chapter five accrual accounting and valuation: …. 92 solutions manual to accompany financial...
TRANSCRIPT

Accrual Accounting and Valuation: Pricing Book Values – Chapter 5 p. 91
CHAPTER FIVE
Accrual Accounting and Valuation: Pricing Book Values
Concept Questions
C5.1. True. A firm with positive expected residual earnings (produced by an ROCE
above the cost of capital) must be valued at a premium.
C5.2. To trade at book value, we expect the ROCE to be equal to the cost of capital,
10%. (The current ROCE is not relevant here: P/B is based on expected future
ROCE.)
C5.3. A P/B of 1.0 implies a future ROCE equal to the cost of capital. An ROCE of
52.2 % is high relative to the cost of capital, so the P/B implies the ROCE is
unusually high and will drop in the future.
C5.4. No. If the firm is expected to earn an ROCE in excess of the required return,
it should sell at a premium over book value. Given the forecast, the firm is a BUY if it
trades below book value.
C5.5. False. If the firm maintains a low ROCE it will be valued at a discount on
book value. But it can survive: it has a positive going-concern value.
C5.6. Firms create residual earnings through ROCE and growth in net assets. The
ROCE for General Electric are level, but the book values are increasing.

p. 92 Solutions Manual to accompany Financial Statement Analysis and Security Valuation
C5.7. (a) Share issues produce more earnings because there are more assets
earning in the business. And dividends reduce earnings.
(b) ROCE is a ratio and, as share issues (usually) affect the numerator and
denominator of a ratio in different proportions, the ratio changes. But RE is not
affected by share issues or dividends (in the case of a firm with no leverage).
C5.8. Yes. Value is generated by growing book values if the book rate of return is
higher than the required return.
C5.9. If the analyst does not forecast all sources of earnings (that is, comprehensive
earnings) then she will ignore some part of the payoff to shareholders, and will lose
some value in her calculation of a value from the forecast.

Accrual Accounting and Valuation: Pricing Book Values – Chapter 5 p. 93
Exercises
E5.1. A Residual Earnings Valuation
This question asks you to convert a pro forma to a valuation using residual earnings
methods. First complete the pro forma by forecasting book values from earnings and
dividends. Then calculate residual earnings from the completed pro forma and value
the firm.
2004E 2005E 2006E 2007E
2008E
Earnings 388.0 570.0 599.0 629.0
660.4
Dividends 115.0 160.0 349.0 367.0
385.4
Book value 4,583.0 4,993.0 5,243.0 5,505.0
5,780.0
ROCE 9.0% 12.4% 12.0% 12.0%
12.0%
Residual earnings -43.0 111.7 99.7 104.7
109.9
Growth in RE -10.7% 5.0%
5.0%
Growth in Book value 8.9% 5.0% 5.0%
5.0%
Discount factor 1.110 1.210 1.331 1.464
1.611
PV of RE -39.1 92.3 74.9
a. Forecasted book values, ROCE, and residual earnings are given in the
completed pro forma above. Book value each year is the prior book value plus
earnings and minus dividends for the year. So, for 2005 for example,
Book value = 4583 +570 –160 = 4,993.
The starting book value (in 2003) is 4,310. Residual earnings for each year is
earnings charged with the required return in book value. So, for 2005,
RE is 570 – (0.10 × 4,583) = 111.7.
p. 94 Solutions Manual to accompany Financial Statement Analysis and Security Valuation
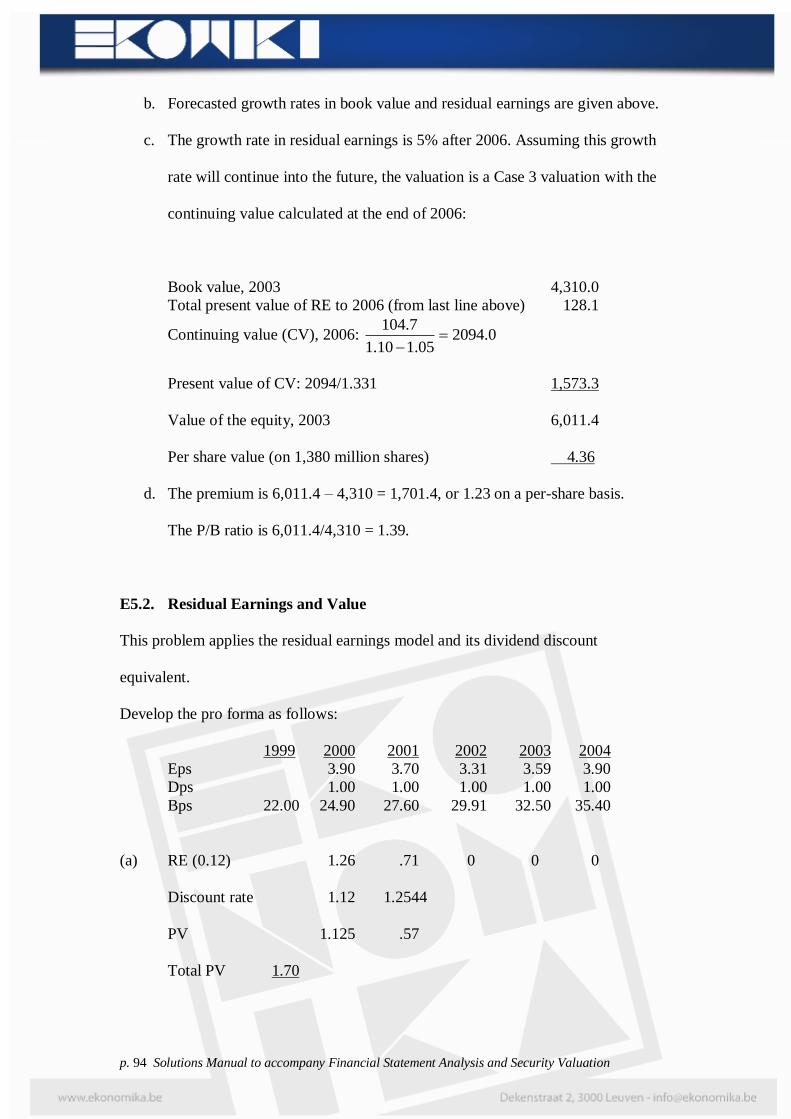
b. Forecasted growth rates in book value and residual earnings are given above.
c. The growth rate in residual earnings is 5% after 2006. Assuming this growth
rate will continue into the future, the valuation is a Case 3 valuation with the
continuing value calculated at the end of 2006:
Book value, 2003 4,310.0
Total present value of RE to 2006 (from last line above) 128.1
Continuing value (CV), 2006: 0.209405.110.1
7.104
Present value of CV: 2094/1.331 1,573.3
Value of the equity, 2003 6,011.4
Per share value (on 1,380 million shares) 4.36
d. The premium is 6,011.4 – 4,310 = 1,701.4, or 1.23 on a per-share basis.
The P/B ratio is 6,011.4/4,310 = 1.39.
E5.2. Residual Earnings and Value
This problem applies the residual earnings model and its dividend discount
equivalent.
Develop the pro forma as follows:
1999 2000 2001 2002 2003 2004
Eps 3.90 3.70 3.31 3.59 3.90
Dps 1.00 1.00 1.00 1.00 1.00
Bps 22.00 24.90 27.60 29.91 32.50 35.40
(a) RE (0.12) 1.26 .71 0 0 0
Discount rate 1.12 1.2544
PV 1.125 .57
Total PV 1.70

Accrual Accounting and Valuation: Pricing Book Values – Chapter 5 p. 95
(b) Value 23.70
(c) As residual earnings are expected to be zero after 2004, the equity is expected
to be worth its book value of $35.40. That is no premium is expected at 2004.
An aside: The calculation can also be made by forecasting the cum-dividend book
value in 2004 and reducing it by the value of dividends to be paid out (to get an ex-
dividend price):
Expected cum-dividend value in 2004 V VT
E T E 0 =1.125 × 23.70 = 41.77
Terminal value of the dividend payoff at 2000:
2000 div: 1.00 × 1.5735 = 1.57
2001 div: 1.00 × 1.4049 = 1.41
2002 div: 1.00 × 1.2544 = 1.25
2003 div: 1.00 × 1.12 = 1.12
2004 div: 1.00 × 1.00 1.00 6.35
Expected ex-dividend value at 2004 35.42
(d) The expected premium at 2004 is zero because subsequent residual income is
expected to be zero. Knowing this, you can calculate the expected price at 2004 as
equal to the expected book value at that date: $35.42. This is a much shorter
calculation!
(e) The dividend discount formula can be applied because we now have a basis
for calculating its terminal value. The terminal value is the expected terminal price,
and this can be calculated at the end of 2001 because, at this point, expected price
equals book value.

p. 96 Solutions Manual to accompany Financial Statement Analysis and Security Valuation
T
1t
TTt
tE
0 /TVdV
The TV2001 is given by the expected 2001 book value:
TV2002 = 27.60
So the calculation goes as follows:
1999 2000 2001
Dps 1.00 1.00
PV .89 .80
Total PV of divs. 1.69
TV 27.60
PV of TV 22.00
Value 23.69
Note that, as price is expected to equal book value at the end of 2001, then we can
also get the current value by taking the present value of the cum-dividend terminal
book value:
As
E
1999V = Cum-dividend 2001 value/1.122
and as
Cum-dividend 2001 value = cum-dividend 2001 book value
then
E
1999V = cum-dividend 2001 book value/1.122
Terminal value of 2000 and 2001 divs at end of 2001 = 2.12
Expected 2001 book value = 27.60
Expected 2001 cum-dividend book value 29.72
PV = 29.72/1.122 = 23.69

Accrual Accounting and Valuation: Pricing Book Values – Chapter 5 p. 97
E5.3. Residual Earnings Valuation and Return on Common Equity
(a) Set the current year as Year 0.
Earnings, Year 1 = 15.60 × 0.15 = 2.34
Residual earnings, Year 1 = 2.34 – (0.10 × 15.60)
= 0.78
This RE is a perpetuity, so
10.0
REBV 0
00
40.2310.0
78.060.15
1.515.6023.40BP
(b) No effect: future payout does not affect current price (unless you have a
tax story) and future dividends don’t affect current book value.
P/B is still 1.5

p. 98 Solutions Manual to accompany Financial Statement Analysis and Security Valuation
E5.4. Using Accounting-Based Techniques to Measure Value Added for a
Project
(a)
Time line: 0 1 2 3 4 5Depreciation 30 30 30 30 30Book value 150 120 90 60 30 0Earnings (15%) 22.5 18 13.5 9 4.5RE (0.12) 4.5 3.6 2.7 1.8 0.9PV of RE 4.02 2.87 1.92 1.14 0.51Total PV of RE 10.47Value of Project 160.47
The investment added $10.47 million over the cost.
(b)
Time line 0 1 2 3 4 5
Earnings 22.5 18.0 13.5 9.0 4.5Depreciation 30.0 30.0 30.0 30.0 30.0Cash from operations 52.5 48.0 43.5 39.0 34.5
PV of cash flow (1.12t) 46.88 38.27 30.96 24.79 19.58
Total PV of cash flow 160.47Cost 150.00NPV 10.47
t
The NPV is the value added.

Accrual Accounting and Valuation: Pricing Book Values – Chapter 5 p. 99
E5.5. Using Accounting-Based Techniques to Measure Value Added for a
Going Concern
(a) Time line: 0 1 2 3 4 5 6 7
Investment 150 150 150 150 150 150 150 150
Depreciation1 30 60 90 120 150 150 150
Book value2 270 360 420 450 450 450 450
Revenue 52.5 100.5 144.0 183.0 217.5 217.5 217.5Depreciation 30.0 60.0 90.0 120.0 150.0 150.0 150.0Earnings (15%) 22.5 40.5 54.0 63.0 67.5 67.5 67.5
RE (0.12) 4.5 8.1 10.8 12.6 13.5 13.5 13.5
PV of RE 4.0 6.5 7.7 8.0
Total of PV of RE 26.2
112.5
PV of CV 71.5
Value 247.7Lost 150Value added 97.7
Continuing value3
1. Depreciation is $30 million per year for each project in place
2. Book value (t) = Book value (t-1) + Investment (t) – Depreciation (t)
3. CV = 12.0
5.13 = 112.5
The value of the firm is $247.7 million. The continuing value is based on a forecast of
residual earning of 13.5 in year 5 continuing perpetually with no growth. This is a
Case 2 valuation.
(b) The value added is $97.7 million

p. 100 Solutions Manual to accompany Financial Statement Analysis and Security Valuation
(c) The value added is greater than 15% of the initial investment because there is
growth in investment: value is driven by the rate of return of 15% (relative to a cost of
capital of 12%) but also by growth.
E5.6. Residual Earnings Techniques: Bond Valuation
The bond has a face value of $1,000. The required return is 8% p.a. but the
coupon yields only 4%. To answer the question, ask how much discount off $1,000 is
required for a payoff of 4% rather than 8%. Clearly a payoff of 4% rather than 8%
yields negative residual earnings.
Discount = 08.1
)1000 %8(40 +
1.1664
1000) (8%40
+ 1.2597
1000) (8%40 +
1.3605
1000) (8%40
+ 1.4693
1000) (8%40
= 159.70
So the bond should sell at $1000 – 159.70 = $840.30 (which is the same valuation as
using a DCF technique).
E5.7. Analysts Forecasts and Valuation: Hewlett-Packard
(a)

Accrual Accounting and Valuation: Pricing Book Values – Chapter 5 p. 101
Time line: 1999A 2000E 2001E 2002E 2003E 2004E 2005E
Eps 3.33 3.75 4.32 4.83 5.42 6.07 6.80
Dps1 0.64 0.71 0.82 0.92 1.03 1.15 1.29
BPS 19.36 22.40 25.90 29.81 34.20 39.12 44.63
RE (0.12) 1.43 1.63 1.72 1.84 1.97 2.11
Growth in RE 14.0% 5.5% 7.0% 7.0% 7.0%
PV of RE(1.12t) 1.28 1.30 1.22
Total PV of RE to 2002 3.80
Continuing value2 36.80
PV of CV 26.19
Value per share 49.35
1. The dps forecast is based on maintaining the same pay out ratio as in 1999.
2. CV = 07.112.1
84.1
, where 7% is the long-term growth ratio in RE.
The valuation from the forecasts is less than the market price of $83. The forecasts
imply a SELL, not a BUY.
Note that one could also calculate the continuing value at the end of 2002, based on
the 1.72 of RE in 2002 growing at 7%, and get the same answer.

p. 102 Solutions Manual to accompany Financial Statement Analysis and Security Valuation
(b) Suppose the market sets the $83 price using analysts’ forecasts for 2000 and 2001
plus a long-term growth rate forecast after 2001. The continuing value at 2001 will be
BPS, 1999
19.36
PV of RE to 2002: (1.43 + 1.63)
3.06
Continuing value (CV)
?
Value per share
83.00
The implied CV (?) is 60.58. The implied growth rate in the CV is that which solves
the CV calculation:
60.58 = (1.63 x g)/(1.12 – g)
Thus g = 1.0905 (an implied growth rate of 9.05%).
(c) Difficulties:
1. Analysts did not give a forecast of dps (which affects forecasted
eps and bps). We used a constant-payout forecast, but is this what analysts had in
mind in forecasting the eps (that are displaced by dividends)?
2. We relied on analysts’ long-run eps growth forecasts to calculate a
value. These forecasts are suspect. Research shows they are not very accurate and
are usually too optimistic.
3. We relied on analysts’ forecasts to 2002 to get the implied long-
run growth rate from the current market price. Are these good forecasts?
E5.8. Forecasting Target Prices Using Residual Earnings Techniques
For this question, recognize that a target (forecasted) value is calculated from
forecasted book values and continuing values:

Accrual Accounting and Valuation: Pricing Book Values – Chapter 5 p. 103
Target value = Book value + continuing value
a. If residual earnings are forecasted to be zero (and thus the continuing value is
zero), the forecasted value must equal the book value of $6,120 million. (A
Case 1 valuation)
b. In this case (Case 2), the continuing value (CV) is the RE for 2006 capitalized
at 11%:
CV = 3.22711.0
25
Target value = 6,120 + 227.3 = 6,347.3
c. In this case (Case 3), the continuing value is the RE for 2006 capitalized at the
growth rate of 3%:
CV = 5.31203.111.1
25
Target value = 6,120 + 312.5 = 6,432.5.
E5.9. Residual Earnings Valuation and Accounting Methods
a. Inventory in the balance sheet is carried at historical cost but is written down
to market value if market value is less than cost. The carrying amount of
inventory on the balance sheet becomes cost of good sold when the inventory
is sold. So, a write-down of $114 million in 2003 means cost of goods sold in
2004 will be $114 million lower, and earnings will be $114 million higher,
that is, $502 million. The book value at the end of 2003 is $114 million lower,
or $4,196 million. So,
ROCE = 502/4,196 = 11.96
This is an increase over the 9% (388/4,310) before the impairment.

p. 104 Solutions Manual to accompany Financial Statement Analysis and Security Valuation
b. Refer to the answer to Exercise 5.1. With earnings of $502 million forecasted
for 2004, residual earnings is now 502 – (0.10 × 4,196) = $82.4 million. The
present value of this RE is $82.4/1.10 = $74.9 million. As the present value of
RE for 2004 prior to the impairment was $-39.1 million, the change in the PV
of RE in the valuation is $114 million. As this is the change in the 2003 book,
value the valuation remains unchanged.
The full pro forma under the changed accounting is below:
2004E 2005E 2006E 2007E
2008E
Earnings 502.0 570.0 599.0 629.0
660.4
Dividends 115.0 160.0 349.0 367.0
385.4
Book value 4,583.0 4,993.0 5,243.0 5,505.0
5,780.0
ROCE 11.96% 12.4% 12.0% 12.0%
12.0%
Residual earnings 82.4 111.7 99.7 104.7
109.9
Growth in RE -10.7% 5.0%
5.0%
Growth in Book value 8.9% 5.0% 5.0%
5.0%
Discount factor 1.110 1.210 1.331 1.464
1.611
PV of RE 74.9 92.3 74.9
Note that the pro forma is unchanged after 2004 as 2004 book values are the same as
before.
The valuation now runs as follows:
Book value, 2003 4,196.0
Total present value of RE to 2006 (from last line above) 242.1
Continuing value (CV), 2006: 209405.110.1
7.104
Present value of CV: 2094/1.331 1,573.3

Accrual Accounting and Valuation: Pricing Book Values – Chapter 5 p. 105
Value of the equity, 2003 6,011.4
Per share value (on 1,380 million shares) 4.36
This is the same valuation as before.
c. The taxes will affect 2004 earnings and 2003 book values by the after-tax
amount of the impairment:
After-tax effect on 2004 earnings = $114 × (1 – 0.35) = $74.1
After-tax effect on book value in 2003 = $114 × (1 – 0.35) = $74.1
Accordingly,
Earnings, 2004 = 388 + 74.1 = 462.1
Book value at the end of 2003 = 4,310 – 74.1 = 4,235.9
ROCE, 2004 = 462.1/4235.9 = 10.91%
As both 2004 earnings and 2003 book values are affected by the same amount, the
value of the equity is unchanged (following the same calculation as in b).
E5.10. Comparison Valuations: Hewlett-Packard, Dell Computer, and Compaq
Computer
(a) Hewlett Packard: Price = 95⅛
First develop a residual earnings pro forma up to 1997. Analysts do not give
dps forecasts, so they have to be estimated; use the dps forecasts in Table 5.3 to
develop the pro forma.
1995A 1996E 1997E
Eps 4.63 5.60 6.60
Dps 0.70 0.94 1.10
Bps 23.22 27.88 33.38
RE (.12) 2.81 3.25
Discount rate 1.120 1.254

p. 106 Solutions Manual to accompany Financial Statement Analysis and Security Valuation
To calculate the implied growth rate in residual earnings for years beyond 1997, calculate g
in the following valuation:
254.1
12.125.3
254.1
25.3
120.1
81.222.23125.95
gxg
The $3.25 is grown up at the rate g for one period, and the continuing value at the end of
1997 is specified with the implied growth rate.
The solution is g = 1.078 (a 7.8% growth rate).
Dell: Price = 36¾
The Pro forma (no dividends):
1995A 1996E 1997E
Eps 2.67 3.20 4.15
Dps 0.00 0.00 0.00
Bps 10.35 13.55 17.70
RE (.12) 1.96 2.52
Discount rate 1.12 1.254
Formula for implied growth rate:
254.1
12.152.2
254.1
52.2
120.1
96.135.1075.36
gxg
The solution is g = 1.029 (a growth rate of 2.9%)
Compaq : Price = 47⅜
1995A 1996E 1997E
Eps 2.88 4.50 5.75
Dps 0.00 0.00 0.00
Bps 17.27 21.77 27.52

Accrual Accounting and Valuation: Pricing Book Values – Chapter 5 p. 107
RE (.12) 2.43 3.14
Discount 1.12 1.25
For the implied growth rate:
254.1
12.114.3
254.1
14.3
120.1
43.227.17375.47
gxg
The solution is g = 1.02 (a growth rate of 2%).
(b) The forecasted P/E ratios imply forecasted prices in 1997 that can be
calculated by multiplying forecasted 1997 earnings by the P/E ratio:
Forecasted P1997 = Earnings1997 x (P/E)1997
The 1995 prices implied by forecasted 1997 prices are the present value of cum-
dividend 1997 prices:
.2544.1/19971995
CPP
PC indicates that the price is cum-dividend, that is, with the terminal value of any
dividends paid in the payoff. Only HP has dividends. The value of the dividends at the
end of 1997 is the 1997 dividend plus the 1996 dividend reinvested for one period at
12%: 1.10 + (0.94 x 1.12) = 2.153.

p. 108 Solutions Manual to accompany Financial Statement Analysis and Security Valuation
The following calculates the 1995 price implied by the forecast.
1997
1997 1997 Cum-div.
1995
Eps P/E Price Price
Price
HP 6.60 14.0 92.4 94.6
75.41
Dell 4.15 12.0 49.8 49.8
39.70
Compaq 5.75 8.4 48.3 48.3
38.50
To ask whether the analyst’s recommendations are consistent with the
forecasts, compare the market price with the price implied by the forecast. Dell is the
only firm where the current price from these calculations is consistent with the
analyst’s recommendation. For HP and Compaq there is an inconsistency between
the forecast and the recommendation. He recommends BUY for Compaq, but the
(intrinsic) price implied by his forecast is less than the market price. For HP, the price
from the forecasts is considerably less than the market price, yet he advises a HOLD.
E5.11. Did You Pay Too Much for Book Value?
If you paid 220 at the beginning of 2001, you are expecting that the
premium over book value that you paid (20) will be returned in (the present value of)
subsequent residual earnings.

Accrual Accounting and Valuation: Pricing Book Values – Chapter 5 p. 109
Year 2000 2001 2002 2003
Book value 200 207 230 238
Dividends 15 0 15
Earnings 22 23 23
Residual earnings (RE) 2.0 2.3 0
PV of RE (at 1.10t) 1.82 1.9 0
Total PV 3.72
Premium you paid 20.00
Ex post loss 16.3
Earnings = Bt – Bt-1 + dt
(This is comprehensive income because it is calculated from the changes
in the book value which includes the dirty surplus income that may not be reported in
net income.)
The conclusion assumes RE beyond 2003 is also expected to be zero.
Another way of looking at it:
Required 3-year stock return = 220 × (1.103 – 1)
= 72.82
If projected residual earnings are zero after 2003, price should equal the book value of
238 in 2003.
Therefore actual return = PT – P0 + terminal value of dividends
= 238 – 220 + (15 × 1.102 ) + 15
=51.15
Actual – required return = (21.67)
PV at 2000 = 21.67/(1.10)3 = (16.28)
(which is the ex post loss calculated above)
Note: you can also calculate the return as the cum-dividend earnings from 2001-2003
(71.15) plus the change in premium (0-20 = -20).

p. 110 Solutions Manual to accompany Financial Statement Analysis and Security Valuation
E5.12. Did You Pay Too Much for Book Value: Boeing, Lockheed, and
McDonnell-Douglas?
1989 1990 1991 1992
1993
Boeing
Earnings, split-adj.1 6.35 9.02 10.26 3.65
8.24
Dividends, split-adj.1 1.76 2.14 2.25 2.25
2.25
BV 39.86 46.74 54.75 56.15
62.14
Residual earnings (.12) 2.12 4.24 4.65 2.92
1.50
PV of RE 1.89 3.38 3.31 1.86
.85
Total PV of RE premium = 7.57
Unless you were buying startling higher profits beyond 1994 you overpaid at 60 58 (at
a 25.36 per share premium).
Notes: 1. The split adjustments express amounts per share outstanding at the end of
1988.
Lockheed
Earnings .03 5.30 4.86 4.58
6.70
Dividends 1.75 1.80 1.95 2.09
2.12
BV 40.01 43.51 46.42 39.75
44.33
Residual earnings 4.98 0.50 -0.36 10.16
1.93
PV of RE 4.45 0.40 -0.26 6.46
1.10
Total PV of RE premium = (-9.67)

Accrual Accounting and Valuation: Pricing Book Values – Chapter 5 p. 111
Bad buy! Lockheed was purchased at book value (approximately), but delivered
negative RE from 1989-92.

p. 112 Solutions Manual to accompany Financial Statement Analysis and Security Valuation
McDonnell Douglas
Earnings 5.72 7.99 11.03 20.10
10.10
Dividends 2.82 2.82 1.40 1.40
1.40
BV 86.33 91.50 101.13 79.63
88.33
Residual earnings 4.29 2.37 .05 32.24
.54
PV of RE 3.83 1.89 .04 20.49
.31
Total PV of RE = premium = (25.86)
Bad buy! MD was purchased at a discount of 11.18 but subsequent profitability
justified a higher discount.
(Of course these conclusions might be changed based on performance subsequent to
1993.)
E5.13. Implied Growth in Residual Earnings: Coca-Cola Company
Market value at end of 1998 = $66 ½ × 2.465 billion
= $163.923 billion
Economic profit (residual earnings) for 1998 = 2.480 billion
The reverse engineering calculation of g is as follows:
g-1.09
g)(1 earnings ResidualBook valueValue
g - 1.09
g 2.480403.8923.163
g = 1.0729 (or a growth rate of 7.29%)

Accrual Accounting and Valuation: Pricing Book Values – Chapter 5 p. 113
E5.14. Residual Earnings Growth and Growth in Earnings: Hewlett-Packard
Company
This exercise demonstrates the relationships between changes in residual
earnings and growth in earnings. It may be better appreciated after reading Chapter 6.
Develop the pro forma with constant residual earnings after 2001 and add
calculations of earnings growth, as follows:
1999 2000 2001 2002 2003 2004
Eps 3.75 4.32 4.74 5.20 5.70
Dps 0.64 0.71 0.82 0.9 0.99 1.08
Bps 19.36 22.40 25.90 29.74 33.95 38.57
RE(0.12) 1.43 1.63 1.63 1.63 1.63
ROCE 19.4% 19.3% 18.3% 17.5% 16.8%
Cum-dividend eps 3.83 4.49 5.03 5.63 6.30
Growth in eps 15.2% 9.7% 9.7% 9.7%
Growth in cum-div. eps 17.2% 12.0% 12.0% 12.0%
(a) The eps growth rate that implies a constant residual earnings is 9.7%.
(b) Zero: a constant RE always means that there is no change in the premium.
The premium is the present value of expected residual earnings, so if residual
earnings do not change, nor will the premium.
Some additional material that is relevant to Chapter 6:
You will notice that cum-dividend earnings are calculated in the pro forma. These
cum-dividend eps forecasts are calculated by adding reinvested dividends to
forecasted earnings. The amounts of earnings from reinvesting dividends at the cost
of capital of 12% are in the following schedule:

p. 114 Solutions Manual to accompany Financial Statement Analysis and Security Valuation
Earnings from reinvested dividends
Year
Dividend
2000
2001
2002
2003
2004
1999 0.64 0.077 0.086 0.096 0.108 0.121
2000 0.71 0.085 0.095 0.107 0.120
2001 0.82 0.098 0.110 0.123
2002 0.90 0.108 0.121
2003 0.99 ____ ____ ____ ____ 0.119
0.077 0.171 0.289 0.433 0.604
Eps 3.750 4.320 4.740 5.200 5.700
Cum-dividend eps 3.827 4.491 5.029 5.633 6.304
The eps growth rate that implies a constant residual earnings is 9.7%. But this growth
is affected by the amount of the payout. (Paying dividends reduces earnings growth.)
Growth in cum-dividend eps after 2001 is 12%. This is equal to the cost of capital,
and illustrates a point: a constant RE always means that cum-dividend earnings grow
at the cost of capital.
E5.15. Forecast Revision and Change in Value: Weyerhaeuser Company
1995A 1996E 1997E 1998E 1999E 2000E
March 31 forecast:
Eps 3.93 3.40 4.10 4.51 4.96 5.46
Dps 1.50 1.60 1.60 1.76 1.94 2.13
Bps 22.57 24.37 26.87 29.62 32.64 35.97
RE (.12) .69 1.18 1.29 1.41 1.54
Discount factor 1.12 1.2544 1.4049 1.5735 1.7623
PV of RE .62 .94 .92 .90 .87
Total PV 4.25
*TV (g = 9%)
55.95
PV of TV 31.75
Valuation 58.57
*The terminal value is based on the 2000E RE of 1.54 growing at 9%: 154 109
03
. .
.
x
Revised forecast:

Accrual Accounting and Valuation: Pricing Book Values – Chapter 5 p. 115
Eps 3.93 2.20 3.25
Dps 1.50 1.60 1.60
Bps 22.57 23.17 24.82
RE (.12) (.51) .47
Revision in RE (1.20) (.71)
PV of revision (1.07) (.57)
Total PV of revisions (1.64)
This implied revision in the value is based on forecast revisions for 1996 and 1997
only. To complete the valuation, we’d have to know what eps the analyst had in mind
for years beyond 1997. Will eps grow at 10% from the revised 1997 forecast or will
they be the same as in the first forecast? What is the payout the analyst expects
beyond 1997? Will it be less because of lower forecasted earnings?
E5.16. Equivalent Valuation Methods
Scenario with no share issues or dividends:
Cum-dividend book value in Year 3 $1,419
shareper $10.66or 1,066$331.1
419,1VE
0
Scenario with share issue and dividend:
Future value in Year 3 of dividend
In Year 2: $25 + 1.10 27.4
Future value in Year 3 of cash surrendered
in share issue: $100 x (1.10)2 (121.0)
Book value in Year 3 (ex-dividend) 1,512.5
Cum-dividend book value in Year 3 $1,419.0
This cum-dividend book value is the same as that in the first scenario, so the
valuations are the same. (Again, as in the text, the value is insensitive to share issues
or dividends.)

p. 116 Solutions Manual to accompany Financial Statement Analysis and Security Valuation
E5.17. Impairment of Goodwill
(a) As the asset is at fair value (the acquisition price) on the balance sheet, it is
expected to earn at the required return on book value: Residual earnings is
projected to be zero. (Fair value in an acquisition always prices the acquisition
to earn at the required rate of return.)
(b) The book value must be marked down to fair market value under FASB
Statement No. 142. The book value at the end of 2002, before the write down,
is 301 + 79 = 380.
Forecasted earnings for 2003 on this book value (at the forecasted ROCE of 9%)
is
380 x 0.09 = 34.2
For a 10% required return, the book value that yields residual earnings in 2003
equal to zero = 34.2 x 10 = 342:
RE2003 = 34.2 – (0.10 x 342) = 0
A book value of 342 is thus “fair value.”
Accordingly, the amount of impairment = 380 – 342 = 38.

Accrual Accounting and Valuation: Pricing Book Values – Chapter 5 p. 117
Minicases
M5.1. The Goldman Sachs IPO
This case introduces residual earnings valuation that evaluates price-to-book
ratios, emphasizes the limitations of short-term forecasts, and compares pro forma
valuation with multiple analysis.
A. The pro forma is simple:
1998A 1999E 2000E
Eps 4.69 4.26
Dps 0.48 0.48
Bps 17.80 22.01 25.79
RE(0.10) 2.91 2.06
ROCE 26.3% 19.4%
With a forecast for a limited period, start with a Case 2 valuation. With this pro
forma and a forecast that the 2000E residual earnings is a good estimate of residual
earnings after 2000, the (Case 2) valuation of Goldman is:
/1.100.10
2.06
1.10
2.91
17.80 V
1998
= $39.17
This value is considerably lower than the market price of $70. But this valuation
assumes no growth in residual earnings after 2000E. The analysts have not given
enough information to complete this valuation. The market price of $70 has an
implied growth rate that can be tested:
10.1/10.1
06.2
1.10
2.91 17.80 70
g
g
g = 1.06 (a 6.0% growth rate)
Can we come up with scenarios that justify a growth rate of 6.0% for Goldman?
Remember growth in RE come from two factors:

p. 118 Solutions Manual to accompany Financial Statement Analysis and Security Valuation
increase in ROCE
increase in net assets earning at the ROCE
B. Corzine and Paulson saw growth coming from acquisitions. So a complete
analysis would involve acquisition strategy. Who were potential acquirees? An
insurance firm (as in the Citicorp Travelers merger)? A larger asset management
business? Chase? The analysis would also involve costs of acquisitions. Were cheap
acquisitions available? Were synergistic merges a possibility? Or would Goldman
have to pay a fair price and earn a normal return (a zero RE) on the acquisition?
Do shares give a firm currency? No: using shares in an acquisition gives up
the same value as the cash equivalent. Goldman might face borrowing constraints to
raise the cash, however. And, if it found itself in a position of having its shares
overvalued in the market, it might use the shares to buy another firm cheaply. Which
brings us to the question 3.
C. If Merrill and Morgan Stanley were “appropriately priced” the use of
multiples is a reasonable way of getting a valuation, with any adjustments for
differences between the firms. But if the prices of comparison firms were too high—
as some maintained—then the Goldman partners may indeed have been taking
advantage of a mispricing. Remember the issue of Ponsi schemes in multiples (in
Chapter 3)? There is further discussion on the Chapter 3 web page.
[Note: This case was written in October 1999. Goldman’s strategy might be
more apparent when you read this case later, and its effects can be incorporated into
this analysis.]

Accrual Accounting and Valuation: Pricing Book Values – Chapter 5 p. 119
M5.2. Strategy and Valuation: Weyerhaeuser Company
This case can be combined with the Weyerhaeuser Minicase M2.3 in Chapter 2 to
compare asset-based valuation with pro forma analysis.
The case introduces the analysis of strategies and highlights the problems one
often has in translating statements about strategy into forecasts and a valuation. It
also motivates students to dig for further information.
Some preliminary calculations
Bps, 1997 (on 199.486 million shares) 23.30
Bps, 1998 (on 199.009 million shares) 22.74

p. 120 Solutions Manual to accompany Financial Statement Analysis and Security Valuation
ROCE, 1998
30.23
48.1 6.4%
P/B ratio, 1998 (at price of $55) 2.4
P/E ratio, 1998 (dividend-adjusted) 38.2
To answer the questions, develop a pro forma based on the plans and their forecasted
outcomes:
Effect on 1999 eps:
Eps, 1998 $1.48
Effect of increasing harvest 0.85
Effect of cost cutting 0.72
Effect of price increases 0.40
Effect of capacity utilization 0.20
Eps, 1999 $3.65
A pro forma that forecasts 1999 residual earnings is as follows:
1997A 1998A 1999E
Eps 1.48 3.65
Dps 1.60 1.60
Bps 23.30 22.74 24.79
RE (0.12) (1.32) 0.92
ROCE 6.4% 16.1%
Answering the Questions
A. The plans and their forecasted affects yield an ROCE for 1999 of 16.1%, just
short of the goal of 17%.
B. Valuing the firm from the forecast.
Suppose the forecasted residual earnings for 1999 are to continue
indefinitely.
Then the value per share would be:
0.12
0.92 22.74 V 1998
= 30.41

Accrual Accounting and Valuation: Pricing Book Values – Chapter 5 p. 121
This value is well below the market price of $55. If the cost of capital were
8%, the value would be $45.62 per share.
But this valuation is incomplete because there may be growth in RE
(and there may be a decline, negative growth, in RE). What growth is the
market forecasting at $55?
9.15%) of rategrowth aor ( 1.0915 g
g-1.12
0.92 22.74 55
So, to pay $55, we have to be able to forecast a growth of 9.15% in
RE. This translates into a growth rate in eps of 9%-10% if the $1.60 dps is
maintained.
C. The question introduces operating leverage: with fixed cost more of each
additional dollar of revenue goes to the bottom line.
D. There are a number of concerns:
(i) The forecasted ROCE for 1999 is high by historical standards and is
for anticipated upswing in the cycle. Shouldn’t the valuation be based on the average,
long-term ROCE for the cycle?
(ii) The excess capacity gives us a red flag. Will some of this capacity
have to be written off in a restructuring or more accelerated depreciation in the future?
These actions will lower ROCE.
(iii) Will Weyerhaeuser resist the temptation to overinvest at the top of the
next cycle?
(iv) The increased harvest is a concern. Is the firm planning to cut timber
for short-term gain at the expense of the long-term? Is the anticipated cutting in
excess of accretion through tree growth? Are the timberlands more valuable uncut?

p. 122 Solutions Manual to accompany Financial Statement Analysis and Security Valuation
E. There are two issues on which we want further information.
(i) Is the ROCE forecasted for 1999 sustainable? The issues raised in part
(d) are relevant to this question.
(ii) Getting a handle on the long-term growth is clearly the key here. A
forecast (or objective) for ROCE is not enough. Growth in investment (book value)
must be considered.
The student does not have the tools to develop growth forecasts at this stage.
These are at the heart of the analysis in Part Two of the book. A key element is the
growth in revenues, for growth in revenues is the primary driver of growth in RE.
Weyerhaeuser’s revenues had been flat or declining, over the prior three years. Is this
to change? The professor could explore the growth issue as an introduction to Part
Two
.
Another question: Is Weyerhaeuser worth more than its going concern value?
Look back at the asset-based valuation in case M3.4 in Chapter 3. Should timberlands
not be cut because the return they produce from cutting is valued less than their value
uncut?
The student might look at how Weyerhaeuser has performed since 1999. Was
the $55 price (that rose to $70 by mid 1999) justified ex post?

Accrual Accounting and Valuation: Pricing Book Values – Chapter 5 p. 123
M6.3 Chrysler Corporation: The Kerkorian Bid
The main purpose of this case is to help students understand what are the necessary
ingredients for carrying out a valuation. Students discover this by finding out the information
they need to solve the problem, but do not have. Students also discover the tools they lack.
This sets them up for what follows in the rest of the book.
Background
At the time of the bid, Chrysler traded at 3943 per share. Kerkorian’s offer
was $55 per share. Other relevant data:
Shares outstanding (issued minus treasury stock):
December 31, 1994 $355.1million
December 31, 1995 $378.3million
Book value Total Per Share
December 31, 1994 $10,692million $30.11
December 31, 1995 $10,959million $28.97

p. 124 Solutions Manual to accompany Financial Statement Analysis and Security Valuation
Traded P/B ratio, April 1995 1.32
Kerkorian’s bid/book ratio
April 11, 1995 1.83
January, 1996 1.90
Chrysler’s beta at the end of 1995 (from beta services)
1.35
Question A of the Case
Greenmail involves demanding to be bought out at a price above the fair
price. But Kerkorian could have had a number of ideas that would lead to a
better price for Chrysler on the market.
(i) He may just have thought that the stock was undervalued at $39¾: the
market did not recognize Chrysler’s earning potential. He may also
have thought that his offer would “signal” his belief to the market and
increase the price. Indeed Chrysler’s stock price increased about 25%
when his offer was announced. Apparently other investors saw his $55
price as persuasive. Icahn, however, doubted Kerkorian’s valuation
and took short positions. The price chart indicates that, in the long run
the Kerkorian position was the profitable one.
(ii) Kerkorian may have had ideas to add value by better management.
He saw Chrysler lacking good ideas or missing out on investment
opportunities. He was very critical of the management at the time and
may have thought that he could run an automobile firm better. He saw
the build up of cash as evidence that management did not have
investment ideas. He of course had little experience with the industry,
but Iacocca’s partnership would provide this. It was Iacocca who was

Accrual Accounting and Valuation: Pricing Book Values – Chapter 5 p. 125
credited with bringing Chrysler back from the brink after a US
government bailout in the 1980s.
(iii) Kerkorian may have seen some “synergy” with his existing operations
in marketing, production, technology or research and development.
This is doubtful; Kerkorian was in gambling, resorts and entertainment.
(iv) Kerkorian may have seen Chrysler as a bridge to other opportunities.
With Chrysler he might have strategies to launch takeovers of other
firms. [He’d want to keep the $7.5 billion of cash inside the firm in this
case.]
(v) He thinks paying out dividends will drive up the price because
shareholders value firms with higher dividends. This runs into the
dividend irrelevance notion. But see the discussion on paying out the
$7.5 billion cash later.
(vi) He may have seen that the break-up value of the firm was greater than
its going concern value. This is the asset stripper at work.
(vii) He may be an empire builder who is willing to pay a lot to build his
empire.
(viii) He may have seen Chrysler as a takeover target for someone else (like
Daimler Benz) who would be willing to pay more than $55 per share.
Question B of the Case
Knowing a firm’s strategy - or strategic alternatives - is a prerequisite
for valuing a firm. With the information that we have here, we will not be
able to do a thorough valuation. We would need to know the industry quite
well and know what strategic options are open to Chrysler. Further, given

p. 126 Solutions Manual to accompany Financial Statement Analysis and Security Valuation
that we want to value Chrysler in Kerkorian’s hands, we’d also like to have
an idea of his plans for the firm.
If we indeed could lay out the strategy options we would need a good
deal more information that that given with case to analyze the value in the
strategies. So working this case is going to produce some frustrations. But
the purpose is to get you working on a valuation problem with limited
information - which often is what you have. You will also discover what
further information you need to do a thorough job. You might also be
surprised how far you can get with simple, approximate valuations.
The claim that Kerkorian was attempting to greenmail the
management presumes that $55 is too high a price. To get a feel for the
appropriate price (and P/B ratio), focus on the residual income model:
V BRE RE RE
0
E
O
1 2
E
3
E
2 3
Carry out the valuation at December 31, 1995. Kerkorian would be expected to be buying
1995 book value by the time matters were resolved. A rough valuation that relies only on the
information at hand runs as follows.
A Rough Valuation
1. Rough Forecasting
Apply information in the equity research report to develop rough pro
forma income statements:
1995A 1996E 1997E 1998E 1999E 2000E
Revenue 53,195 55,323 56,982 56,982 58,122 59,285
Cost of Sales 41,304 42,875 44,161 45,016 45,335 46,242
Gross Margin 11,891 12,448 12,821 11,966 12,787 13,043
Other Expenses 9,887 10,290 10,599 10,599 10,810 11,027
Net Income 2,004 2,158 2,222 1,367 1,977 2,016
Notes:

Accrual Accounting and Valuation: Pricing Book Values – Chapter 5 p. 127
(1) The 1995 gross margin percentage appears to be based on “costs, other
than items below” in income statement.
(2) Other expenses are a percentage of revenue, as incurred in 1995 (18.6%).
Is this pro forma satisfactory?
a. Net income may not be comprehensive. Chrysler did not publish a
statement of shareholders’ equity, but the reconciliation of beginning and
ending shareholders’ equity in footnotes indicates adjustments in pension
liabilities and translation adjustments that are part of comprehensive
income. These are small and may not be predictable in the future,
however.
b. Are revenue estimates reasonable? This is a strategy and market research
issue.
c. Gross margin should be calculated on sales revenue, not total revenue.
d. Are gross margin estimates reasonable? This is an issue of technology,
production, labor rates, material costs, product mix, etc.
e. Is the other expense percentage correct? Need further detail:
- distinguish types of revenue
- distinguish fixed and variable expenses
- distinguish interest income and expense from operating items
- distinguish unusual expenses in 1995 that are not likely to be repeated
More financial analysis is needed. Part Two of the book will supply this.
2. Rough Valuation (cost of capital 12%)
Suppose that forecasted 1996 RE will continue in subsequent years at the
same level.
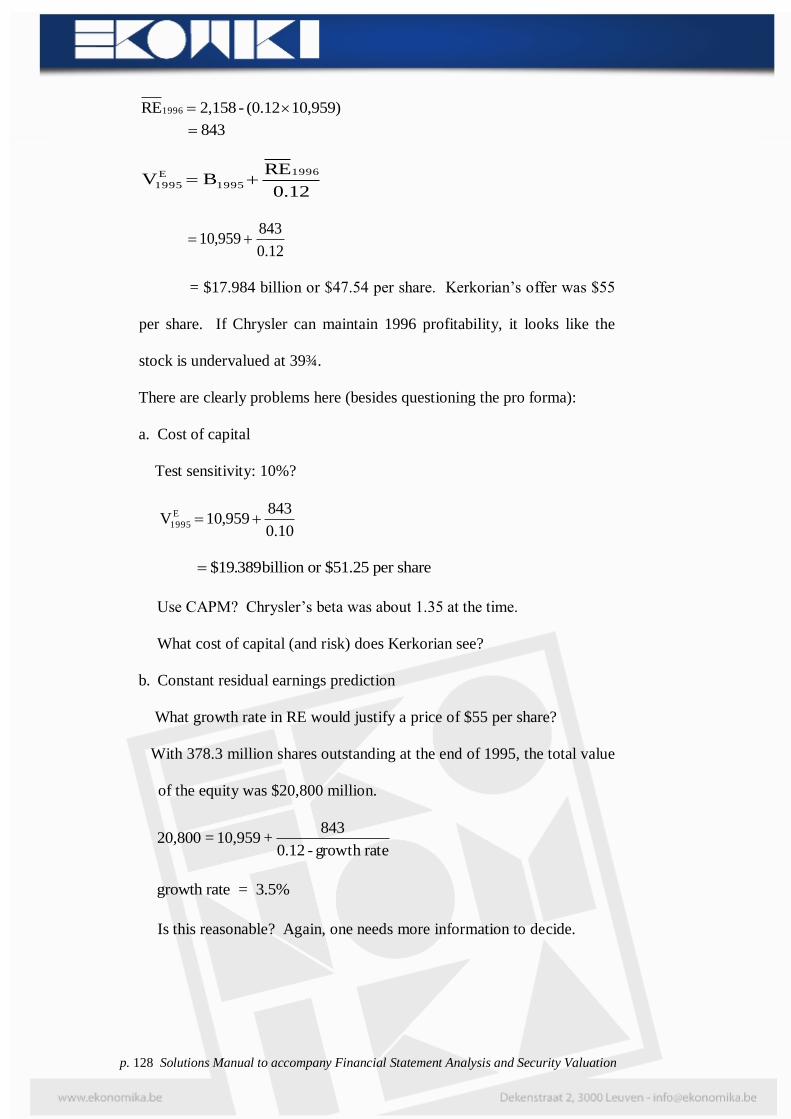
p. 128 Solutions Manual to accompany Financial Statement Analysis and Security Valuation
10,959) (0.12-2,158RE1996
843
0.12
REBV
1996
1995
E
1995
12.0
843959,10
= $17.984 billion or $47.54 per share. Kerkorian’s offer was $55
per share. If Chrysler can maintain 1996 profitability, it looks like the
stock is undervalued at 39¾.
There are clearly problems here (besides questioning the pro forma):
a. Cost of capital
Test sensitivity: 10%?
10.0
843959,10VE
1995
$19.389billion or $51.25 per share
Use CAPM? Chrysler’s beta was about 1.35 at the time.
What cost of capital (and risk) does Kerkorian see?
b. Constant residual earnings prediction
What growth rate in RE would justify a price of $55 per share?
With 378.3 million shares outstanding at the end of 1995, the total value
of the equity was $20,800 million.
rategrowth -0.12
843+10,959=20,800
growth rate = 3.5%
Is this reasonable? Again, one needs more information to decide.

Accrual Accounting and Valuation: Pricing Book Values – Chapter 5 p. 129
The rough pro forma indicates earnings below 1996 earnings until at
least 2001. And those earnings need more investment to maintain
them.
On the other hand a market price of 3943 per share in April, 1995 (or,
with 378.3 million shares outstanding, $15,037 million total value)
forecasts a perpetual RE as follows
12.0
RE959,10037,15
1996
RE1996 489
This implies a forecast of net income for 1996 of $1,804 million. Too
low?
A more thorough valuation would apply the residual earnings model with
explicit forecasts of RE for 1997, 1998, and so on. This requires a forecast
of book values for subsequent years, and so requires forecasts of dividends
and net share issues. In turn this will require a forecast of cash needed which
depends on cash to be generated from operations and from borrowing.
This could get complicated. We will simplify the process immensely. And
we will develop the financial analysis that will give as much better pro
formas than the rough one here.
Valuation using analysts’ forecasts
In April 1995, analysts were forecasting eps for 1996 in a range of $4.15 to $6.23, with an
average of $5.10. Their forecasts for 1997 ranged from $3.21 to $5.55, with an average of
$4.38. The typical growth rate in eps forecasted for the three years after 1997 was 9%.

p. 130 Solutions Manual to accompany Financial Statement Analysis and Security Valuation

Accrual Accounting and Valuation: Pricing Book Values – Chapter 5 p. 131
Using these forecasts, predict future residual earnings:
1995A 1996E 1997E 1998E 1999E 2000E
Eps 5.10 4.38 4.77 5.20 5.67
Dps 2.50 2.80 2.90 3.00 3.20
Bps 28.97 31.57 33.15 35.02 37.22 39.69
ROCE 17.6% 13.9% 14.4% 14.8% 15.2%
RE(.12) 1.62 .59 .79 1.00 1.20
PV of RE 1.45 .47 .56 .66 .68
[The dps forecast is typically not given by analysts: one has to conjecture
what they had in mind in making the eps forecasts, as future eps will depend
on prior payout.]
You’ll notice the pro forma is on a per-share basis, so one does not have to be concerned with
possible share issues or repurchases.
Value the equity as follows:
Book value, 1995 $28.97
Present value of RE to 2000 3.82
Present value of continuing value 5.67
Value, 1995 $38.46
]00.100.12
1.20 = growth) (no valueg[Continuin
This valuation is sensitive to the continuing value calculation. What did
analysts have in mind after the year 2000?
Given analysts’ forecasts, the perpetual RE growth rate (after 2000) that
yields the bid price of $55 is 8.7%:
Book value, 1995 $28.97
Present value of RE to 2000 3.82
Present value of continuing value 22.21
Value, 1995 $55.00

p. 132 Solutions Manual to accompany Financial Statement Analysis and Security Valuation
]52.391.087 - 1.12
1.087 1.20 = 1.087) = (g valueg[Continuin
Can we justify a perpetual growth rate of 8.7% in residual earnings?
A lesson to be learnt here: using analysts forecasts can be difficult because
they usually do not give (very) long-term growth rates and they do not give
dividend forecasts.
By now you are probably frustrated by the lack of information to solve the
problem. You also realize you don’t have all the tools. Indeed the purpose
of this case is to spur you on to the succeeding chapters of the book which
give you the apparatus to deal with the problem.
You found that you lacked the following:
a) A strategy analysis
b) More information on how strategy will generate sales
c) More information on the expected profit margins and expense ratios of the
business
d) The tools to determine not just the future ROCE but also the growth in
book value which determine future residual earnings. What investments
will be necessary? How much additional equity will have to be raised?
e) The long-term growth rate is clearly crucial.

Accrual Accounting and Valuation: Pricing Book Values – Chapter 5 p. 133
Question C of the Case
Kerkorian might advance the following arguments for paying out the $7.5
billion in cash:
a) If management can’t find good investments for the cash, give it to the
shareholders who might.
b) Without a cash buffer to protect themselves during bad times,
management may work harder to generate more profits for shareholders
and to protect shareholders against bad times in other ways. And
management who have excess cash are tempted to invest it unwisely.
Corporate Jets? This is the so-called “free cash flow hypothesis:” too
much cash gives poor incentives to management. Are management just
protecting themselves - their jobs and their incomes - against a rainy day
rather than protecting shareholders?
c) The rainy day argument has a fallacy. If a rainy day brings trouble, but it’s
temporary trouble, the firm can (if it indeed needs cash) borrow or issue
new stock against the value expected to be generated in a recovery. A
problem might be communicating to banks or the capital market that the
trouble was temporary. Chrysler had had an experience in the late 1970s
and early 1980s when it required US government guarantees on debt
raised to get it through its troubles.
If a rainy day were permanent (operations permanently unprofitable) then
the shareholders would not wish management to have the cash to lose in
“chasing after the bad”.

p. 134 Solutions Manual to accompany Financial Statement Analysis and Security Valuation
d) The “cash” is in the form of liquid financial assets. Holding financial
assets within corporations is not in shareholders’ interest. The interest
income is taxed within the corporation and then again to the shareholders
through taxes on dividends on capital gains for the income. This double
taxation is avoided by payout. If investors want to invest in financial
assets (which take no special skills), they should do it on personal
account, not through a corporation. Holding financial assets in a
corporation is justified only as a way of temporarily storing cash until it is
needed in operations. This need is what’s at issue.
e) If, as management insists, the financial assets are being held to use in
operations, they are at risk in operations. Accordingly they should be
required to earn at rate reflecting that risk. They are currently earning at
the rate for less risky debt investments. Thus, as assets employed in
operations, they are generating negative residual earnings and losing
value. Suppose the financial assets (T-bills, say) were earning 3.5% after
tax. Then, with approximately $8.0 billion of the assets, the annual
income would be $280 million in income. As a holding of T-bills, they
would earn zero residual income:
Residual income = 280 – (0.035 x 8.0 billion) = 0
Here the required return is just the required return on T-bills. But, if the
assets were being put at risk in the operations (for a rainy day), the
required rate is the rate for the risk in the operations. If this is 12%, then
Residual income = 287 – (0.12 x 8.0 billion) = - $673 million (negative!)

Accrual Accounting and Valuation: Pricing Book Values – Chapter 5 p. 135
So the annual cost for carrying these assets as insurance against a
rainy day is $673 million. Is this expensive insurance? Can the
shareholders better employ the $8.0 billion elsewhere?
f) If Chrysler’s shares were undervalued, the cash could be used to buy back
the stock and so create value for shareholders.