chapter five event operations planning - … program planning efforts for future planned special...
TRANSCRIPT

5-1
OV
ER
VIE
W
DA
Y-O
F-E
VE
NT
AC
TIV
ITIE
S A
DV
AN
CE
PL
AN
NIN
G
POST
-EV
EN
T A
CT
IVIT
IES
EV
EN
T P
RO
FIL
E
5CHAPTER FIVE
EVENT OPERATIONS PLANNING
Figure 5-1 Event Planning Team Meeting
PURPOSE This chapter presents advance planning and stakeholder coordination activities con-ducted for a specific planned special event. It represents the first of three successive chapters on the event operations planning phase. The primary, interrelated products of the event operations planning phase include: (1) feasibility study, (2) traffic management plan, and (3) travel demand management initiatives. This chapter describes initial planning activities, summarizes feasibility study analysis steps specific to a planned special event, and highlights external factors
affecting the scope of event impact on trans-portation system operations. Practitioners can use this chapter as a tool to: (1) establish an event operations planning framework for guiding stakeholder activities throughout the phase, (2) assist in deciding whether to grant or deny preliminary ap-proval to schedule a proposed planned spe-cial event based on predicted transportation system impacts and (3) determine traffic and parking demand, roadway capacity deficien-cies, and unplanned scenarios that define that scope of traffic management plan re-quired (Chapter 6) in addition to the need for developing travel demand management ini-tiatives (Chapter 7).

5-2
INTRODUCTION This chapter helps practitioners to hit the ground running on advance planning for a specific planned special event. Compared to Chapters 6 and 7 which detail strategies and tactics for mitigating the impact of planned special events on transportation system op-erations, this chapter emphasizes, with sup-porting example case studies, the importance of facilitating a planning structure, stake-holder coordination, and comprehensive event assessment in generating event plan-ning phase products that completely and ac-curately guide operations activities on the day-of-event. A section on initial planning activities de-scribes input data requirements for analyz-ing the event impact and discusses scenarios linked to particular events that may require the development of a contingency plan(s). The section lists transportation system per-formance objectives, and associated facility-specific measures of effectiveness (MOEs), that satisfy the customer service require-ments of event patrons and other road user classes. It presents an event operations planning schedule and lists various products of the event operations planning phase. The section concludes by examining situations necessitating public involvement, summariz-ing the feasibility study and traffic manage-ment plan review process, and identifying successful policies and agreements for man-aging and operating a planned special event. The event feasibility study section presents travel forecast process strategies and consid-erations for estimating modal split, event-generated traffic demand, and vehicle occu-pancy factors. It reviews techniques for identifying a market area and directional dis-tribution of event-generated traffic. The section reviews methodologies for identify-ing and evaluating the sufficiency of avail-able venue parking supply based on event
parking demand and existing conditions. It specifies traffic demand analysis and road-way capacity analysis strategies, including the application of various traffic modeling and capacity analysis tools. To provide a lead-in to the following two chapters on event operations planning, the section de-scribes a toolbox of mitigation strategies for adjusting event traffic generation levels as well as increasing transportation system ca-pacity. This chapter concludes with an examination of external factors that may create consider-able impact on transportation system opera-tions if ignored. A feasibility study may not account for issues such as available re-sources, weather, concurrent road construc-tion activities, and concurrent planned spe-cial events. These factors must be ac-counted for early in the advance planning process as well as in traffic management plans prepared for a planned special event. For example, given a particular recurring event, event patrons and non-attendee trans-portation system users may realize satisfac-tory system operations during one event oc-currence, then experience an unacceptable level of service during the next event occur-rence. Such incidents occur when stake-holders do not account for various external factors, through scenario-based response plans, early in the event traffic management plan development process. INITIAL PLANNING ACTIVITIES Overview This section examines key planning initia-tives and special considerations in order to help guide the user through the first steps of the event operations planning phase. The event operations planning phase begins with stakeholders establishing a planning frame-

5-3
OV
ER
VIE
W
DA
Y-O
F-E
VE
NT
AC
TIV
ITIE
S A
DV
AN
CE
PL
AN
NIN
G
POST
-EV
EN
T A
CT
IVIT
IES
EV
EN
T P
RO
FIL
E
5
work and schedule. The framework in-cludes forming an event planning team, cre-ating agreements, identifying performance goals and objectives, and deciding on miti-gation assessment and approval protocol. Special considerations evolve from review-ing the event operations characteristics of a particular special event (e.g., risk assess-ment) in addition to past successes and les-sons learned. These considerations weigh heavy on traffic management plan require-ments, and stakeholders must address issues affecting community residents and busi-nesses through public outreach efforts early in the planning phase in order to ensure proper mitigation and non-conflict with traf-fic management plan specifications. Stakeholder Roles and Coordination The event planning team handles tasks asso-ciated with event-specific operations plan-ning and traffic management plan implementation. Table 5-1 lists the primary responsibilities of the event planning team under the event operations planning phase. The event planning team consists of a di-verse group of stakeholders with either event operations or community interest as their primary concern. The success of the event planning team depends on achieving strong coordination among participating team stakeholders.
Table 5-1 Event Planning Team Responsibilities
During the Event Operations Planning Phase RESPONSIBILITY
• Perform feasibility study. • Develop traffic management plan. • Evaluate travel demand management initia-
tives.
Event Planning Team Establishment An event planning team forms as a result of either: (1) coordination among traffic opera-tions agencies, transit agencies, law en-forcement agencies, and event organizers that represent the core event planning team stakeholders or (2) designation by a commit-tee on special events within a regional trans-portation management organization, such as a traffic incident management program. • The former typically describes event
planning teams formed in response to lo-cal planned special events affecting few jurisdictions, such as events occurring in rural or urban areas.
• The latter may occur in metropolitan ar-eas where planned special events happen frequently, thus warranting an on-call event planning team.
A regional transportation committee on special events features stakeholders that have achieved interagency coordination through past, cooperative travel manage-ment efforts. • Stakeholder representatives have first-
hand knowledge of the roles, resources, and capabilities of each committee par-ticipant.
• Stakeholders commonly include traffic operations agencies, law enforcement, transit agencies, event organizers or venue operators, and the media.
• Committees in metropolitan areas may create task forces for specific planned special event venues or recurring planned special events (e.g., annual fairs, fireworks displays, parades, etc.). The committee or task force generally meets and performs event operations planning tasks on an as-needed basis. The group may also convene regularly (e.g., weekly, monthly, or quarterly) to review

5-4
program planning efforts for future planned special events.
Prior to initiating the event operations plan-ning process, the core event planning team should adopt a mission, or purpose, and so-licit buy-in from public agency stakeholders, the community, and other event support stakeholders. In identifying pertinent juris-dictions, the event planning team may con-sider contacting stakeholders within a cer-tain distance (e.g., five miles) of the event venue. The event planning team can obtain buy-in from community interest stake-holders more easily when a core group of stakeholders already exists, including public agencies. Elected officials and the public
can serve as advocates for the event plan-ning team; therefore, participation from these stakeholders should occur early in the event operations planning phase. Table 5-2 indicates the typical function of each participating stakeholder in generating the primary products of the event operations planning phase. A list of stakeholders is referenced to the three products produced: (1) feasibility study, (2) traffic management plan, and (3) travel demand management. Stakeholders contribute data, communicate needs, and/or furnish resources. Often, cer-tain agencies promote initiatives developed by the event planning team, such as travel demand management strategies.
Table 5-2 Stakeholder Participation in Event Operations Planning
PRODUCTS OF THE EVENT PLANNING TEAM
FEASIBILITY STUDY
TRAFFIC MANAGEMENT
PLAN
TRAVEL DEMAND MAN-AGEMENT
STAKEHOLDER
INPUT DEVELOP REVIEW INPUT DEVELOP REVIEW INPUT DEVELOP REVIEW PROMOTE
Traffic Operations Agency • • • • • • • • • •
Law Enforcement • • • Event Organizer • • • • • Fire and EMS • • • Elected Official • • • • • Transit Agency • • • • • • Public • • • • • Private Transporta-tion Consultant • • • • •
Private Traffic Control Contractor •
Media • Office on Special Events • •
Emergency Management Agency • •
Regional Organization • • • • • •
5-5
OV
ER
VIE
W
DA
Y-O
F-E
VE
NT
AC
TIV
ITIE
S A
DV
AN
CE
PL
AN
NIN
G
POST
-EV
EN
T A
CT
IVIT
IES
EV
EN
T P
RO
FIL
E
5
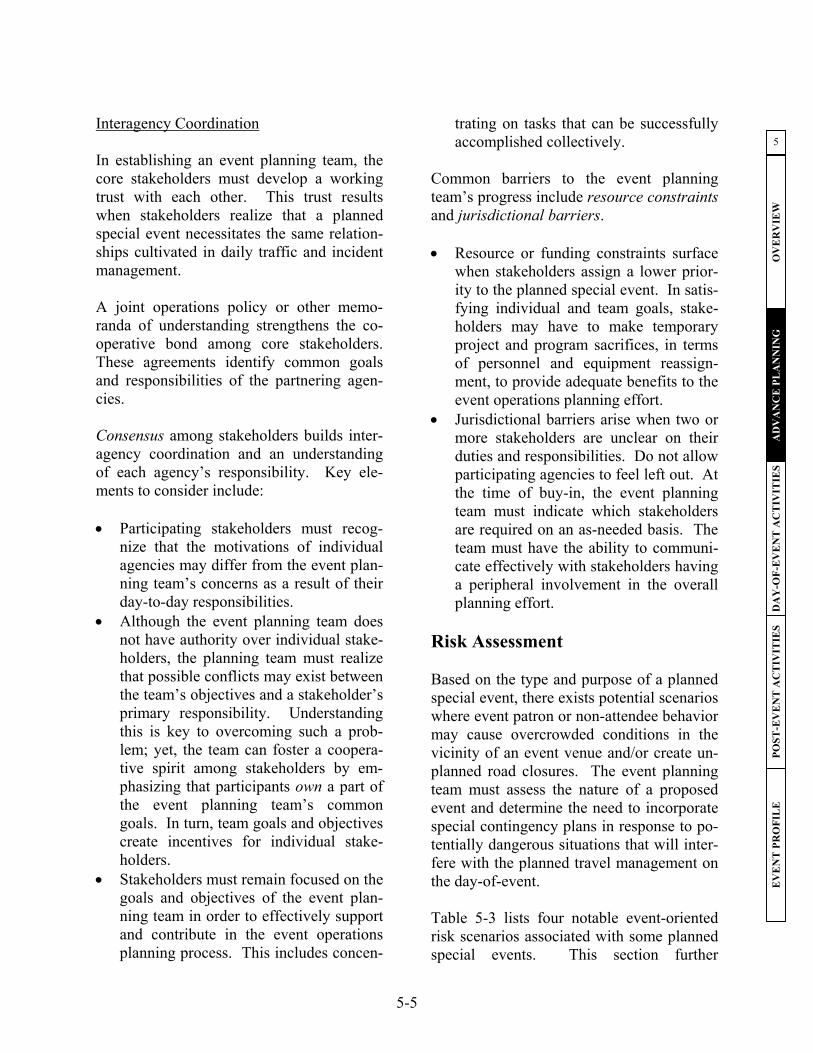
Interagency Coordination In establishing an event planning team, the core stakeholders must develop a working trust with each other. This trust results when stakeholders realize that a planned special event necessitates the same relation-ships cultivated in daily traffic and incident management. A joint operations policy or other memo-randa of understanding strengthens the co-operative bond among core stakeholders. These agreements identify common goals and responsibilities of the partnering agen-cies. Consensus among stakeholders builds inter-agency coordination and an understanding of each agency’s responsibility. Key ele-ments to consider include: • Participating stakeholders must recog-
nize that the motivations of individual agencies may differ from the event plan-ning team’s concerns as a result of their day-to-day responsibilities.
• Although the event planning team does not have authority over individual stake-holders, the planning team must realize that possible conflicts may exist between the team’s objectives and a stakeholder’s primary responsibility. Understanding this is key to overcoming such a prob-lem; yet, the team can foster a coopera-tive spirit among stakeholders by em-phasizing that participants own a part of the event planning team’s common goals. In turn, team goals and objectives create incentives for individual stake-holders.
• Stakeholders must remain focused on the goals and objectives of the event plan-ning team in order to effectively support and contribute in the event operations planning process. This includes concen-
trating on tasks that can be successfully accomplished collectively.
Common barriers to the event planning team’s progress include resource constraints and jurisdictional barriers. • Resource or funding constraints surface
when stakeholders assign a lower prior-ity to the planned special event. In satis-fying individual and team goals, stake-holders may have to make temporary project and program sacrifices, in terms of personnel and equipment reassign-ment, to provide adequate benefits to the event operations planning effort.
• Jurisdictional barriers arise when two or more stakeholders are unclear on their duties and responsibilities. Do not allow participating agencies to feel left out. At the time of buy-in, the event planning team must indicate which stakeholders are required on an as-needed basis. The team must have the ability to communi-cate effectively with stakeholders having a peripheral involvement in the overall planning effort.
Risk Assessment Based on the type and purpose of a planned special event, there exists potential scenarios where event patron or non-attendee behavior may cause overcrowded conditions in the vicinity of an event venue and/or create un-planned road closures. The event planning team must assess the nature of a proposed event and determine the need to incorporate special contingency plans in response to po-tentially dangerous situations that will inter-fere with the planned travel management on the day-of-event. Table 5-3 lists four notable event-oriented risk scenarios associated with some planned special events. This section further

5-6
Table 5-3 Summary of Event-Oriented Risk Scenarios
EVENT-ORIENTED RISK EXAMPLE SCENARIO Demonstration or protest • Any event that is political in nature or invokes social concern.
• Political conventions and parades Ticketless event patrons causing overcrowding
• Sold-out sports championship games • Sold-out concerts involving select performers
Fan celebration • Response to city or school sports team winning a championship. Event patron violence • Motorcycle rally violence between patrons and/or participants.
describes these scenarios and highlights ex-ample case studies that illustrate resulting impacts on advance planning and/or day-of-event operations. Chapter 6 provides de-tailed guidance on contingency planning in addition to the development of specific strategies (e.g., alternate route plans) needed to effectively respond to certain unplanned scenarios. Demonstration or Protest Certain political or socially controversial planned special events may provoke a dem-onstration or protest. Those attending the demonstration represent non-attendees, and the event planning team often has little or no advance information regarding the demon-stration’s specific location and time of oc-currence. The event planning team should obtain access to relevant law enforcement intelligence reports regarding potential dem-onstrations to develop an effective travel management contingency plan. The threat of an unplanned road closure should prompt the event planning team to consider develop-ing an alternate route contingency plan de-tailing the personnel and equipment re-sources necessary to effect an immediate diversion of traffic. Appendix B contains a contingency diver-sion routing plan prepared in response to the potential for demonstrations during the 2000 Republican National Convention in Phila-delphia, PA.
Overcrowding The occurrence of sports championship games or major concerts at venues having a defined sell-out capacity may attract ticket-less event patrons not accounted for in event travel forecasts and impact mitigation strategies. Events such as the Super Bowl or National Collegiate Athletic Association (NCAA) Final Four cause an increase in area visitors beyond the actual event partici-pants and patrons. Sold-out music festivals may attract persons wanting to tailgate in venue parking areas despite not having a ticket. For instance, event planners originally an-ticipated 200,000 people to attend a two-day Grateful Dead reunion concert at a 35,000 seat amphitheater in rural East Troy, WI, located approximately 30 miles southeast of Milwaukee. The Walworth County High-way Committee initially denied the event organizer a permit to hold the two concerts. After the event organizer unveiled a com-prehensive security and traffic management plan that included using advance check-points to turn away any vehicle that con-tained a ticketless occupant, county execu-tives overturned their decision and issued a permit.(1) Appendix B contains a list of re-strictions imposed by the event organizer and event planning team to prevent ticket-less event patrons from gaining access to the venue parking areas.

5-7
OV
ER
VIE
W
DA
Y-O
F-E
VE
NT
AC
TIV
ITIE
S A
DV
AN
CE
PL
AN
NIN
G
POST
-EV
EN
T A
CT
IVIT
IES
EV
EN
T P
RO
FIL
E
5
Fan Celebration Another severe impact risk associated with sports championship games involves fan celebrations that occur when a city sports team wins a championship at home. In this case, the traffic management team charged with managing travel during event egress must also mitigate traffic impacts caused by non-attendees converging on the venue site and unruly fans disrupting traffic and pedes-trian flow. For instance, the Detroit Red Wings won the 2002 Stanley Cup in Detroit. Operating from past experience, the Michigan State Police began closing portions of Interstate 75 and the Lodge Freeway (State Route 10) leading to downtown Detroit and the event venue. This contingency plan went into ef-fect at the start of the final period of play with Detroit leading the championship clinching game.(2) Contingency plan details were even posted in advance on Red Wings’ fan websites. Located approximately 16 miles north of the event venue, Royal Oak police and city officials maintained road clo-sure contingency plans to accommodate the thousands of fans that went to the popular clubs and bars to celebrate the home team win.(3) Event Patron Violence An outbreak of violence among event pa-trons warrants special security precautions to contain and capture potential suspects. Law enforcement may initiate a road closure as a first response to discourage people from entering and leaving the region where the violence took place. During the 2002 Laughlin, NV River Run motorcycle rally, attended by tens of thou-sands of motorcycle enthusiasts, a multiple homicide occurred after a clash between ri-val motorcycle gangs. In an effort to cap-
ture the homicide suspects, Nevada officials closed all highways and arterials serving Laughlin, including Nevada State Route 163 at the Nevada/Arizona border as shown in Figure 5-2. Trucks traveling U.S. 93, a North American Free Trade Agreement (NAFTA) designated trucking corridor, traverse State Route 163 because of prohibi-tions on crossing the Hoover Dam. Law en-forcement maintained the road closures for a few hours.(4) A possible traffic management contingency plan prepared in advance of the described security incident would specify a regional alternate route plan coupled with regional traveler information.
Figure 5-2 Nevada State Route 168 Closure During Motorcycle Rally (Photo courtesy of the
Laughlin Free Press) Performance Goals and Objectives The goals of managing travel for planned special events include achieving predictabil-ity, ensuring safety, and maximizing effi-ciency. Table 5-4 states performance objec-tives, for the previously defined classes of transportation system users, applicable to satisfying the overall goal of operations effi-ciency and safety. In meeting these per-formance objectives, the event planning team must target the goal of achieving pre-dictability during the event operations plan-ning phase. Table 5-5 presents common, easy-to-measure measures of effectiveness for assessing the performance

5-8
Table 5-4 Transportation System Operations Performance Objectives for Planned Special Events
USER CLASS PERFORMANCE OBJECTIVE Event patron • Minimize travel delay to/from the event.
• Minimize conflicts between pedestrians and vehicles. • Minimize travel safety hazards. • Minimize impact of traffic incidents. • Disseminate accurate, timely, and consistent traveler information. • Increase automation of traffic control. • Maximize site access service flow rates.
Non-attendee road user
• Minimize travel delay on major thoroughfares, freeways and major arterials. • Minimize impact on commuter and trucker travel time reliability. • Maintain required parking and access for local residents and businesses. • Maintain unimpeded access for emergency vehicles.
Transit user • Maintain scheduled travel times. • Minimize transit bus dwell times. • Maintain required transit station parking for non-attendee transit users.
objectives that describe traffic operations. The event planning team should consider field studies to quantify existing MOEs at key roadways and intersections to calibrate capacity analysis software and computer simulation models applied during traffic management plan development. The identi-fied MOEs represent day-of-event perform-ance evaluation data, useful for: (1) making real-time adjustments to the traffic manage-ment plan on the day-of-event, (2) conduct-ing a post-event evaluation of transportation system performance, and (3) referencing during advance planning for future event occurrences. NCHRP Synthesis 311, Performance Meas-ures of Operational Effectiveness for High-way Segments and Systems, reports on the state-of-the-practice of using performance measures for the monitoring and operational management of highway segments and sys-tems.(5) It assesses the relative strengths and weaknesses of various performance meas-ures. Based on a survey of current agency practice, the synthesis reports that perform-ance measures associated with planned spe-cial event management are similar to traffic and incident management, but may also in-clude performance measures related to
clearance times (e.g., time for vehicles to clear a venue site area) and parking man-agement measures.
Table 5-5 Measures of Effectiveness for Assessing
Performance Objectives LOCATION MEASURE OF
EFFECTIVENESS Venue parking areas
• Occupancy and turnover rate • Arrival and departure service
rate • Time to clear parking lots
Intersections • Vehicle delay • Queue length
Freeways and streets
• Travel time and delay • Traffic volume to capacity
ratio • Traffic speed • Number and location of
crashes and other incidents • Traffic incident clearance time
Planning Schedule and Deliverables Two deliverables, produced by the event planning team during the event operations planning phase, include the feasibility study and the traffic management plan, designed to mitigate impacts identified in the feasibil-ity study. Travel demand management represents a key component of the overall

5-9
OV
ER
VIE
W
DA
Y-O
F-E
VE
NT
AC
TIV
ITIE
S A
DV
AN
CE
PL
AN
NIN
G
POST
-EV
EN
T A
CT
IVIT
IES
EV
EN
T P
RO
FIL
E
5
process when forecasted traffic demand lev-els approach or exceed available roadway capacity. The previous chapter outlined a detailed special event permit process and identified advance planning deadlines applicable to the event organizer. In turn, Figure 5-3 illus-trates a high-level event operations planning schedule for an event planning stakeholder group. The figure lists advance planning activities and potential stakeholder meetings and public hearings in a timeline relative to the planning deliverables. The schedule in-dicates other stakeholder planning initia-tives, such as the development of a special-
ized transit plan to reduce event traffic de-mand. The event planning team should: • Obtain a completed special event permit
application and commence work on the event feasibility study no later than 60 days prior to the event.
• Start developing the event traffic man-agement plan and obtain all initial public input and recommendations no later than 30 days before the event.
• Set aside the final 14 days prior to the event for implementation activities in addition to event information dissemina-tion.
Figure 5-3 Event Operations Planning Schedule
ProposeEvent
PerformFeasibility
Study
DevelopTraffic
ManagementPlan
Advance toImplementation
Activities
EVENT OPERATIONS PLANNING TIMELINE
Submit PermitApplication
Meeting onEvent Concept
and Review PastLessons Learned
Meeting onTraffic ManagementPlan Requirements
Meeting onTraffic Management
Plan Review
Hearing withPublic to Assess
Needs
Develop Travel Demand Management Initiatives
Conduct Public Outreach Develop Transit Plan
Issue PermitApproval
MONTHS WEEKS DAYS
60 Days 30 Days 14 Days
N.T.S.
Perform Situation Analysis andRisk Assessment
ApproveMitigationEstablish Policies and Agreements
Event
5-10
The planning schedule provides a generic timeline, recognizing that actual event op-erations planning schedules vary considera-bly. For instance, some major, roving planned special events, such as the U.S. Golf Open, require an event operations planning phase spanning more than one year. Public Outreach Planned special events that may impact ad-jacent neighborhoods and businesses usually require public involvement to address re-lated concerns. The public represents indi-vidual residents, businesses, and associated community groups. Public outreach activi-ties initiated early in the event operations planning phase can reveal important issues that local residents and businesses may have. Soliciting these concerns through public involvement, and addressing the is-sues in the planning process, can improve relations and day-of-event operations. Street use events or other planned special events that take place at venues located ad-jacent to residential and/or commercial dis-tricts may significantly impact non-attendee mobility and community quality of life. Specific neighborhood impact issues include heavy traffic demand on local streets and event patron use of available local on-street parking. These issues arise because, in some instances, event patrons may find on-street parking in residential neighborhoods and business districts affords more conven-ient ingress and egress. In addition, illegal parking fines may not exceed, or signifi-cantly exceed, the fee charged at designated venue parking areas. Initiation of public outreach efforts includes stakeholders, such as a traffic operations agency or law enforcement, holding initial
and regular meetings with community groups and local elected officials. At these meetings, the event planning team should present the scope of the event in enough de-tail to solicit quality input and buy-in from public stakeholders. Concerns revealed in this process should be addressed, and feasi-ble solutions presented, so that the public stakeholders feel assured that impacts will be mitigated to their satisfaction. The event planning team and public stake-holders should identify potential problems prior to the development of the traffic man-agement plan. These problems can be iden-tified by first understanding the event scope with consideration given to current neighborhood traffic and parking restric-tions, traffic management plans deployed during past planned special events, and iden-tified problems experienced during past events. With this information, the public stakeholders can make informed decisions and provide valuable input to the event planning team. Example Case Studies Innovative strategies developed by the cities of Seattle and Chicago to minimize neighborhood traffic and parking impacts during discrete/recurring events at a perma-nent venue are highlighted in three case studies summarized below. It should be recognized that an event planning team can implement these strategies on a temporary basis for less frequent continuous events and street use events. Case Study One: University of Washington. Due to the construction of a new football stadium, the Seattle Seahawks moved their scheduled 2000 and 2001 home games to the University of Washington’s Husky Stadium. Recognizing the Seahawks represented a

5-11
OV
ER
VIE
W
DA
Y-O
F-E
VE
NT
AC
TIV
ITIE
S A
DV
AN
CE
PL
AN
NIN
G
POST
-EV
EN
T A
CT
IVIT
IES
EV
EN
T P
RO
FIL
E
5
new and different stadium user with unique characteristics, the City of Seattle required development of a Seahawk Football Trans-portation Management Program.(6) Key strategies included: • The City of Seattle DOT, Seahawks or-
ganization, University of Washington, neighboring residents, and other City of Seattle officials conducted formal meet-ings prior to and during the Seahawks football season to listen to community concerns, report on operations, develop plan modifications, and review perform-ance goal achievement.
• A hotline was established for local resi-dents to voice concerns and to commu-nicate day-of-event observations.
• Stakeholders responded by developing carpool parking pricing incentives and establishing new restricted parking zones (RPZ) in residential neighbor-hoods adjacent to Husky Stadium.
• The number of parking enforcement of-ficers assigned to patrol the RPZs on the day-of-event increased from 6 to 13, and the Seattle Municipal Court approved an RPZ violation fine increase from $28 to $44 (although a $71 fine was initially proposed).
• Table 5-6 notes specific performance goals established by the event planning team to evaluate roadway system per-
formance objectives for the 2000 Seattle Seahawks football season.
Case Study Two: Safeco Field in Seattle, WA. Safeco Field, home to baseball’s Seat-tle Mariners, was constructed in 1999 and borders three neighborhoods. Recognizing the residential and business needs of these neighborhoods, the City of Seattle devel-oped an Inaugural Season Transportation Management Program (TMP) for events at the stadium venue.(7) Key strategies included: • Participating stakeholders set the follow-
ing TMP goal: The primary goal, first and foremost, is reducing the number of vehicles, drive-alone and otherwise, as-sociated with game attendance, thereby deflecting the traffic and parking im-pacts from the adjacent destination neighborhoods and the regional trans-portation system as a whole. The goals, which are stepped according to the kinds of and anticipated attendance, are ex-pressed in vehicles per thousand atten-dees.
• The Mariners organization, City staff, and the public formed the event planning team charged with developing the TMP.
Table 5-6
Seahawk Football Transportation Management Program Goals and Objectives(6) GOAL MEASURE MEASURED PER-
FORMANCE GOAL MET?
Travel reduction No more than 195 cars/1000 attendees 182 cars/1000 attendees Yes
Travel time Within 5% of Husky game travel times
-0.1% to 4.7% different than for Husky games Yes
Duration of post-game traffic
Equal to or less than after Husky games 35 minutes less Yes

5-12
• The stakeholders focused on meeting
numerous performance-based traffic demand mitigation requirements, vary-ing by type of event and attendance lev-els, set by the Seattle City Council upon issuing a stadium master use permit.
• First year operation performance goals for Mariner’s baseball games ranged from 330 (sell-out) to 345 vehicles per 1000 attendees. The permit specified third year operation and beyond per-formance goals ranging from 275 (sell-out) to 325 vehicles per 1000 attendees.
• A top priority for the TMP concerned deflecting special event parking impacts on the surrounding neighborhoods to the Seattle Central Business District.
• Table 5-7 lists specific measures consid-ered by City officials to minimize on-
street parking by event patrons in adja-cent neighborhoods.
Case Study Three: U.S. Cellular Field in Chicago, IL. The City of Chicago DOT maintains a Resident Parking Permit Pro-gram to preserve legal on-street parking for residents of neighborhoods surrounding U.S. Cellular Field during all Chicago White Sox baseball games.(8) Key elements of the Resident Parking Per-mit Program include: • For residents living within the program
area, the City issues one resident parking permit per registered vehicle in addition to one guest permit per resident.
Table 5-7 Measures Considered in Developing a Neighborhood Parking Management Plan
for Seattle’s Safeco Field(7) PARKING MANAGEMENT OPTION
• Extend parking meter enforcement hours (until at least 10 p.m. and on Sundays). • Replace existing meters with smart meters (programmable by season, allowing extended hours during base-
ball season, for instance). • Impose time limits on parking after 6 p.m. with signs (rather than extend meter hours, place 2 hour limits on
metered spaces after 6 p.m. and on Sundays). • Impose time limits on parking after 6 p.m. with meter hoods. • Enforce parking restrictions 7 days per week (8 a.m. to 6 p.m. on Sundays). • Add new parking meters. • Reduce parking meter duration limits (change some 2 hour meters to 1 hour or less). • Replace 4 hour and unrestricted spaces with 2-hour spaces. • Refine role of City’s enforcement officers (add community/public relations function). • Assess higher fines for parking infractions in the ballpark neighborhoods. • Increase enforcement (additional parking enforcement officers on game days; multiple ticketing). • Create residential parking zones. • Increase number and/or size of loading zones. • Create business parking zones. • Discontinue access restrictions that temporarily remove on-street parking (before and after events). • Discontinue parking prohibitions for stadium access (before, during, and after events). • Parking space delineation in non-metered areas.

5-13
OV
ER
VIE
W
DA
Y-O
F-E
VE
NT
AC
TIV
ITIE
S A
DV
AN
CE
PL
AN
NIN
G
POST
-EV
EN
T A
CT
IVIT
IES
EV
EN
T P
RO
FIL
E
5
• The City also makes available guest
parking permits for area businesses and churches to allow customers and con-gregation members to park in legal on-street parking spaces and gain access to off-street business/church parking within the program area.
• Figure 5-4 shows a sign enforcing the Resident Parking Permit Program.
• The City has a similar permit program in place for neighborhoods surrounding Wrigley Field, home to baseball’s Chi-cago Cubs.
Figure 5-4 Chicago Resident Permit Parking Program
Enforcement Stakeholder Review of Planning Products The previous chapter summarized various criteria for planned special event permit ap-proval. However, as indicated in Figure 5-3, the event operations planning phase includes intermediate and final review periods for the event feasibility study and traffic manage-ment plan. Stakeholder review concentrates on the identification and proposed mitigation of
event travel impacts. Effective and rapid stakeholder review of event operations plan-ning products requires: (1) an annotated planning timeline, (2) a review process, and (3) performance standards. Annotated Planning Timeline In cases where an event planning team col-lectively develops a feasibility study, traffic management plan, and associated mitigation strategies, an annotated planning timeline proves effective for monitoring team pro-gress. The Wisconsin DOT found such a tool use-ful for tracking specific traffic management planning and infrastructure deployment ac-tivities required to prepare for the opening of Miller Park in Milwaukee. The agency maintained a responsibility matrix listing each action item, the stakeholder responsi-ble, the due date, and the present deploy-ment status. An event planning team should establish an annotated planning timeline early in the event operations planning phase and use the tool to guide subsequent team meeting agendas as stakeholders develop event impact mitigation strategies and tac-tics. Review Process Adopting a formal review process reduces unnecessary delay in producing event opera-tions planning deliverables required to stage a planned special event. Key aspects to be considered include: • The review process should feature the
oversight team monitoring and review-ing plans developed by the event plan-ning team.
• The oversight team typically consists of mid-to-upper level representatives of

5-14
transportation agencies and law en-forcement in addition to elected officials and ranking officials of other public agencies.
• A regional organization may assume the duties of an oversight team.
• Under a formal review process, an event planning team may seek oversight team approval of a feasibility study scope or conceptual traffic management plan prior to commencing work on the final deliverable. Both stakeholder groups in-teract again to review feasibility study results and final traffic management op-erations plans.
• Some jurisdictions have a champion charged with resolving institutional and operations issues affecting travel man-agement for planned special events. These champions have the position to mitigate issues hampering the event op-erations planning process. Therefore, they should administer the review proc-ess.
• Jurisdictions should have an alternate official ready to replace the current champion should that person resign from present duty.
Performance Standards This chapter included a review of various transportation system operations perform-ance objectives and associated measures of effectiveness that stakeholders may use to monitor system performance on the day-of-event and, in turn, evaluate travel manage-ment efforts. During the event operations planning phase, stakeholders must set and agree to performance standards used to as-sess traffic impact mitigation proposals. These performance standards typically rep-resent level of service (LOS) measures ap-plicable to freeway and street segments, freeway junctions, and roadway intersec-tions. Stakeholders assigned to develop
mitigation strategies or review planned spe-cial event impacts on traffic should refer-ence jurisdiction Traffic Impact Study guidelines defining accepted LOS thresh-olds. The LOS thresholds likely vary by roadway classification. In urban and metro-politan areas, jurisdictions may deem an LOS D, describing high-density stable flow, acceptable for freeways, arterials, and major intersections. Similarly, an LOS C, describ-ing stable flow, may represent the allowable threshold for local streets and intersections. Small urban and rural areas may have more stringent requirements. Jurisdictions may relax their performance standards and allow LOS E operation, describing unstable capacity flow, on major roadway facilities for infrequent planned special events. Policies and Agreements The establishment of special policies and agreements to support planning and day-of-event management of planned special events facilitates efficient stakeholder collaboration and defines important event support stake-holder services that may be incorporated into a traffic management plan for a particu-lar planned special event. These initiatives improve interagency relationships, clarify decision-making responsibilities and expec-tations, and secure on-call services and agency actions. For instance, a particular policy or agreement may intuitively support a contingency response plan to mitigate un-anticipated congestion delay on the day-of-event. Stakeholders may develop policies and agreements specific to a particular planned special event or for all planned spe-cial events in a region. Because of the po-tential significant time to develop and ap-prove a particular policy or agreement, stakeholders should establish these initia-tives early in the event operations planning phase or during the program planning phase.

5-15
OV
ER
VIE
W
DA
Y-O
F-E
VE
NT
AC
TIV
ITIE
S A
DV
AN
CE
PL
AN
NIN
G
POST
-EV
EN
T A
CT
IVIT
IES
EV
EN
T P
RO
FIL
E
5Table 5-8 summarizes four types of policies and agreements involving stakeholders re-sponsible for event operations planning and/or day-of-event operations. Interagency Agreement Interagency agreements include a joint op-erations policy, memorandum of understanding, or mutual-aid agreement between two or more stakeholders. Table 5-9 lists components of interagency agreements. Appendix C contains an Illinois and Washington State joint opera-tions policy, between state DOT and state police, that covers special event plan-ning.(9,10) Stakeholders may also strike an interagency agreement, during the event operations planning phase, applicable to a specific planned special event. Standard Street Use Event Routes The development and use of standard street use event routes reduces the level and com-plexity of event operations planning tasks and overall planning time. In establishing such standard routes for parades and/or street races, stakeholders simplify planning tasks, thus creating a more efficient event operations planning process. The routes specify appropriate event starting and end-ing points coupled with staging areas for participant assembly and disbanding.
Use of a standard street use event route of-fers the following advantages: • Allows reuse of traffic management and
operations plans, with minor modifica-tions as necessary.
• Realizes a cost savings for stakeholders. • Allows for the development of standard
signs, specific to the event route and as-sociated alternate routes for background traffic, that may be reused for future street use events.
• Allows event patrons and non-attendee road users to become familiar with traf-fic patterns during recurring street use events, thus minimizing potential traffic problems on the day-of-event.
Toll Facility Congestion Policy Suspension of toll collections on turnpikes and other toll facilities during periods of heavy congestion represents a new policy concept aimed at reducing congestion and the occurrence of traffic incidents at toll pla-zas. A toll facility congestion policy repre-sents a congestion mitigation strategy appli-cable to planned special events. Both West Virginia and Maryland have experience with this policy:
Table 5-8
Summary of Policies and Agreements Applicable to Managing Planned Special Events ITEM EXAMPLE APPLICATION
Interagency agreement • Joint operations policy between stakeholders that establishes a shared role regarding event operations planning and day-of-event travel management.
• Memorandum of understanding defining stakeholder roles and responsi-bilities.
• Mutual-aid agreement facilitating resource sharing and/or reimbursement for services.
Standard street use event routes • Routes established under the program planning phase for recurring street use events such as parades and races.
Toll facility congestion policy • Suspension of tolls during periods of heavy congestion. Public-private towing agreement • On-call towing and recovery services during a special event.

5-16
Table 5-9
Components of Interagency Agreements COMPONENT
• Advance planning duties and responsibilities • Day-of-event duties and responsibilities • Organization • Resource sharing • Funding reimbursement mechanisms
• A West Virginia Turnpike policy, en-
acted in December 2002, allows Turn-pike officials to open toll plazas for 15 minutes any time vehicle queues extend at least three miles upstream of the plaza. After the 15-minute period ends, officials can determine whether the queue dispersed or if another 15-minute period is required. Under normal opera-tions, Turnpike officials estimate that a vehicle joining a three-mile queue takes approximately 15 minutes to pass through a toll plaza. Officials noted 15 minor crashes occurred on the Sunday after Thanksgiving in 2002, the Turn-pike’s busiest day of the year.(11)
• State legislators in Maryland debated a proposed bill in 2003 to create a similar policy for the Chesapeake Bay Bridge.(12) The bill specifies suspending tolls if a traffic queue extends more than five miles upstream of the toll plaza and is moving at less than 30 miles per hour. The increasing deployment of electronic tolling may obviate the need for these strategies in the future.
Public-Private Towing Agreement Private towing companies perform a specific functional activity in traffic incident man-agement, that is, removal of disabled or wrecked vehicles, spilled cargo, and debris from an incident site. Law enforcement and traffic operations agencies alike have recog-nized the indispensable role private towing companies have in effecting incident re-
moval and restoring the affected road sec-tion back to normal operation. Public agen-cies commonly enter into agreements with one or more commercial towing companies to secure on-call traffic incident clearance services, or at a minimum, the agencies maintain a contact list of local private tow-ing companies. Traffic incident management represents a key consideration in event operations plan-ning. Event planning team stakeholders may establish event-specific public-private towing agreements to secure on-site towing and recovery services. For instance, the City of Cincinnati has established, under the City rules and regulations for police rotation wreckers, a special event tow category.(13) The City defines a special event tow as “when tow operator remains with police of-ficer for a specified period of time towing or moving vehicles as need arises.” The City regulation specifies a special event tow rate of $20.00 per tow or $35.00 per hour, whichever is greater. FEASIBILITY STUDY Overview The structure and approach of a planned special event feasibility study resembles a Traffic Impact Study required for planned developments, as illustrated in Figure 5-5. The figure shows the sequential steps in preparing a feasibility study for a planned special event. Table 5-10 provides an overview of the first five feasibility study components. The ac-curacy of one analysis influences that of an-other. Achieving predictability, a goal of managing travel for planned special events, represents the focus of a feasibility study effort.

5-17
OV
ER
VIE
W
DA
Y-O
F-E
VE
NT
AC
TIV
ITIE
S A
DV
AN
CE
PL
AN
NIN
G
POST
-EV
EN
T A
CT
IVIT
IES
EV
EN
T P
RO
FIL
E
5
Figure 5-5 Feasibility Study Analysis Steps
Table 5-10 Feasibility Study Analysis Summary
COMPONENT ANALYSIS RESULT APPLICATION • Modal split • Number of trips by mode of
travel • Event traffic genera-
tion • Number of vehicle trips by
personal automobile
Travel forecast
• Traffic arrival rate • Number of trips per unit of time
• Input into parking de-mand analysis.
• Input into traffic demand analysis.
Market area analysis
• Event trip origin • Geographic location of event trip origins and percent split
• Input into traffic demand analysis.
• Background parking occupancy
• Number of non-attendee ve-hicles per parking area and unit of time
• Input into event parking occupancy.
Parking demand analysis
• Event parking demand • Number of event-generated vehicles per parking area and unit of time
• Input into traffic demand analysis.
• Background traffic flow
• Background traffic demand rate, adjusted for event-required road closures
Traffic demand analysis
• Event traffic assign-ment
• Event traffic demand rate per assigned route
• Input into roadway ca-pacity analysis.
• Section and point ca-pacity
• Identification of capacity constraints and level of ser-vice
Roadway ca-pacity analysis
• Network operations • Identification of bottleneck locations and saturation flow rates
• Input into traffic man-agement plan.
• Input into travel demand management assessment.
STEP ONETRAVEL FORECAST
STEP TWOMARKET AREA ANALYSIS
STEP THREEPARKING DEMAND ANALYSIS
STEP FOURTRAFFIC DEMAND ANALYSIS
STEP FIVEROADWAY CAPACITY ANALYSIS
STEP SIXMITIGATION OF IMPACTS
Trip generation
Directional distribution(origin)
Directional distribution(destination)
Trip assignment
Impact assessment
Traffic management plan

5-18
The feasibility study gauges the impact a proposed event has on traffic and parking operations in the vicinity of the venue. It determines if a particular planned special event will cause travel problems, where and when the problems will occur, and the mag-nitude of each identified problem using various MOEs. Initially, the study is con-ducted without roadway capacity improve-ments or initiatives to reduce travel demand. Once the feasibility study identifies event travel problems, practitioners can take steps to mitigate transportation system deficien-cies. These results define the scope of the traffic management plan required to success-fully manage travel for a planned special event. Data Requirements Feasibility study input data requirements reflect measures of the three core factors that determine the impact of the event: travel demand, road/site capacity, and event operation. Table 5-11 summarizes various types of input data to consider in a feasibil-ity study. This includes transportation sys-tem infrastructure, background traffic, and area data and information. With the assis-tance of other event planning team stake-holders most data types are accessible. Travel demand data is used to develop the event travel forecast and to determine the event area of impact. Background traffic data describes the scope of available road-way and parking capacity for event patron traffic. Information regarding the venue area assists in identifying possible event pa-tron trip origins. For example, a venue lo-cated in a downtown area may attract a sig-nificant number of patrons arriving from work, thus possibly reducing the number of transit or vehicular trips generated. Events having a regional or greater scope may in-volve a significant number of patrons stay-
ing at area hotels. To increase travel fore-cast accuracy and meet the goal of achieving predictability, practitioners should research appropriate historical data. The identification and quantification of site and transportation system capacity involves performing a full inventory of the transpor-tation system infrastructure serving the event venue. This includes obtaining data on roadway geometrics and associated regu-lations (e.g., speed limits and travel restric-tions). An inventory of freeway facilities should include the capacity of such freeway components as ramp junctions and weaving sections. In addition, street traffic control devices and signal timing plans must be identified and saturation flow rates deter-mined. Event operation characteristics impact both travel demand and available capacity. The knowledge of certain event logistics, com-bined with available historical data, can help predict the rate of event patron arrivals and departures over time. Practitioners, in tan-dem with the event organizer, must also identify the scope of road closures and park-ing area needed just to stage the event (e.g., parade/race route, hospitality areas, etc.). This does not include the roadway capacity and parking needed to accommodate event patron traffic. Travel Forecast Travel forecast analysis involves estimating: (1) modal split, (2) event traffic generation, and (3) traffic arrival rate. Event planning team stakeholders that typically collaborate on this analysis include a traffic operations agency, traffic engineering consultant, tran-sit agency, and event organizer. The event organizer supplies key input data regarding event operation. The transit agency assists

5-19
OV
ER
VIE
W
DA
Y-O
F-E
VE
NT
AC
TIV
ITIE
S A
DV
AN
CE
PL
AN
NIN
G
POST
-EV
EN
T A
CT
IVIT
IES
EV
EN
T P
RO
FIL
E
5Table 5-11
Feasibility Study Data Requirements FACTOR INPUT DATA DESCRIPTION
• Event patron traffic
• Daily attendance • Event patron demographics (e.g., advance/season ticket holder place of
residence or zip code) • Admission (general/reserved seating and free/cost) • Venue attendance capacity • Acceptable walking times (e.g., to determine available parking areas and
percent walking trips) • Background
traffic • Hourly traffic volumes • Existing parking occupancy • Vehicle classification
• Venue area • Employment centers in venue vicinity (e.g., number of jobs) • Hotels in venue vicinity
Travel Demand
• Historical data (similar events)
• Attendance (e.g., trip generation rate) • Hourly traffic volumes • Parking demand (e.g., parking demand rate) • Vehicle occupancy • Hourly/sub-hourly event patron arrival and departure distribution • Modal spilt • Patron survey (e.g., demographics and travel)
• Roadway facilities
• Existing, areawide roadway network o Freeway and arterial corridors o Local street facilities connecting corridors and the venue site
• Location and capacity of site access points • Pedestrian (e.g., sidewalks and crossings) and bicycle accommodation • Geometrics, regulations, and lane assignments • Traffic control devices and traffic signal programming data • Toll plazas (freeway or bridge/tunnel) in venue vicinity
• Parking availability
• Location and capacity of site access points • Location and capacity of off-street venue parking areas (free and paid) • Location and capacity of permitted on-street parking areas • Location and capacity of overflow parking areas
Road/Site Capacity
• Transit avail-ability
• Number and location of transit stations serving venue (e.g., public trans-portation – bus and rail)
• Scope of transit services at identified stations (e.g., schedule and capacity) • Origin and scope of established express and charter bus service to venue
(e.g., scheduled bus service from park and ride lots for special events only) • Base transit spilt (e.g., without incentive or promotion)
• Event logis-tics
• Venue location • Event hours of operation • Site opening and closing times • Participant accommodation (e.g., arrive by bus, stay at hotel near venue,
etc.) • Event personnel and volunteer travel demand
• Site • Required road closures to stage event
Event Operation
• Parking • Number of parking spaces lost in order to stage event (e.g., parking for event participants, hospitality tents, etc.)

5-20
in estimating modal split. The traffic opera-tions agency or traffic engineering consult-ant performs the analysis, and either stake-holder may research historical traffic and parking data or maintain a data archive re-lated to operations for similar planned spe-cial events. Modal Split Under the scope of a feasibility study, modal split concerns identifying the existing modes of travel event patrons will use to access the event venue site. Common travel modes include personal automobile, public transit, and walking. Public transit refers to sched-uled bus transit or commuter rail. Transit agencies may assist in determining a base transit split, without service incentives or promotion, for patrons traveling to/from the event. Illustrated in Figure 5-6, some patrons of the 1986 and 1995 U.S. Golf Open in rural Southampton, NY found the Long Island Rail Road commuter rail service an efficient and convenient mode of travel to/from Shin-necock Hills Country Club. To assure con-sideration of appropriate roadway mitiga-tion, transportation operations planners ana-lyzed a range of modal split percentages in the feasibility study to account for various scenarios. Commuter rail or other people mover systems exist in several metropolitan areas across the Nation and usually provide regular service to city stadium and arena venues. Transit availability includes sched-uled express and charter bus service operat-ing from other cities, suburban park and ride lots, and city neighborhoods. Table 5-12 lists surveyed modal splits for discrete/recurring events at a permanent venue in San Francisco, New York, and San Diego. The baseball stadium venues in San
Francisco and New York, located within a metropolitan area, have excellent scheduled transit service, including commuter rail. Stadiums located in suburban areas, such as Qualcomm Stadium in San Diego, and rural areas generally have a high percentage of automobile trips. Travel time, travel convenience, parking ac-cessibility and cost weighs significantly on an event patron’s decision to drive or utilize an alternate mode of travel. This likely represents another contributor to the high transit split in the San Francisco example, where Pacific Bell Park resides adjacent to the downtown area. Other modes of travel include bicycle and taxi.
Figure 5-6 Commuter Rail Modal Split
Walking trips deserve consideration in mo-dal split estimates for planned special events occurring at downtown venues. Practitio-ners must consider the proximity of

5-21
OV
ER
VIE
W
DA
Y-O
F-E
VE
NT
AC
TIV
ITIE
S A
DV
AN
CE
PL
AN
NIN
G
POST
-EV
EN
T A
CT
IVIT
IES
EV
EN
T P
RO
FIL
E
5Table 5-12
Example Modal Split for Discrete/Recurring Events at a Permanent Venue MODE OF TRAVEL EVENT ATTENDANCE AUTO TRANSIT WALKING OTHER
San Francisco Giants weekday baseball game – August 2000(14)
38,000 – 41,000 (capacity 41,000) 48% 41% 8% 3%
San Francisco Giants weeknight baseball game – August 2000(14)
38,000 – 41,000 (capacity 41,000) 50% 37% 7% 6%
San Francisco Giants weekend baseball game – August 2000(14)
38,000 – 41,000 (capacity 41,000) 58% 34% 5% 4%
New York Mets weeknight baseball game – June 1997(15)
18,000 (capacity 56,500) 59% 41% -- --
San Diego Padres weekday baseball game – April/May 1998(16)
Unknown 85% 12% -- 3%
San Diego Padres weeknight baseball game – April/May 1998(16)
Unknown 95% 5% -- --
San Diego Padres weekend evening baseball game – April/May 1998(16)
Unknown 85% 12% -- 3%
employment centers, residential develop-ments, and hotels to a planned special event venue before dismissing walking as a viable travel mode. Venues located on university campuses typically draw a measurable per-centage of walking trips. Surveys for col-lege football games have reported as many as 10 to 25 percent of event patrons arriving by foot.(17) Practitioners can best obtain measured data on planned special event modal split through conducting a survey of event patrons. Ap-pendix D contains an Internet-based event patron evaluation survey for those attending the 2003 Fair Saint Louis festival. In addi-tion to querying event patrons on mode of travel, obtaining origin location information (e.g., zip code) assists event planning team stakeholders configure transit schedules or express and charter bus services for future similar events.
Event Traffic Generation Unlike other traffic generators such as commercial developments, planned special event practitioners typically have advance knowledge of event attendance and, in turn, can develop traffic generation estimates via vehicle occupancy factors. On the other hand, traffic generation rates, based on event traffic volume or parking occupancy data, may not be appropriate for transfer and ap-plication from one special event to another. Too many variables exist with regard to event category, event logistics, event popu-larity, weather, and parking characteristics. Event operations and other external vari-ables affect any application of historical data to future events. Table 5-13 outlines a two-step process for forecasting event traffic generation. Input data includes a modal split estimate since

5-22
Table 5-13 Traffic Generation Forecast Process
COMPONENT DETAIL Input data • Daily attendance • Percent automobile trips • Vehicle occupancy factor
Method Step 1. (Daily Attendance) x (Percent Automobile Trips) = Person Trips Via Automobile Step 2. (Person Trips) / (Vehicle Occupancy Factor) = Vehicle Trips
Result • Number of vehicle trips by personal automobile both to and from the event the traffic generation forecast aims to esti-mate the number of event-generated trips by personal automobile. In the absence of a daily attendance estimate, practitioners can use percentage of venue capacity as a base. However, many continuous events or street use events do not have a pre-specified venue capacity. Continuous events, such as fairs and festivals, often run for two or more days. Attendance generally fluctuates greatly from day to day, with Saturday op-erations yielding the highest daily atten-dance. A study of two-day (Satur-day/Sunday) festivals in West Virginia indi-cated 58 percent of the total festival atten-dance was on Saturday.(18) The same study noted the following total event attendance distribution for three-day festivals: 20 per-cent on Friday, 50 percent on Saturday, and 30 percent on Sunday. It should be recog-nized that daily attendance reflects sched-uled headline entertainment or other main festival events. Vehicle occupancy factors can serve as the basis for estimating event-generated traffic. Table 5-14 lists average vehicle occupancy factors for select discrete/recurring events at a permanent venue and continuous events. A discrete/recurring event at a permanent venue that occurs on the weekend will likely have a higher vehicle occupancy factor due to families and groups of tailgaters. A vehi-cle occupancy factor of 2.5 persons per ve-hicle represents a common assumption, however for forecasting purposes, practitio-ners should consider a range of factors from 2.2 to 2.8 depending on local conditions.(15)
Traffic Arrival and Departure Rate In order to estimate peak traffic volumes generated by an event, practitioners must estimate the time and scope of peak traffic flow during event ingress and egress. Traf-fic arrival and departure rate indicates the peak period (e.g., hour or 15 minute) of event-generated traffic. The rate is used to determine the following key parameters for input into the traffic demand analysis: (1) peak period time and (2) percent of total event-generated traffic within the peak pe-riod. Event operation characteristics that influence traffic arrival and departure rates include: • Event time and duration – e.g., specific
start time, abrupt end time, continuous operation.
• Event time of occurrence – e.g., day/night, weekday/weekend.
• Audience accommodation – e.g., re-served seating, general admission.
• Event type – e.g., sports/concert, fair/festival, parade/race.
This section focuses on estimating the traffic arrival rate. The temporal share of event patron arrivals vary considerably by event type and requires prediction by practitioners. Traffic arriving to an event can potentially cause greater impacts to background traffic mobility than event departure traffic. This is attributed to arrival traffic typically traveling from high-capacity roadway facilities (e.g., freeways and arterials) to low-capacity fa-cilities (e.g., venue access roads). Roadway

5-23
OV
ER
VIE
W
DA
Y-O
F-E
VE
NT
AC
TIV
ITIE
S A
DV
AN
CE
PL
AN
NIN
G
POST
-EV
EN
T A
CT
IVIT
IES
EV
EN
T P
RO
FIL
E
5
Table 5-14 Example Planned Special Event Vehicle Occupancy Factors
EVENT ATTENDANCE AVERAGE VEHICLE OCCUPANCY Discrete/Recurring Event at a Permanent Venue
San Francisco Giants baseball games – August 2000(14)
38,000 – 41,000 (capacity 41,000) 2.8 persons per automobile
Anaheim Angels weeknight baseball game – July 1997(15)
18,197 (capacity 37,000) 2.6 persons per automobile
Cleveland Indians Saturday baseball game – July 1997(15)
43,070 (capacity 43,368) 2.64 persons per automobile
New York Mets weeknight baseball game – June 1997(15)
18,000 (capacity 56,500) 2.31 persons per automobile
San Diego Padres weekday baseball game – April/May 1998(16) Unknown 2.3 persons per automobile
San Diego Padres weeknight baseball game – April/May 1998(16) Unknown 2.5 persons per automobile
San Diego Padres weekend evening baseball game – April/May 1998(16) Unknown 3.0-3.1 persons per automobile
Denver Broncos football games – 1998/2001(19) 76,000 3.0 persons per automobile on-site;
2.3 persons per automobile off-site Continuous Event
1997 Stonewall Jackson Heritage Arts & Crafts Jubilee - West Virginia(18)
45,000 to 50,000 (four-day total) 2.46 persons per automobile
1997 West Virginia Honey Festival(18) 6,000 (two-day total) 2.15 persons per automobile
1997 West Virginia Wine & Jazz Festival(18)
3,500 (two-day total) 2.42 persons per automobile
22nd Mountain Heritage Arts & Crafts Festi-val – West Virginia(18)
25,000 (three-day total) 2.30 persons per automobile
congestion that occurs during event ingress may create queue spillbacks to freeways and major streets, thus impacting background traffic. Drivers departing an event venue site gener-ally have little or no choice of exit routes. Roadway capacity constraints include free-way entrance ramps and turning movements to arterials and other major collector road-ways. Departing traffic queues are usually constrained to the venue access roadway and spillback into the parking areas. Figure 5-7 shows traffic operations, following a foot-ball game at Qualcomm Stadium in San Diego, CA, at: (1) a freeway entrance ramp, (2) a venue access road upstream of a free-way, and (3) an on-site venue parking area.
Figure 5-7 Event Patron Departure from a Dis-
crete/Recurring Event at a Permanent Venue

5-24
Table 5-15 indicates traffic arrival rates and time of peak arrival for select dis-crete/recurring events at a permanent venue and continuous events. Time of arrival de-pends on audience accommodation (e.g., general admission or reserved seating) and/or the nature of pre-event activities. Such activities include tailgating or prac-tices. Figure 5-8 illustrates NASCAR pre-race preparations that attract a significant number of event patrons well before the event start. As illustrated in Table 5-15, the traffic arri-val rate for sporting games and concerts peaks within one hour of the event start. Due to high traffic arrival concentration, practitioners may consider estimating a peak 15-minute traffic arrival rate and associated peak hour factor for roadway capacity analysis. With regard to continuous events, peak traffic arrival rate generally occurs
immediately prior to the event start. Since event patrons do not place a high priority on meeting a continuous event start time, the concentration of continuous event arrivals is relatively low compared to other event cate-gories. The peak level of event-generated traffic demand may occur during the middle of a continuous event operating period when both event arrival and departure traffic trav-erse the roadway system as patrons come and go from the event. Practitioners may use event patron travel surveys in addition to historical event-generated traffic volume and/or parking oc-cupancy counts to estimate the traffic arrival rate and peak time of occurrence. It should be noted that weather conditions, particu-larly for continuous events and street use events, may significantly skew data. Thus, practitioners must exercise great care when developing future event estimates from his-torical data.
Table 5-15
Example Planned Special Event Traffic Arrival Rate Characteristics EVENT ATTENDANCE EVENT
START SITE
OPEN PEAK TRAFFIC
FLOW OCCURRENCE Discrete/Recurring Event at a Permanent Venue
2001 NASCAR Kansas 400(20) 100,000+ 12:00 P.M. 6:00 A.M. 8:00 A.M.
Anaheim Angels weeknight baseball game – July 1997(15)
18,197 (capacity 37,000) Evening
2+ hours before first
pitch
1 hour before first pitch (82% of arrivals – 29%
peak 15 minutes)
Cleveland Indians Saturday baseball game – July 1997(15)
43,070 (capacity 43,368) Afternoon
2+ hours before first
pitch
1 hour before first pitch (67% of arrivals – 19%
peak 15 minutes)
New York Mets weeknight baseball game – June 1997(15)
18,000 (capacity 56,500) Evening
2+ hours before first
pitch
1 hour before first pitch (62% of arrivals – 16%
peak 15 minutes) Continuous Event
Louisiana World Exposition in New Orleans – weekday August 1984(21)
35,700 10:00 A.M. -- 31% of event patrons ar-rived by 11:00 A.M.
Louisiana World Exposition in New Orleans – Saturday in August 1984(21)
Unknown 10:00 A.M. -- 29% of event patrons ar-rived by 11:00 A.M.

5-25
OV
ER
VIE
W
DA
Y-O
F-E
VE
NT
AC
TIV
ITIE
S A
DV
AN
CE
PL
AN
NIN
G
POST
-EV
EN
T A
CT
IVIT
IES
EV
EN
T P
RO
FIL
E
5
Figure 5-8 Pre-Event Activity
Market Area Analysis A market area analysis identifies the origin and destination of trips to and from a planned special event. The analysis focuses on developing a regional directional distri-bution of event patron trips to/from an event site via personal automobile. The site refers to the collective parking areas serving the venue. A regional directional distribution specifies: (1) the freeway and arterial corri-dors serving the venue site and (2) the per-cent split and volume of event-generated automobile trips traversing each corridor. Appendix E contains a regional directional distribution prepared for the NASCAR Kan-sas 400 race.(20) Table 5-16 summarizes three analysis meth-ods used to define a planned special event market area. Travel Time and Distance Analysis Practitioners can apply a travel time analysis or distance analysis to estimate the market area for any planned special event. Con-tinuous events or street use events that do
not offer advance ticket sales typically re-quire a market analysis based on travel time or distance and referencing area population distribution. Figure 5-9 illustrates an example travel time analysis for a downtown Chicago lakefront fireworks display. A geographic informa-tion system or other mapping software tool can create travel time zones, as shown in the figure, based on user-defined thresholds. Multiple travel time zones allow users to perform a weighted analysis of population distribution. Practitioners should categorize area population within each travel time zone by zip code or, for a 15 minute threshold or less, by census tract. Most geographic in-formation systems and computer mapping tools generate spreadsheets identifying all spatial population categories within each travel time zone. Using the spreadsheet, practitioners can assign a freeway or arterial corridor, serving the event venue site, to each defined population category. The population distribution among roadway sys-tem corridors constitutes the regional direc-tional distribution for the planned special event. Practitioners can also incorporate Census socioeconomic data into an analysis as necessary. The described travel time analysis method-ology applies to a distance analysis as well. Instead of travel time thresholds, users de-fine distance thresholds. Practitioners should exercise care in developing a planned special event market area by travel time or absolute distance to the event venue site:
• In the case of continuous events or street use events, the market area must incorporate only the commu-nity or region the event is staged for.

5-26
Table 5-16 Market Area Analysis Methods
METHOD DESCRIPTION Travel time analysis • Determine population distribution within travel time threshold of event venue. Distance analysis • Determine population distribution within distance radius of event venue. Origin location analysis • Determine weighted distribution of known origins by place or zip code.
Figure 5-9 Example Travel Time Analysis
• Discrete/recurring events at a permanent
venue, such as professional/major col-lege sporting events or major concerts, warrant an expanded market area.
• A travel time or distance analysis for these events should not reflect a sensitiv-ity to travel time or distance at the city/suburb level. In other words, an event patron located in a city suburb typically does not factor travel time into a decision to attend a professional or ma-jor college sporting event at a downtown venue.
Origin Location Analysis An origin location analysis represents the most accurate method for developing an event-specific regional directional distribu-tion. This analysis utilizes a statistically significant database of event patron travel
origins. Input data includes advance or sea-son ticket holder place of residence (e.g., place or zip code) or place of trip origin ob-tained through a past/similar event travel survey. An event economic impact study also indicates the cities or regions patrons will arrive from. A discrete/recurring event at a permanent venue requires ticket sales, and event organizers initiate ticket sales weeks and even months in advance of the event. But, event organizers or ticket sales companies may consider customer informa-tion confidential or proprietary. An event patron travel survey (see Appendix D) proves effective in determining the exact origin of a patron trip to a planned special event. For instance, weekday events may attract a significant percentage of non-home-based trips as event patrons arrive from work. A survey of patrons attending week-night baseball games at Pacific Bell Park in San Francisco indicates 28 percent of pa-trons come from work.(14) An event patron travel survey captures this critical informa-tion. Event patron departures from the event venue site typically involve home as a desti-nation. Practitioners performing an origin location analysis determine a geographical distribu-tion of event patron origins. In turn, this distribution defines the freeway and arterial corridors that event patrons will use to ac-cess the event venue site in addition to a traffic distribution. An origin location analysis applies to all planned special events.

5-27
OV
ER
VIE
W
DA
Y-O
F-E
VE
NT
AC
TIV
ITIE
S A
DV
AN
CE
PL
AN
NIN
G
POST
-EV
EN
T A
CT
IVIT
IES
EV
EN
T P
RO
FIL
E
5
Parking Demand Analysis A parking demand analysis functions to de-termine the amount of required parking for event patrons in the vicinity of the event venue. A parking occupancy study drives the overall analysis and determination of event parking areas. This study indicates the level of parking spaces occupied, relative to lot capacity, at intermittent time intervals. It also specifies an estimate of peak parking demand, a figure particularly useful for managing continuous events where parking space turnover occurs throughout the event day. Figure 5-10 presents a parking demand analysis process used to determine the ade-quacy of event venue (on-site) parking and the identification of appropriate off-site parking areas. The flowchart denotes an analysis conducted for a one-time interval. Practitioners should perform an iterative parking demand analysis, over hourly time periods as necessary, if considering parking areas characterized by high background parking turnover. Examination of on-site parking areas must account for spaces lost to the event sponsors, bus staging, limousine and taxi staging, me-dia parking, event employee parking, and event participant parking. Net parking sup-ply incorporates event staging needs and any background traffic that can legally use the parking area during event hours of opera-tion. In order to conceptually measure park-ing supply within a non-striped area, assume 150 cars per acre as a rule of thumb.(22) The travel forecast analysis yields an estimate of parking demand by quantifying the antici-pated number of event-generated automobile trips. Aside from continuous events, practi-tioners should perform a parking demand analysis that accounts for maximum event-generated parking demand.
In evaluating parking supply versus demand, consider as a rule of thumb that 90 to 95 percent lot occupancy represents a full park-ing area.(23) This especially applies under scenarios where event patrons must self-park. When a parking area reaches a near-capacity occupancy level, drivers experience difficulty locating an empty parking space and must circulate through the lot again or seek another parking area. Continuous events and street use events often utilize self-park areas. Overflow parking areas comprise both on-street parking and public/private off-street parking areas, located off-site but in the im-mediate vicinity of the event venue. Figure 5-11 shows a designated off-street parking area, as noted by a light post banner, for the Summerfest music festival in downtown Milwaukee, WI. Identification of off-site parking areas depends on walking distance to the event venue. For example, a 15-minute walking time threshold allows con-sideration of off-street parking areas within 3,600 feet of an event venue, assuming a pedestrian walking speed of 4 feet per sec-ond. Parking areas located further from the venue would require a continuous shuttle service. Table 5-17 shows a parking occupancy sum-mary for a regional/multi-venue event in downtown Denver, CO. The spreadsheet format conveniently organizes and presents occupancy estimates by time of day and day of week. A parking demand analysis for a regional/multi-venue event presents special challenges. Practitioners must determine the hourly parking requirements for each facility separately. Parking areas in this case func-tion under shared parking operation, servic-ing variable demand rates from different planned special events over the course of a day.
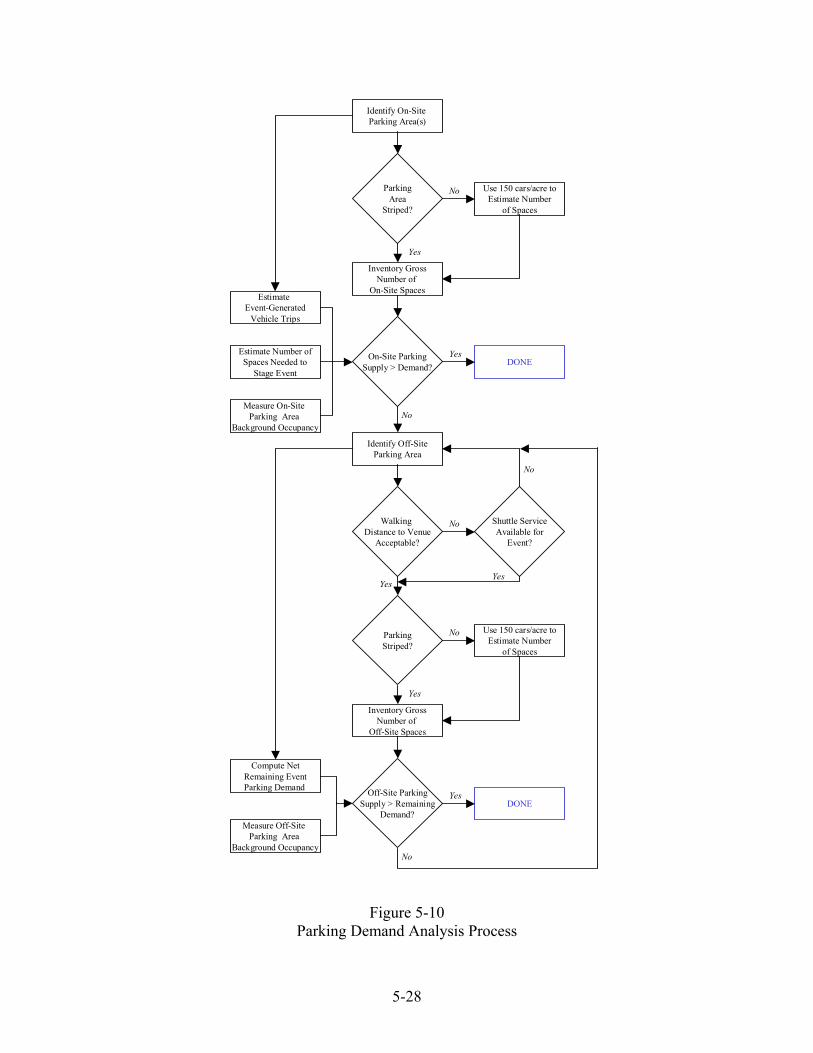
5-28
Figure 5-10 Parking Demand Analysis Process
Estimate Event-Generated
Vehicle Trips
Estimate Number ofSpaces Needed to
Stage Event
Measure On-Site Parking Area
Background Occupancy
Identify On-Site Parking Area(s)
ParkingArea
Striped?
Inventory GrossNumber of
On-Site Spaces
On-Site ParkingSupply > Demand?
Use 150 cars/acre toEstimate Number
of Spaces
No
Yes
DONEYes
No
Identify Off-SiteParking Area
Walking Distance to Venue
Acceptable?
Shuttle ServiceAvailable for
Event?
No
No
ParkingStriped?
Inventory GrossNumber of
Off-Site Spaces
Use 150 cars/acre toEstimate Number
of Spaces
No
Yes
YesYes
Off-Site ParkingSupply > Remaining
Demand?DONE
Yes
Compute NetRemaining EventParking Demand
Measure Off-Site Parking Area
Background OccupancyNo

5-29
OV
ER
VIE
W
DA
Y-O
F-E
VE
NT
AC
TIV
ITIE
S A
DV
AN
CE
PL
AN
NIN
G
POST
-EV
EN
T A
CT
IVIT
IES
EV
EN
T P
RO
FIL
E
5
Figure 5-11 Designated Event Off-Site Parking Area
Table 5-17 Example Event Parking Occupancy
Summary(23)
Traffic Demand Analysis A traffic demand analysis determines: (1) a local area directional distribution and (2) the overall assignment of event-generated traf-fic. This analysis references results obtained through the travel forecast, market area analysis, and parking demand analysis. The local area directional distribution in-dicates freeway ramps and intersections, in-cluding turning movements, traversed by
event-generated traffic arriving to or depart-ing from a planned special event. The re-gional directional distribution, as determined in the market area analysis, quantifies the percentage of event patron trips (e.g., ori-gins) by regional freeway and arterial corri-dor, and the planned special event parking areas, as determined in the parking demand analysis, represent sink nodes or location of trip destination. Traffic assignment includes event-generated automobile traffic, express buses, charter buses, limousines, and other vehicles transporting event patrons, partici-pants, and event employees. Practitioners performing traffic demand analyses should possess a personal knowledge of the road-way system surrounding an event venue in addition to existing traffic conditions. A parking demand analysis assesses event parking sufficiency. The analysis does not define local traffic patterns to/from individ-ual parking areas. Practitioners, instead, must gauge the utility associated with driv-ers choosing individual parking areas. The key components comprising this utility in-clude driving time, parking cost, and walk-ing time.(24) The attractiveness of each lot varies by freeway or arterial corridor serving the event site, yet event patrons will accept a moderate increase in overall driving/walking time in exchange for a substantial parking cost savings. The event planning team and traffic management team must recognize such driver behavior and formulate the ap-propriate traffic flow routes and develop traffic management strategies to manage site access and circulation effectively. Figure 5-12 illustrates one strategy, instituting on-street parking restrictions on the day-of-event. Pre-trip and en-route traveler infor-mation also influences driver choice regard-ing parking selection.

5-30
Figure 5-12 Local Area Planned Special Event Parking
Restriction Traffic demand analysis includes developing composite background and event-generated traffic projections for all roadway system facilities serving the event venue. Compos-ite traffic volumes expressed as an hourly (or sub-hourly) rate meet roadway capacity analysis input requirements. These rates identify the peak hour capacity analysis pe-riods during event patron arrival and/or de-parture. Practitioners must adjust back-ground traffic volumes to account for dis-placed and diverted traffic due to road clo-sures required to stage the planned special event. These road closures alter traffic pat-terns to/from commercial trip generators, residential areas, and places of worship. Displaced background traffic assignment involves identifying the shortest path alter-nate route that has excess capacity. As a preliminary step to assess the need to perform a detailed roadway capacity analy-sis, draw a circular screen line (e.g., 0.5 to 1 mile radius) around the event venue site. Note each roadway segment intercepted by the screen line, and estimate the segment’s capacity in each direction of travel. Create a chart of hourly composite traffic volumes for each identified segment, and assess ca-pacity deficiencies in both directions of travel. Figure 5-13 shows a preliminary
road segment capacity analysis conducted as part of a feasibility study for a re-gional/multi-venue event in Denver, CO.
Figure 5-13 Example Preliminary Road Segment
Capacity Analysis(23) Roadway Capacity Analysis A roadway capacity analysis uses traffic demand analysis results to measure the im-pact of a proposed planned special event on roadway system operations. At the feasibil-ity study level, a roadway capacity analysis references existing roadway facility opera-tions and capacity (e.g., no reverse flow op-eration or other capacity enhancements). The analysis assumes pedestrian access management strategies will minimize pedes-trian/vehicular conflicts, and parking area access points provide sufficient service flow rates through proper design. Regardless of capacity analysis outcome, pedestrian ac-commodation and parking management rep-resent key considerations in a planned spe-cial event traffic management plan. Roadway capacity analysis involves freeway segments, freeway junctions such as ramps and weaving areas, street segments, signal-ized intersections, and unsignalized intersec-tions. To evaluate these facilities, practitio-ners can employ one of two approaches: (1) analyze section and point capacity or (2) analyze network operations.

5-31
OV
ER
VIE
W
DA
Y-O
F-E
VE
NT
AC
TIV
ITIE
S A
DV
AN
CE
PL
AN
NIN
G
POST
-EV
EN
T A
CT
IVIT
IES
EV
EN
T P
RO
FIL
E
5
• The first approach pertains to applying Highway Capacity Manual (HCM) rec-ommended capacity analysis method-ologies to discrete locations in the study area. Practitioners determine roadway sections, freeway junctions, or intersec-tions for analysis, then apply an appro-priate HCM methodology to identify movement capacity constraints and measure operations level of service.
• The latter approach concerns utilizing a computer traffic simulation model to identify bottleneck locations, or hot spots, and associated saturation flow rates. Practitioners scope the size and detail of the simulation model network, and the model works to reveal opera-tional deficiencies.
Computer traffic simulation models provide seamless analysis of traffic operations across a network of roadway segments and inter-sections. This proves particularly useful in analyzing a corridor of closely spaced traffic signals where signal coordination and vehi-cle spillback from adjacent intersections sharply impact traffic operations. Numerous macroscopic and microscopic simulation models exist, including the CORSIM micro-scopic computer traffic simulation model developed and supported by FHWA. COR-SIM can interface component freeway (FRESIM) and arterial (NETSIM) simula-tion models. For example, it has the capa-bility of showing a freeway entrance ramp bottleneck and the resulting queue spillback on adjacent streets (or vice versa). As shown in Figure 5-14, CORSIM also affords practitioners and event planning team stake-holders the opportunity to view an animation of simulated traffic operations.
Figure 5-14 CORSIM Simulation Animation
Mitigation of Impacts Mitigating anticipated planned special event impacts on travel represents the ultimate goal of conducting a feasibility study. The mitigation of congestion and potential safety impacts identified through a feasibility study requires development of a traffic manage-ment plan and complementing travel de-mand management strategies. In turn, prac-titioners can utilize the tools and techniques used to determine feasibility study results in order to evaluate various mitigation strate-gies and determine if the selected strategies adequately mitigate identified transportation system deficiencies. Table 5-18 lists numerous tools for mitigat-ing planned special event impacts on local roadway and regional transportation system operations. In meeting the overall travel management goal of achieving efficiency, these tools target utilizing the excess capac-ity of the roadway system, parking facilities, and transit. Through travel demand man-agement, event planning team stakeholders develop attractive incentives and use inno-vative communication mechanisms to influ-ence event patron decision-making and, ul-timately, traffic demand. Chapters 6 and 7

5-32
Table 5-18 Tools for Mitigating Planned Special Event Impacts on Transportation System Operations
CATEGORY EXAMPLE TOOLS Traffic Control and Capacity Improvements
Freeway traffic control • Ramp closures or additional capacity • Alternate routes • Ramp metering
Street traffic control • Lane control • Alternative lane operations • Road closures • On-street parking restrictions • Trailblazer signing • Parking management systems
Intersection traffic control • Access and turn restrictions • Advance signing to improve traffic circulation • Traffic signal timing and coordination
Traffic incident management • Service patrols • Tow truck staging • Advance congestion warning signs • Portable lighting
Traffic Management Traffic surveillance • Closed-circuit television systems
• Field observation • Aerial observation • Media reports • Portable traffic management systems
En-route traveler information • Changeable message signs • Highway advisory radio • Media • Static signing • Destination signing
Travel Demand Management Transit incentives • Public transit service expansion
• Express bus service from park and ride lots • Charter bus service
High occupancy vehicle incentives • Preferred parking • Reduced parking cost
Event patron incentives • Pre-event and post-event activities Bicyclist accommodation • Bicycle routes and available parking/lock-up Local travel demand management • Background traffic diversion
• Truck diversion Pre-trip traveler information • Internet
• Telephone information systems • Public information campaign • Event and venue transportation guide • Media

5-33
OV
ER
VIE
W
DA
Y-O
F-E
VE
NT
AC
TIV
ITIE
S A
DV
AN
CE
PL
AN
NIN
G
POST
-EV
EN
T A
CT
IVIT
IES
EV
EN
T P
RO
FIL
E
5
detail impact mitigation strategies and tac-tics. EXTERNAL FACTORS AFFECTING SCOPE OF EVENT IMPACT Overview This chapter summarizes event operations planning and impact analysis activities that address the core factors affecting planned special event severity. That is, travel de-mand, road/site capacity, and event opera-tion. A number of secondary factors warrant consideration in the event operations phase, including: • Available resources • Weather • Concurrent roadway construction • Concurrent planned special events These factors can greatly influence the level of impact a planned special event has on transportation system operations. By gain-ing an understanding of the special chal-lenges that these external factors present, the event planning team can develop appropriate contingency response plans, using the tools and strategies presented in Chapters 6 and 7, to mitigate infrequent but high-impact sce-narios. An assessment of the level of impact that an external factor has on travel during a par-ticular planned special event involves the consideration of the following components: • Duration – temporal impact (e.g., when
does the external factor impact opera-tions and for how long?).
• Extent – spatial impact or scope of area
affected (e.g., does the external factor impact a particular corridor or the entire region?) • Intensity – volume of impact (e.g., how
severe is the impact?) Practitioners should express the impact of an external factor in terms of how it affects travel demand, road/site capacity, and per-sonnel/equipment resource quantities. Fea-sibility study input data can reflect adjust-ments made due to certain anticipated exter-nal factors, or practitioners can rerun park-ing and roadway capacity analyses to ac-count for a new unexpected factor (e.g., oc-currence of emergency road construction). In turn, revised results may warrant adjust-ments to the event traffic management plan. Available Resources Available resources refer to the quantity and experience of personnel and equipment available to plan and conduct day-of-event travel management operations. Besides the size of a planned special event, the level of required resources depend on time/place of occurrence, other planned special events, and equipment status. A special factor that may place significant strain on available resources involves the occurrence of planned special events at a venue under reconstruction. Shown in Fig-ure 5-15, venue reconstruction places addi-tional demand on the amount of traffic man-agement team personnel and equipment re-sources needed to manage events hosted by the venue during its reconstruction. Stake-holder response to on-site parking restric-tions include redevelopment of traffic man-agement plans to accommodate parking de-mand, pedestrian access, and traffic flow in the immediate vicinity of the venue.

5-34
Figure 5-15 Stadium Reconstruction
Figure 5-16 presents a site and pedestrian accommodation plan for 2002 Green Bay Packers games during Lambeau Field reno-vation. Appendix F contains contingency parking and pedestrian accommodation plans for event patrons traveling to Lambeau Field. Weather Weather conditions affect travel demand, road/site capacity, or both. For example, in winter, snow banks in permanent venue parking areas reduce the number of on-site parking spaces required for an event sell-out. Rain can create significant problems for unpaved parking areas and access roads. A one-day rain event totaling approximately 0.70 inches during the 2002 U.S. Golf Open forced the traffic management team to close all unpaved parking areas adjacent to the golf course. Figure 5-17 displays a traffic advisory service television announcement issued to indicate contingency parking ar-rangements that used paved lots. With regard to travel demand, weather con-ditions have a significant impact on atten-dance (e.g., increased attendance or reduced attendance) and/or the rate of arrivals and departures at some special events. For in-stance, event patrons will attend an event at a domed stadium on a rainy day, but patrons
will bypass arriving at the venue early to tailgate, thus concentrating patron arrivals. Concurrent Road Construction and Planned Special Events The occurrence of planned events, including road construction and other planned special events, create a range of impacts affecting different traffic management plan compo-nents. On a regional level, the characteris-tics (e.g., increased traffic demand, road/lane closures) of concurrent planned events reduce available capacity in roadway corridors serving a particular planned spe-cial event, thus affecting traffic flow pat-terns. Local impacts include reduced park-ing supply, in the event of other area planned special events, and restricted traffic circulation. The identification of concurrent planned events requires interagency communication at the local, county, and state level. Figure 5-18 illustrates an example of a local de-partment of public works (DPW) inventory, accessible through the DPW website, of ac-tive local road construction and other planned special events within the jurisdic-tion. Key considerations include: • With regard to planning for a specific
planned special event, the event planning team should identify road construction activities in all jurisdictions within a cer-tain travel time or distance radius, equivalent to the event market area, of the event venue. Appendix G contains a local stakeholder outreach letter pre pared by the Wisconsin DOT to identify local road construction in the vicinity of Miller Park and scheduled during the 2002 All-Star baseball game.

5-35
OV
ER
VIE
W
DA
Y-O
F-E
VE
NT
AC
TIV
ITIE
S A
DV
AN
CE
PL
AN
NIN
G
POST
-EV
EN
T A
CT
IVIT
IES
EV
EN
T P
RO
FIL
E
5
Figure 5-16 Site and Pedestrian Accommodation Plan for Stadium Reconstruction
Figure 5-17 Contingency Parking Plan for Weather
• The event planning team must also inter-act with area venue operators and deter-mine a timeline of planned special events in the region, particularly those affecting the transportation system serv-ing the subject planned special event.
• Recognizing the regional impacts (e.g., county and multi-county) of major planned special events, the event plan-ning team should obtain information, in-cluding attendance estimates, on planned special events occurring in other metro-politan areas and areas with large venues within a certain radius (e.g., 50 or 100 miles). Highway corridors traversing one jurisdiction can realize a significant

5-36
Figure 5-18 Internet Summary of Road Construction and Planned Special Events (Graphic courtesy of
the City of Milwaukee DPW.)
increase in background traffic during typical off-peak periods as a result of traffic generated by major events occur-ring in other jurisdictions.
External Factor Monitoring and Assessment The event planning team should maintain, and continually update, a spreadsheet matrix or map of inter-jurisdictional roadway con-struction and planned special events occur-ring over some defined period of time. For example, Appendix G contains a Wisconsin DOT summary of local and state road con-struction coupled with major planned special events occurring in the Milwaukee metro-politan area over Summer 2002. Identifica-tion of concurrent planned events allows stakeholders to merge transportation plan-ning and operations efforts and consider re-vising road construction schedules. On a broader scale, a regional committee on planned special events monitors planned events across a metropolitan area through
regular meetings with traffic operations agencies, law enforcement, community offi-cials, event organizers, and other agencies. The committee facilitates communication and coordination between specific event planning and operation task forces to ensure optimal application of personnel and equip-ment resources. The Traffic Incident Man-agement Enhancement (TIME) program in southeastern Wisconsin maintains such a committee. As highlighted in Chapter 2, the TIME special event committee proposed development of a traffic management plan-ning tool designed to evaluate the severity level of any planned special event proposed in the greater Milwaukee metropolitan area. Table 5-19 lists specific external factors, and associated criteria, accounted for in the draft planning tool. REFERENCES 1. Held, T., “Dead Family Reunion in
East Troy Is a Go,” Milwaukee Jour-nal-Sentinel, June 28, 2002.
2. Schmitt, B., “State Troopers Close
Roads into Downtown Detroit,” De-troit Free Press, June 13, 2002.
3. Laitner, B., “Royal Oak Preparing to
Handle Crowds of Red Wings Fans,” Detroit Free Press, June 13, 2002.
4. “Hundreds questioned in Nevada Ca-
sino Deaths,” CNN.com, April 28, 2002.
5. Shaw, T., Performance Measures of
Operational Effectiveness for High-way Segments and Systems, NCHRP Synthesis 311, Transportation Re-search Board, National Research Council, Washington D.C., 2003, 59 pp.

5-37
OV
ER
VIE
W
DA
Y-O
F-E
VE
NT
AC
TIV
ITIE
S A
DV
AN
CE
PL
AN
NIN
G
POST
-EV
EN
T A
CT
IVIT
IES
EV
EN
T P
RO
FIL
E
5Table 5-19
External Factors Considered in the Wisconsin TIME Program Special Event Planning Tool(25)
INCREASING EVENT IMPACT QUESTION CRITERIA What is the effect of construction on traffic? Is there a construction project on any of the corridors leading to or away from the special event venue? Are there any lane closures?
Not appli-cable
Some impact
Moderate impact
Considerable impact
Severe impact
What effect does the event scheduling have on traffic? Is the event scheduled to begin or end during a peak period? Is there more than one event beginning or ending at the same time?
Not appli-cable
Some impact
Moderate impact
Considerable impact
Severe impact
What are the weather conditions? Is there a forecast for severe weather before, during, or after the special event that might affect traffic? Clear Mild Moderate Severe-
summer Severe- winter
Are all human resources available? Is the event scheduled to begin and end during normal working hours? Are key individuals available if needed?
Yes Most Some Few None
Is all equipment available? Are all facilities available? Is communication equipment working? Is all traffic control equipment available?
Yes Most Some Little None
6. Markley, D.D., N.L. Conrad, and
G.S. Rutherford, “Serving the Uni-versity of Washington’s Husky Sta-dium,” Preprint No. 00113, Prepared for the 2001 ITE Annual Meeting and Exhibit, Institute of Transporta-tion Engineers, Chicago, Illinois, August 19--22, 2002.
7. Rankin, E.A., “A Home Run or Out
in Left Field? Transportation Man-agement for the New Seattle Mari-ner’s Baseball Park,” Prepared for the ITE 1998 Annual Meeting and Exhibit, Institute of Transportation Engineers, Toronto, Ontario, Can-ada, 1998.
8. “2003 U.S. Cellular Field Resident
Permit Parking Program”, Chicago Department of Transportation, Chi-cago, Illinois, [Online]. Available:
http://www.ci.chi.il.us/Transportation/Sox/. [2003, April 25].
9. Joint Operational Policy Statement,
Illinois Department of Transporta-tion and Illinois State Police, Febru-ary 1999.
10. A Joint Operations Policy Statement,
Washington State Patrol and Wash-ington State Department of Transportation, Washington, February 2002.
11. Wrenn, D., “Turnpike Letting Driv-
ers Go Free in Heavy Traffic,” Charleston Daily Mail, December 4, 2002.
12. Townsend, E., “Freshman Delegate
Wants Bridge Tolls Stopped in Backups,” The Star Democrat, Feb-ruary 10, 2003.

5-38
13. “Wrecker and Towing Rules and Regulations for Police Rotation Wreckers,” City of Cincinnati Mu-nicipal Code Section 869.21.
14. Robbins, G., A. Felder, and W.E.
Hurrell, “San Francisco’s New Downtown Ballpark: A Home Run for Public Transit,” Preprint No. 00111, Prepared for the 2001 ITE Annual Meeting and Exhibit, Insti-tute of Transportation Engineers, Chicago, Il., August 19--22, 2001.
15. Grava, S. and F. Nangle, “Get Me to
the Ball Game on Time – Access Time Patterns at Baseball Stadia,” Preprint No. 00395, Prepared for the 2000 Annual Meeting of the Trans-portation Research Board, National Research Council, Washington, D.C., January 9--13, 2000.
16. Peterson, M., D.M. Marum, and A.
Moran, “Mode of Access for the New Downtown San Diego Ball-park,” Prepared for the ITE 2000 Annual Meeting and Exhibit, Insti-tute of Transportation Engineers, San Diego, Ca., 2000.
17. Traffic Considerations for Special
Events, Institute of Transportation Engineers, Washington, D.C., 1976, 44 pp.
18. Montag, D.A., Trip Generation
Rates and Characteristics for Theme-Oriented Fairs and Festivals, West Virginia University, Morgan-town, West Virginia, May 1998.
19. Parking and Traffic Management
Plans for Investco Field at Mile High, Prepared for the City and
County of Denver by Turner/HNTB, June 2002.
20. Volz, M.A. and B.J. Nicholson,
“Kansas Speedway Event Manage-ment Using ITS,” n.d.
21. Womble, J.E., “A Transportation and
Tourism Profile of Visitors to the 1984 Louisiana World Exposition in New Orleans,” ITE Journal, Vol. 55, No. 4, April 1985, pp. 49--53.
22. Boggs, R., “Challenges in Support-
ing Planned Special Events in Your Community,” Presented at the Insti-tute of Transportation Engineers 2003 Technical Conference and Ex-hibit Program,” Fort Lauderdale, Florida, March 23—26, 2003.
23. Shell Grand Prix of Denver – Park-
ing and Traffic Management Plan, Prepared for the Grand Prix of Den-ver by URS Corporation, August 2002, 33 pp.
24. Sattayhatewa, P. and R.L. Smith,
“Development of Parking Choice Models for Special Events,” Pre-sented at the 82nd Annual Meeting of the Transportation Research Board, Washington, D.C., January 12-16, 2003.
25. Silverson, S., Wisconsin Department
of Transportation – District 2, Per-sonal Communication, February 18, 2003.