chapter g - government of alberta ministry of transportation: · g.a.2 calculation of costs ........
TRANSCRIPT
Alberta InfrastructureHIGHWAY GEOMETRIC DESIGN GUIDE AUGUST 1999
3R/4R GEOMETRIC DESIGN GUIDELINES G-1
&+$37(5�*�
�������� +�).�� ������������ �� ��������
���������������
Section SubjectPage
Number Page Date
G.1 INTRODUCTION ................................................................................................. G-5 August 1999G.1.1 Guidelines for Initial Review .................................................................. G-7 August 1999G.1.2 Minimum Lane and Shoulder Widths................................................... G-7 August 1999G.1.3 Grade Widening/Reconstruction Versus Overlay............................... G-8 August 1999G.1.4 Acceptable Curb Heights on Existing Roadways................................. G-8 August 1999
G.2 HORIZONTAL CURVATURE ........................................................................... G-10 April 1995G.3 VERTICAL CURVATURE................................................................................... G-11 August 1999
G.3.1 Crests.......................................................................................................... G-11 August 1999G.3.2 Sags............................................................................................................. G-12 August 1999
G.4 INTERSECTIONS ................................................................................................. G-14 August 1999G.5 PASSING OPPORTUNITY (CLIMBING, PASSING LANES) ..................... G-15 August 1999G.6 ROADSIDE DESIGN ........................................................................................... G-15 August 1999
G.6.1 Definition of Clear Zone.......................................................................... G-15 August 1999G.6.2 Shoulder Rumble Strips........................................................................... G-15 August 1999G.6.3 Improvement to Sideslopes, Ditch and Backslopes ............................. G-16 August 1999G.6.4 Treatment of Approaches on Highways ............................................... G-16 August 1999G.6.5 Guardrail ................................................................................................... G-18 August 1999
G.7 SUPERELEVATION ............................................................................................. G-19 April 1995
Appendix A Economic Analysis for Grade-widening............................................. G-21 April 1995G.A.1 Background Information: Basis of Economic Analysis........................ G-22 June 1996G.A.2 Calculation of Costs ................................................................................. G-23 April 1995G.A.3 Calculation of Benefits ............................................................................. G-24 April 1995G.A.4 Summary of Results ................................................................................. G-28 April 1995G.A.5 Rationale for Figure G-1.1 ....................................................................... G-37 April 1995
Appendix B Example of Economic Analysis for Horizontal AlignmentImprovements. ......................................................................................... G-39 June 1996
G.B.1 Data Collected for the Analysis .............................................................. G-40 June 1996G.B.2 Construction and Maintenance Costs for Both Alternatives .............. G-45 June 1996G.B.3 Calculation of Collision Rates for Both Alternatives ........................... G-45 June 1996G.B.4 Calculation of Road User Costs for Existing and Proposed
Alignment.................................................................................................. G-47 June 1996G.B.5 Economic Analysis using Lotus Module Benefit-Cost ........................ G-56 April 1995
Appendix C Summary of Economic Analysis for Sideslope Flattening .............. G-58 April 1995Appendix D Rationale for Table G.7 .......................................................................... G-64 April 1995
Alberta InfrastructureAPRIL 1995 HIGHWAY GEOMETRIC DESIGN GUIDE
G-2 3R/4R GEOMETRIC DESIGN GUIDELINES
�������� +�).�� ������������ �� ��������
��������� ���
Figure DescriptionPage
Number
G-1 Geometric Assessment Process Flowchart............................................................................................... G-6G-1.1 Suggested Minimum Roadway Width for Rural Highways in Alberta............................................... G-9G-A.3 Typical Collision Rates on Alberta Two-Lane Undivided Highways................................................ G-25G-A.5.1 Cost-Effectiveness of Grade-Widening to 10.0m vs Overlay on Existing Paved Roadways
(existing sideslope = 3:1 or steeper) ........................................................................................................ G-30G-A.5.2 Cost-Effectiveness of Grade-Widening to 10.0m vs Overlay on Existing Paved Roadways
(existing sideslope = 4:1 or flatter) .......................................................................................................... G-31G-A.5.3 Cost-Effectiveness of Grade-Widening to 11.8m vs Overlay and Sideslope Improvement
on Existing Paved Roadways (existing sideslope = 3:1 or steeper) .................................................... G-32G-A.5.4 Cost-Effectiveness of Grade-Widening to 11.8m vs Overlay on Existing Paved Roadways
(existing sideslope = 4:1 or flatter) .......................................................................................................... G-33G-A.5.5 Cost-Effectiveness of Grade-Widening to 13.4m vs Overlay on Existing Roadways
(existing sideslope = 4:1 or flatter) .......................................................................................................... G-34G-B.1 Data Collected for Analysis: Hwy. 2 at McLennan, Alberta................................................................ G-40G-B.4.1 Road User Cost Evaluation ...................................................................................................................... G-48G-B.4.2 Road User Cost Evaluation ...................................................................................................................... G-49G-B.4.3 Road User Cost Evaluation ...................................................................................................................... G-50G-B.4.4 Road User Cost Evaluation ...................................................................................................................... G-51G-B.4.5 Road User Cost Evaluation ...................................................................................................................... G-52G-B.4.6 Road User Cost Evaluation ...................................................................................................................... G-53G-B.4.7 Road User Cost Evaluation ...................................................................................................................... G-54G-B.4.8 Road User Cost Evaluation ...................................................................................................................... G-55
Alberta InfrastructureHIGHWAY GEOMETRIC DESIGN GUIDE AUGUST 1999
3R/4R GEOMETRIC DESIGN GUIDELINES G-3
�������� +�).�� ������������ �� ��������
�����������
Table DescriptionPage
Number
G.1.4 Minimum Acceptable Curb Heights on Existing Roadways .................................................................G-8G.3.1 Suggested Minimum Vertical Crest Curve K Values for 3R/4R Projects...........................................G-12G.3.2 Suggested Minimum Vertical Sag Curve K Values for 3R/4R Projects..............................................G-13G.4 Suggested Minimum Sight Distances for At-Grade Intersections on 3R/4R Projects ......................G-14G.6.3a Sideslope Improvement Warrants ...........................................................................................................G-17G.6.3b Suggested Approach Sideslopes ............................................................................................................G-18G.7 Suggested Minimum Radii for Superelevation Rates on 3R/4R Projects...........................................G-20G.A.3.a Alberta Severity Indices for Run-off-Road Collisions...........................................................................G-24G.A.3.b Percentage Reduction of Run-off-Road Collision Cost Resulting from Sideslope Flattening .........G-27G.A.5.1 Existing AADT Required to Justify Grade-Widening...........................................................................G-29G.A.5.2 Economic Analysis - Grade-Widening vs Overlay................................................................................G-35G.A.5.3 Economic Analysis - Grade-Widening vs Overlay................................................................................G-36G.B.1.a Proposed Alignment Information for Project.........................................................................................G-41G.B.1.b Existing Alignment Information for Project ...........................................................................................G-42G.B.1.c Conversion Chart .......................................................................................................................................G-43G.B.4 Input Parameters for Analysis..................................................................................................................G-47G.B.5 Economic Analysis - Horizontal Alignment Improvements ................................................................G-57G.C.1 Economic Analysis - Roadside Improvement ........................................................................................G-60G.C.2 Economic Analysis - Roadside Improvement ........................................................................................G-61G.C.3 Economic Analysis - Roadside Improvement ........................................................................................G-62G.C.4 Economic Analysis - Roadside Improvement ........................................................................................G-63
Alberta InfrastructureAPRIL 1995 HIGHWAY GEOMETRIC DESIGN GUIDE
G-4 3R/4R GEOMETRIC DESIGN GUIDELINES
This page left blank intentionally.
Alberta InfrastructureHIGHWAY GEOMETRIC DESIGN GUIDE AUGUST 1999
3R/4R GEOMETRIC DESIGN GUIDELINES G-5
�������� +�).�� ������������ �� ��������
� ���������������
3R projects generally include resurfacing, restorationor rehabilitation of existing paved roads. 4R projectsinclude some reconstruction of existing paved roads,which generally takes place in conjunction withresurfacing, restoration or rehabilitation of theexisting pavement. The purpose of the 3R/4Rguidelines is to extend the service life of existingpaved highways and enhance highway safety on anetwork basis. To accomplish this objective, thestandards focus on the most safety-cost effectiveimprovements and also encourage the use of low-costopportunities to improve safety where majorreconstruction is not cost-effective. The guidelinescontained in this document are general in nature andare not a substitute for engineering judgement.
The process used to review the geometric designstandards on existing paved highways under AlbertaInfrastructure’ jurisdiction is described below:
Pavements are designed with an intended life of 20years and therefore, the first and subsequentrehabilitation will generally occur in 20-year cycles.This pattern establishes a logical timetable for thereview of geometric design standards on existingpaved roads. If geometric improvements are requiredit is generally most cost-effective to construct at thetime of rehabilitation. Projects that are scheduled forpavement rehabilitation are listed on a constructionprogram. This list is based on pavement conditionand other considerations. Because approximately15,000 km (total two-lane equivalent length as ofMarch 1994) of Alberta’s primary highway system arepaved and because those pavements generallyrequire rehabilitation every 20 years, approximately750 km of pavement will require rehabilitation eachyear. An assessment of geometric design standards is
made on each section of highway prior to pavementrehabilitation. It is desirable that this assessment takeplace several years before the scheduledrehabilitation to allow all improvement options to beconsidered. The first step in the geometric assessmentprocess is an initial screening of all the projects todetermine the general scope of work. This initialscreening is done by a small group of expertsrepresenting the design, planning and programmingfunctions with special input, if required, from otherareas; for example, the Regional Offices (RegionalServices), the Maintenance, Specifications and TrafficEngineering Section, the Highway EngineeringSection of Technical Standards Branch (Planning andTechnical Services) etc.
The general scope-of-work determination includesdeciding whether or not grade-widening is requiredand deciding if selective geometric improvements orgeneral reconstruction (perhaps to new constructionstandards) is appropriate.
The initial technical review is based on a summary ofgeometric, traffic and collision data that is readilyavailable for each project. Generally, as part of theinitial review, projects will be identified for planningstudy, preliminary engineering or detailedengineering work. This type of technical review mayalso be applied to projects listed on the PrimaryHighway Construction Program. This process allowsprojects which previously may have beenunsupported by technical data to gain some technicalcredibility, or conversely, projects without technicalmerit can be identified.
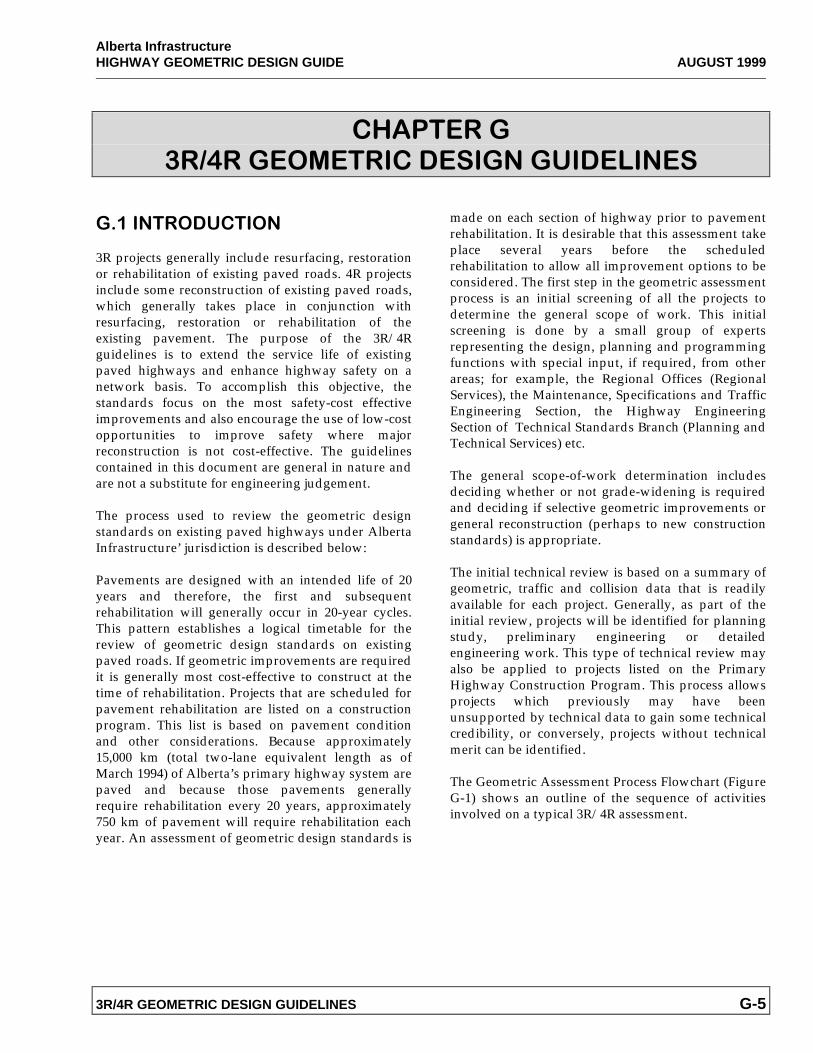
The Geometric Assessment Process Flowchart (FigureG-1) shows an outline of the sequence of activitiesinvolved on a typical 3R/4R assessment.
Alberta InfrastructureAUGUST 1999 HIGHWAY GEOMETRIC DESIGN GUIDE
G-6 3R/4R GEOMETRIC DESIGN GUIDELINES
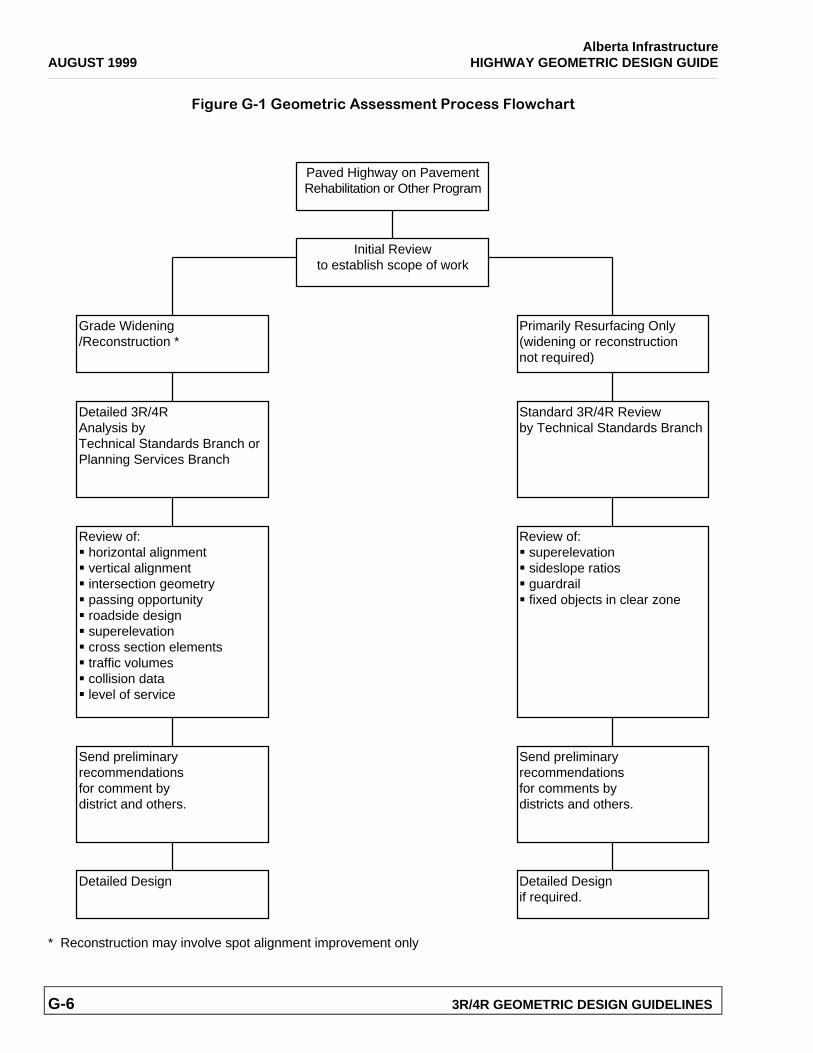
� #*��� ��� �'!�-� &�������!��-���'&������'%&$��-
* Reconstruction may involve spot alignment improvement only
Paved Highway on PavementRehabilitation or Other Program
Initial Reviewto establish scope of work
Primarily Resurfacing Only(widening or reconstructionnot required)
Grade Widening/Reconstruction *
Detailed 3R/4RAnalysis byTechnical Standards Branch orPlanning Services Branch
Standard 3R/4R Reviewby Technical Standards Branch
Review of:� horizontal alignment� vertical alignment� intersection geometry� passing opportunity� roadside design� superelevation� cross section elements� traffic volumes� collision data� level of service
Review of:� superelevation� sideslope ratios� guardrail� fixed objects in clear zone
Send preliminaryrecommendationsfor comment bydistrict and others.
Send preliminaryrecommendationsfor comments bydistricts and others.
Detailed Design Detailed Designif required.
Alberta InfrastructureHIGHWAY GEOMETRIC DESIGN GUIDE AUGUST 1999
3R/4R GEOMETRIC DESIGN GUIDELINES G-7
����� * (�� ����,'���� - �����2 �%
The following information is required for the initialtechnical review: project description, AADT, level ofservice, pavement width, sideslope, backslope,collision rate, and summary of horizontal alignmentinformation noting radii of all curves.
When determining the scope of work for a 3R/4Rproject, a fundamental parameter that must beconsidered is pavement width. If the pavement issufficiently wide to provide the desired service fortraffic, then only the other geometric parameters needto be assessed. If grade-widening is necessary, achoice must be made between simple grade-widening(retaining existing horizontal and vertical geometry)or some degree of reconstruction.
If grade-widening is not required, the horizontalcurvature should be reviewed together with thecollision data to see if selective alignmentimprovements may be called for. If neither grade-widening or horizontal curve improvements areindicated by the initial review and there are noobvious safety concerns, the project may be given astandard 3R/4R review rather than a detailed 3R/4Ranalysis. Projects which are labelled as standard3R/4R review are still reviewed for sideslope ratio,removal of fixed objects in the clear zone (forexample, guardrail), etc. but will not need a fulldetailed geometric assessment. All other projects willundergo a detailed 3R/4R analysis which includes anassessment of horizontal alignment, verticalalignment, roadside area, intersection geometrics,superelevation and passing opportunity.
Sections G.1.2 and G.1.3 provide guidelines forestablishing the minimum acceptable width andchoosing between grade widening andreconstruction.
������ � !*!��������(�$'*�(��: (-$�
Undivided Highways
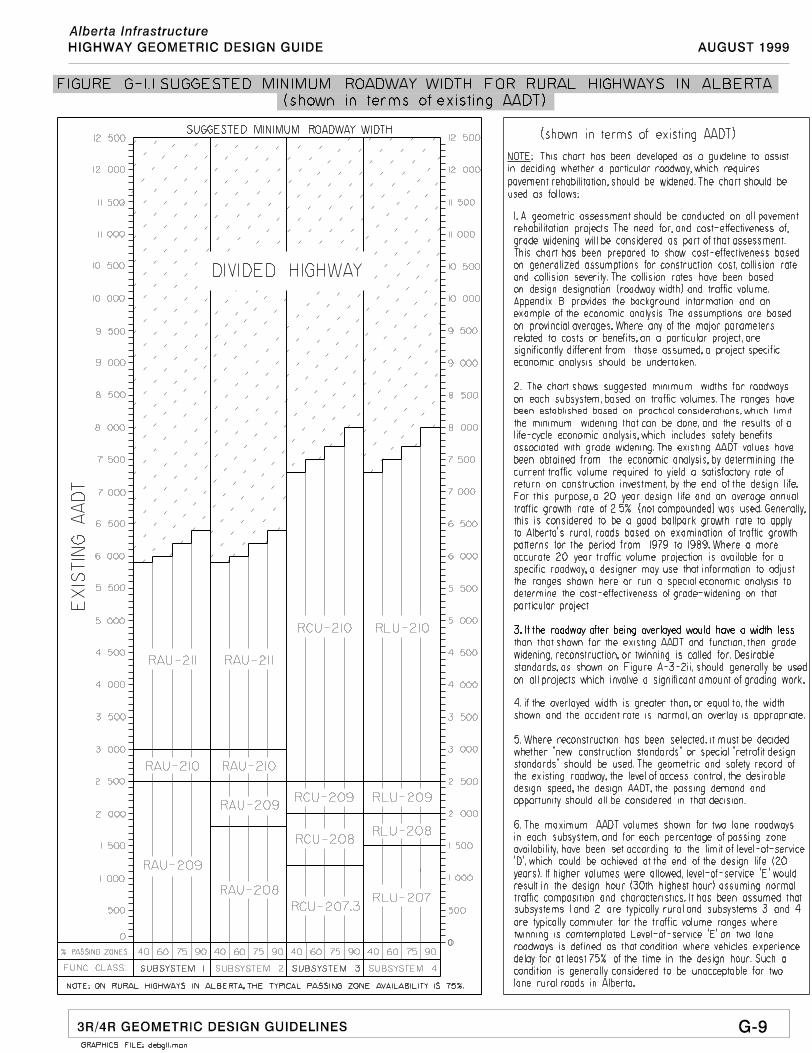
Designers should refer to Figure G-1.1 (SuggestedMinimum Standards for Rural Highways in Alberta).
Through reference to this figure, a designer candetermine if a given roadway would be sufficientlywide after an overlay according to the existing width,AADT and functional classification. If the roadwaywould not be sufficiently wide, consideration shouldbe given to grade-widening and/or reconstruction. Adesigner should then refer to Figure A-3.2i, DesirableStandards for Rural Highways in Alberta todetermine the desirable width for the roadway. TheSuggested Minimum Standards in Figure G-1.1 areshown in terms of Existing AADT while the DesirableStandards in Figure A-3.2i are shown in terms ofDesign AADT. A rationale for Figure G-1.1 isprovided based on economic analysis and otherconsiderations in Appendix A.
Divided Highways
On existing paved highways that are being twinnedor overlaid (divided highways), the suggestedminimum roadway width for each road top is 9.5m.This provides sufficient width for shoulders andlanes as follows: 0.3m, 3.7m, 3.7m and 1.8m.
Where the pavement width is greater than 9.9m (0.3mleft shoulder, 2.2m right shoulder), the right shouldershould be increased to a 3.0m width before increasingthe left shoulder width.
Alberta InfrastructureAUGUST 1999 HIGHWAY GEOMETRIC DESIGN GUIDE
G-8 3R/4R GEOMETRIC DESIGN GUIDELINES
���+� ��(�: (�� �#)��&'��-�*&- '������*��2����"
Designers should refer to Section C.8.1 of thisdocument for a discussion on the department’sstrategy to retain existing pavement widths. Allfeasible alternatives should be explored to minimizethe loss of pavement width while undertakingpavement rehabilitation however inevitably therewill be a need to widen or reconstruct someroadways. In choosing between full or partial grade-widening and total reconstruction, many factors mustbe taken into consideration. Normally, input will berequired from Regions and Technical StandardsBranch before that decision is made. However, thefollowing guidelines may be useful:
1. If width after overlay will be less than that shownin Figure G-1.1, grade-widening is generally cost-effective from the point of view of collision costreduction, assuming a provincial averagecollision rate for the existing width of roadway.
2. Where the existing collision rate is significantly
different from the provincial average for thisroadway width, this should be considered whenassessing the need for grade widening. Whenassessing the collision history of a particular road,designers should consider the breakdown ofcollision types and their relationship to geometricfeatures. For example, geometric improvementswill usually have very little impact on thenumber of animal collisions. However, roadsideimprovements can significantly reduce theseverity of run-off-the-road type collisions.
3. Existing geometrics should also be considered.
Substandard geometrics would provide moresupport for grade widening or reconstructionrather than overlay.
4. Where grade-widening and horizontal or vertical
alignment improvements are warranted, adesigner should carefully assess the impact ofdoing selective alignment improvements only.Selective alignment improvements will likely beless costly than applying the desirable newconstruction standards throughout. However,
they may result in a less balanced design; forexample, a wide roadway with minimumalignment standards. Generally on grade-widening projects, improvement of sub-standardhorizontal curvature is considered appropriate.However, vertical alignment improvements maybe done selectively according to the 3R/4RGeometric Design Guidelines. Vehicle speedsgenerally increase as a result of lane and shoulderwidth improvements. These speed increases willoffset part of the safety benefit of grade-wideningbecause, other things being equal, collision ratesincrease with speed. Because the typical driverexpects better alignments on wider roads anddrives accordingly, it is appropriate to providebetter than minimum alignment standards onroadways with wide shoulders.
Where a grade widening project requires alignmentimprovements over a substantial portion of its length,it is appropriate to adopt the desirable newconstruction standards for the entire project to ensuredesign consistency.
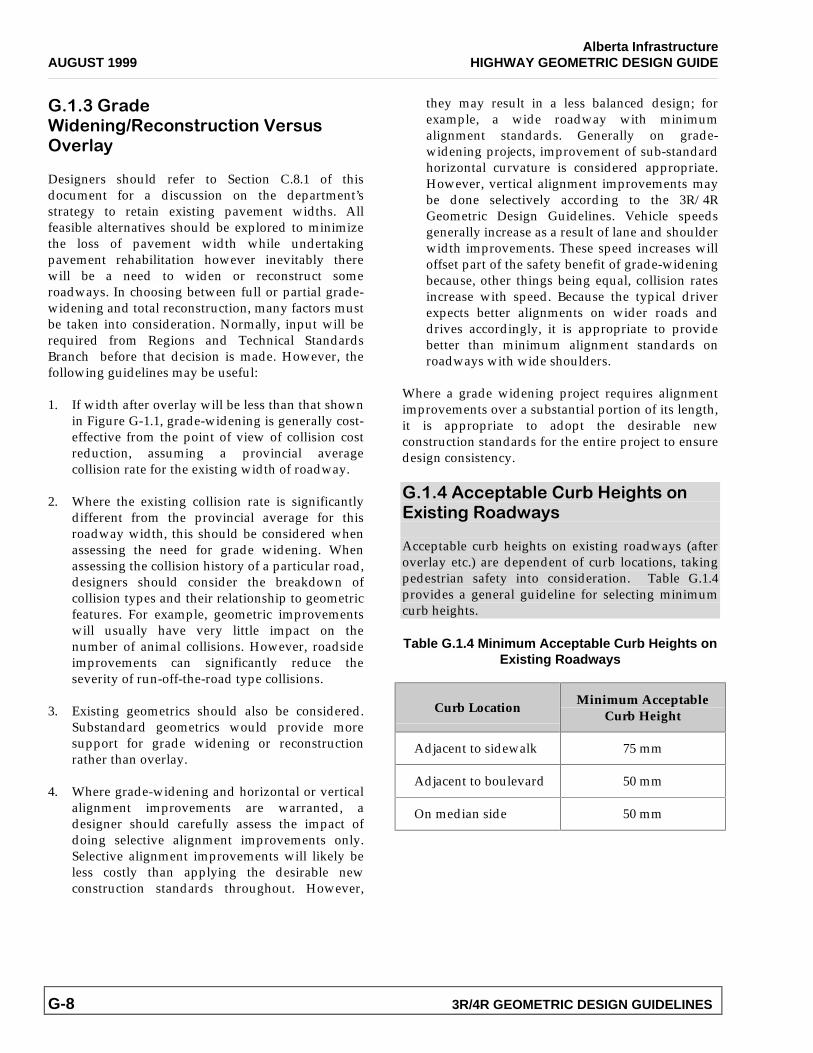
���.��&&�4-�3����*�3��� #$-��'��D �- �#��'�(%�"�
Acceptable curb heights on existing roadways (afteroverlay etc.) are dependent of curb locations, takingpedestrian safety into consideration. Table G.1.4provides a general guideline for selecting minimumcurb heights.
Table G.1.4 Minimum Acceptable Curb Heights onExisting Roadways
Curb LocationMinimum Acceptable
Curb Height
Adjacent to sidewalk 75 mm
Adjacent to boulevard 50 mm
On median side 50 mm
Alberta InfrastructureAPRIL 1995 HIGHWAY GEOMETRIC DESIGN GUIDE
G-10 3R/4R GEOMETRIC DESIGN GUIDELINES
� �������C���������������
Improvements should be considered at all horizontalcurves on pavement rehabilitation projects.Improvements will generally be warranted only oncurves which do not meet the minimum radius for newconstruction. Curves that exceed the minimum radiusshould also be considered for upgrading, based onfactors such as superelevation rate, collision rate,intersections or hazards on curve, consistency withhighway alignment, horizontal-vertical alignmentcoordination, road user savings due to lower vehiclerunning costs, or small deflection angles.
Designers undertaking geometric assessmentgenerally prepare a summary of all horizontalalignment elements that should be considered forimprovement for any of the reasons listed above, orfor other reasons. The summary includes the curvegeometric information (radius, spiral, delta,superelevation, width, length), township diagram,collision records and traffic information (AADT).
Where detailed analysis is required, use of thedepartment’s Benefit-Cost Guidelines isrecommended as one tool in the analysis, the resultsof which will be only one of several factors which willbear upon the decision.
Because of the many site specific factors which canaffect the outcome of an analysis, a project specificanalysis considering all of the alignment alternativesshould be undertaken. Where the realignmentproposals involve more than one curve on a highwaysection, it is necessary to include the entire alignment(from common point to common point, whichincludes all the alternatives) in the analysis. The routeto be used should include all expected costs thatapply to the specific project. All alternativesconsidered must be feasible from a route locationperspective.
The benefit-cost guidelines include benefits forreductions in vehicle running cost, time savings forshorter alignments or higher speeds, and potentialsavings in collision costs. Three factors maycontribute to savings in collision cost for horizontalalignment improvements. These factors are:
�� ���#-$�',��� #�!��-
Where the length of the project is different fordifferent alternatives, this will result in
differences in total vehicle kilometres, orexposure of vehicles to collision risk, over theanalysis period.
�� �'�� � '����2�� -"�
The collision severity on any particular projectcould be affected by horizontal alignmentimprovement. However, there is no dataavailable at the present time to link these twofactors. Generally, where horizontal realignmentis being considered, if all other geometric featuresare to remain unchanged, then no change incollision severity should be assumed. Theanalysis should consider that otherimprovements (sideslope flattening or removal ofobstacles such as approaches), which are oftenundertaken at the same time as horizontalrealignment, could result in lower collisionseverity. In this case, a reduction in collisionseverity may be appropriate.
+� �'�� � '����-��
Collision rate (generally expressed as collisionsper 100 million vehicle kilometres) is known to berelated to the sharpness of horizontal curvature.Many models have been developed to predict thecollision rate on horizontal curves and tangents ofhigh speed rural highways. It is recommendedthat the Glennon Model be used to estimate thefuture collision rate, as described in Appendix Dof the 1987 Transportation Research Board (TRB)publication Special Report 214 entitled DesigningSafer Roads - Practices for Resurfacing,Restoration or Rehabilitation. The model shouldbe calibrated using the existing collisionexperience on the highway section in question.An example showing the use of this model isincluded in Appendix B of this chapter.
On many projects where horizontal realignment isconsidered, cost effectiveness can be demonstratedwithout a significant dollar value for collision costsavings. However, on some projects the collision costsavings are crucial to the overall cost-effectiveness. Inthese cases, a sensitivity analysis should beperformed; that is, an analysis which will show thecost-effectiveness based on a range of collision ratesthat may result after geometric improvement. Theresults of the sensitivity analysis will allow aninformed decision to be made regarding realignmentbased on a reasonable prediction of collision ratechange.
Alberta InfrastructureHIGHWAY GEOMETRIC DESIGN GUIDE AUGUST 1999
3R/4R GEOMETRIC DESIGN GUIDELINES G-11
An example of a full economic analysis, including asensitivity analysis, for horizontal alignmentimprovement is shown in Appendix B.
Where horizontal realignment of existing pavedroads takes place, the new alignment should beprojected considering desirable standards. Minimumstandards are to be used for critical locations, withbetter standards encouraged where practical andcost-effective. Desirable standards result in lowersuperelevation rates, less wear and tear for vehiclesand tires on curves, and generally safer and morerelaxed driving conditions for all road users.
� �+�������������������
�+�������-�
Vertical crest curve reconstruction should beevaluated if any one of the following conditions exist:
1. There is a safety problem, or 2. There is a hazard in close proximity to the crest,
or 3. The AADT exceeds 3000 and there is limited
sight distance (that is, stopping sight distanceavailable is substantially less than what wouldnormally be provided under new constructionstandards for vehicles travelling at the averagerunning speed of vehicles on the crest).
Although evaluation of vertical crest curves isappropriate where any of the above conditions exist,reconstruction may not be the most desirable action,due to low cost-effectiveness, physical constraints, orother reasons.
The use of traffic control devices to advise motoristsof the sharp crest may be considered where adecision has been made not to improve a verticalalignment due to low cost-effectiveness, although theexisting alignment is substantially below currentstandards. Additional low-cost measures to beconsidered are fixed hazard removal, shoulderwidening and relocation of minor intersection.
Generally, a substantial sight distance restriction isone where the minimum stopping sight distanceavailable is more than 20 km/h less than the 85thpercentile running speed of vehicles on the crest. InAlberta, the 85th percentile running speed on two-
lane highways is frequently 109 km/h. Therefore, thesuggested minimum vertical crest curvature isgenerally based on the minimum stopping sightdistance for 89 km/h.
Using current object height, eye height, perception-reaction time and friction factor, this gives aminimum stopping sight distance of 165.76 m(rounded to 166 m) or a crest K value of 51.0(rounded to 50) for a running speed of 109 km/h.Therefore a K value of 50 is considered acceptable onexisting paved undivided highways with designspeed up to 110 km/h. This same value is used fordivided highways which may have a higher designspeed (up to 130 km/h), a higher posted speed of 110km/h and a higher 85th percentile running speed(estimated a 116 km/h). The reason for accepting theK of 50 on divided highways is because stoppingsight distance is not as critical on a roadway servingjust one direction of travel. Additionally, experiencefrom other agencies especially in the United States1
indicates that a speed differential between runningspeed and stopping sight distance speed of32.2 km/h (20 mph) is generally acceptable onexisting crest curves that are under consideration forreconstruction.
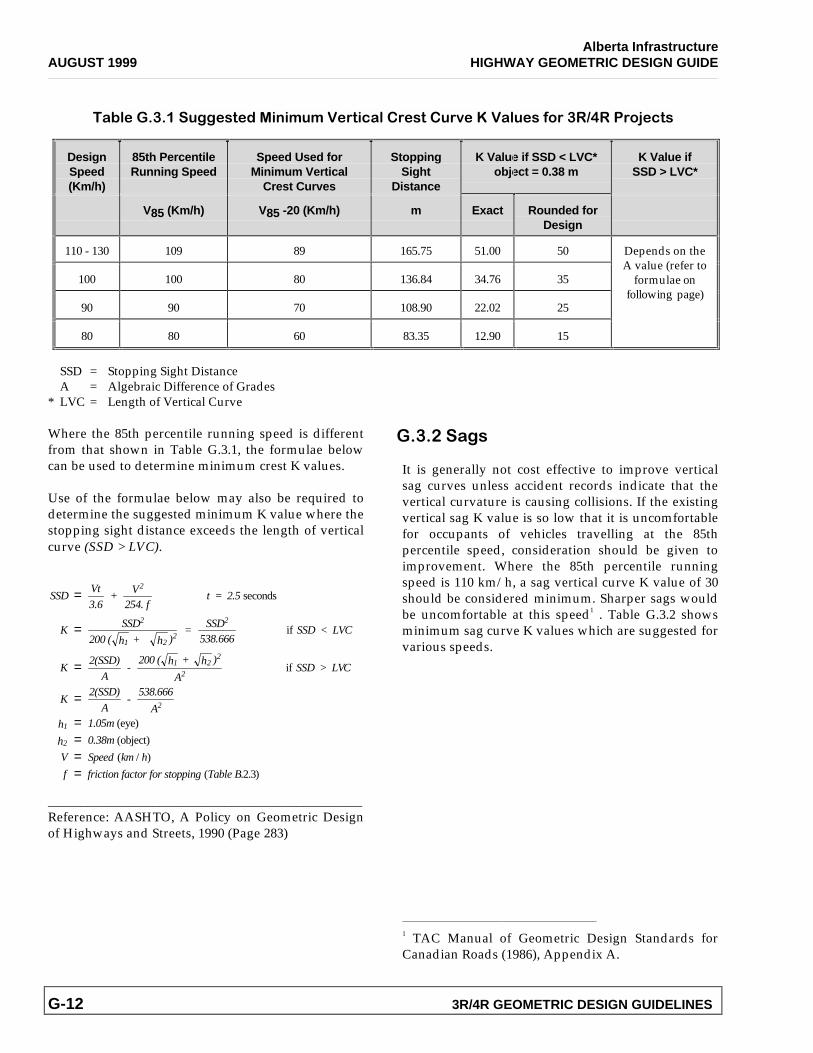
Table G.3.1 shows suggested minimum vertical crestcurve K values for 3R projects in Alberta based on theabove criteria.
1 Reference: Special Report 214, Practices forResurfacing, Restoration and Rehabilitation,Transportation Research Board, National ResearchCouncil 1987.
Alberta InfrastructureAUGUST 1999 HIGHWAY GEOMETRIC DESIGN GUIDE
G-12 3R/4R GEOMETRIC DESIGN GUIDELINES
��3��� �+���*##��-�(�� � !*!����- &�������-��*�2��F����*���,'��+�).����'1�&-�
DesignSpeed(Km/h)
85th PercentileRunning Speed
Speed Used forMinimum Vertical
Crest Curves
StoppingSight
Distance
K Value if SSD < LVC*object = 0.38 m
K Value ifSSD > LVC*
V85 (Km/h) V85 -20 (Km/h) m Exact Rounded forDesign
110 - 130 109 89 165.75 51.00 50
100 100 80 136.84 34.76 35
90 90 70 108.90 22.02 25
80 80 60 83.35 12.90 15
Depends on theA value (refer to
formulae onfollowing page)
SSD = Stopping Sight DistanceA = Algebraic Difference of Grades
* LVC = Length of Vertical Curve
Where the 85th percentile running speed is differentfrom that shown in Table G.3.1, the formulae belowcan be used to determine minimum crest K values.
Use of the formulae below may also be required todetermine the suggested minimum K value where thestopping sight distance exceeds the length of verticalcurve (SSD > LVC).
SSDVt
3.6 +
V254. f
t = 2.5
KSSD
200 ( h + h ) =
SSD538.666
SSD < LVC
K2(SSD)
A -
200 ( h + h )
A SSD > LVC
K2(SSD)
A -
538.666
Ah 1.05m
h 0.38m
V Speed km h
f friction factor for stopping Table B
2
2
1 22
2
1 22
2
2
1
2
=
=
=
=
====
seconds
if
if
(eye)
(object)
( / )
( . . )2 3
________________________________________________Reference: AASHTO, A Policy on Geometric Designof Highways and Streets, 1990 (Page 283)
�+����#�
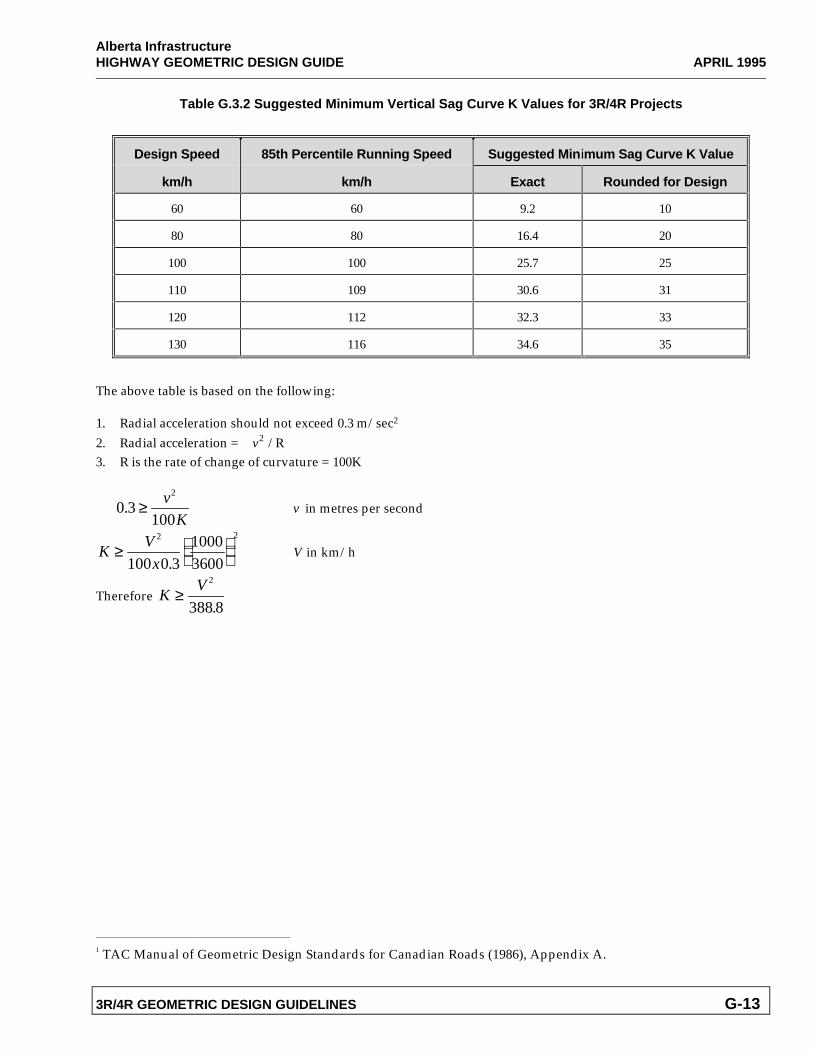
It is generally not cost effective to improve verticalsag curves unless accident records indicate that thevertical curvature is causing collisions. If the existingvertical sag K value is so low that it is uncomfortablefor occupants of vehicles travelling at the 85thpercentile speed, consideration should be given toimprovement. Where the 85th percentile runningspeed is 110 km/h, a sag vertical curve K value of 30should be considered minimum. Sharper sags wouldbe uncomfortable at this speed1 . Table G.3.2 showsminimum sag curve K values which are suggested forvarious speeds.
1 TAC Manual of Geometric Design Standards forCanadian Roads (1986), Appendix A.
Alberta InfrastructureHIGHWAY GEOMETRIC DESIGN GUIDE APRIL 1995
3R/4R GEOMETRIC DESIGN GUIDELINES G-13
Table G.3.2 Suggested Minimum Vertical Sag Curve K Values for 3R/4R Projects
Design Speed 85th Percentile Running Speed Suggested Minimum Sag Curve K Value
km/h km/h Exact Rounded for Design
60 60 9.2 10
80 80 16.4 20
100 100 25.7 25
110 109 30.6 31
120 112 32.3 33
130 116 34.6 35
The above table is based on the following:
1. Radial acceleration should not exceed 0.3 m/sec2
2. Radial acceleration = v2 / R
3. R is the rate of change of curvature = 100K
0 3100
2
. ≥ v
Kv in metres per second
KV
x≥
2 2
100 0 3
1000
3600.V in km/h
Therefore KV≥
2
388 8.
1 TAC Manual of Geometric Design Standards for Canadian Roads (1986), Appendix A.
Alberta InfrastructureAUGUST 1999 HIGHWAY GEOMETRIC DESIGN GUIDE
G-14 3R/4R GEOMETRIC DESIGN GUIDELINES
� �.������������
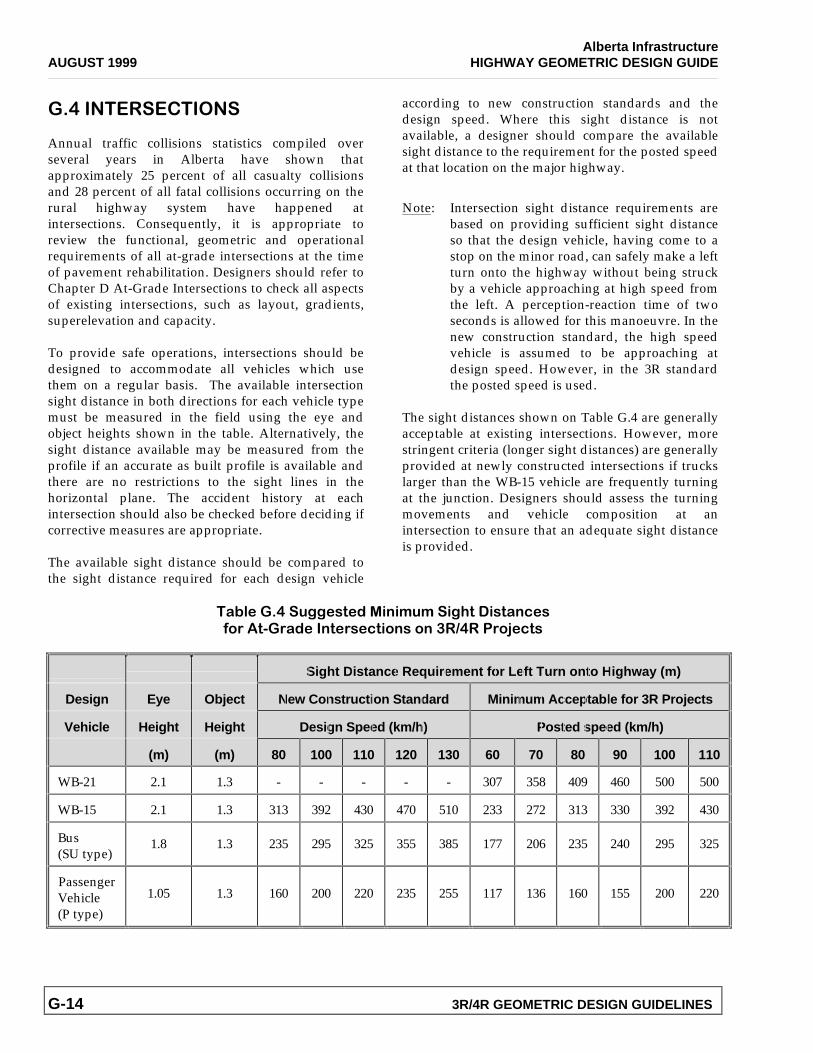
Annual traffic collisions statistics compiled overseveral years in Alberta have shown thatapproximately 25 percent of all casualty collisionsand 28 percent of all fatal collisions occurring on therural highway system have happened atintersections. Consequently, it is appropriate toreview the functional, geometric and operationalrequirements of all at-grade intersections at the timeof pavement rehabilitation. Designers should refer toChapter D At-Grade Intersections to check all aspectsof existing intersections, such as layout, gradients,superelevation and capacity.
To provide safe operations, intersections should bedesigned to accommodate all vehicles which usethem on a regular basis. The available intersectionsight distance in both directions for each vehicle typemust be measured in the field using the eye andobject heights shown in the table. Alternatively, thesight distance available may be measured from theprofile if an accurate as built profile is available andthere are no restrictions to the sight lines in thehorizontal plane. The accident history at eachintersection should also be checked before deciding ifcorrective measures are appropriate.
The available sight distance should be compared tothe sight distance required for each design vehicle
according to new construction standards and thedesign speed. Where this sight distance is notavailable, a designer should compare the availablesight distance to the requirement for the posted speedat that location on the major highway.
Note: Intersection sight distance requirements arebased on providing sufficient sight distanceso that the design vehicle, having come to astop on the minor road, can safely make a leftturn onto the highway without being struckby a vehicle approaching at high speed fromthe left. A perception-reaction time of twoseconds is allowed for this manoeuvre. In thenew construction standard, the high speedvehicle is assumed to be approaching atdesign speed. However, in the 3R standardthe posted speed is used.
The sight distances shown on Table G.4 are generallyacceptable at existing intersections. However, morestringent criteria (longer sight distances) are generallyprovided at newly constructed intersections if truckslarger than the WB-15 vehicle are frequently turningat the junction. Designers should assess the turningmovements and vehicle composition at anintersection to ensure that an adequate sight distanceis provided.
��3��� �.�*##��-�(�� � !*!� #$-�� �-��&��,'���-� ��(����-����&- '���'��+�).����'1�&-�
Sight Distance Requirement for Left Turn onto Highway (m)
Design Eye Object New Construction Standard Minimum Acceptable for 3R Projects
Vehicle Height Height Design Speed (km/h) Posted speed (km/h)
(m) (m) 80 100 110 120 130 60 70 80 90 100 110
WB-21 2.1 1.3 - - - - - 307 358 409 460 500 500
WB-15 2.1 1.3 313 392 430 470 510 233 272 313 330 392 430
Bus(SU type)
1.8 1.3 235 295 325 355 385 177 206 235 240 295 325
PassengerVehicle(P type)
1.05 1.3 160 200 220 235 255 117 136 160 155 200 220

Alberta InfrastructureHIGHWAY GEOMETRIC DESIGN GUIDE AUGUST 1999
3R/4R GEOMETRIC DESIGN GUIDELINES G-15
�/����� ������������=������ B����� �����>
Projects undergoing pavement rehabilitation shouldbe checked for passing opportunity. The passingopportunity available on a highway segment due topavement markings, together with the passingdemand (which is a function of traffic volume andspeed distribution), will have a major impact onlevel-of-service. Designers should use the warrantsand guidelines for climbing and passing lanescontained in Chapter B to determine the need forauxiliary lanes.
Care should be exercised in applying the auxiliarylane warrants to existing paved roadways. There maybe cases where the addition of an auxiliary lane is notdesirable even though the warrant is met. This couldbe due to the physical constraints of the existingroadway, presence of hazards such as intersections,or the location of no passing zones. For safety reasonson some projects, it may be necessary to include someaccess control in conjunction with construction ofauxiliary lanes. Where this is not feasible, it may bebetter not to build the auxiliary lane.
�5������������ �
�5�����, � - '��',�������C'��
Clear zone is the total roadside border area, startingat the edge of travelled way, available for safe use byerrant vehicles. Although the movement of out-of-control vehicles is difficult to predict, a study of run-off-road incidents entitled The General MotorsProving Ground Study8 has shown that 50 percent oferrant vehicles do not go beyond five metres from theedge of roadway while a full 80 percent stray lessthan nine metres. Provision of a clear forgivingroadside area for the entire right of way width isdesirable. However, for hazards that are located morethan nine metres from the travelled way, it is moredifficult to justify the cost of mitigation because of thesmaller number of crashes that would be eliminated.
8 Skeels, P.C., The Role of the Highway in a SafeTransportation System. Presented at 65th annualconvention, American Road Builders Association(Feb. 1968).
To assist designers in deciding which hazards shouldbe mitigated, the clear zone concept has beendeveloped. The clear zone distance, used for designpurposes, is a function of the design speed, sideslopeand traffic volume. Other factors such as horizontalalignment, hazard type etc. should also be usedwhere applicable. Clear zone width can bedetermined from Table C-5.2a. For typical Albertarural highway conditions, the normal clear zone ontangent sections is 9 m. Generally, any hazard locatedwithin the clear zone distance should be mitigated.Sometimes major hazards are located outside of theclear zone; for example, large bodies of water whichcould result in severe collisions. In these cases,designers may still provide protection even though itis generally not required by the clear zone policy.Engineering judgement should be used in applyingthe clear zone concept, generally providing moreprotection against, or clearance from severe hazards,especially when volumes and speeds are higher.
�5���$'*�(����*!3���-� 4�
In general on all overlay or grade-widening projects,shoulder rumble strips should be included if theshoulder is wide enough. Generally on undividedhighways, the minimum shoulder width required forrumble strips is two metres. This is to ensure that anadequate smooth pavement width is available on theshoulders for bicycle traffic. In the case of one-direction-only roads, such as divided highways orinterchange ramps, the minimum shoulder width istwo metres on the right hand side and 1.2m on theleft hand side to allow for rumble strips. Rumblestrips are not placed through urban areas or whereshoulder widths are reduced due to turning lanes orfor other reasons. The addition of shoulder rumblestrips is expected to reduce the number of singlevehicle run-off-road collisions by alerting driverswhen they veer off the travel lanes.
The typical layout and details for shoulder rumblestrips is shown in Figures C-3.1a, C-3.1b and C-3.1c.Some changes to the typical layout may be made inthe future to allow for usage on narrower shoulders,intermittent strips or selective rumble strips whererun-off-road incidents are likely to occur. Becauseshoulder rumble strips are a relatively new feature inAlberta, the methods used to install the strips may bemodified and improved in the future. Shoulderrumble strip layouts and methods should beconsistent with current practice at the time ofinstallation.
Alberta InfrastructureAUGUST 1999 HIGHWAY GEOMETRIC DESIGN GUIDE
G-16 3R/4R GEOMETRIC DESIGN GUIDELINES
�5�+��!4�'2�!��-�-'� (���'4��B� -&$���(��&6��'4��
On any roadway where the 85th percentile runningspeed exceeds 100 km/h, any existing sideslopes of3:1 or steeper should be identified as candidatelocations for improvement. On projects where it is notcost effective to do sideslope improvements on theentire project (due to low traffic volumes),improvements should be considered at locationswhere run-off-the-road collisions are likely to occur,such as on the outside of sharp horizontal curves.Existing sideslopes of 4:1 or flatter on existing pavedroads generally do not warrant improvement.
Where sideslope improvements are beingundertaken, a 4:1 slope should be considered as aminimum, 5:1 desirable for moderate volumes(design AADT 1500-4000) and 6:1 desirable for highervolume two-lane roadways (design AADT>4000) andall divided highways. Where the existing ditch widthis being reduced to accommodate sideslopeimprovements, 1.2m should be considered theminimum width. However, the designer must ensurethat the ditch is sufficiently wide to provide adequatedrainage and snow storage capacity.
Although backslopes are not as critical as sideslopesfor an errant vehicle, it is desirable to provide 3:1 orflatter backslopes to improve the traversability of theentire roadside cross section.
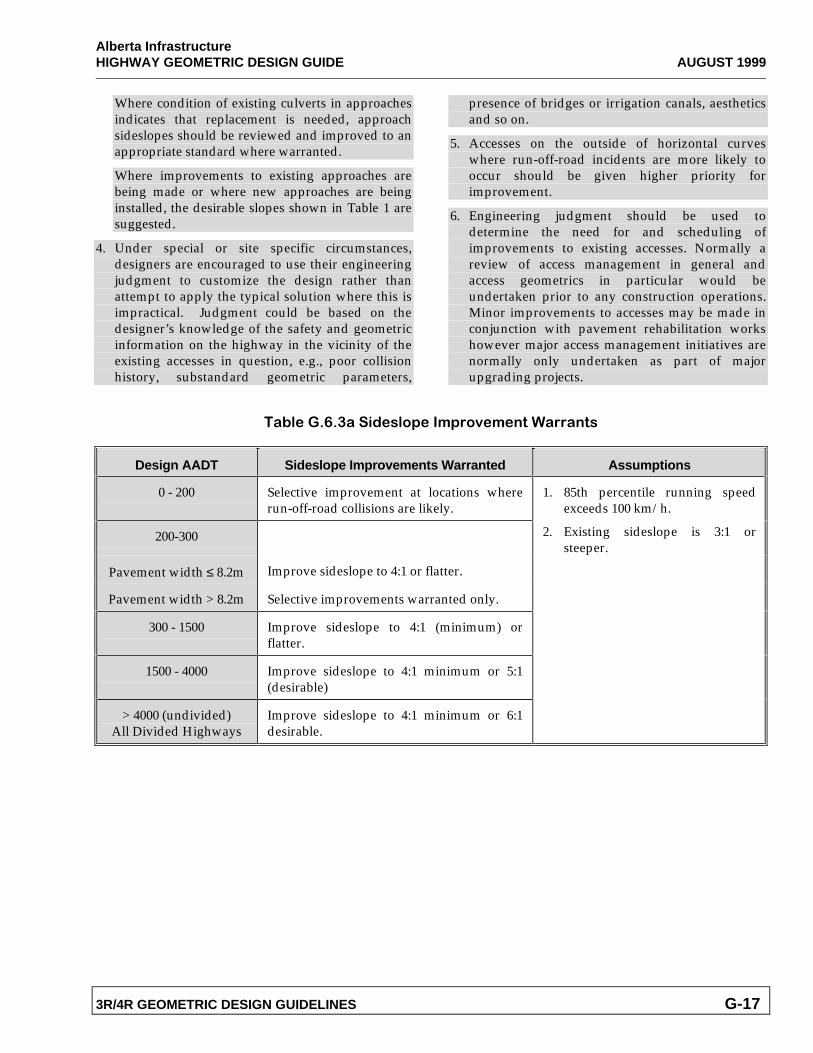
The traffic volume ranges in Table G.6.3a aresuggested as a guide for determining the extent ofroadside improvement that is warranted at the timeof pavement rehabilitation. These ranges are based onan economic analysis of the safety cost effectivenessof sideslope improvements and consideration of thenew construction standards for roadways with thesevolumes. The economic analysis is shown inAppendix C.
�5�.�����-!��-�',��44�'�&$���'�Access management, particularly the assessment ofexisting approaches for possible elimination,consolidation or improvement should be consideredprior to all overlay, rehabilitation or wideningprojects.
In determining the number, location and spacing ofapproaches to adjacent properties or roadwaysserving adjacent lands, the department’s Access
Management Guidelines (Chpater I of the DesignGuide) shall be used. These guidelines may be usedas basic requirements on new construction projectsand may also be used as a basis for accessmanagement plans on pavement rehabilitationprojects or for consideration of developmentapplications.
When accesses are to be retained the followingguidelines should be used:
1. The geometrics of approaches shall typically be asshown in Figure D-3.3a (for main intersectingroadway) or Figure D-3.3b (for minor intersectingroadway). The geometrics of other embankmentswithin or close to the clear zone of a highwayright-of-way such as a railway embankments orirrigation canal embankments should be assessedin a similar way to roadway approaches. Becauseof the additional hazard posed by irrigationcanals, there is a greater need to provideprotection for the motorist and thereforerelocation of accesses in close proximity to canalcrossings may be justified in some cases. Thepurpose of the relocation would be to allowappropriate traffic barriers to be placed to protecthighway traffic from the canal hazard and toallow for gentle slopes.
2. Where a culvert is required on a new approach orwhere culvert replacement is needed in anexisting approach the culvert should be placed asfar away from the highway as possible while stillaccommodating ditch drainage. Placement nearthe highway right-of-way boundary is desirable.
3. The slope of an approach is a key factor affectingsafety. The slopes are generally variable due tothe transition from highway embankment toapproach embankment and due to the intersectionof these slopes and therefore the slope midwaybetween the highway shoulder and basic right-of-way boundary is used here (and illustrated inFigures D-3.3a & D-3.3b) as a criteria. In areas ofhigh fill, the slope should be measured at alocation where the slope extends to the bottom ofthe embankment.
If slope is steeper than 4:1 on undivided highway or5:1 on divided highway, improvement should beconsidered. If slope is steeper than 3:1, approachshould be given a high priority for improvement orremoval.
Alberta InfrastructureHIGHWAY GEOMETRIC DESIGN GUIDE AUGUST 1999
3R/4R GEOMETRIC DESIGN GUIDELINES G-17
Where condition of existing culverts in approachesindicates that replacement is needed, approachsideslopes should be reviewed and improved to anappropriate standard where warranted.
Where improvements to existing approaches arebeing made or where new approaches are beinginstalled, the desirable slopes shown in Table 1 aresuggested.
4. Under special or site specific circumstances,designers are encouraged to use their engineeringjudgment to customize the design rather thanattempt to apply the typical solution where this isimpractical. Judgment could be based on thedesigner’s knowledge of the safety and geometricinformation on the highway in the vicinity of theexisting accesses in question, e.g., poor collisionhistory, substandard geometric parameters,
presence of bridges or irrigation canals, aestheticsand so on.
5. Accesses on the outside of horizontal curveswhere run-off-road incidents are more likely tooccur should be given higher priority forimprovement.
6. Engineering judgment should be used todetermine the need for and scheduling ofimprovements to existing accesses. Normally areview of access management in general andaccess geometrics in particular would beundertaken prior to any construction operations.Minor improvements to accesses may be made inconjunction with pavement rehabilitation workshowever major access management initiatives arenormally only undertaken as part of majorupgrading projects.
������������� ���������������������������
Design AADT Sideslope Improvements Warranted Assumptions
0 - 200 Selective improvement at locations whererun-off-road collisions are likely.
200-300
1. 85th percentile running speedexceeds 100 km/h.
2. Existing sideslope is 3:1 orsteeper.
Pavement width ≤ 8.2m Improve sideslope to 4:1 or flatter.
Pavement width > 8.2m Selective improvements warranted only.
300 - 1500 Improve sideslope to 4:1 (minimum) orflatter.
1500 - 4000 Improve sideslope to 4:1 minimum or 5:1(desirable)
> 4000 (undivided)All Divided Highways
Improve sideslope to 4:1 minimum or 6:1desirable.
Alberta InfrastructureAUGUST 1999 HIGHWAY GEOMETRIC DESIGN GUIDE
G-18 3R/4R GEOMETRIC DESIGN GUIDELINES
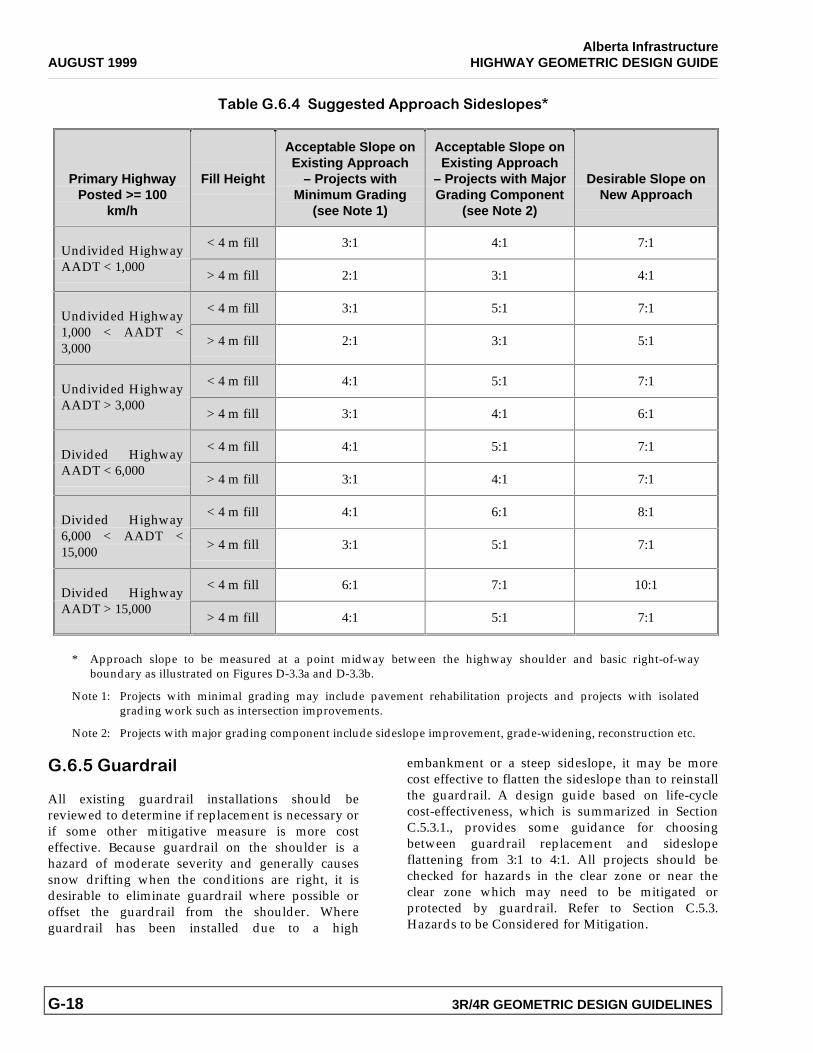
��3��� �5�.��*##��-�(��44�'�&$� (���'4��P
Primary HighwayPosted >= 100
km/h
Fill Height
Acceptable Slope onExisting Approach
– Projects withMinimum Grading
(see Note 1)
Acceptable Slope onExisting Approach
– Projects with MajorGrading Component
(see Note 2)
Desirable Slope onNew Approach
< 4 m fill 3:1 4:1 7:1Undivided HighwayAADT < 1,000
> 4 m fill 2:1 3:1 4:1
< 4 m fill 3:1 5:1 7:1Undivided Highway1,000 < AADT <3,000 > 4 m fill 2:1 3:1 5:1
< 4 m fill 4:1 5:1 7:1Undivided HighwayAADT > 3,000
> 4 m fill 3:1 4:1 6:1
< 4 m fill 4:1 5:1 7:1Divided HighwayAADT < 6,000
> 4 m fill 3:1 4:1 7:1
< 4 m fill 4:1 6:1 8:1Divided Highway6,000 < AADT <15,000 > 4 m fill 3:1 5:1 7:1
< 4 m fill 6:1 7:1 10:1Divided HighwayAADT > 15,000
> 4 m fill 4:1 5:1 7:1
* Approach slope to be measured at a point midway between the highway shoulder and basic right-of-wayboundary as illustrated on Figures D-3.3a and D-3.3b.
Note 1: Projects with minimal grading may include pavement rehabilitation projects and projects with isolatedgrading work such as intersection improvements.
Note 2: Projects with major grading component include sideslope improvement, grade-widening, reconstruction etc.
�5�/� *��(�� �
All existing guardrail installations should bereviewed to determine if replacement is necessary orif some other mitigative measure is more costeffective. Because guardrail on the shoulder is ahazard of moderate severity and generally causessnow drifting when the conditions are right, it isdesirable to eliminate guardrail where possible oroffset the guardrail from the shoulder. Whereguardrail has been installed due to a high
embankment or a steep sideslope, it may be morecost effective to flatten the sideslope than to reinstallthe guardrail. A design guide based on life-cyclecost-effectiveness, which is summarized in SectionC.5.3.1., provides some guidance for choosingbetween guardrail replacement and sideslopeflattening from 3:1 to 4:1. All projects should bechecked for hazards in the clear zone or near theclear zone which may need to be mitigated orprotected by guardrail. Refer to Section C.5.3.Hazards to be Considered for Mitigation.
Alberta InfrastructureHIGHWAY GEOMETRIC DESIGN GUIDE APRIL 1995
3R/4R GEOMETRIC DESIGN GUIDELINES G-19
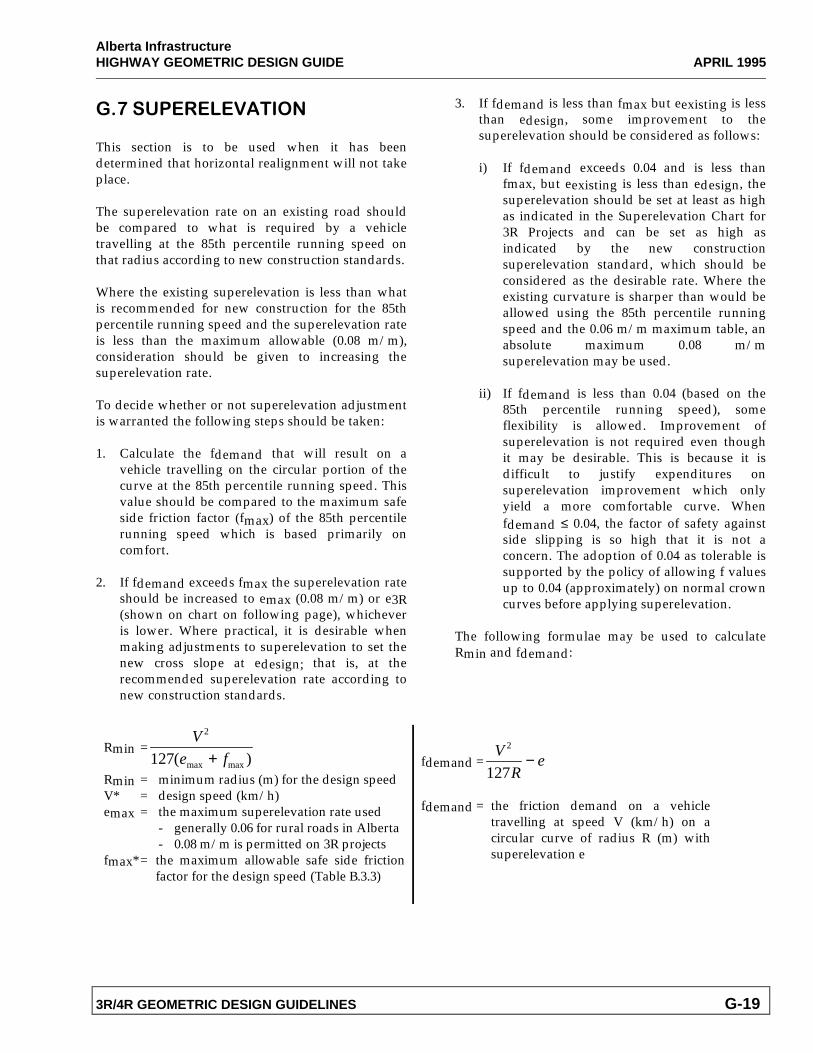
� �9��������������
This section is to be used when it has beendetermined that horizontal realignment will not takeplace.
The superelevation rate on an existing road shouldbe compared to what is required by a vehicletravelling at the 85th percentile running speed onthat radius according to new construction standards.
Where the existing superelevation is less than whatis recommended for new construction for the 85thpercentile running speed and the superelevation rateis less than the maximum allowable (0.08 m/m),consideration should be given to increasing thesuperelevation rate.
To decide whether or not superelevation adjustmentis warranted the following steps should be taken: 1. Calculate the fdemand that will result on a
vehicle travelling on the circular portion of thecurve at the 85th percentile running speed. Thisvalue should be compared to the maximum safeside friction factor (fmax) of the 85th percentilerunning speed which is based primarily oncomfort.
2. If fdemand exceeds fmax the superelevation rate
should be increased to emax (0.08 m/m) or e3R(shown on chart on following page), whicheveris lower. Where practical, it is desirable whenmaking adjustments to superelevation to set thenew cross slope at edesign; that is, at therecommended superelevation rate according tonew construction standards.
3. If fdemand is less than fmax but eexisting is lessthan edesign, some improvement to thesuperelevation should be considered as follows:
i) If fdemand exceeds 0.04 and is less than
fmax, but eexisting is less than edesign, thesuperelevation should be set at least as highas indicated in the Superelevation Chart for3R Projects and can be set as high asindicated by the new constructionsuperelevation standard, which should beconsidered as the desirable rate. Where theexisting curvature is sharper than would beallowed using the 85th percentile runningspeed and the 0.06 m/m maximum table, anabsolute maximum 0.08 m/msuperelevation may be used.
ii) If fdemand is less than 0.04 (based on the
85th percentile running speed), someflexibility is allowed. Improvement ofsuperelevation is not required even thoughit may be desirable. This is because it isdifficult to justify expenditures onsuperelevation improvement which onlyyield a more comfortable curve. Whenfdemand ≤ 0.04, the factor of safety againstside slipping is so high that it is not aconcern. The adoption of 0.04 as tolerable issupported by the policy of allowing f valuesup to 0.04 (approximately) on normal crowncurves before applying superelevation.
The following formulae may be used to calculateRmin and fdemand:
Rmin =V
e f
2
127( )max max+Rmin = minimum radius (m) for the design speedV* = design speed (km/h)emax = the maximum superelevation rate used
- generally 0.06 for rural roads in Alberta- 0.08 m/m is permitted on 3R projects
fmax* = the maximum allowable safe side frictionfactor for the design speed (Table B.3.3)
fdemand =V
Re
2
127−
fdemand = the friction demand on a vehicletravelling at speed V (km/h) on acircular curve of radius R (m) withsuperelevation e
Alberta InfrastructureAPRIL 1995 HIGHWAY GEOMETRIC DESIGN GUIDE
G-20 3R/4R GEOMETRIC DESIGN GUIDELINES
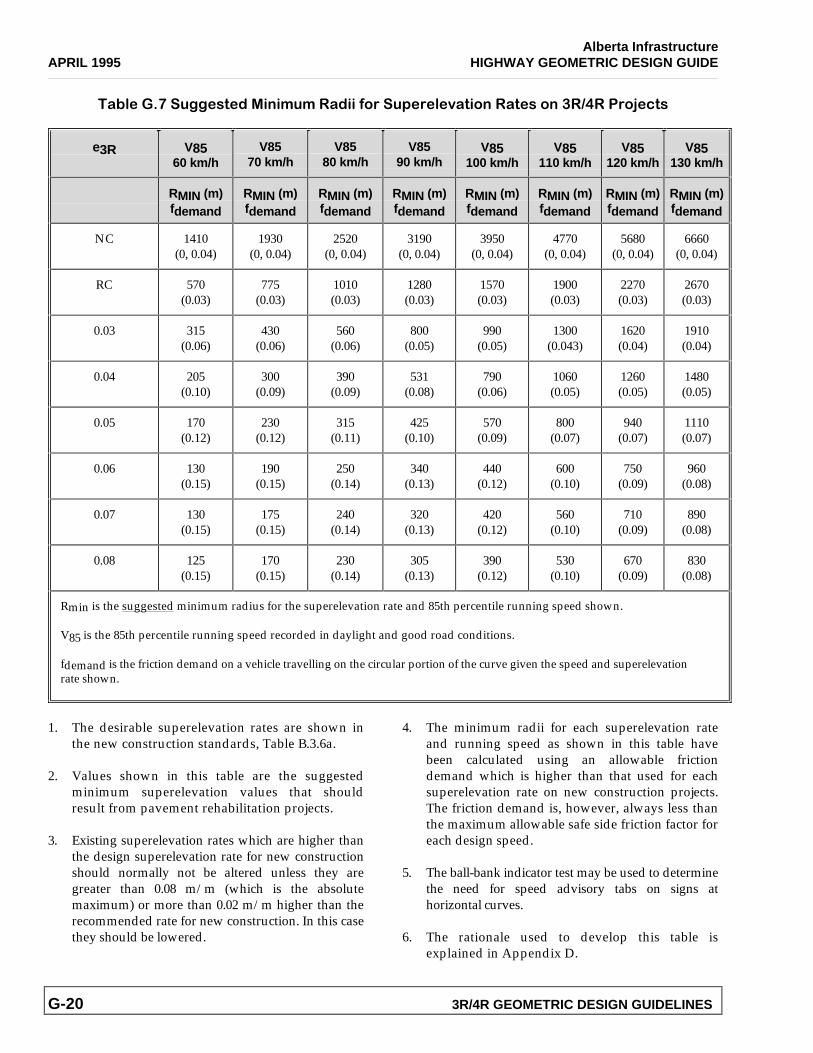
��3��� �9�*##��-�(�� � !*!���( �,'��*4�����2�- '����-���'��+�).����'1�&-�
e3R V8560 km/h
V8570 km/h
V8580 km/h
V8590 km/h
V85100 km/h
V85110 km/h
V85120 km/h
V85130 km/h
RMIN (m)fdemand
RMIN (m)fdemand
RMIN (m)fdemand
RMIN (m)fdemand
RMIN (m)fdemand
RMIN (m)fdemand
RMIN (m)fdemand
RMIN (m)fdemand
NC 1410(0, 0.04)
1930(0, 0.04)
2520(0, 0.04)
3190(0, 0.04)
3950(0, 0.04)
4770(0, 0.04)
5680(0, 0.04)
6660(0, 0.04)
RC 570(0.03)
775(0.03)
1010(0.03)
1280(0.03)
1570(0.03)
1900(0.03)
2270(0.03)
2670(0.03)
0.03 315(0.06)
430(0.06)
560(0.06)
800(0.05)
990(0.05)
1300(0.043)
1620(0.04)
1910(0.04)
0.04 205(0.10)
300(0.09)
390(0.09)
531(0.08)
790(0.06)
1060(0.05)
1260(0.05)
1480(0.05)
0.05 170(0.12)
230(0.12)
315(0.11)
425(0.10)
570(0.09)
800(0.07)
940(0.07)
1110(0.07)
0.06 130(0.15)
190(0.15)
250(0.14)
340(0.13)
440(0.12)
600(0.10)
750(0.09)
960(0.08)
0.07 130(0.15)
175(0.15)
240(0.14)
320(0.13)
420(0.12)
560(0.10)
710(0.09)
890(0.08)
0.08 125(0.15)
170(0.15)
230(0.14)
305(0.13)
390(0.12)
530(0.10)
670(0.09)
830(0.08)
Rmin is the suggested minimum radius for the superelevation rate and 85th percentile running speed shown.
V85 is the 85th percentile running speed recorded in daylight and good road conditions.
fdemand is the friction demand on a vehicle travelling on the circular portion of the curve given the speed and superelevationrate shown.
1. The desirable superelevation rates are shown inthe new construction standards, Table B.3.6a.
2. Values shown in this table are the suggested
minimum superelevation values that shouldresult from pavement rehabilitation projects.
3. Existing superelevation rates which are higher than
the design superelevation rate for new constructionshould normally not be altered unless they aregreater than 0.08 m/m (which is the absolutemaximum) or more than 0.02 m/m higher than therecommended rate for new construction. In this casethey should be lowered.
4. The minimum radii for each superelevation rateand running speed as shown in this table havebeen calculated using an allowable frictiondemand which is higher than that used for eachsuperelevation rate on new construction projects.The friction demand is, however, always less thanthe maximum allowable safe side friction factor foreach design speed.
5. The ball-bank indicator test may be used to determine
the need for speed advisory tabs on signs athorizontal curves.
6. The rationale used to develop this table is
explained in Appendix D.
Alberta InfrastructureHIGHWAY GEOMETRIC DESIGN GUIDE APRIL 1995
3R/4R GEOMETRIC DESIGN GUIDELINES G-21
�������I��� �������������������� �����:������
This appendix presents the economic analysis that is the basis for Figure G.1.1. Suggested Minimum RoadwayWidth for Rural Highways in Alberta. The appendix is divided into the following sections:
G.A.1. Background Information: Basis of Economic AnalysisG.A.2. Calculation of CostsG.A.3. Calculation of BenefitsG.A.4. Summary of ResultsG.A.5. Rationale for Figure G.1.1.

Alberta InfrastructureJUNE 1996 HIGHWAY GEOMETRIC DESIGN GUIDE
G-22 3R/4R GEOMETRIC DESIGN GUIDELINES
� ������&6#�'*�(���,'�!�- '�@��� ��',��&'�'! &�����"� �
The economic analysis used to justify the suggested traffic volumes ranges required to warrant grade-widening asshown on Figure G-1.1, is based on the principles set out in the Benefit-Costs Analysis, Summary, Guide and UserManual prepared by K. E. Howery, P.Eng. and Applications Management Consulting Ltd. for AlbertaInfrastructure, distributed in 1992. Because the above document is general in nature, some additional investigationinto collision rates, collision severity, construction costs, etc. was required for this economic analysis. The valuesadopted as a result of the investigation are documented in this appendix.
Alberta Infrastructure’ benefit-cost analysis guidelines suggest that an Internal Rate of Return (IRR) of at least fourpercent must be produced in the design life of an improvement for it to be considered cost effective. The IRR is anindicator of the economic viability of any project. The IRR is the discount rate at which the present value ofbenefits equals the present value of costs. As in any investment, the higher the rate of return, the better. However,any rate higher than the discount rate (four percent being generally used) shows economic feasibility.
The IRR for any proposed improvement is calculated based on incremental costs and benefits that would resultfrom the improvement. For example, on an existing paved highway which is scheduled for pavementrehabilitation, the very minimum amount of work that may be required could be a pavement overlay. Thepavement overlay will result in certain costs and benefits. The proposed improvement may be realignment, grade-widening or something else. The improvement will result in some costs and benefits which should be calculatedover the life of the improvement. The costs and benefits that are used in the analysis are the net values resultingfrom the improvement; that is, the additional construction costs, the reduced road user costs and other additionalbenefits to society. The stream of costs and benefits used in the analysis may be extended to 50 years. However,the key indicator of economic feasibility is the IRR at the end of the design life of the improvement. This isgenerally the twentieth year, or sooner in some cases.
Alberta InfrastructureHIGHWAY GEOMETRIC DESIGN GUIDE APRIL 1995
3R/4R GEOMETRIC DESIGN GUIDELINES G-23
� ��������&*��- '��',��'�-�
The incremental costs for grade-widening on existing paved roads are calculated based on the current practice fortreatment of those projects. Current practice is to first determine if grade-widening or other geometricimprovements are required. If no major improvements are required, the existing sideslope ratio is checked foradequate slope using the 3R/4R Geometric Design Guidelines. Generally if the existing sideslope is 3:1 or steeper,the slope will be improved to 4:1 if the AADT is at least 300 or flatter where appropriate for higher volumes. Onsome projects even where the existing slope is 4:1, it may be necessary or desirable to include sideslopeimprovement in the overlay project to preserve the pavement surface width and provide a flat roadside area thatis appropriate for the traffic volume.
Based on the above considerations, the cost of an overlay without grade-widening is calculated. This is the basecase or do-nothing alternative (alternative 1) for economic analysis purposes. The cost for grade-widening(alternative 2) which includes overlay, sideslope improvement, etc. is then calculated. An average cost for grade-widening to both sides and one side is used in the analysis.
The costs for each alternative are all inclusive project costs i.e. including engineering, materials, right of way,contract, etc. For each alternative, a stream of capital costs is developed for each year, starting from the year ofconstruction and extending to year 50 (or longer if necessary). This is necessary because the grade-widening mayresult in higher capital costs in future years due to the wider pavement that will need to be overlayed in 20-yearcycles (approximately).
The capital cost difference for each year is calculated by comparing the costs for alternatives 1 and 2. This is easilydone using a standardized Lotus spreadsheet, a copy of which is shown in this appendix.
Alberta InfrastructureAPRIL 1995 HIGHWAY GEOMETRIC DESIGN GUIDE
G-24 3R/4R GEOMETRIC DESIGN GUIDELINES
� ���+����&*��- '��',����, -�
The benefits used in this economic analysis for grade-widening are based on safety only. In particular the benefitsare calculated based on a reduced collision rate that can be expected after widening, and a reduced collisionseverity for run-off-road collisions that should result due to the flatter sideslope, wider ditch and flatter backslope.The change in collision severity is used only if the sideslope ratio is different in one alternative compared to theother.
Frequently, other geometric improvements such as improvements to horizontal or vertical alignment orintersections, are included with grade-widening. However, because the additional costs associated with thoseimprovements are not included here, the benefits are also not included.
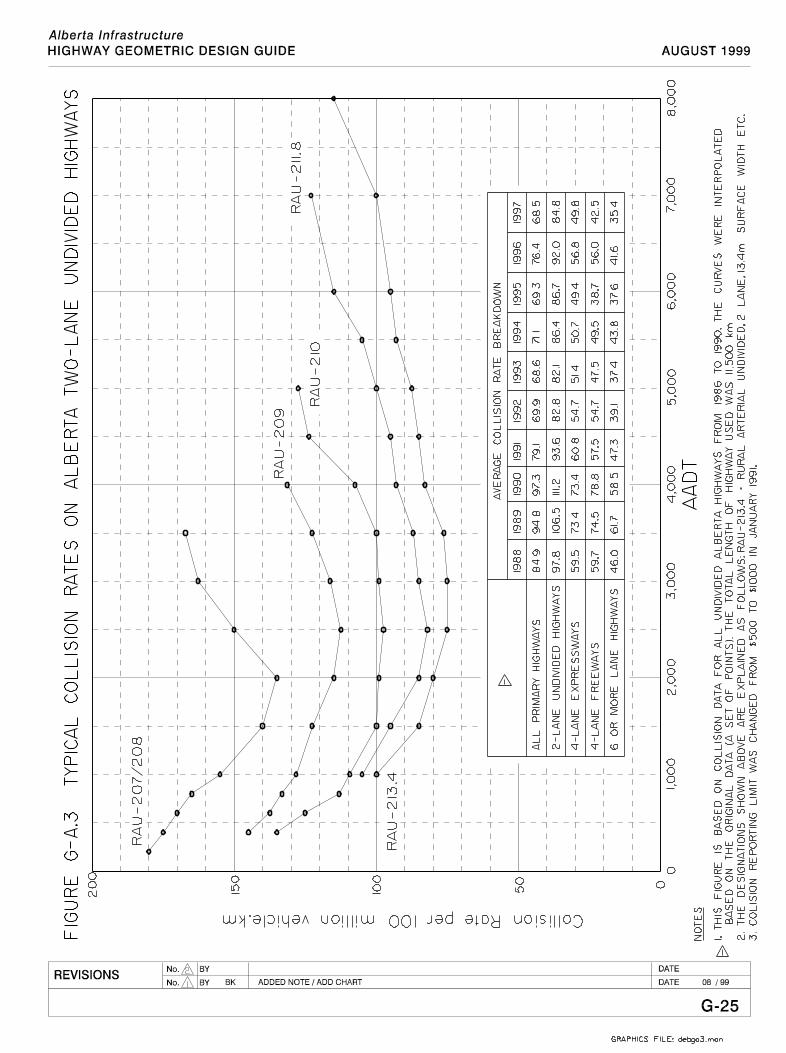
The collision rate for each roadway used in this analysis has been based on the average collision experience onAlberta primary highways from 1986 to 1990. The information has been obtained from collision records compiledby Motor Transport Services and is summarized in Figure G-A.3. The average collision rates computed over thefive-year period for each shoulder width were plotted based on traffic volumes. The initial plots for each roadwaywidth produced a set of points. A smooth curve was interpolated to represent each set of points. The interpolationwas not strictly scientific, but rather was based on application of engineering judgement to the data available foreach volume and width.
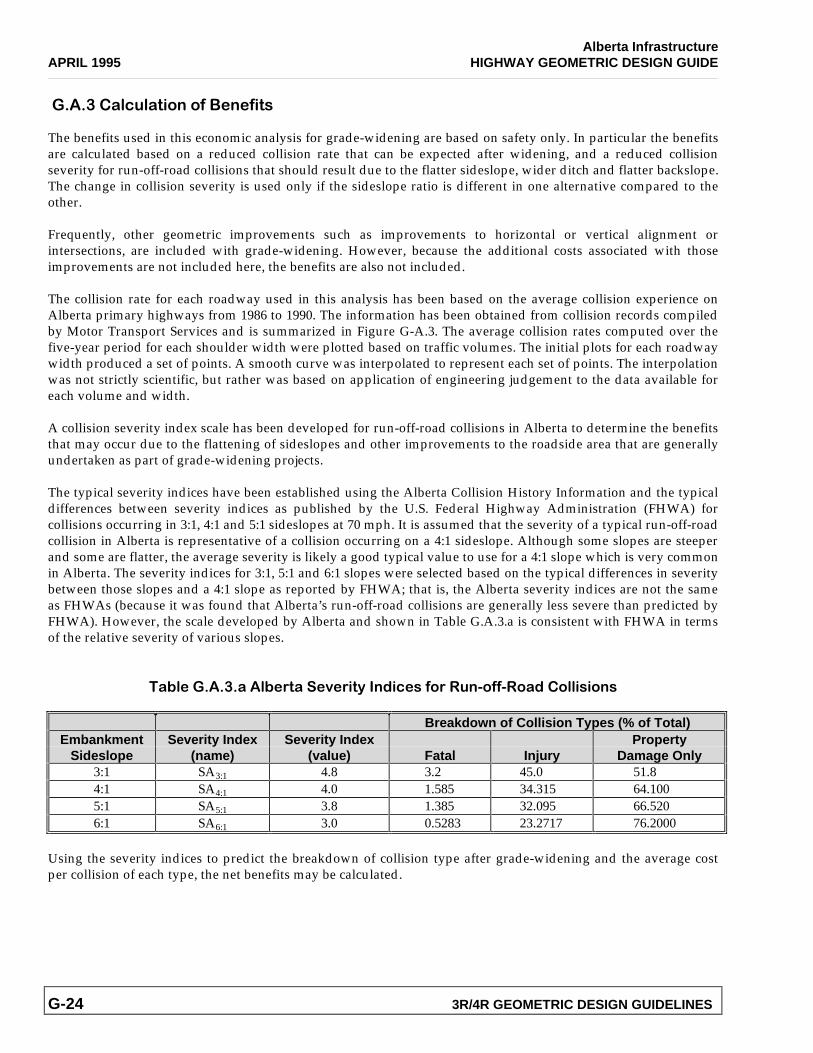
A collision severity index scale has been developed for run-off-road collisions in Alberta to determine the benefitsthat may occur due to the flattening of sideslopes and other improvements to the roadside area that are generallyundertaken as part of grade-widening projects.
The typical severity indices have been established using the Alberta Collision History Information and the typicaldifferences between severity indices as published by the U.S. Federal Highway Administration (FHWA) forcollisions occurring in 3:1, 4:1 and 5:1 sideslopes at 70 mph. It is assumed that the severity of a typical run-off-roadcollision in Alberta is representative of a collision occurring on a 4:1 sideslope. Although some slopes are steeperand some are flatter, the average severity is likely a good typical value to use for a 4:1 slope which is very commonin Alberta. The severity indices for 3:1, 5:1 and 6:1 slopes were selected based on the typical differences in severitybetween those slopes and a 4:1 slope as reported by FHWA; that is, the Alberta severity indices are not the sameas FHWAs (because it was found that Alberta’s run-off-road collisions are generally less severe than predicted byFHWA). However, the scale developed by Alberta and shown in Table G.A.3.a is consistent with FHWA in termsof the relative severity of various slopes.
��3��� ���+�����3��-���2�� -"���( &���,'���*��',,��'�(��'�� � '��
Breakdown of Collision Types (% of Total)Embankment Severity Index Severity Index Property
Sideslope (name) (value) Fatal Injury Damage Only3:1 SA3:1 4.8 3.2 45.0 51.84:1 SA4:1 4.0 1.585 34.315 64.1005:1 SA5:1 3.8 1.385 32.095 66.5206:1 SA6:1 3.0 0.5283 23.2717 76.2000
Using the severity indices to predict the breakdown of collision type after grade-widening and the average costper collision of each type, the net benefits may be calculated.
Alberta InfrastructureAPRIL 1995 HIGHWAY GEOMETRIC DESIGN GUIDE
G-26 3R/4R GEOMETRIC DESIGN GUIDELINES
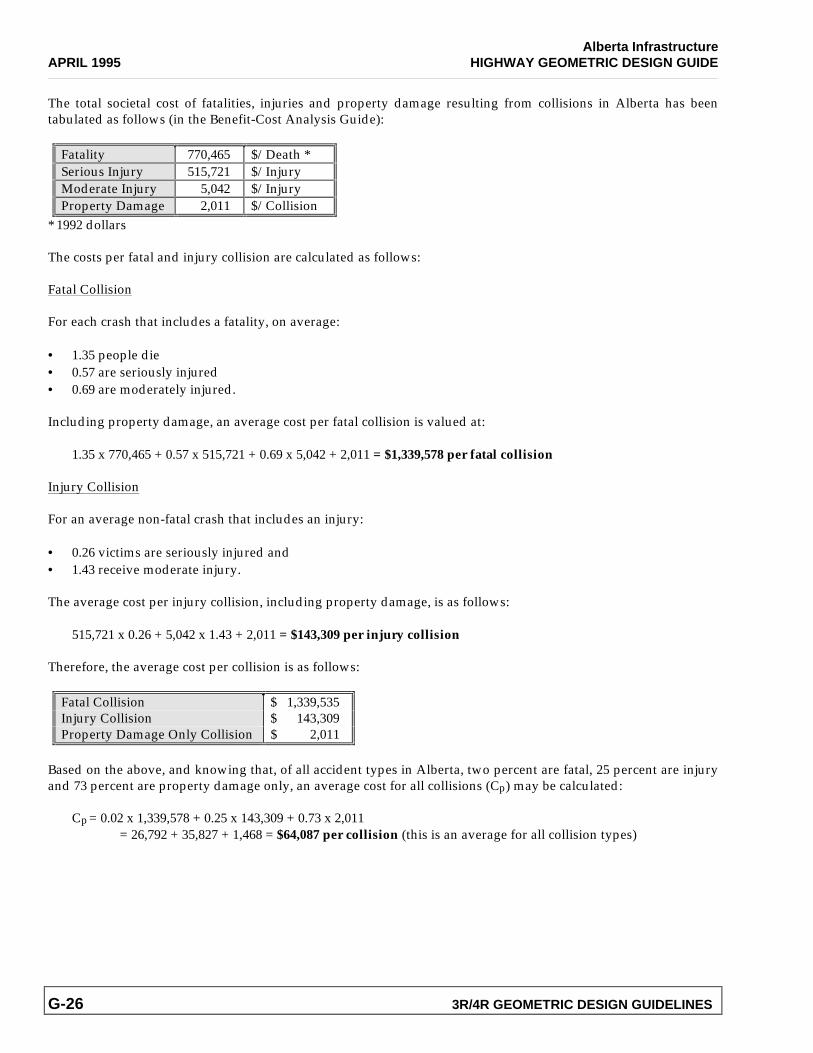
The total societal cost of fatalities, injuries and property damage resulting from collisions in Alberta has beentabulated as follows (in the Benefit-Cost Analysis Guide):
Fatality 770,465 $/Death *Serious Injury 515,721 $/InjuryModerate Injury 5,042 $/InjuryProperty Damage 2,011 $/Collision
* 1992 dollars
The costs per fatal and injury collision are calculated as follows:
Fatal Collision
For each crash that includes a fatality, on average:
• 1.35 people die• 0.57 are seriously injured• 0.69 are moderately injured.
Including property damage, an average cost per fatal collision is valued at:
1.35 x 770,465 + 0.57 x 515,721 + 0.69 x 5,042 + 2,011 = $1,339,578 per fatal collision
Injury Collision
For an average non-fatal crash that includes an injury:
• 0.26 victims are seriously injured and• 1.43 receive moderate injury.
The average cost per injury collision, including property damage, is as follows:
515,721 x 0.26 + 5,042 x 1.43 + 2,011 = $143,309 per injury collision
Therefore, the average cost per collision is as follows:
Fatal Collision $ 1,339,535Injury Collision $ 143,309Property Damage Only Collision $ 2,011
Based on the above, and knowing that, of all accident types in Alberta, two percent are fatal, 25 percent are injuryand 73 percent are property damage only, an average cost for all collisions (Cp) may be calculated:
Cp= 0.02 x 1,339,578 + 0.25 x 143,309 + 0.73 x 2,011= 26,792 + 35,827 + 1,468 = $64,087 per collision (this is an average for all collision types)
Alberta InfrastructureHIGHWAY GEOMETRIC DESIGN GUIDE APRIL 1995
3R/4R GEOMETRIC DESIGN GUIDELINES G-27
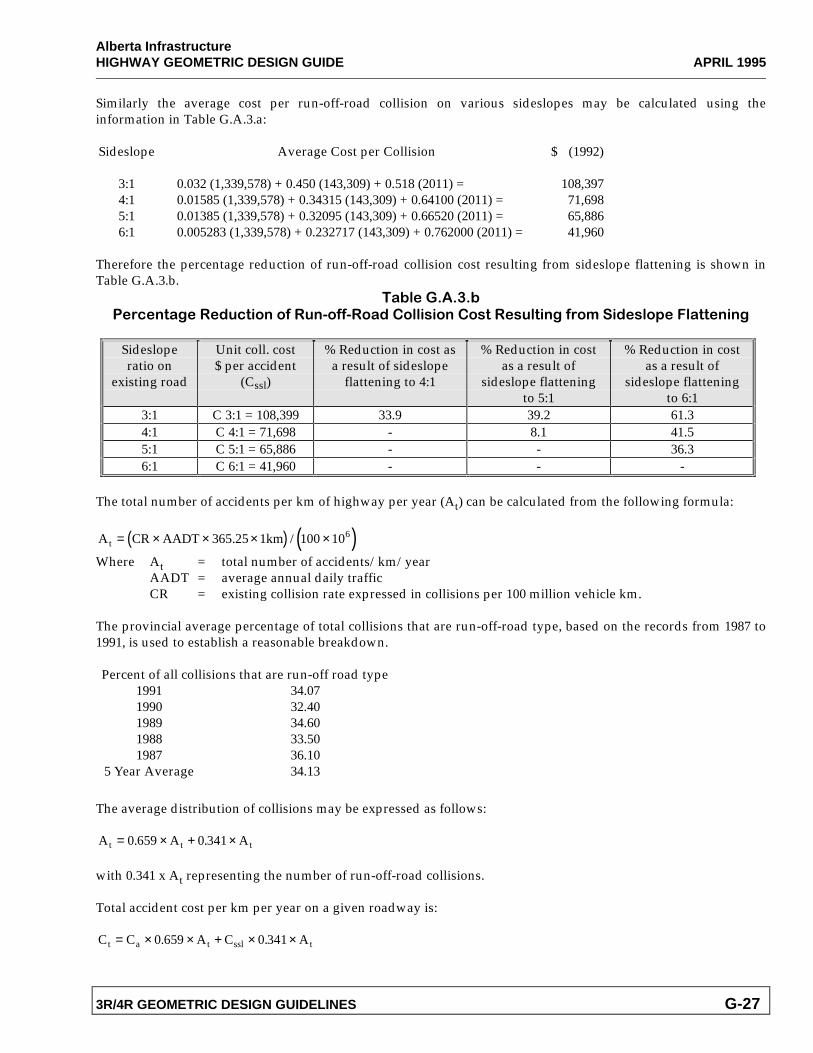
Similarly the average cost per run-off-road collision on various sideslopes may be calculated using theinformation in Table G.A.3.a:
Sideslope Average Cost per Collision $ (1992)
3:1 0.032 (1,339,578) + 0.450 (143,309) + 0.518 (2011) = 108,3974:1 0.01585 (1,339,578) + 0.34315 (143,309) + 0.64100 (2011) = 71,6985:1 0.01385 (1,339,578) + 0.32095 (143,309) + 0.66520 (2011) = 65,8866:1 0.005283 (1,339,578) + 0.232717 (143,309) + 0.762000 (2011) = 41,960
Therefore the percentage reduction of run-off-road collision cost resulting from sideslope flattening is shown inTable G.A.3.b.
��3��� ���+�3���&��-�#����(*&- '��',��*��',,��'�(��'�� � '���'�-����*�- �#�,�'!� (���'4�����--�� �#
Sidesloperatio on
existing road
Unit coll. cost$ per accident
(Cssl)
% Reduction in cost asa result of sideslope
flattening to 4:1
% Reduction in costas a result of
sideslope flatteningto 5:1
% Reduction in costas a result of
sideslope flatteningto 6:1
3:1 C 3:1 = 108,399 33.9 39.2 61.34:1 C 4:1 = 71,698 - 8.1 41.55:1 C 5:1 = 65,886 - - 36.36:1 C 6:1 = 41,960 - - -
The total number of accidents per km of highway per year (At) can be calculated from the following formula:
( ) ( )A CR AADT 365.25 1kmt = × × × ×/ 100 106
Where At = total number of accidents/km/yearAADT = average annual daily trafficCR = existing collision rate expressed in collisions per 100 million vehicle km.
The provincial average percentage of total collisions that are run-off-road type, based on the records from 1987 to1991, is used to establish a reasonable breakdown.
Percent of all collisions that are run-off road type1991 34.071990 32.401989 34.601988 33.501987 36.10
5 Year Average 34.13
The average distribution of collisions may be expressed as follows:
A A At t t= × + ×0 659 0 341. .
with 0.341 x At representing the number of run-off-road collisions.
Total accident cost per km per year on a given roadway is:
C C A C At a t ssl t= × × + × ×0 659 0 341. .
Alberta InfrastructureAPRIL 1995 HIGHWAY GEOMETRIC DESIGN GUIDE
G-28 3R/4R GEOMETRIC DESIGN GUIDELINES
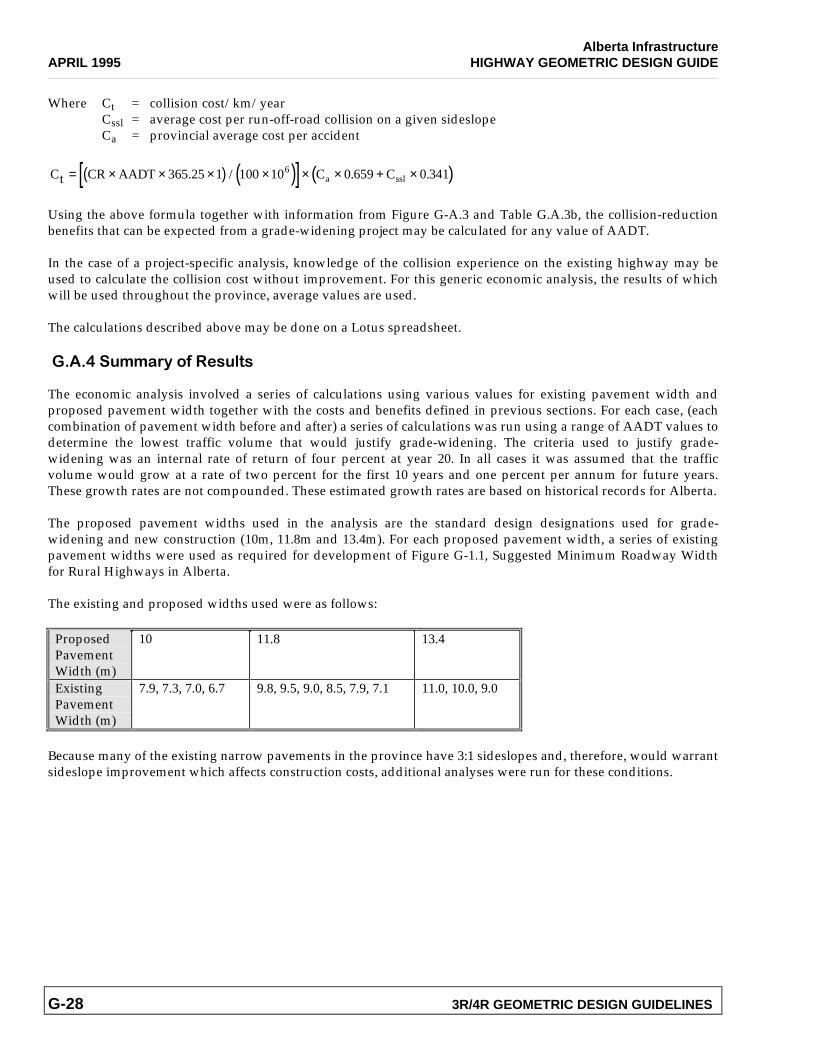
Where Ct = collision cost/km/yearCssl = average cost per run-off-road collision on a given sideslopeCa = provincial average cost per accident
( ) ( )[ ] ( )Ct CR AADT 365.25 1 100 10 C C6a ssl= × × × × × × + ×/ . .0 659 0 341
Using the above formula together with information from Figure G-A.3 and Table G.A.3b, the collision-reductionbenefits that can be expected from a grade-widening project may be calculated for any value of AADT.
In the case of a project-specific analysis, knowledge of the collision experience on the existing highway may beused to calculate the collision cost without improvement. For this generic economic analysis, the results of whichwill be used throughout the province, average values are used.
The calculations described above may be done on a Lotus spreadsheet.
� ���.�*!!��"�',����*�-�
The economic analysis involved a series of calculations using various values for existing pavement width andproposed pavement width together with the costs and benefits defined in previous sections. For each case, (eachcombination of pavement width before and after) a series of calculations was run using a range of AADT values todetermine the lowest traffic volume that would justify grade-widening. The criteria used to justify grade-widening was an internal rate of return of four percent at year 20. In all cases it was assumed that the trafficvolume would grow at a rate of two percent for the first 10 years and one percent per annum for future years.These growth rates are not compounded. These estimated growth rates are based on historical records for Alberta.
The proposed pavement widths used in the analysis are the standard design designations used for grade-widening and new construction (10m, 11.8m and 13.4m). For each proposed pavement width, a series of existingpavement widths were used as required for development of Figure G-1.1, Suggested Minimum Roadway Widthfor Rural Highways in Alberta.
The existing and proposed widths used were as follows:
ProposedPavementWidth (m)
10 11.8 13.4
ExistingPavementWidth (m)
7.9, 7.3, 7.0, 6.7 9.8, 9.5, 9.0, 8.5, 7.9, 7.1 11.0, 10.0, 9.0
Because many of the existing narrow pavements in the province have 3:1 sideslopes and, therefore, would warrantsideslope improvement which affects construction costs, additional analyses were run for these conditions.

Alberta InfrastructureHIGHWAY GEOMETRIC DESIGN GUIDE APRIL 1995
3R/4R GEOMETRIC DESIGN GUIDELINES G-29
The results of the economic analysis are summarised in Table G.A.5.1 below.
��3��� ���/���D �- �#��������;* ��(�-'�O*�- ,"� ��(��: (�� �#
Proposed Pavement Width (m)10.0 11.8 13.4
6.7 15707.0 1620
Existing 7.1 17827.3 1780
Sideslope 7.9 2080 19258.5 1980
4:1 9.0 2145 23009.5 24209.8 2500
Existing 10.0 267011.0 2875
Pavement 6.7 12907.0 1490
Width Existing 7.1 17207.3 1580
Sideslope 7.9 1930 18108.5 1875
3:1 9.0 19809.5 22109.8 2370
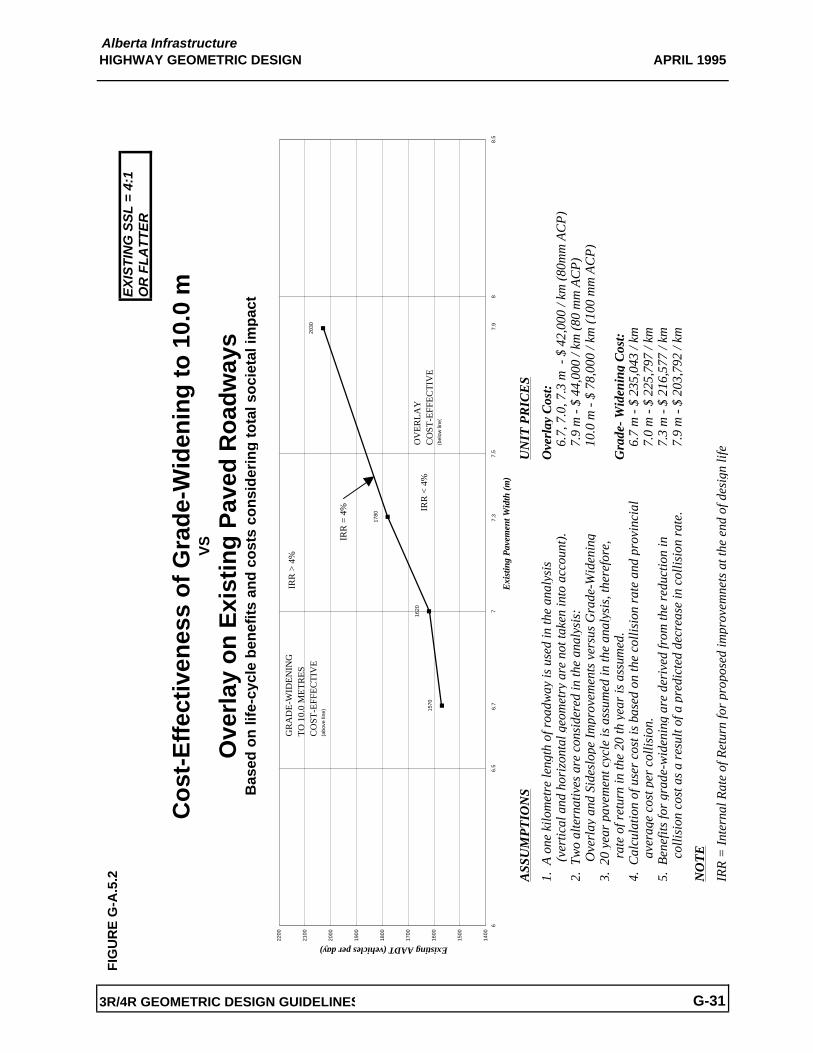
These results are shown graphically in Figures G-A.5.1 through G-A.5.5. Two sample Lotus spreadsheetsummaries are also included to illustrate the computations.

FIG
UR
E G
-A.5
.1
EX
IST
ING
SS
L =
3:1
OR
ST
EE
PE
R
ASS
UM
PT
ION
SU
NIT
PR
ICE
S
1. A
one
kilo
met
re le
ngth
of r
oadw
ay is
use
d in
the
anal
ysis
O
verl
ay C
ost:
(ver
tical
and
hor
izon
tal g
eom
etry
are
not
take
n in
to a
ccou
nt).
6
.7, 7
.0, 7
.3 m
- $
42,
000
/ km
(80m
m A
CP
) 2.
Tw
o al
tern
ativ
es a
re c
onsi
dere
d in
the
anal
ysis
:
7.9
m -
$ 4
4,00
0 / k
m (8
0 m
m A
CP
)
O
verl
ay a
nd S
ides
lope
Impr
ovem
ents
ver
sus
Gra
de-W
iden
ing
1
0.0
m -
$ 78
,000
/ km
(100
mm
AC
P)
3. 2
0 ye
ar p
avem
ent c
ycle
is a
ssum
ed in
the
anal
ysis
, the
refo
re,
rat
e of
ret
urn
in th
e 20
th y
ear
is a
ssum
ed.
Gra
de-W
iden
ing
Cos
t:4.
Cal
cula
tion
of u
ser
cost
is b
ased
on
the
colli
sion
rat
e an
d
6.7
m -
$ 2
35,0
43 /
km
p
rovi
ncia
l ave
rage
cos
t per
col
lisio
n.
7.0
m -
$ 2
25,7
97 /
km5.
Ben
efits
for
grad
e-w
iden
ing
are
deri
ved
from
the
redu
ctio
n in
7.3
m -
$ 2
16,5
77 /
km
c
ollis
ion
cost
as
a re
sult
of a
pre
dict
ed d
ecre
ase
in c
ollis
ion
rate
.
7.9
m -
$ 2
03,7
92 /
km
NO
TE
Side
slop
e Im
prov
emen
t Cos
t: $
20,
000
/ km
IRR
= In
tern
al R
ate
of R
etur
n fo
r pro
pose
d im
prov
emen
t at t
he e
nd o
f des
ign
life
3R/4R GEOMETRIC DESIGN GUIDELINES
Alberta InfrastructureHIGHWAY GEOMETRIC DESIGN GUIDE
G-30
Ove
rlay
on
Exi
stin
g P
aved
Ro
adw
ays
B
ased
on
life
-cyc
le b
enef
its
and
co
sts
con
sid
erin
g t
ota
l so
ciet
al im
pac
t
APRIL 1995
Co
st-E
ffec
tive
nes
s o
f G
rad
e-W
iden
ing
to
10.
0 m
VS
1490
1580
1930
1290
1200
1300
1400
1500
1600
1700
1800
1900
2000
2100
66.
57
7.5
88.
5
Exi
stin
g P
avem
ent W
idth
(m)
Existing AADT (vehicles per day)
OV
ERLA
YC
OST
-EFF
ECTI
VE
(bel
ow li
ne)
GR
AD
E-W
IDE
NIN
GT
O 1
0.0
ME
TR
ES
CO
ST-E
FFEC
TIV
E (a
bove
line
)
IRR
> 4
%
IRR
= 4
% IRR
< 4
%
6.7
7.3
7.9
FIG
UR
E G
-A.5
.2E
XIS
TIN
G S
SL
= 4
:1
OR
FL
AT
TE
R
ASS
UM
PT
ION
SU
NIT
PR
ICE
S
1. A
one
kilo
met
re le
ngth
of r
oadw
ay is
use
d in
the
anal
ysis
Ove
rlay
Cos
t:
(v
ertic
al a
nd h
oriz
onta
l geo
met
ry a
re n
ot ta
ken
into
acc
ount
).
6.7
, 7.0
, 7.3
m -
$ 4
2,00
0 / k
m (8
0mm
AC
P)
2. T
wo
alte
rnat
ives
are
con
side
red
in th
e an
alys
is:
7
.9 m
- $
44,0
00 /
km (8
0 m
m A
CP
)
O
verl
ay a
nd S
ides
lope
Impr
ovem
ents
ver
sus
Gra
de-W
iden
ing
1
0.0
m -
$ 78
,000
/ km
(100
mm
AC
P)
3. 2
0 ye
ar p
avem
ent c
ycle
is a
ssum
ed in
the
anal
ysis
, the
refo
re,
rat
e of
ret
urn
in th
e 20
th y
ear
is a
ssum
ed.
Gra
de- W
iden
ing
Cos
t:4.
Cal
cula
tion
of u
ser
cost
is b
ased
on
the
colli
sion
rat
e an
d pr
ovin
cial
6.7
m -
$ 23
5,04
3 / k
m
a
vera
ge c
ost p
er c
ollis
ion.
7
.0 m
- $
225,
797
/ km
5. B
enef
its fo
r gr
ade-
wid
enin
g ar
e de
rive
d fr
om th
e re
duct
ion
in
7
.3 m
- $
216,
577
/ km
col
lisio
n co
st a
s a
resu
lt of
a p
redi
cted
dec
reas
e in
col
lisio
n ra
te.
7
.9 m
- $
203,
792
/ km
NO
TE
IRR
= In
tern
al R
ate
of R
etur
n fo
r pr
opos
ed im
prov
emne
ts a
t the
end
of d
esig
n lif
e
G-313R/4R GEOMETRIC DESIGN GUIDELINES
Alberta InfrastructureHIGHWAY GEOMETRIC DESIGN
Co
st-E
ffec
tive
nes
s o
f G
rad
e-W
iden
ing
to
10.
0 m
VS
Ove
rlay
on
Exi
stin
g P
aved
Ro
adw
ays
Bas
ed o
n li
fe-c
ycle
ben
efit
s an
d c
ost
s co
nsi
der
ing
to
tal s
oci
etal
imp
act
APRIL 1995
1620
1780
2030
1570
1400
1500
1600
1700
1800
1900
2000
2100
2200
66.
57
7.5
88.
5
Exi
stin
g P
avem
ent W
idth
(m)
Existing AADT (vehicles per day)
OV
ER
LA
YC
OST
-EFF
EC
TIV
E(b
elow
line
)
GR
AD
E-W
IDE
NIN
GT
O 1
0.0
ME
TR
ES
CO
ST-E
FFE
CT
IVE
(abo
ve li
ne)
IRR
> 4
%
IRR
= 4
% IRR
< 4
%
6.7
7.3
7.9
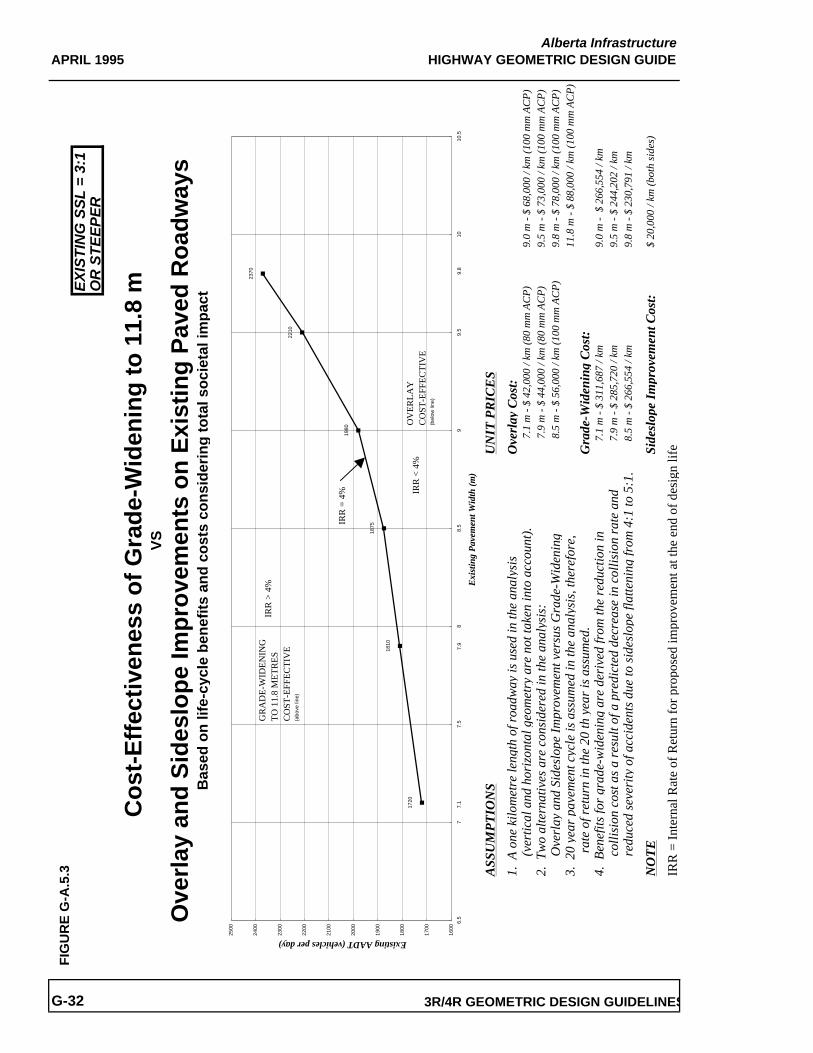
FIG
UR
E G
-A.5
.3E
XIS
TIN
G S
SL
= 3
:1O
R S
TE
EP
ER
ASS
UM
PT
ION
SU
NIT
PR
ICE
S
1. A
one
kilo
met
re le
ngth
of r
oadw
ay is
use
d in
the
anal
ysis
Ove
rlay
Cos
t:
(v
ertic
al a
nd h
oriz
onta
l geo
met
ry a
re n
ot ta
ken
into
acc
ount
).
7.
1 m
- $
42,0
00 /
km (8
0 m
m A
CP
)9.
0 m
- $
68,0
00 /
km (1
00 m
m A
CP
)2.
Tw
o al
tern
ativ
es a
re c
onsi
dere
d in
the
anal
ysis
:
7.
9 m
- $
44,0
00 /
km (8
0 m
m A
CP
)9.
5 m
- $
73,0
00 /
km (1
00 m
m A
CP
)
O
verl
ay a
nd S
ides
lope
Impr
ovem
ent v
ersu
s G
rade
-Wid
enin
g
8.
5 m
- $
56,0
00 /
km (1
00 m
m A
CP
)9.
8 m
- $
78,0
00 /
km (1
00 m
m A
CP
)3.
20
year
pav
emen
t cyc
le is
ass
umed
in th
e an
alys
is, t
here
fore
, 11
.8 m
- $
88,0
00 /
km (1
00 m
m A
CP
)
r
ate
of r
etur
n in
the
20 th
yea
r is
ass
umed
.G
rade
-Wid
enin
g C
ost:
4. B
enef
its fo
r gr
ade-
wid
enin
g ar
e de
rive
d fr
om th
e re
duct
ion
in
7
.1 m
- $
311,
687
/ km
9.0
m -
$ 2
66,5
54 /
km
co
llisi
on c
ost a
s a
resu
lt of
a p
redi
cted
dec
reas
e in
col
lisio
n ra
te a
nd
7
.9 m
- $
285,
720
/ km
9.5
m -
$ 24
4,20
2 / k
m
re
duce
d se
veri
ty o
f acc
iden
ts d
ue to
sid
eslo
pe fl
atte
ning
from
4:1
to 5
:1.
8
.5 m
- $
266,
554
/ km
9.8
m -
$ 23
0,79
1 / k
m
NO
TE
Side
slop
e Im
prov
emen
t Cos
t:$
20,0
00 /
km (b
oth
side
s)
IRR
= In
tern
al R
ate
of R
etur
n fo
r pro
pose
d im
prov
emen
t at t
he e
nd o
f des
ign
life
Alberta InfrastructureHIGHWAY GEOMETRIC DESIGN GUIDE
G-32 3R/4R GEOMETRIC DESIGN GUIDELINES
VS
Ove
rlay
an
d S
ides
lop
e Im
pro
vem
ents
on
Exi
stin
g P
aved
Ro
adw
ays
Bas
ed o
n li
fe-c
ycle
ben
efit
s an
d c
ost
s co
nsi
der
ing
to
tal s
oci
etal
imp
act
APRIL 1995
Co
st-E
ffec
tive
nes
s o
f G
rad
e-W
iden
ing
to
11.
8 m
1810
1875
1980
2210
2370
1720
1600
1700
1800
1900
2000
2100
2200
2300
2400
2500
6.5
77.
58
8.5
99.
510
10.5
Exi
stin
g P
avem
ent W
idth
(m)
Existing AADT (vehicles per day)
GR
AD
E-W
IDE
NIN
GTO
11.
8 M
ETR
ESC
OST
-EFF
ECTI
VE
(abo
ve li
ne)
IRR
> 4
%
OV
ER
LA
YC
OST
-EFF
ECTI
VE
(bel
ow li
ne)
IRR
= 4
% IRR
< 4
%
7.1
9.8
7.9
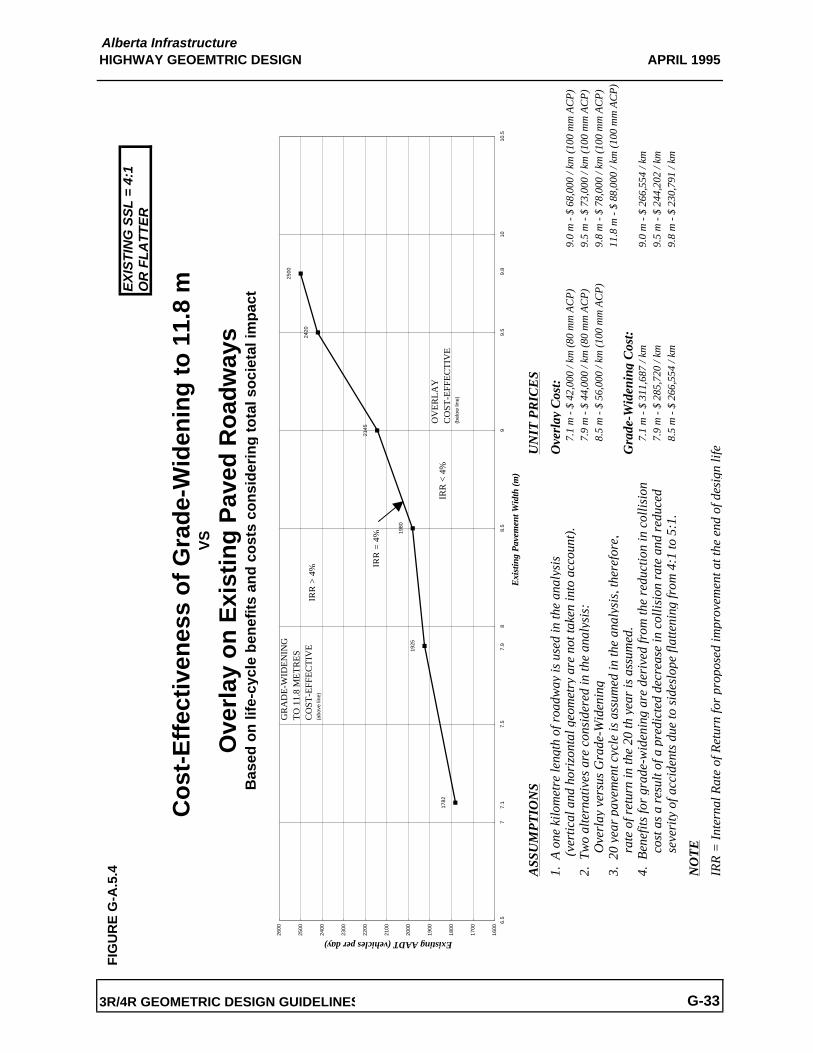
FIG
UR
E G
-A.5
.4E
XIS
TIN
G S
SL
= 4
:1O
R F
LA
TT
ER
ASS
UM
PT
ION
SU
NIT
PR
ICE
S
1. A
one
kilo
met
re le
ngth
of r
oadw
ay is
use
d in
the
anal
ysis
O
verl
ay C
ost:
(ver
tical
and
hor
izon
tal g
eom
etry
are
not
take
n in
to a
ccou
nt).
7
.1 m
- $
42,0
00 /
km (8
0 m
m A
CP
)9.
0 m
- $
68,0
00 /
km (1
00 m
m A
CP
)2.
Tw
o al
tern
ativ
es a
re c
onsi
dere
d in
the
anal
ysis
:
7.9
m -
$ 44
,000
/ km
(80
mm
AC
P)
9.5
m -
$ 73
,000
/ km
(100
mm
AC
P)
Ove
rlay
ver
sus
Gra
de-W
iden
ing
8
.5 m
- $
56,0
00 /
km (1
00 m
m A
CP
)9.
8 m
- $
78,0
00 /
km (1
00 m
m A
CP
)3.
20
year
pav
emen
t cyc
le is
ass
umed
in th
e an
alys
is, t
here
fore
,11
.8 m
- $
88,0
00 /
km (1
00 m
m A
CP
)
r
ate
of r
etur
n in
the
20 th
yea
r is
ass
umed
.G
rade
-Wid
enin
g C
ost:
4. B
enef
its fo
r gr
ade-
wid
enin
g ar
e de
rive
d fr
om th
e re
duct
ion
in c
ollis
ion
7
.1 m
- $
311,
687
/ km
9.0
m -
$ 26
6,55
4 / k
m
c
ost a
s a
resu
lt of
a p
redi
cted
dec
reas
e in
col
lisio
n ra
te a
nd r
educ
ed
7.9
m -
$ 28
5,72
0 / k
m9.
5 m
- $
244,
202
/ km
sev
erity
of a
ccid
ents
due
to s
ides
lope
flat
teni
ng fr
om 4
:1 to
5:1
.
8.5
m -
$ 26
6,55
4 / k
m9.
8 m
- $
230,
791
/ km
NO
TE
IRR
= In
tern
al R
ate
of R
etur
n fo
r pr
opos
ed im
prov
emen
t at t
he e
nd o
f des
ign
life
APRIL 1995Alberta InfrastructureHIGHWAY GEOEMTRIC DESIGN
3R/4R GEOMETRIC DESIGN GUIDELINES
Co
st-E
ffec
tive
nes
s o
f G
rad
e-W
iden
ing
to
11.
8 m
V
S
Ove
rlay
on
Exi
stin
g P
aved
Ro
adw
ays
Bas
ed o
n li
fe-c
ycle
ben
efit
s an
d c
ost
s co
nsi
der
ing
to
tal s
oci
etal
imp
act
G-33
1925
1980
2145
2420
2500
1782
1600
1700
1800
1900
2000
2100
2200
2300
2400
2500
2600
6.5
77.
58
8.5
99.
510
10.5
Exi
stin
g P
avem
ent W
idth
(m)
Existing AADT (vehicles per day)
GR
AD
E-W
IDE
NIN
GT
O 1
1.8
ME
TR
ES
CO
ST-E
FFE
CT
IVE
(abo
ve li
ne)
IRR
< 4
%O
VE
RL
AY
CO
ST-E
FFE
CT
IVE
(bel
ow li
ne)
IRR
= 4
%
IRR
> 4
%
9.8
7.9
7.1
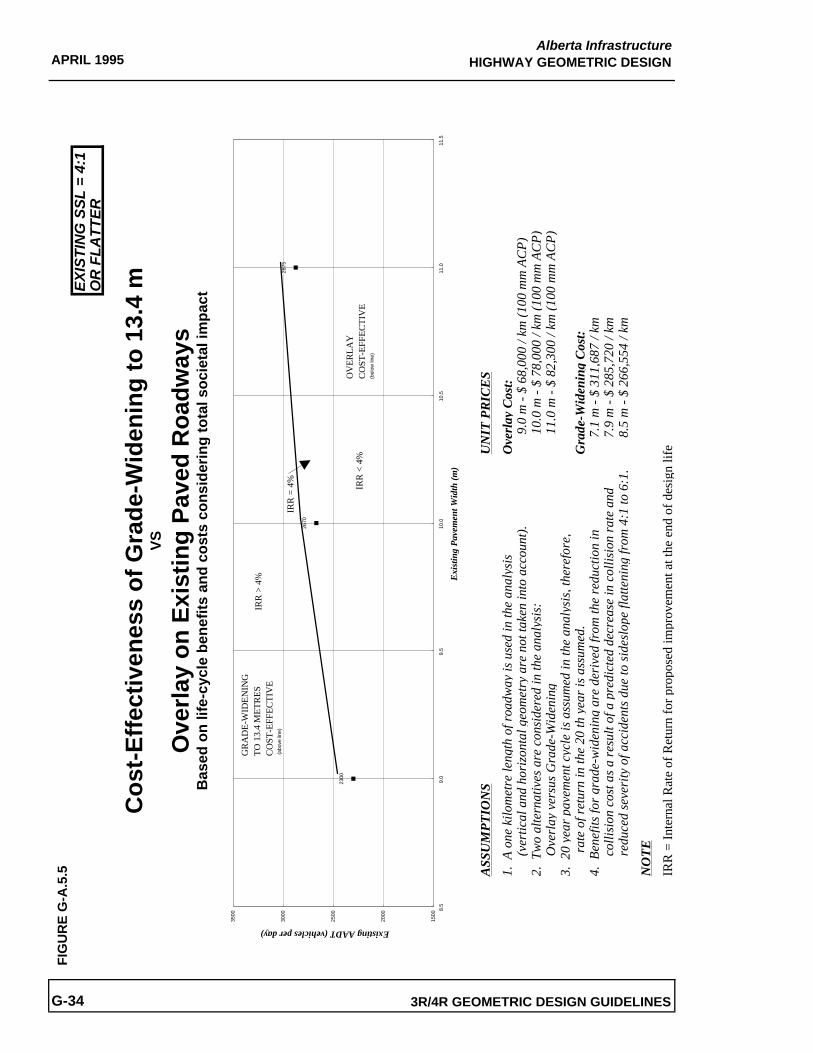
FIG
UR
E G
-A.5
.5E
XIS
TIN
G S
SL
= 4
:1O
R F
LA
TT
ER
ASS
UM
PT
ION
SU
NIT
PR
ICE
S
1. A
one
kilo
met
re le
ngth
of r
oadw
ay is
use
d in
the
anal
ysis
Ove
rlay
Cos
t:
(v
ertic
al a
nd h
oriz
onta
l geo
met
ry a
re n
ot ta
ken
into
acc
ount
).
9.
0 m
- $
68,0
00 /
km (1
00 m
m A
CP
)2.
Tw
o al
tern
ativ
es a
re c
onsi
dere
d in
the
anal
ysis
:
10
.0 m
- $
78,0
00 /
km (1
00 m
m A
CP
)
O
verl
ay v
ersu
s G
rade
-Wid
enin
g
11
.0 m
- $
82,3
00 /
km (1
00 m
m A
CP
)3.
20
year
pav
emen
t cyc
le is
ass
umed
in th
e an
alys
is, t
here
fore
,
r
ate
of r
etur
n in
the
20 th
yea
r is
ass
umed
.G
rade
-Wid
enin
g C
ost:
4. B
enef
its fo
r gr
ade-
wid
enin
g ar
e de
rive
d fr
om th
e re
duct
ion
in
7
.1 m
- $
311,
687
/ km
colli
sion
cos
t as
a re
sult
of a
pre
dict
ed d
ecre
ase
in c
ollis
ion
rate
and
7.9
m -
$ 28
5,72
0 / k
m
re
duce
d se
veri
ty o
f acc
iden
ts d
ue to
sid
eslo
pe fl
atte
ning
from
4:1
to 6
:1.
8
.5 m
- $
266,
554
/ km
NO
TE
IRR
= In
tern
al R
ate
of R
etur
n fo
r pro
pose
d im
prov
emen
t at t
he e
nd o
f des
ign
life
G-34
APRIL 1995
Co
st-E
ffec
tive
nes
s o
f G
rad
e-W
iden
ing
to
13.
4 m
VS
3R/4R GEOMETRIC DESIGN GUIDELINES
Ove
rlay
on
Exi
stin
g P
aved
Ro
adw
ays
Bas
ed o
n li
fe-c
ycle
ben
efit
s an
d c
ost
s co
nsi
der
ing
to
tal s
oci
etal
imp
act
Alberta InfrastructureHIGHWAY GEOMETRIC DESIGN
2670
2875
2300
1500
2000
2500
3000
3500
8.5
9.0
9.5
10.0
10.5
11.0
11.5
Exi
stin
g P
avem
ent W
idth
(m)
Existing AADT (vehicles per day)
GR
AD
E-W
IDE
NIN
GT
O 1
3.4
ME
TR
ES
CO
ST-E
FFEC
TIV
E (a
bove
line
)
IRR
> 4
%
IRR
= 4
%
IRR
< 4
%O
VER
LAY
CO
ST-E
FFEC
TIV
E(b
elow
line
)
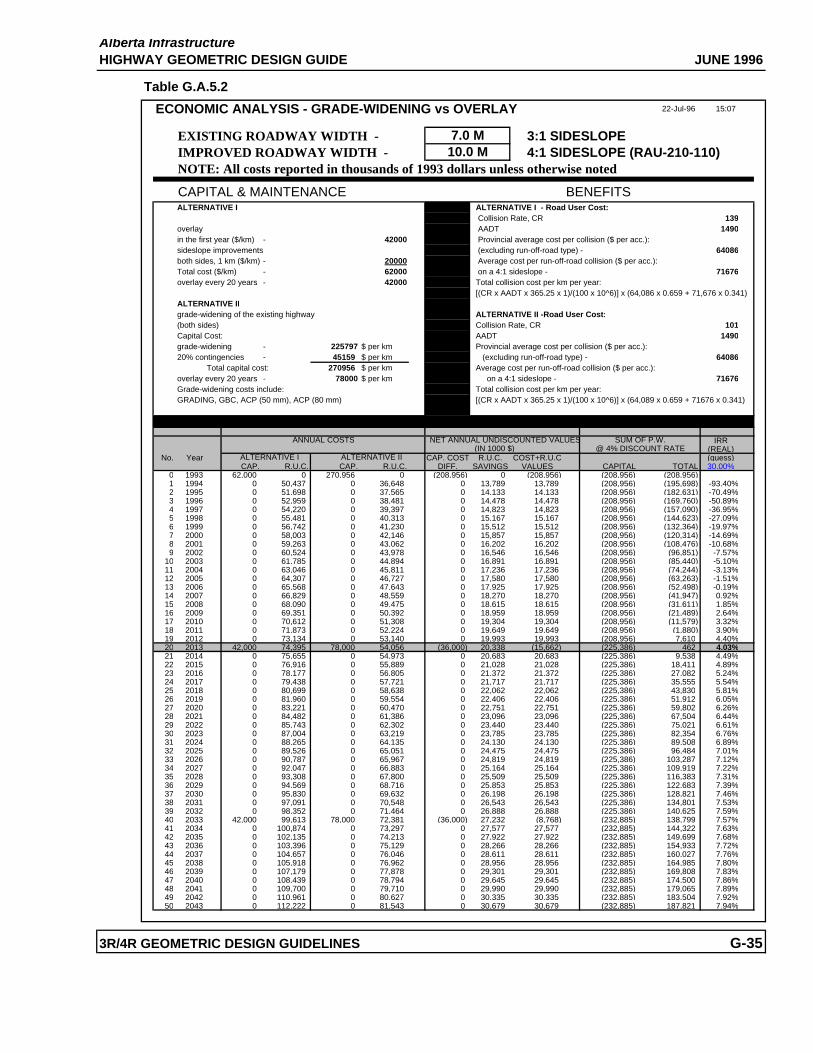
JUNE 1996
Table G.A.5.2
ECONOMIC ANALYSIS - GRADE-WIDENING vs OVERLAY 22-Jul-96 15:07
EXISTING ROADWAY WIDTH - 3:1 SIDESLOPEIMPROVED ROADWAY WIDTH - 4:1 SIDESLOPE (RAU-210-110)NOTE: All costs reported in thousands of 1993 dollars unless otherwise noted
CAPITAL & MAINTENANCE BENEFITSALTERNATIVE I ALTERNATIVE I - Road User Cost:
Collision Rate, CR 139overlay AADT 1490in the first year ($/km) - 42000 Provincial average cost per collision ($ per acc.):sideslope improvements (excluding run-off-road type) - 64086both sides, 1 km ($/km) - 20000 Average cost per run-off-road collision ($ per acc.):Total cost ($/km) - 62000 on a 4:1 sideslope - 71676overlay every 20 years - 42000 Total collision cost per km per year:
[(CR x AADT x 365.25 x 1)/(100 x 10^6)] x (64,086 x 0.659 + 71,676 x 0.341)ALTERNATIVE IIgrade-widening of the existing highway ALTERNATIVE II -Road User Cost:(both sides) Collision Rate, CR 101Capital Cost: AADT 1490grade-widening - 225797 $ per km Provincial average cost per collision ($ per acc.):20% contingencies - 45159 $ per km (excluding run-off-road type) - 64086
Total capital cost: 270956 $ per km Average cost per run-off-road collision ($ per acc.):overlay every 20 years - 78000 $ per km on a 4:1 sideslope - 71676Grade-widening costs include: Total collision cost per km per year:GRADING, GBC, ACP (50 mm), ACP (80 mm) [(CR x AADT x 365.25 x 1)/(100 x 10^6)] x (64,089 x 0.659 + 71676 x 0.341)
IRR(REAL)
No. Year CAP. COST R.U.C. COST+R.U.C (guess)CAP. R.U.C. CAP. R.U.C. DIFF. SAVINGS VALUES CAPITAL TOTAL 30.00%
0 1993 62,000 0 270,956 0 (208,956) 0 (208,956) (208,956) (208,956)1 1994 0 50,437 0 36,648 0 13,789 13,789 (208,956) (195,698) -93.40%2 1995 0 51,698 0 37,565 0 14,133 14,133 (208,956) (182,631) -70.49%3 1996 0 52,959 0 38,481 0 14,478 14,478 (208,956) (169,760) -50.89%4 1997 0 54,220 0 39,397 0 14,823 14,823 (208,956) (157,090) -36.95%5 1998 0 55,481 0 40,313 0 15,167 15,167 (208,956) (144,623) -27.09%6 1999 0 56,742 0 41,230 0 15,512 15,512 (208,956) (132,364) -19.97%7 2000 0 58,003 0 42,146 0 15,857 15,857 (208,956) (120,314) -14.69%8 2001 0 59,263 0 43,062 0 16,202 16,202 (208,956) (108,476) -10.68%9 2002 0 60,524 0 43,978 0 16,546 16,546 (208,956) (96,851) -7.57%
10 2003 0 61,785 0 44,894 0 16,891 16,891 (208,956) (85,440) -5.10%11 2004 0 63,046 0 45,811 0 17,236 17,236 (208,956) (74,244) -3.13%12 2005 0 64,307 0 46,727 0 17,580 17,580 (208,956) (63,263) -1.51%13 2006 0 65,568 0 47,643 0 17,925 17,925 (208,956) (52,498) -0.19%14 2007 0 66,829 0 48,559 0 18,270 18,270 (208,956) (41,947) 0.92%15 2008 0 68,090 0 49,475 0 18,615 18,615 (208,956) (31,611) 1.85%16 2009 0 69,351 0 50,392 0 18,959 18,959 (208,956) (21,489) 2.64%17 2010 0 70,612 0 51,308 0 19,304 19,304 (208,956) (11,579) 3.32%18 2011 0 71,873 0 52,224 0 19,649 19,649 (208,956) (1,880) 3.90%19 2012 0 73,134 0 53,140 0 19,993 19,993 (208,956) 7,610 4.40%20 2013 42,000 74,395 78,000 54,056 (36,000) 20,338 (15,662) (225,386) 462 4.03%21 2014 0 75,655 0 54,973 0 20,683 20,683 (225,386) 9,538 4.49%22 2015 0 76,916 0 55,889 0 21,028 21,028 (225,386) 18,411 4.89%23 2016 0 78,177 0 56,805 0 21,372 21,372 (225,386) 27,082 5.24%24 2017 0 79,438 0 57,721 0 21,717 21,717 (225,386) 35,555 5.54%25 2018 0 80,699 0 58,638 0 22,062 22,062 (225,386) 43,830 5.81%26 2019 0 81,960 0 59,554 0 22,406 22,406 (225,386) 51,912 6.05%27 2020 0 83,221 0 60,470 0 22,751 22,751 (225,386) 59,802 6.26%28 2021 0 84,482 0 61,386 0 23,096 23,096 (225,386) 67,504 6.44%29 2022 0 85,743 0 62,302 0 23,440 23,440 (225,386) 75,021 6.61%30 2023 0 87,004 0 63,219 0 23,785 23,785 (225,386) 82,354 6.76%31 2024 0 88,265 0 64,135 0 24,130 24,130 (225,386) 89,508 6.89%32 2025 0 89,526 0 65,051 0 24,475 24,475 (225,386) 96,484 7.01%33 2026 0 90,787 0 65,967 0 24,819 24,819 (225,386) 103,287 7.12%34 2027 0 92,047 0 66,883 0 25,164 25,164 (225,386) 109,919 7.22%35 2028 0 93,308 0 67,800 0 25,509 25,509 (225,386) 116,383 7.31%36 2029 0 94,569 0 68,716 0 25,853 25,853 (225,386) 122,683 7.39%37 2030 0 95,830 0 69,632 0 26,198 26,198 (225,386) 128,821 7.46%38 2031 0 97,091 0 70,548 0 26,543 26,543 (225,386) 134,801 7.53%39 2032 0 98,352 0 71,464 0 26,888 26,888 (225,386) 140,625 7.59%40 2033 42,000 99,613 78,000 72,381 (36,000) 27,232 (8,768) (232,885) 138,799 7.57%41 2034 0 100,874 0 73,297 0 27,577 27,577 (232,885) 144,322 7.63%42 2035 0 102,135 0 74,213 0 27,922 27,922 (232,885) 149,699 7.68%43 2036 0 103,396 0 75,129 0 28,266 28,266 (232,885) 154,933 7.72%44 2037 0 104,657 0 76,046 0 28,611 28,611 (232,885) 160,027 7.76%45 2038 0 105,918 0 76,962 0 28,956 28,956 (232,885) 164,985 7.80%46 2039 0 107,179 0 77,878 0 29,301 29,301 (232,885) 169,808 7.83%47 2040 0 108,439 0 78,794 0 29,645 29,645 (232,885) 174,500 7.86%48 2041 0 109,700 0 79,710 0 29,990 29,990 (232,885) 179,065 7.89%49 2042 0 110,961 0 80,627 0 30,335 30,335 (232,885) 183,504 7.92%50 2043 0 112,222 0 81,543 0 30,679 30,679 (232,885) 187,821 7.94%
3R/4R GEOMETRIC DESIGN GUIDELINES G-35
Alberta InfrastructureHIGHWAY GEOMETRIC DESIGN GUIDE
SUM OF P.W.@ 4% DISCOUNT RATE
ANNUAL COSTS
7.0 M10.0 M
ALTERNATIVE I ALTERNATIVE II
NET ANNUAL UNDISCOUNTED VALUES(IN 1000 $)
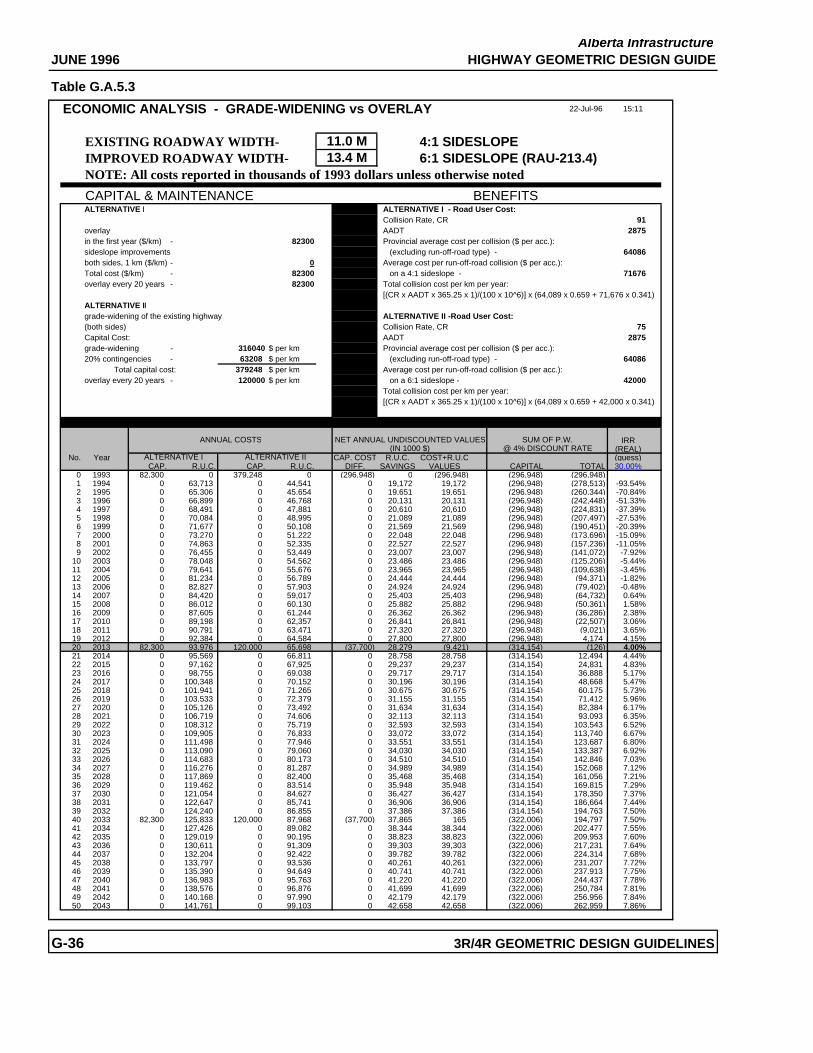
JUNE 1996
Table G.A.5.3
ECONOMIC ANALYSIS - GRADE-WIDENING vs OVERLAY 22-Jul-96 15:11
EXISTING ROADWAY WIDTH- 4:1 SIDESLOPEIMPROVED ROADWAY WIDTH- 6:1 SIDESLOPE (RAU-213.4)NOTE: All costs reported in thousands of 1993 dollars unless otherwise noted
CAPITAL & MAINTENANCE BENEFITSALTERNATIVE I ALTERNATIVE I - Road User Cost:
Collision Rate, CR 91overlay AADT 2875in the first year ($/km) - 82300 Provincial average cost per collision ($ per acc.):sideslope improvements (excluding run-off-road type) - 64086both sides, 1 km ($/km) - 0 Average cost per run-off-road collision ($ per acc.):Total cost ($/km) - 82300 on a 4:1 sideslope - 71676overlay every 20 years - 82300 Total collision cost per km per year:
[(CR x AADT x 365.25 x 1)/(100 x 10^6)] x (64,089 x 0.659 + 71,676 x 0.341)ALTERNATIVE IIgrade-widening of the existing highway ALTERNATIVE II -Road User Cost:(both sides) Collision Rate, CR 75Capital Cost: AADT 2875grade-widening - 316040 $ per km Provincial average cost per collision ($ per acc.):20% contingencies - 63208 $ per km (excluding run-off-road type) - 64086
Total capital cost: 379248 $ per km Average cost per run-off-road collision ($ per acc.):overlay every 20 years - 120000 $ per km on a 6:1 sideslope - 42000
Total collision cost per km per year: [(CR x AADT x 365.25 x 1)/(100 x 10^6)] x (64,089 x 0.659 + 42,000 x 0.341)
IRR(REAL)
No. Year CAP. COST R.U.C. COST+R.U.C (guess)CAP. R.U.C. CAP. R.U.C. DIFF. SAVINGS VALUES CAPITAL TOTAL 30.00%
0 1993 82,300 0 379,248 0 (296,948) 0 (296,948) (296,948) (296,948)1 1994 0 63,713 0 44,541 0 19,172 19,172 (296,948) (278,513) -93.54%2 1995 0 65,306 0 45,654 0 19,651 19,651 (296,948) (260,344) -70.84%3 1996 0 66,899 0 46,768 0 20,131 20,131 (296,948) (242,448) -51.33%4 1997 0 68,491 0 47,881 0 20,610 20,610 (296,948) (224,831) -37.39%5 1998 0 70,084 0 48,995 0 21,089 21,089 (296,948) (207,497) -27.53%6 1999 0 71,677 0 50,108 0 21,569 21,569 (296,948) (190,451) -20.39%7 2000 0 73,270 0 51,222 0 22,048 22,048 (296,948) (173,696) -15.09%8 2001 0 74,863 0 52,335 0 22,527 22,527 (296,948) (157,236) -11.05%9 2002 0 76,455 0 53,449 0 23,007 23,007 (296,948) (141,072) -7.92%
10 2003 0 78,048 0 54,562 0 23,486 23,486 (296,948) (125,206) -5.44%11 2004 0 79,641 0 55,676 0 23,965 23,965 (296,948) (109,638) -3.45%12 2005 0 81,234 0 56,789 0 24,444 24,444 (296,948) (94,371) -1.82%13 2006 0 82,827 0 57,903 0 24,924 24,924 (296,948) (79,402) -0.48%14 2007 0 84,420 0 59,017 0 25,403 25,403 (296,948) (64,732) 0.64%15 2008 0 86,012 0 60,130 0 25,882 25,882 (296,948) (50,361) 1.58%16 2009 0 87,605 0 61,244 0 26,362 26,362 (296,948) (36,286) 2.38%17 2010 0 89,198 0 62,357 0 26,841 26,841 (296,948) (22,507) 3.06%18 2011 0 90,791 0 63,471 0 27,320 27,320 (296,948) (9,021) 3.65%19 2012 0 92,384 0 64,584 0 27,800 27,800 (296,948) 4,174 4.15%20 2013 82,300 93,976 120,000 65,698 (37,700) 28,279 (9,421) (314,154) (126) 4.00%21 2014 0 95,569 0 66,811 0 28,758 28,758 (314,154) 12,494 4.44%22 2015 0 97,162 0 67,925 0 29,237 29,237 (314,154) 24,831 4.83%23 2016 0 98,755 0 69,038 0 29,717 29,717 (314,154) 36,888 5.17%24 2017 0 100,348 0 70,152 0 30,196 30,196 (314,154) 48,668 5.47%25 2018 0 101,941 0 71,265 0 30,675 30,675 (314,154) 60,175 5.73%26 2019 0 103,533 0 72,379 0 31,155 31,155 (314,154) 71,412 5.96%27 2020 0 105,126 0 73,492 0 31,634 31,634 (314,154) 82,384 6.17%28 2021 0 106,719 0 74,606 0 32,113 32,113 (314,154) 93,093 6.35%29 2022 0 108,312 0 75,719 0 32,593 32,593 (314,154) 103,543 6.52%30 2023 0 109,905 0 76,833 0 33,072 33,072 (314,154) 113,740 6.67%31 2024 0 111,498 0 77,946 0 33,551 33,551 (314,154) 123,687 6.80%32 2025 0 113,090 0 79,060 0 34,030 34,030 (314,154) 133,387 6.92%33 2026 0 114,683 0 80,173 0 34,510 34,510 (314,154) 142,846 7.03%34 2027 0 116,276 0 81,287 0 34,989 34,989 (314,154) 152,068 7.12%35 2028 0 117,869 0 82,400 0 35,468 35,468 (314,154) 161,056 7.21%36 2029 0 119,462 0 83,514 0 35,948 35,948 (314,154) 169,815 7.29%37 2030 0 121,054 0 84,627 0 36,427 36,427 (314,154) 178,350 7.37%38 2031 0 122,647 0 85,741 0 36,906 36,906 (314,154) 186,664 7.44%39 2032 0 124,240 0 86,855 0 37,386 37,386 (314,154) 194,763 7.50%40 2033 82,300 125,833 120,000 87,968 (37,700) 37,865 165 (322,006) 194,797 7.50%41 2034 0 127,426 0 89,082 0 38,344 38,344 (322,006) 202,477 7.55%42 2035 0 129,019 0 90,195 0 38,823 38,823 (322,006) 209,953 7.60%43 2036 0 130,611 0 91,309 0 39,303 39,303 (322,006) 217,231 7.64%44 2037 0 132,204 0 92,422 0 39,782 39,782 (322,006) 224,314 7.68%45 2038 0 133,797 0 93,536 0 40,261 40,261 (322,006) 231,207 7.72%46 2039 0 135,390 0 94,649 0 40,741 40,741 (322,006) 237,913 7.75%47 2040 0 136,983 0 95,763 0 41,220 41,220 (322,006) 244,437 7.78%48 2041 0 138,576 0 96,876 0 41,699 41,699 (322,006) 250,784 7.81%49 2042 0 140,168 0 97,990 0 42,179 42,179 (322,006) 256,956 7.84%50 2043 0 141,761 0 99,103 0 42,658 42,658 (322,006) 262,959 7.86%
G-36 3R/4R GEOMETRIC DESIGN GUIDELINES
ANNUAL COSTS
Alberta InfrastructureHIGHWAY GEOMETRIC DESIGN GUIDE
11.0 M13.4 M
NET ANNUAL UNDISCOUNTED VALUES SUM OF P.W.@ 4% DISCOUNT RATE(IN 1000 $)
ALTERNATIVE I ALTERNATIVE II
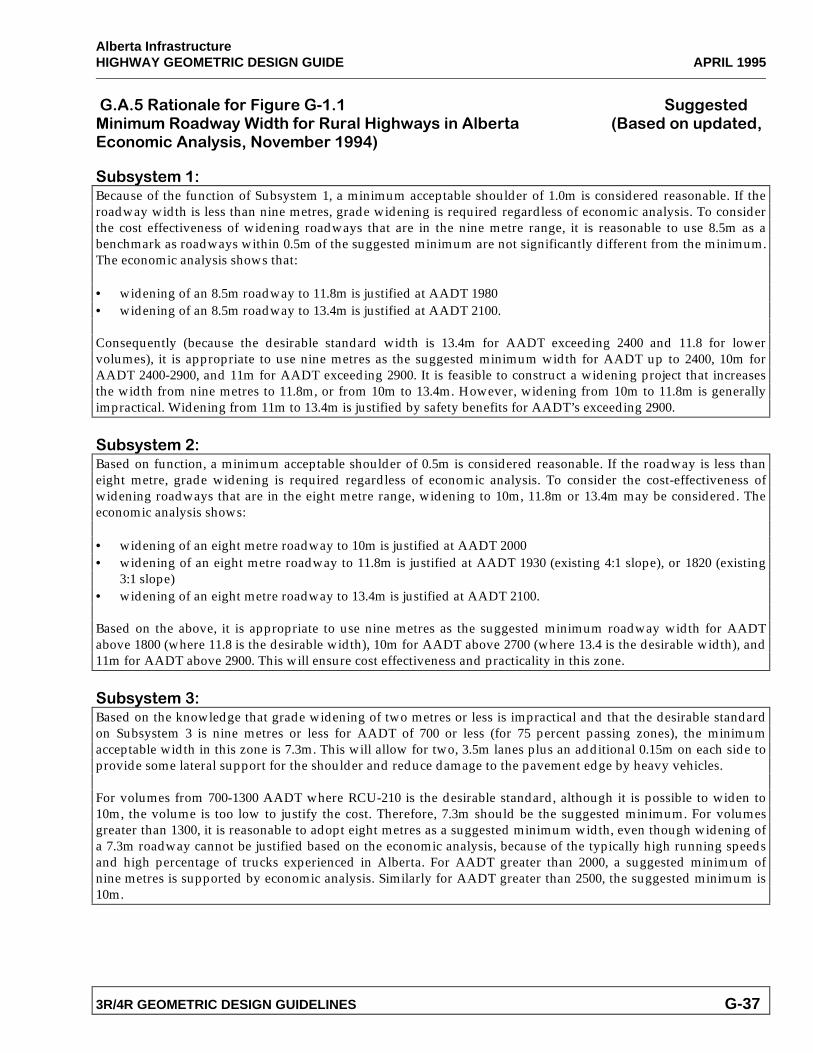
Alberta InfrastructureHIGHWAY GEOMETRIC DESIGN GUIDE APRIL 1995
3R/4R GEOMETRIC DESIGN GUIDELINES G-37
� ���/���- '�����,'��� #*��� ������������������������������������������������������������������������������������*##��-�(� � !*!��'�(%�"�: (-$�,'���*����� #$%�"�� ����3��-������������������������=���(�'��*4(�-�(B�&'�'! &�����"� �B��'2�!3����77.>
*3�"�-�!��@Because of the function of Subsystem 1, a minimum acceptable shoulder of 1.0m is considered reasonable. If theroadway width is less than nine metres, grade widening is required regardless of economic analysis. To considerthe cost effectiveness of widening roadways that are in the nine metre range, it is reasonable to use 8.5m as abenchmark as roadways within 0.5m of the suggested minimum are not significantly different from the minimum.The economic analysis shows that:
• widening of an 8.5m roadway to 11.8m is justified at AADT 1980• widening of an 8.5m roadway to 13.4m is justified at AADT 2100.
Consequently (because the desirable standard width is 13.4m for AADT exceeding 2400 and 11.8 for lowervolumes), it is appropriate to use nine metres as the suggested minimum width for AADT up to 2400, 10m forAADT 2400-2900, and 11m for AADT exceeding 2900. It is feasible to construct a widening project that increasesthe width from nine metres to 11.8m, or from 10m to 13.4m. However, widening from 10m to 11.8m is generallyimpractical. Widening from 11m to 13.4m is justified by safety benefits for AADT’s exceeding 2900.
*3�"�-�!��@Based on function, a minimum acceptable shoulder of 0.5m is considered reasonable. If the roadway is less thaneight metre, grade widening is required regardless of economic analysis. To consider the cost-effectiveness ofwidening roadways that are in the eight metre range, widening to 10m, 11.8m or 13.4m may be considered. Theeconomic analysis shows:
• widening of an eight metre roadway to 10m is justified at AADT 2000• widening of an eight metre roadway to 11.8m is justified at AADT 1930 (existing 4:1 slope), or 1820 (existing
3:1 slope)• widening of an eight metre roadway to 13.4m is justified at AADT 2100.
Based on the above, it is appropriate to use nine metres as the suggested minimum roadway width for AADTabove 1800 (where 11.8 is the desirable width), 10m for AADT above 2700 (where 13.4 is the desirable width), and11m for AADT above 2900. This will ensure cost effectiveness and practicality in this zone.
*3�"�-�!�+@Based on the knowledge that grade widening of two metres or less is impractical and that the desirable standardon Subsystem 3 is nine metres or less for AADT of 700 or less (for 75 percent passing zones), the minimumacceptable width in this zone is 7.3m. This will allow for two, 3.5m lanes plus an additional 0.15m on each side toprovide some lateral support for the shoulder and reduce damage to the pavement edge by heavy vehicles.
For volumes from 700-1300 AADT where RCU-210 is the desirable standard, although it is possible to widen to10m, the volume is too low to justify the cost. Therefore, 7.3m should be the suggested minimum. For volumesgreater than 1300, it is reasonable to adopt eight metres as a suggested minimum width, even though widening ofa 7.3m roadway cannot be justified based on the economic analysis, because of the typically high running speedsand high percentage of trucks experienced in Alberta. For AADT greater than 2000, a suggested minimum ofnine metres is supported by economic analysis. Similarly for AADT greater than 2500, the suggested minimum is10m.
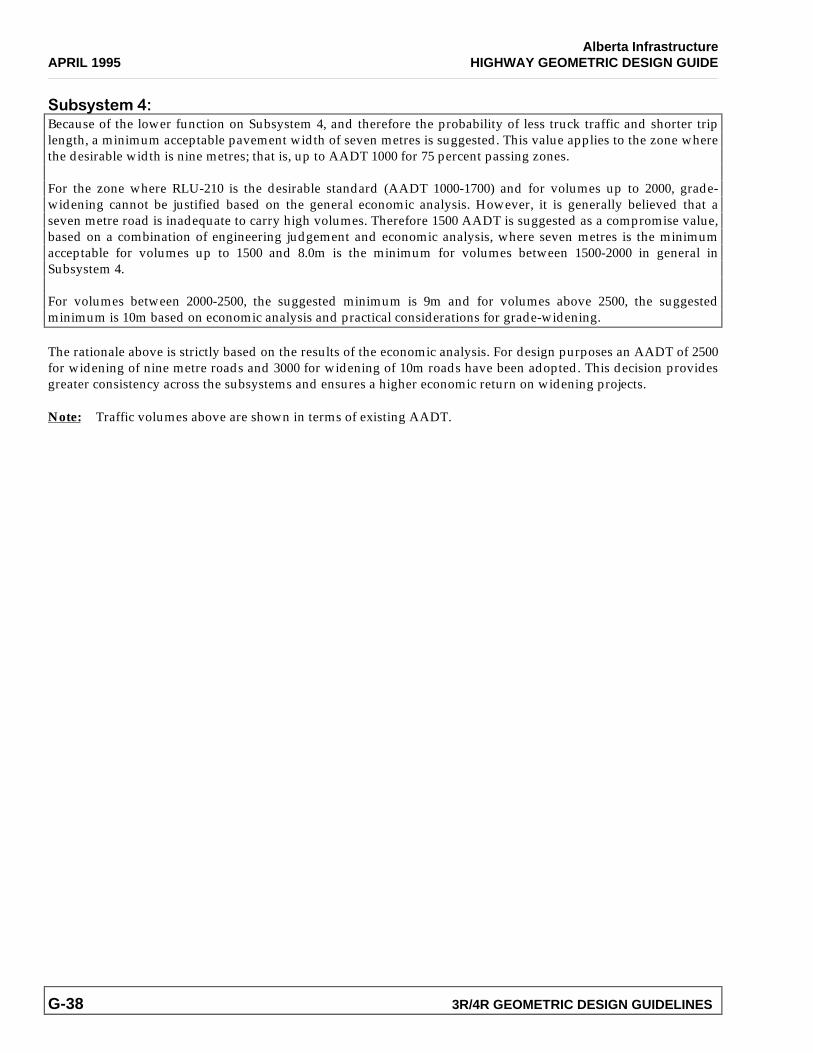
Alberta InfrastructureAPRIL 1995 HIGHWAY GEOMETRIC DESIGN GUIDE
G-38 3R/4R GEOMETRIC DESIGN GUIDELINES
*3�"�-�!�.@Because of the lower function on Subsystem 4, and therefore the probability of less truck traffic and shorter triplength, a minimum acceptable pavement width of seven metres is suggested. This value applies to the zone wherethe desirable width is nine metres; that is, up to AADT 1000 for 75 percent passing zones.
For the zone where RLU-210 is the desirable standard (AADT 1000-1700) and for volumes up to 2000, grade-widening cannot be justified based on the general economic analysis. However, it is generally believed that aseven metre road is inadequate to carry high volumes. Therefore 1500 AADT is suggested as a compromise value,based on a combination of engineering judgement and economic analysis, where seven metres is the minimumacceptable for volumes up to 1500 and 8.0m is the minimum for volumes between 1500-2000 in general inSubsystem 4.
For volumes between 2000-2500, the suggested minimum is 9m and for volumes above 2500, the suggestedminimum is 10m based on economic analysis and practical considerations for grade-widening.
The rationale above is strictly based on the results of the economic analysis. For design purposes an AADT of 2500for widening of nine metre roads and 3000 for widening of 10m roads have been adopted. This decision providesgreater consistency across the subsystems and ensures a higher economic return on widening projects.
Note: Traffic volumes above are shown in terms of existing AADT.

Alberta InfrastructureHIGHWAY GEOMETRIC DESIGN GUIDE JUNE 1996
3R/4R GEOMETRIC DESIGN GUIDELINES G-39
�������I�
� �I���������������������������������C�����������������������
This appendix presents an example of an economic analysis for a horizontal curve improvement on a particularproject. The 3R/4R Geometric Design Guidelines suggest that a project specific analysis be undertaken todetermine the cost effectiveness of any proposed horizontal realignments. This example is provided to illustratethe process required.
This appendix is divided into the following sections:
G.B.1. Data Collected for the AnalysisG.B.2. Construction and Maintenance Costs for Both Alternatives (do nothing versus alignment improvement)G.B.3. Calculation of Collision Rates for Both AlternativesG.B.4. Calculation of Road User Costs for Existing and Proposed AlignmentG.B.5. Economic Analysis using Lotus Module Benefit-Cost.
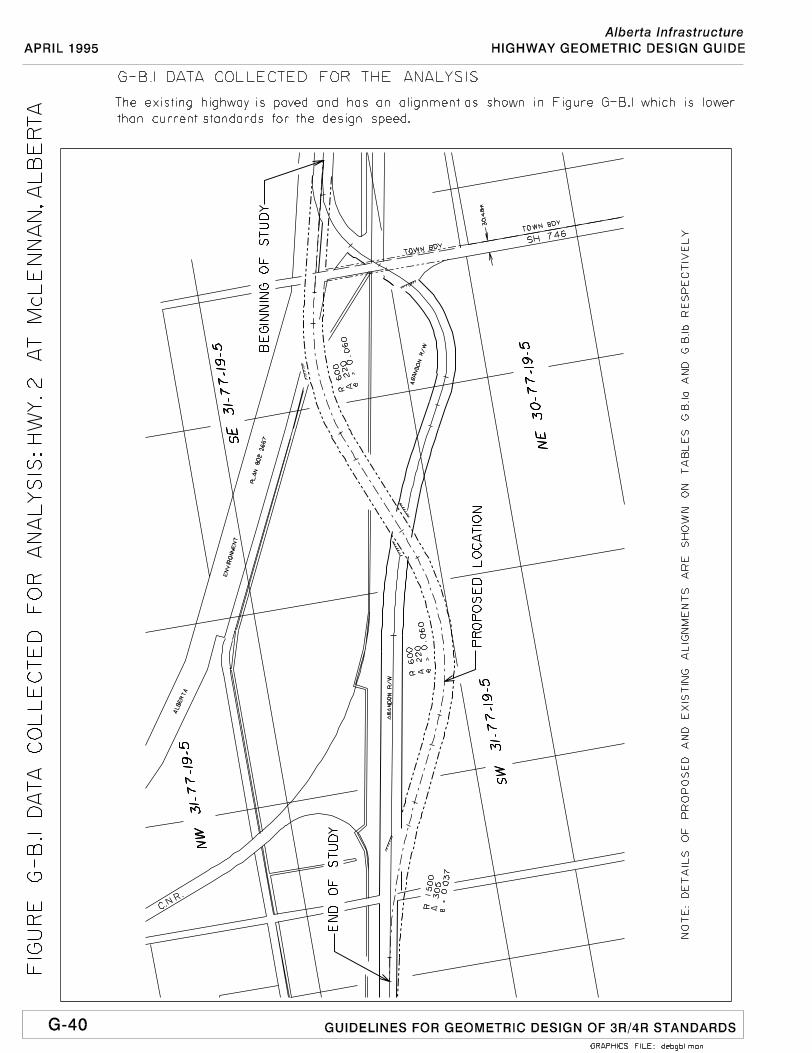
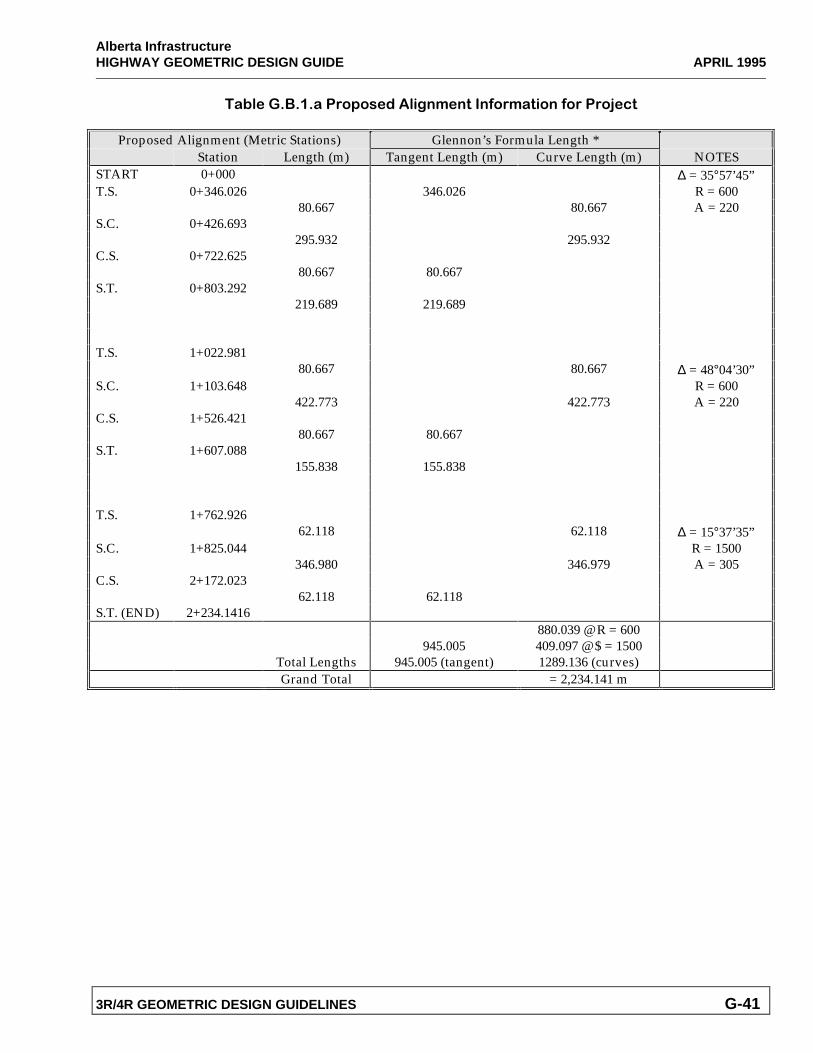
Alberta InfrastructureHIGHWAY GEOMETRIC DESIGN GUIDE APRIL 1995
3R/4R GEOMETRIC DESIGN GUIDELINES G-41
��3��� ��������'4'��(��� #�!��-���,'�!�- '��,'����'1�&-
Proposed Alignment (Metric Stations) Glennon’s Formula Length *Station Length (m) Tangent Length (m) Curve Length (m) NOTES
START 0+000 ∆ = 35°57’45”T.S. 0+346.026 346.026 R = 600
80.667 80.667 A = 220S.C. 0+426.693
295.932 295.932C.S. 0+722.625
80.667 80.667S.T. 0+803.292
219.689 219.689
T.S. 1+022.98180.667 80.667 ∆ = 48°04’30”
S.C. 1+103.648 R = 600422.773 422.773 A = 220
C.S. 1+526.42180.667 80.667
S.T. 1+607.088155.838 155.838
T.S. 1+762.92662.118 62.118 ∆ = 15°37’35”
S.C. 1+825.044 R = 1500346.980 346.979 A = 305
C.S. 2+172.02362.118 62.118
S.T. (END) 2+234.1416880.039 @ R = 600
945.005 409.097 @ $ = 1500Total Lengths 945.005 (tangent) 1289.136 (curves)Grand Total = 2,234.141 m
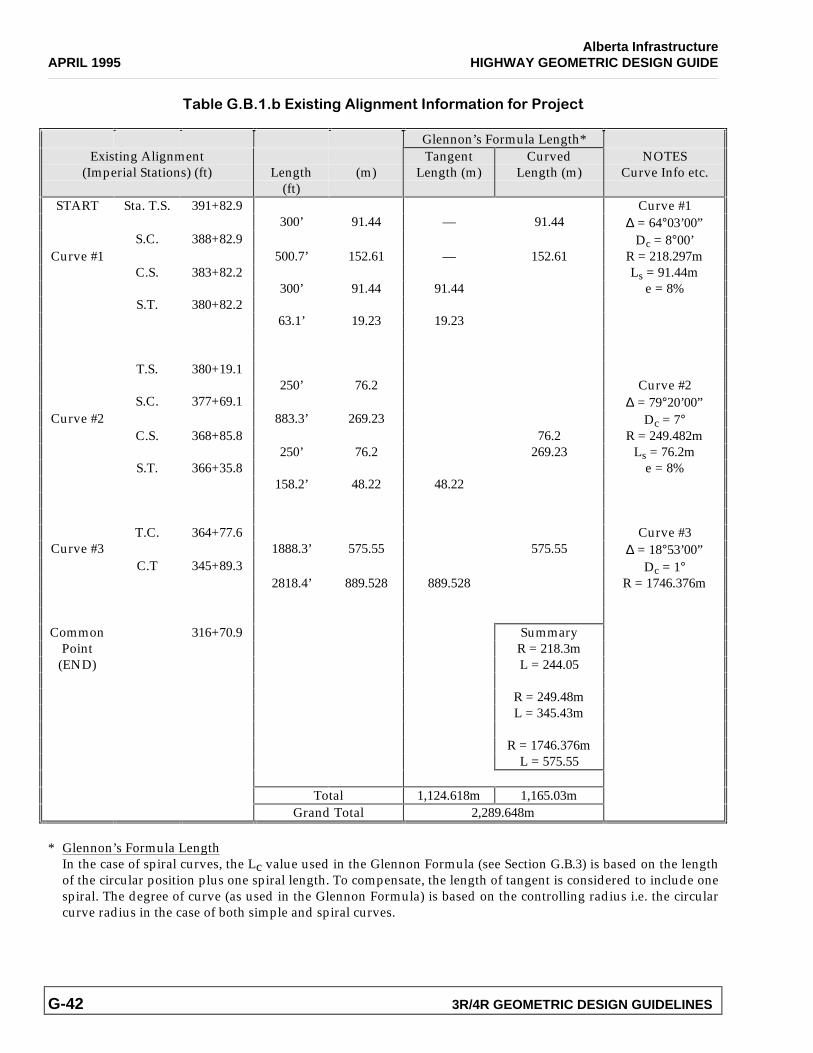
Alberta InfrastructureAPRIL 1995 HIGHWAY GEOMETRIC DESIGN GUIDE
G-42 3R/4R GEOMETRIC DESIGN GUIDELINES
��3��� ����3��D �- �#��� #�!��-���,'�!�- '��,'����'1�&-
Glennon’s Formula Length*Existing Alignment
(Imperial Stations) (ft) Length(ft)
(m)Tangent
Length (m)Curved
Length (m)NOTES
Curve Info etc.
START Sta. T.S. 391+82.9 Curve #1300’ 91.44 — 91.44 ∆ = 64°03’00”
S.C. 388+82.9 Dc = 8°00’Curve #1 500.7’ 152.61 — 152.61 R = 218.297m
C.S. 383+82.2 Ls = 91.44m300’ 91.44 91.44 e = 8%
S.T. 380+82.263.1’ 19.23 19.23
T.S. 380+19.1250’ 76.2 Curve #2
S.C. 377+69.1 ∆ = 79°20’00”Curve #2 883.3’ 269.23 Dc = 7°
C.S. 368+85.8 76.2 R = 249.482m250’ 76.2 269.23 Ls = 76.2m
S.T. 366+35.8 e = 8%158.2’ 48.22 48.22
T.C. 364+77.6 Curve #3Curve #3 1888.3’ 575.55 575.55 ∆ = 18°53’00”
C.T 345+89.3 Dc = 1°2818.4’ 889.528 889.528 R = 1746.376m
Common 316+70.9 SummaryPoint R = 218.3m
(END) L = 244.05
R = 249.48mL = 345.43m
R = 1746.376mL = 575.55
Total 1,124.618m 1,165.03mGrand Total 2,289.648m
* Glennon’s Formula LengthIn the case of spiral curves, the Lc value used in the Glennon Formula (see Section G.B.3) is based on the lengthof the circular position plus one spiral length. To compensate, the length of tangent is considered to include onespiral. The degree of curve (as used in the Glennon Formula) is based on the controlling radius i.e. the circularcurve radius in the case of both simple and spiral curves.
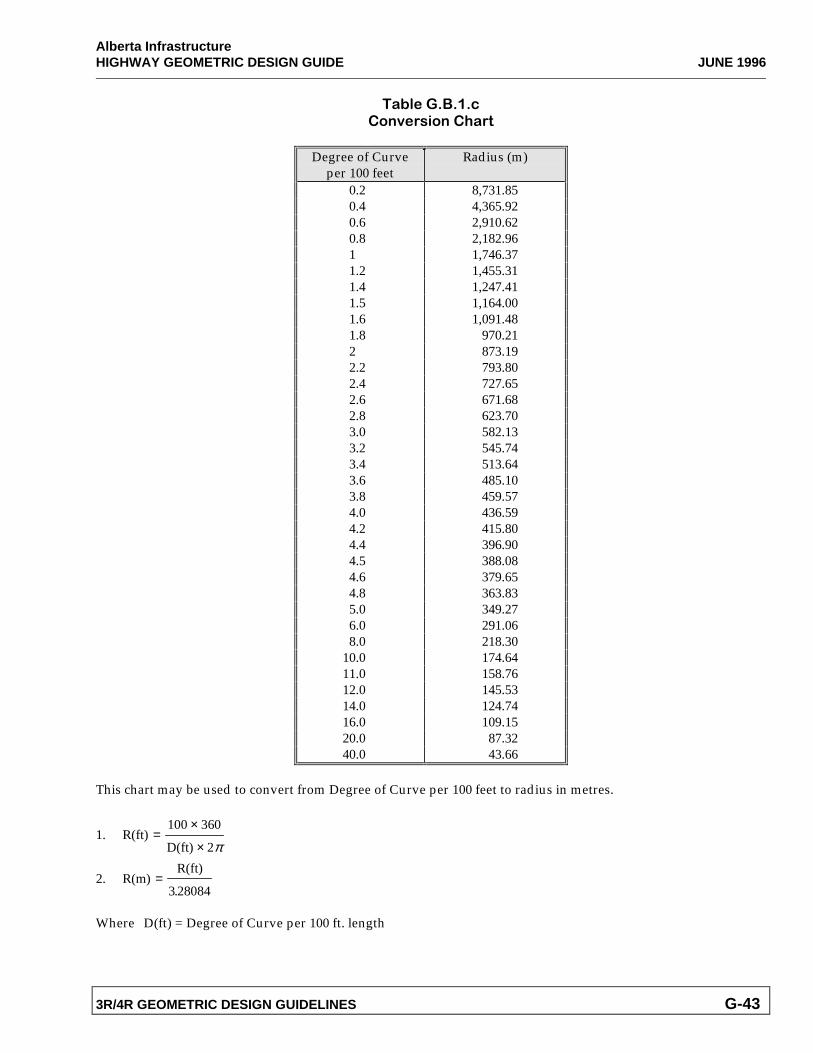
Alberta InfrastructureHIGHWAY GEOMETRIC DESIGN GUIDE JUNE 1996
3R/4R GEOMETRIC DESIGN GUIDELINES G-43
��3��� ����&�'�2��� '���$��-
Degree of Curveper 100 feet
Radius (m)
0.2 8,731.850.4 4,365.920.6 2,910.620.8 2,182.961 1,746.371.2 1,455.311.4 1,247.411.5 1,164.001.6 1,091.481.8 970.212 873.192.2 793.802.4 727.652.6 671.682.8 623.703.0 582.133.2 545.743.4 513.643.6 485.103.8 459.574.0 436.594.2 415.804.4 396.904.5 388.084.6 379.654.8 363.835.0 349.276.0 291.068.0 218.30
10.0 174.6411.0 158.7612.0 145.5314.0 124.7416.0 109.1520.0 87.3240.0 43.66
This chart may be used to convert from Degree of Curve per 100 feet to radius in metres.
1. R(ft)D(ft)
=×
×
100 360
2π
2. R(m)R(ft)
=3 28084.
Where D(ft) = Degree of Curve per 100 ft. length
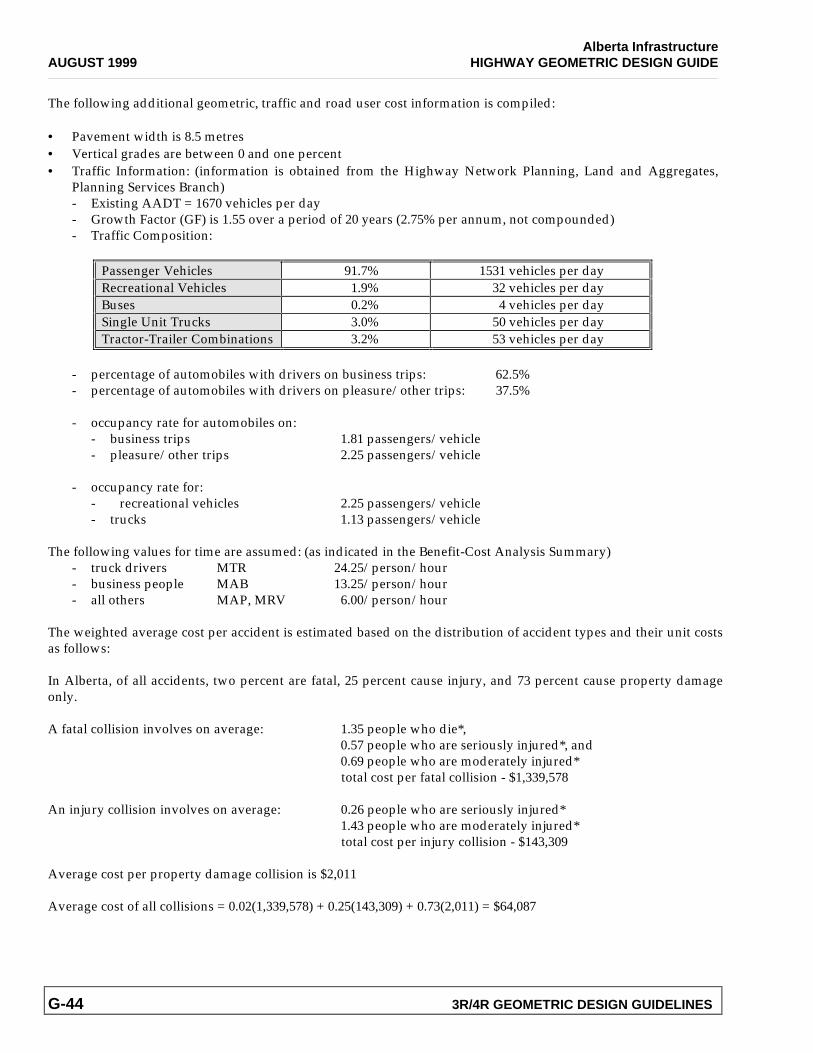
Alberta InfrastructureAUGUST 1999 HIGHWAY GEOMETRIC DESIGN GUIDE
G-44 3R/4R GEOMETRIC DESIGN GUIDELINES
The following additional geometric, traffic and road user cost information is compiled:
• Pavement width is 8.5 metres• Vertical grades are between 0 and one percent• Traffic Information: (information is obtained from the Highway Network Planning, Land and Aggregates,
Planning Services Branch)- Existing AADT = 1670 vehicles per day- Growth Factor (GF) is 1.55 over a period of 20 years (2.75% per annum, not compounded)- Traffic Composition:
Passenger Vehicles 91.7% 1531 vehicles per dayRecreational Vehicles 1.9% 32 vehicles per dayBuses 0.2% 4 vehicles per daySingle Unit Trucks 3.0% 50 vehicles per dayTractor-Trailer Combinations 3.2% 53 vehicles per day
- percentage of automobiles with drivers on business trips: 62.5%- percentage of automobiles with drivers on pleasure/other trips: 37.5%
- occupancy rate for automobiles on:- business trips 1.81 passengers/vehicle- pleasure/other trips 2.25 passengers/vehicle
- occupancy rate for:- recreational vehicles 2.25 passengers/vehicle- trucks 1.13 passengers/vehicle
The following values for time are assumed: (as indicated in the Benefit-Cost Analysis Summary)- truck drivers MTR 24.25/person/hour- business people MAB 13.25/person/hour- all others MAP, MRV 6.00/person/hour
The weighted average cost per accident is estimated based on the distribution of accident types and their unit costsas follows:
In Alberta, of all accidents, two percent are fatal, 25 percent cause injury, and 73 percent cause property damageonly.
A fatal collision involves on average: 1.35 people who die*,0.57 people who are seriously injured*, and0.69 people who are moderately injured*total cost per fatal collision - $1,339,578
An injury collision involves on average: 0.26 people who are seriously injured*1.43 people who are moderately injured*total cost per injury collision - $143,309
Average cost per property damage collision is $2,011
Average cost of all collisions = 0.02(1,339,578) + 0.25(143,309) + 0.73(2,011) = $64,087
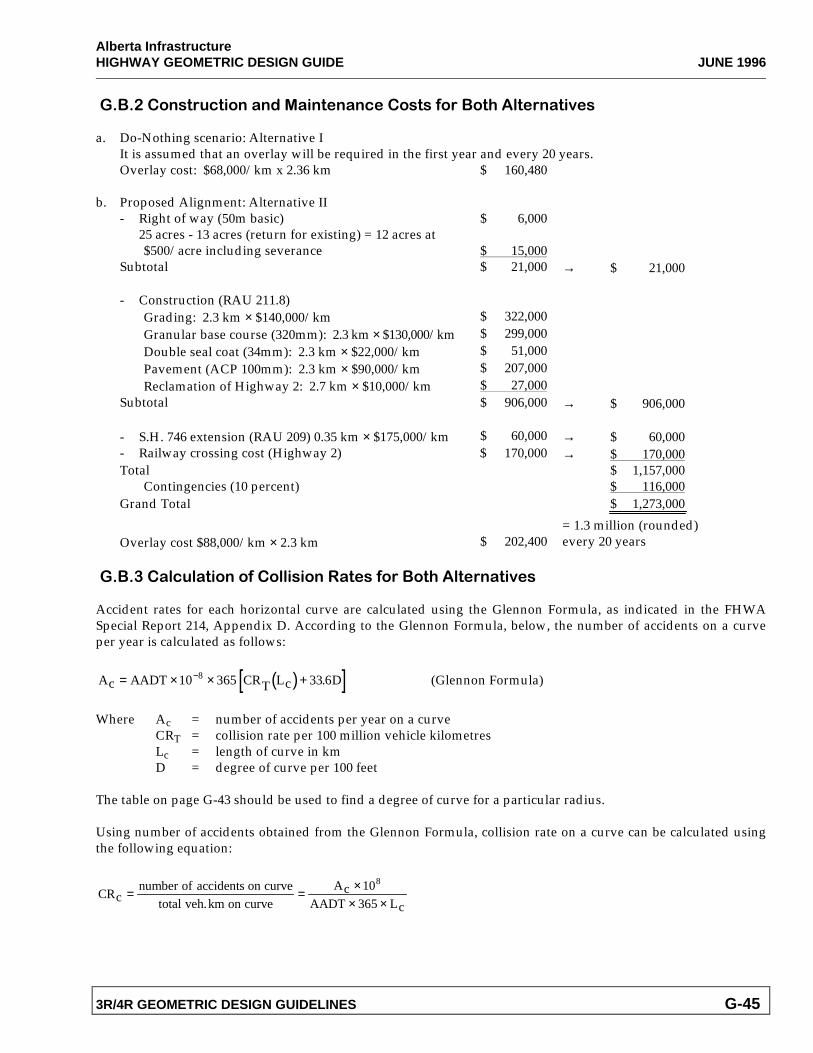
Alberta InfrastructureHIGHWAY GEOMETRIC DESIGN GUIDE JUNE 1996
3R/4R GEOMETRIC DESIGN GUIDELINES G-45
� �����'��-�*&- '����(��� �-����&���'�-��,'��'-$���-����- 2��
a. Do-Nothing scenario: Alternative IIt is assumed that an overlay will be required in the first year and every 20 years.Overlay cost: $68,000/km x 2.36 km $ 160,480
b. Proposed Alignment: Alternative II- Right of way (50m basic)
25 acres - 13 acres (return for existing) = 12 acres at$500/acre including severance
$ 6,000
$ 15,000Subtotal $ 21,000 → $ 21,000
- Construction (RAU 211.8)Grading: 2.3 km × $140,000/km $ 322,000Granular base course (320mm): 2.3 km × $130,000/km $ 299,000Double seal coat (34mm): 2.3 km × $22,000/km $ 51,000Pavement (ACP 100mm): 2.3 km × $90,000/km $ 207,000Reclamation of Highway 2: 2.7 km × $10,000/km $ 27,000
Subtotal $ 906,000 → $ 906,000
- S.H. 746 extension (RAU 209) 0.35 km × $175,000/km $ 60,000 → $ 60,000- Railway crossing cost (Highway 2) $ 170,000 → $ 170,000Total $ 1,157,000
Contingencies (10 percent) $ 116,000Grand Total $ 1,273,000
= 1.3 million (rounded)Overlay cost $88,000/km × 2.3 km $ 202,400 every 20 years
� ��+����&*��- '��',��'�� � '����-���,'��'-$���-����- 2��
Accident rates for each horizontal curve are calculated using the Glennon Formula, as indicated in the FHWASpecial Report 214, Appendix D. According to the Glennon Formula, below, the number of accidents on a curveper year is calculated as follows:
( )[ ]Ac AADT CRT Lc D= × × +−10 365 33 68 . (Glennon Formula)
Where Ac = number of accidents per year on a curveCRT = collision rate per 100 million vehicle kilometresLc = length of curve in kmD = degree of curve per 100 feet
The table on page G-43 should be used to find a degree of curve for a particular radius.
Using number of accidents obtained from the Glennon Formula, collision rate on a curve can be calculated usingthe following equation:
CRcnumber of accidents on curve
total veh.km on curve
AcAADT Lc
= = ×× ×
10
365
8
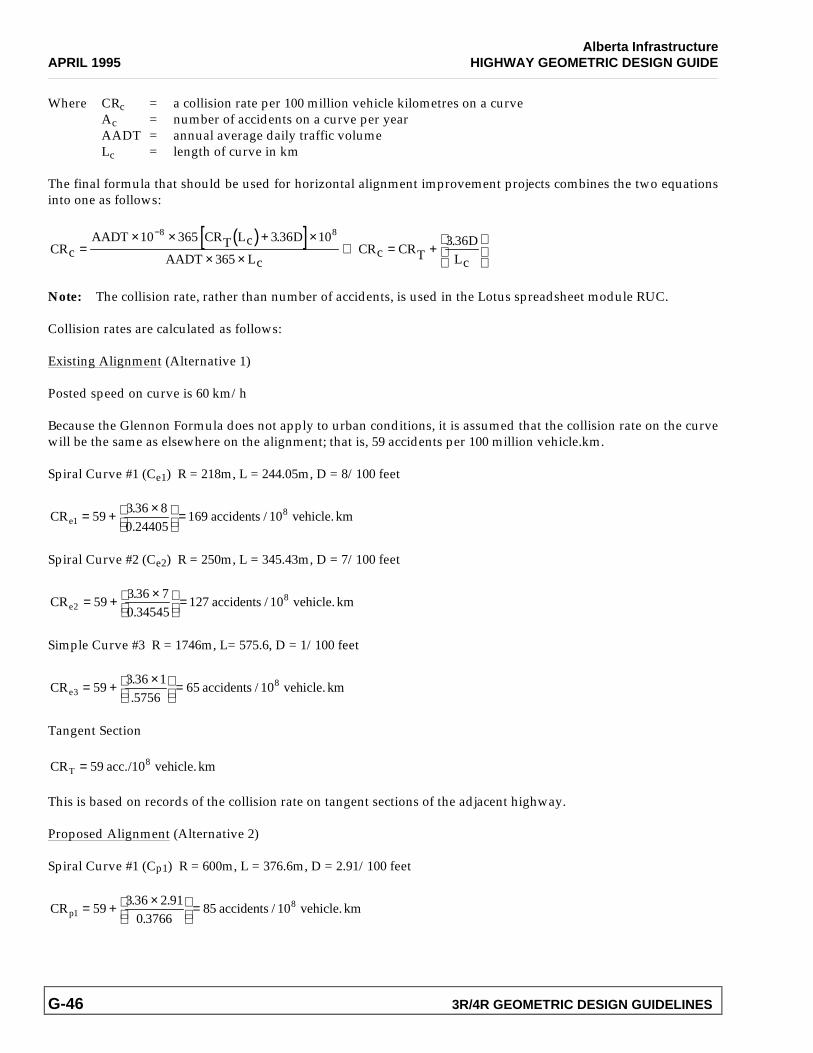
Alberta InfrastructureAPRIL 1995 HIGHWAY GEOMETRIC DESIGN GUIDE
G-46 3R/4R GEOMETRIC DESIGN GUIDELINES
Where CRc = a collision rate per 100 million vehicle kilometres on a curveAc = number of accidents on a curve per yearAADT = annual average daily traffic volumeLc = length of curve in km
The final formula that should be used for horizontal alignment improvement projects combines the two equationsinto one as follows:
( )[ ]CRc
AADT CRT Lc D
AADT LcCRc CRT
DLc
=× × + ×
× ×⇒ = +
−10 365 3 36 10
3653 36
8 8. .
Note: The collision rate, rather than number of accidents, is used in the Lotus spreadsheet module RUC.
Collision rates are calculated as follows:
Existing Alignment (Alternative 1)
Posted speed on curve is 60 km/h
Because the Glennon Formula does not apply to urban conditions, it is assumed that the collision rate on the curvewill be the same as elsewhere on the alignment; that is, 59 accidents per 100 million vehicle.km.
Spiral Curve #1 (Ce1) R = 218m, L = 244.05m, D = 8/100 feet
CR accidents vehicle. kme1 = + ×
=593 36 80 24405
169 108..
/
Spiral Curve #2 (Ce2) R = 250m, L = 345.43m, D = 7/100 feet
CR accidents vehicle. kme2859
3 36 70 34545
127 10= + ×
=..
/
Simple Curve #3 R = 1746m, L= 575.6, D = 1/100 feet
CR accidents vehicle. kme3859
3 36 15756
65 10= + ×
=..
/
Tangent Section
CR acc. vehicle.kmT = 59 8/10
This is based on records of the collision rate on tangent sections of the adjacent highway.
Proposed Alignment (Alternative 2)
Spiral Curve #1 (Cp1) R = 600m, L = 376.6m, D = 2.91/100 feet
CR accidents vehicle. kmp1859
3 36 2 910 3766
85 10= + ×
=. ..
/
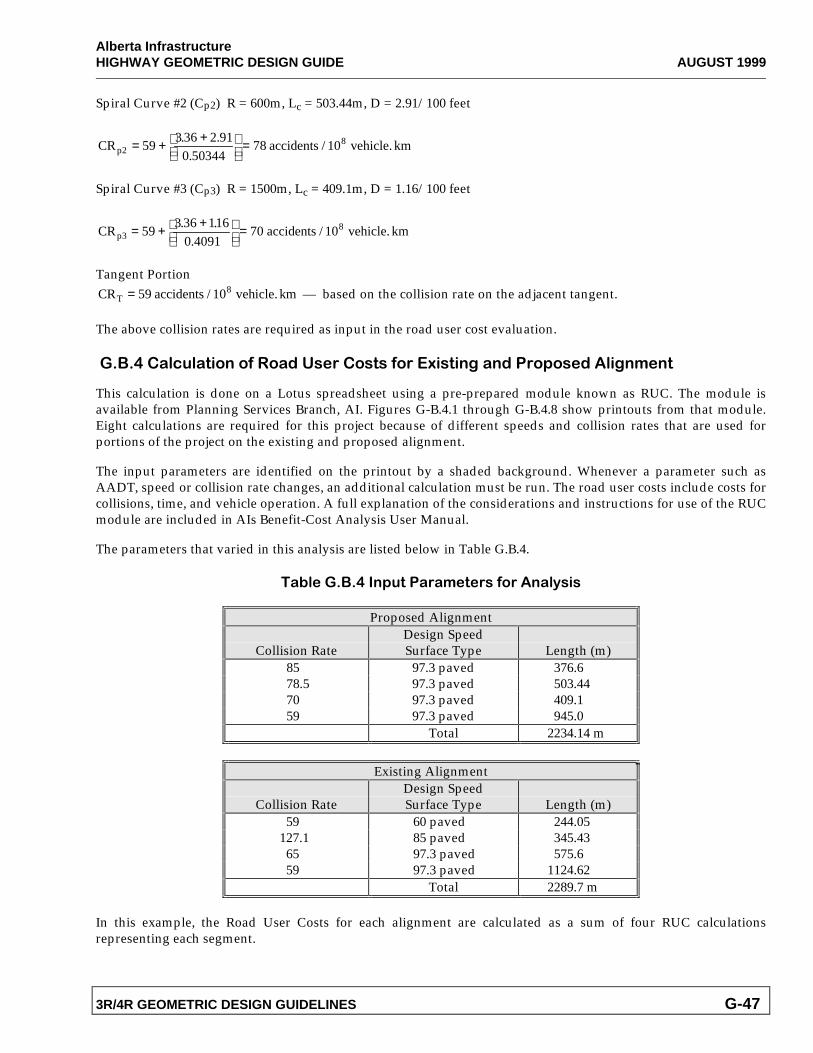
Alberta InfrastructureHIGHWAY GEOMETRIC DESIGN GUIDE AUGUST 1999
3R/4R GEOMETRIC DESIGN GUIDELINES G-47
Spiral Curve #2 (Cp2) R = 600m, Lc = 503.44m, D = 2.91/100 feet
CR accidents vehicle. kmp2859
3 36 2 910 50344
78 10= + +
=. ..
/
Spiral Curve #3 (Cp3) R = 1500m, Lc = 409.1m, D = 1.16/100 feet
CR accidents vehicle. kmp3859
3 36 1160
70 10= + +
=. ..4091
/
Tangent PortionCR accidents vehicle. kmT = 59 108/ — based on the collision rate on the adjacent tangent.
The above collision rates are required as input in the road user cost evaluation.
� ��.����&*��- '��',��'�(�������'�-��,'���D �- �#���(���'4'��(��� #�!��-
This calculation is done on a Lotus spreadsheet using a pre-prepared module known as RUC. The module isavailable from Planning Services Branch, AI. Figures G-B.4.1 through G-B.4.8 show printouts from that module.Eight calculations are required for this project because of different speeds and collision rates that are used forportions of the project on the existing and proposed alignment.
The input parameters are identified on the printout by a shaded background. Whenever a parameter such asAADT, speed or collision rate changes, an additional calculation must be run. The road user costs include costs forcollisions, time, and vehicle operation. A full explanation of the considerations and instructions for use of the RUCmodule are included in AIs Benefit-Cost Analysis User Manual.
The parameters that varied in this analysis are listed below in Table G.B.4.
��3��� ��.���4*-�����!�-����,'������"� �
Proposed Alignment
Collision RateDesign SpeedSurface Type Length (m)
85 97.3 paved 376.678.5 97.3 paved 503.4470 97.3 paved 409.159 97.3 paved 945.0
Total 2234.14 m
Existing Alignment
Collision RateDesign SpeedSurface Type Length (m)
59 60 paved 244.05127.1 85 paved 345.4365 97.3 paved 575.659 97.3 paved 1124.62
Total 2289.7 m
In this example, the Road User Costs for each alignment are calculated as a sum of four RUC calculationsrepresenting each segment.

APRIL 1995
FIGURE G - B.4.1
ROAD USER COST EVALUATION
PROJECT: CURVE FLATTENING PROJECT - SIMPLE CURVE 0.3 KM W OF McLennan ALT: ALT II 06-Apr-95
ROAD USER COST INPUT DATA:
AADT %PV %RV %BUS %SU %TRT DES. SP/ SUR. TYPE1670 91.7 1.9 0.2 3 3.2 97.3 paved
TIME $: TRK DRVR TRK PASS WK/BUS OTHER24.25 13.25 13.25 6.00
PASSENGER VEHS. REC. VEHS. BUSES TRIP PURPOSE: % W/B % OTHER % W/B % OTHER % W/B % OTHER
62.5 37.5 0 100 100 0
VEH.OCC. PV W/B PV OTH RV W/B RV OTH TRUCKS BUS W/B BUS OTHERFACTORS 1.81 2.25 0.00 2.25 1.13 1.00 0.00
COLLISION DATA: RATE %FATAL %INJURY %PDO85 2 25 73
#FATALS #SER.INJ #MOD.INJFATAL COLLISIONS 1.35 0.57 0.69INJURY COLLISIONS - 0.26 1.43
FATALS SER.INJ MOD.INJ P.D.O.SOC.+DIR.COSTS 691800 459800 1495 300PROPERTY DAMAGE 7500 6750 6750 3600
GRADIENT COSTS:
grade length unit cost for grades running costs on grades total cost PV SU TRT PV SU TRT for grades
0 0.38 100.14 297.67 274.89 58.95 5.99 5.53 70.471 0.00 100.68 301.93 251.40 0.00 0.00 0.00 0.002 0.00 102.02 278.34 246.62 0.00 0.00 0.00 0.003 0.00 103.14 317.23 290.60 0.00 0.00 0.00 0.004 0.00 104.75 347.55 334.09 0.00 0.00 0.00 0.005 0.00 104.99 379.59 384.49 0.00 0.00 0.00 0.006 0.00 109.28 414.28 437.69 0.00 0.00 0.00 0.007 0.00 117.57 450.79 499.79 0.00 0.00 0.00 0.008 0.00 128.54 490.22 572.86 0.00 0.00 0.00 0.00
TOT. LEN. 0.38TOTAL DAILY RUNNING COST FOR GRADES 70.47
CURVATURE COSTS:
radius superelev length unit cost for curves running costs on curves total cost for PV SU TRT PV SU TRT curves
250 0.080 0.00 196.5 2183.2 4141.8 0.00 0.00 0.00 0.00600 0.060 0.00 13.1 179.7 344.3 0.00 0.00 0.00 0.00748 0.058 0.00 3.0 69.7 135.8 0.00 0.00 0.00 0.00600 0.060 0.38 13.1 179.7 344.3 7.71 3.62 6.93 18.25873 0.047 0.00 1.9 57.8 113.3 0.00 0.00 0.00 0.00
1500 0.049 0.00 0.0 0.0 0.0 0.00 0.00 0.00 0.00
TOTAL DAILY RUNNING COST FOR CURVES 18.25
TIME COSTS:
trippurpose unit cost for time vehicle time costs total cost
PV RV TRUCK BUS PV RV TRUCK BUSwrk/bus 23.98 0.00 25.97 24.25 88.84 0.00 10.41 0.31 99.57other 13.50 13.50 18.25 30.01 1.66 0.00 31.66
TOTAL DAILY TIME COSTS FOR ROUTE 131.23COLLISION COSTS:
collision severity unit cost for collision
FATALITY SER. INJ MOD. INJ DAMAGE SUB TOTAL % x COST2 % fatal 933930 262086 1032 7500 1204548 24090.95
25 % injury 119548 2138 6750 128436 32108.9673 % pdo 3900 3900 2847.00
AVERAGE COST PER COLLISION 59046.91AVERAGE # COLLISIONS PER DAY 0.00053TOTAL DAILY COLLISION COSTS 31.57
TOTAL DAILY ROAD USER COSTS 251.52
TOTAL ANNUAL ROAD USER COSTS 91,867.86
G-48 3R/4R GEOMETRIC DESIGN GUIDELINES
Alberta InfrastructureHIGHWAY GEOMETRIC DESIGN GUIDE
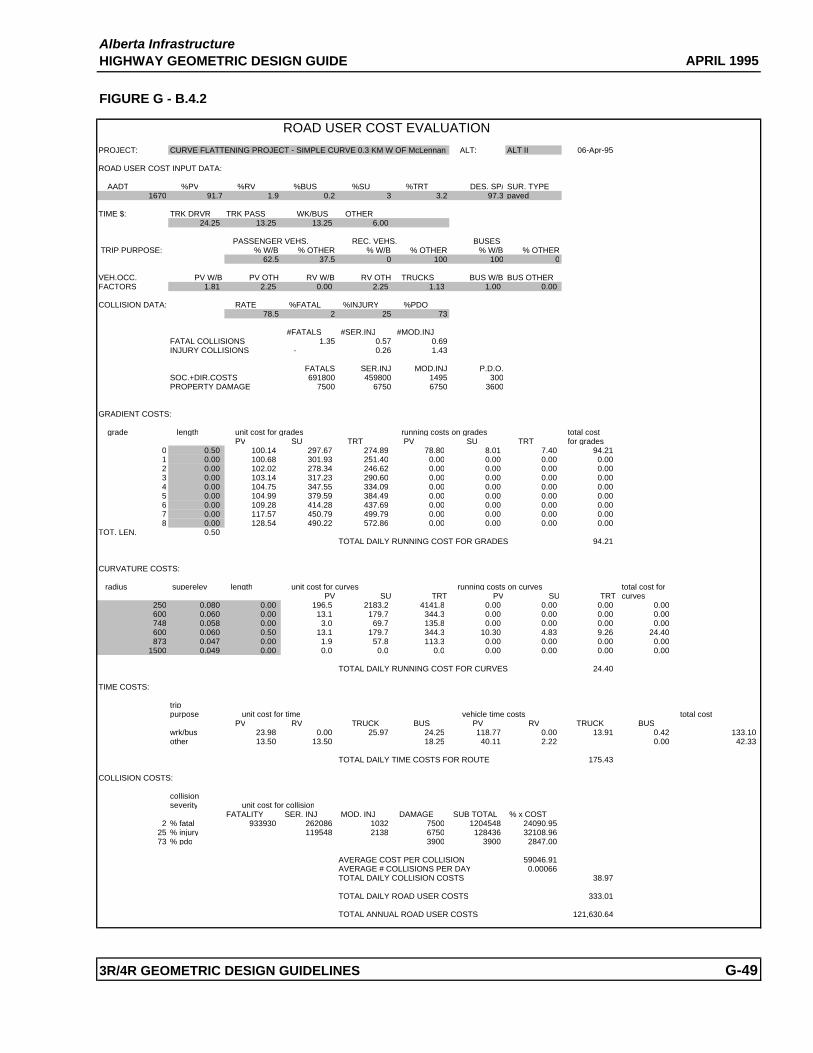
APRIL 1995
FIGURE G - B.4.2
ROAD USER COST EVALUATION
PROJECT: CURVE FLATTENING PROJECT - SIMPLE CURVE 0.3 KM W OF McLennan ALT: ALT II 06-Apr-95
ROAD USER COST INPUT DATA:
AADT %PV %RV %BUS %SU %TRT DES. SP/ SUR. TYPE1670 91.7 1.9 0.2 3 3.2 97.3 paved
TIME $: TRK DRVR TRK PASS WK/BUS OTHER24.25 13.25 13.25 6.00
PASSENGER VEHS. REC. VEHS. BUSES TRIP PURPOSE: % W/B % OTHER % W/B % OTHER % W/B % OTHER
62.5 37.5 0 100 100 0
VEH.OCC. PV W/B PV OTH RV W/B RV OTH TRUCKS BUS W/B BUS OTHERFACTORS 1.81 2.25 0.00 2.25 1.13 1.00 0.00
COLLISION DATA: RATE %FATAL %INJURY %PDO78.5 2 25 73
#FATALS #SER.INJ #MOD.INJFATAL COLLISIONS 1.35 0.57 0.69INJURY COLLISIONS - 0.26 1.43
FATALS SER.INJ MOD.INJ P.D.O.SOC.+DIR.COSTS 691800 459800 1495 300PROPERTY DAMAGE 7500 6750 6750 3600
GRADIENT COSTS:
grade length unit cost for grades running costs on grades total cost PV SU TRT PV SU TRT for grades
0 0.50 100.14 297.67 274.89 78.80 8.01 7.40 94.211 0.00 100.68 301.93 251.40 0.00 0.00 0.00 0.002 0.00 102.02 278.34 246.62 0.00 0.00 0.00 0.003 0.00 103.14 317.23 290.60 0.00 0.00 0.00 0.004 0.00 104.75 347.55 334.09 0.00 0.00 0.00 0.005 0.00 104.99 379.59 384.49 0.00 0.00 0.00 0.006 0.00 109.28 414.28 437.69 0.00 0.00 0.00 0.007 0.00 117.57 450.79 499.79 0.00 0.00 0.00 0.008 0.00 128.54 490.22 572.86 0.00 0.00 0.00 0.00
TOT. LEN. 0.50TOTAL DAILY RUNNING COST FOR GRADES 94.21
CURVATURE COSTS:
radius superelev length unit cost for curves running costs on curves total cost for PV SU TRT PV SU TRT curves
250 0.080 0.00 196.5 2183.2 4141.8 0.00 0.00 0.00 0.00600 0.060 0.00 13.1 179.7 344.3 0.00 0.00 0.00 0.00748 0.058 0.00 3.0 69.7 135.8 0.00 0.00 0.00 0.00600 0.060 0.50 13.1 179.7 344.3 10.30 4.83 9.26 24.40873 0.047 0.00 1.9 57.8 113.3 0.00 0.00 0.00 0.00
1500 0.049 0.00 0.0 0.0 0.0 0.00 0.00 0.00 0.00
TOTAL DAILY RUNNING COST FOR CURVES 24.40
TIME COSTS:
trippurpose unit cost for time vehicle time costs total cost
PV RV TRUCK BUS PV RV TRUCK BUSwrk/bus 23.98 0.00 25.97 24.25 118.77 0.00 13.91 0.42 133.10other 13.50 13.50 18.25 40.11 2.22 0.00 42.33
TOTAL DAILY TIME COSTS FOR ROUTE 175.43
COLLISION COSTS:
collision severity unit cost for collision
FATALITY SER. INJ MOD. INJ DAMAGE SUB TOTAL % x COST2 % fatal 933930 262086 1032 7500 1204548 24090.95
25 % injury 119548 2138 6750 128436 32108.9673 % pdo 3900 3900 2847.00
AVERAGE COST PER COLLISION 59046.91AVERAGE # COLLISIONS PER DAY 0.00066TOTAL DAILY COLLISION COSTS 38.97
TOTAL DAILY ROAD USER COSTS 333.01
TOTAL ANNUAL ROAD USER COSTS 121,630.64
3R/4R GEOMETRIC DESIGN GUIDELINES G-49
Alberta InfrastructureHIGHWAY GEOMETRIC DESIGN GUIDE

APRIL 1995
FIGURE G - B.4.3
ROAD USER COST EVALUATION
PROJECT: CURVE FLATTENING PROJECT - SIMPLE CURVE 0.3 KM W OF McLennan ALT: ALT II 06-Apr-95
ROAD USER COST INPUT DATA:
AADT %PV %RV %BUS %SU %TRT DES. SP/ SUR. TYPE1670 91.7 1.9 0.2 3 3.2 97.3 paved
TIME $: TRK DRVR TRK PASS WK/BUS OTHER24.25 13.25 13.25 6.00
PASSENGER VEHS. REC. VEHS. BUSES TRIP PURPOSE: % W/B % OTHER % W/B % OTHER % W/B % OTHER
62.5 37.5 0 100 100 0
VEH.OCC. PV W/B PV OTH RV W/B RV OTH TRUCKS BUS W/B BUS OTHERFACTORS 1.81 2.25 0.00 2.25 1.13 1.00 0.00
COLLISION DATA: RATE %FATAL %INJURY %PDO70 2 25 73
#FATALS #SER.INJ #MOD.INJFATAL COLLISIONS 1.35 0.57 0.69INJURY COLLISIONS - 0.26 1.43
FATALS SER.INJ MOD.INJ P.D.O.SOC.+DIR.COSTS 691800 459800 1495 300PROPERTY DAMAGE 7500 6750 6750 3600
GRADIENT COSTS:
grade length unit cost for grades running costs on grades total cost PV SU TRT PV SU TRT for grades
0 0.41 100.14 297.67 274.89 64.04 6.51 6.01 76.551 0.00 100.68 301.93 251.40 0.00 0.00 0.00 0.002 0.00 102.02 278.34 246.62 0.00 0.00 0.00 0.003 0.00 103.14 317.23 290.60 0.00 0.00 0.00 0.004 0.00 104.75 347.55 334.09 0.00 0.00 0.00 0.005 0.00 104.99 379.59 384.49 0.00 0.00 0.00 0.006 0.00 109.28 414.28 437.69 0.00 0.00 0.00 0.007 0.00 117.57 450.79 499.79 0.00 0.00 0.00 0.008 0.00 128.54 490.22 572.86 0.00 0.00 0.00 0.00
TOT. LEN. 0.41TOTAL DAILY RUNNING COST FOR GRADES 76.55
CURVATURE COSTS:
radius superelev length unit cost for curves running costs on curves total cost for PV SU TRT PV SU TRT curves
250 0.080 0.00 196.5 2183.2 4141.8 0.00 0.00 0.00 0.00600 0.060 0.00 13.1 179.7 344.3 0.00 0.00 0.00 0.00748 0.058 0.00 3.0 69.7 135.8 0.00 0.00 0.00 0.00600 0.060 0.00 13.1 179.7 344.3 0.00 0.00 0.00 0.00873 0.047 0.00 1.9 57.8 113.3 0.00 0.00 0.00 0.00
1500 0.037 0.41 0.0 0.0 0.0 0.00 0.00 0.00 0.00
TOTAL DAILY RUNNING COST FOR CURVES 0.00
TIME COSTS:
trippurpose unit cost for time vehicle time costs total cost
PV RV TRUCK BUS PV RV TRUCK BUSwrk/bus 23.98 0.00 25.97 24.25 96.51 0.00 11.31 0.34 108.16other 13.50 13.50 18.25 32.60 1.80 0.00 34.40
TOTAL DAILY TIME COSTS FOR ROUTE 142.56
COLLISION COSTS:
collision severity unit cost for collision
FATALITY SER. INJ MOD. INJ DAMAGE SUB TOTAL % x COST2 % fatal 933930 262086 1032 7500 1204548 24090.95
25 % injury 119548 2138 6750 128436 32108.9673 % pdo 3900 3900 2847.00
AVERAGE COST PER COLLISION 59046.91AVERAGE # COLLISIONS PER DAY 0.00048TOTAL DAILY COLLISION COSTS 28.24
TOTAL DAILY ROAD USER COSTS 247.35
TOTAL ANNUAL ROAD USER COSTS 90,343.61
G-50 3R/4R GEOMETRIC DESIGN GUIDELINES
Alberta InfrastructureHIGHWAY GEOMETRIC DESIGN GUIDE

APRIL 1995
FIGURE G - B.4.4
ROAD USER COST EVALUATION
PROJECT: CURVE FLATTENING PROJECT - SIMPLE CURVE 0.3 KM W OF McLennan ALT: ALT II 06-Apr-95
ROAD USER COST INPUT DATA:
AADT %PV %RV %BUS %SU %TRT DES. SP/ SUR. TYPE1670 91.7 1.9 0.2 3 3.2 97.3 paved
TIME $: TRK DRVR TRK PASS WK/BUS OTHER24.25 13.25 13.25 6.00
PASSENGER VEHS. REC. VEHS. BUSES TRIP PURPOSE: % W/B % OTHER % W/B % OTHER % W/B % OTHER
62.5 37.5 0 100 100 0
VEH.OCC. PV W/B PV OTH RV W/B RV OTH TRUCKS BUS W/B BUS OTHERFACTORS 1.81 2.25 0.00 2.25 1.13 1.00 0.00
COLLISION DATA: RATE %FATAL %INJURY %PDO59 2 25 73
#FATALS #SER.INJ #MOD.INJFATAL COLLISIONS 1.35 0.57 0.69INJURY COLLISIONS - 0.26 1.43
FATALS SER.INJ MOD.INJ P.D.O.SOC.+DIR.COSTS 691800 459800 1495 300PROPERTY DAMAGE 7500 6750 6750 3600
GRADIENT COSTS:
grade length unit cost for grades running costs on grades total cost PV SU TRT PV SU TRT for grades
0 0.95 100.14 297.67 274.89 147.92 15.03 13.88 176.831 0.00 100.68 301.93 251.40 0.00 0.00 0.00 0.002 0.00 102.02 278.34 246.62 0.00 0.00 0.00 0.003 0.00 103.14 317.23 290.60 0.00 0.00 0.00 0.004 0.00 104.75 347.55 334.09 0.00 0.00 0.00 0.005 0.00 104.99 379.59 384.49 0.00 0.00 0.00 0.006 0.00 109.28 414.28 437.69 0.00 0.00 0.00 0.007 0.00 117.57 450.79 499.79 0.00 0.00 0.00 0.008 0.00 128.54 490.22 572.86 0.00 0.00 0.00 0.00
TOT. LEN. 0.95TOTAL DAILY RUNNING COST FOR GRADES 176.83
CURVATURE COSTS:
radius superelev length unit cost for curves running costs on curves total cost for PV SU TRT PV SU TRT curves
250 0.080 0.00 196.5 2183.2 4141.8 0.00 0.00 0.00 0.00600 0.060 0.00 13.1 179.7 344.3 0.00 0.00 0.00 0.00748 0.058 0.00 3.0 69.7 135.8 0.00 0.00 0.00 0.00600 0.060 0.00 13.1 179.7 344.3 0.00 0.00 0.00 0.00873 0.047 0.00 1.9 57.8 113.3 0.00 0.00 0.00 0.00
1500 0.037 0.00 0.0 0.0 0.0 0.00 0.00 0.00 0.00
TOTAL DAILY RUNNING COST FOR CURVES 0.00
TIME COSTS:
trippurpose unit cost for time vehicle time costs total cost
PV RV TRUCK BUS PV RV TRUCK BUSwrk/bus 23.98 0.00 25.97 24.25 222.94 0.00 26.12 0.79 249.84other 13.50 13.50 18.25 75.30 4.16 0.00 79.46
TOTAL DAILY TIME COSTS FOR ROUTE 329.30
COLLISION COSTS:
collision severity unit cost for collision
FATALITY SER. INJ MOD. INJ DAMAGE SUB TOTAL % x COST2 % fatal 933930 262086 1032 7500 1204548 24090.95
25 % injury 119548 2138 6750 128436 32108.9673 % pdo 3900 3900 2847.00
AVERAGE COST PER COLLISION 59046.91AVERAGE # COLLISIONS PER DAY 0.00093TOTAL DAILY COLLISION COSTS 54.98
TOTAL DAILY ROAD USER COSTS 561.11
TOTAL ANNUAL ROAD USER COSTS 204,945.17
3R/4R GEOMETRIC DESIGN GUIDELINES G-51
Alberta InfrastructureHIGHWAY GEOMETRIC DESIGN GUIDE
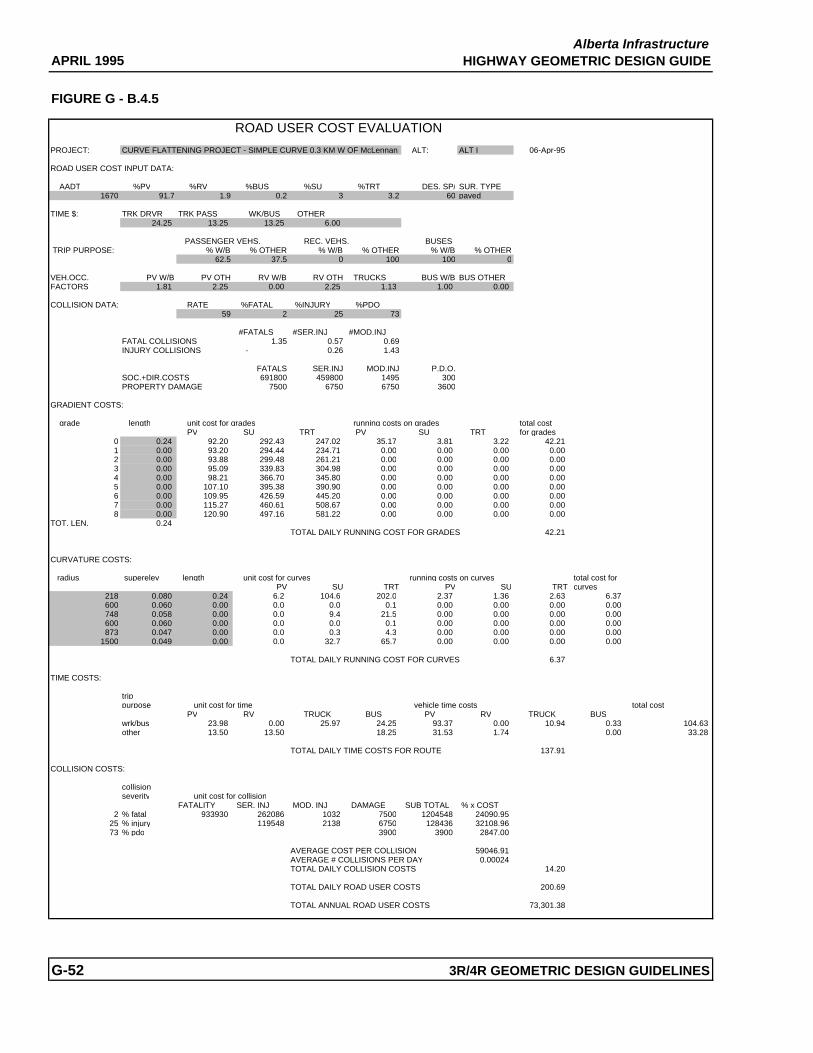
APRIL 1995
FIGURE G - B.4.5
ROAD USER COST EVALUATION
PROJECT: CURVE FLATTENING PROJECT - SIMPLE CURVE 0.3 KM W OF McLennan ALT: ALT I 06-Apr-95
ROAD USER COST INPUT DATA:
AADT %PV %RV %BUS %SU %TRT DES. SP/ SUR. TYPE1670 91.7 1.9 0.2 3 3.2 60 paved
TIME $: TRK DRVR TRK PASS WK/BUS OTHER24.25 13.25 13.25 6.00
PASSENGER VEHS. REC. VEHS. BUSES TRIP PURPOSE: % W/B % OTHER % W/B % OTHER % W/B % OTHER
62.5 37.5 0 100 100 0
VEH.OCC. PV W/B PV OTH RV W/B RV OTH TRUCKS BUS W/B BUS OTHERFACTORS 1.81 2.25 0.00 2.25 1.13 1.00 0.00
COLLISION DATA: RATE %FATAL %INJURY %PDO59 2 25 73
#FATALS #SER.INJ #MOD.INJFATAL COLLISIONS 1.35 0.57 0.69INJURY COLLISIONS - 0.26 1.43
FATALS SER.INJ MOD.INJ P.D.O.SOC.+DIR.COSTS 691800 459800 1495 300PROPERTY DAMAGE 7500 6750 6750 3600
GRADIENT COSTS:
grade length unit cost for grades running costs on grades total cost PV SU TRT PV SU TRT for grades
0 0.24 92.20 292.43 247.02 35.17 3.81 3.22 42.211 0.00 93.20 294.44 234.71 0.00 0.00 0.00 0.002 0.00 93.88 299.48 261.21 0.00 0.00 0.00 0.003 0.00 95.09 339.83 304.98 0.00 0.00 0.00 0.004 0.00 98.21 366.70 345.80 0.00 0.00 0.00 0.005 0.00 107.10 395.38 390.90 0.00 0.00 0.00 0.006 0.00 109.95 426.59 445.20 0.00 0.00 0.00 0.007 0.00 115.27 460.61 508.67 0.00 0.00 0.00 0.008 0.00 120.90 497.16 581.22 0.00 0.00 0.00 0.00
TOT. LEN. 0.24TOTAL DAILY RUNNING COST FOR GRADES 42.21
CURVATURE COSTS:
radius superelev length unit cost for curves running costs on curves total cost for PV SU TRT PV SU TRT curves
218 0.080 0.24 6.2 104.6 202.0 2.37 1.36 2.63 6.37600 0.060 0.00 0.0 0.0 0.1 0.00 0.00 0.00 0.00748 0.058 0.00 0.0 9.4 21.5 0.00 0.00 0.00 0.00600 0.060 0.00 0.0 0.0 0.1 0.00 0.00 0.00 0.00873 0.047 0.00 0.0 0.3 4.3 0.00 0.00 0.00 0.00
1500 0.049 0.00 0.0 32.7 65.7 0.00 0.00 0.00 0.00
TOTAL DAILY RUNNING COST FOR CURVES 6.37
TIME COSTS:
trippurpose unit cost for time vehicle time costs total cost
PV RV TRUCK BUS PV RV TRUCK BUSwrk/bus 23.98 0.00 25.97 24.25 93.37 0.00 10.94 0.33 104.63other 13.50 13.50 18.25 31.53 1.74 0.00 33.28
TOTAL DAILY TIME COSTS FOR ROUTE 137.91
COLLISION COSTS:
collision severity unit cost for collision
FATALITY SER. INJ MOD. INJ DAMAGE SUB TOTAL % x COST2 % fatal 933930 262086 1032 7500 1204548 24090.95
25 % injury 119548 2138 6750 128436 32108.9673 % pdo 3900 3900 2847.00
AVERAGE COST PER COLLISION 59046.91AVERAGE # COLLISIONS PER DAY 0.00024TOTAL DAILY COLLISION COSTS 14.20
TOTAL DAILY ROAD USER COSTS 200.69
TOTAL ANNUAL ROAD USER COSTS 73,301.38
G-52 3R/4R GEOMETRIC DESIGN GUIDELINES
Alberta InfrastructureHIGHWAY GEOMETRIC DESIGN GUIDE
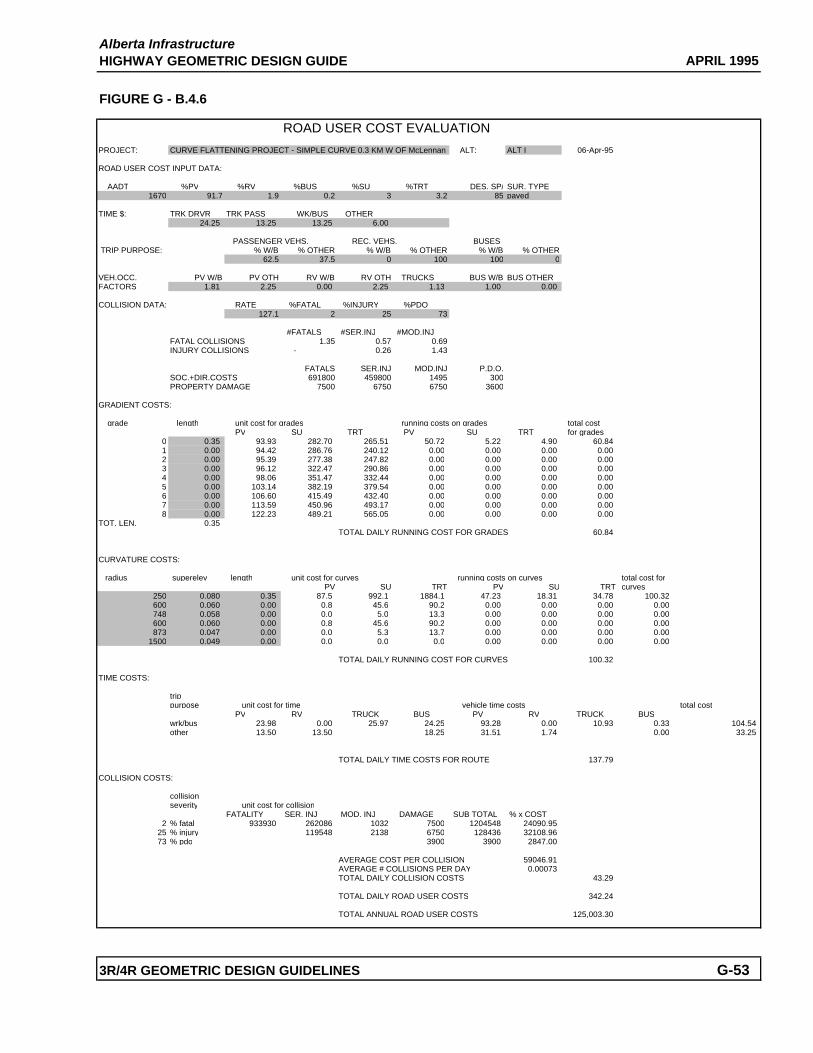
APRIL 1995
FIGURE G - B.4.6
ROAD USER COST EVALUATION
PROJECT: CURVE FLATTENING PROJECT - SIMPLE CURVE 0.3 KM W OF McLennan ALT: ALT I 06-Apr-95
ROAD USER COST INPUT DATA:
AADT %PV %RV %BUS %SU %TRT DES. SP/ SUR. TYPE1670 91.7 1.9 0.2 3 3.2 85 paved
TIME $: TRK DRVR TRK PASS WK/BUS OTHER24.25 13.25 13.25 6.00
PASSENGER VEHS. REC. VEHS. BUSES TRIP PURPOSE: % W/B % OTHER % W/B % OTHER % W/B % OTHER
62.5 37.5 0 100 100 0
VEH.OCC. PV W/B PV OTH RV W/B RV OTH TRUCKS BUS W/B BUS OTHERFACTORS 1.81 2.25 0.00 2.25 1.13 1.00 0.00
COLLISION DATA: RATE %FATAL %INJURY %PDO127.1 2 25 73
#FATALS #SER.INJ #MOD.INJFATAL COLLISIONS 1.35 0.57 0.69INJURY COLLISIONS - 0.26 1.43
FATALS SER.INJ MOD.INJ P.D.O.SOC.+DIR.COSTS 691800 459800 1495 300PROPERTY DAMAGE 7500 6750 6750 3600
GRADIENT COSTS:
grade length unit cost for grades running costs on grades total cost PV SU TRT PV SU TRT for grades
0 0.35 93.93 282.70 265.51 50.72 5.22 4.90 60.841 0.00 94.42 286.76 240.12 0.00 0.00 0.00 0.002 0.00 95.39 277.38 247.82 0.00 0.00 0.00 0.003 0.00 96.12 322.47 290.86 0.00 0.00 0.00 0.004 0.00 98.06 351.47 332.44 0.00 0.00 0.00 0.005 0.00 103.14 382.19 379.54 0.00 0.00 0.00 0.006 0.00 106.60 415.49 432.40 0.00 0.00 0.00 0.007 0.00 113.59 450.96 493.17 0.00 0.00 0.00 0.008 0.00 122.23 489.21 565.05 0.00 0.00 0.00 0.00
TOT. LEN. 0.35TOTAL DAILY RUNNING COST FOR GRADES 60.84
CURVATURE COSTS:
radius superelev length unit cost for curves running costs on curves total cost for PV SU TRT PV SU TRT curves
250 0.080 0.35 87.5 992.1 1884.1 47.23 18.31 34.78 100.32600 0.060 0.00 0.8 45.6 90.2 0.00 0.00 0.00 0.00748 0.058 0.00 0.0 5.0 13.3 0.00 0.00 0.00 0.00600 0.060 0.00 0.8 45.6 90.2 0.00 0.00 0.00 0.00873 0.047 0.00 0.0 5.3 13.7 0.00 0.00 0.00 0.00
1500 0.049 0.00 0.0 0.0 0.0 0.00 0.00 0.00 0.00
TOTAL DAILY RUNNING COST FOR CURVES 100.32
TIME COSTS:
trippurpose unit cost for time vehicle time costs total cost
PV RV TRUCK BUS PV RV TRUCK BUSwrk/bus 23.98 0.00 25.97 24.25 93.28 0.00 10.93 0.33 104.54other 13.50 13.50 18.25 31.51 1.74 0.00 33.25
TOTAL DAILY TIME COSTS FOR ROUTE 137.79
COLLISION COSTS:
collision severity unit cost for collision
FATALITY SER. INJ MOD. INJ DAMAGE SUB TOTAL % x COST2 % fatal 933930 262086 1032 7500 1204548 24090.95
25 % injury 119548 2138 6750 128436 32108.9673 % pdo 3900 3900 2847.00
AVERAGE COST PER COLLISION 59046.91AVERAGE # COLLISIONS PER DAY 0.00073TOTAL DAILY COLLISION COSTS 43.29
TOTAL DAILY ROAD USER COSTS 342.24
TOTAL ANNUAL ROAD USER COSTS 125,003.30
3R/4R GEOMETRIC DESIGN GUIDELINES G-53
Alberta InfrastructureHIGHWAY GEOMETRIC DESIGN GUIDE
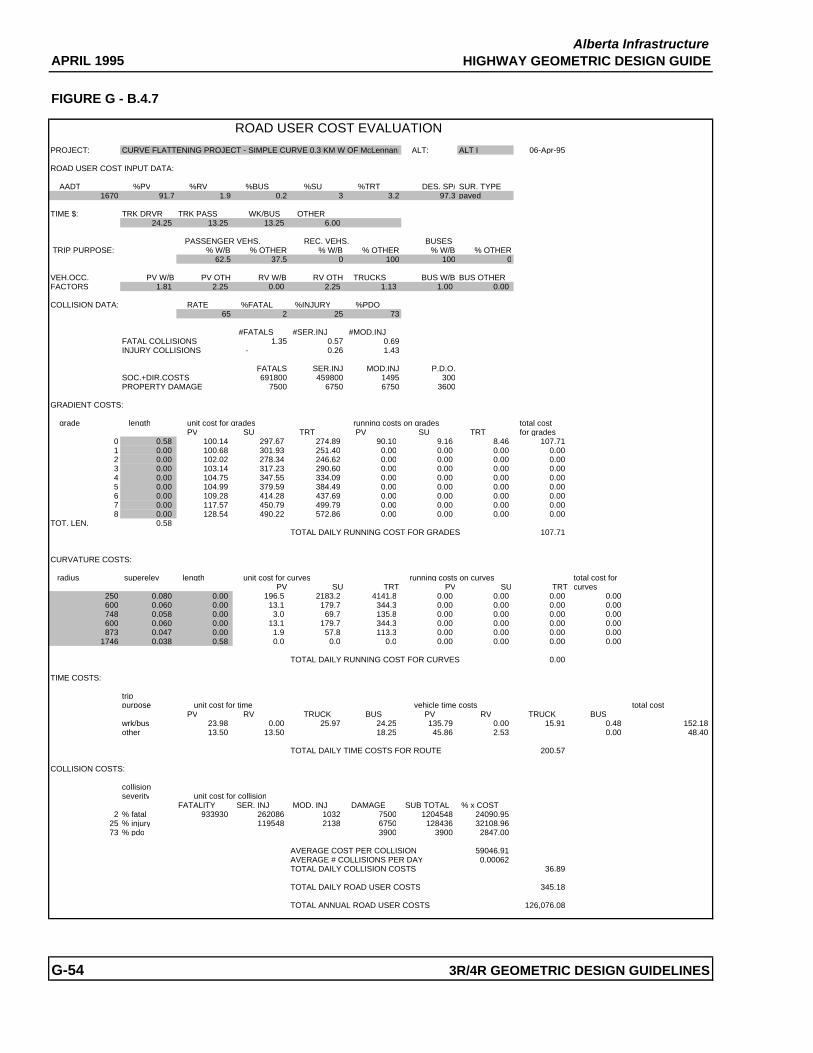
APRIL 1995
FIGURE G - B.4.7
ROAD USER COST EVALUATION
PROJECT: CURVE FLATTENING PROJECT - SIMPLE CURVE 0.3 KM W OF McLennan ALT: ALT I 06-Apr-95
ROAD USER COST INPUT DATA:
AADT %PV %RV %BUS %SU %TRT DES. SP/ SUR. TYPE1670 91.7 1.9 0.2 3 3.2 97.3 paved
TIME $: TRK DRVR TRK PASS WK/BUS OTHER24.25 13.25 13.25 6.00
PASSENGER VEHS. REC. VEHS. BUSES TRIP PURPOSE: % W/B % OTHER % W/B % OTHER % W/B % OTHER
62.5 37.5 0 100 100 0
VEH.OCC. PV W/B PV OTH RV W/B RV OTH TRUCKS BUS W/B BUS OTHERFACTORS 1.81 2.25 0.00 2.25 1.13 1.00 0.00
COLLISION DATA: RATE %FATAL %INJURY %PDO65 2 25 73
#FATALS #SER.INJ #MOD.INJFATAL COLLISIONS 1.35 0.57 0.69INJURY COLLISIONS - 0.26 1.43
FATALS SER.INJ MOD.INJ P.D.O.SOC.+DIR.COSTS 691800 459800 1495 300PROPERTY DAMAGE 7500 6750 6750 3600
GRADIENT COSTS:
grade length unit cost for grades running costs on grades total cost PV SU TRT PV SU TRT for grades
0 0.58 100.14 297.67 274.89 90.10 9.16 8.46 107.711 0.00 100.68 301.93 251.40 0.00 0.00 0.00 0.002 0.00 102.02 278.34 246.62 0.00 0.00 0.00 0.003 0.00 103.14 317.23 290.60 0.00 0.00 0.00 0.004 0.00 104.75 347.55 334.09 0.00 0.00 0.00 0.005 0.00 104.99 379.59 384.49 0.00 0.00 0.00 0.006 0.00 109.28 414.28 437.69 0.00 0.00 0.00 0.007 0.00 117.57 450.79 499.79 0.00 0.00 0.00 0.008 0.00 128.54 490.22 572.86 0.00 0.00 0.00 0.00
TOT. LEN. 0.58TOTAL DAILY RUNNING COST FOR GRADES 107.71
CURVATURE COSTS:
radius superelev length unit cost for curves running costs on curves total cost for PV SU TRT PV SU TRT curves
250 0.080 0.00 196.5 2183.2 4141.8 0.00 0.00 0.00 0.00600 0.060 0.00 13.1 179.7 344.3 0.00 0.00 0.00 0.00748 0.058 0.00 3.0 69.7 135.8 0.00 0.00 0.00 0.00600 0.060 0.00 13.1 179.7 344.3 0.00 0.00 0.00 0.00873 0.047 0.00 1.9 57.8 113.3 0.00 0.00 0.00 0.00
1746 0.038 0.58 0.0 0.0 0.0 0.00 0.00 0.00 0.00
TOTAL DAILY RUNNING COST FOR CURVES 0.00
TIME COSTS:
trippurpose unit cost for time vehicle time costs total cost
PV RV TRUCK BUS PV RV TRUCK BUSwrk/bus 23.98 0.00 25.97 24.25 135.79 0.00 15.91 0.48 152.18other 13.50 13.50 18.25 45.86 2.53 0.00 48.40
TOTAL DAILY TIME COSTS FOR ROUTE 200.57
COLLISION COSTS:
collision severity unit cost for collision
FATALITY SER. INJ MOD. INJ DAMAGE SUB TOTAL % x COST2 % fatal 933930 262086 1032 7500 1204548 24090.95
25 % injury 119548 2138 6750 128436 32108.9673 % pdo 3900 3900 2847.00
AVERAGE COST PER COLLISION 59046.91AVERAGE # COLLISIONS PER DAY 0.00062TOTAL DAILY COLLISION COSTS 36.89
TOTAL DAILY ROAD USER COSTS 345.18
TOTAL ANNUAL ROAD USER COSTS 126,076.08
G-54 3R/4R GEOMETRIC DESIGN GUIDELINES
Alberta InfrastructureHIGHWAY GEOMETRIC DESIGN GUIDE
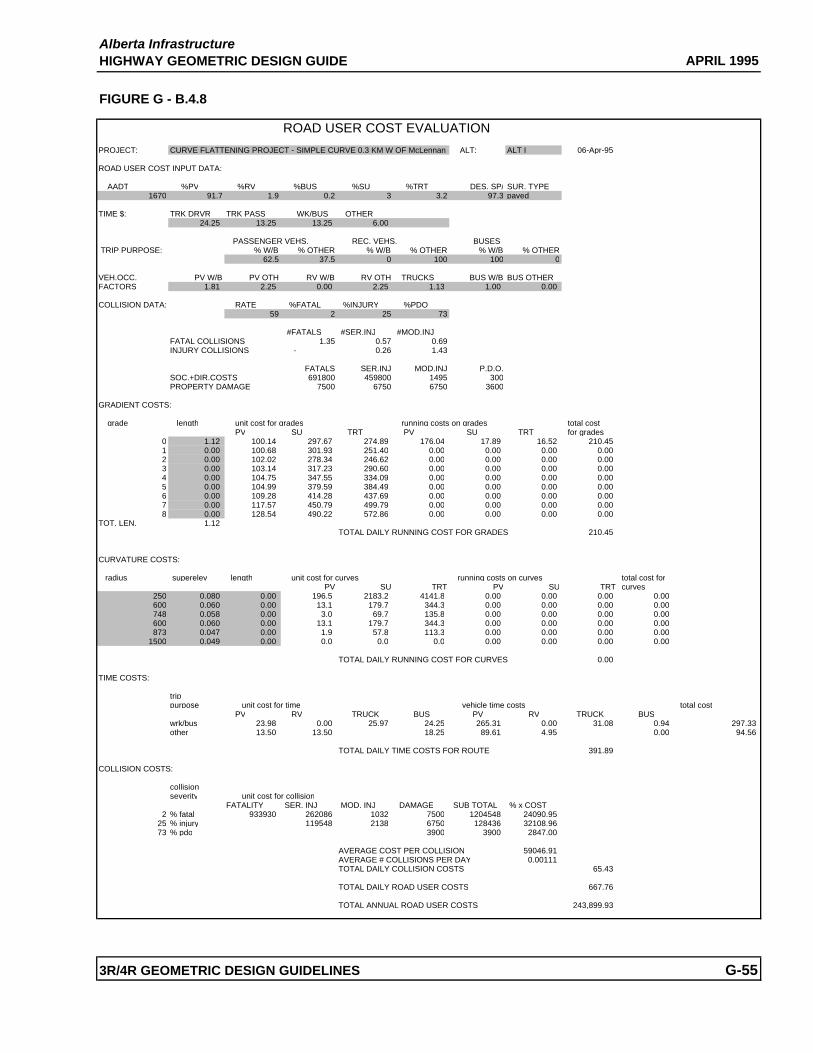
APRIL 1995
FIGURE G - B.4.8
ROAD USER COST EVALUATION
PROJECT: CURVE FLATTENING PROJECT - SIMPLE CURVE 0.3 KM W OF McLennan ALT: ALT I 06-Apr-95
ROAD USER COST INPUT DATA:
AADT %PV %RV %BUS %SU %TRT DES. SP/ SUR. TYPE1670 91.7 1.9 0.2 3 3.2 97.3 paved
TIME $: TRK DRVR TRK PASS WK/BUS OTHER24.25 13.25 13.25 6.00
PASSENGER VEHS. REC. VEHS. BUSES TRIP PURPOSE: % W/B % OTHER % W/B % OTHER % W/B % OTHER
62.5 37.5 0 100 100 0
VEH.OCC. PV W/B PV OTH RV W/B RV OTH TRUCKS BUS W/B BUS OTHERFACTORS 1.81 2.25 0.00 2.25 1.13 1.00 0.00
COLLISION DATA: RATE %FATAL %INJURY %PDO59 2 25 73
#FATALS #SER.INJ #MOD.INJFATAL COLLISIONS 1.35 0.57 0.69INJURY COLLISIONS - 0.26 1.43
FATALS SER.INJ MOD.INJ P.D.O.SOC.+DIR.COSTS 691800 459800 1495 300PROPERTY DAMAGE 7500 6750 6750 3600
GRADIENT COSTS:
grade length unit cost for grades running costs on grades total cost PV SU TRT PV SU TRT for grades
0 1.12 100.14 297.67 274.89 176.04 17.89 16.52 210.451 0.00 100.68 301.93 251.40 0.00 0.00 0.00 0.002 0.00 102.02 278.34 246.62 0.00 0.00 0.00 0.003 0.00 103.14 317.23 290.60 0.00 0.00 0.00 0.004 0.00 104.75 347.55 334.09 0.00 0.00 0.00 0.005 0.00 104.99 379.59 384.49 0.00 0.00 0.00 0.006 0.00 109.28 414.28 437.69 0.00 0.00 0.00 0.007 0.00 117.57 450.79 499.79 0.00 0.00 0.00 0.008 0.00 128.54 490.22 572.86 0.00 0.00 0.00 0.00
TOT. LEN. 1.12TOTAL DAILY RUNNING COST FOR GRADES 210.45
CURVATURE COSTS:
radius superelev length unit cost for curves running costs on curves total cost for PV SU TRT PV SU TRT curves
250 0.080 0.00 196.5 2183.2 4141.8 0.00 0.00 0.00 0.00600 0.060 0.00 13.1 179.7 344.3 0.00 0.00 0.00 0.00748 0.058 0.00 3.0 69.7 135.8 0.00 0.00 0.00 0.00600 0.060 0.00 13.1 179.7 344.3 0.00 0.00 0.00 0.00873 0.047 0.00 1.9 57.8 113.3 0.00 0.00 0.00 0.00
1500 0.049 0.00 0.0 0.0 0.0 0.00 0.00 0.00 0.00
TOTAL DAILY RUNNING COST FOR CURVES 0.00
TIME COSTS:
trippurpose unit cost for time vehicle time costs total cost
PV RV TRUCK BUS PV RV TRUCK BUSwrk/bus 23.98 0.00 25.97 24.25 265.31 0.00 31.08 0.94 297.33other 13.50 13.50 18.25 89.61 4.95 0.00 94.56
TOTAL DAILY TIME COSTS FOR ROUTE 391.89
COLLISION COSTS:
collision severity unit cost for collision
FATALITY SER. INJ MOD. INJ DAMAGE SUB TOTAL % x COST2 % fatal 933930 262086 1032 7500 1204548 24090.95
25 % injury 119548 2138 6750 128436 32108.9673 % pdo 3900 3900 2847.00
AVERAGE COST PER COLLISION 59046.91AVERAGE # COLLISIONS PER DAY 0.00111TOTAL DAILY COLLISION COSTS 65.43
TOTAL DAILY ROAD USER COSTS 667.76
TOTAL ANNUAL ROAD USER COSTS 243,899.93
3R/4R GEOMETRIC DESIGN GUIDELINES G-55
Alberta InfrastructureHIGHWAY GEOMETRIC DESIGN GUIDE
Alberta InfrastructureAPRIL 1995 HIGHWAY GEOMETRIC DESIGN GUIDE
G-56 3R/4R GEOMETRIC DESIGN GUIDELINES
� ��/��&'�'! &�����"� ��*� �#��'-*���'(*������, -��'�-
The economic analysis for horizontal alignment improvement is performed using a Lotus module known asBenefit-Cost which is available from Planning Services Branch (AI). A printout for the analysis on the exampleproject is shown in Table G.B.5. The input values and theory used in the Benefit-Cost module are fully explainedin the Benefit-Cost Analysis User Manual. A brief description follows:
A stream of costs and benefits for year 0 through to year 50 are input. The costs and benefits include construction,maintenance and road user costs for each alternative. In this case, the do nothing alternative is compared to thealignment improvement alternative. The annual differences in costs and benefits between the two alternatives arecompared to yield a net annual undiscounted value for the improvement for each year of the analysis. Thesevalues are used to generate a column of figures representing each year entitled sum of present worth @ fourpercent discount rate. These figures are in turn used to determine the Internal Rate of Return (IRR) for each yearof the analysis. The IRR is defined as the discount rate at which the present value of benefits equals the presentvalue of costs. The IRR is the key indicator of economic feasibility for the project. For comparison purposesbetween various proposals or between various projects, the IRR at the end of the design life of an improvement isgenerally used. A project should be considered economically feasible if the IRR exceeds four percent at the end ofthe design life.
In the case of this example, where the IRR is 2.48 percent at year 20, the horizontal alignment improvement shouldbe considered not economically feasible. A detailed treatment on how to assess the feasibility of a proposal isavailable in the Benefit-Cost Analysis Guide.

APRIL 1995
Table G.B.5
ALTERNATIVE I ROAD USER COST SAVINGSOverlay cost: AS CALCULATED USING LOTUS MODULE RUC68,000 x 2.29 = $155,700 every 20 years beginning the first year ALTERNATIVE I - Road User cost
- travel time cost 317095ALTERNATIVE II - running cost on grades 153847Construction cost: - excess running cost on curves 38969$1,237,000 - collision cost 58371
Total cost $568,282
Overlay cost ALTERNATIVE II - Road User cost 88,000 x 2.23 = $196,604 every 20 years - travel time cost 284354
- running cost on grades 152696- excess running cost on curves 15578
ASSUMPTIONS: - collision cost 56161- AADT and road user cost increase 2% Total cost $508,790 for first ten years and 1% annually thereafter.- 1993 AADT = 1670 Road User Savings: 568,282 - 508,790
= $59,492
IRR(REAL)
No. Year EXISTING ALT P-1 CR 110 CAP. COST R.U.C. COST+R.U.C (guess)CAP. R.U.C. CAP. R.U.C. DIFF. SAVINGS VALUES CAPITAL TOTAL 20.00%
0 1993 156 0 1,237 0 (1,081) 0 (1,081) (1,081) (1,081)1 1994 0 568 0 509 0 59 59 (1,081) (1,024) -94.50%2 1995 0 580 0 519 0 61 61 (1,081) (968) -73.40%3 1996 0 591 0 529 0 62 62 (1,081) (913) -54.51%4 1997 0 602 0 539 0 63 63 (1,081) (859) -40.73%5 1998 0 614 0 549 0 64 64 (1,081) (806) -30.83%6 1999 0 625 0 560 0 65 65 (1,081) (755) -23.60%7 2000 0 636 0 570 0 67 67 (1,081) (704) -18.17%8 2001 0 648 0 580 0 68 68 (1,081) (654) -14.02%9 2002 0 659 0 590 0 69 69 (1,081) (606) -10.76%
10 2003 0 671 0 600 0 70 70 (1,081) (558) -8.17%11 2004 0 682 0 611 0 71 71 (1,081) (512) -6.08%12 2005 0 688 0 616 0 72 72 (1,081) (467) -4.37%13 2006 0 693 0 621 0 73 73 (1,081) (424) -2.96%14 2007 0 699 0 626 0 73 73 (1,081) (381) -1.79%15 2008 0 705 0 631 0 74 74 (1,081) (340) -0.80%16 2009 0 710 0 636 0 74 74 (1,081) (301) 0.05%17 2010 0 716 0 641 0 75 75 (1,081) (262) 0.77%18 2011 0 722 0 646 0 76 76 (1,081) (225) 1.39%19 2012 0 727 0 651 0 76 76 (1,081) (189) 1.93%20 2013 156 733 197 656 (41) 77 36 (1,100) (172) 2.16%21 2014 0 739 0 661 0 77 77 (1,100) (138) 2.60%22 2015 0 744 0 667 0 78 78 (1,100) (105) 2.98%23 2016 0 750 0 672 0 79 79 (1,100) (74) 3.32%24 2017 0 756 0 677 0 79 79 (1,100) (43) 3.62%25 2018 0 761 0 682 0 80 80 (1,100) (13) 3.89%26 2019 0 767 0 687 0 80 80 (1,100) 16 4.13%27 2020 0 773 0 692 0 81 81 (1,100) 44 4.34%28 2021 0 779 0 697 0 82 82 (1,100) 71 4.54%29 2022 0 784 0 702 0 82 82 (1,100) 98 4.71%30 2023 0 790 0 707 0 83 83 (1,100) 123 4.86%31 2024 0 796 0 712 0 83 83 (1,100) 148 5.01%32 2025 0 801 0 717 0 84 84 (1,100) 172 5.13%33 2026 0 807 0 722 0 84 84 (1,100) 195 5.25%34 2027 0 813 0 728 0 85 85 (1,100) 217 5.36%35 2028 0 818 0 733 0 86 86 (1,100) 239 5.45%36 2029 0 824 0 738 0 86 86 (1,100) 260 5.54%37 2030 0 830 0 743 0 87 87 (1,100) 280 5.62%38 2031 0 835 0 748 0 87 87 (1,100) 300 5.70%39 2032 0 841 0 753 0 88 88 (1,100) 319 5.77%40 2033 156 847 197 758 (41) 89 48 (1,108) 329 5.80%41 2034 0 852 0 763 0 89 89 (1,108) 347 5.86%42 2035 0 858 0 768 0 90 90 (1,108) 364 5.91%43 2036 0 864 0 773 0 90 90 (1,108) 381 5.96%44 2037 0 869 0 778 0 91 91 (1,108) 397 6.01%45 2038 0 875 0 784 0 92 92 (1,108) 413 6.05%46 2039 0 881 0 789 0 92 92 (1,108) 428 6.09%47 2040 0 887 0 794 0 93 93 (1,108) 443 6.13%48 2041 0 892 0 799 0 93 93 (1,108) 457 6.16%49 2042 0 898 0 804 0 94 94 (1,108) 471 6.19%50 2043 0 904 0 809 0 95 95 (1,108) 484 6.22%
3R/4R GEOMETRIC DESIGN GUIDELINES G-57
ANNUAL COSTS NET ANNUAL UNDISCOUNTED VALUES SUM OF P.W.@ 4% DISCOUNT RATE
Alberta InfrastructureHIGHWAY GEOMETRIC DESIGN GUIDE
ECONOMIC ANALYSIS - HORIZONTAL ALIGNMENT IMPROVEMNETS
NOTE: All costs reported in thousands of 1993 dollars unless otherwise noted
CAPITAL & MAINTENANCE BENEFITS
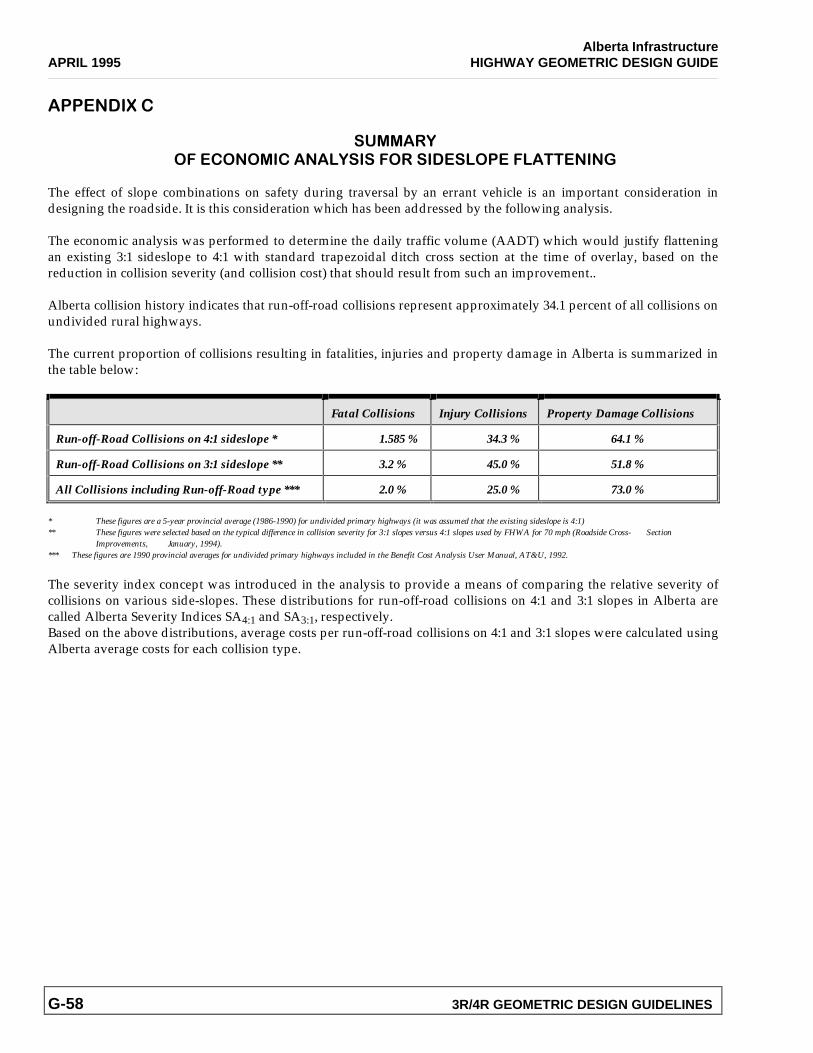
Alberta InfrastructureAPRIL 1995 HIGHWAY GEOMETRIC DESIGN GUIDE
G-58 3R/4R GEOMETRIC DESIGN GUIDELINES
�������I��
� ������� ����������������������������������������
The effect of slope combinations on safety during traversal by an errant vehicle is an important consideration indesigning the roadside. It is this consideration which has been addressed by the following analysis.
The economic analysis was performed to determine the daily traffic volume (AADT) which would justify flatteningan existing 3:1 sideslope to 4:1 with standard trapezoidal ditch cross section at the time of overlay, based on thereduction in collision severity (and collision cost) that should result from such an improvement..
Alberta collision history indicates that run-off-road collisions represent approximately 34.1 percent of all collisions onundivided rural highways.
The current proportion of collisions resulting in fatalities, injuries and property damage in Alberta is summarized inthe table below:
Fatal Collisions Injury Collisions Property Damage Collisions
Run-off-Road Collisions on 4:1 sideslope * 1.585 % 34.3 % 64.1 %
Run-off-Road Collisions on 3:1 sideslope ** 3.2 % 45.0 % 51.8 %
All Collisions including Run-off-Road type *** 2.0 % 25.0 % 73.0 %
* These figures are a 5-year provincial average (1986-1990) for undivided primary highways (it was assumed that the existing sideslope is 4:1)** These figures were selected based on the typical difference in collision severity for 3:1 slopes versus 4:1 slopes used by FHWA for 70 mph (Roadside Cross- Section
Improvements, January, 1994).*** These figures are 1990 provincial averages for undivided primary highways included in the Benefit Cost Analysis User Manual, AT&U, 1992.
The severity index concept was introduced in the analysis to provide a means of comparing the relative severity ofcollisions on various side-slopes. These distributions for run-off-road collisions on 4:1 and 3:1 slopes in Alberta arecalled Alberta Severity Indices SA4:1 and SA3:1, respectively.Based on the above distributions, average costs per run-off-road collisions on 4:1 and 3:1 slopes were calculated usingAlberta average costs for each collision type.
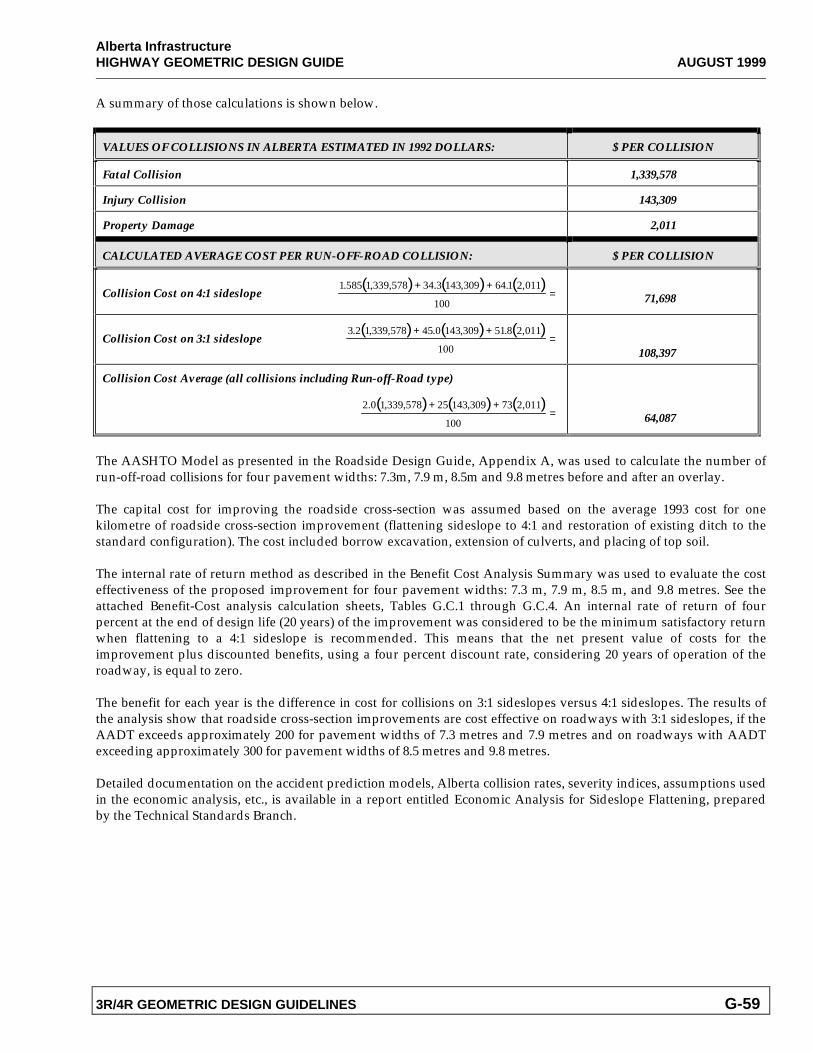
Alberta InfrastructureHIGHWAY GEOMETRIC DESIGN GUIDE AUGUST 1999
3R/4R GEOMETRIC DESIGN GUIDELINES G-59
A summary of those calculations is shown below.
VALUES OF COLLISIONS IN ALBERTA ESTIMATED IN 1992 DOLLARS: $ PER COLLISION
Fatal Collision 1,339,578
Injury Collision 143,309
Property Damage 2,011
CALCULATED AVERAGE COST PER RUN-OFF-ROAD COLLISION: $ PER COLLISION
Collision Cost on 4:1 sideslope( ) ( ) ( )1 585 1 339 578 34.3 143 309 64.1 2 011
100
. , , , ,+ += 71,698
Collision Cost on 3:1 sideslope( ) ( ) ( )3 1 339 578 45 0 143 309 51 8 2 011
100
.2 , , . , . ,+ +=
108,397
Collision Cost Average (all collisions including Run-off-Road type)
( ) ( ) ( )2 0 1 339 578 25 143 309 73 2 011
100
. , , , ,+ += 64,087
The AASHTO Model as presented in the Roadside Design Guide, Appendix A, was used to calculate the number ofrun-off-road collisions for four pavement widths: 7.3m, 7.9 m, 8.5m and 9.8 metres before and after an overlay.
The capital cost for improving the roadside cross-section was assumed based on the average 1993 cost for onekilometre of roadside cross-section improvement (flattening sideslope to 4:1 and restoration of existing ditch to thestandard configuration). The cost included borrow excavation, extension of culverts, and placing of top soil.
The internal rate of return method as described in the Benefit Cost Analysis Summary was used to evaluate the costeffectiveness of the proposed improvement for four pavement widths: 7.3 m, 7.9 m, 8.5 m, and 9.8 metres. See theattached Benefit-Cost analysis calculation sheets, Tables G.C.1 through G.C.4. An internal rate of return of fourpercent at the end of design life (20 years) of the improvement was considered to be the minimum satisfactory returnwhen flattening to a 4:1 sideslope is recommended. This means that the net present value of costs for theimprovement plus discounted benefits, using a four percent discount rate, considering 20 years of operation of theroadway, is equal to zero.
The benefit for each year is the difference in cost for collisions on 3:1 sideslopes versus 4:1 sideslopes. The results ofthe analysis show that roadside cross-section improvements are cost effective on roadways with 3:1 sideslopes, if theAADT exceeds approximately 200 for pavement widths of 7.3 metres and 7.9 metres and on roadways with AADTexceeding approximately 300 for pavement widths of 8.5 metres and 9.8 metres.
Detailed documentation on the accident prediction models, Alberta collision rates, severity indices, assumptions usedin the economic analysis, etc., is available in a report entitled Economic Analysis for Sideslope Flattening, preparedby the Technical Standards Branch.
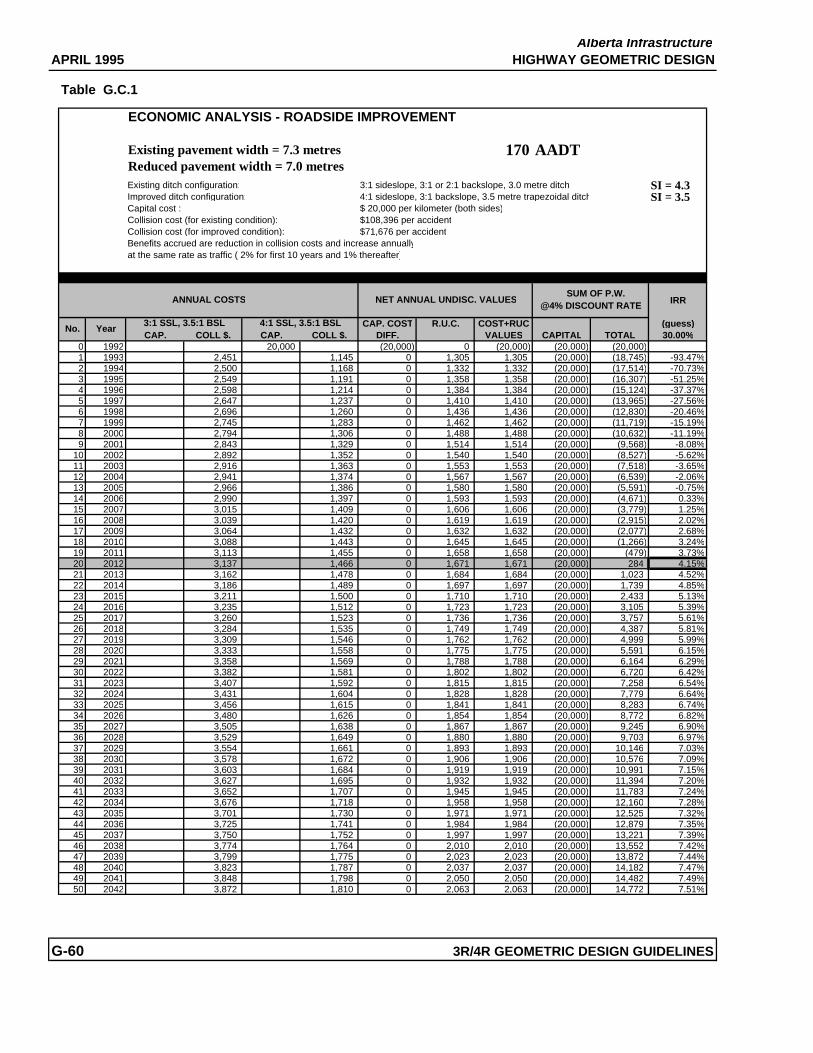
APRIL 1995
Table G.C.1
ECONOMIC ANALYSIS - ROADSIDE IMPROVEMENT
Existing pavement width = 7.3 metres 170 AADTReduced pavement width = 7.0 metresExisting ditch configuration: 3:1 sideslope, 3:1 or 2:1 backslope, 3.0 metre ditch SI = 4.3Improved ditch configuration: 4:1 sideslope, 3:1 backslope, 3.5 metre trapezoidal ditch SI = 3.5Capital cost : $ 20,000 per kilometer (both sides)Collision cost (for existing condition): $108,396 per accidentCollision cost (for improved condition): $71,676 per accidentBenefits accrued are reduction in collision costs and increase annuallyat the same rate as traffic ( 2% for first 10 years and 1% thereafter)
IRR
CAP. COST R.U.C. COST+RUC (guess)CAP. COLL $. CAP. COLL $. DIFF. VALUES CAPITAL TOTAL 30.00%
0 1992 20,000 (20,000) 0 (20,000) (20,000) (20,000)1 1993 2,451 1,145 0 1,305 1,305 (20,000) (18,745) -93.47%2 1994 2,500 1,168 0 1,332 1,332 (20,000) (17,514) -70.73%3 1995 2,549 1,191 0 1,358 1,358 (20,000) (16,307) -51.25%4 1996 2,598 1,214 0 1,384 1,384 (20,000) (15,124) -37.37%5 1997 2,647 1,237 0 1,410 1,410 (20,000) (13,965) -27.56%6 1998 2,696 1,260 0 1,436 1,436 (20,000) (12,830) -20.46%7 1999 2,745 1,283 0 1,462 1,462 (20,000) (11,719) -15.19%8 2000 2,794 1,306 0 1,488 1,488 (20,000) (10,632) -11.19%9 2001 2,843 1,329 0 1,514 1,514 (20,000) (9,568) -8.08%
10 2002 2,892 1,352 0 1,540 1,540 (20,000) (8,527) -5.62%11 2003 2,916 1,363 0 1,553 1,553 (20,000) (7,518) -3.65%12 2004 2,941 1,374 0 1,567 1,567 (20,000) (6,539) -2.06%13 2005 2,966 1,386 0 1,580 1,580 (20,000) (5,591) -0.75%14 2006 2,990 1,397 0 1,593 1,593 (20,000) (4,671) 0.33%15 2007 3,015 1,409 0 1,606 1,606 (20,000) (3,779) 1.25%16 2008 3,039 1,420 0 1,619 1,619 (20,000) (2,915) 2.02%17 2009 3,064 1,432 0 1,632 1,632 (20,000) (2,077) 2.68%18 2010 3,088 1,443 0 1,645 1,645 (20,000) (1,266) 3.24%19 2011 3,113 1,455 0 1,658 1,658 (20,000) (479) 3.73%20 2012 3,137 1,466 0 1,671 1,671 (20,000) 284 4.15%21 2013 3,162 1,478 0 1,684 1,684 (20,000) 1,023 4.52%22 2014 3,186 1,489 0 1,697 1,697 (20,000) 1,739 4.85%23 2015 3,211 1,500 0 1,710 1,710 (20,000) 2,433 5.13%24 2016 3,235 1,512 0 1,723 1,723 (20,000) 3,105 5.39%25 2017 3,260 1,523 0 1,736 1,736 (20,000) 3,757 5.61%26 2018 3,284 1,535 0 1,749 1,749 (20,000) 4,387 5.81%27 2019 3,309 1,546 0 1,762 1,762 (20,000) 4,999 5.99%28 2020 3,333 1,558 0 1,775 1,775 (20,000) 5,591 6.15%29 2021 3,358 1,569 0 1,788 1,788 (20,000) 6,164 6.29%30 2022 3,382 1,581 0 1,802 1,802 (20,000) 6,720 6.42%31 2023 3,407 1,592 0 1,815 1,815 (20,000) 7,258 6.54%32 2024 3,431 1,604 0 1,828 1,828 (20,000) 7,779 6.64%33 2025 3,456 1,615 0 1,841 1,841 (20,000) 8,283 6.74%34 2026 3,480 1,626 0 1,854 1,854 (20,000) 8,772 6.82%35 2027 3,505 1,638 0 1,867 1,867 (20,000) 9,245 6.90%36 2028 3,529 1,649 0 1,880 1,880 (20,000) 9,703 6.97%37 2029 3,554 1,661 0 1,893 1,893 (20,000) 10,146 7.03%38 2030 3,578 1,672 0 1,906 1,906 (20,000) 10,576 7.09%39 2031 3,603 1,684 0 1,919 1,919 (20,000) 10,991 7.15%40 2032 3,627 1,695 0 1,932 1,932 (20,000) 11,394 7.20%41 2033 3,652 1,707 0 1,945 1,945 (20,000) 11,783 7.24%42 2034 3,676 1,718 0 1,958 1,958 (20,000) 12,160 7.28%43 2035 3,701 1,730 0 1,971 1,971 (20,000) 12,525 7.32%44 2036 3,725 1,741 0 1,984 1,984 (20,000) 12,879 7.35%45 2037 3,750 1,752 0 1,997 1,997 (20,000) 13,221 7.39%46 2038 3,774 1,764 0 2,010 2,010 (20,000) 13,552 7.42%47 2039 3,799 1,775 0 2,023 2,023 (20,000) 13,872 7.44%48 2040 3,823 1,787 0 2,037 2,037 (20,000) 14,182 7.47%49 2041 3,848 1,798 0 2,050 2,050 (20,000) 14,482 7.49%50 2042 3,872 1,810 0 2,063 2,063 (20,000) 14,772 7.51%
G-60 3R/4R GEOMETRIC DESIGN GUIDELINES
Alberta InfrastructureHIGHWAY GEOMETRIC DESIGN
SUM OF P.W.@4% DISCOUNT RATE
No. Year3:1 SSL, 3.5:1 BSL 4:1 SSL, 3.5:1 BSL
ANNUAL COSTS NET ANNUAL UNDISC. VALUES

APRIL 1995
Table G.C.2
ECONOMIC ANALYSIS - ROADSIDE IMPROVEMENT
Existing pavement width = 7.9 metres 195 AADTReduced pavement width = 7.3 metresExisting ditch configuration: 3:1 sideslope, 3:1 or 2:1 backslope, 3.0 metre ditch SI = 4.3Improved ditch configuration: 4:1 sideslope, 3:1 backslope, 3.5 metre trapezoidal ditch SI = 3.5Capital cost : $ 20,000 per kilometer (both sides)Collision cost (for existing condition): $108,396 per accidentCollision cost (for improved condition): $71,676 per accidentBenefits accrued are reduction in collision costs and increase annuallyat the same rate as traffic ( 2% for first 10 years and 1% thereafter)
IRR
CAP. COST R.U.C. COST+RUC (guess)CAP. COLL $. CAP. COLL $. DIFF. VALUES CAPITAL TOTAL 30.00%
0 1992 20,000 (20,000) 0 (20,000) (20,000) (20,000)1 1993 2,558 1,258 0 1,300 1,300 (20,000) (18,750) -93.50%2 1994 2,609 1,283 0 1,326 1,326 (20,000) (17,524) -70.80%3 1995 2,660 1,308 0 1,352 1,352 (20,000) (16,322) -51.33%4 1996 2,711 1,333 0 1,378 1,378 (20,000) (15,144) -37.46%5 1997 2,763 1,359 0 1,404 1,404 (20,000) (13,990) -27.64%6 1998 2,814 1,384 0 1,430 1,430 (20,000) (12,860) -20.54%7 1999 2,865 1,409 0 1,456 1,456 (20,000) (11,754) -15.27%8 2000 2,916 1,434 0 1,482 1,482 (20,000) (10,671) -11.26%9 2001 2,967 1,459 0 1,508 1,508 (20,000) (9,611) -8.15%
10 2002 3,018 1,484 0 1,534 1,534 (20,000) (8,575) -5.68%11 2003 3,044 1,497 0 1,547 1,547 (20,000) (7,570) -3.72%12 2004 3,070 1,510 0 1,560 1,560 (20,000) (6,596) -2.12%13 2005 3,095 1,522 0 1,573 1,573 (20,000) (5,651) -0.81%14 2006 3,121 1,535 0 1,586 1,586 (20,000) (4,735) 0.28%15 2007 3,146 1,547 0 1,599 1,599 (20,000) (3,847) 1.19%16 2008 3,172 1,560 0 1,612 1,612 (20,000) (2,987) 1.97%17 2009 3,198 1,573 0 1,625 1,625 (20,000) (2,152) 2.63%18 2010 3,223 1,585 0 1,638 1,638 (20,000) (1,344) 3.19%19 2011 3,249 1,598 0 1,651 1,651 (20,000) (560) 3.68%20 2012 3,274 1,610 0 1,664 1,664 (20,000) 199 4.11%21 2013 3,300 1,623 0 1,677 1,677 (20,000) 935 4.48%22 2014 3,325 1,635 0 1,690 1,690 (20,000) 1,648 4.80%23 2015 3,351 1,648 0 1,703 1,703 (20,000) 2,339 5.09%24 2016 3,377 1,661 0 1,716 1,716 (20,000) 3,009 5.34%25 2017 3,402 1,673 0 1,729 1,729 (20,000) 3,657 5.57%26 2018 3,428 1,686 0 1,742 1,742 (20,000) 4,286 5.77%27 2019 3,453 1,698 0 1,755 1,755 (20,000) 4,894 5.95%28 2020 3,479 1,711 0 1,768 1,768 (20,000) 5,484 6.11%29 2021 3,504 1,723 0 1,781 1,781 (20,000) 6,055 6.25%30 2022 3,530 1,736 0 1,794 1,794 (20,000) 6,608 6.38%31 2023 3,556 1,749 0 1,807 1,807 (20,000) 7,144 6.50%32 2024 3,581 1,761 0 1,820 1,820 (20,000) 7,663 6.60%33 2025 3,607 1,774 0 1,833 1,833 (20,000) 8,165 6.70%34 2026 3,632 1,786 0 1,846 1,846 (20,000) 8,652 6.79%35 2027 3,658 1,799 0 1,859 1,859 (20,000) 9,123 6.86%36 2028 3,684 1,812 0 1,872 1,872 (20,000) 9,579 6.93%37 2029 3,709 1,824 0 1,885 1,885 (20,000) 10,020 7.00%38 2030 3,735 1,837 0 1,898 1,898 (20,000) 10,448 7.06%39 2031 3,760 1,849 0 1,911 1,911 (20,000) 10,862 7.11%40 2032 3,786 1,862 0 1,924 1,924 (20,000) 11,263 7.16%41 2033 3,811 1,874 0 1,937 1,937 (20,000) 11,651 7.21%42 2034 3,837 1,887 0 1,950 1,950 (20,000) 12,026 7.25%43 2035 3,863 1,900 0 1,963 1,963 (20,000) 12,390 7.29%44 2036 3,888 1,912 0 1,976 1,976 (20,000) 12,742 7.32%45 2037 3,914 1,925 0 1,989 1,989 (20,000) 13,082 7.35%46 2038 3,939 1,937 0 2,002 2,002 (20,000) 13,412 7.38%47 2039 3,965 1,950 0 2,015 2,015 (20,000) 13,731 7.41%48 2040 3,990 1,962 0 2,028 2,028 (20,000) 14,039 7.44%49 2041 4,016 1,975 0 2,041 2,041 (20,000) 14,338 7.46%50 2042 4,042 1,988 0 2,054 2,054 (20,000) 14,627 7.48%
3R/4R GEOMETRIC DESIGN GUIDELINES G-61
Alberta InfrastructureHIGHWAY GEOMETRIC DESIGN
NET ANNUAL UNDISC. VALUES SUM OF P.W.
@ 4% DISCOUNT RATEANNUAL COSTS
No. Year3:1 SSL, 3.5:1 BSL 4:1 SSL, 3.5:1 BSL
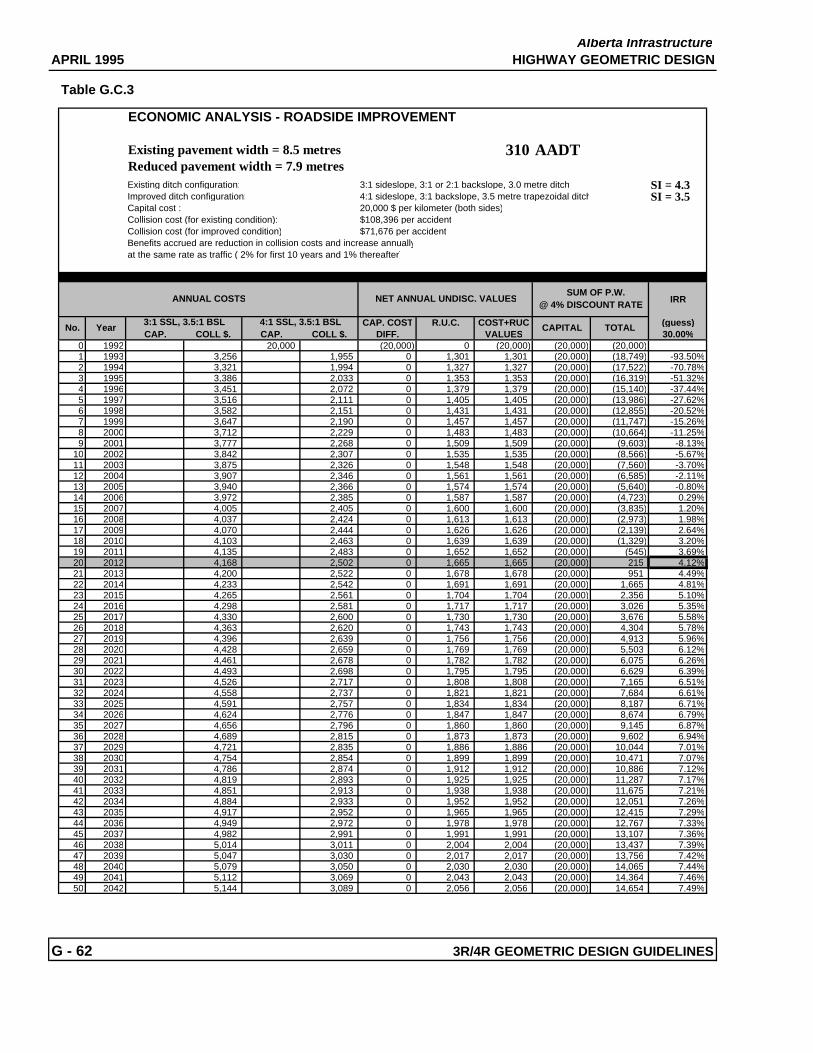
APRIL 1995
Table G.C.3
ECONOMIC ANALYSIS - ROADSIDE IMPROVEMENT
Existing pavement width = 8.5 metres 310 AADTReduced pavement width = 7.9 metresExisting ditch configuration: 3:1 sideslope, 3:1 or 2:1 backslope, 3.0 metre ditch SI = 4.3Improved ditch configuration: 4:1 sideslope, 3:1 backslope, 3.5 metre trapezoidal ditch SI = 3.5Capital cost : 20,000 $ per kilometer (both sides)Collision cost (for existing condition): $108,396 per accidentCollision cost (for improved condition) $71,676 per accidentBenefits accrued are reduction in collision costs and increase annuallyat the same rate as traffic ( 2% for first 10 years and 1% thereafter)
IRR
CAP. COST R.U.C. COST+RUC (guess)CAP. COLL $. CAP. COLL $. DIFF. VALUES 30.00%
0 1992 20,000 (20,000) 0 (20,000) (20,000) (20,000)1 1993 3,256 1,955 0 1,301 1,301 (20,000) (18,749) -93.50%2 1994 3,321 1,994 0 1,327 1,327 (20,000) (17,522) -70.78%3 1995 3,386 2,033 0 1,353 1,353 (20,000) (16,319) -51.32%4 1996 3,451 2,072 0 1,379 1,379 (20,000) (15,140) -37.44%5 1997 3,516 2,111 0 1,405 1,405 (20,000) (13,986) -27.62%6 1998 3,582 2,151 0 1,431 1,431 (20,000) (12,855) -20.52%7 1999 3,647 2,190 0 1,457 1,457 (20,000) (11,747) -15.26%8 2000 3,712 2,229 0 1,483 1,483 (20,000) (10,664) -11.25%9 2001 3,777 2,268 0 1,509 1,509 (20,000) (9,603) -8.13%
10 2002 3,842 2,307 0 1,535 1,535 (20,000) (8,566) -5.67%11 2003 3,875 2,326 0 1,548 1,548 (20,000) (7,560) -3.70%12 2004 3,907 2,346 0 1,561 1,561 (20,000) (6,585) -2.11%13 2005 3,940 2,366 0 1,574 1,574 (20,000) (5,640) -0.80%14 2006 3,972 2,385 0 1,587 1,587 (20,000) (4,723) 0.29%15 2007 4,005 2,405 0 1,600 1,600 (20,000) (3,835) 1.20%16 2008 4,037 2,424 0 1,613 1,613 (20,000) (2,973) 1.98%17 2009 4,070 2,444 0 1,626 1,626 (20,000) (2,139) 2.64%18 2010 4,103 2,463 0 1,639 1,639 (20,000) (1,329) 3.20%19 2011 4,135 2,483 0 1,652 1,652 (20,000) (545) 3.69%20 2012 4,168 2,502 0 1,665 1,665 (20,000) 215 4.12%21 2013 4,200 2,522 0 1,678 1,678 (20,000) 951 4.49%22 2014 4,233 2,542 0 1,691 1,691 (20,000) 1,665 4.81%23 2015 4,265 2,561 0 1,704 1,704 (20,000) 2,356 5.10%24 2016 4,298 2,581 0 1,717 1,717 (20,000) 3,026 5.35%25 2017 4,330 2,600 0 1,730 1,730 (20,000) 3,676 5.58%26 2018 4,363 2,620 0 1,743 1,743 (20,000) 4,304 5.78%27 2019 4,396 2,639 0 1,756 1,756 (20,000) 4,913 5.96%28 2020 4,428 2,659 0 1,769 1,769 (20,000) 5,503 6.12%29 2021 4,461 2,678 0 1,782 1,782 (20,000) 6,075 6.26%30 2022 4,493 2,698 0 1,795 1,795 (20,000) 6,629 6.39%31 2023 4,526 2,717 0 1,808 1,808 (20,000) 7,165 6.51%32 2024 4,558 2,737 0 1,821 1,821 (20,000) 7,684 6.61%33 2025 4,591 2,757 0 1,834 1,834 (20,000) 8,187 6.71%34 2026 4,624 2,776 0 1,847 1,847 (20,000) 8,674 6.79%35 2027 4,656 2,796 0 1,860 1,860 (20,000) 9,145 6.87%36 2028 4,689 2,815 0 1,873 1,873 (20,000) 9,602 6.94%37 2029 4,721 2,835 0 1,886 1,886 (20,000) 10,044 7.01%38 2030 4,754 2,854 0 1,899 1,899 (20,000) 10,471 7.07%39 2031 4,786 2,874 0 1,912 1,912 (20,000) 10,886 7.12%40 2032 4,819 2,893 0 1,925 1,925 (20,000) 11,287 7.17%41 2033 4,851 2,913 0 1,938 1,938 (20,000) 11,675 7.21%42 2034 4,884 2,933 0 1,952 1,952 (20,000) 12,051 7.26%43 2035 4,917 2,952 0 1,965 1,965 (20,000) 12,415 7.29%44 2036 4,949 2,972 0 1,978 1,978 (20,000) 12,767 7.33%45 2037 4,982 2,991 0 1,991 1,991 (20,000) 13,107 7.36%46 2038 5,014 3,011 0 2,004 2,004 (20,000) 13,437 7.39%47 2039 5,047 3,030 0 2,017 2,017 (20,000) 13,756 7.42%48 2040 5,079 3,050 0 2,030 2,030 (20,000) 14,065 7.44%49 2041 5,112 3,069 0 2,043 2,043 (20,000) 14,364 7.46%50 2042 5,144 3,089 0 2,056 2,056 (20,000) 14,654 7.49%
G - 62 3R/4R GEOMETRIC DESIGN GUIDELINES
CAPITAL TOTALNo. Year3:1 SSL, 3.5:1 BSL 4:1 SSL, 3.5:1 BSL
Alberta InfrastructureHIGHWAY GEOMETRIC DESIGN
ANNUAL COSTS NET ANNUAL UNDISC. VALUES SUM OF P.W.
@ 4% DISCOUNT RATE
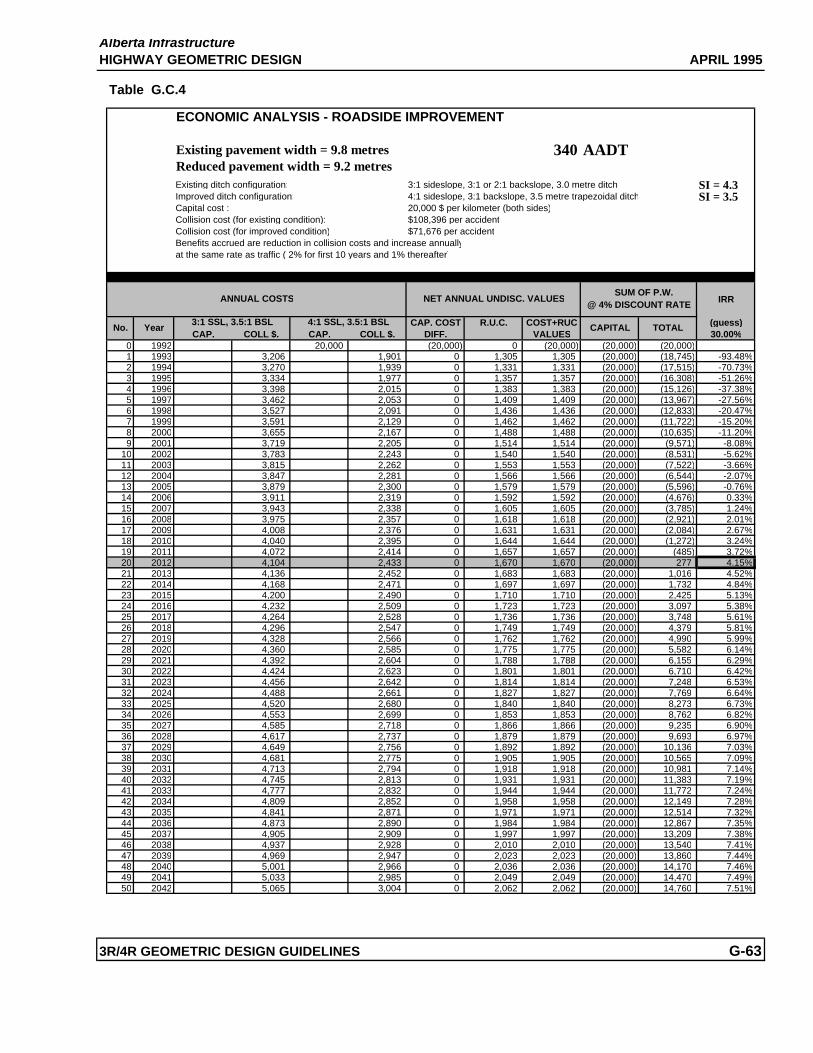
APRIL 1995
Table G.C.4
ECONOMIC ANALYSIS - ROADSIDE IMPROVEMENT
Existing pavement width = 9.8 metres 340 AADTReduced pavement width = 9.2 metresExisting ditch configuration: 3:1 sideslope, 3:1 or 2:1 backslope, 3.0 metre ditch SI = 4.3Improved ditch configuration: 4:1 sideslope, 3:1 backslope, 3.5 metre trapezoidal ditch SI = 3.5Capital cost : 20,000 $ per kilometer (both sides)Collision cost (for existing condition): $108,396 per accidentCollision cost (for improved condition) $71,676 per accidentBenefits accrued are reduction in collision costs and increase annuallyat the same rate as traffic ( 2% for first 10 years and 1% thereafter)
IRR
CAP. COST R.U.C. COST+RUC (guess)CAP. COLL $. CAP. COLL $. DIFF. VALUES 30.00%
0 1992 20,000 (20,000) 0 (20,000) (20,000) (20,000)1 1993 3,206 1,901 0 1,305 1,305 (20,000) (18,745) -93.48%2 1994 3,270 1,939 0 1,331 1,331 (20,000) (17,515) -70.73%3 1995 3,334 1,977 0 1,357 1,357 (20,000) (16,308) -51.26%4 1996 3,398 2,015 0 1,383 1,383 (20,000) (15,126) -37.38%5 1997 3,462 2,053 0 1,409 1,409 (20,000) (13,967) -27.56%6 1998 3,527 2,091 0 1,436 1,436 (20,000) (12,833) -20.47%7 1999 3,591 2,129 0 1,462 1,462 (20,000) (11,722) -15.20%8 2000 3,655 2,167 0 1,488 1,488 (20,000) (10,635) -11.20%9 2001 3,719 2,205 0 1,514 1,514 (20,000) (9,571) -8.08%
10 2002 3,783 2,243 0 1,540 1,540 (20,000) (8,531) -5.62%11 2003 3,815 2,262 0 1,553 1,553 (20,000) (7,522) -3.66%12 2004 3,847 2,281 0 1,566 1,566 (20,000) (6,544) -2.07%13 2005 3,879 2,300 0 1,579 1,579 (20,000) (5,596) -0.76%14 2006 3,911 2,319 0 1,592 1,592 (20,000) (4,676) 0.33%15 2007 3,943 2,338 0 1,605 1,605 (20,000) (3,785) 1.24%16 2008 3,975 2,357 0 1,618 1,618 (20,000) (2,921) 2.01%17 2009 4,008 2,376 0 1,631 1,631 (20,000) (2,084) 2.67%18 2010 4,040 2,395 0 1,644 1,644 (20,000) (1,272) 3.24%19 2011 4,072 2,414 0 1,657 1,657 (20,000) (485) 3.72%20 2012 4,104 2,433 0 1,670 1,670 (20,000) 277 4.15%21 2013 4,136 2,452 0 1,683 1,683 (20,000) 1,016 4.52%22 2014 4,168 2,471 0 1,697 1,697 (20,000) 1,732 4.84%23 2015 4,200 2,490 0 1,710 1,710 (20,000) 2,425 5.13%24 2016 4,232 2,509 0 1,723 1,723 (20,000) 3,097 5.38%25 2017 4,264 2,528 0 1,736 1,736 (20,000) 3,748 5.61%26 2018 4,296 2,547 0 1,749 1,749 (20,000) 4,379 5.81%27 2019 4,328 2,566 0 1,762 1,762 (20,000) 4,990 5.99%28 2020 4,360 2,585 0 1,775 1,775 (20,000) 5,582 6.14%29 2021 4,392 2,604 0 1,788 1,788 (20,000) 6,155 6.29%30 2022 4,424 2,623 0 1,801 1,801 (20,000) 6,710 6.42%31 2023 4,456 2,642 0 1,814 1,814 (20,000) 7,248 6.53%32 2024 4,488 2,661 0 1,827 1,827 (20,000) 7,769 6.64%33 2025 4,520 2,680 0 1,840 1,840 (20,000) 8,273 6.73%34 2026 4,553 2,699 0 1,853 1,853 (20,000) 8,762 6.82%35 2027 4,585 2,718 0 1,866 1,866 (20,000) 9,235 6.90%36 2028 4,617 2,737 0 1,879 1,879 (20,000) 9,693 6.97%37 2029 4,649 2,756 0 1,892 1,892 (20,000) 10,136 7.03%38 2030 4,681 2,775 0 1,905 1,905 (20,000) 10,565 7.09%39 2031 4,713 2,794 0 1,918 1,918 (20,000) 10,981 7.14%40 2032 4,745 2,813 0 1,931 1,931 (20,000) 11,383 7.19%41 2033 4,777 2,832 0 1,944 1,944 (20,000) 11,772 7.24%42 2034 4,809 2,852 0 1,958 1,958 (20,000) 12,149 7.28%43 2035 4,841 2,871 0 1,971 1,971 (20,000) 12,514 7.32%44 2036 4,873 2,890 0 1,984 1,984 (20,000) 12,867 7.35%45 2037 4,905 2,909 0 1,997 1,997 (20,000) 13,209 7.38%46 2038 4,937 2,928 0 2,010 2,010 (20,000) 13,540 7.41%47 2039 4,969 2,947 0 2,023 2,023 (20,000) 13,860 7.44%48 2040 5,001 2,966 0 2,036 2,036 (20,000) 14,170 7.46%49 2041 5,033 2,985 0 2,049 2,049 (20,000) 14,470 7.49%50 2042 5,065 3,004 0 2,062 2,062 (20,000) 14,760 7.51%
3R/4R GEOMETRIC DESIGN GUIDELINES G-63
CAPITAL TOTALNo. Year3:1 SSL, 3.5:1 BSL 4:1 SSL, 3.5:1 BSL
Alberta InfrastructureHIGHWAY GEOMETRIC DESIGN
ANNUAL COSTS NET ANNUAL UNDISC. VALUES SUM OF P.W.
@ 4% DISCOUNT RATE

Alberta InfrastructureAPRIL 1995 HIGHWAY GEOMETRIC DESIGN GUIDE
G-64 3R/4R GEOMETRIC DESIGN GUIDELINES
�������I���
� ������������������� �9� � ���������������������������������������������+�).�����O���
This table was developed based on the following principles:
1. On flatter curves and curves of medium radius; that is, where the superelevation rate for new construction isless than 0.04m/m, the factor of safety against side-slip is high and fdemand at design speed is relatively low.Therefore, a 0.02m/m tolerance in the superelevation rate is allowed.
2. On sharper curves, where the superelevation rate for new construction is between 0.04m/m and 0.06m/m, the
allowable variance from design superelevation is gradually reduced as the radius is decreased. At e=0.06m/m(which is the minimum radius for new construction) the superelevation rate suggested on 3R projects is thesame as that required on new construction. This is because fdemand at this radius is equal to the theoreticalmaximum safe-side friction factor for this speed (based primarily on comfort considerations).
3. On curves that are sharper than the Rmin used for new construction, it is important to restrict the fdemand to
fmax (the maximum safe-side friction factor) where possible. Therefore, the superelevation rate is increasedup to 0.08m/m as required for sharper curves.
4. Because 0.08m/m is considered a practical maximum for superelevation on Alberta highways, e is not
increased beyond this point. However, because it is recognized that existing curves with radii below the Rminfor new construction can provide good service and have reasonable safety records, a lower Rmin is suggestedfor existing paved roads. Even the Rmin suggested for 3R projects should not be interpreted as an absoluteminimum radius but rather as a benchmark value. Radii below the benchmark value should routinely beevaluated for realignment. However, in many cases especially on lower volume highways, realignment maynot be cost effective. Overlay of the existing alignment even with curves sharper than Rmin, possibly with theaddition of speed advisory signs where warranted should not be ruled out. This may be the most viablealternative in some cases when all factors, including construction costs, road user costs and collision costs areconsidered. The following recommendation is published in the U.S. Transportation Research Board’s (TRB)Special Report 214 Highway agencies should evaluate reconstruction of horizontal curves when the designspeed of the existing curve is more than 15 m.p.h. (24 km/h) below the running speed of approaching vehicles(assuming improved superelevation cannot reduce this difference to less than 15 m.p.h.) and the average dailytraffic volume is greater than 750 vehicles per day. Alberta’s guideline differs from TRBs in that no speeddifferential is used and because all highways with sharp curvature are recommended for evaluation, not justthose with volumes exceeding 750 vehicles per day.
The following summary lists the rules used to set up the values for Rmin for each superelevation rate for V85 =110 km/h. Similar rules were used for the other speeds.
e3R for V85 = 110 km/h (85th percentile speed)
NC allowed until fdemand = 0.02±e, (f=0.04 for 0.02+e, f=0.00 for 0.02-e)RC allowed until fdemand = 0.03 R=1900e = 0.03 allowed until fdemand = 0.043 R=1300e = 0.04 allowed until fdemand = 0.05 R=1060e = 0.05 allowed until fdemand = 0.07 R=800e = 0.06 allowed until fdemand = 0.10 R=600 (f max) new constructione = 0.07 allowed until fdemand = 0.10 R=560e3R = 0.08 allowed until fdemand = 0.10 R=530