chapter – iii - shodhgangashodhganga.inflibnet.ac.in/bitstream/10603/21247/8/08_chapter 3.pdf ·...
TRANSCRIPT


-
13013
CHAPTER – III
RESEARCH METHODOLOGY
Introduction
The present study is indented to find out the Effectiveness of
teaching Vedic Mathematics on students’ Achievement of class
VII. In the present chapter, the design and procedure followed to
carry out the study has been presented in detail.
The details of the design and procedure are discussed as:-
3.1.1 Statement of the problem
3.1.2 Definitions of the Key terms
3.1.3 Objectives of the study
3.1.4 Hypothesis of the study
3.1.5 Delimitation of the study
3.1.6 Variables of the study
3.2 Sample
3.3 Method of Research
3.4 Experimental design
3.5 Procedure of the study

-
13113
3.6 Research Tools
3.7 Data Collection
3.8 Analysis of Data
Conclusion
3.1.1 Statement of the problem
“A Study of Effectiveness of teaching Vedic Mathematics on
Students’ Achievement”.
3.1.2 OPERATIONAL DEFINITIONS OF KEY TERMS :
Effectiveness : The capability of producing a desired result.
Teaching : The act of imparting knowledge.
Vedic Mathematics: Solving mathematical problems easily with
the help of some sutras.
Achievement : The act of achieving or performing;
successful performance.
3.1.3 Objectives of the study:
• To study the effectiveness of teaching through Vedic
Mathematics and Conventional methods in relation to
achievement of students.

-
13213
• To compare the means scores on the achievement of
Mathematics of the two groups of students to be taught
through Vedic Mathematics and conventional method of
teaching before the experiment treatment
• To compare the means scores on the achievement of
Mathematics of the two groups of students to be taught
through Vedic Mathematics and conventional method of
teaching after the experiment treatment.
• To find out whether Vedic mathematics is useful for all
levels of students. (High achievers & Low achievers).
• To create awareness about the importance of Vedic
Mathematics among students.
3.1.4 Hypothesis:
Ho1: There is no significant difference in the mean scores of
experimental group & control group on pre-test.
Ho2: There is no significant difference in the mean scores of high
achievers of the experimental group & the control group on pre-
test.

-
13313
Ho3: There is no significant difference in the mean scores of low
achievers of the experimental group & the control group on
pre-test.
Ho4: There is no significant difference in the mean scores of the
experimental group & the control group on post-test.
Ho5: There is no significant difference in the mean scores of high
achievers of the experimental group & the control group on post -
test.
Ho6: There is no significant difference in the mean scores of low
achievers of the experimental group & the control group on post -
test.
Ho7: There is no significant difference in the mean scores of high
achievers and low achievers in the experimental group on post-test
Ho8: There is no significant difference in the mean scores of high
achievers and low achievers in the control group on post-test
Ho9: There is no significant difference in the mean scores of girls
in the experimental group & the control group on pre-test.
Ho10: There is no significant difference in the mean scores of boys
in the experimental group & the control group on pre-test

-
13413
Ho11: There is no significant difference in the mean scores of girls
in the experimental group & the control group on post-test
Ho12: There is no significant difference in the mean scores of boys
in the experimental group & the control group on post-test
Ho13: There is no significant difference in the mean scores of boys
and girls in the experimental group on pre-test.
Ho14: There is no significant difference in the mean scores of boys
and girls in the control group on pre-test
Ho15: There is no significant difference in the mean scores of boys
and girls in the experimental group on post-test
Ho16: There is no significant difference in the mean scores of boys
and girls in the control group on post-test.
3.1.5 DELIMITATIONS
1. The study will be confined to Mathematics Subject only.
2. The study will be delimited to Thane District only.
3. The study will be delimited to Secondary Section class only.
4. The study will be delimited to English Medium Students only.
5. The study will be delimited to 130 students only.
6. In Vedic mathematics there are 16 sutras. It is very descriptive
and consumes a lot of time and also students may get confused if

-
13513
all the 16 sutras are taught to them at one time. So, to make them
understand very easily and keeping the time in mind, the researcher
selected only few sutras.
3.1.6 Variables selected for the study:
In the present study the researcher used the following variables:
Independent variables: Teaching Vedic mathematics
Dependent Variable : Students’ Achievement
Variables controlled : Teacher, Time, Average Age, and
Classroom conditions.
Variables uncontrolled: I.Q. of the students, their previous
achievement, socio - economic status, anxieties, self-concept,
interests and attitude.
Variables – Variables are characteristics experimenter manipulates
controls or observes in an experimental study i.e element or
characteristic being studied.
In layman’s understanding, a variable means a quality ‘which
varies’. A research problem involves study of variations in either
one variable over time, or social, economic, cultural or geographic
groups, or the relationships between the variations in several
variables. For example, the study may be just about how the height

-
13613
varies among persons in population. This is the case of variable
‘height’. Alternatively, one may wish to study the variations in
height and their relationship to variations in family incomes, etc.
Here, the variable height is related to the second variable ‘family
income’. In these two cases, the variables are quantitative i.e., their
values can be expressed in numbers. Variables whose values can be
expressed in terms of numbers are called quantitative variables.
The variables are not directly expressed in terms of numbers. Such
variables are called qualitative variables. However, qualitative
variables can be converted into quantitative variables by assigning
suitable numerical codes to their values. For example, all states can
be numbered 1 to 35 in alphabetical order, gender can be expressed
as codes1 and 2, managerial styles can be classified and given
numerical representations (e.g. 1 for authoritative, 3 for
democratic, etc.). it is also possible to convert quantitative
variables.
There are two types of variables. a) Independent variable b)
Dependant variable. (Best and Kahn 1996 p.137).

-
13713
3.2 Sample of the study
In this research, the random sampling technique was used for the
selection of the sample. 130 students of Lourdes high school,
Kalyan (W) and Shankara Vidyala, Dombivili(E) were divided into
two groups, as Experimental group and Control group. The number
of students in each group was 65.
Since the sample size is small there might arise the problem of
generalizing to a large population, but it must be noted that large
sample is not feasible in this study because it is an in depth study,
taking place for a long duration (12 weeks including the
intermittent holidays). Not only that, it is beyond the control of the
researcher. Smaller samples were taken for number of experimental
studies.
A sample represents the population and it is “any part of a
population of individuals on whom information is obtained”
(Frankel &Wallen 2006, p.107)..

-
13813
A random sample is a sub-set of units that are selected randomly
from a population. In a random sampling all the possible samples
of the same size have the same probability of being included in the
sample. For example, if the process of selecting 1000 households
from 2,00,000 households using chits or random number tables
mentioned above to estimate household income in a city.
The advantages of Random sampling are as follows:
• It is a simple process of sample selection through chance
mechanism. Thus, it avoids all personal and other biases in
selection.
• It gives equal chance to every possible sample of the same
size.
• The design is applicable in all situations.
Judgement or purposive sampling: The researcher selects a
sample to serve a specific purpose, even if this makes a sample less
than fully representative.
-
13913
Judgement samples are most useful in studying those cases, which
we believe, are in the best position to provide us with information.
For example, we may be interested only in those who hold extreme
position, have had certain types of experiences within the last few
years, and so forth. The subjects may be those, which are judged by
some expert to be the best ones for study. In these cases we seek a
particular type of subject and may not even be interested in
securing a cross-section of a population.
Advantages of Purposive Sampling:
1. Purposive sampling is less costly.
2. It is more readily accessible to the investigator.
Quota sampling
In Quota sampling we are interested in selecting subjects to
conform to certain predesigned control measures. For example, we
may know that the student body at Madras University is 55 per

cent male and 45 per cent female. We may require interviewers in
-
14014
this ratio.
In most quota samples we specify more than one control
dimension, depending upon our opinions or evidence as to their
importance. For example, we may believe that response to a
question should vary, depending upon the sex of the respondent. If
so, we seek proportional responses from both men and women. We
may also feel that undergraduates differ from graduate students, so
this would be a dimension. We may also choose dimensions such
as the student’s academic discipline, ethnic group, religious
affiliation and social group affiliation.
This reasoning by analogy is obviously dangerous and gives no
assurance that the sample is truly representative.
In spite of these weakness already mentioned, quota sampling is
widely used by the opinion pollsters and researchers. Its advocates
feel that, while there is some danger of systematic bias, the risks

-
14114
are worth taking. They are interested in averages and these tend to
be rather stable even if there is some bias involved.
3.3 METHOD OF RESEARCH
The various types of research are explained below. But, the
researcher had selected Experimental research for her study.
Historical Research - describes what was.
Quantitative descriptive research: Quantitative descriptive
research uses quantitative methods to describe what is.
Qualitative descriptive research: Qualitative descriptive research
uses systematic procedures to discover non quantifiable
relationships between exiting variables.
Experimental research: Experimental research describes what
will happen when certain variables are carefully controlled or
manipulated. As defined here, deliberate manipulation is always a
part of the experimental method.
“If this is done under carefully controlled conditions, what will
happen?” After experiments define a problem, they propose a

-
14214
tentative answer or guessed answer or hypothesis. After testing the
hypothesis the experimenter confirm or disconfirm. It is important
to note that the confirmation or rejection of the hypothesis is stated
in terms of probability rather than certainty.
In testing hypothesis or evaluating tentative answers to questions,
experimenters make decisions based on probability rather than on
certainty.
Teachers can make their most effective contribution to educational
research by identifying important problems that they encounter in
their classrooms and by working cooperatively with research
specialists in the conduct and interpretation of classroom
experiments.
3.4 Experimental design
The present study was experimental in nature. For this purpose,
‘The Pre-test- Post-test Equivalent-Groups Design’ was used. The
design of the study was as follows:-

-
14314
Stage Control Group Exper imental Group
1. Pre-test Measurement of achievement in Mathematics
Measurement of achievement in
Mathematics
2.Treatment Teaching problems of Mathematics through Traditional
Method
Teaching problems of
Mathematics
through Vedic
Mathematics.
3.post-Test Measurement of achievement in Mathematics
Measurement of achievement in
Mathematics
Experimental research is the blue print of the research. Choice of a
exact design is depend upon the intention of the experiment, the
type of variables to be manipulated and the situations or restrictive

-
14414
factors under which it is to be conducted. The intend plan deals
with such practical problems as how subjects are to be manipulated
and restricted, and the type of statistical analysis to be used in
interpreting data relationships. The design of an experiment has the
purpose of giving the collection of details in such a manner that
inferences of a casual relationship between the dependent and
independent variables can be drawn while framing an experimental
design some important aspects should be kept in mind such as the
method of selecting experimental and control groups, measurement
of dependent and independent variables, time of measurement,
pattern of controlled groups used and number of possible casual
variables.
The purpose of an experimental design is to obtain maximum
information with the minimum of cost and labour. For this purpose,
two groups are chosen in such a manner that they do not differ
from each other in significant respects except by chance. The
experimental group is exposed to the independent variable while

-
14514
the controlled group is not. The two groups are then compared in
terms of the assumed effect.
Types of experimental design
The adequacy of experimental designs is judged by the degree to
which they eliminate or minimize threats to experimental validity.
Three categories are presented here:
i) Pre-experimental design
ii) True experimental design
iii) Quasi- experimental design
Each category is further subdividing into a number
designs .
Pre-experimental design: Pre experimental designs involve only
one group. A Pre experimental design always control the
extraneous variables that Jeopardize validity. The least adequate of
designs is characterised by:
i) the lack of a control group, or ii) a failure to provide for the
equivalence of a control group.

-
14614
The One group pre-test-post-test Design: This design provides
some improvement over the first one.
True experimental designs
The pre-test – post-test Equivalent-Groups design
R O1 X O2 X gain = O2 - O1 O1 O2 =
pre-test
R
O3
C
O4
C gain = O4 – O3
O2 O4 =
post-test
The above design has been used in the present study. This design is
similar to the previously described design.
The Time-Series Design:
At periodic intervals, observations (measurements) are applied to
individuals or a group. The purpose of the series of measurements
before and after the intervention or treatment is to demonstrate
little or no change except immediately after the intervention.

-
14714
The Equivalent Time- Samples Design:
Instead of having equivalent samples of persons, it may be
necessary to use one group as the experimental and control group.
In this design, the experimental condition (X1) is present between
some observations and not (Xo) between others.
The Equivalent Materials, Pre test, Post test Design:
Another experimental design, using the same group or class for
both experimental and control groups, involves two or more cycles.
The class may be used as a control group in the first cycle and as
an experimental group in the second.
Factorial Designs:
When more than one independent variable is included in a study,
whether a true experimental or a quasi-experiment, a factorial
design is necessary.
3.5 Procedure of the study
The procedure of the study consisted of following steps:

-
14814
1. The Researcher contacted Fr. Philip Gonsalves, the Principal
of the Lourdes High School, Kalyan (W) and Mrs.Sorupa,
the Head Mistress of Shankara Vidyalaya, Dombivili(E),the
Institutions selected for conducting the experiment.
2. The Lourdes high School Supervisor, Mrs. Elizabeth and
Shankara Vidyalaya’s Supervisor, Mrs.Sudha
Ramakrishanan were contacted for necessary arrangements
of classrooms for the Experiment.
3. The pre-test was administered on students in order to acquire
their pre-test scores. Their pre-test scores were arranged in
descending order and the students of the sample were
allotted into two groups. The groups were randomly
assigned to one control and one experimental group.
4. The pre-test results were preserved for the purpose of data
analysis.
5. The experimental group was taught by the researcher herself
by the method of Vedic Mathematics.
-
14914
6. The control group was taught by the researcher herself in
traditional way.
7. The duration of the experiment was spread over six weeks.
8. On the final day of the experiment, the post-test was
administered.
3.5.1 Sample Equating Test
All students were selected from 7th class of the two schools. Total
sample was 130, which was divided into two groups (i.e.
experimental and control) of 65 students each. Experimental group
had 65 students. In this group of 65 students, forty students were
high achievers, twenty five were low achievers. And also the two
groups i.e. experimental group and control group students were
divided into boys group and girls group. 37 boys and 28 girls were
selected in the experimental group and 41 boys and 24 girls were
selected in the control group for the study.

-
15015
3.6 Research Tools
Pre-test and post- test was administered to conduct the research.
3.6.1 Validity of the Test
Validity of the tests was evaluated by a committee, which
consisted of Mathematics teachers and Teacher Educators.
Validity:
It is clear that the definition of validity has two parts:
a) that the measuring instruments are actually
measuring the concept in question, and not some other
concept; and b) that the concept is being measured
accurately.
Assessing Validity: A casual reading of the research
literature, reveals the existence of many alleged
validation procedures. One type is face validation and
the another is criterion validation by Selltiz et al. Two
forms of pragmatic validation distinguished by
Selltiz are concurrent validation and predictive

-
15115
validation. Kerlinger also uses their terms “predictive”
and “concurrent” validity. The third major form of
validation is construct validation.
Face Validity: Face Validation is probably the easiest
validation procedure to explain but the most difficult
to carry out in the course of actual filed research.
Criterion Validity: Criterion validity, variously
called pragmatic validity, concurrent validity, or
predictive validity, involves multiple measurement of
the same concept. The term “concurrent validity” has
been used to describe a measure that is valid for
measuring a particular phenomenon at the present
time. An example of the former would be prejudice
scale that is capable of distinguishing between
prejudiced and on prejudiced respondents. Face

-
15215
validity cannot be proved but must be assumed; that is,
the measure must at least appear to be valid.
Construct Validity: Imagine that we construct two
indices of social class, which we may label index 2.
Assume that we have a theory that contains a
proposition stating an inverse relationship between
social class and prejudice as social class increased,
prejudice decreases. Assume further that this
proposition has been tested by measuring social class
by index 1, and has been substantiated. Construct
validity consists of replacing index 1 by index 2 in the
theory and retesting the entire theory. If we get the
same results for the whole theory (especially for the
proposition containing index2) as when we used index
1 to measure social class, then we say that the new
measure (index 2) has construct validity.
-
15315
Internal and External Validity: In addition to face
validity, criterion validity, and construct validity, two
other somewhat different uses of them .
“validity” have appeared is research literature—
internal and external validity, webb et al. define these
terms as follows:
Internal validity asks whether a difference exists at all
in any given comparison. To what other population,
occasions, stimulus objects, and measures may they
obtained results be applied.
The terms were developed within an experimental
context and apply to sources of error within the
experimental (internal validity) and to problems of
generalizing from the experiment to a larger
population. For example, if one does not encounter
contradictions in the data within a given experiment,

-
15415
then the study is said to have internal validity.
Contradictory findings signal the absence of internal
validity. Even if internal validity is present, the
findings are not said to have external validity unless
they are held to be valid for additional (external)
situations besides the original study that generated the
findings.
3.7 Data Collection
Two different treatment patterns were applied during the research.
The researcher provided both the groups the same direct
instruction strategy with same lesson plans and activities, except
for the control group was provided with traditional routine situation
in the class room while experimental group was provided with
Vedic mathematic method of teaching as treatment. The
experimental continued for six weeks. Soon after the treatment was
over, post test was administered on the same day and same time

-
15515
3.8 Analysis of data
For the purpose of interpretation, Raw scores obtained from pre
test and post test were presented in tabular form. For the
manipulation of data, the means, standard deviation and t-test were
used.
The following formulae were applied:
1. Mean (X)
(Best and Kahn, 2004, P.279)
The mean of the distribution is commonly understood as the
arithmetic average. It is computed by dividing the sum of all the
scores by the number of scores.
In formula form
X = ΣX / N
Where X = means,
Σ= sum of
X = scores in a distribution
-
15615
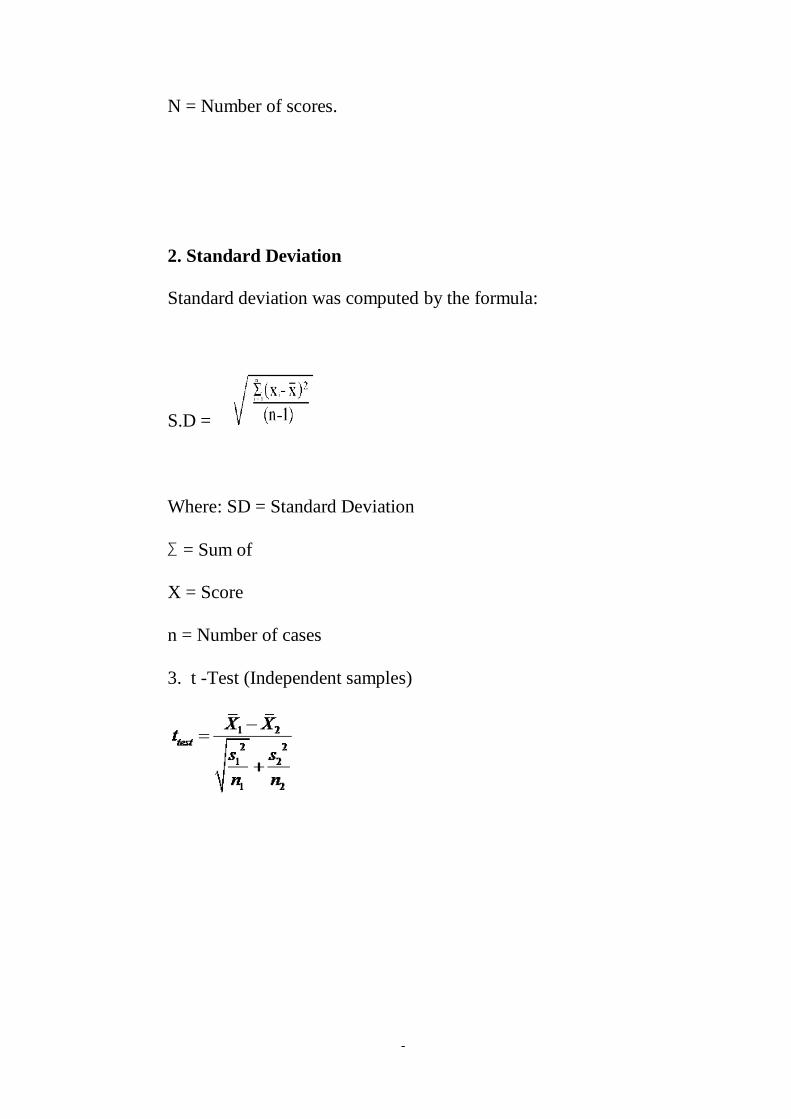
N = Number of scores.
2. Standard Deviation
Standard deviation was computed by the formula:
S.D =
Where: SD = Standard Deviation
Σ = Sum of
X = Score
n = Number of cases
3. t -Test (Independent samples)

-
15715
Data was analyzed with the help of computer. On the basis of
analysis findings, conclusions and recommendations were made.
CONCLUSION
In this chapter the researcher explained how she had conducted the
present research work. The researcher had given the detailed work
plan and research methodology of the research. He also had given
about sample, sampling method, and data collection method,
objective of the study, hypothesis of the study, research method
and limitation of study.

-
15815