chapter iii performance audit relating to statutory
TRANSCRIPT

Chapter III – Performance Reviews relating to Statutory corporation
57
Chapter III
Performance audit relating to Statutory Corporation
Kerala State Road Transport Corporation
3. Performance Review on the performance of Kerala State Road Transport Corporation Executive Summary The Kerala State Road Transport Corporation (KSRTC) provides public transport in Kerala through its 87 Depots, Sub Depots and Operating Centres. The Corporation had a fleet strength of 5,115 buses as on 31 March 2009 and carried an average of 32.28 lakh passengers per day during the review period. It accounted for a share of 12.86 per cent in public transport with the rest coming from private operators. The performance audit of the Corporation for the period from 2004-05 to 2008-09 was conducted to assess efficiency and economy of its operations, ability to meet its financial commitments, possibility of realigning the business model to tap non-conventional sources of revenue, existence and adequacy of fare policy and effectiveness of the top management in monitoring the affairs of the Corporation. Finances and Performance The Corporation’s books of accounts are in arrears since 2006-07. Based on provisional figures, it suffered loss of Rs. 148.28 crore in 2008-09. The accumulated losses and borrowings of the Corporation stood at Rs. 2,085.98 crore and Rs. 831.75 crore respectively as at 31 March 2009 (Provisional). The Corporation earned Rs. 22.44 per kilometre and expended Rs. 25.57 per kilometre in 2008-09. Audit noticed that with a right kind of policy measures and better management of its affairs, it is possible to increase revenue and reduce costs, so as to limit losses and serve its cause better.
Share in Public Transport Out of 39,763 stage carriage buses licensed for public transport in 2008-09, about 12.86 per cent belonged to the Corporation. The percentage share decreased from 13.77 per cent in 2004-05 to 12.86 in 2008-09. The decline in share was mainly due to its operational inefficiency and lack of effective monitoring by top management. Vehicle density (including private operators) per one lakh population increased from 102 in 2004-05 to 117 in 2008-09 indicating improvement in the level of public transport in the State. However, the Corporation’s vehicle density remained almost constant at 14 buses per one lakh population, which was due to the inability of the Corporation to expand its operations. Vehicle profile and utilisation The Corporation added 2,098 buses during 2004-09 at a total cost of Rs. 197.94 crore. However, the overage fleet increased from 15.91 per cent in 2004-05 to 26.26 per cent in 2008-09. The acquisition was primarily funded through commercial borrowings. The overall fleet utilisation of the Corporation marginally increased from 79.31 per cent in 2004-05 to 79.60 per cent in 2008-09, which was less than all India average (AIA) of 92 per cent. The overall vehicle productivity at 259 kilometres per day per bus in 2008-09 was less than the AIA of 313 kilometres. The passenger load factor stood at 66 per cent during 2008-09, which was higher than the

Audit Report (Commercial) for the year ended 31 March 2009
58
AIA of 63 per cent. 84 per cent schedules were unprofitable and two per cent schedules were not even earning enough to meet variable cost of operations. The Corporation had not carried out preventive maintenance in up to 22 per cent cases in 2008-09. Economy in operations Manpower and fuel constitute 74.68 per cent of total cost. Interest, depreciation and taxes account for 16.18 per cent and are not controllable in the short-term. Thus, the major cost saving has to come from manpower and fuel. Manpower cost of the Corporation was Rs. 10.02 per effective KM which was higher than the AIA mainly due to implementation of pension scheme to the employees without creating separate fund. However, the expenditure on repairs and maintenance was Rs. 118.09 crore (Rs. 2.31 lakh per bus) in 2008-09, of which nearly 41.95 per cent was on manpower. The Corporation did not attain AIA in respect of fuel efficiency. Consumption of fuel in excess of AIA resulted in excess consumption of 10.58 crore litres of fuel valued at Rs. 339.55 crore during 2004-09. Revenue Maximisation
The Corporation has about 15.76 lakh square metres of land. As it mainly utilises ground floor/ land for their operations, the space above can be developed on public private partnership (PPP)/ Build Operate and Transfer (BOT) basis to earn steady income, which can be used to cross-subsidise its operations. Even though the Corporation identified 63 sites upto August 2008 for such projects since November 1998, not even a single project was completed so far (September 2009) due to delay in decision making.
Need for a regulator The fare in Kerala is decided by the State Government which is same for both the Corporation as well as Private Operators. The fare policy adopted by the State Government is based on ‘Price Index for Stage Carriage Operations’ (PISCO) brought out by National
Transportation Planning and Research Centre (NATPAC), an autonomous body under the Government of Kerala. Despite the request from the Government to update PISCO on quarterly basis, the updation was done in an ad hoc manner since the quarterly cost data was not furnished. In the absence of norms, the adequacy of services on uneconomical routes cannot be ascertained in Audit. Thus, it would be desirable to have an independent regulatory body (like State Electricity Regulatory Commission) to fix the fares, specify operations on uneconomical routes and address grievances of commuters.
Inadequate Monitoring
The fixation of targets for various operational parameters and an effective Management Information System (MIS) for obtaining feed back on achievement thereof are essential for monitoring by the top management. Though internal targets are fixed by the Management, it is deprived of authentic data with respect to unit level operations since the required registers/ records were not maintained properly. This had a detrimental effect on decision making. The Board of Directors did not evaluate the operational performance on a regular basis. The top Management of the Corporation has not demonstrated managerial capability to set realistic and progressive targets, address areas of weakness and take remedial action wherever the things are not moving on expected lines.
Conclusion and Recommendations
Though the Corporation is incurring losses, it is mainly due to its high cost of operations. The Corporation can control the losses by improving operational efficiency and resorting to tapping non-conventional sources of revenue. This review contains nine recommendations to improve the Corporation’s performance. Creating a regulator to regulate fares and services and tapping non-conventional sources of revenue are some of these recommendations.

Chapter III – Performance Reviews relating to Statutory corporation
59
Introduction 3.1 In Kerala, the public road transport is provided by the Kerala State Road Transport Corporation (Corporation), which is mandated to provide an efficient, adequate, economical and properly co-ordinated road transport. The State also allows the private operators to provide public transport. The State has reserved 31 routes exclusively for the Corporation while allowed both Corporation and private operators to operate on other routes. The fare structure is controlled and approved by the Government. This structure is same for both the Corporation as well as private operators. 3.2 The Corporation was incorporated on 15 March 1965 by the Government of Kerala under Section 3 of the Road Transport Corporations Act, 1950 as a wholly owned Corporation of the State Government. The Corporation is under the administrative control of the Transport Department of the Government of Kerala. The Management of the Corporation is vested with a Board of Directors comprising Chairman & Managing Director and nine Directors appointed by the Government of Kerala. The day-to-day operations are carried out by the Chairman & Managing Director, who is the Chief Executive of the Corporation, with the assistance of five Executive Directors (Technical, Operation, Administration, Vigilance and Maintenance & Works) and the Financial Advisor & Chief Accounts Officer. The Corporation has five Zonal Offices, 28 Depots, 41 Sub Depots, 18 Operating Centres, one Central Workshop and four Regional Workshops. The bus body building and tyre retreading operations are carried out at Central and Regional Workshops of the Corporation. 3.3 The Corporation had a fleet strength of 5,115 buses as on 31 March 2009. It carried an average of 32.28 lakh passengers per day during 2004-05 to 2008-09. During 2008-09, the Corporation’s share in the passenger transport operations in the State was 12.86 per cent and the remaining 87.14 per cent was accounted for by private operators. The turnover of the Corporation was Rs. 1,045.09 crore in 2008-09, which was equal to 0.58 per cent of the State Gross Domestic Product (Rs. 1,80,281 crore). The Corporation employed 34,470 employees as at 31 March 2009 out of which 12,999 were temporary employees who were paid on daily basis. As assessed by Management, only around 60 per cent of the temporary employees could be deployed on a regular basis. 3.4 A review on the working of the Corporation was included in the Report of the Comptroller and Auditor General of India for the year 1999-2000 (Commercial), Government of Kerala. The Report was discussed by the Committee on Public Undertakings (COPU) and its recommendations were included in the 66th Report (2004-06). The main recommendations contained in that Report, presented (July 2004) to the Legislature, were as under:
• The Corporation should improve its operational performance in all respects;

Audit Report (Commercial) for the year ended 31 March 2009
60
• Norms fixed for docking of vehicles for repair should be adhered to;
• Spare parts should be acquired every year only after ascertaining the balance stock available in each store;
• Norms for fuel consumption should be specified depending upon the age
of vehicles, route, etc.; • Area-wise norms should be fixed for utilisation of tyres; and
• Fresh norms to be fixed for engine oil consumption.
The extent to which the directions issued by COPU have been complied with are commented in paragraphs 3.15 to 3.102 below. Scope of Audit and Audit Methodology 3.5 The present review conducted during January 2009 to May 2009 covers the performance of the Corporation during the period from 2004-05 to 2008-09. The review mainly deals with operational efficiency, financial management, fare policy, fulfillment of social obligations and monitoring by top management of the Corporation. The audit examination involved scrutiny of records at the Head Office, Central Workshop at Thiruvananthapuram, two Regional Workshops at Kozhikode and Aluva, nine Depots and 14 Sub Depots♣. Two out of four Regional Workshops were selected on the basis of bus building capacity, tyre re-treading facility and regional representation. Depots and Sub Depots were selected on the basis of regional representation, topography and number of schedules and profitability. The selected Depots and Sub Depots had a fleet strength of 1,634 buses (31.95 per cent) against 5,115 buses held by Corporation and represented 41.81 per cent of total revenue (2007-08). 3.6 The methodology adopted for attaining the audit objectives with reference to audit criteria consisted of explaining audit objectives to top management, scrutiny of records at Head Office and selected units, interaction with the auditee personnel, analysis of data with reference to audit criteria, raising of audit queries, discussion of audit findings with the Management and issue of draft review to the Management for comments. Audit Objectives 3.7 The objectives of the performance audit were to assess:
♣ Depots/ Sub Depots/ Workshops selected : Aluva, Chalakkudy, Ernakulam, Guruvayoor, Kalpetta,
Karunagapally, Kasaragode, Kattakkada, Kilimanoor, Kothamangalam, Kozhikode, Mala, Malappuram, Mananthavady, Mavelikkara, North Paravur, Pala, Palakkad, Ponnani, Thodupuzha, Thrissur, Thiruvananthapuram City, Vizhinjam, Central Workshop at Thiruvananthapuram, two Regional Workshops at Kozhikode and Aluva.

Chapter III – Performance Reviews relating to Statutory corporation
61
Operational Performance • the extent to which the Corporation was able to keep pace with the
growing demand for public transport;
• whether the Corporation succeeded in recovering the cost of operations;
• the extent to which the Corporation was running its operations efficiently;
• whether adequate maintenance was undertaken to keep the vehicles
roadworthy; and • the extent to which economy was ensured in cost of operations.
Financial Management
• whether the Corporation was able to meet its commitments and recover
its dues efficiently; and • the possibility of realigning the business model of the Corporation to
tap non-conventional sources of revenue and adopting innovative methods of accessing such funds.
Fare Policy and Fulfillment of Social Obligations
• the existence and adequacy of fare policy; and • whether the Corporation operated adequately on uneconomical routes.
Monitoring by Top Management
• whether the monitoring by Corporation’s top management was
effective.
Audit Criteria 3.8 The audit criteria adopted for assessing the achievement of the audit objectives were:
• all India averages for performance parameters; • performance standards and operational norms fixed by the Association
of State Road Transport Undertakings (ASRTU);
• physical and financial targets/ norms fixed by the Management; • manufacturers’ specifications, norms for life of a bus, preventive
maintenance schedule, fuel efficiency norms, etc.;

Audit Report (Commercial) for the year ended 31 March 2009
62
• instructions of the Government of India (GOI) and Government of State
and other relevant rules and regulations;
• corporate policy for investment of funds; and
• procedures laid down by the Corporation. Financial Position and Working Results 3.9 The Corporation has finalised its accounts up to the year 2005-06 only. Hence authentic financial data was unavailable for three years from 2006-07 to 2008-09 and analysis was made on the basis of provisional figures made available by the Corporation. The financial position of the Corporation for the five years up to 2008-09 is given below.
(Rs. in crore) Particulars 2004-05 2005-06 2006-07 2007-08 2008-09
A. Liabilities Paid up Capital 142.95 147.95 152.95 155.66 180.65Reserve & Surplus (including Capital Grants but excluding Depreciation Reserve) 12.18 30.05 68.09 26.51 3.79Borrowings (Loan Funds) 405.11 461.43 553.14 570.10 831.75Current Liabilities & Provisions 1,110.70 1,225.45 1,125.95 1,324.28 1,309.36Total 1,670.94 1,864.88 1,900.13 2,076.55 2,325.55B. Assets Gross Block 454.40 478.81 479.53 519.26 625.26Less: Depreciation 285.16 309.84 349.60 391.18 442.04Net Fixed Assets 169.24 168.97 129.93 128.08 183.22Capital works-in-progress (including cost of chassis)
Nil 2.78 Nil Nil Nil
Investments 0.03 0.03 0.03 0.03 0.03Current Assets, Loans and Advances 79.41 75.00 54.28 40.17 56.32Accumulated losses 1,422.26 1,618.10 1,715.89 1,908.27 2,085.98Total 1,670.94 1,864.88 1,900.13 2,076.55 2,325.55
3.10 The details of working results like operating revenue and expenditure, total revenue and expenditure, net surplus/ loss and earnings and cost per kilometre of operation are given below.

Chapter III – Performance Reviews relating to Statutory corporation
63
(Rs. in crore)
Sl.No. Description 2004-05 2005-06 2006-07 2007-08 2008-09 1. Total Revenue 764.04 831.70 876.16 883.82 1,062.142. Operating Revenueφ 750.55 817.21 860.58 868.67 1,045.093. Total Expenditure 915.08 1,023.60 1,018.11 1,076.22 1,210.424. Operating Expenditureψ 860.64 965.23 959.54 1,014.22 1,121.515. Operating Profit/ Loss -110.09 -148.02 -98.96 -145.55 -76.426. Profit/ Loss for the year -151.04 -191.90 -141.95 -192.40 -148.287. Accumulated Profit/
Loss (-)1,422.26 (-)1,618.10 (-)1,715.89 (-)1,908.27 (-)2,085.988. Fixed Costs
Personnel Costs Depreciation Interest Other Fixed Costs
388.14
36.92 54.44
29.76
400.42
40.62 58.37 49.67
395.48
39.76 58.57 41.16
439.77
41.58 62.00 40.43
474.21
50.86 88.91 46.87
Total Fixed Costs 509.26 549.08 534.97 583.78 660.859. Variable Costs
Fuel & Lubricants Tyres & Tubes∞
Other Items/ spares Taxes (MV Tax, Passenger Tax, etc.) Other Variable Costs
301.89
22.21 29.60 49.84
2.28
363.18
28.49 28.10 51.67
3.08
372.88
30.47 26.28 49.94
3.58
375.94
25.71 33.98 52.76
4.05
429.73
22.03 37.66 56.10
4.05
Total Variable Costs 405.82 474.52 483.15 492.44 549.5710. Effective KMs operated
(in lakh) 4,299.89 4,402.17 4,223.06 4,182.63 4,732.5511. Earnings per KM (Rs.)
(1/10) 17.77 18.89 20.75 21.13 22.4412. Fixed Cost per KM
(Rs.) (8/10) 11.84 12.47 12.67 13.96 13.9613. Variable Cost per KM
(Rs.) (9/10) 9.44 10.78 11.44 11.77 11.6114. Cost per KM (Rs.)
(12+13) 21.28 23.25 24.11 25.73 25.5715. Net Earnings per KM
(Rs.) (11-14) -3.51 -4.36 -3.36 -4.60 -3.1316. Traffic Revenue§ 750.55 817.21 860.58 868.67 1,045.0917. Traffic revenue per KM
(Rs.) (16/10) 17.46 18.56 20.38 20.77 22.08
φ Operating revenue includes traffic earnings, passes and season tickets, etc. ψ Operating expenditure includes expenses relating to traffic, depreciation on fleet, repair and maintenance,
electricity, welfare and remuneration, licences and taxes and general administration expenses. ∞ The purchase value of tyre and tubes were taken as consumption from 2006-07 onwards since the accounts
were not finalised. § Traffic revenue represents sale of tickets, advance booking, reservation charges and contract services
earnings.

Audit Report (Commercial) for the year ended 31 March 2009
64
Elements of Cost 3.11 Personnel costs and material costs constitute the major elements of costs. The percentage break-up of costs for 2008-09 is given below in the pie-chart.
Components of various elements of cost
39%
41%
4%4%
7%
5%
Personnel Cost Material Cost TaxesInterest Depreciation Miscellaneous
Elements of revenue 3.12 Traffic revenue and non-traffic revenue constitute the elements of revenue. The percentage break-up of revenue for 2008-09 is given below in the pie-chart.
Components of various elements of revenue
2%
98%
Traffic Revenue Non-Traffic Revenue

Chapter III – Performance Reviews relating to Statutory corporation
65
Audit Findings 3.13 Audit explained the audit objectives to the Corporation during an ‘entry conference’ held on 20 February 2009. Subsequently, audit findings were reported to the Corporation and the Government in June 2009 and discussed in an ‘exit conference’ held on 27 July 2009, which was attended by Additional Chief Secretary, Transport Department, Government of Kerala, Chairman & Managing Director and Financial Advisor & Chief Accounts Officer of the Corporation. The Government also replied to audit findings in August 2009. The views expressed by them have been considered while finalising this review. The audit findings are discussed below. Operational Performance 3.14 The operational performance of the Corporation for the five years ending 2008-09 is given in Annexure 14. The operational performance of the Corporation was evaluated on various operational parameters as described below. It was also seen whether the Corporation was able to maintain pace with the growing demand of public transport. Audit findings in this regard are discussed in the subsequent paragraphs. These audit findings show that the losses were controllable and there is scope for improvement in performance. Share of Corporation in public transport 3.15 The Government of Kerala has nationalised 31 routes and earmarked them exclusively for the Corporation. In other routes the Corporation as well as private operators are operating based on the permits issued by the transport authority from time to time. Apart from the allocation of routes, no specific policy on transport has been adopted by the Government of Kerala. 3.16 National Transportation Planning and Research Centre (NATPAC), an autonomous body under the Government of Kerala, conducted (April 2003) a study and recommended the introduction of mini buses to improve the share of the Corporation in public transport by restricting operation of parallel services∗. Even though the Corporation purchased 365 mini buses at a total cost of Rs. 30.02 crore from 2003 to 2007, these buses were utilised for regular services instead of routes where there was drain of revenue on account of illegal parallel services and did not result in attaining the intended objective. Due to less carrying capacity of mini buses as compared to normal buses, the operation of these buses resulted in loss of Rs. 8.46 crore. 3.17 The Government replied (August 2009) that the operation of mini buses was not viable since the findings of study by NATPAC were wrong. The reply is not convincing since the Corporation did not deploy the mini buses in a co-ordinated manner to counter the parallel services as recommended by NATPAC
∗ Contract carriages illegally operated as stage carriages.
Operation of 365 mini buses for regular services instead of routes where the illegal parallel services operated resulted in loss of revenue of Rs. 8.46 crore.
Audit Report (Commercial) for the year ended 31 March 2009
66
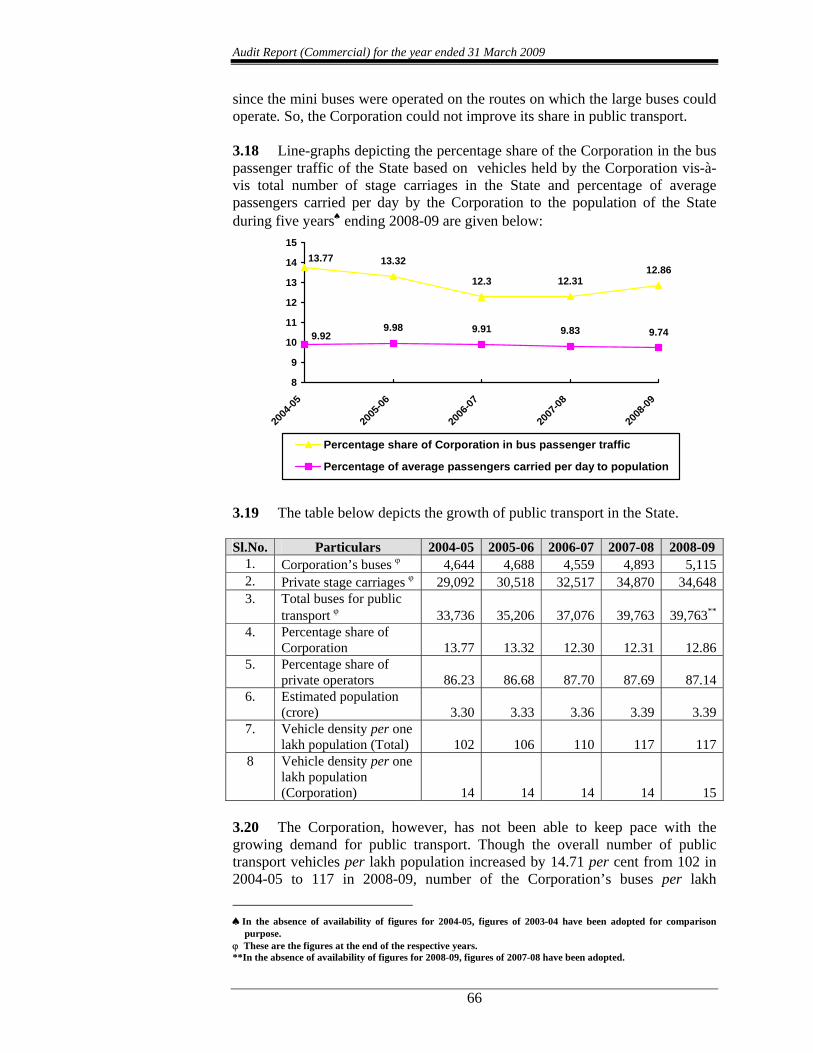
since the mini buses were operated on the routes on which the large buses could operate. So, the Corporation could not improve its share in public transport. 3.18 Line-graphs depicting the percentage share of the Corporation in the bus passenger traffic of the State based on vehicles held by the Corporation vis-à-vis total number of stage carriages in the State and percentage of average passengers carried per day by the Corporation to the population of the State during five years♠ ending 2008-09 are given below:
13.32
12.3 12.3112.86
9.98 9.91 9.83 9.74
13.77
9.92
8
9
10
11
12
13
14
15
2004
-05
2005
-06
2006
-07
2007
-08
2008
-09
Percentage share of Corporation in bus passenger traffic
Percentage of average passengers carried per day to population
3.19 The table below depicts the growth of public transport in the State. Sl.No. Particulars 2004-05 2005-06 2006-07 2007-08 2008-09
1. Corporation’s buses ϕ 4,644 4,688 4,559 4,893 5,1152. Private stage carriages ϕ 29,092 30,518 32,517 34,870 34,6483. Total buses for public
transport ϕ 33,736 35,206 37,076 39,763 39,763**
4. Percentage share of Corporation 13.77 13.32 12.30 12.31 12.86
5. Percentage share of private operators 86.23 86.68 87.70 87.69 87.14
6. Estimated population (crore) 3.30 3.33 3.36 3.39 3.39
7. Vehicle density per one lakh population (Total) 102 106 110 117 117
8 Vehicle density per one lakh population (Corporation) 14 14 14 14 15
3.20 The Corporation, however, has not been able to keep pace with the growing demand for public transport. Though the overall number of public transport vehicles per lakh population increased by 14.71 per cent from 102 in 2004-05 to 117 in 2008-09, number of the Corporation’s buses per lakh
♠In the absence of availability of figures for 2004-05, figures of 2003-04 have been adopted for comparison
purpose. ϕ These are the figures at the end of the respective years. **In the absence of availability of figures for 2008-09, figures of 2007-08 have been adopted.

Chapter III – Performance Reviews relating to Statutory corporation
67
population remained almost stagnant. The effective per capita KM operated per year is given below.
Particulars 2004-05 2005-06 2006-07 2007-08 2008-09 Effective KM operated (lakh) 4,299.89 4,402.16 4,223.06 4,182.63 4,732.55Estimated Population (crore) 3.30 3.33 3.36 3.39 3.42Per Capita KM per year 13.02 13.22 12.57 12.34 13.84
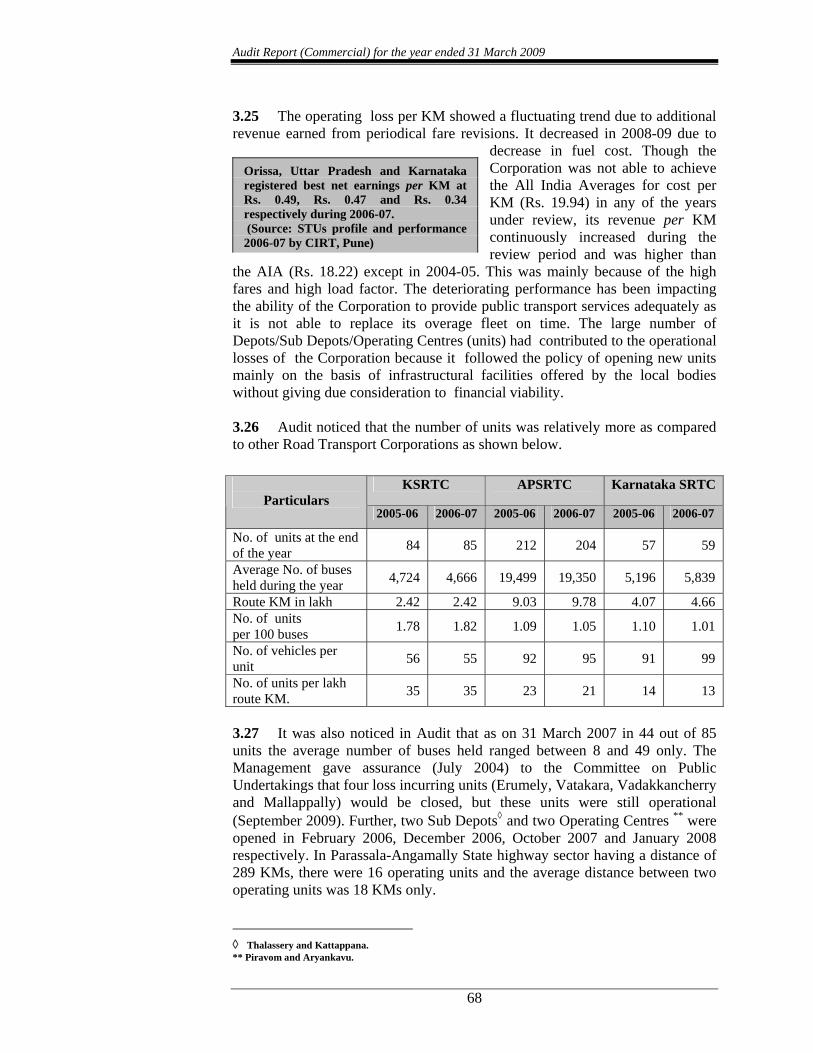
3.21 Even though the Corporation succeeded in maintaining 9 to 10 per cent of passengers carried per day to total population and operated 12.34 to 13.84 per capita KM throughout the five years under review, its presence continued to be extremely low in the public transport space. 3.22 Public transport has definite benefits over personalised transport in terms of costs, congestion on roads and environmental impact. The public transport services have to be adequate to derive those benefits. In the instant case, the Corporation was not able to maintain its share in transport mainly due to operational inefficiencies as described later. 3.23 The Government replied (August 2009) that the Corporation had not tried to expand its operations till 2007 as the concept of variable costs and fixed costs was not properly understood till then and the Management was under the mistaken notion that operating additional distance would add to the losses. Recovery of cost of operations 3.24 The Corporation was not able to recover its cost of operations. During the last five years ending 2008-09, the net revenue remained negative as given in the graph⊗ below:
21.2
8
23.2
5
24.1
1
25.7
3
25.5
7
17.7
7
18.8
9
20.7
5
21.1
3
22.4
4
-3.5
1
-4.3
6
-3.3
6
-4.6
-3.1
3
-2.5
6
-3.3
6
-2.3
4
-3.4
8
-1.6
1
-5
0
5
10
15
20
25
302004-05 2005-06 2006-07 2007-08 2008-09
Cost per KM Revenue per KM Net Revenue per KM Operating loss per KM
⊗Cost per KM represents total expenditure divided by effective KM operated. Revenue per KM is arrived at by dividing total revenue with effective KM operated. Net Revenue per KM is revenue per KM reduced by cost per KM. Operating loss per KM would be operating expenditure per KM reduced by operating income per KM.
Audit Report (Commercial) for the year ended 31 March 2009
68
3.25 The operating loss per KM showed a fluctuating trend due to additional revenue earned from periodical fare revisions. It decreased in 2008-09 due to
decrease in fuel cost. Though the Corporation was not able to achieve the All India Averages for cost per KM (Rs. 19.94) in any of the years under review, its revenue per KM continuously increased during the review period and was higher than
the AIA (Rs. 18.22) except in 2004-05. This was mainly because of the high fares and high load factor. The deteriorating performance has been impacting the ability of the Corporation to provide public transport services adequately as it is not able to replace its overage fleet on time. The large number of Depots/Sub Depots/Operating Centres (units) had contributed to the operational losses of the Corporation because it followed the policy of opening new units mainly on the basis of infrastructural facilities offered by the local bodies without giving due consideration to financial viability. 3.26 Audit noticed that the number of units was relatively more as compared to other Road Transport Corporations as shown below.
3.27 It was also noticed in Audit that as on 31 March 2007 in 44 out of 85 units the average number of buses held ranged between 8 and 49 only. The Management gave assurance (July 2004) to the Committee on Public Undertakings that four loss incurring units (Erumely, Vatakara, Vadakkancherry and Mallappally) would be closed, but these units were still operational (September 2009). Further, two Sub Depots◊ and two Operating Centres ** were opened in February 2006, December 2006, October 2007 and January 2008 respectively. In Parassala-Angamally State highway sector having a distance of 289 KMs, there were 16 operating units and the average distance between two operating units was 18 KMs only. ◊ Thalassery and Kattappana. ** Piravom and Aryankavu.
Orissa, Uttar Pradesh and Karnataka registered best net earnings per KM at Rs. 0.49, Rs. 0.47 and Rs. 0.34 respectively during 2006-07. (Source: STUs profile and performance 2006-07 by CIRT, Pune)
KSRTC APSRTC Karnataka SRTC Particulars
2005-06 2006-07 2005-06 2006-07 2005-06 2006-07
No. of units at the end of the year 84 85 212 204 57 59
Average No. of buses held during the year 4,724 4,666 19,499 19,350 5,196 5,839
Route KM in lakh 2.42 2.42 9.03 9.78 4.07 4.66 No. of units per 100 buses 1.78 1.82 1.09 1.05 1.10 1.01
No. of vehicles per unit 56 55 92 95 91 99
No. of units per lakh route KM. 35 35 23 21 14 13
Chapter III – Performance Reviews relating to Statutory corporation
69
3.28 The Government stated (August 2009) that present financial stringency was not the result of the present performance. It was also stated that the total revenue had increased from Rs. 815.52 crore in 2005-06 to Rs. 1,045.09 crore in 2008-09. With respect to the Audit observation on large number of units, it was replied (January 2009) that the earlier policy of opening operating units without considering financial viability had been done away with and only viable units were being opened at present. However, Audit observed that the increase in revenue in 2008-09 was mainly due to increase in fare and the reply is silent about the non-implementation of the assurance given by the Corporation to COPU. Efficiency and Economy in operations Fleet strength and utilisation Fleet Strength and its Age Profile 3.29 The Corporation has its own fleet of buses. It had not, at any time made a cost benefit analysis of hiring buses from private operators. Key operational data such as route/trip-wise earnings, reasons for cancellation of scheduled distance, punctuality and records relating to repairs and maintenance of buses were not properly compiled/ maintained by the Corporation and the absence of this data hampered Audit analysis considerably. 3.30 The Association of State Road Transport Undertakings (ASRTU) had prescribed (September 1997) the desirable age of a bus as eight years or five lakh kilometres, whichever was earlier. However, the Corporation adopted the norm of reckoning the life of a bus as 10 years or 10 lakh kilometres of operation whichever was earlier in tune with improved technical parameters of new buses. But the Corporation failed to adhere to its own norms. The table below shows the age-profile of the buses held by the Corporation for the period of five years ending 2008-09.

Audit Report (Commercial) for the year ended 31 March 2009
70
Sl. No.
Particulars 2004-05 2005-06 2006-07 2007-08 2008-09
1. Total No. of buses at the beginning of the year 4,348 4,644 4,688 4,559 4,893
2. Additions during the year 519 269 92 517 7013. Buses scrapped during
the year (1+2-4) 223 225 221 183 4794. Buses held at the end of
the year 4,644 4,688 4,559 4,893 5,1155. No. of buses more than
10 years old 739 982 1,129 1,452 1,3436. Percentage of over-age
buses (more than 10 years) 15.91 20.95 24.76 29.68 26.26
3.31 During 2004-09, the Corporation added 2,098 new buses at a cost of Rs.197.94♦ crore. The expenditure was funded through external borrowings from financial institutions. To achieve the norm of right age buses, the Corporation was required to buy 1,343 new buses additionally which would have cost it Rs. 149.07 crore approximately††. However, the Corporation did not generate adequate resources through its operations to finance the replacement of buses. It suffered a loss of Rs. 615.84 crore before charging of depreciation during 2004-09, and hence was not in a position to deploy internal funds for fleet augmentation. Thus, the Corporation’s ability to survive and grow depends on its efforts to remove operational inefficiencies, cut costs and tap non-conventional revenue avenues so that it can fund its capital expenditure and be self-reliant. 3.32 The Corporation had not generated sufficient internal resources to carry out its capital and revenue activities during the period under review. Hence, the Corporation raised loans from financial institutions. Fresh loans raised during each year were higher than the loans repaid during that year. Therefore the loan amount of Rs. 321.23 crore as on 31 March 2004 increased to Rs. 831.75 crore as on 31 March 2009. Besides, the Corporation also took a loan of Rs. 666.99 crore to meet its working capital requirement during the period 2004-2009. In view of operating losses and mounting debts, the Corporation faces a challenging task ahead. 3.33 The over aged fleet requires high maintenance and results in extra cost and less availability of vehicles compared to underage fleet, other things being equal. This only goes on to increase operational inefficiency and causes losses which, in turn, affects the ability of the Corporation to replace its fleet on a timely basis. The increase in percentage of overage buses is a result of inability of the Corporation, due to its operational inefficiency, to generate funds to replace buses. ♦ Since the capitalised cost of vehicles was not available in the absence of final accounts from 2006-07, the total
amount borrowed from 2004-05 to 2008-09 for financing vehicle purchase was adopted by Audit. †† Calculated on the basis of average cost of Rs. 11.10 lakh per bus as provided by Management.
Percentage of overage buses increased from 15.91 per cent to 26.26 per cent in 2008-09.
Chapter III – Performance Reviews relating to Statutory corporation
71
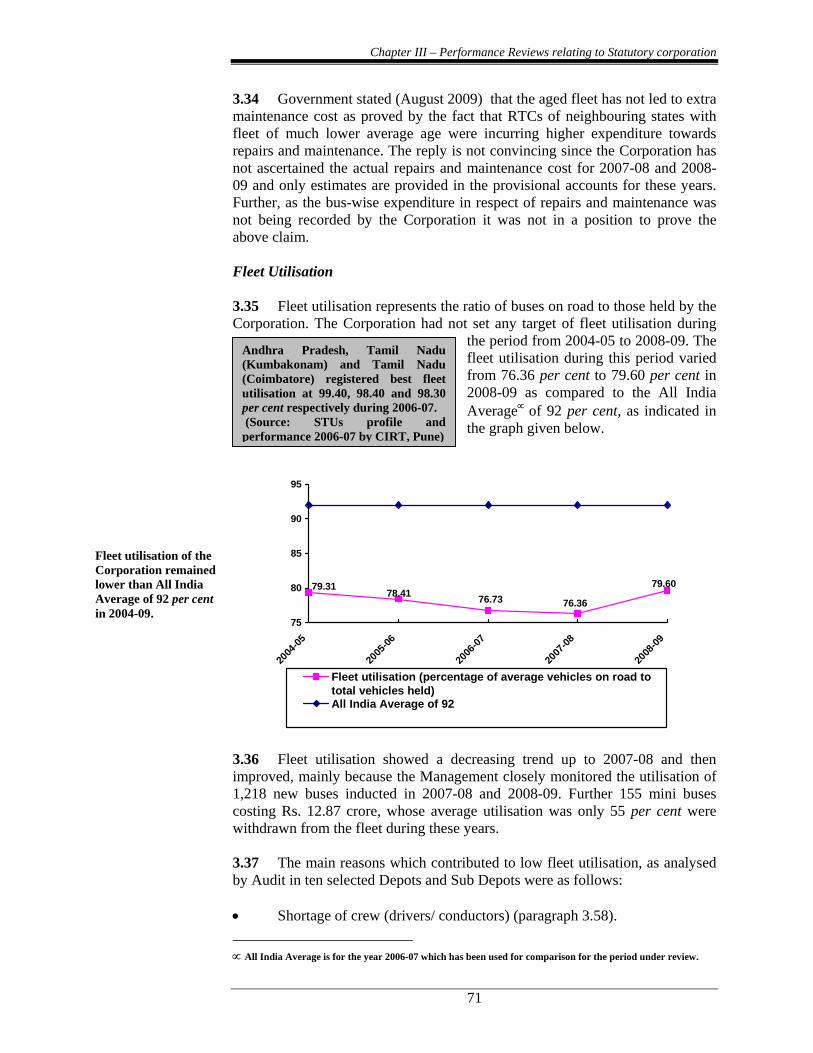
3.34 Government stated (August 2009) that the aged fleet has not led to extra maintenance cost as proved by the fact that RTCs of neighbouring states with fleet of much lower average age were incurring higher expenditure towards repairs and maintenance. The reply is not convincing since the Corporation has not ascertained the actual repairs and maintenance cost for 2007-08 and 2008-09 and only estimates are provided in the provisional accounts for these years. Further, as the bus-wise expenditure in respect of repairs and maintenance was not being recorded by the Corporation it was not in a position to prove the above claim. Fleet Utilisation 3.35 Fleet utilisation represents the ratio of buses on road to those held by the Corporation. The Corporation had not set any target of fleet utilisation during
the period from 2004-05 to 2008-09. The fleet utilisation during this period varied from 76.36 per cent to 79.60 per cent in 2008-09 as compared to the All India Average∝ of 92 per cent, as indicated in the graph given below.
78.4179.31
76.73 76.36
79.60
75
80
85
90
95
2004
-05
2005
-06
2006
-07
2007
-08
2008
-09
Fleet utilisation (percentage of average vehicles on road tototal vehicles held)All India Average of 92
3.36 Fleet utilisation showed a decreasing trend up to 2007-08 and then improved, mainly because the Management closely monitored the utilisation of 1,218 new buses inducted in 2007-08 and 2008-09. Further 155 mini buses costing Rs. 12.87 crore, whose average utilisation was only 55 per cent were withdrawn from the fleet during these years. 3.37 The main reasons which contributed to low fleet utilisation, as analysed by Audit in ten selected Depots and Sub Depots were as follows: • Shortage of crew (drivers/ conductors) (paragraph 3.58). ∝ All India Average is for the year 2006-07 which has been used for comparison for the period under review.
Andhra Pradesh, Tamil Nadu (Kumbakonam) and Tamil Nadu (Coimbatore) registered best fleet utilisation at 99.40, 98.40 and 98.30 per cent respectively during 2006-07. (Source: STUs profile and performance 2006-07 by CIRT, Pune)
Fleet utilisation of the Corporation remained lower than All India Average of 92 per cent in 2004-09.

Audit Report (Commercial) for the year ended 31 March 2009
72
• Breakdowns on account of inadequate servicing/ maintenance
(paragraph 3.61). • Off road buses for 6,789 days for want of motor vehicle inspection
certificates (paragraph 3.66).
3.38 From the above, it can be concluded that the Corporation was not able to achieve an optimum utilisation of its fleet strength, which in turn impacted its operational performance adversely. 3.39 Government replied (August 2009) that the figures included by Audit regarding fleet utilisation were incorrect since fleet utilisation is calculated based on the total number of buses held minus the spare buses. It was further stated that the detention of buses for Certificate of Fitness repair was inevitable, holiday cancellation was in the best interests of the Corporation and that the Corporation was facing acute shortage of manpower. 3.40 The reply is not convincing since the Central Institute of Road Transport, Pune has clearly defined fleet utilisation as the ratio of buses held (including spare buses) to the buses on road. Non-utilisation of vehicles for want of timely renewal of Certificate of Fitness was avoidable. Further, manpower per bus of the Corporation stood at 5.74 in 2006-07, which was much higher than the manpower per bus of Karnataka State Road Transport Corporation at 4.99 in that year. Vehicle Productivity 3.41 Vehicle productivity refers to the average Kilometres run by each bus per day in a year. The vehicle productivity of the Corporation vis-à-vis the overage fleet for the five years ending 2008-09 is shown in the table below.
Sl.No. Particulars 2004-05 2005-06 2006-07 2007-08 2008-091. Vehicle productivity based
on average vehicles held (KM) 262 255 248 247 259
2. Overage fleet (percentage) 15.91 20.95 24.76 29.68 26.26 3.42 There has been continuous increase in over age fleet leading to decrease in vehicle productivity except in 2008-09 when it had increased but could not attain its own level of 2004-05. The increase in vehicle productivity during 2008-09 was primarily due to addition of new buses during 2007-08 and 2008-09.

Chapter III – Performance Reviews relating to Statutory corporation
73
3.43 Compared to the All India Average of 313 KMs per day, the vehicle productivity of the Corporation has been on lower side for all the years under review. The lower productivity is mainly on account of:
• Deficient route planning (paragraph 3.50) • Excess time taken for servicing/repairs (paragraph 3.58) • Want of crew (paragraph 3.58)
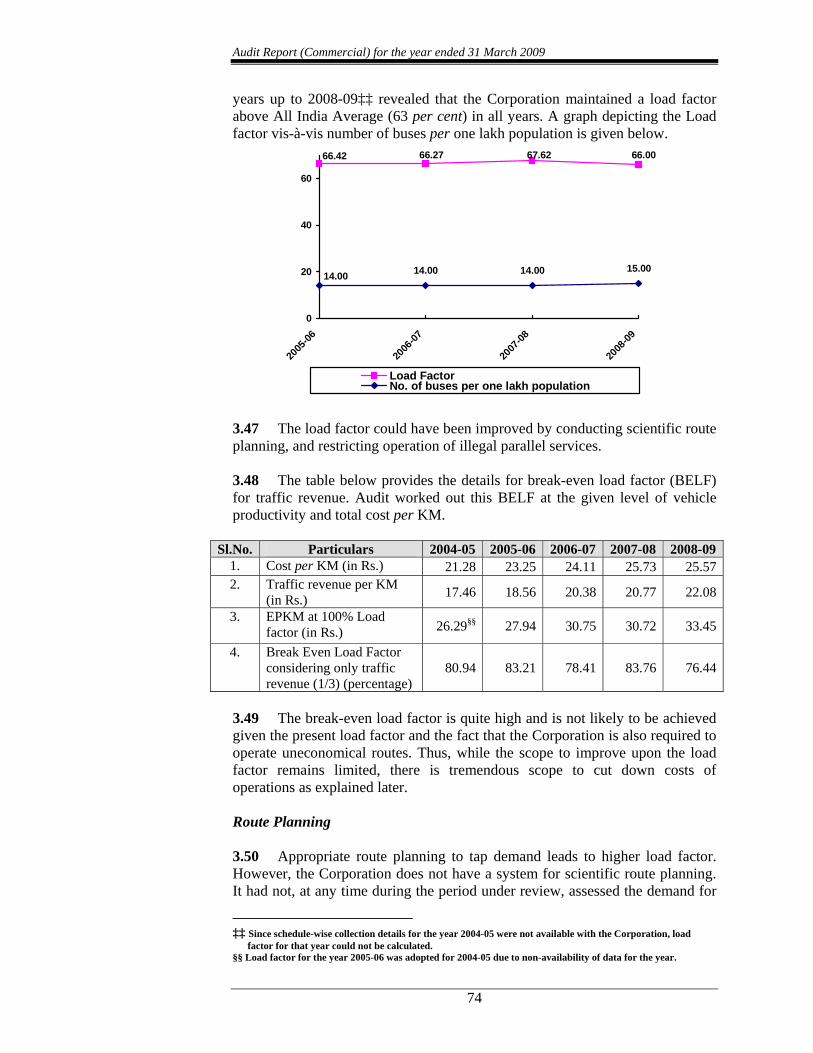
• Cancellation of scheduled kilometres (paragraph 3.58) 3.44 The Corporation had not fixed any specific norms for vehicle productivity. Further, vehicle productivity achieved in 2004-2005 could not be maintained in subsequent years. One of the major reasons for low vehicle productivity was non-adherence to the norm fixed for steering duty. The Corporation had fixed norms for steering duty hours and spread over duty time in each schedule as six and a half hours and eight hours respectively. The Corporation has adopted a practice of assigning double duties to all its crew. A test check in Audit of the duty hours of 2,918 schedules in the selected Depots during review period revealed that in 397 schedules, duty hours were below standards from one hour to three and a half hours against the 13 hours duty (double shift). 3.45 Government stated (August 2009) that the slight fall in the vehicle productivity during 2005-06 to 2008-09 when compared to 2004-05 was due to the introduction of services as chain services in selected route in competition with private stage carriages and small adjustments in duty norms would be more beneficial to the Corporation than extending the schedule to odd timings to suit the duty norms. The reply is not convincing since introduction of chain services in competition with private stage carriages may not be of much benefit to the Corporation. Moreover, shortfall commented in Audit does not relate to small adjustment as short duty ranged from about one hour to three and a half hours against the norm of 13 hours per double shift duty. Capacity Utilisation Load Factor 3.46 Capacity utilisation of a transport undertaking is measured in terms of Load Factor, which represents the percentage of passengers carried to seating capacity. The schedules to be operated are to be decided after proper study of routes and periodical reviews are necessary to improve the load factor. The Corporation did not have any system to compile the data required for assessing the load factor. Compilation and analysis in Audit of the load factor for the four
Tamil Nadu (Villupuram), Tamil Nadu (Salem) and Tamil Nadu (Kumbakonam) registered best vehicle productivity at 474, 469 and 462.8 KMs per day respectively during 2006-07. (Source: STUs profile and performance 2006-07 by CIRT, Pune)
Audit Report (Commercial) for the year ended 31 March 2009
74
years up to 2008-09‡‡ revealed that the Corporation maintained a load factor above All India Average (63 per cent) in all years. A graph depicting the Load factor vis-à-vis number of buses per one lakh population is given below.
14.00 14.00 15.00
66.0067.6266.42 66.27
14.00
0
20
40
60
2005
-06
2006
-07
2007
-08
2008
-09
Load FactorNo. of buses per one lakh population
3.47 The load factor could have been improved by conducting scientific route planning, and restricting operation of illegal parallel services. 3.48 The table below provides the details for break-even load factor (BELF) for traffic revenue. Audit worked out this BELF at the given level of vehicle productivity and total cost per KM.
Sl.No. Particulars 2004-05 2005-06 2006-07 2007-08 2008-091. Cost per KM (in Rs.) 21.28 23.25 24.11 25.73 25.572. Traffic revenue per KM
(in Rs.) 17.46 18.56 20.38 20.77 22.08
3. EPKM at 100% Load factor (in Rs.) 26.29§§ 27.94 30.75 30.72 33.45
4. Break Even Load Factor considering only traffic revenue (1/3) (percentage)
80.94 83.21 78.41 83.76 76.44
3.49 The break-even load factor is quite high and is not likely to be achieved given the present load factor and the fact that the Corporation is also required to operate uneconomical routes. Thus, while the scope to improve upon the load factor remains limited, there is tremendous scope to cut down costs of operations as explained later. Route Planning 3.50 Appropriate route planning to tap demand leads to higher load factor. However, the Corporation does not have a system for scientific route planning. It had not, at any time during the period under review, assessed the demand for
‡‡ Since schedule-wise collection details for the year 2004-05 were not available with the Corporation, load factor for that year could not be calculated. §§ Load factor for the year 2005-06 was adopted for 2004-05 due to non-availability of data for the year.

Chapter III – Performance Reviews relating to Statutory corporation
75
its services on a scientific basis and planned the routes accordingly. Generally, services were being introduced/ modified on the basis of requests received from people’s representatives without assessing financial and operational viability. 3.51 The Corporation had not compiled the route-wise revenue details. Instead of routes, the services are made up of schedules, each schedule comprising of a number of trips. An analysis by Audit of schedule-wise revenue details for the four years up to 2008-09 is given in the table below.
Particulars Total No.
of Schedules∗
No. of Schedules
making Profit
No. of Schedules not meeting total
cost
No. of Schedules not meeting variable cost
2004-05 NA NA NA NA
2005-06 6,511 367(5.64)
6,144 (94.36)
135 (2.07)
2006-07 5,007 169(3.38)
4,838 (96.62)
152 (3.04)
2007-08 5,489 486(8.85)
5,003 (91.15)
125 (2.28)
2008-09 7,300 1,148(15.73)
6,152 (84.27)
121 (1.66)
Figures in brackets indicate percentage to total schedules.
3.52 Some schedules are profitable while others are not. Though some of the schedules now appearing unprofitable would become profitable once the Corporation improves its efficiency, there would still be some uneconomical schedules. Given the scenario of mixed schedules and obligation to serve uneconomical schedules, the Corporation should decide an optimum quantum of different schedules so as to optimise its revenue while serving the cause. However, no such exercise was carried out by the Corporation. Further, the operating units of the Corporation did not compile and analyse trip-wise profitability despite instructions issued in this regard by the Management. 3.53 The details in the table indicate that the profit making schedules increased from 5.64 per cent in 2005-06 to 15.73 per cent in 2008-09 and those not meeting total cost showed a declining trend. Those not meeting variable cost had decreased to 1.66 per cent in 2008-09 from 2.07 per cent in 2004-05. Even though the above trend indicated slight improvement in performance, Audit noticed that the profitability for schedules was improved by cancelling a few of the uneconomic trips within the schedule whereas buses available due to such cancellation were not gainfully utilised in other schedules.
∗ Including additional schedules and special trips operated over and above notified schedules.
Audit Report (Commercial) for the year ended 31 March 2009
76
3.54 Further, the State Government approved procurement of 1,000 buses in 2007-08 with the stipulation that these vehicles should be operated only on routes having earning per kilometre (EPKM) of Rs. 20 and above. Audit scrutiny, however, revealed that out of 942 buses inducted for operations during 2007-08 and 2008-09, 291 buses were operated in routes where EPKM was below Rs. 20 and ranged between Rs. 8.27 and Rs. 19.98 only. The loss of revenue due to less EPKM worked out to Rs. 4.37 crore. Moreover, in order to improve EPKM, the Management had ordered (January 2009) that all schedules fetching EPKM below Rs. 15 should be stopped. However, Audit noticed that during the period January 2009 to March 2009, the Corporation operated 732 schedules covering 45.72 lakh km with EPKM below Rs. 15. This was in violation of the orders of January 2009. 3.55 Government replied (August 2009) that the percentage of profit making schedules had increased due to concerted efforts initiated from 2007-08 onwards to deploy more buses on routes serviced by private operators where the demand was higher. However, the fact remains that the Corporation could have increased its earnings and at the same time provided better travel facilities to the public by concentrating on routes where illegal parallel services are operated instead of deploying more buses in competition to private operators. Cancellation of Scheduled Kilometres 3.56 A review of the operations indicated that the scheduled kilometres were not fully operated mainly due to non-availability of adequate number of buses, shortage of crew and other factors like breakdown, accidents, late arrivals, strikes, planned cancellation on holidays, etc. 3.57 The details of scheduled kilometres, effective kilometres, cancelled kilometres calculated as difference between the scheduled kilometres and effective kilometres are furnished in the Table below.
Due to operation of 291 buses during 2007-09 on routes with EPKM less than Rs. 20 resulted in a loss of revenue of Rs. 4.37 crore.

Chapter III – Performance Reviews relating to Statutory corporation
77
2004-05 2005-06 2006-07 2007-08 2008-09 Sl.
No. Particulars (In lakh KMs) 1 Scheduled kilometres 4,751.00£ 5,289.53 5,358.48 5,401.01 5,530.032 Effective kilometres 4,299.89 4,402.17 4,223.06 4,182.63 4,732.553 Kilometres cancelled 451.11 887.36 1,135.42 1,218.38 797.48
4 Percentage of cancellation 9.49 16.78 21.19 22.56 14.42
Cause-wise analysisΨ 5 Want of buses 204.40 477.13 671.03 554.12 270.036 Want of crew 28.00 93.97 148.29 205.30 55.507 Others 218.71 316.26 316.10 458.96 471.95
8 Contribution per KM (in Rs.) 8.02 7.78 8.94 9.00 10.47
9 Avoidable cancellation (want of buses and crew) (lakh KM) 232.40 571.10 819.32 759.42 325.53
10 Loss of contribution (8X9) (Rs. in crore) 18.64 44.43 73.25 68.35 34.08
3.58 It can be seen from the above table that the percentage of cancellation of scheduled kilometres increased from 9.49 per cent to 22.56 per cent in 2007-08
and decreased thereafter to 14.42 per cent. Over age buses and shortage of staff were the major reasons for higher percentage of cancellation besides planning of schedules without addition of sufficient buses. Due to cancellation of scheduled kilometres for want of buses and crew, the Corporation was
deprived of contribution of Rs. 238.75 crore during 2004-05 to 2008-09. Further, the Corporation’s failure to repair the buses as per the norms of 14 days and 30 days respectively for minor and major repairs also resulted in cancellation of scheduled kilometres. During the five years up to 2008-09, in 23 Depots test checked, 1,953 buses were over docked for repairs beyond the prescribed norms, resulting in loss of 43,319 bus days leading to loss of contribution of Rs. 9.33 crore. Further, test check of the records of Regional Workshop Kozhikode revealed that two buses were docked from November 2006 and June 2007 for more than 127 and 177 days respectively for want of spares resulting in loss of contribution of Rs. 19.11 lakh. The Corporation had not maintained reliable data relating to holiday cancellation and night trip cancellation. 3.59 The Government stated (August 2009) that the cancellation of schedules had not caused any loss to the Corporation since it was done to reduce the £ In the absence of availability of scheduled kilometres, Gross kilometres operated during 2004-05 have been
taken as scheduled kilometres for the purpose of calculations. Ψ In the absence of cause-wise analysis by the Corporation, test check in Audit of five Depots in respect of the
period under review was conducted and cause-wise percentage so computed was extrapolated on the over all data.
Tamil Nadu (Salem), State Express Transport Corporation (Tamil Nadu) and Tamil Nadu (Villupuram) registered least cancellation of scheduled KMs at 0.45, 0.67 and 0.78 per cent respectively during 2006-07. (Source: STUs profile and performance 2006-07 by CIRT, Pune)
Due to cancellation of scheduled kilometres for want of bus and crew, the Corporation lost contribution of Rs. 238.75 crore.

Audit Report (Commercial) for the year ended 31 March 2009
78
operation of uneconomic trips/schedules. The reply is not convincing since Audit had excluded planned cancellation while working out the loss. Further, by avoiding cancellation for want of buses and crew, the Corporation could have earned contribution towards fixed costs. Maintenance of vehicles Preventive Maintenance 3.60 Preventive maintenance is essential to keep the buses in good running condition and to reduce breakdowns/ other mechanical failures. The Corporation had fixed its own schedule for preventive maintenance based on which monthly maintenance∏, weekly maintenanceϒ, battery maintenance, fuel maintenance and tyre inflation of vehicles were to be conducted. Audit observed that the required preventive maintenance schedules were not being adhered to. Most of the Depots were not maintaining prescribed registers for recording preventive maintenance due and done. A test check of monthly garage inspection reports conducted by Assistant Works Managers of selected Depots for 2008-09♦ revealed lack of preventive maintenance as detailed below.
Type Monthly Maintenance
Weekly Maintenance
Fuel System Maintenance
Oil Change
Tyre Inflation
Battery Maintenance
No. of buses Due 1,055 22,709 2,042 3,039 46,873 23,561No. of buses Done as per norms 966 18,986 1,871 2,992 36,423 22,330Percentage Done as per norms 91.56 83.61 91.63 98.45 77.71 94.78
3.61 It can be seen from the above table that preventive maintenance for tyre inflation was carried out only in 77.71 per cent cases. Audit observed that one of the major reasons for breakdown was tyre puncture. The high incidence of breakdowns was also due to the ineffectiveness of preventive maintenance carried out. The Corporation itself identified that 1,236, 959 and 196 cases of breakdowns were due to maintenance lapse in 2006-07, 2007-08 and 2008-09 respectively. 3.62 The Corporation had fixed (January 2006) Depot-wise norms for consumption of engine oil based on the previous consumption pattern of the Depots. It was noticed in Audit that the Corporation’s consumption of engine oil was in excess of norms by 6.04 lakh litres during 2005-06 to 2007-08♦ which caused an extra expenditure of Rs. 4.55 crore. 3.63 Government replied (August 2009) that lapses in preventive maintenance were due to lack of adequate and skilled staff. However, the fact ∏ Maintenance of suspension system, clutch system, cabin repairs, wheel bearings, brake liners, etc. ϒ General check-up, oil level checking, lubrication of moving parts, etc. ♦ Data relating to previous years was not made available by the Corporation. ♦ Data for 2004-05 was not made available by the Corporation and the consumption was within norms in 2008-
09.
Consumption of engine oil in excess of norms by 6.04 lakh litres during 2005-08 caused an extra expenditure of Rs. 4.55 crore.

Chapter III – Performance Reviews relating to Statutory corporation
79
remains that the Corporation had not explored the possibility of outsourcing preventive maintenance work or hiring of skilled staff on contractual basis. Repairs & Maintenance 3.64 A summarised position of fleet holding, over-aged buses, repairs and maintenance (R&M) expenditure for the last five years up to 2008-09 is given below. Sl. No.
Particulars 2004-05
2005-06
2006-07
2007-08
2008-09
1. Total buses (at the end of the year) 4,644 4,688 4,559 4,893 5,115
2. Over-age buses (more than 10 years old) 739 982 1,129 1,452 1,343
3. Percentage of over-age buses 15.91 20.95 24.76 29.68 26.26
4. R&M Expenses (Rs. in crore) 97.59 101.65 108.75 118.03 118.09
5. R&M Expenses per bus (Rs. in lakh) (4/1) 2.10 2.17 2.39 2.41 2.31
6. Percentage of Manpower cost on R&M Expenses 38.34 34.65 39.99 41.97 41.95
3.65 It can be seen from the above table that R&M expenses per bus were steadily increasing up to 2007-08 and then decreased in 2008-09. The impact of over-age buses on R & M is reflected by the fact that when the number of over-age buses came down in 2008-09, the per bus R & M cost also decreased. Bus-wise details of the R & M were not available with the Corporation. Hence Audit could not work out the economy of maintaining the over-aged buses. However, it may be observed that the average cost of a bus, which stood at Rs. 11.10 lakh in 2008-09 is expended by the Corporation in less than five years on R & M of one bus. Docking of vehicles for fitness Certificates 3.66 The buses are required to be repaired and made fit before sending the same to Regional Transport Offices (RTO) for renewal of fitness certificate under Section 62 of the Central Motor Vehicle Rules, 1989. As the date of expiry of the fitness certificate is known in advance, Management should plan accordingly to get the buses repaired in time so that bus days are not lost due to delay in renewal. A test check of the records revealed that in 10 out of 23 selected Depots/ Sub-Depots, there was delay ranging from 1 to 194 days beyond the date fixed for Motor Vehicle Inspection Report/ Certificate resulting in loss of 6,789 bus days. The loss of contribution due to the same has already been included under paragraph 3.58. It was observed in Audit that the Corporation did not have any system to monitor and ensure timely repairs. Further, the Corporation failed to obtain fitness certificates due to reasons like non- rectification of defects in time and poor condition of the buses, which are prima facie controllable by Management.

Audit Report (Commercial) for the year ended 31 March 2009
80
3.67 The Government attributed (August 2009) delay to lack of qualified and experienced staff. However, proper planning by Management could have resulted in avoiding the same as date of expiry of the Fitness Certificate is known in advance. Manpower Cost 3.68 The cost structure of the organisation shows that manpower and fuel constitute 74.68 per cent of total cost. Interest, depreciation and taxes – the costs which are not controllable in the short-term – account for 16.18 per cent. Thus, the major cost saving can come only from manpower and fuel. 3.69 Manpower is an important element of cost which constituted 39.17 per
cent of total expenditure of the Corporation in 2008-09. Therefore, it is imperative that this cost is kept under control and the manpower is utilised optimally to achieve high productivity. Besides regular employees, the Corporation also deploys temporary
staff in various categories who are paid on daily basis. The payment to these temporary employees is quite less than the payments made to regular employees. Management has assessed that around 60 per cent of these could be deployed on regular basis. Based on Management’s assessment of 60 per cent deployment of temporary employees, the Table below provides the details of manpower, its cost and productivity.
Sl.No. Particulars 2004-05 2005-06 2006-07 2007-08 2008-09 1. Total Manpower (Nos.) 27,962 28,034 26,147 28,262 29,2702. Manpower Cost (Rs. in
crore) 388.14 400.42 395.48 439.77 474.213. Effective KMs (in lakh) 4,299.89 4,402.17 4,223.06 4,182.63 4,732.554. Cost per effective KM (Rs.) 9.03 9.10 9.36 10.51 10.025. Productivity per day per
person (KMs) 42.13 43.02 44.25 40.55 44.306. Total Buses (No.) 4,644 4,688 4,559 4,893 5,1157. Manpower per bus 6.02 5.98 5.74 5.78 5.72
3.70 Manpower cost was higher than the All India Average during all the years under review mainly because of the implementation of pension scheme on par with State Government employees in the Corporation in 1984 following a Government Order without creating a pension fund by the Corporation or Government support. As per the latest finalised accounts of 2005-06, pension and related expenditure constituted 48.45 per cent of total personnel cost. Manpower per bus was reduced from 6.02 in 2004-05 to 5.72 in 2008-09. 3.71 The productivity per day per person increased from 42.13 KM in 2004-05 to 44.25 KM in 2006-07. The decrease in productivity of manpower from 2006-07 was mainly due to recruitment of additional staff without corresponding increase in the effective distance operated. Besides, the
Gujarat, Tamil Nadu (Villupuram) and Tamil Nadu (Salem) registered best performance at Rs. 6.10, Rs. 6.13 and Rs. 6.21 cost per effective KMs respectively during 2006-07. (Source: STUs profile and performance 2006-07 by CIRT, Pune)
Manpower cost was higher than All India Average (2004-09) due to implementation of pension scheme.

Chapter III – Performance Reviews relating to Statutory corporation
81
Corporation was not adhering to the steering duty norms as already mentioned in paragraph 3.44. 3.72 The Corporation had not fixed any norms for manpower productivity. As per the norms fixed by NATPAC for fare fixation, expenditure on wages and salaries was only Rs. 2.63 per KM up to May 2005 after which it increased to Rs. 2.65 and again increased to Rs. 2.93 in June 2008. But the Corporation’s wages and salaries of traffic personnel were higher than the norms of NATPAC in all the five years under review resulting in an extra expenditure of Rs. 243.69 crore as detailed in the table below. Sl.No. Year 2004-05 2005-06 2006-07 2007-08 2008-09
1
Traffic Personnel Cost (Rs. in crore) 163.96 168.11 153.24 159.88 189.92
2
Effective Kilometres (in lakh) 4,299.89 4,402.17 4,223.06 4,182.63 4,732.55
3
Traffic Personnel Cost (Rs. Per KM) 3.81 3.82 3.63 3.82 4.01
4
Norm fixed by NATPAC (Rs. per KM)
2.63 2.65 2.65 2.65 2.93
5
Under recovery of wages (Rs. in crore) [(3-4) x 2]
50.74 51.51 41.39 48.94 51.11
Fuel Cost 3.73 Fuel is a major cost element which constituted 35.50 per cent of total expenditure in 2008-09. Control of fuel costs by a Road Transport Undertaking has a direct bearing on its productivity. The Table below gives the targets fixed by the Corporation for fuel consumption, actual consumption, mileage obtained per litre (Kilometre per litre i.e., KMPL), All India Average and estimated extra expenditure.
Wages and salaries of traffic personnel were higher than NATPAC norms resulting in extra expenditure of Rs. 243.69 crore during 2004-09.

Audit Report (Commercial) for the year ended 31 March 2009
82
Sl.No. Particulars 2004-05 2005-06 2006-07 2007-08 2008-09
1. Gross Kilometres (in lakh) 4,751.00 4,831.00 4,304.43 4,302.84 4,963.01
2. Actual Consumption (in crore litres) 12.18 12.23 10.64 10.52 11.88
3. Kilometre obtained per litre (KMPL) 3.90 3.95 4.05 4.09 4.18
4. Target of KMPL fixed by Corporation 4.50 4.50 4.50 4.50 4.50
5. All India Average in the category♦ 4.94 4.94 4.94 4.94 4.94
6. Consumption as per All India Average (in crore litres) (1/5) 9.62 9.78 8.71 8.71 10.05
7. Excess Consumption (in crore litres) (2-6) 2.56 2.45 1.93 1.81 1.83
8. Average cost per litre (in Rs.) 26.60 31.65 34.67 34.22 35.55
9. Extra expenditure (Rs. in crore) (7X8) 68.10 77.54 66.91 61.94 65.06
3.74 It can be seen from the above table that the mileage obtained per litre has continuously shown an increasing trend over the period under review
though the Corporation could not achieve its target of 4.5 KMPL. The Corporation had identified the main reasons for excessive fuel consumption as bad driving habits, operation of over- aged vehicles, and excessive number of stops. A test check in Audit of statements
of Petrol, Oil and Lubricants (POL) for two months in each year under review, in 23 Depots, showed that up to January 2007 the Corporation had no mechanism in place to monitor vehicle-wise or driver-wise data for consumption of fuel so as to exercise effective management control though the internal manuals prescribed for the recording and analysis of such data. From 2007-08, the Management initiated several measures to control excessive consumption of fuel. It directed operating units to record driver-wise KMPL. Drivers who consistently failed to obtain good mileage were counselled and trained and their performance monitored. A mileage based incentive scheme was also introduced to motivate drivers to achieve better KMPL. However, test check in Audit of 23 selected Depots revealed that in seven Depots∗, driver-wise KMPL data was not maintained. Fuel issue to Depots was strictly controlled by fixing monthly/ daily quotas and fuel tankers were purchased for transporting fuel with a view to avoid pilferage. A Fuel Cell was also set up at top Management level for monitoring fuel efficiency. Further, in nine Depotsϕ, the fuel accounts were not properly maintained. Due to partial implementation of ♦ All India Average is for 2006-07, which has been taken for comparison purpose in all the years under review. ∗ Thodupuzha, Pala, Vizhinjam, Thiruvalla, Mala, Thiruvananthapuram City and Thrissur. ϕ Thodupuzha, Pala, Vizhinjam, Ernakulam, Thiruvalla, Kattakkada, Karunagappally, Aluva and Mavelikkara.
North East Karnataka State Road Transport, Uttar Pradesh and Andhra Pradesh registered mileage of 5.45, 5.33 and 5.26 KMPL. (Source: STUs profile and performance 2006-07 by CIRT, Pune)

Chapter III – Performance Reviews relating to Statutory corporation
83
the Management’s initiatives, the top Management may not be in a position to exercise effective control over the issue. However, these efforts helped the Corporation to improve its mileage. Inspite of these, the Corporation consumed 10.58 crore litres of fuel in excess as compared to All India Average during 2004-05 to 2008-09 resulting in extra expenditure of Rs. 339.55 crore. 3.75 As per the recommendations of COPU (July 2004), the Corporation had fixed unit-wise and engine-wise norms for fuel consumption in January 2006. Audit observed that these norms were fixed on the basis of previous performance only. However, the same were not monitored to take follow up action.
3.76 Government replied (August 2009) that the low mileage obtained by the Corporation compared to the All India Average was due to peculiarities of the State such as high co-efficient of friction in Kerala roads, uneven terrain, higher number of stops etc., and the target of 4.5 KM per litre of fuel was fixed only to motivate the crew to achieve better fuel efficiency. It was also stated that the Management had initiated concrete measures to improve fuel efficiency as proved by the increasing trend from 2004-05 to 2008-09.
3.77 The reply is not convincing since the measures taken by the Corporation had partially succeeded in increasing fuel efficiency which shows that within the State specific constraints, it was possible to improve performance. This is further corroborated by the fact that buses operated by Tamil Nadu State Transport Corporation (TNSTC) in the Thiruvananthapuram- Nagercoil inter-state route were able to obtain higher mileage♦ than the Corporation’s buses plying on the same route though they had more number of stops. The fact remains that though fuel cost was the major element in the Corporation’s operating costs, proportionate attention was not given to improve fuel efficiency.
Body Building
3.78 The Corporation has body building units at all the Workshops. In the absence of data with the Corporation, Audit could not ascertain the expenditure incurred on these body building units. The Corporation also outsourced fabrication of buses to private contractors. Based on information provided by the Management, the cost and efficiency of building bodies of ordinary buses in the Corporation’s own Workshops is compared against the private contractors in the table given below:
♦ TNSTC was able to achieve the mileage of 5.3 KM per litre.
Consumption of 10.58 crore litres of fuel (2004-09) in excess of All India Average resulted in extra expenditure of Rs. 339.55 crore.

Audit Report (Commercial) for the year ended 31 March 2009
84
3.79 The Corporation decided to outsource bus body building by inviting tenders from 2002-03 onwards. The Corporation got fabricated 535 buses during 2004-05 to 2006-07 through outsourcing at the total fabrication cost of Rs. 28.30 crore. In August 2007, it was decided to fabricate the bus bodies in the Central Workshop and four regional Workshops. Accordingly, the Corporation fabricated 1,325 buses at a total cost of Rs. 55.80 crore during 2007-08 and 2008-09. The comparatively low cost of fabrication achieved by the Corporation in 2007-08 and 2008-09 was due to the fact that most of the employees engaged for body building were temporary employees paid on a daily basis. Financial Management 3.80 Raising of funds for capital expenditure, i.e., for replacement/ addition of buses happens to be the major challenge in financial management of Corporation’s affairs. This issue has been covered in paragraph 3.31. The section below deals with the Corporation’s efficiency in raising claims and their recovery. This section also analyses whether an opportunity exists to realign the business model to generate more resources without compromising on service delivery. Claims and Dues 3.81 The Corporation gives its buses on hire for which parties were required to pay in advance the charges at prescribed rates per kilometre basis at the time of booking. It was, however, noticed during Audit that the charges due were not promptly recovered from the parties. As per the provisional accounts an amount of Rs. 14.92 crore was due as on 31 March 2009 from various debtors which mainly comprised of Government Departments. Audit noticed that the Corporation did not prepare year-wise break up of debtors and age-wise details were not maintained. In the absence of maintenance of primary records by the Corporation, Audit could not vouchsafe the party-wise debts.
Sl.No. Particulars 2004-05 2005-06 2006-07 2007-08 2008-09 1. Total No. of buses
fabricated in house Nil Nil 1 569 756
2. Cost of fabrication per bus for ordinary buses (Rs. in lakh)
NA NA 6.09 4.12 4.28
3. No. of days taken to fabricate an ordinary bus NA NA 84 25 20
4. No. of buses fabricated through private contractors 336 190 9 Nil Nil
5. Cost of fabrication per bus (Rs. in lakh) 5.29 5.29 5.29 NA NA
6. No. of days taken to fabricate a bus 43 51 90 NA NA

Chapter III – Performance Reviews relating to Statutory corporation
85
3.82 Further, the Corporation provides free/ concessional passes to various categories of public like students, physically challenged, etc., as detailed in the table below.
Sl.No. Particulars 2004-05 2005-06 2006-07 2007-08 2008-09 1. No. of student passes issued
(No. in lakh) 6.19 5.27 5.67 5.68 6.022. No. of other passes issued 45,197 46,220 47,384 48,114 48,8223. Loss assessed for student
passes (Rs. in crore) 28.82 30.11 32.18 33.13 44.904. Loss assessed for other
passes (Rs. in crore) 66.22 67.39 68.64 71.91 72.705. Total loss claimed from
Government (Rs. in crore) 95.04 97.50 100.82 105.04 117.606. Amount actually received Nil Nil Nil Nil Nil
3.83 It can be seen from the above that against Rs. 516 crore claimed from the Government during the five years ended 2008-09, the Corporation could not realise any amount. The Government stated (April 2009) that reimbursement of concessional passes would arise only if the Corporation is on self sustaining basis. The Government has been releasing funds to the Corporation without repayment being made to enable the Corporation to stand on its own feet. Realignment of business model 3.84 The Corporation is mandated to provide an efficient, adequate and economic road transport to public. Therefore, the Corporation cannot take an absolutely commercial view in running its operations. It has to cater to uneconomical routes to fulfil its mandate. It also has to keep the fares affordable. In such a situation, it is imperative for the Corporation to tap non-traffic revenue sources to cross-subsidise its operations. However, the share of non-traffic revenues was nominal at 1.71 per cent of total revenue during 2004-09. This revenue of Rs. 75.76 crore during 2004-09 was mainly from advertisements and restaurant/ shop rentals. Audit observed that the Corporation has not substantially tapped non-traffic revenue sources. 3.85 Over a period of time, the Corporation has come to acquire sites at prime locations in cities, district and tehsil headquarters. The Corporation generally uses the ground floor/ land for its operations, leaving ample scope to construct and utilise spaces above. Audit observed that the Corporation owned land measuring 15.76 lakh square metres. The Management assessed (January 2007) the market value of the land at Rs. 800 crore. Audit observed that the Corporation had land at important locations admeasuring 7.92 lakh square metres as shown below.

Audit Report (Commercial) for the year ended 31 March 2009
86
Particulars Cities (Municipal areas)
District HQrs.
Tehsil HQrs.
Total
Number of sites 56 1 8 65 Area (Sq. mtrs.) 6,89,123 10,117 92,717 7,91,957 3.86 It is, thus, possible for the Corporation to undertake projects on public private partnership (PPP) basis for construction of shopping complexes, malls, hotels, office spaces, etc., (from first or second floor onwards) in the existing sites so as to bring in a steady stream of revenues without any investment by it. Such projects can be executed without curtailing the existing area of operations of the Corporation and can yield substantial revenue for the Corporation which can only increase year after year. 3.87 The Board of Directors of the Corporation decided (November 1998) to implement projects for constructing commercial complexes at Depots/locations viable for such projects. The Corporation identified 63 such locations upto August 2008. Cost estimates for six of these projects totalling Rs. 201.30 crore have been approved and architects appointed. However, the tender for only Angamaly project has been awarded (July 2008) at a total cost of Rs. 22 crore. Further, the Corporation had taken up four projects to be implemented by itself through advance rent deposit scheme at a total cost of Rs. 14.44 crore. None of the projects has been completed so far (September 2009). 3.88 Audit observed that in spite of initiating the action by Management in November 1998 for commercial exploitation of available land, no project has been completed as yet (September 2009). Thus, due to slow pace of progress and lack of effective action by Management, Corporation was deprived of the benefit from such projects till date. Timely Management action could have helped the Corporation to bring in the steady stream of revenue. 3.89 Further, Audit observed that in the absence of availability of competent staff for undertaking and supervising civil works, the Management may reconsider its decision to execute the projects on rent deposit scheme basis and look for PPP/ BOT route so as to avoid its own monetary and manpower investment. Fare policy and fulfillment of social obligations Existence and fairness of fare policy 3.90 Fare Structure of stage carriages operated in Kerala was decided by the State Government. At the instance of the Government, National Transportation Planning and Research Centre (NATPAC) brought out a ‘Price Index for Stage Carriage Operations’ (PISCO) in 1998, based on limited survey carried out on stage carriages in various regions of the State. Transport Department of the Government requested (February 2004) NATPAC to undertake the task of routine updating of PISCO on quarterly basis. However, the updation by NATPAC was done in an ad hoc manner since the quarterly cost data was not furnished by the private operators and authenticated by the Transport

Chapter III – Performance Reviews relating to Statutory corporation
87
Department. Based on PISCO, bus fare in Kerala was upwardly revised by the State Government three times and reduced♥ once (February 2009) during the period under review. The fare which stood at Rs. 0.35 per KM in April 2004 was increased to Rs. 0.55 per KM in July 2008 and subsequently reduced to Rs. 0.52 per KM from February 2009.
Fare table for ordinary buses (Rs. per KM)
Stages 2004-05 2005-06 2006-07 2007-08 2008-09 First 5 KMs 3.00 3.50 3.50 3.50 4.50First 10 KMs 4.50 5.00 5.00 5.00 5.5025 KMs 10.50 12.00 12.00 12.00 14.00100 KMs 42.00 48.00 48.00 48.00 55.00
3.91 The revised fare was not sufficient to recover the cost of operation of the Corporation since the Corporation could not achieve the fuel standard of 4.5 KM per litre of HSD considered by NATPAC for fare fixation. Also, the Corporation’s manpower cost exceeded the norms fixed by NATPAC. These have been discussed under paragraph 3.72. 3.92 The table below shows how the Corporation could have curtailed cost and increased revenue with better operational efficiency.
Sl.No. Particulars 2004-05 2005-06 2006-07 2007-08 2008-09 1. Cost per KM 21.28 23.25 24.11 25.73 25.57 2. Revenue per KM 17.46 18.56 20.38 20.77 22.08 3. Loss of revenue due to less
vehicle productivity (per KM) 1.56 1.77 2.34 2.41 2.18
4. Excess cost due to low manpower productivity (per KM)
1.18 1.17 0.98 1.17 1.08
5. Excess cost due to excess consumption of fuel (per KM) 1.58 1.76 1.58 1.48 1.37
6. Ideal revenue per KM (2+3) 19.02 20.33 22.72 23.18 24.26 7. Ideal cost per KM [1-(4+5)] 18.52 20.32 21.55 23.08 23.12 8. Net revenue per KM (2-1) -3.82 -4.69 -3.73 -4.96 -3.49 9. Net ideal revenue per KM (6-7) 0.50 0.10 1.17 0.10 1.14 10. Effective KMs (in lakh) 4,299.89 4,402.16 4,223.06 4,182.63 4,732.5511. Avoidable loss (in Rs. crore)
[(8-9) X 10] 185.76 210.86 206.93 211.64 219.12
3.93 The above Table does not take into account other inefficiencies such as low fleet utilisation, excess tyre cost, defective route planning, etc. Nonetheless, it shows that the net loss could be lower, if the operations are properly planned and efficiently managed, than what they actually are. Thus, the case made by the Corporation for increase in fare, includes its inefficiencies and in a way would make the commuters pay more than what they should be actually paying.
♥ Consequent to reduction in price of HSD.
Due to lower vehicle and manpower productivity besides excess consumption of fuel (2004-09), the Corporation sustained avoidable loss of Rs. 1,034.31 crore.

Audit Report (Commercial) for the year ended 31 March 2009
88
3.94 The above facts lead to conclude that it is necessary to regulate the fares on the basis of a normative cost and it would be desirable to have an independent regulatory body (like State Electricity Regulatory Commission) to fix the fares, specify operations on uneconomical routes and address the grievances of commuters. Adequacy of services on uneconomical routes 3.95 The Corporation had about 15.73 per cent profit making schedules as of March 2009 as shown in Table under paragraph 3.51. However, the position would change if the Corporation improves its efficiency. Nonetheless, there would still be some routes which would be uneconomical. Though the Corporation is required to cater to these routes, the Corporation has not formulated norms for providing services on uneconomical routes. It has instead, adopted the practice of classifying all loss making schedules as being operated to fulfil social obligations. In the absence of norms, the adequacy of services on uneconomical routes cannot be ascertained in Audit. The desirability to have an independent regulatory body to specify the quantum of services on uneconomical routes, taking into account the specific needs of commuters, is further underlined. Monitoring by top management MIS data and monitoring of service parameters 3.96 For an organisation like Kerala State Road Transport Corporation to succeed in operating economically, efficiently and effectively, there has to be written norms of operations, service standards and targets. Further, there has to be a Management Information System (MIS) to report on achievement of targets and norms. The achievements need to be reviewed to address deficiencies and also to set targets for subsequent years. The targets should generally be such that the achievement of which would make an organisation self-reliant. In the light of this, Audit reviewed the system existing in the Corporation. 3.97 The Corporation had a comprehensive system for recording operational and financial data by way of a series of specific registers for recording each aspect of functioning. The system was designed in such a way as to enable regular monitoring and comparison with norms. However, it was observed that the registers, including the Cash Book, were not being maintained properly in any of the Depots test checked. Cost accounts were not being maintained even at the Workshops. This was attributed by the Corporation to shortage of manpower. The effect of non-maintenance of vital records has been that the Management is deprived of authentic data with respect to unit level operations and this has a detrimental effect on decision making. 3.98 The Corporation implemented (1986) computerisation with limited application. The data relating to bus operations are initially collected, compiled
Chapter III – Performance Reviews relating to Statutory corporation
89
and reported at unit level, which is subsequently furnished to EDP Wing at Head Office for analysis. EDP Wing generates various operational reports for evaluation by top Management. However, these reports were not being used by the top Management to exercise control over operational areas. 3.99 The Corporation has not made an attempt to treat each bus as a cost centre to assess its performance. Though revenue earned by each bus is available, the expenditure incurred for its operation (including cost of repairs & maintenance, fuel, labour, etc.) is not computed. The Board of Directors though meeting regularly did not evaluate the operational performance to take corrective actions. 3.100 Several proposals were approved by the Government to tide over the financial difficulty. But Management failed to implement such proposals in their true spirit and strengthen its financial viability. Major instances include Government’s Order (May 2003) to convert each unit into profit-centres, closing down loss incurring units, conducting trial study for inducting hired buses on long distance routes and hiring of qualified managerial staff. 3.101 Though the Management issued written instructions from 2007-08 onwards to all units to improve various aspects of its functioning, Audit noticed that the system to monitor the actual implementation of these instructions was ineffective. For instance, despite repeated instructions, the units are not maintaining and analysing trip-wise earnings, and driver-wise mileage. Further, the orders in force to ensure attendance of temporary (empanelled) crew by imposing penalty on defaulters were not enforced by the units. 3.102 The top Management of the Corporation is expected to demonstrate managerial capability to set realistic and progressive targets, address areas of weakness and take remedial action wherever the things are not moving on expected lines. However, such ability was not seen either from records or performance of the Corporation during the period under review except to a limited extent from 2007-08 to 2008-09. Conclusion Operational performance
• The Corporation could not keep pace with the growing demand for public transport as its share declined from 13.77 per cent in 2004-05 to 12.86 per cent in 2008-09.
• The Corporation could not recover the cost of operations in any of the five years under review. This was mainly due to operational inefficiencies, weak financial management and inadequate/ ineffective monitoring by top Management.
• The Corporation was not running its operations efficiently as its performance on important operational parameters like fleet

Audit Report (Commercial) for the year ended 31 March 2009
90
utilisation, vehicle productivity and fuel cost was below All India Average.
• The Corporation did not carry out the preventive maintenance as required in two to 22 per cent cases, affecting the roadworthiness of its buses.
• The Corporation did not ensure economy in operations as its manpower and fuel costs were higher than the All India Average.
Financial management
• The Corporation did not demonstrate utmost discipline in raising its claims for dues in time and follow up recovery of dues to logical end.
• The Corporation has tremendous potential to tap non-conventional sources of revenue but the Management’s delay in taking timely action deprived the Corporation of steady stream of revenue from the same.
Fare policy and fulfillment of social obligations
• Though the State Government has a fare policy, it is not implemented in true spirit.
• No policy yardstick has been laid down for operation on uneconomical routes. Therefore, the adequacy of operations could not be ascertained in Audit.
Monitoring by top management
• Though the Corporation had comprehensive Management Information System in place, it was not implemented properly. Therefore, the monitoring by its top management of key operational parameters and service standards was largely ineffective.
On the whole, there is immense scope to improve the performance of the Corporation. However, the present set-up of the Corporation does not seem to be equipped to handle this. Effective monitoring of key parameters, coupled with certain policy measures, can see improvement in performance. Recommendations Operational performance
• Fleet utilisation may be increased by closely monitoring bus-wise utilisation.
Chapter III – Performance Reviews relating to Statutory corporation
91
• The Corporation may increase vehicle productivity by adhering to the norms of steering duty.
• The Corporation may devise a suitable mechanism to analyse schedule-wise profitability and control the losses on that account while serving the social cause.
• The Corporation may record and analyse cause-wise reasons for cancellation of scheduled kilometres and take corrective actions.
Financial performance
• The Government/ Corporation may consider devising a policy for tapping non-conventional sources of revenue on a large scale, which will result in steady inflow of revenue without additional investment.
• The Government/ Corporation may consider outsourcing the work of record maintenance so that financial records are properly maintained.
Fare policy and fulfillment of social obligations
• The Government may consider creating a regulator to regulate fares and also services on uneconomical routes.
Monitoring by top management
• The Management may make effective use of the MIS system in place and follow up the instructions issued by it to exercise effective adequate control over operational areas.
• Management should regularly monitor important operational parameters to take remedial measures and adequately follow up the same to achieve desired objectives.