chapter iii research method a. research typedigilib.iain-palangkaraya.ac.id/306/4/chapter iii...
TRANSCRIPT

37
CHAPTER III
RESEARCH METHOD
In this chapter, the writer described; research type, research design, place
of the study, population and sample of the study, instrument of study, research
instrument validity, research instrument reliability, techniques of data analysis,
data collection procedures, and data analysis procedures.
A. Research Type
Considering the purposes of the research and the nature of the problems,
the type of research was quantitative research. Quantitative research may be
further classified as either experimental or nonexperimental. In this study the
writer used non-experimental quantitative research, the writer identified variables
and may look for relationships among them but does not manipulate the variables.
Major forms of non-experimental research are relationship studies including ex
post facto and correlational research and survey research.
It was the study which compare the writing ability between the students
who graduated from Islamic School and those graduated from Public School The
Department Of Education The Study Program of English Education of State
Islamic College of Palangka Raya, in order to find the similarities and the
differences. The writer found of casual-effect based of relationship or casual
comparative research (Ex-post Facto research).

38
B. Research Design
The design of this study was Ex-post Facto Research. Ex-post facto
research is similar to an experiment, except the writer did not manipulate the
independent variable, which has already occurred in the natural course of events.
The writer simply compared groups differing on the pre-existing independent
variable to determine any relationship to the dependent variable. Because there is
no manipulation or control of the independent variable, one must be very careful
regarding the conclusions that are drawn about any observed relationship.32
The study used quantitative comparative approach. Related to this,
Aliaga and Gunderson in Daniel stated that “quantitative research is explaining
phenomena by collecting numerical data that are analysed using mathematically
based methods”.33
Ex post facto research is conducted after variation in the
variable of interest has already been determined in the natural course of events.
This method is sometimes called causal comparative because its purpose is to
investigate cause and effect relationships between independent and dependent
variables. Writer used it in situations that do not permit the randomization and
manipulation of variables characteristic of experimental research. Thus, much of
the basic rationale for experimental and ex post facto is the same. They both
investigate relationships among variables and test hypotheses.
The study compared about writing ability in making recount text between
students graduated from Public School and Islamic School at the Department of
32
Donald Ary, Lucy Cheser Jacobs, Chris Sorense, Asghar Razavieh, Introduction to
Research in Education (eight edition), Wadsworth: USA, 2010, p. 26 33
Daniel Muihs, Doing Quantitative Research in Education, London: Sage Publications,
2004, p.1
39
Education of the Study Program of English Education, in order to find the
similarities and the differences. In this study the writer took the third semester
students of at the Department of Education of the Study Program of English
Education of State Islamic College of Palangka Raya as subject of the study. The
subjects divided it into two groups based on the sudents’ graduation. They are
Public School and Islamic School. Then the two groups were tested to know the
differences on their writing ability.
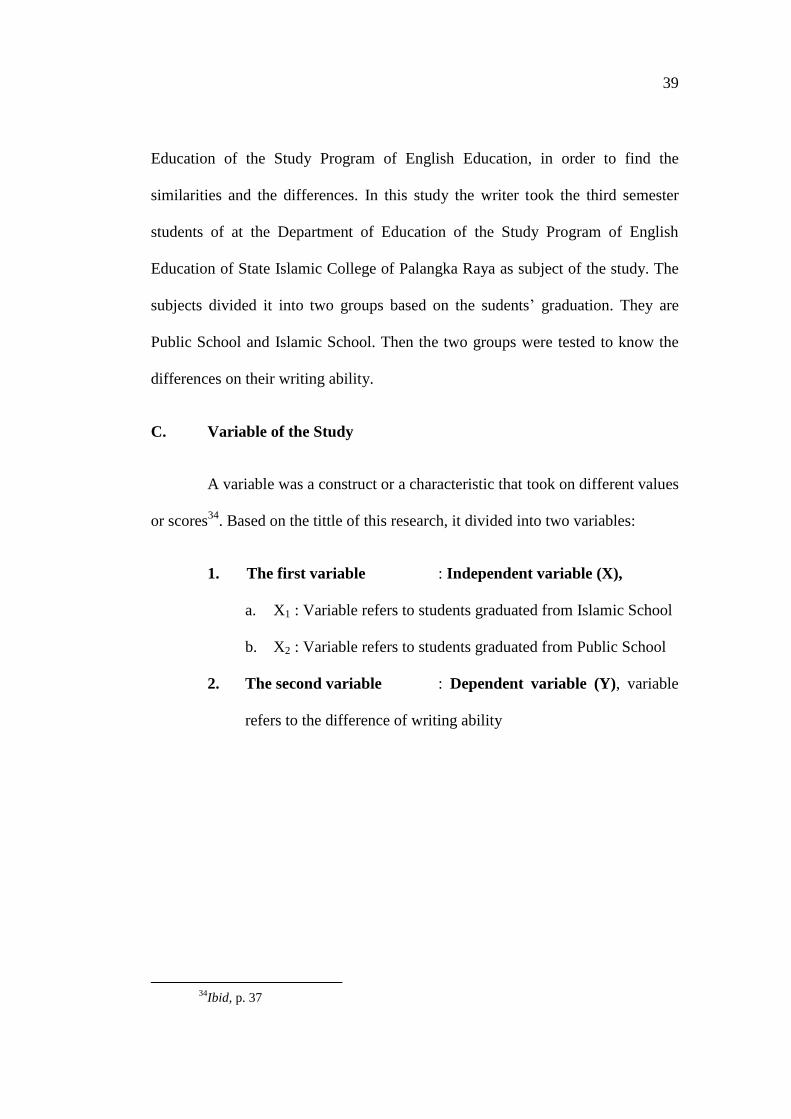
C. Variable of the Study
A variable was a construct or a characteristic that took on different values
or scores34
. Based on the tittle of this research, it divided into two variables:
1. The first variable : Independent variable (X),
a. X1 : Variable refers to students graduated from Islamic School
b. X2 : Variable refers to students graduated from Public School
2. The second variable : Dependent variable (Y), variable
refers to the difference of writing ability
34
Ibid, p. 37

40
D. Population and Sample
1. Population
According to Ary, population is defined as all members of any well-
defined class of people, events, or object.35
For this research, the writer
used population study or census study, because the number of student’s
are few. In this case, writer choosed students graduated from Islamic
School and those graduated from Public School.
The writer need to know the students’ writing ability between students
graduated from Islamic School and those graduated from Public School
of at the Department of Education of the Study Program of English
Education of State Islamimc College of Palangka Raya. The population
of the study was all of the third semester students of at the Department of
Education of the Study Program of English Education of State Islamic
College of Palangka Raya, it contained seventy one (72) students. Based
on their school background, they can be classified into two groups; they
were Public School and Islamic school.
Table 3.1
The Number of Students Based on Their School Background
35
Ibid, p. 138
No Students’ Graduate Total
1 Senior High School 28 Students
2 Vocational School 25 Students
3 Islamic School 19 Students
Total 72 Students

41
2. Sample
The small group that was observed is called a sample.36
It is called
sample research if someone aliens to generalize result of subject research.
In this case, the writer choose students of Department of Study Program
of English Education of State Islamic College of Palangka Raya. Based
on their school-background they can be classified into two groups as a
sample, they are Public School (SMA), and Islamic School
(MA/MAN/PONPES). The sample took in purposive sampling, because
the sample of this study took on the certain purpose.
E. Research Instrument
In this study, the data collection were conducted while the students in the
third semester. The data is need to prove and support this study. By this collecting
data, the writer compared the writing ability between students that graduated from
Public School and Islamic School at Department of Study Program of English
Education of State Islamic College of Palangka Raya. There are two instruments
used by the writer such as test and documentation.
a. Test
The type of the test used was writing test to collect the data, the
type of the writing test used is paragraph writing test. It consisted of
the instruction and statement the subjects addressed in their writing
36
Ibid, p. 148
42
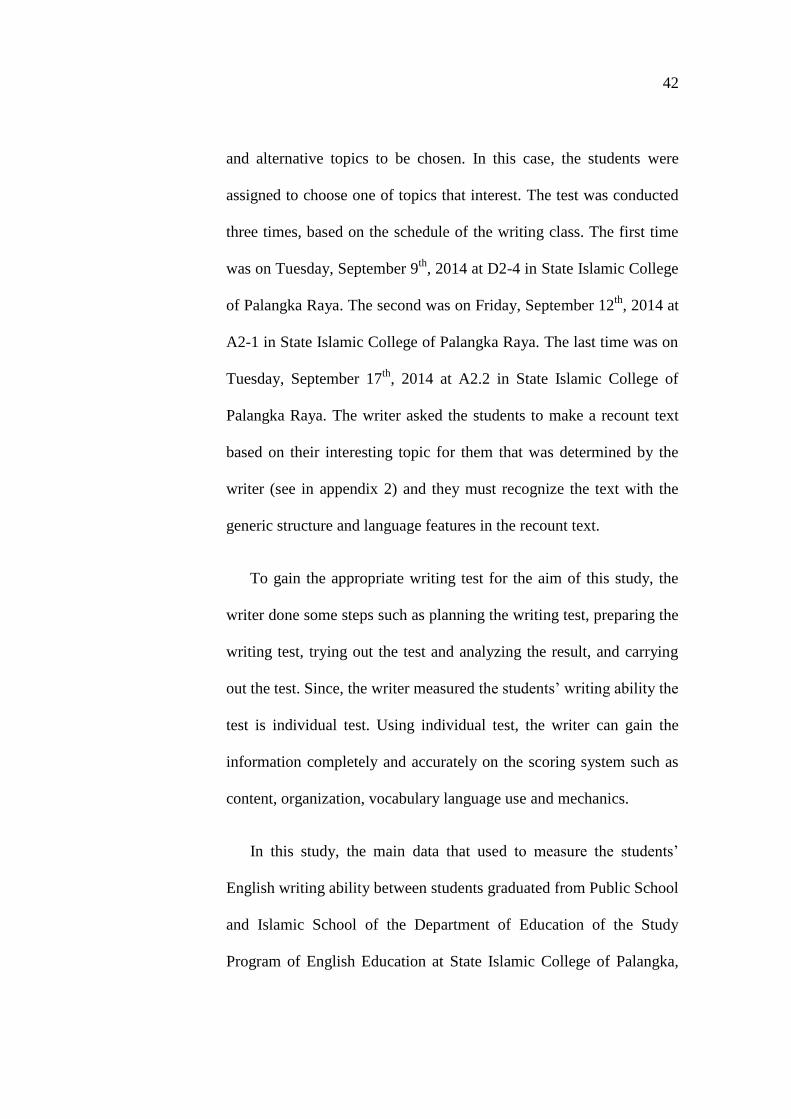
and alternative topics to be chosen. In this case, the students were
assigned to choose one of topics that interest. The test was conducted
three times, based on the schedule of the writing class. The first time
was on Tuesday, September 9th
, 2014 at D2-4 in State Islamic College
of Palangka Raya. The second was on Friday, September 12th
, 2014 at
A2-1 in State Islamic College of Palangka Raya. The last time was on
Tuesday, September 17th
, 2014 at A2.2 in State Islamic College of
Palangka Raya. The writer asked the students to make a recount text
based on their interesting topic for them that was determined by the
writer (see in appendix 2) and they must recognize the text with the
generic structure and language features in the recount text.
To gain the appropriate writing test for the aim of this study, the
writer done some steps such as planning the writing test, preparing the
writing test, trying out the test and analyzing the result, and carrying
out the test. Since, the writer measured the students’ writing ability the
test is individual test. Using individual test, the writer can gain the
information completely and accurately on the scoring system such as
content, organization, vocabulary language use and mechanics.
In this study, the main data that used to measure the students’
English writing ability between students graduated from Public School
and Islamic School of the Department of Education of the Study
Program of English Education at State Islamic College of Palangka,

43
which took through written test, it was about paragraph writing in
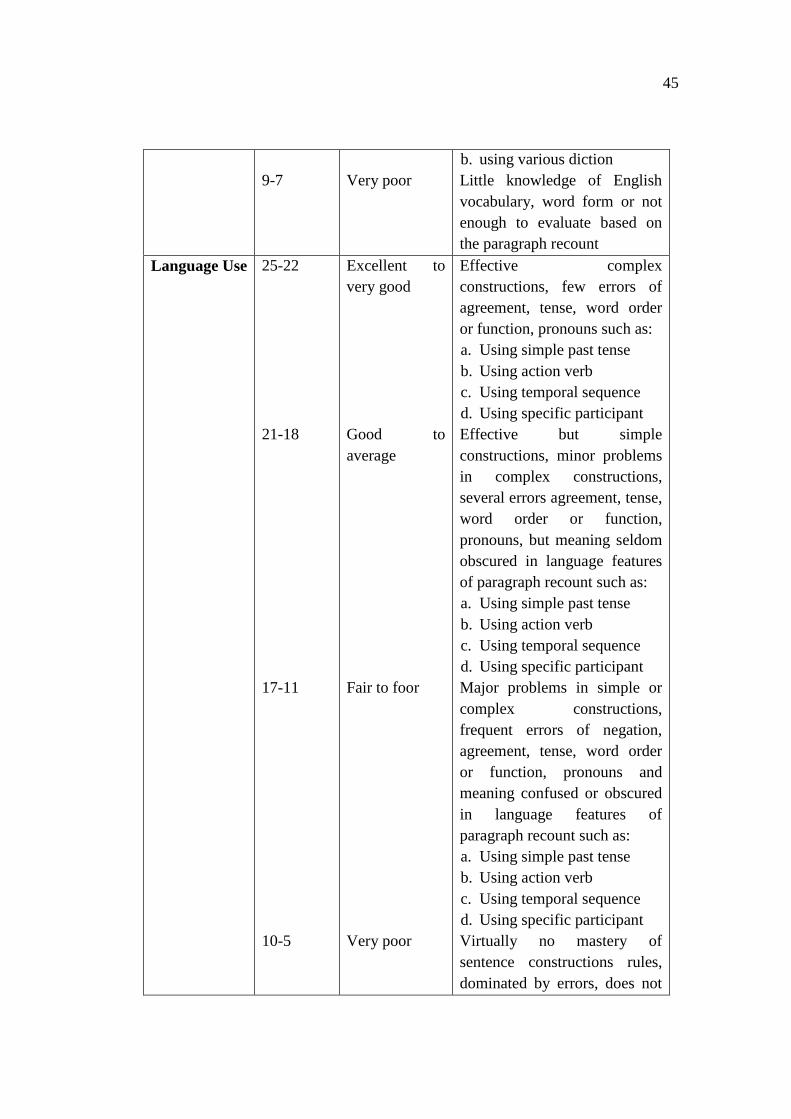
personal recount text. The scoring rubric that used by the writer as
follows, which contained five components that measured the students’
writing ability such as content, organization, vocabulary, language use
and mechanism which had some points that should measure.
Table 3.2 Scoring Rubrics in Making Recount Paragraph
Components Score Level Criteria
Content 30-27
26-22
21-17
16-13
Excellent to
very good
Good to
average
Fair to foor
Very poor
Knowledgeable, substantive
and relevant to assigned topic
such as:
a. Orientation: introducing the
participant (when, where,
who)
b. Event: explaining about the
problem/event
c. Re-orientation: closure the
event
Adequate range, mostly
relevant to topic, but luck
detail in:
a. Orientation: introducing the
participant (when, where,
who)
b. Event: explaining about the
problem/event
c. Re-orientation: closure the
event
Little substance, inadequate
development of topic of
recount text
Not-substantive, not pertinent
or not Enough to evaluate
Organization 20-18
Excellent to
very good
Fluent expression, ideas clearly
stated or supported, succinct,
well organization, logical

44
17-14
13-10
9-7
Good to
average
Fair to foor
Very poor
sequencing and cohesive in:
a. Orientation
b. Event
c. Re-orientation
Loosely organized but main
ideas stand out, limited support
and logical but incomplete
sequencing about:
a. Orientation
b. Event
c. Re-orientation
Non-fluent, ideas confused or
disconnected and lacks logical
sequencing and development
about:
a. Orientation
b. Event
c. Re-orientation
Does not communicate, no
organization or not enough to
evaluate based on the
paragraph recount
Vocabulary 20-18
17-14
13-10
Excellent to
very good
Good to
average
Fair to foor
Effective word or choice and
usage, word form mastery and
appropriate register in:
a. utilizing a word in
paragraph recount
b. using various diction
Adequate range, occasional
errors of word form, choice,
usage but meaning not
obscured in
a. utilizing a word in
paragraph recount
b. using various diction
Frequency errors of word form,
choice, usage and meaning
confused or obscured in
a. utilizing a word in
paragraph recount
45
9-7
Very poor
b. using various diction
Little knowledge of English
vocabulary, word form or not
enough to evaluate based on
the paragraph recount
Language Use 25-22
21-18
17-11
10-5
Excellent to
very good
Good to
average
Fair to foor
Very poor
Effective complex
constructions, few errors of
agreement, tense, word order
or function, pronouns such as:
a. Using simple past tense
b. Using action verb
c. Using temporal sequence
d. Using specific participant
Effective but simple
constructions, minor problems
in complex constructions,
several errors agreement, tense,
word order or function,
pronouns, but meaning seldom
obscured in language features
of paragraph recount such as:
a. Using simple past tense
b. Using action verb
c. Using temporal sequence
d. Using specific participant
Major problems in simple or
complex constructions,
frequent errors of negation,
agreement, tense, word order
or function, pronouns and
meaning confused or obscured
in language features of
paragraph recount such as:
a. Using simple past tense
b. Using action verb
c. Using temporal sequence
d. Using specific participant
Virtually no mastery of
sentence constructions rules,
dominated by errors, does not

46
communicate or not enough to
evaluate based on the
paragraph recount
Mechanics
5
4
3
2
Excellent to
very Good
Good to
Average
Fair to Poor
Very Poor
Demonstrates mastery of
convention, for instance:
a. Few Errors of Spelling
b. Few Errors of Punctuation
c. Few Errors of Capitalization
d. Few Errors of Paragraphing
Occasionals errors in some
points, for instance:
a. Spelling
b. Punctuation
c. Capitalization
d. Paragraphing
e. Meaning Confused Or
Obscured
Frequent errors in some points,
for instance:
a. Spelling
b. Punctuation
c. Capitalization
d. Paragraphing
e. Poor Handwriting
f. Meaning Confused or
Obscured
N No mastery of conventions,
dominated by erros of;
a. Spelling
b. Punctuation
c. Capitalization
d. Paragraphing
e. Handwriting
f. Illegible or not enough to
evaluate

47
b. Documentation
The writer used documentation as the second instrument of the
study. Based on Arikunto’s opinion states “there are three kinds of
source namely paper, place, and people. This technique used to collect
the data in the form of document on the study place. The data that the
writer need such as:
1) The amount, the name, and the student’s registration number of the
students who takes writing subject
2) The number of the third semester students of English education
study program of STAIN Palangka Raya
3) The specification of students graduated
4) The student’s score of writing
After the writer got all the data above, then it classified the students
who should be the subject of the test and the students tried out. In
addition, the writer took some photos when try out and the test will be
conduct.

48
1. Research Instrument Reliability
Reliability is a necessary characteristic of any good test for it to be
valid at all. A test must first be reliable as a measuring instrument. It is the
degree of consistency with which it measures whatever it is measuring.37
In addition, reliability is the accuracy of the measurement and the
consistency of results.38
It is the degree of consistency with which it
measures whatever it is measuring. In this case, to score composition as
fairly and consistently as possible, the writer uses inter-rater method (test
of reliability). Inter-rater reliability is the consistency of the judgment of
several raters on how they see a phenomenon or interpret the responses of
the subjects.
In this case, the two raters were employed to score the students’
writing. The two raters are the writer and a person which mastered the
wrting lesson based on writer’s perception. One important thing in using
the inter rater method in rating process is focused with the training of the
raters. It can maximize the accuracy of the writing assessment. It makes
the raters be consistent in scoring and avoid subjectivity of the raters in
scoring. For this purpose, the training will done to get inter rater agreement
in order to give reliable scores to students’ writing product. The first thing
that need in this case, the two raters must competence toward the test and
37
Donald Ary, Lucy Cheser Jacobs, Chir Sorense, Asghar Razavieh, Introduction to
Research in Education, Wadsworth: USA, 2010, p. 236 38
Hellriegel, John W.S and Richard W. W., Organizational Behavior, Ohio, South
Western College Publishing, 1998, p. 631
49
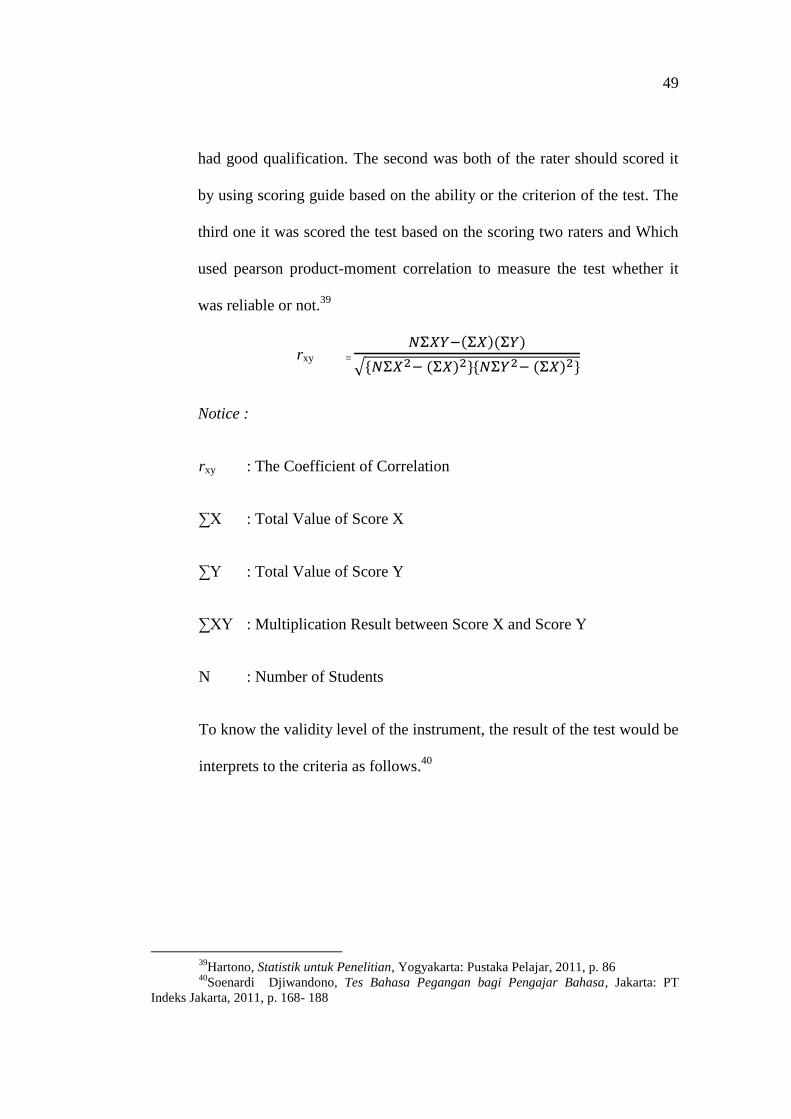
had good qualification. The second was both of the rater should scored it
by using scoring guide based on the ability or the criterion of the test. The
third one it was scored the test based on the scoring two raters and Which
used pearson product-moment correlation to measure the test whether it
was reliable or not.39
rxy =
( )( )
√* ( ) +* ( ) +
Notice :
rxy : The Coefficient of Correlation
∑X : Total Value of Score X
∑Y : Total Value of Score Y
∑XY : Multiplication Result between Score X and Score Y
N : Number of Students
To know the validity level of the instrument, the result of the test would be
interprets to the criteria as follows.40
39
Hartono, Statistik untuk Penelitian, Yogyakarta: Pustaka Pelajar, 2011, p. 86 40
Soenardi Djiwandono, Tes Bahasa Pegangan bagi Pengajar Bahasa, Jakarta: PT
Indeks Jakarta, 2011, p. 168- 188

50
Table 3.3 The Interpretation of Correlation Pearson Product Moment
Coefission Criteria
0.800 – 1.000 Very High Validity
0.600 – 0.799 High Validity
0.400 – 0.599 Fair VaLidity
0.200 – 0.399 Poor Validity
0.001 – 0.199 Very Poor Validity
2. Research Instrument Validity
A validity test or measure is one which measures what is intended to
measure. Validity must always be examined with respect to the use which
is to be made of the values obtained from the measurement procedure.
a. Content Validity
According to Heaton, content validity is:
Kinds of validity depends on a careful analysis of the being test
and the particular course objective. The test should be as
constructed as contain a representative sample of the course, the
relationship between the test item and the course objectives
always being apparent.41
In this study, the writer used essay test for students. It is useful to
measure their writing ability between students graduated from Islamic
School and Public School. The material should be test is about recount
41
J. B. Heaton, Writing English Language Test, England: Longman, 1974, p. 153
51
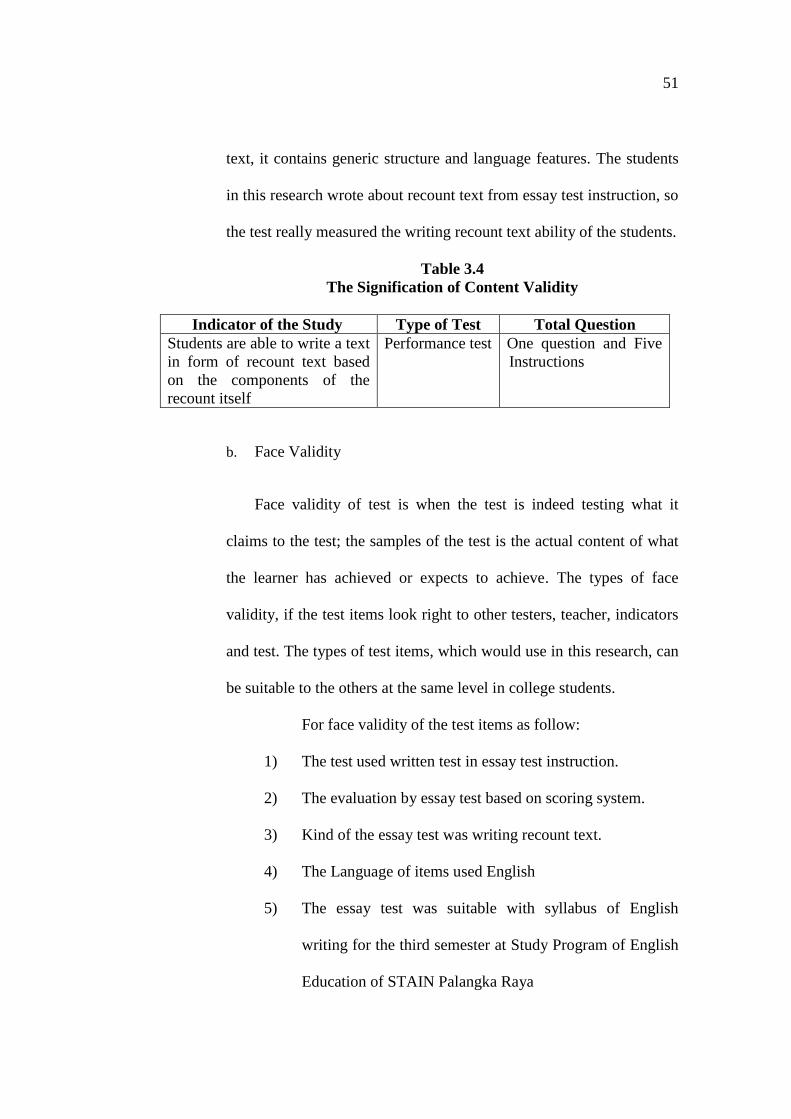
text, it contains generic structure and language features. The students
in this research wrote about recount text from essay test instruction, so
the test really measured the writing recount text ability of the students.
Table 3.4
The Signification of Content Validity
Indicator of the Study Type of Test Total Question
Students are able to write a text
in form of recount text based
on the components of the
recount itself
Performance test One question and Five
Instructions
b. Face Validity
Face validity of test is when the test is indeed testing what it
claims to the test; the samples of the test is the actual content of what
the learner has achieved or expects to achieve. The types of face
validity, if the test items look right to other testers, teacher, indicators
and test. The types of test items, which would use in this research, can
be suitable to the others at the same level in college students.
For face validity of the test items as follow:
1) The test used written test in essay test instruction.
2) The evaluation by essay test based on scoring system.
3) Kind of the essay test was writing recount text.
4) The Language of items used English
5) The essay test was suitable with syllabus of English
writing for the third semester at Study Program of English
Education of STAIN Palangka Raya

52
F. Techniques of Data Analysis
Data analysis ware explained about the kind of statistics analysis which is
used. In this research, writer used inferential statistic. The inferential statistics was
directed to provide the answer if there is a significant difference in writing ability
between the students graduated from Islamic School and those graduated from
Public School. The inferential statistics includes the following points:
1. Normality Test
It is used to know the normality of the data that is going to be
analyzed whether both groups have normal distribution or not. In this
case, the SPSS program 16 will be applied. The data were normal if the
value of the probability was higher than 0.05.
2. Homogeneity Test
Homogenous testing was intended to find out whether or not the
scores of one group have homogenous variance with the scores of the
other groups. The formula is:42
F =
Notice:
F : Frequence
The hypotheses in homogeneity:
Fvalue ≤ Ftable, means both of variants are homogeneity.
Fvalue > Ftable, both of variants are not homogeneity.
42
Ibid, p.280

53
If calculation result of F value is lower than F table by 5% degree
of significance so Ho is accepted, it means both groups have same
variants. The test can be said homogenous if the probability was higher
than 0.05. In addition, the SPSS program will be applied.
G. Data Collection Procedures
In this study, the writer will use some procedures to collect the data. The
procedures consisted of some steps as follows:
1. The writer observed the class
The writer asked permission to the writing II lecturer to observe the
class for finding the data of students that graduated from.
2. The writer determined the groups
The writer determined students into some groups based on their
graduated.
3. The writer gave the test to the students
The writer gave a paragraph writing test to the students in making
personal recount text.
4. The writer (the rater one and the writer two) gave score
There are some criterias that has been measured by the rater one
and rater two such as:
a. Scoring based on the component of paragraph recount writing
such as content, organization, vocabulary language use, and
mechanics.

54
b. Recapitalizing based on the students’ score of writing product
in writing personal recount paragraph.
H. Data Analysis Procedures
The collected data were analyzed by applying some procedures as
follows:
1. The writer determined the range of the score
Before the writer arranges the distribution of frequency table, she
determined the range of score, the class interval, and interval of
temporary, using formula:
a. The range of score ®
R = H – L + 1
Where:
R = Range
H = Highest score
L = Lowest score
b. The class interval (K)
K = 1 + (3,3) x Log n
c. Interval of temporary (I)
I =
Where:
R = Range
K = Class Interval
55
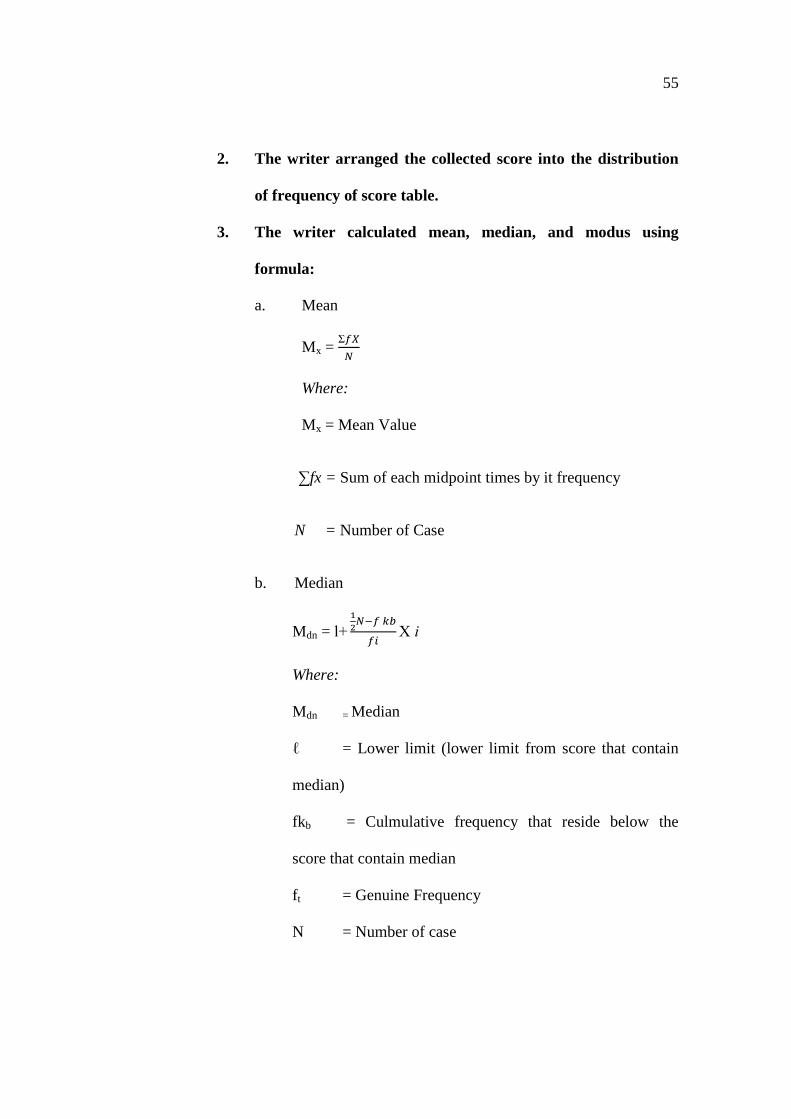
2. The writer arranged the collected score into the distribution
of frequency of score table.
3. The writer calculated mean, median, and modus using
formula:
a. Mean
Mx =
Where:
Mx = Mean Value
∑fx = Sum of each midpoint times by it frequency
N = Number of Case
b. Median
Mdn = l
X
Where:
Mdn = Median
ℓ = Lower limit (lower limit from score that contain
median)
fkb = Culmulative frequency that reside below the
score that contain median
ft = Genuine Frequency
N = Number of case

56
U = upper limit (upper limit from score that contain
median)
fkb = Culmulative frequency that reside above the score
that contain median
c. Modus
Mo = l
X
Where:
Mo = Modus
ℓ = LOWER LIMIT (lower limit from interval that
contain modus)
fa = Frequency that reside above interval that contain
modus
fb = Frequency that reside below interval that contain
modus
u = Upper Limit (upper limit from interval that
contain median)
I = Interval Class
4. The writer calculated the standard deviation using the
formula:
SD = √
Where:

57
SD = Standard Deviation
∑fx = Sum of the multiplication result between each
score frequency with the squared deviation score
N = Number of Case
5. The writer calculated the variance homogeneity.
F =
6. The writer calculated the data by using t-test to the test the
hypothesis of the study, using formula:
t =
√( )
( )
(
)
Where:
N : The Number of Sample
: Average Value of the First Sample
: Average Value of the Second Sample
S1 : Deviation Standard of the First Sample
S2 : Deviation Standard of the Second Sample
: Variance of the First Sample
: Variance of the Second Sample
7. The writer used the level of significance at 5%.
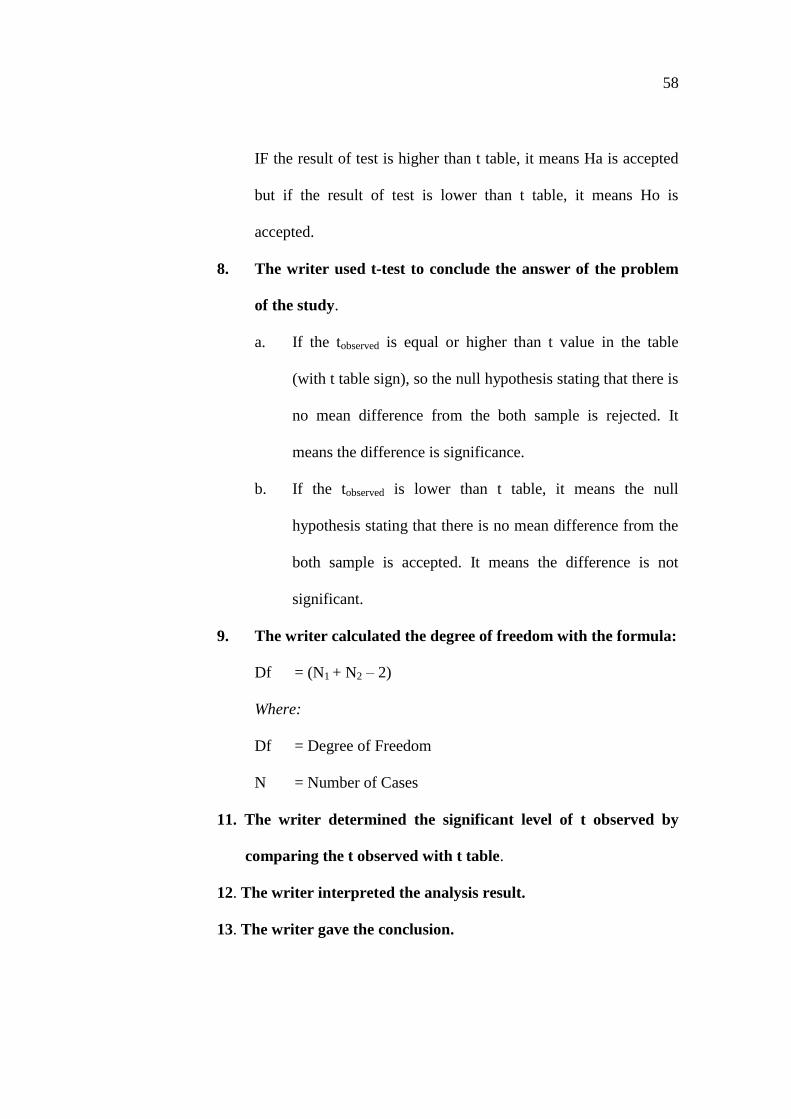
58
IF the result of test is higher than t table, it means Ha is accepted
but if the result of test is lower than t table, it means Ho is
accepted.
8. The writer used t-test to conclude the answer of the problem
of the study.
a. If the tobserved is equal or higher than t value in the table
(with t table sign), so the null hypothesis stating that there is
no mean difference from the both sample is rejected. It
means the difference is significance.
b. If the tobserved is lower than t table, it means the null
hypothesis stating that there is no mean difference from the
both sample is accepted. It means the difference is not
significant.
9. The writer calculated the degree of freedom with the formula:
Df = (N1 + N2 – 2)
Where:
Df = Degree of Freedom
N = Number of Cases
11. The writer determined the significant level of t observed by
comparing the t observed with t table.
12. The writer interpreted the analysis result.
13. The writer gave the conclusion.

59
The data analysis procedures above can be described by the writer as
follows:
Figure 3.1 Writing Analysis Procedures
Writing
Ability
Islamic School Public School
Scored Scored
Writing
test
Writing
test
Compared
Testing normality and homogenity test
Testing hypothesis t- test
Interpretation
Conclussion
Discussion