chapter iv research finding and discussion a. …digilib.uinsby.ac.id/11320/7/bab 4.pdf · chapter...
TRANSCRIPT
49
CHAPTER IV
RESEARCH FINDING AND DISCUSSION
This chapter presents about the result of the finding in the field. The data of
the study are gained during the research. The result is the answer of the research
questions at the chapter I.
A. Research findings
The researcher discusses the data analysis by determining the result of
the students’ comprehension skill in understanding narrative text. The result is
viewed from the score of the students’ test. These scores are used to know the
difference of students’ comprehension skill in understanding narrative text
based on their different sex and school background.
There are two tests which are given to the students. The first test
consists of 25 multiple choices and 25 True/False questions. The researcher
gives 0 score for the wrong answer and 1 score for the correct answer. This
scoring technique is applied for all of questions in the first test (test 1).59
Then, the second test consists of 10 essay questions. The researcher gives
scoring based on the scoring rubric. This scoring technique is applied for all
of questions in the second test (test 2).60
59 It is shown in Appendix 5 60 It is shown in Appendix 6
50
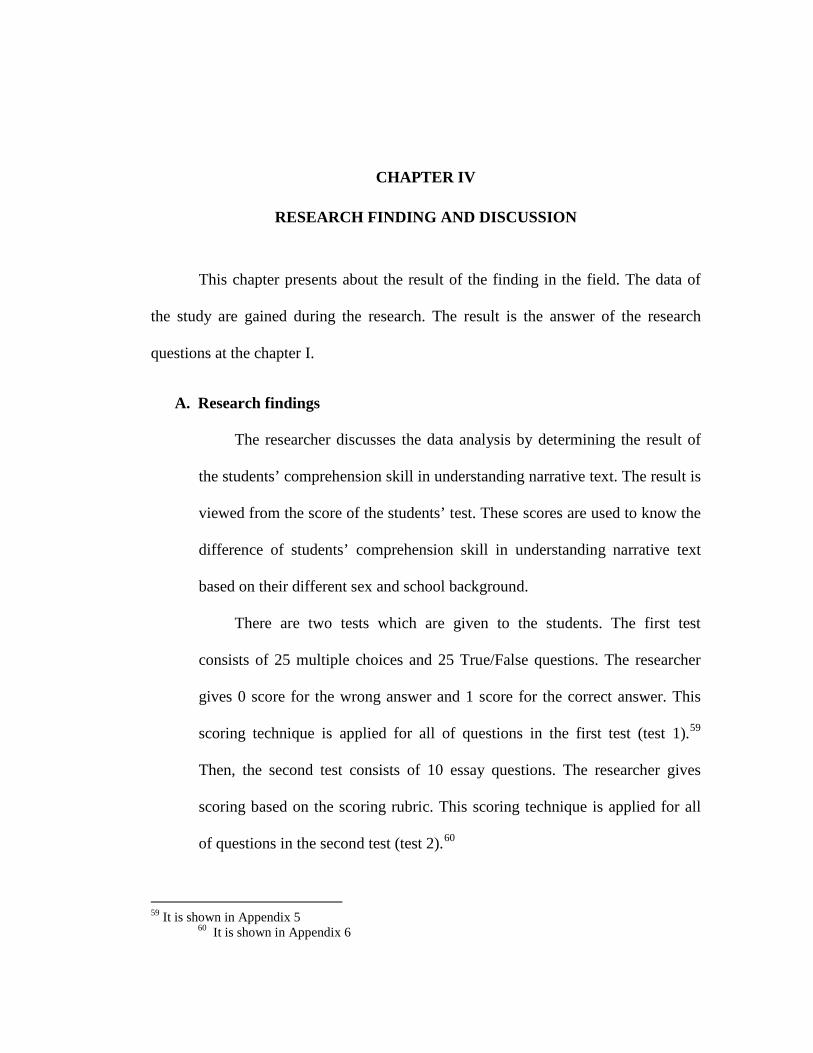
The researcher calculates the sum of the correct answer and counts the
total scores. The researcher tabulates the data of students’ comprehension skill
in understanding narrative text based on their different sex and school
background. It can be seen in the table 4.1, table 4.2, table 4.3, and table 4.4:
Table 4.1 The Score of Female with Private School Background
No. Name Score Of Test
Total Score Test I Test II
1. Lenni Fitriani 43 38 81
2. Cici Nofia Safitri 45 45 90
3. Mufarroha 39 39 78
4. Selvy Meylinda Sari 41 42 83
5. Lailatum Maghfiro 41 39 80
6. Bibichah Ghufroniyah 46 45 91
7. Choirun Nisa’ 43 34 77
8. Firstania Azizah 37 38 75
9. Lisa Rahayu Ningsih 40 40 80
10. Novia Cahayani 44 38 82
Total 817
Table 4.2 The Score of Male with Private School Background
No. Name Score Of Test
Total Score Test I Test II
1. Yogi Ardi Setiawan 37 33 70
51
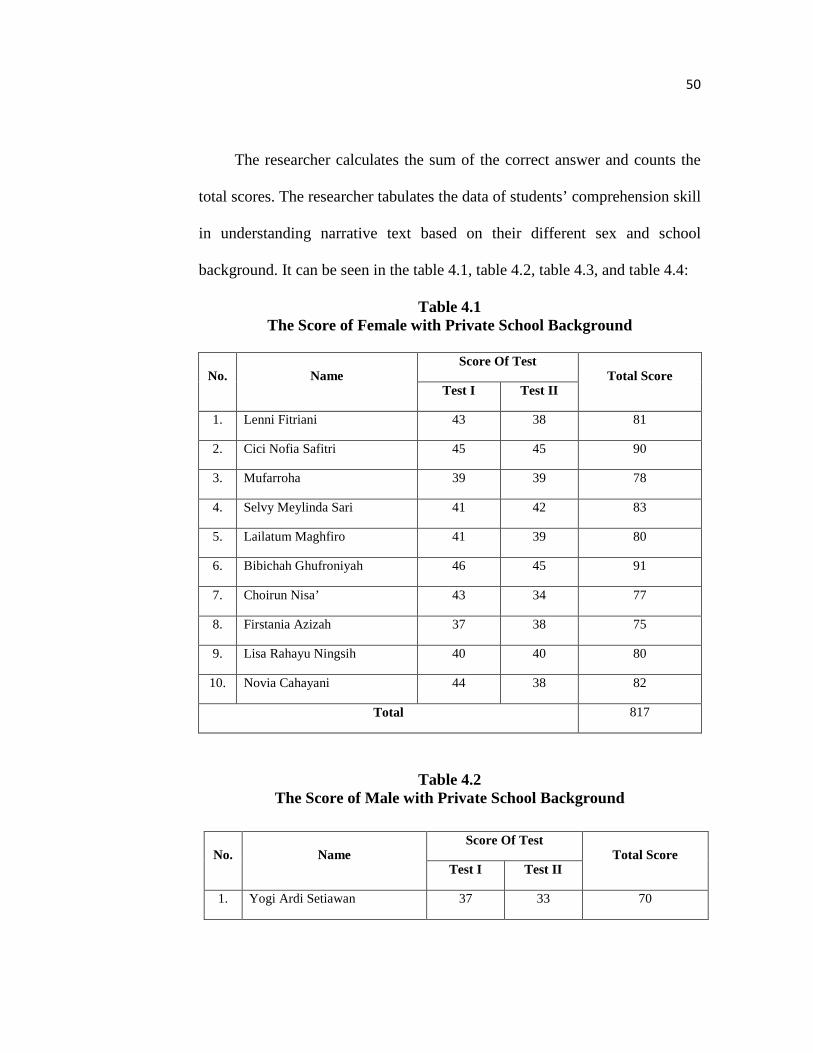
Table 4.3 The Score of Female with Public School Background
No. Name Score Of Test
Total Score Test I Test II
1. Lina arofah 40 43 83
2. Ira 39 36 75
3. Putri Febriani 39 31 70
4. Dinda Nur Ningrat S. 46 45 91
5. Desinta Fitrianingsih 39 36 75
6. Ratih Nawang Papule 41 39 80
7. Ika Ayunda S. 39 38 77
8. Yuni Ambarwati 37 35 72
9. Vina Eka Safitri 44 41 85
10. Tri Rahayu 36 39 75
Total 783
2. Makhzuna Alam Fikri 40 43 83
3. Moh. Al'lail Ubnani 38 39 77
4. Ade Kurniawan 37 35 72
5. Firman Ariansyah 41 39 80
6. Achmad Irfan rosadi 45 41 86
7. M.Renaldi 33 39 72
8. Ajib Romdon 34 33 67
9. M. Fajar Ilyasa 39 36 75
10. Ikhsan Dwi Firnandhika 33 32 65
Total 747
52
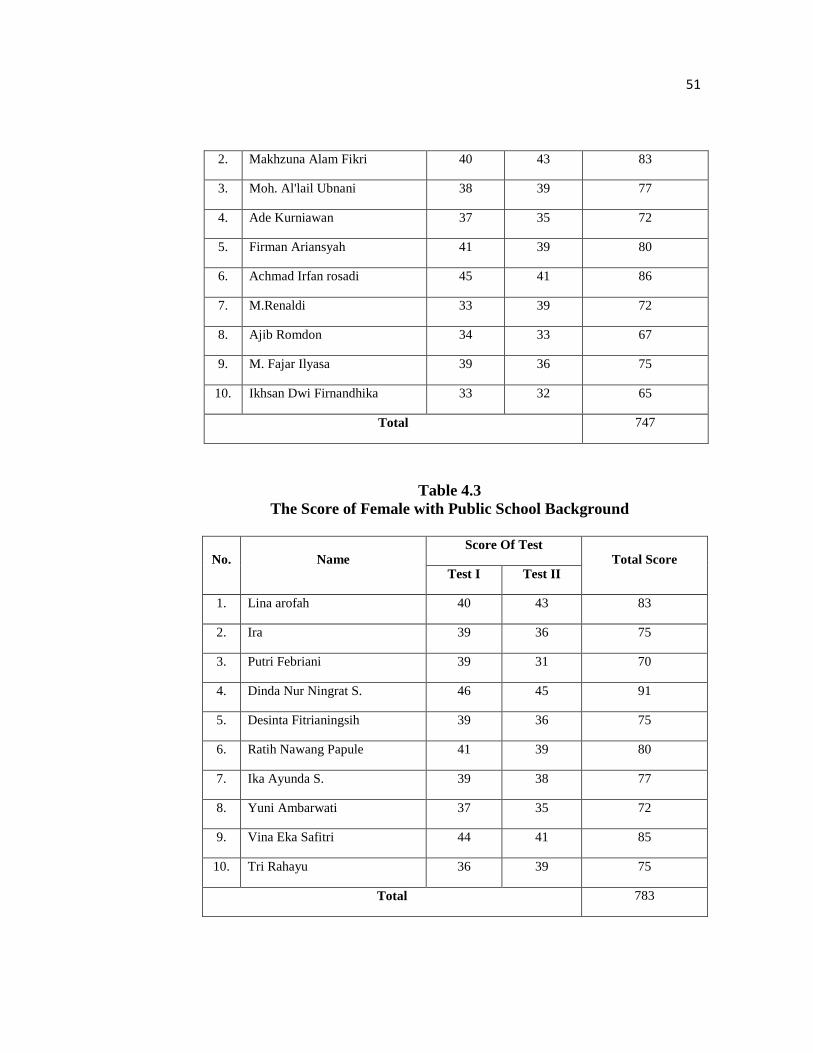
Table 4.4 The Score of Male with Public School Background
No. Name Score Of Test
Total Score Test I Test II
1. Surya Fathur Ramadhan 39 36 75
2. Mohammad Tofa 35 32 67
3. Rifqi Laksma W. 31 38 69
4. M.Chabib Asrorudin 39 34 73
5. Rifa Dwi Permana P. 45 42 87
6. Dendy Wahyu W. 40 40 80
7. Iqbal Firmansyah 33 37 70
8. Muh. Lukman Ardiansyah 37 38 75
9. Muh. Yudha Firdaus 32 33 65
10. Dendi Rahmat Fahrezi 34 36 70
Total 731
The data from table 4.1, table 4.2, table 4.3, and table 4.4 show the
students’ result in reading comprehension skill of narrative text. The total
score is the sum up of the students’ score in the first test (test 1) and the
second test (test 2). Test 1 is about fairy tale and test 2 is about fable. There
are two types of questions in test 1, they are 25 multiple choices and 25
True/False questions. In test 2, there are 10 essay questions. The questions are
covering the narrative text either the content which is the generic structure
(orientation, complication, and resolution) consist of events, actors, time and
location or the way how the narrative is told.

53
B. Data Analysis
The result of the students’ ability in comprehending narrative text shown
in table 4.1, table 4.2, table 4.3, and table 4.4 are used by the researcher to
analyze the data further by using Two-Way ANOVA. It is used to verify the
hypothesis. There are several steps which are used in analyzing the data. First,
the researcher finds the quadrate of the score and the mean of it. It can be seen
in table 4.5, table 4.6, table 4.7, and table 4.8:
Table 4.5 The Score of Female with Private School Background
No. Name Score
(X) (X²)
1. Lenni Fitriani 81 6561
2. Cici Nofia Safitri 90 8100
3. Mufarroha 78 6084
4. Selvy Meylinda Sari 83 6889
5. Lailatum Maghfiro 80 6400
6. Bibichah Ghufroniyah 91 8281
7. Choirun Nisa’ 77 5929
8. Firstania Azizah 75 5625
9. Lisa Rahayu Ningsih 80 6400
10. Novia Cahayani 82 6724
Total ∑X= 817
= 81.7
∑X= 66993
= 6699.3
54
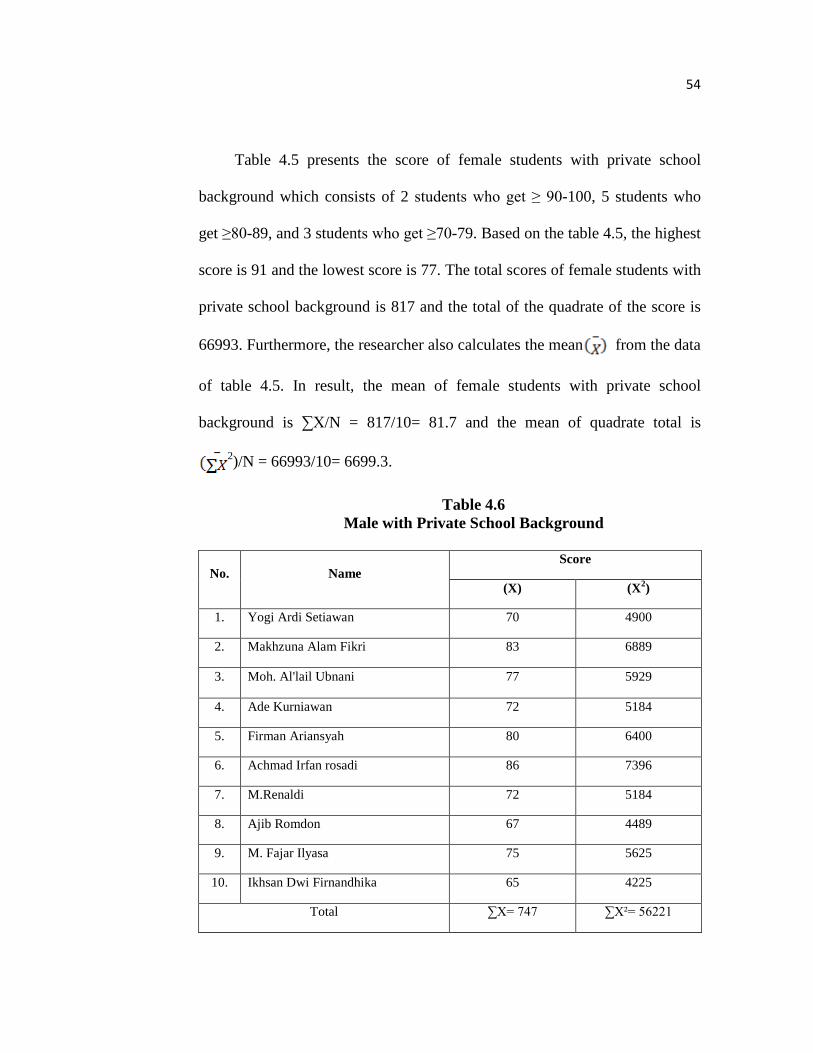
Table 4.5 presents the score of female students with private school
background which consists of 2 students who get ≥ 90-100, 5 students who
get ≥80-89, and 3 students who get ≥70-79. Based on the table 4.5, the highest
score is 91 and the lowest score is 77. The total scores of female students with
private school background is 817 and the total of the quadrate of the score is
66993. Furthermore, the researcher also calculates the mean from the data
of table 4.5. In result, the mean of female students with private school
background is ∑X/N = 817/10= 81.7 and the mean of quadrate total is
2)/N = 66993/10= 6699.3.
Table 4.6 Male with Private School Background
No. Name Score
(X) (X2)
1. Yogi Ardi Setiawan 70 4900
2. Makhzuna Alam Fikri 83 6889
3. Moh. Al'lail Ubnani 77 5929
4. Ade Kurniawan 72 5184
5. Firman Ariansyah 80 6400
6. Achmad Irfan rosadi 86 7396
7. M.Renaldi 72 5184
8. Ajib Romdon 67 4489
9. M. Fajar Ilyasa 75 5625
10. Ikhsan Dwi Firnandhika 65 4225
Total ∑X= 747 ∑X²= 56221
55
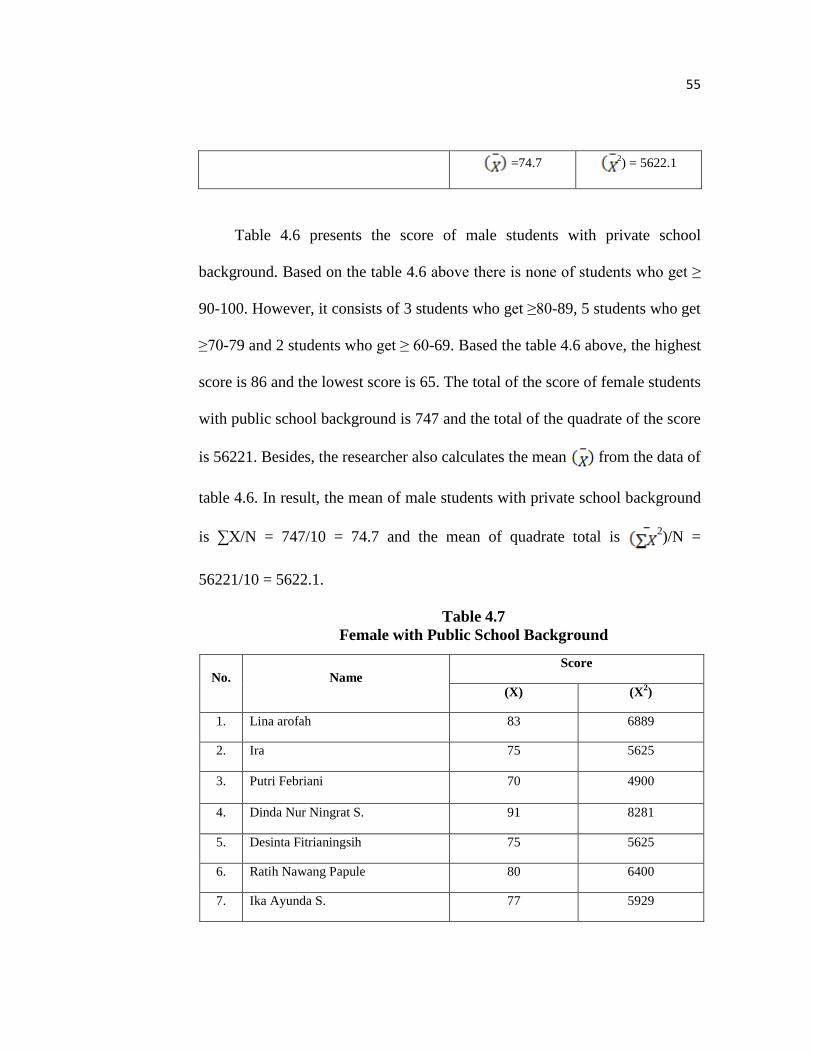
=74.7 2) = 5622.1
Table 4.6 presents the score of male students with private school
background. Based on the table 4.6 above there is none of students who get ≥
90-100. However, it consists of 3 students who get ≥80-89, 5 students who get
≥70-79 and 2 students who get ≥ 60-69. Based the table 4.6 above, the highest
score is 86 and the lowest score is 65. The total of the score of female students
with public school background is 747 and the total of the quadrate of the score
is 56221. Besides, the researcher also calculates the mean from the data of
table 4.6. In result, the mean of male students with private school background
is ∑X/N = 747/10 = 74.7 and the mean of quadrate total is 2)/N =
56221/10 = 5622.1.
Table 4.7 Female with Public School Background
No. Name Score
(X) (X2)
1. Lina arofah 83 6889
2. Ira 75 5625
3. Putri Febriani 70 4900
4. Dinda Nur Ningrat S. 91 8281
5. Desinta Fitrianingsih 75 5625
6. Ratih Nawang Papule 80 6400
7. Ika Ayunda S. 77 5929
56
T
h
e
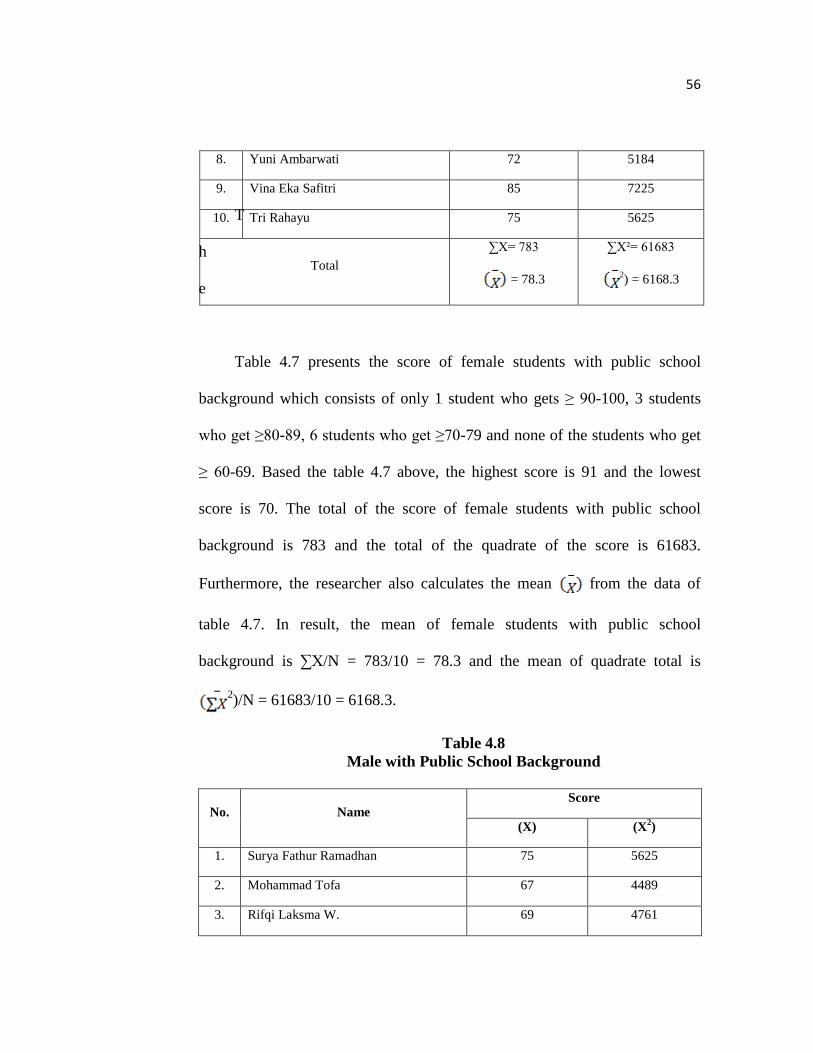
Table 4.7 presents the score of female students with public school
background which consists of only 1 student who gets ≥ 90-100, 3 students
who get ≥80-89, 6 students who get ≥70-79 and none of the students who get
≥ 60-69. Based the table 4.7 above, the highest score is 91 and the lowest
score is 70. The total of the score of female students with public school
background is 783 and the total of the quadrate of the score is 61683.
Furthermore, the researcher also calculates the mean from the data of
table 4.7. In result, the mean of female students with public school
background is ∑X/N = 783/10 = 78.3 and the mean of quadrate total is
2)/N = 61683/10 = 6168.3.
Table 4.8 Male with Public School Background
No. Name Score
(X) (X2)
1. Surya Fathur Ramadhan 75 5625
2. Mohammad Tofa 67 4489
3. Rifqi Laksma W. 69 4761
8. Yuni Ambarwati 72 5184
9. Vina Eka Safitri 85 7225
10. Tri Rahayu 75 5625
Total ∑X= 783
= 78.3
∑X²= 61683
2) = 6168.3
57
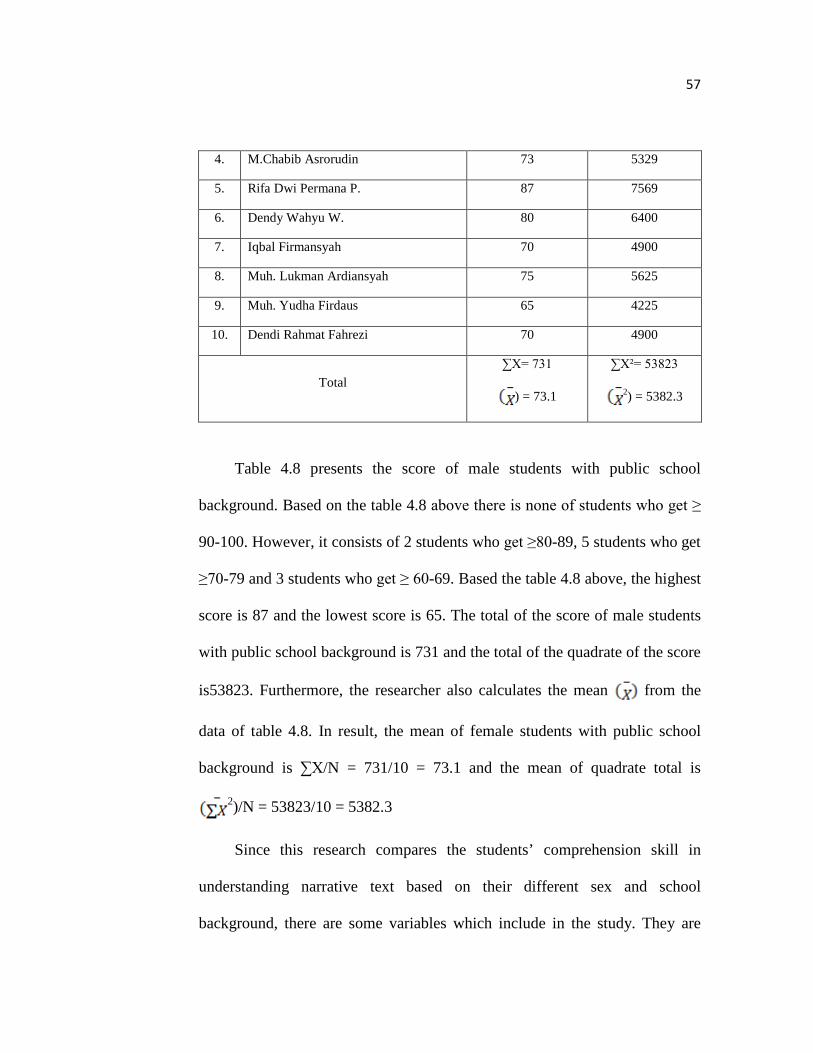
4. M.Chabib Asrorudin 73 5329
5. Rifa Dwi Permana P. 87 7569
6. Dendy Wahyu W. 80 6400
7. Iqbal Firmansyah 70 4900
8. Muh. Lukman Ardiansyah 75 5625
9. Muh. Yudha Firdaus 65 4225
10. Dendi Rahmat Fahrezi 70 4900
Total ∑X= 731
) = 73.1
∑X²= 53823
2) = 5382.3
Table 4.8 presents the score of male students with public school
background. Based on the table 4.8 above there is none of students who get ≥
90-100. However, it consists of 2 students who get ≥80-89, 5 students who get
≥70-79 and 3 students who get ≥ 60-69. Based the table 4.8 above, the highest
score is 87 and the lowest score is 65. The total of the score of male students
with public school background is 731 and the total of the quadrate of the score
is53823. Furthermore, the researcher also calculates the mean from the
data of table 4.8. In result, the mean of female students with public school
background is ∑X/N = 731/10 = 73.1 and the mean of quadrate total is
2)/N = 53823/10 = 5382.3
Since this research compares the students’ comprehension skill in
understanding narrative text based on their different sex and school
background, there are some variables which include in the study. They are
58
independent variable (students’ different sex and school background) and
dependent variable (students’ comprehension skill in understanding narrative
text).
Therefore, in analyzing the data using Two-Way ANOVA, the
researcher finds the main effect of A (the students’ different sex), main
effect of B (the students’ different school background), and interaction of A
and B. Thus the researcher partitions variance into parts caused by IVA, IVB,
IntAxB, and Error.
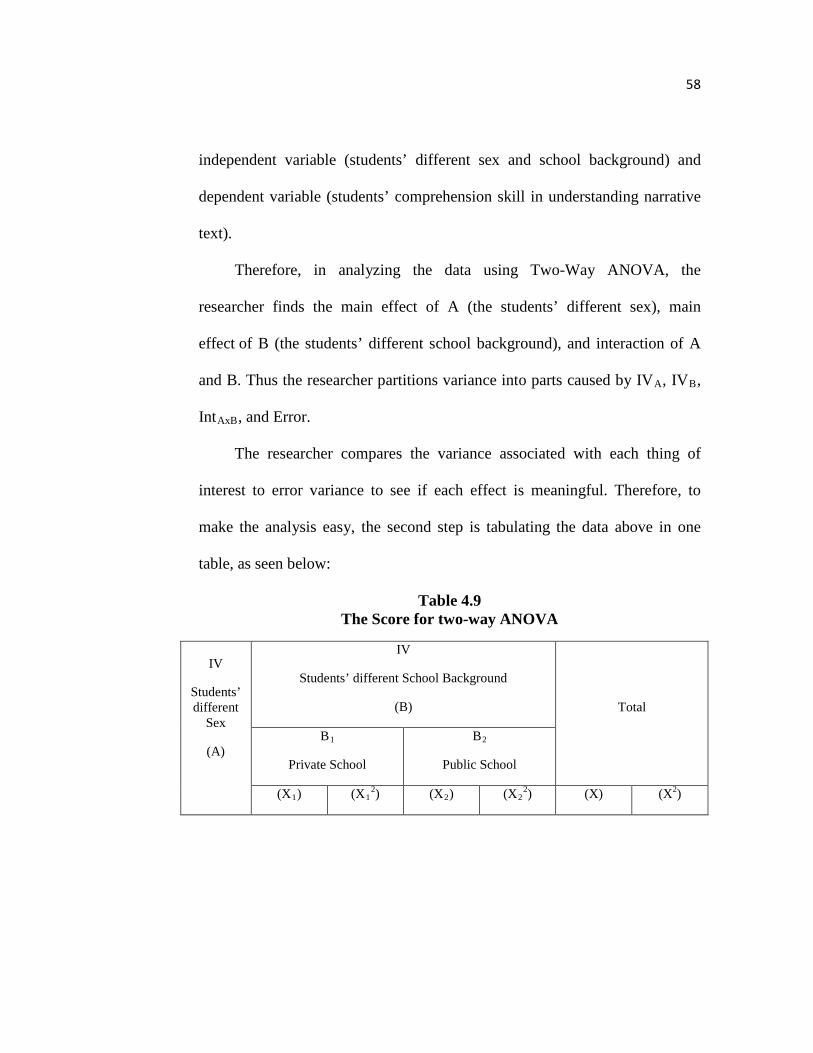
The researcher compares the variance associated with each thing of
interest to error variance to see if each effect is meaningful. Therefore, to
make the analysis easy, the second step is tabulating the data above in one
table, as seen below:
Table 4.9 The Score for two-way ANOVA
IV
Students’ different
Sex
(A)
IV
Students’ different School Background
(B)
Total
B1
Private School
B2
Public School
(X1) (X12) (X2) (X2
2) (X) (X2)
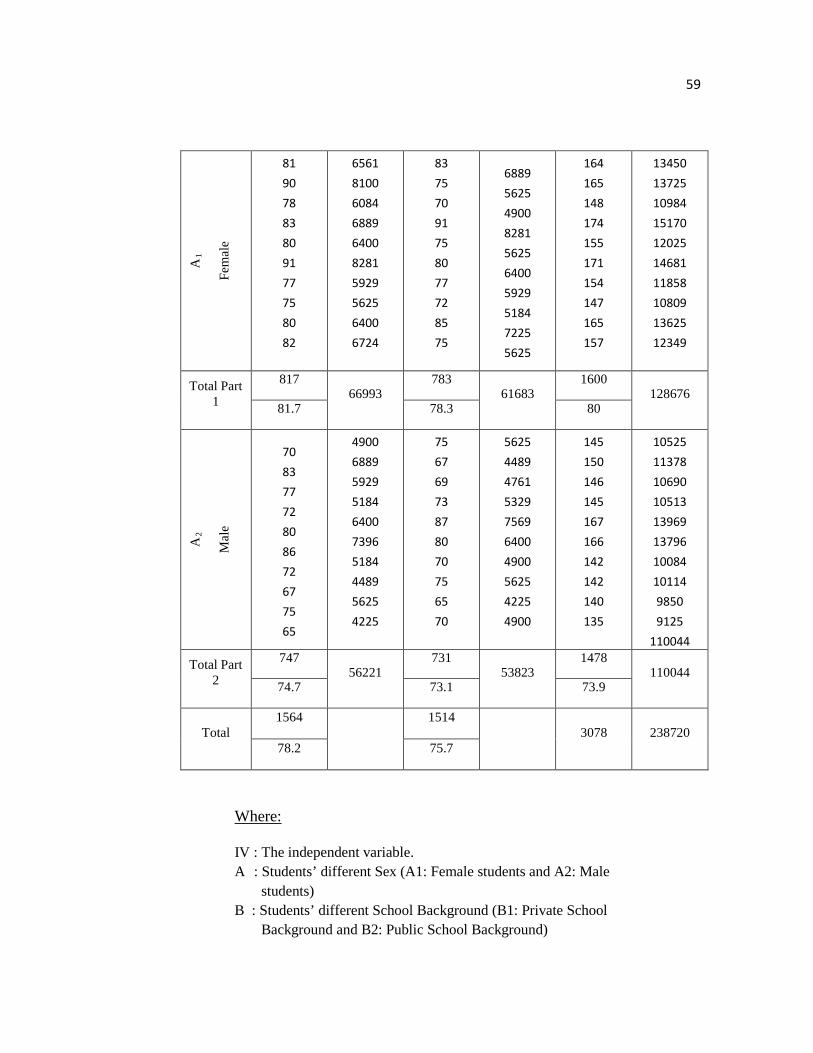
59
A1
Fem
ale
81 90 78 83 80 91 77 75 80 82
6561 8100 6084 6889 6400 8281 5929 5625 6400 6724
83 75 70 91 75 80 77 72 85 75
6889 5625 4900 8281 5625 6400 5929 5184 7225 5625
164 165 148 174 155 171 154 147 165 157
13450 13725 10984 15170 12025 14681 11858 10809 13625 12349
Total Part 1
817 66993
783 61683
1600 128676
81.7 78.3 80
A2
Mal
e
70 83 77 72 80 86 72 67 75 65
4900 6889 5929 5184 6400 7396 5184 4489 5625 4225
75 67 69 73 87 80 70 75 65 70
5625 4489 4761 5329 7569 6400 4900 5625 4225 4900
145 150 146 145 167 166 142 142 140 135
10525 11378 10690 10513 13969 13796 10084 10114 9850 9125
110044
Total Part 2
747 56221
731 53823
1478 110044
74.7 73.1 73.9
Total 1564
1514
3078 238720 78.2 75.7
Where:
IV : The independent variable. A : Students’ different Sex (A1: Female students and A2: Male
students) B : Students’ different School Background (B1: Private School
Background and B2: Public School Background)
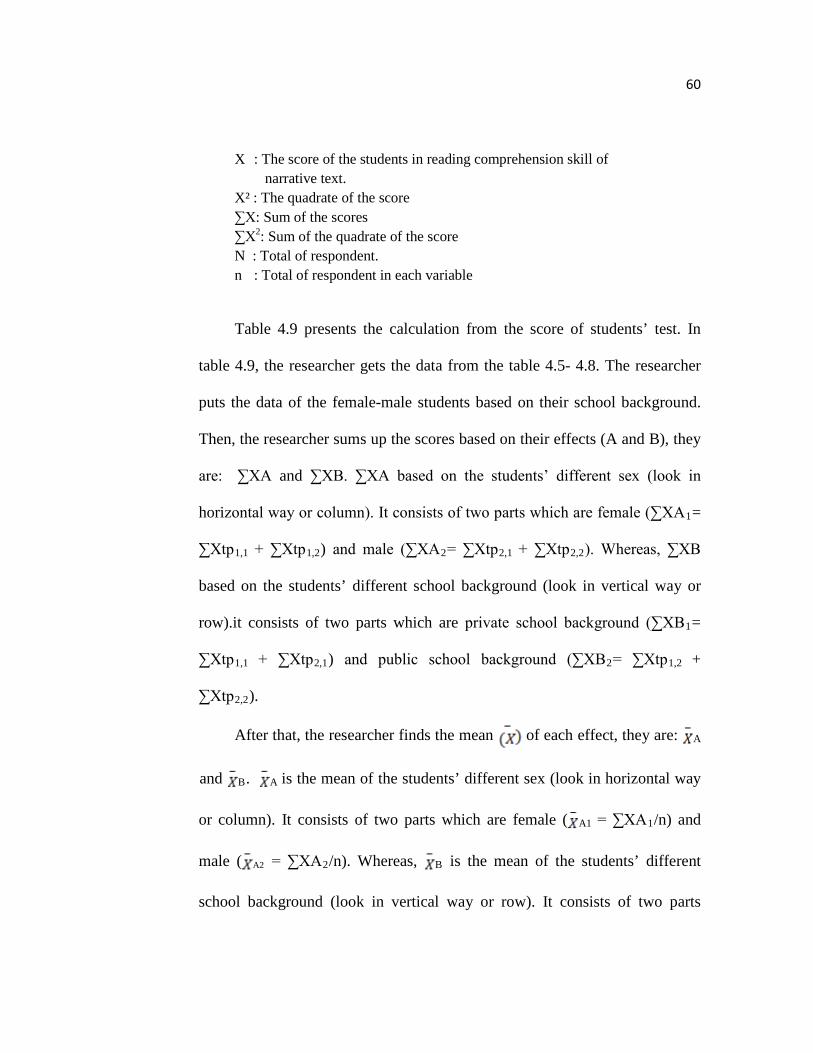
60
X : The score of the students in reading comprehension skill of narrative text.
X² : The quadrate of the score ∑X: Sum of the scores ∑X2: Sum of the quadrate of the score N : Total of respondent. n : Total of respondent in each variable Table 4.9 presents the calculation from the score of students’ test. In
table 4.9, the researcher gets the data from the table 4.5- 4.8. The researcher
puts the data of the female-male students based on their school background.
Then, the researcher sums up the scores based on their effects (A and B), they
are: ∑XA and ∑XB. ∑XA based on the students’ different sex (look in
horizontal way or column). It consists of two parts which are female (∑XA1=
∑Xtp1,1 + ∑Xtp1,2) and male (∑XA2= ∑Xtp2,1 + ∑Xtp2,2). Whereas, ∑XB
based on the students’ different school background (look in vertical way or
row).it consists of two parts which are private school background (∑XB1=
∑Xtp1,1 + ∑Xtp2,1) and public school background (∑XB2= ∑Xtp1,2 +
∑Xtp2,2).
After that, the researcher finds the mean of each effect, they are: A
and B. A is the mean of the students’ different sex (look in horizontal way
or column). It consists of two parts which are female ( A1 = ∑XA1/n) and
male ( A2 = ∑XA2/n). Whereas, B is the mean of the students’ different
school background (look in vertical way or row). It consists of two parts
61
which are private school background ( B1 = ∑XB1/n) and public school
background ( B2 = ∑XB2/n). The last, the researcher sums up all the score
(∑Xtot= ∑XA1 + ∑XA2 or ∑Xtot= ∑XB1 + ∑XB2) and sums up all the
quadrate of the score (∑Xtot2 = ∑XA1 + ∑XA2 or ∑Xtot= ∑XB1 + ∑XB2).
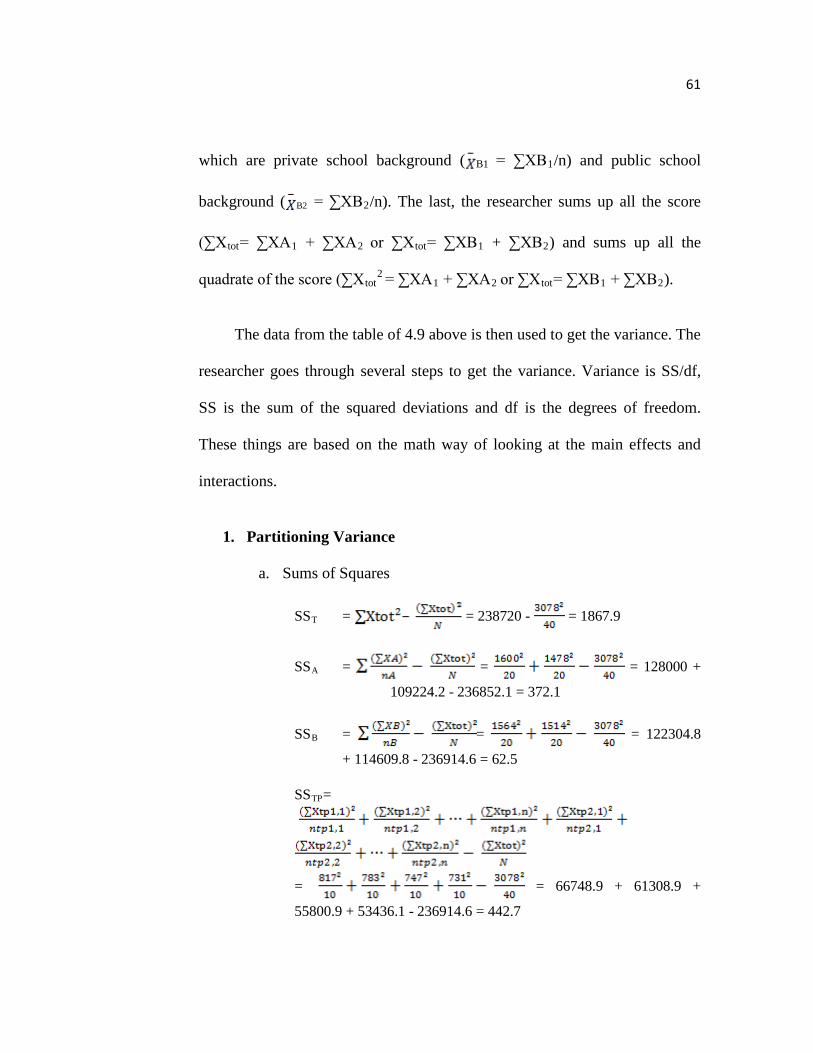
The data from the table of 4.9 above is then used to get the variance. The
researcher goes through several steps to get the variance. Variance is SS/df,
SS is the sum of the squared deviations and df is the degrees of freedom.
These things are based on the math way of looking at the main effects and
interactions.
1. Partitioning Variance
a. Sums of Squares
SST = = 238720 - = 1867.9
SSA = = = 128000 +
109224.2 - 236852.1 = 372.1
SSB = = = 122304.8
+ 114609.8 - 236914.6 = 62.5
SSTP=
= = 66748.9 + 61308.9 +
55800.9 + 53436.1 - 236914.6 = 442.7
62
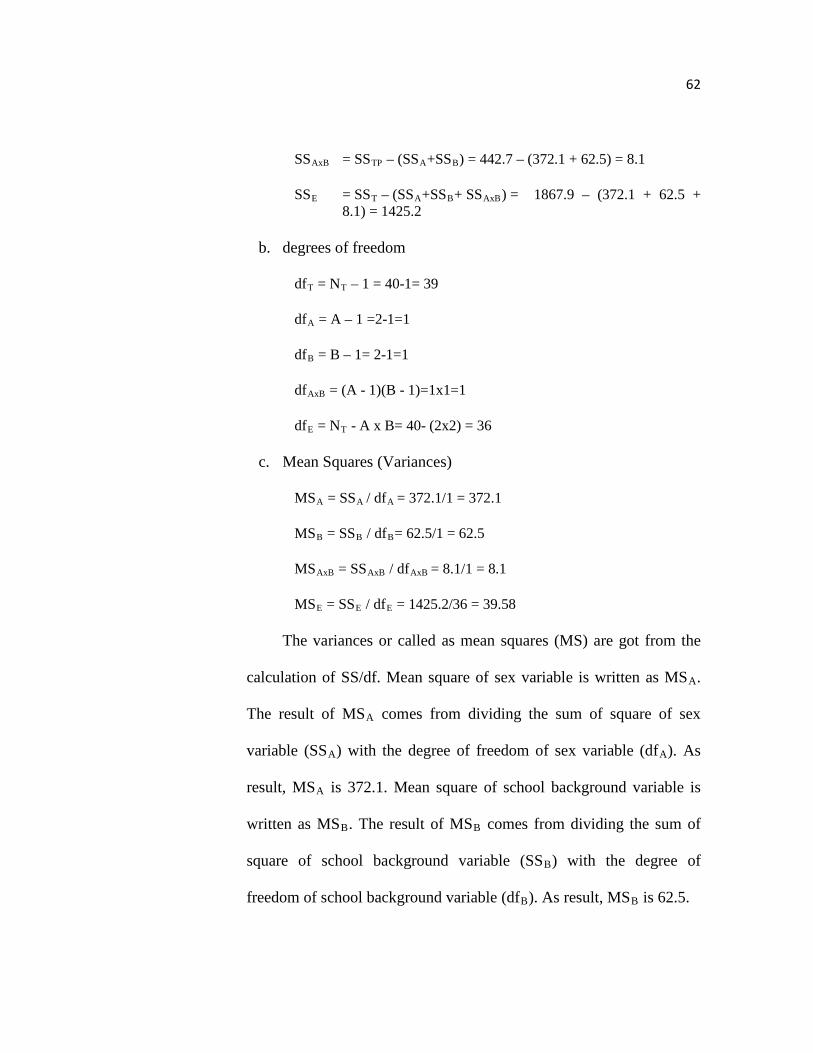
SSAxB = SSTP – (SSA+SSB) = 442.7 – (372.1 + 62.5) = 8.1
SSE = SST – (SSA+SSB+ SSAxB) = 1867.9 – (372.1 + 62.5 + 8.1) = 1425.2
b. degrees of freedom
dfT = NT – 1 = 40-1= 39
dfA = A – 1 =2-1=1
dfB = B – 1= 2-1=1
dfAxB = (A - 1)(B - 1)=1x1=1
dfE = NT - A x B= 40- (2x2) = 36
c. Mean Squares (Variances)
MSA = SSA / dfA = 372.1/1 = 372.1
MSB = SSB / dfB= 62.5/1 = 62.5
MSAxB = SSAxB / dfAxB = 8.1/1 = 8.1
MSE = SSE / dfE = 1425.2/36 = 39.58
The variances or called as mean squares (MS) are got from the
calculation of SS/df. Mean square of sex variable is written as MSA.
The result of MSA comes from dividing the sum of square of sex
variable (SSA) with the degree of freedom of sex variable (dfA). As
result, MSA is 372.1. Mean square of school background variable is
written as MSB. The result of MSB comes from dividing the sum of
square of school background variable (SSB) with the degree of
freedom of school background variable (dfB). As result, MSB is 62.5.
63
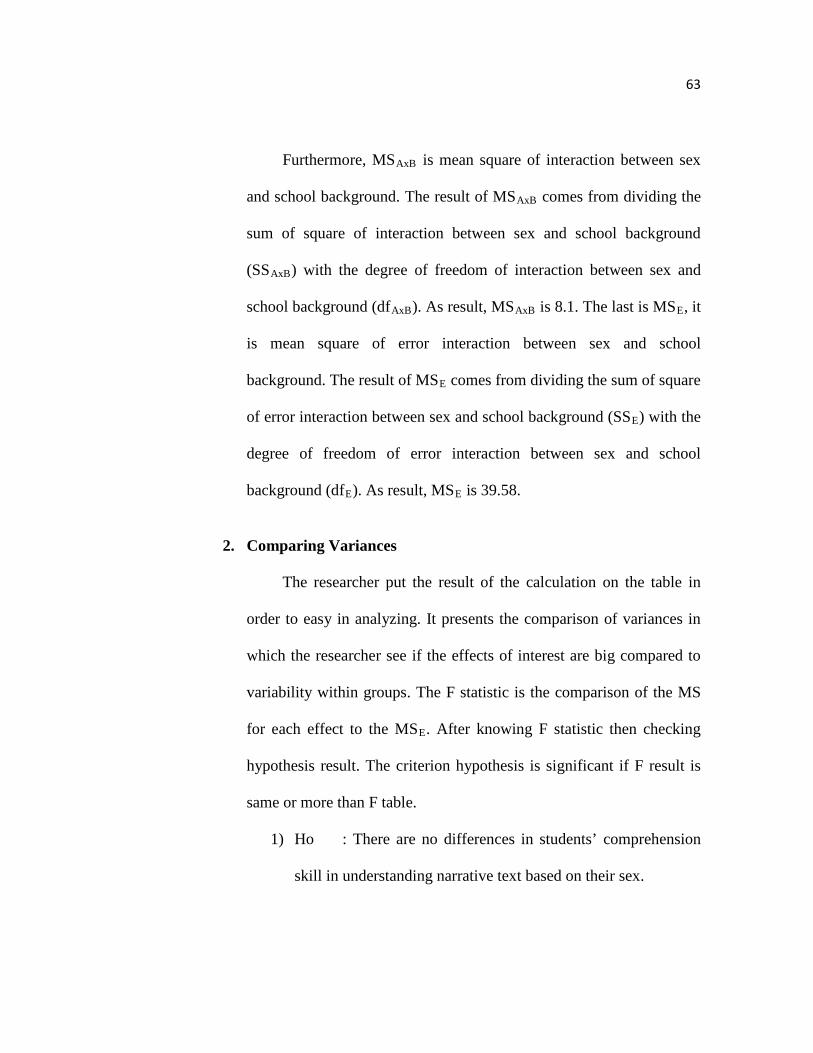
Furthermore, MSAxB is mean square of interaction between sex
and school background. The result of MSAxB comes from dividing the
sum of square of interaction between sex and school background
(SSAxB) with the degree of freedom of interaction between sex and
school background (dfAxB). As result, MSAxB is 8.1. The last is MSE, it
is mean square of error interaction between sex and school
background. The result of MSE comes from dividing the sum of square
of error interaction between sex and school background (SSE) with the
degree of freedom of error interaction between sex and school
background (dfE). As result, MSE is 39.58.
2. Comparing Variances
The researcher put the result of the calculation on the table in
order to easy in analyzing. It presents the comparison of variances in
which the researcher see if the effects of interest are big compared to
variability within groups. The F statistic is the comparison of the MS
for each effect to the MSE. After knowing F statistic then checking
hypothesis result. The criterion hypothesis is significant if F result is
same or more than F table.
1) Ho : There are no differences in students’ comprehension
skill in understanding narrative text based on their sex.
64
Ha : There are differences in students’ comprehension skill
in understanding narrative text based on their sex.
2) Ho : There are no differences in students’ comprehension
skill in understanding narrative text based on their school
background.
Ha : There are differences in students’ comprehension skill
in understanding narrative text based on their school
background.
3) Ho : there are no differences attributable to the particular
combinations of sex and school background in students’
comprehension skill in understanding narrative text.
Ha : there are differences attributable to the particular
combinations of sex and school background in students’
comprehension skill in understanding narrative text.
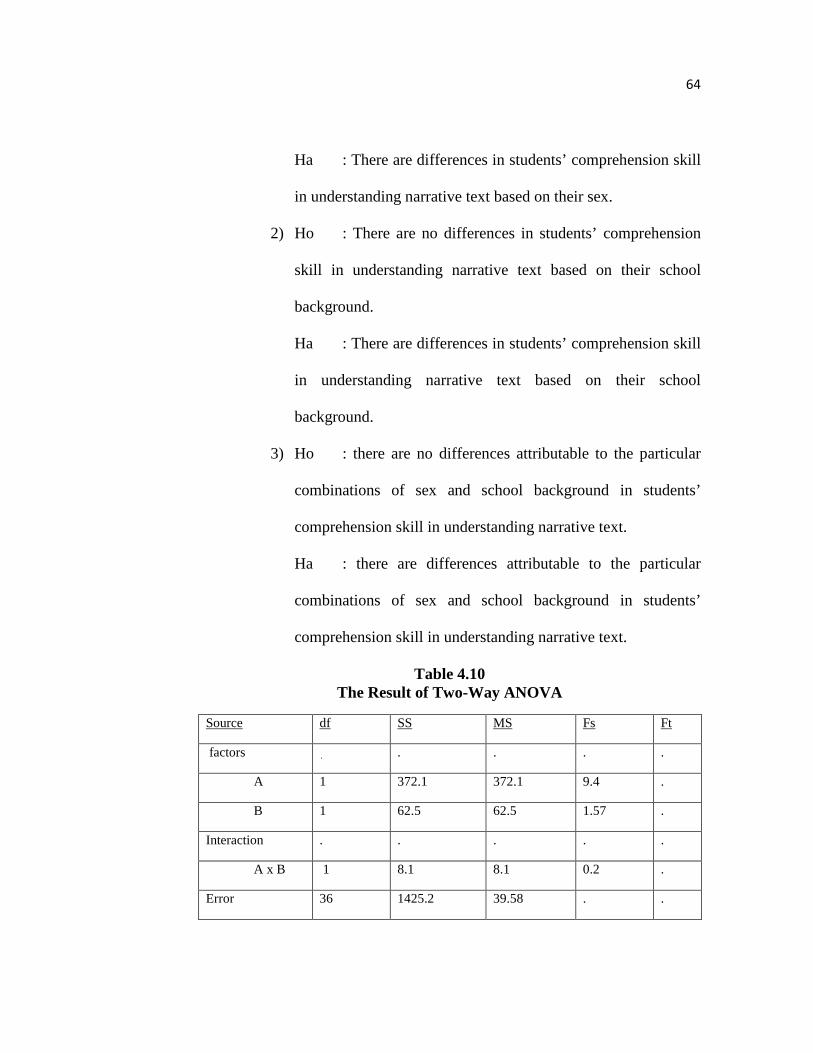
Table 4.10 The Result of Two-Way ANOVA
Source df SS MS Fs Ft
factors . . . . .
A 1 372.1 372.1 9.4 .
B 1 62.5 62.5 1.57 .
Interaction . . . . .
A x B 1 8.1 8.1 0.2 .
Error 36 1425.2 39.58 . .
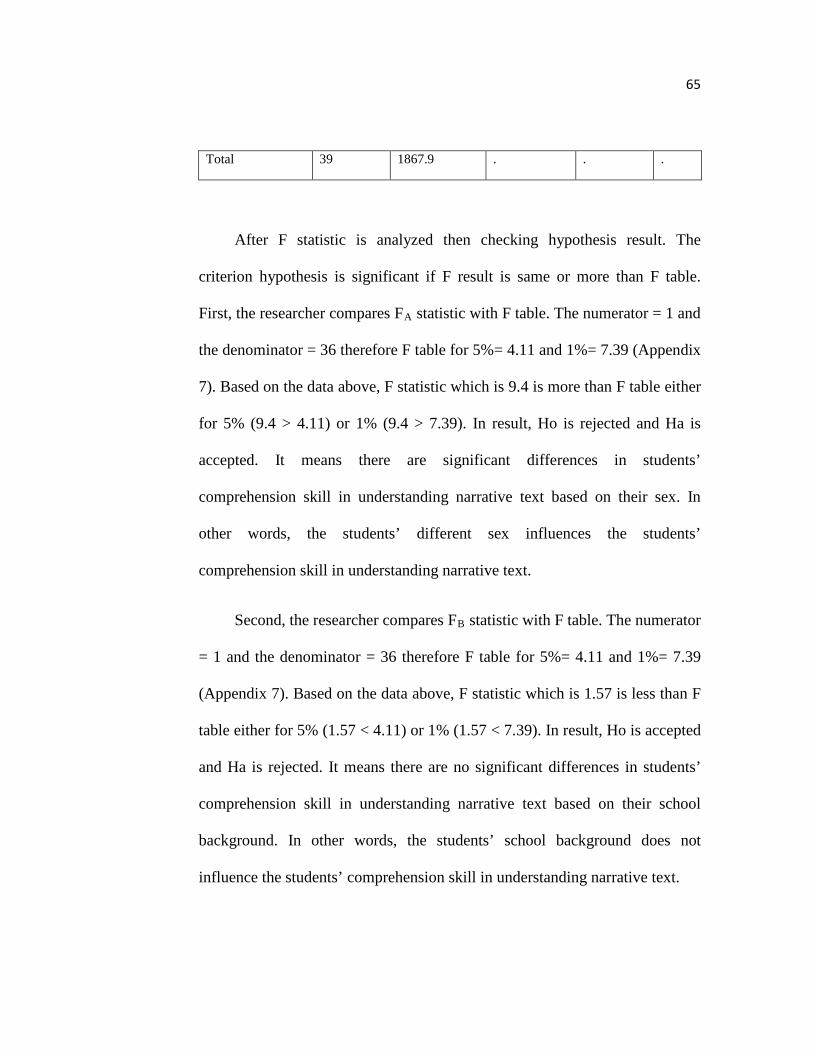
65
Total 39 1867.9 . . .
After F statistic is analyzed then checking hypothesis result. The
criterion hypothesis is significant if F result is same or more than F table.
First, the researcher compares FA statistic with F table. The numerator = 1 and
the denominator = 36 therefore F table for 5%= 4.11 and 1%= 7.39 (Appendix
7). Based on the data above, F statistic which is 9.4 is more than F table either
for 5% (9.4 > 4.11) or 1% (9.4 > 7.39). In result, Ho is rejected and Ha is
accepted. It means there are significant differences in students’
comprehension skill in understanding narrative text based on their sex. In
other words, the students’ different sex influences the students’
comprehension skill in understanding narrative text.
Second, the researcher compares FB statistic with F table. The numerator
= 1 and the denominator = 36 therefore F table for 5%= 4.11 and 1%= 7.39
(Appendix 7). Based on the data above, F statistic which is 1.57 is less than F
table either for 5% (1.57 < 4.11) or 1% (1.57 < 7.39). In result, Ho is accepted
and Ha is rejected. It means there are no significant differences in students’
comprehension skill in understanding narrative text based on their school
background. In other words, the students’ school background does not
influence the students’ comprehension skill in understanding narrative text.
66
The last, the researcher compares FAxB statistic with F table. The
numerator = 1 and the denominator = 36 therefore F table for 5%= 4.11 and
1%= 7.39 (Appendix 7). Based on the data above, F statistic which is 0.2 is
less than F table either for 5% (0.2 < 4.11) or 1% (0.2 < 7.39). In result, Ho is
accepted and Ha is rejected. It means there are no significant differences
attributable to the particular combinations of sex and school background in
the students’ comprehension skill in understanding narrative text. In other
words, the students’ school background does not influence differently either
for male or female students’ reading comprehension skill of narrative text.
C. Discussion
This research observes the influence of students’ different sex and
school background in reading comprehension skill of narrative text at the 2nd
grade of junior high school at Darul Muta’allimin Taman, Sidoarjo. As result,
there are three research questions which cover this research. First, whether or
not there are differences in students’ comprehension skill in understanding
narrative text based on their sex. Second, whether or not there are differences
in students’ comprehension skill in understanding narrative text based on their
school background. Third, whether or not there are differences attributable to
the particular combinations of sex and school background in students’
comprehension skill in understanding narrative text.
67
In relating to the research question above, there are four categories
which are discussed in this research. They are female students with private
school background, male students with private school background, female
students with public school background, and male students with public school
background. The researcher takes the sample through the data from the school
about students’ school background. In result, the sample is 10 for each
category.61
In collecting the data, the researcher gives test to the students. The test is
given to measure the students’ comprehension skill in understanding narrative
text. There are two tests which are done by the students. Both of them are
narrative texts. Test 1 is about fairy tale and test 2 is about fable. There are
two types of questions in test 1, they are 25 multiple choices and 25
True/False questions. The questions are covering the narrative text either the
content which is the generic structure (orientation, complication, and
resolution) consist of events, actors, time and location or the way how the
narrative is told.
The second test (Test 2) is about fable. In test 2, there are 10 essay
questions. In this test, there is a question which asked the students to
determine the generic structure of the story. There are also some questions
which try to lead the students to analyze the text in order to find the answers.
Such as, the students have to find the character of the main figure, to find the
61 It is shown in Appendix 2
68
problem in the 2nd paragraph and also to find the moral value of the story. The
results of the score show that the majority of the students either female–male
with private school background or public school background got difficulties in
answering those kinds of questions which is proven by the result of the
scoring.62 It could be assumed that they are still low in analyzing the context
of the text rather than the content of text.
After collecting the data, the researcher analyzes the data using Two-
Way ANOVA. This analyzing technique is used to verify the hypotheses
which are as follows:
1) Ho : There are no differences in students’ comprehension skill in
understanding narrative text based on their sex.
Ha : There are differences in students’ comprehension skill in
understanding narrative text based on their sex.
2) Ho : There are no differences in students’ comprehension skill in
understanding narrative text based on their school background.
Ha : There are differences in students’ comprehension skill in
understanding narrative text based on their school background.
3) Ho : there are no differences attributable to the particular
combinations of sex and school background in students’
comprehension skill in understanding narrative text.
62 It is shown in Appendix 6

69
Ha : there are differences attributable to the particular
combinations of sex and school background in students’
comprehension skill in understanding narrative text.
Based on the result of data analysis, the researcher finds that there are
significant differences in students’ comprehension skill in understanding
narrative text based on their sex. It happens because F statistic which is 9.4 is
more than F table either for 5% (9.4 > 4.11) or 1% (9.4 > 7.39). In result, Ho
is rejected and Ha is accepted. It indicates that the differences between sexes
do not happen accidentally.
In other word, female students have better comprehension skill in
understanding narrative text than their male counterpart. As Arnold Stated that
the factor of sex differences cannot be ignored in students’ achievement and
proficiency in learning language because it can affect students’ achievement
and proficiency in learning.63 It shows that the students’ different sex
influences the students’ comprehension skill in understanding narrative text.
The result for the second question is different from the first question.
The researcher finds that there are no significant differences in students’
comprehension skill in understanding narrative text based on their school
background. It happens because F statistic which is 1.57 is less than F table
either for 5% (1.57 < 4.11) or 1% (1.57 < 7.39). It indicates that students with
private school background have equal comprehension skill in understanding
63 Arnold. 2002. Project in Linguistic. New York: Oxford University Press. p.139.
70
narrative text with the students with public school background. It shows that
the students’ school background does not influence the students’
comprehension skill in understanding narrative text.
This finding is different from the previous finding which stated that one
school is better than the others. The finding of Strauss et al which stated that
public schools in Indonesia enjoy higher quality input compared to private
school and another finding which stated that elementary private school is
more efficient to achieve academic performance.64 The different findings
show that each school has their own characteristic and each school gives the
same good result in students’ achievement.
For the result of the third question, the researcher finds that there are no
significant differences attributable to the particular combinations of sex and
school background in the students’ comprehension skill in understanding
narrative text. It happens because F statistic which is 0.2 is less than F table
either for 5% (0.2 < 4.11) or 1% (0.2 < 7.39). It means students’ school
background does not influence differently to the students’ comprehension
skill in understanding narrative text either for male or female students. The
graph which shows that there is no interaction is gotten from the mean of each
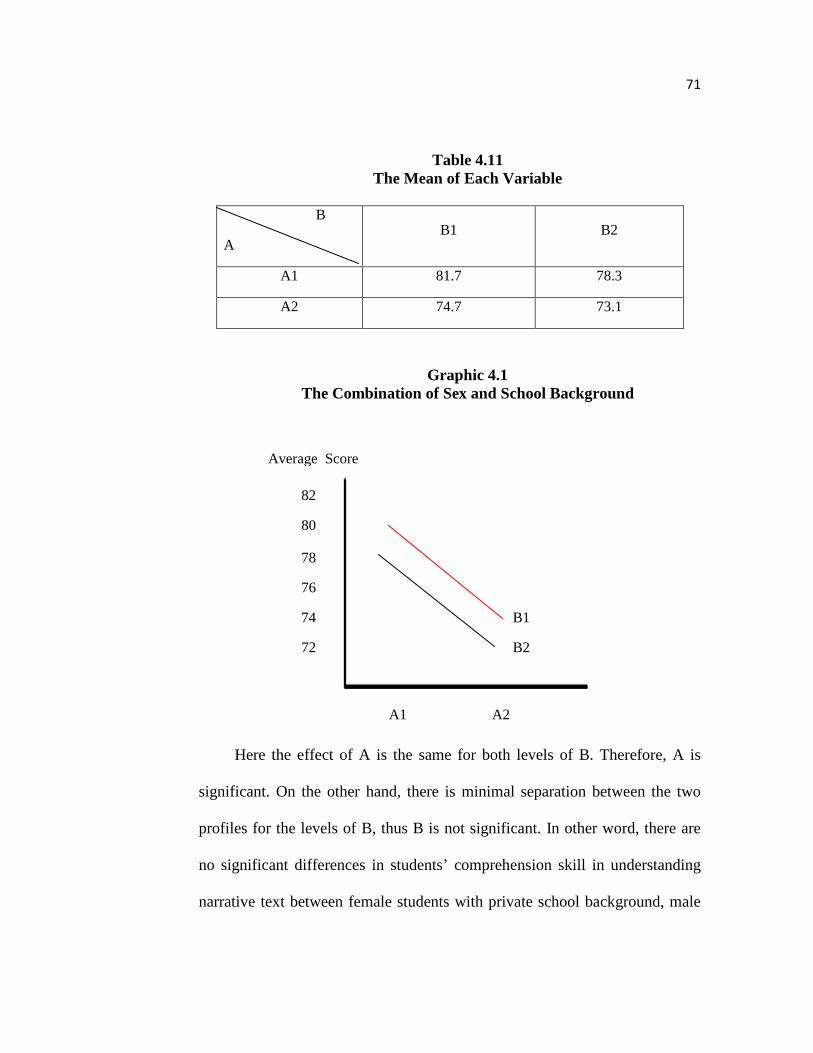
variable. It can be seen in table 4.11 and graphic 4.1:
64 Fahmi, Mohamad. 2009. School Choice and Earning: A case of Indonesia. Department of Economics Padjadjaran University. p. 2
71
Table 4.11 The Mean of Each Variable
B
A B1 B2
A1 81.7 78.3
A2 74.7 73.1
Graphic 4.1 The Combination of Sex and School Background
Here the effect of A is the same for both levels of B. Therefore, A is
significant. On the other hand, there is minimal separation between the two
profiles for the levels of B, thus B is not significant. In other word, there are
no significant differences in students’ comprehension skill in understanding
narrative text between female students with private school background, male
B1
B2
82
80
78
76
74
72
Average Score
A1 A2
72
students with private school background, female students with public school
background, and male students with public school background. It shows that
students’ school background does not influence differently to the students’
comprehension skill in understanding narrative text either for male or female
students.