chapter one introduction to the study 1.1. introduction
TRANSCRIPT

1
CHAPTER ONE
INTRODUCTION TO THE STUDY
1.1. Introduction
Anxiety, a general term for several disorders that cause nervousness, fear and apprehension,
has been defined as an “affective feeling of fear or uneasiness caused by apprehension or
anticipation of negative outcomes” (Burdick, 1995, p. 19). This feeling has been identified
as one of the most important barriers in academic environments, which has caused different
cognitive, affective, and behavioral effects in students, and has had an impact on their
educational performance (Erfanmanesh, 2011). Scientific and educational environments
may give students the experience of frustration and anxiety called “academic-related
anxiety” (Onwuegbuzie, Jiao & Bostick, 2004). To date, several forms of academic-related
anxiety have been studied including library anxiety (Mellon, 1986a; Bostick, 1992; Jiao &
Onwuegbuzie, 1997a, 1997b, 1998a, 1998b, 1999a, 1999b, 1999c, 2001, 2002a, 2002b,
2004; Onwuegbuzie & Jiao, 1998a, 1998b; Onwuegbuzie, Jiao & Bostick, 2004, 2006;
Jiao, Onwuegbuzie & Waytowich, 2008), research anxiety (Onwuegbuzie, 1997a; Higgins,
2001; Kracker, 2001), computer anxiety (Turkzadeh & Angulo, 1992; Maurer, 1994;
Jerabek, Meyer & Cordinak, 2001; Kohrman, 2003; Jiao & Onwuegbuzie, 2004), Internet
anxiety (Ben Omran, 2001), mathematics and statistics anxiety (Bander & Betz, 1981;
Onwuegbuzie, 2003; Onwuegbuzie & Wilson, 2003), foreign language anxiety (Bailey,
Onwuegbuzie & Daley, 1998, 2000), writing anxiety (Hadfield, Martin & Wooden, 1992;
Onwuegbuzie, 1997a), and test anxiety (Hill & Wigfield, 1984).

2
However, of all the forms of academic-related anxiety, frustration associated with the
search for information resources in libraries or information systems appear to be among the
most prevalent and, presumably, because virtually most, if not all, students are required to
conduct a research (research project, thesis, or dissertation) as part of completing their
programme which needs an extensive search and use of information resources (Kuhlthau,
1993; Jiao, Onwuegbuzie, 2002b; Onwuegbuzie & Jiao, 2004; Onwuegbuzie, Jiao, &
Bostick, 2004). The intricacy of higher education research, especially postgraduate
research, requires the identification and retrieval of information resources through different
sources. Finding a topic for research, writing a research proposal, conducting a review of
the related literature, and settling on the dissertation topic may cause or increase feelings of
anxiety and frustration in the vast majority of postgraduate students (Van Kampen, 2003, p.
19; Kohrman, 2003).
Fear and apprehension during the information search process (which has been labeled
information seeking anxiety in the current study) is typically experienced when an
individual is searching for information in libraries or information systems or even when he
is preparing or just thinking to conduct search process. Anxiety experienced during the
information seeking process has been documented by previous research (Mellon, 1986a,
Kuhlthau, 1988a, 1988c 1993, Van Kampen, 2003, Jiao, Onwuegbuzie & Bostick, 2004).
Consistent across these studies and other existing literature is the finding that, the anxiety
experienced during the information seeking process is a real phenomenon which is
prevalent among students and may has “debilitating effects on students’ academic
achievement” (Jiao, Onwuegbuzie & Waytowich, 2008, p. 949) and their research
performance (Onwuegbuzie & Jiao, 2004). As such, the aim of the current study is to
deepen further understanding of this problem by developing an instrument to measure

3
levels of information seeking anxiety and validating this scale in a Malaysian research
intensive university. It is hoped that the results of the present study can make an important
contribution to the literature of academic-related anxiety in general and the information
seeking anxiety in particular.
1.2. Statement of the Problem
Frustration over how to begin a search for a topic, what to do in order to find information
related to the research topic, and how to complete the information search process has been
documented by many researchers as a prominent and prevalent phenomenon in students
(Mellon, 1986a; Kuhlthau, 1988a, 1993; Loerke, 1992; Dalrymple, 1992; Young & Von
Seggern, 2001; Van Kampen, 2003; Onwuegbuzie, Jiao & Bostick, 2004; Cheng, 2004;
Arapakis, Jose & Gray, 2008). According to Mellon (1986a), “when confronted with the
need to gather information in the library … many students become so anxious that they are
unable to approach the problem logically or effectively” (Mellon, 1986a as cited in Van
Kampen, 2004, p. 28). Kuhlthau (1988a, 1988c, 1993) stated that anxiety is a natural
occurrence during the information seeking process which may begin during any one of the
six (6) stages of the research process. In another study, Cheng (2004) has reported that
anxiety was indeed an important factor in students’ information seeking tasks. Also,
according to Young and Von Seggern (2001), frustration and anxiety has been reported as
the most prevalent negative feeling during the information search process among
undergraduate and postgraduate students. Branan (2001) reported that students tended to
experience frustration and anxiety during different stages of the information seeking
process. Nahl and Tenopir (1996) explored affective aspect of the searching behavior of
novice users and found that hesitation, fear and anxiety and other negative feelings affected
search strategies.

4
Many negative effects of anxiety during information seeking in libraries or information
systems have been reported by previous studies including reduction in the quality of
students’ research proposal (Onwuegbuzie, 1997a), information seeking avoidance
behaviors (Mellon, 1986a; Kuhlthau, 1993; Carlile, 2007), lack of persistence and focus for
seeking information (Onwuegbuzie, Jiao & Bostick, 2004), attenuating effects on students’
academic achievements (Jiao, Onwuegbuzie & Waytowich, 2008; Jiao & Onwuegbuzie,
2003), reduction in individual’s abilities to learn and work efficiently during the
information seeking process (Kracker, 2002) and “interfering responses during various
stages of the information seeking process” (Jiao, Onwuegbuzie & Daley, 1997, p. 3).
Despite the existence of anxiety during the information seeking process among students,
prior to the present study, no valid and reliable instrument to measure levels of anxiety has
been developed and validated. Those studies which have investigated anxiety during the
information seeking process did not develop a scale to measure this construct and have not
named this phenomenon. Rather, many of them have used qualitative research methods to
study anxiety experienced during the information seeking process or have included
information seeking process as a part of general library research and have utilized library
anxiety scales. Additionally, this phenomenon has yet to be empirically investigated among
postgraduate students in a Malaysian research-intensive university. Moreover, the
association between postgraduate student’s information seeking anxiety and their
demographic variables has not been investigated until now.
Accordingly, the current study aims to further our understanding of the postgraduate
students’ emotions when they are searching for information resources related to their
research. Additionally, it addresses a gap in the literature by developing the Information

5
Seeking Anxiety Scale (ISAS) and validating this scale among postgraduate students at a
research-intensive university in Kuala Lumpur, Malaysia. Moreover, the correlation
between information seeking anxiety and some demographic variables is determined.
Understanding the prevalence and correlates of the information seeking anxiety construct
among postgraduate students may enable university administrators, librarians, and faculty
members to device methods that begin to reduce this phenomenon and, thus, prepare
postgraduate students to be more successful in their research.
1.3. Research Objectives
The current study aims to determine whether a valid and reliable instrument could be
developed and validated to measure levels of anxiety experience by postgraduate students
during the information seeking process in libraries or information systems. The purposes of
the study are to develop and validate the Information Seeking Anxiety Scale (ISAS) as well
as determine the information seeking anxiety levels of postgraduate students at a research-
intensive university in Kuala Lumpur, Malaysia. It also attempts to explore the association
between postgraduate student’s information seeking anxiety and their demographic
variables. Detailed objectives of the study are to:
a) Develop and validate the Information Seeking Anxiety Scale (ISAS).
b) Determine components of the information seeking anxiety construct which have the most
and the least prevalence among postgraduate students at a research-intensive university in
Malaysia.
c) Determine whether statistically significant mean differences and relationships exist
between various dimensions of the information seeking anxiety construct and selected
independent variables (gender, level of study, nationality, information literacy skills

6
instruction received, students’ academic major, age, frequency of library use and frequency
of Internet use) among postgraduate students at a research-intensive university in Malaysia.
1.4. Research Questions
The study attempts to answer to the following research questions:
a) How can a valid and reliable instrument be developed and validated to measure
information seeking anxiety of postgraduate students?
b) What components of the information seeking anxiety construct have the most and the
least prevalence among postgraduate students at a research-intensive university in
Malaysia?
c) Do statistically significant mean differences, relationships and main and interaction
effects exist between various dimensions of the information seeking anxiety construct and
selected independent variables (gender, level of study, nationality, information literacy
skills instruction received, students’ academic major, age, frequency of library use and
frequency of Internet use) among postgraduate students at a research-intensive university in
Malaysia?
1.5. Research Hypotheses
In order to respond to the third research question, the following eighteen (18) hypotheses
are developed and tested:
Hypotheses 1. There are statistically significant mean differences in various dimensions of
the information seeking anxiety construct between male and female postgraduate students.
Hypotheses 2. There are statistically significant mean differences in various dimensions of
the information seeking anxiety construct between master’s level students and doctoral
level students.

7
Hypotheses 3. There are statistically significant mean differences in various dimensions of
the information seeking anxiety construct between Malaysian students and non-Malaysian
students.
Hypotheses 4. There are statistically significant mean differences in various dimensions of
the information seeking anxiety construct between students who have received information
literacy skills instruction and those who have not received information literacy skills
instructions.
Hypotheses 5. There are statistically significant mean differences in various dimensions of
the information seeking anxiety construct between postgraduate students from different
academic majors.
Hypotheses 6. There are statistically significant relationships between various dimensions
of the information seeking anxiety construct and postgraduate student’s age.
Hypotheses 7. There are statistically significant relationships between various dimensions
of the information seeking anxiety construct and postgraduate student’s frequency of
library use.
Hypotheses 8. There are statistically significant relationships between various dimensions
of the information seeking anxiety construct and postgraduate student’s frequency of
Internet use.
Hypotheses 9. There are statistically significant main and interaction effects of gender and
academic major on various dimensions of the information seeking anxiety construct.
Hypotheses 10. There are statistically significant main and interaction effects of gender and
level of study on various dimensions of the information seeking anxiety construct.
Hypotheses 11. There are statistically significant main and interaction effects of gender and
nationality on various dimensions of the information seeking anxiety construct.

8
Hypotheses 12. There are statistically significant main and interaction effects of gender and
information literacy skills instruction received on various dimensions of the information
seeking anxiety construct.
Hypotheses 13. There are statistically significant main and interaction effects of academic
major and level of study on various dimensions of the information seeking anxiety
construct.
Hypotheses 14. There are statistically significant main and interaction effects of academic
major and nationality on various dimensions of the information seeking anxiety construct.
Hypotheses 15. There are statistically significant main and interaction effects of academic
major and information literacy skills instruction received on various dimensions of the
information seeking anxiety construct.
Hypotheses 16. There are statistically significant main and interaction effects of nationality
and level of study on various dimensions of the information seeking anxiety construct.
Hypotheses 17. There are statistically significant main and interaction effects of nationality
and information literacy skills instruction received on various dimensions of the
information seeking anxiety construct.
Hypotheses 18. There are statistically significant main and interaction effects of level of
study and information literacy skills instruction received on various dimensions of the
information seeking anxiety construct.
1.6. Significance of the Study
An extensive review of the literature on feelings and emotions during the information
seeking process was conducted for this study. It was found that, hitherto no scale was ever
developed, let alone validated, to assess the anxiety experienced by individuals during the
information seeking process. From the practical perspective, this study is conducted to

9
address a gap in the literature by developing and validating the Information Seeking
Anxiety Scale (ISAS). The Information Seeking Anxiety Scale (ISAS) which is developed
and validated in this study may be used by other researchers in the area of information
seeking behaviors in order to study the information seeking anxiety construct further.
Additionally, to the best of the researcher’s knowledge, no previous study has investigated
the postgraduate students’ information seeking anxiety and factors associated with this
phenomenon in a Malaysian university. This study is the first to investigate the negative
feelings, specifically anxiety, of postgraduate students during the information seeking
process in libraries or information systems by determining information seeking anxiety
levels of postgraduate students at a research intensive university in Kuala Lumpur,
Malaysia. Understanding the prevalence and correlates of the information seeking anxiety
of postgraduate students at the sampled university may enable academic librarians to devise
methods and learning experiences that begin to reduce this anxiety and, thus, prepare
postgraduate students to be more successful in their research.
Identifying factors which may influence the information seeking process negatively is a
useful step toward redesigning library services, information literacy instruction
programmes, and information systems more appropriate to help in remedying this
phenomenon. Additionally, student’s familiarity with the information seeking anxiety
construct increases their awareness that this phenomenon is prevalent among postgraduate
students and they are not the only one who experiences this negative feeling. From the
theoretical perspective, the current study contributes to the body of literature on academic-
related anxiety in general, and the information seeking anxiety construct in particular. It is

10
hoped that the findings of this study would help to increase the understanding of the
construct of information seeking anxiety.
1.7. Research Limitations
The following aspects of the research are not subject to the researcher’s control and can be
considered as limitations of the study:
a) The researcher conducted the study at a research-intensive university in Kuala Lumpur,
Malaysia. The results of the study may not be generalizable to the entire population of
postgraduate students in Malaysia.
b) Students were self-reporting their anxiety, gender, age, nationality, level of study, major,
frequency of library and the Internet use as well as information literacy skills instruction
received which might imply inaccurate or flawed information.
c) Some academic programmes may incorporate courses that may influence the attitudes
and emotions of postgraduate students toward the information seeking process and
information seeking anxiety. This influence was measured by comparing the mean
differences in various dimensions of the information seeking anxiety construct between
postgraduate students from different areas of study.
1.8. Research Assumptions
The following assumptions are made regarding the conduct of this study:
a) It is assumed that all participants responded the survey honestly.
b) It is assumed that participant’s responses reflected their actual feelings and concerns
about the information seeking part of their research.
c) It is assumed that the sample of the study was representative of the entire postgraduate
students at the sampled university.

11
d) It is assumed that all postgraduate students at the sampled university are required to
conduct a research (thesis, dissertation, or research project) as part of completing their
educational programme which needs an extensive search for information resources in
university libraries and information systems.
1.9. Definition of Terms
The following list provides conceptual and operational definitions for significant terms
used in this study:
1.9.1. Conceptual Definitions
Academic-related
Anxiety:
Stress and/or pressure that experienced by students in the
academic arena based upon their academic related functions.
Many types of academic anxieties have been identified before,
including computer anxiety, Internet anxiety, library anxiety,
test anxiety, writing anxiety, mathematics and statistics anxiety,
foreign language anxiety, and research anxiety (Giao,
Onwuegbuzie & Bostick, 2004; Onwuegbuzie & Jiao, 2004)
Anxiety: “Distress or uneasiness of mind caused by fear of danger or
misfortune” (Higgins, 2001, p. 3).
Computer Anxiety: “Fear and/or apprehension when using or considering using a
computer” (Leso & Peck, 1992, as cited in Kohrman, 2002, p.
4).

12
Information Anxiety: “Apprehension about the ever-widening gap between what we
understand and what we think we should understand”
(Mohundro, 1999, p. 24).
Information Search
Process:
“The process of forming ideas through information as it
processed. The ideas generated lead to the need for further
information, which continues until the search is completed.
There are six stages in the information search process. Stages
include: task initiation; topic selection; pre focus exploration;
focus formulation; collection of information; completion of the
library research and preparation needed for presentation” (Van
Kampen, 2003, p. 9).
Internet Anxiety: “A modern disease of adaptation caused by an inability to cope
with Internet in a healthy manner” (Brod, 1984, p. 16).
Library Anxiety: “An uncomfortable feeling or emotional disposition,
experienced in a library setting, which has cognitive, affective,
psychological, and behavioral ramifications” (Jiao,
Onwuegbuzie & Lichtenstein, 1996, p. 152).
Library Anxiety Scale
(LAS):
“An instrument developed by Sharon Bostick (1992) to
quantitatively measure library anxiety. The LAS measured the

13
construct of library anxiety through a forty-three (43) question
Likert scale instrument. The scale measured five (5) variables
that impacted a person’s level of library anxiety: barriers with
staff, affective barriers, comfort with the library, knowledge of
the library, and mechanical barriers” (Bowers, 2010, p. 10).
Library Research: “The section of a research assignment which requires the use of
the library to obtain the necessary resources for the completion
of the assignment” (Kohrman, 2002, p. 4).
Library Research
Anxiety:
“Fear and/or apprehension of performing the necessary search
for information or sources while attempting a library research
assignment” (Kohrman, 2002, p. 4).
Research Anxiety: “Research anxiety is the worry and apprehension experienced
when students are enrolled in research methodology courses or
are contemplating or are engaged in the research process”
(Onwuehbuzie, 1997, as cited in Onwuegbuzie, 2003, p. 1024).
State Anxiety: “A conscious awareness of anxiety that varies in intensity and
the occurrence of which is dependent on situation” (Brannan,
2003, p. 9).
Trait Anxiety: “A generalized tendency toward anxiety experienced by some

14
people in many areas of their lives” (Brannan, 2003, p.9).
1.9.2. Operational Definition
Information Seeking
Anxiety:
Fear and/or apprehension of searching for information or
resources during information seeking process.
1.10. Organization of the Dissertation
This dissertation is divided into five (5) chapters. Chapter one consists of the background
information for this study, the statement of the problem, the objectives and questions of the
study, as well as the research hypotheses. It also presents the significance of the study,
operational definition of important terms, research limitations and research assumptions.
The second chapter of the study reviews the literature related to the anxiety experienced
during the information seeking process in libraries and information systems. This chapter is
divided into the following sections: : investigating anxiety among different populations,
sources of anxiety, negative effect of anxiety, characteristics of anxious students,
relationship to other academic-related anxiety, antecedents of anxiety, development and
validation of instruments to measure anxiety, theoretical models related to the library
anxiety construct and reduction of anxiety.
Chapter three (3) of the study presents the research design and methodology of the study. In
this chapter, the procedures that were followed in order to development and validation of
the Information Seeking Anxiety Scale (ISAS) are explained. It also explains the research
methodology, research population and sample, sampling technique, data collection
procedures, and data analysis in detail. Chapter four (4) presents the results and findings of
the study. Chapter five (5) summarizes and discusses the findings of the study in

15
accordance with the objectives and research questions. Research conclusion, research
implications as well as recommendations for future research are outlines in this chapter.
Additionally, appendices and a bibliography have been included at the end of the
dissertation.

16
CHAPTER TWO
REVIEW OF THE LITERATURE
2.1. Introduction
As discussed in the first chapter, the purposes of this study are to develop and validate the
Information Seeking Anxiety Scale (ISAS) as well as investigate levels of information
seeking anxiety among postgraduate students at a research-intensive university in Kuala
Lumpur, Malaysia. An extensive review of the literature was conducted to investigate and
summarize previous studies regarding anxiety experienced during the information seeking
in libraries or information systems. To gather information resources for this review,
different library resources and databases were searched using the different facilities
available in the university libraries. In addition, an extensive search of the World Wide
Web was conducted. This chapter is divided into the following sections: investigating
anxiety among different populations, sources of anxiety, negative effect of anxiety,
characteristics of anxious students, relationship to other academic-related anxiety,
antecedents of anxiety, development and validation of instruments to measure anxiety,
theoretical models related to the library anxiety construct and reduction of anxiety.
It is important to note that the term information seeking anxiety was introduced in this
study for the first time. Many previous studies which investigated the anxiety experienced
during the information seeking part of research did not name this phenomenon or even did
not provide any definition of it. Rather, they have included information seeking as a part of
a general library research and have used library anxiety scales to investigate information

17
seeking anxiety of users (Onwuegbuzie, 1997a; Kohrman, 2003; Van Kampen, 2003).
Accordingly, a review of the literature was conducted in the area of library anxiety as well.
2.2. Investigating Anxiety among Different Populations
This section reviews available literature that addresses anxiety experienced during the
information seeking in libraries and information systems among different groups of
undergraduate and postgraduate students. One of the earliest studies in this area conducted
by Swope and Katzer (1972) at the Syracuse University in order to “identify non-question-
asking library users” in the library environment (Anwar, Al-Kndari & Al-Qallaf, 2004, p.
267). The authors investigated whether students they saw in the library were reticent to
seek help from librarians. Students who were selected randomly participated in a structured
interview to determine how many of them had questions and, of those who did, how many
would seek help from librarians and library staff. The results of the study revealed that
“sixty five percent (65%) of those students who had questions would not ask librarians for
help” (p. 163). The major reasons given by the students were dissatisfaction with the past
service of library and librarian and the conception that their question was too simple for the
librarian (Swope & Katzer, 1972 as cited by Anwar, Al-Kndari & Al-Qallaf, 2004).
The notion of anxiety experienced during the information seeking in library environment
was first proposed by Constance Mellon. In the first formalized study of the library anxiety
construct as a phenomenon, Mellon (1986a) developed the theory of library anxiety for the
first time as a result of two (2) years study of six thousand (6000) students in a southern
university in the United States. The study was conducted in an effort to recognize students’
feelings toward the university library. Twenty (20) English language instructors
participated in the study. They were assigned to collect students’ personal documents for a

18
two (2)-year period. Personal documents were in two (2) forms: journal entries and essays.
The English instructors asked their students to “keep search journals, diary-like entries that
describe search process and their feelings about it during the course of the semester”
(Mellon, 1986a, p. 162).
Students’ journals and essays were collected by instructors for analysis. The analysis of
students’ journals revealed signs of fear and frustration. Terms like scary, overpowering,
fear, lost, helplessness, confused, and overwhelming appeared repeatedly in essays. Some
of the students described their fears as phobia. This phobia caused them to describe library
use in fear terms such as nightmare. One of the students described the library experience as
“terrifying, like being in a foreign country and unable to speak the language” (Mellon,
1986a as cited by Mohundro, 1999, p. 26). Mellon (1986a) stated that “students become so
anxious about having to gather information in a library for their research papers that they
are unable to approach the problem logically or effectively” (p. 163). She (1986) also found
that seventy-five (75) to eighty-five (85) percent of undergraduate students were reported to
have experienced some levels of library anxiety. According to her findings, feeling of
frustration in the library stems from four (4) different resources: (a) “the size of the
university library; (b) Inadequate knowledge about the location of materials, equipment,
and the resources in the university library; (c) Lack of knowledge about what to do in the
university library and (d) Lack of knowledge about how to begin a library research”
(Mellon, 1986a, p. 162).
In another study, Loerke (1992) studied high school students’ thoughts, feelings and actions
through a library research process using an action research approach. Thirty-six (36) grade
seven (7) and thirty-seven (37) grade eight (8) students were surveyed at the initiation,

19
midpoint, and completion of their information seeking task. Additionally, students were
asked to keep daily journals of their feelings throughout the process of information seeking.
Results of the study revealed that “junior high school students experienced similar feelings
during the research process as did the high school and university students noted in
Kuhlthau’s Information Seeking Process (ISP) model” (p. 60). Loerke (1992) also found
that the focus formulation (forth stage of the Kuhlthau’s Information Search Process
Model) was the most challenging stage for students in the library research process. This
finding lends support to the studies conducted by Kuhlthau (1988a, 1988c, 1993) and
Burdick (1995) who found that the formulation of a focus is the central task in the process
of information seeking.
Dalrymple and Zweizig (1992) explored the relationship between “search experience of
information retrieval systems and affective measures” (p. 167). Forty (40) students were
given some questions to solve using a university card catalogue as well as an Online Public
Access Catalogue (OPAC). After search tasks were completed, the students were requested
to report their attitudes and feelings about the information seeking process. An eleven (11)-
item, five (5)-point Likert-type questionnaire was used for data collection. The results of
using a factor analysis on the responses to the attitude measures revealed that some of the
negative feelings like frustration, anxiety, tension, and confusion were reported by
participants during the information seeking process using card and Online Public Access
Catalogue catalogs.
Jiao and Onwuegbuzie (1999a) conducted a research using the “Library Anxiety Scale
(Bostick, 1992)” as the instrument, to investigate the prevalence of the five dimensions of
library anxiety among one hundred and twenty-five (125) students at a northeastern

20
university in the United States. It was found that of the five (5) dimensions of library
anxiety, mechanical barriers was the most prevalent source of library anxiety, followed by
affective barriers, barriers with staff, comfort with the library, and knowledge of the library
dimensions. This result is consistent with Onwuegbuzie (1997a), Jiao and Onwuegbuzie
(2001a, b) and Brannan’s (2003) finding that mechanical barriers “generated statistically
significantly greater levels of library anxiety than did the other four (4) dimensions of the
Library Anxiety Scale” (Onwuegbuzie, Jiao & Bostick, 2004, p. 36). The researchers
concluded that utilizing library technologies appeared to be the greatest source of library
anxiety among international students.
Branch (2001) found that uncertainty, frustration, doubt, and anxiety to be the common
emotions while searching for information resources using the CD-ROM encyclopedias
among junior high school students. Data were gathered from twelve (12) participants from
Inuvik, Northwest Territories, Canada using a variety of qualitative data collection methods
like verbal protocol analysis, interviews, observation, and videotaping. Findings from this
study support that of Kuhlthau (1988a, 1988c, 1991, 1993) and Loerke (1992) who found
that high school students tended to experience frustration and anxiety during different
stages of the information seeking process. She also found that factors like “finding
appropriate keywords, knowing when to narrow or broaden the search term, asking
questions of others, skimming and scanning skills, and having time, patience, and
persistence when searching for information resources” may influence emotions of students
during the information seeking process (p. 22).
Shoham and Mizrachi (2001) conducted a study to determine the presence and to identify
the antecedents of library anxiety disorder among three hundred and thirty-nine

21
(339) undergraduate Israeli students. Additionally, the relationship between library anxiety
and computer attitudes was investigated. Participants were administered a demographic
information form as well as a modified version of the Library Anxiety Scale, namely, the
“Hebrew-Library Anxiety Scale (Shoham & Mizrachi, 2001)” which included thirty-five
(35) statements in seven (7) dimensions (p. 306). Results of the study revealed that Israeli
students were reported to have experienced a moderate level of library anxiety. Among all
seven (7) dimensions of the “Hebrew Library Anxiety Scale”, the English language factor
was reported as the most significant contributing dimension of library anxiety. Moreover,
the researchers reported a statistically significant relationship between library anxiety and
computer attitudes. In other words, all seven (7) dimensions of the H-LAS were associated
statistically significantly with computer attitude, with correlations ranging from 0.11 to
0.47 (Onwuegbuzie, Jiao & Bostick, 2004).
The Shoham and Mariachi’s (2001) findings showed that female students were reported to
have experienced greater levels of library anxiety associated with English language factor,
staff factor and resource factor than did their male counterparts. These finding do not
support that of Jacobson (1991), Jiao, Onwuegbuzie and Lichtenstein (1996), and Jiao and
Onwuegbuzie (1997b) who found males have experienced higher levels of library anxiety
than females. Moreover, the finding in which four (4) dimensions of library anxiety were
inversely correlated with age, lend support to the findings of Jiao, Onwuegbuzie and
Lichtenstein (1996), and Jiao and Onwuegbuzie (1997b) who reported younger students
were more likely to experience higher levels of library anxiety than did older students.
Investigating the year of study as a variable, the researchers found that first year students
showed the greatest anxiety with significant decreases in each subsequent year. The study
also investigated the relationship between library anxiety and seven (7) types and

22
applications of computer usage namely home usage, work usage, word process, spread
sheet, games, Internet, and programming language. It was found that a negative relationship
existed between library anxiety and computer usage. This finding is in contrast with Jiao,
Onwuegbuzie and Lichtenstein (1996) finding that computer usage experience did not
significantly correlated with library anxiety.
Using the focus group method, Young and Von Seggern (2001) studied information
seeking methods of thirty-three (33) undergraduate students, postgraduate students, and
faculty members. Five (5) focus groups were conducted during a period of six (6) months
which each session was recorded and analyzed utilizing the “Ethnography software
program for textual data analysis” (Young & Von Seggern, 2001, p. 159). According to the
results of the study, participants were reported to have experienced positive emotions more
than negative emotions when they were searching for information resources. However,
anxiety has been reported as the most prevalent negative feelings during the information
seeking process among the sample of the study.
Veal (2002) surveyed one hundred and forty-three (143) off-campus adult learners in
Education using the “Library Anxiety Scale (Bostick, 1992)” to determine if library anxiety
existed among the study population. Additionally, the relationships between student’s
library anxiety levels and their demographic variables were explored. The results of the
study revealed that adult learners were reported to have experienced low to average levels
of library anxiety. Moreover, the researcher found that male students were reported to have
experienced greater levels of library anxiety than did their female counterparts. This finding
supports that of Jiao, Onwuegbuzie and Lichtenstein (1996) and Jiao and Onwuegbuzie
(1997b) who reported male students experienced more frustration in the library

23
environment than female students. Additionally, perception of the information resource
availability and distance from the academic library reported to have no correlation with
library anxiety. In contrast, available time to conduct library research was statistically
significantly related to the library anxiety construct.
Using quantitative and qualitative approach, Van Kampen (2003) studied whether doctoral
students at the University of Central Florida showed evidence of anxiety in the library as
well as during the information seeking process, and if yes, “then which aspects of the
library and the information search process were factors” (p. iii). Quantitative data were
collected using the “Multidimensional Library Anxiety Scale (Van Kampen, 2003)” while
qualitative data were gathered through several focus group sessions. According to the
results of the study, participants were reported to have some levels of library anxiety. In
particular, doctoral students encountered less anxiety in “knowing how to begin the
research process, but greater anxiety in their comfort level with using the library, seeking
help from the librarians, and feeling comfortable in the library environment” (Van Kampen,
2003 as cited by Bowers, 2010, p. 37). Additionally, students reported to have the highest
level of anxiety in the first (initiation) and third (formulation and collection) stages of the
dissertation process, which appears to support Kuhlthau’s Information Seeking Process
(ISP) Model.
Brannan (2003) conducted a study among forty-seven (47) History and Physical Education
students in a small southern university using the “Library Anxiety Scale (Bostick, 1992)” to
determine whether library anxiety existed among this population of students (p. 18).
Results of the study revealed that Physical Education students were reported to have
experienced statistically significantly higher levels of library anxiety than History students.

24
The researcher believed this result may stem from the fact that History students used
academic library more often than Physical Education students. Additionally, mechanical
barriers dimension was reported as the main reason of student’s library anxiety in both
areas of study. This finding supports the results of Onwuegbuzie (1997) and Jiao and
Onwuegbuzie (2001) who reported that the mechanical barrier was the most important and
prevalent source of library anxiety.
Investigating the role of using English language for performing library research as well as
using information resources in English (one of the six dimensions of the “Hebrew-Library
Anxiety Scale”, namely, English language barrier) on overall library anxiety among
undergraduate Israeli students was another study which conducted by Mizrachi and
Shoham (2004, P. 1). For this purpose, six hundred and fifty-four (654) students surveyed
using the “Hebrew-Library Anxiety Scale (Shoham & Mizrachi, 2001)” (p. 2). According
to the results, the anxiety associated with the English language factor was found to be
“statistically significantly higher than other five (5) dimensions of the H-LAS” (p. 4).
Additionally, Arabic speaker students were reported to have experienced higher levels of
library anxiety associated with English language dimension than did Hebrew speaker
students, despite the fact that the language of instruction at the institutions under study was
Hebrew. Moreover, the researchers reported that “Arabic students reported to have lower
levels of library anxiety pertaining to the knowledge factor than did Hebrew students”
(Onwuegbuzie, Jiao & Bostick, 2004, p. 52).
Moreover, Shoham and Mizrachi (2001) found that first year students had the least level of
library anxiety associated with the language factor. This level of anxiety increased
significantly by the second year, as students realized the need to use English for their
25
research. There was a slight rise in the third year students. Additionally, a slight drop
occurred in the fourth year. The researchers concluded that “for Israeli B.Ed students the
most debilitating library task was searching and using English language materials and
resources” (p. 3). Regarding the gender of the participants, female students were reported to
have experienced statistically significantly higher levels of library anxiety in three (3) out
of six (6) dimensions, include staff barrier, language barrier and resource barrier. This
finding is in contrast to the Jacobsen (1991), Jiao, Onwuegbuzie and Lichtenstein (1996)
and Jiao and Onwuegbuzie’s (1997b) finding that male students suffer more library anxiety
than female students.
Anwar, Al-Kandari and Al-Qallaf (2004) studied one hundred and forty-five (145)
undergraduate students of Biological Sciences at the Kuwait University using a modified
version of the “Library Anxiety Scale (Bostick, 1992)” which consisted of thirty-four (34)
items. The objective of the study was to examine the prevalence of the library anxiety
among the Kuwaiti population (p. 266). The results of the study indicated that a large
percentage of participants (72%) experienced mild level of library anxiety while severe
anxiety reported by only 3.4% of the students. Furthermore, male students were reported to
have experienced higher levels of anxiety stemming from barriers with staff dimension than
did female students. Additionally, those students who have studied in Arabic were reported
to have greater library anxiety than those students who have studied in English. This
finding supports Shoham and Mizrachi’s (2001) claim that “Arabic speakers tend to
experience higher levels of library anxiety than Hebrew students” (p. 308). The findings of
the study revealed that those students who have used the academic libraries were not
different in terms of library anxiety levels compare to those students who have not, except
for the library constraints dimension. This finding is in contrast to the study conducted by

26
Jiao, Onwuegbuzie and Lichtenstein (1996) which reported a statistically significant
negative relationship between the frequency of library visit and levels of library anxiety.
The researchers also proposed a “quantitative linear measure for determining the level of
library anxiety in terms of no anxiety, low anxiety, mild anxiety, moderate anxiety, and
severe anxiety” (p. 266).
Hyldegard (2006) conducted a case study with five (5) Danish postgraduate students in
Library and Information Science to explore whether “members of a group behave
differently from the individual modeled in the Kuhlthau’s Information Search Process (ISP)
model” (p. 276). Results of the study revealed that various emotional feelings were reported
by students during the collaborative information seeking process. It has been found that
negative feelings did not only occur in the beginning of the process. Moreover, in the
middle and at the end of the project feelings such as uncertainty, frustration and anxiety
reported by students. The researcher concluded that “group members did not perceive
emotional experiences as the individual information seeker presented in the Information
Search Process (ISP) model” (p. 295). These differences found to be related with
contextual, social and personal factors (Hyldegard, 2006 as cited by Fainburg, 2009).
In an exploratory user study, Arapakis, Jose and Gray (2008) investigated the role of
emotions during the information seeking process. The information seeking behaviors and
emotions of twenty-four (24) bachelor’s level students, master’s level students and doctoral
level students were monitored and traced using logging software, facial analysis software,
and a questionnaire which developed by the researchers for this study. The results of the
study revealed that “information seeking task difficulty and complexity has a significant
effect on the distribution of negative emotions during the information seeking process” (p.

27
401). For instance, feeling of anxiety and fear were reported to have experienced by only
four (4) percent of students during easy information seeking tasks. In contrast, during
extremely complex information seeking assignments, feeling of fear and anxiety were
reported to have increased to seventeen (17) percent of students. Accordingly, the
researchers concluded that as the difficulty of the information seeking task aggravated,
students’ emotions changed from positive to negative and anxiety and frustration increased.
Kim and Todd (2008) conducted an in-depth pilot study to investigate information seeking
behaviors and emotions of two (2) Korean high school students in the United States (p. 1).
Data were gathered using several methods: “questionnaire, search journals, search sessions,
observation, students’ papers, and interviews” (p. 1). According to the results, the students
reported emotional changes throughout the research process. In the beginning of the
information seeking process, they felt confused, anxious, and worried about the search
process. In the midst of the information seeking process, the students’ anxiety increased
because they could not find appropriate information resources. Additionally, feelings of
disappointment, dissatisfaction, and anxiety were reported to have experienced at the end of
the search process. This finding supports Kuhlthau’s (1993) claim that negative emotions
are an integral component of the information seeking process.
Chowdhury and Gibb (2009) investigated different activities and problems which cause
uncertainty and anxiety during the information seeking process. A total of six hundred and
sixty-eight (668) academic staff, research staff, and research students were investigated
using an online questionnaire which was developed by the researchers. The results of the
study revealed that “uncertainty and anxiety may occur due to a number of information
seeking activities, and may also be created because of some problems associated with
information seeking” (p. 470). The most important information seeking activities which

28
cause anxiety during the information seeking process were reported as following:
“choosing appropriate information channel,” “formulating a research expression,”
“deciding when to stop a search and start to begin to use the retrieved items,” “making sure
to remain up-to-date in a given field,” and “judging quality of the sources” (p. 478).
Furthermore, some other information seeking problems were reported by the researchers to
cause levels of anxiety and apprehension including “when search output is not exhaustive,”
“unawareness of source and channel,” “information overload,” “unfamiliarity with
information sources,” and “finding too scattered information” (p. 487). Finally, the
researchers found that with increase in age of students, uncertainty and anxiety increased
with regard to the following activities: “formulating a search expression,” “taking a course
of action following a research,” and “deciding which retrieved items should be looked at
for their content” (p. 479).
Bowers (2010) studied whether library anxiety exists among one hundred and fifty-seven
(157) undergraduate law students at a private mid-western university in the United States.
Study subjects were requested to complete the “Multidimensional Library Anxiety Scale”
(MLAS) which was developed and validated by Van Kampen (2003) (p. 42). The results of
the study revealed that “law students exhibited moderate levels of overall library anxiety, as
well as varying levels of library anxiety on each of the six (6) sub-dimensions” (p. 5).
According to the results, no significant differences were existed between males and females
in regard to overall library anxiety levels. This result is consistent with the findings of
Bostick (1992), Mech and Brooks (1995, 1997), Onwuegbuzie and Jiao (2000) and Anwar,
Al-Kandari and Al-Qallaf’s (2004) who found gender to have no effect on the levels of
library anxiety. Moreover, the results of the study revealed no statistically significant
correlations between library anxiety and year of study as well as age among undergraduate

29
law students. This finding is in contrast to the Bostick (1992), Jiao, Onwuegbuzie and
Lichtenstein (1996) and Ben Omran’s (2001) finding that library anxiety declined linearly
as age increased. Additionally, the results of the study indicated that library anxiety on the
six (6) components did not differ based upon law students’ grade point average. This
finding is in contrast to the Jiao, Onwuegbuzie and Lichtenstein (1996) and Jiao and
Onwuegbuzie’s (1997b) claim that students with higher grade point average tended to
have higher levels of library anxiety than those with lower GPA. Moreover, evening
division students were reported to have experienced greater levels of library anxiety
stemming from the comfort with the library staff dimension than did day division students.
Another finding of the study was that “law students who used the library in person one (1)
or fewer times per semester encountered grater library anxiety as it pertained to general
library and research anxiety” (p. iii).
Abusin and Zainab (2010) used the diary method to investigate library anxiety among fifty-
one (51) undergraduate students at the Sudan University of Science and Technology (p.
59). The results of the study revealed that 88.2% of the Sudanese students experienced
some levels of library anxiety. This finding supports Mellon’s (1986a) conclusion that 75%
to 85% of undergraduate students expressed feeling of frustration from the library.
Searching for information resources in the library, insufficient number of books and other
library resources, annoyance caused by peers in the library environment, and indifferent
library staff were reported as the most important sources of library anxiety among the
Sudanese students. The results of the study also revealed that fifty-five percent (55%) of the
students expressed library avoidance behaviors when they were using libraries.
Additionally, the researchers “proposed the Sudanese Library Anxiety and Avoidance
Model (SLAAM) which described five (5) categories of factors that may be related to the
30
student’s feeling of library anxiety and avoidance, include: negative perceptions toward the
library environment, negative perceptions toward peers, negative perceptions toward library
staff, negative perceptions toward library services and psychological barriers” (p. 75). The
researchers concluded that “the Sudanese Library Anxiety and Avoidance Model (SLAAM)
proposed in this study has provided rich information about various barriers to library use
and can be used as the basis for quantitative testing to confirm the situation” (Abusin,
Zainab & Noor, 2011, p. 173).
Erfanmanesh (2011) studied library anxiety among one hundred and twenty-three (123)
postgraduate students in Education and Psychology at Shiraz University, Iran using a
modified version of the “Multidimensional Library Anxiety Scale (Van Kampen, 2003)” (p.
1). The findings of the study revealed the presence of library anxiety among students to the
extent that 79% of all students were reported to have experienced moderate to high levels
of library anxiety. Making a comparison amongst the mean of different aspects of anxiety
illustrated that the anxiety of access to services factor came to the highest mean followed
by library literacy factor and access to resources factor. Moreover, the analysis of variance
showed significant mean differences in all library anxiety subscales among students from
different disciplines. Accordingly, Library and Information Science students were reported
to have experienced the lowest and Educational Psychology students were reported to have
experienced the highest levels of library anxiety. The results of the running an independent
sample t-tests indicated that male students were reported to have experienced statistically
significantly higher levels of library anxiety than did females. This finding supports that of
Jiao, Onwuegbuzie and Lichtenstein (1996), Jiao and Onwuegbuzie (1997b) and Veal
(2002) studies that found males to be experiencing higher levels of library anxiety than
females. However, comparing the mean anxiety in both groups demonstrated no significant

31
differences in three (3) sub-scales of the “library anxiety scale”, namely, access to
resources, library literacy and library building dimensions. Additionally, it was found that
students at the second semester of the study were more likely to experience higher levels of
library anxiety than students in other semesters of the study.
Lee (2011) studied the prevalence of library anxiety among one hundred and ninety-one
(191) basic skills English students in a California Community College District (p. 1) using
the mixed-methods approach. The quantitative data were collected using the “Library
Anxiety Scale (Bostick, 1992)”, while the qualitative data were gathered using interviews
with thirteen (13) students. According to the results, participants were reported to have
experienced moderate level of library anxiety. The results of the study revealed that low
anxious students were more likely to use the academic and public libraries than did high
anxious students. This finding is consistent with Jiao, Onwuegbuzie and Lichtenstein
(1996) and Jiao and Onwuegbuzie’s (1997a) findings that revealed a negative statistically
significant relationship between the frequency of library use and levels of library anxiety.
Additionally, Asian students were reported to have experienced the highest and African-
American students were reported to have experienced the lowest levels of library anxiety.
This result confirms Jiao, Onwuegbuzie and Bostick’s (2004, 2006) findings that the
African-American student were reported to have lower levels of library anxiety related to
three (3) out of five (5) dimensions of library anxiety, namely, affective barriers, comfort
with the library and barriers with staff, than did Caucasian-American students (Jiao,
Onwuegbuzie & Bostick, 2004, p. 232). According to the results of the study, as students’
hours of employment per week increased, so did their library anxiety. The findings also
provided evidence that “male students reported experiencing higher levels of library
anxiety than did female students” (p. 81). Finally, students over fifty (50) years old had the

32
highest levels of library anxiety associated with the following subscales: barriers with staff,
comfort with the library, and knowledge of the library. This finding supports Bostick’s
(1992) claim that, students over fifty (50) years old were more likely to experience higher
levels of library anxiety than younger students.
2.3. Sources of Anxiety
Many sources of anxiety during the information seeking process in libraries and
information systems have been identified by previous studies. Mellon (1986a), who
developed the theory of library anxiety, noted four (4) sources of anxiety: “the size of the
library,” “not knowing where to find information resources,” “not knowing what to do in
the library,” and “not knowing how to begin information search process” (p. 162). She
stated that students were confused about layout of library floor and they did not know on
which floor the information resources are located. This caused them to feel anxious and
lost, as one of the students explained: I relate my fear to the library … to its large size,
another student added the largest library you have ever been is seemed like a small room
compare to this (Mellon, 1986a).
Bostick (1992) found that library staff, affective barriers, comfort with the library,
knowledge of the library, as well as mechanical barriers cause anxiety and frustration
among university students when they are seeking information in libraries. In another study,
Jiao and Onwuegbuzie (2001b) who investigated library anxiety among international
students in the American university found that mechanical barrier is the greatest source of
library anxiety among participants of the study. The same results were also obtained from
the studies conducted by Onwuegbuzie (1997), Jiao and Onwuegbuzie (1999a), Jiao and

33
Onwuegbuzie (2001b) and Brannan (2003). Further, anxiety over how to start searching for
a search topic and what to do in order to find information resources was reported by
Kuhlthau (1991) as sources of anxiety during the information search process (Van Kampen,
2003, p. 21). In another study, Kuhlthau (1993) suggested that unawareness of the different
stages of the information search process may play a role in students’ negative feelings
during the search process. Onwuegbuzie (1997) and Shoham and Mizrachi (2001) referred
to anxiety which arose from lack of required information resources in the area of research
as resource anxiety.
Onwuegbuzie (1997) found that resource anxiety is one of the most prevalent factors of
library anxiety that contributes to underachievement in writing research proposal. The idea
that finding both too much or a limited number of information resources may cause anxiety
during the information seeking process was also supported by other researchers (Kohrman,
2002; Chowdhury & Gibb, 2009). On the one hand, “lack of relevant information
resources,” “inadequate number of books and reference materials” as well as “scarcity of
non-book materials in libraries” has been put forward as possible sources of anxiety
(Abusin & Zainab, 2010, p. 69, 70). Moreover, limitation of relevant information resources
reported as a probable source of anxiety during the information seeking process
(Chowdhury & Gibb, 2009). Andrews (1991) who studied students’ library use problems
noted that limited number of copies of resources may cause problem between the students
who are taking the same course. On the other hand, “finding too many information
resources was reported to cause confusion and frustration as well as blocking the student’s
ability to make critical choices,” (Oberman, 1991, p. 189). This was named cereal
syndrome by Oberman (1991). Additionally, Stebelman (1987) suggested that the large
34
amount of information resources in different formats which are available in today academic
libraries may contribute to feelings of anxiety and frustration in students.
Shoham and Mizrachi (2001) identified seven (7) factors as possible sources of library
anxiety: library staff, library knowledge, English language barriers, library physical
comfort, library computers, library policies and hours and library resources. They notified
that some students have negative attitudes towards library regulations, rules and operating
hours. Those students were aware of the importance of these regulations; however they
considered the regulation applied in their academic library inconvenient. The library
policies and hours was the second most prevalent factor that contributed to feelings of
library anxiety among Israeli undergraduate student, as it scored an average of 2.81
(Shoham & Mizrachi, 2001). In another study, Van Kampen (2003) suggested that comfort
and confidence using the library, interaction with library staff, perceived importance of the
library, comfort level with library technologies and comfort level with library building were
underlying sources of student’s anxiety during the information seeking in library
environment. Furthermore, Anwar, Al-Kandari and Al-Qallaf (2004) listed staff
approachability, feelings of inadequacy, library confidence and library constrains as
probable sources of library anxiety among undergraduate Kuwaiti students.
The cost of information seeking has been identified as another probable source
of information seeking anxiety (Kohrman, 2002; Chowdhury & Gibb, 2009). In other
studies, time limitations for finding required information resources as well as having
deadlines for conducting research were also reported as possible sources of anxiety during
the information seeking process (Keefer, 1993; Kohrman, 2002; Chowdhury & Gibb,
2009). Moreover, the lack of support by the faculty members, who believes that

35
postgraduate students should already know how to find information resources and how to
perform library research, has been cited as another reason of students’ research anxiety
(Dreifuss, 1981; Jacobsen, 1991; Kohrman, 2002). Kuhlthau et al. (1990b) indicated that
“unfocused topic selection and lack of mental models of the research process” may
contribute to feeling of anxiety during the information seeking process (Ben Omran, 2001).
Additionally, unfamiliarity with the information resources and information technologies has
also been identified as possible sources of anxiety during the information seeking process
(Kuhlthau, 1991). In other studies, lack of computer and Internet skills has also been found
to heighten students’ anxiety when they are seeking information related to their research
(Ben Omran, 2001; Van Kampen, 2003).
Bostick (1992) indicated that library anxiety can stem from feeling unsafe or uncomfortable
inside the library. She noted that comfort with the library refers to “how safe, secure,
welcoming and non-threatening students perceive the library to be” (Van Kampen, 2004, p.
29). Feeling unsafe is related to the fact that large libraries at the United States more often
witness crimes against staff and users. Shuman (1999) discussed different types of crimes
that occur in American libraries, including “homicide, rape, sexual assault, aggravate
assault, robbery, larceny, burglary, grand theft, personal property theft, harassment of the
staff, obscene phone calls, nuisance calls, indecent exposure, pickpockets, and elevator
crime”. Additionally, Shoham and Mizrachi (2001) introduced the physical comfort factor
which assessed the influence of physical facilities on students’ comfort and enjoyment with
the library.
Abusin and Zainab (2010) reported that Sudanese students get nervous in university
libraries due to the “inadequate provision of books and references,” “shortage of

36
photocopiers,” “poor lighting,” “offensive smells,” “poor ventilation,” “lack of seats,”
“disturbance caused by noise,” “crowding in the library,” “shortage of lockers,” and “lack
of security” (p. 64, 65). Some researchers have suggested that library policies and
regulations as well as library hours may contribute to students’ sense of frustration
(Bostick, 1992; Shoham & Mizrachi, 2001; Abusin & Zainab, 2010). In another research,
Andrews (1991) recognized the following reasons of library anxiety: “problems
with the catalogue,” “problems with locating books,” “the classification scheme,” “library
layout,” “perceived lack of information about library services,” and “reluctance to ask for
help” (p. 7). Additionally, Andrews (1991) revealed that lack of re-shelving, missing, and
hidden books were among the reasons that prevent students from locating their required
materials in the academic library. In addition, some students had problems because there
was not enough information available about the library facilities and resources (Andrews,
1991).
Presno (1988) found four (4) areas of Internet anxiety, named Internet terminology anxiety,
Internet search anxiety, Internet time delay anxiety and general fear of internet failure,
which resulted in users feeling anxious and frustrated during the information seeking
process in the World Wide Web. Kohrman (2003) reported that students get nervous when
necessary information resources may not be quickly accessible, when what is found during
the search process is not desired, or when dissimilar technology is required to access
required information resources. Additionally, “The fear of not finding or getting everything
necessary” has been put forward as another possible source of information seeking anxiety
(Kohrman, 2002, p. 16). In another study, Onwuegbuzie, Jiao and Bostick (2004) notified
that library anxiety can be influenced by library décor architecture, an arrangement of the

37
furniture, noise of cell phones ringing in the library, theft of personal belongings, and poor
lighting and ventilation.
Balanli et al. (2007) indicated that insufficient library use was mainly related to difficulties
in gaining access to the needed information and insufficient library collection. It was also
related to many physical characteristics including the lack of space, high noise level, poor
temperature control, airlessness and poor lighting quality. They found that poor temperature
control affected library users as “30.98 percent of users complained about the temperature
during the cold season and 13.79 percent of them complained about the temperature during
the hot season” (p. 717). Additionally, the researchers indicated that more than half of the
respondents complained about airlessness inside the library. In addition, students were
affected by distinctive and heavy odor. Finally, the researchers found that “19.70 percent of
users in the library building complained about the insufficient lighting quality” (p. 717).
Lack of critical thinking disposition (Kwon, Onwuegbuzie & Alexander, 2007; Kwon,
2008), lack of socially prescribed perfectionism (Jiao & Onwuegbuzie, 1998a), lack of self-
perception (Jiao & Onwuegbuzie, 1999b), and low levels of perceived social acceptance
(Jiao & Onwuegbuzie, 2002a) have been found to heighten anxiety in students during the
information seeking in libraries. In addition, poor reading abilities (Jiao & Onwuegbuzie,
2003), inappropriate study habits (Jiao & Onwuegbuzie, 2001a) and lack of persistence and
self-motivation in learning (Onwuegbuzie & Jiao, 1998a) were also found as potential
sources of library anxiety. In another study, Jiao and Onwuegbuzie (2004) found that
extensive use of new information technologies in library environment, negative attitudes
toward computers and new technologies as well as using unfamiliar hardware and software
to seek information resources may be related to higher levels of library anxiety. Moreover,
38
Onwuegbuzie (1997) noted that library anxiety comprised the following six (6)
components: interpersonal anxiety, perceived library competence, perceived comfort with
the library, location anxiety, mechanical anxiety and resource anxiety (Onwuegbuzie, Jiao
& Bostick, 2004, p. 36-37).
Few more studies have focused on location of information resources in libraries as a
potential source of anxiety (Bostick, 1992; Kohrman, 2002). Additionally, Abusin and
Zainab (2010) suggested that the location of the academic library in university campus can
influence students’ library anxiety. Furthermore, both the small library building (Abusin &
Zainab, 2010) and the large library building (Mellon, 1986a; Kuhlthau, 1993; Jacobsen &
Mark, 1995; Ansari, 2009) have been reported as possible sources of library anxiety.
According to Ansari (2009), “students who perceived library building and collection as
big experienced more anxiety and less comfort in the library and face more barriers
with service providers” (p. 425). Moreover, absence of signs and graphics in the library to
locate resources and services may contribute to students’ feeling of anxiety (Bostick,
1992; Onwuegbuzie, Jiao & Bostick, 2004). Inadequate library skills were also found to
be one of the main sources of anxiety among students who use academic libraries (Mellon,
1986a; Bostick, 1992; Shoham & Mizrachi, 2001; Van Kampen, 2003; Gross & Latham,
2007; Erfanmanesh, 2011).
Several other factors have been discovered by Chowdhury and Gibb (2009) as reasons
of anxiety and uncertainty during the information search process which includes
unfamiliarity with information resources, scattering of resources, novelty of resources,
quality of resources, and availability of resources. Additionally, judging the quality and
relevancy of retrieved information resources during the information seeking process was

39
also reported as a potential reason of anxiety (Chowdhury & Gibb, 2009). They also found
students to be experiencing tension and anxiety when they have no access to full-text
resources which they need for their research. Some other possible sources of anxiety
experienced during the information seeking in libraries and information systems are: “rapid
changes in information technologies,” “fear of mistakes that cause system malfunction,”
“the lack of stability of internet contents” “the lack of computer and internet experience,”
and “overwhelming computer and Internet jargons” (Ben Omran, 2001, p. 32-33). Selecting
the appropriate electronic tool to search for information, formulating the suitable search
query, and using the proper search command to produce desired responses were also
reported as potential sources of anxiety during the information seeking process
(Onwuegbuzie, Jiao & Bostick, 2004).
Studies have shown that one of the most important factors that contribute to students’
feelings of anxiety is the library staff factor (Bostick, 1992; Shoham & Mizrachi, 2001;
Van Kampen, 2003; Abusin & Zainab, 2010). Bostick (1992) found that anxiety stem from
students’ perception that library staff are intimidating, unapproachable, too busy, with more
important things to help them and not available when their assistance is needed. Similarly,
Onwuegbuzie (1997a) and Shoham and Mizrachi (2001) referred to this factor as
interpersonal anxiety and staff factor respectively.
2.4. Negative Effects of Anxiety
Many negative effects of anxiety during information seeking in the libraries or information
systems have been reported by previous studies including: reduction in the quality of
students’ research proposal (Onwuegbuzie, 1997a), “negative and self-defeating thoughts”
(Jiao, Onwuegbuzie & Lichtenstein, 1996, p. 152), library avoidance behaviors (Keefer,

40
1993; Jiao, Onwuegbuzie, 1997a; Onwuegbuzie, Jiao & Bostick, 2004), development of
inappropriate library skills (Mellon, 1986a), “information seeking avoidance” as well as
lack of persistence and focus for searching information” (Carlile, 2007, p. 136), lack of
persistence in library research (Onwuegbuzie, Jiao & Bostick, 2004; Abusin & Zainab,
2010), “mental disorganization” (Jiao, Onwuegbuzie & Lichtenstein, 1996, p. 152),
impediment of the students’ scientific productivity (Higgins, 2001), and “debilitating
effects on students’ academic achievement” (Jiao, Onwuegbuzie & Waytowich, 2008, p.
949; Jiao & Onwuegbuzie, 2003, p. 161).
Keefer (1993) reported that negative emotions during the information seeking process “not
only interferes with the necessary mental and creative process, but also exacerbates basic
physical locating operations” (Battle, 2004, p. 61). Kohrman (2004) stated that keefer
(1993) referred to this as the hungry rat syndrome. “A hungry rat often misses the correct
and previously known turns because the drive and need for the food (information) at the
end of the maze (library search process) causes it to become confused, anxious, or rattled”
(p. 23-24). In another study, Jiao, Collins & Onwuegbuzie (2008) found that students’
anxiety during the information search process “reduces the efficiency with which memory
processes are utilized while striving to receive, to encode and to process new information,
thereby making it difficult to reach a successful search closure” (p. 613). Additionally,
anxiety during the information seeking process was found to make students less interested
in continuing the search for information resources or interacting with information systems
(Kuhlthau, 1993). This anxiety may also restrict the “ability to learn and to work efficiently
during the information seeking process” (Kracker, 2002, p. 283).

41
In other studies, links have been reported between high levels of library anxiety and
academic procrastination (Onwuegbuzie & Jiao, 2000), citation errors (Jiao, Onwuegbuzie
& Waytowich, 2008), low perceived academic self-competence, intellectual ability,
creativity, and social competence (Jiao & Onwuegbuzie, 1999b) and using poor study
habits (Jiao & Onwuegbuzie, 2001a). According to Higgins (2001), high levels of
academic-related anxiety have been associated with “serious health problems such as
physiological, psychological, and behavioral disorders” (p. 4). Additionally, Jiao and
Onwuegbuzie (2002a) reported that high anxious students tend to visit and utilize the
academic library 2.5 times less than low anxious students. Moreover, anxiety during
information seeking in libraries and information systems has been reported to “lessen
students’ critical thinking and self-esteem” as well as decrease the chance of success in
information seeking tasks (Kohrman, 2003, p. 5). Moreover, as noted by Onwuegbuzie,
Jiao & Bostick (2004), high anxious students often “lack confidence in their library ability
to effectively utilize the library in general and to conduct library searches in particular” (p.
33).
The negative impact of anxiety during the information seeking process has been recorded
as “inappropriate behaviors that students accomplish in the search process, such as the
inability to start the search, select a topic, gather relevant information resources, respond
suitably to cues and directional hints, and finish the search process” (Collins & Veal, 2004,
p. 7). Moreover, anxious students were reported to have experienced more “interfering
responses during various stages of the information search process” (Jiao, Onwuegbuzie &
Daley, 1997, p. 3). In another study, high levels of library anxiety have been found to
endanger graduate students’ capability to complete their study by preventing them from
conducting information seeking part of their research (Onwuegbuzie & Jiao, 1998a, c).

42
Onwuegbuzie and Jiao (2004) found that according to the Wine’s Cognitive-Attentional-
Interference theory (1980), anxiety experienced during the information seeking process
impede information seeking behaviors by hindering students’ capability to find, to focus
on, to encode, and to utilize necessary information for research. Accordingly, library and
information seeking anxieties elevate cognitive interference by causing students to move
from task-relevant to task-irrelevant thoughts. Additionally, it has been reported by
Onwuegbuzie and Jiao (2000) that anxiety during the information search process “de-
motivates students from beginning or prolonging their search, thereby impeding the
development of their information literacy skills” (p. 46).
Some other symptoms of anxiety during the information seeking in libraries or information
systems which have been reported by previous studies are as following: giving up the
library research before reaching the goals (Jiao & Onwuegbuzie, 2003), “hindering the
optimal use of library systems, services, and resources” (Anwar, Al-Kandari & Al-Qallaf,
2004, p. 267), overlooking signs, misinterpreting maps or directions and failing to look in
obvious places (Keefer, 1993), impeding cognitive processes during the information
seeking process (Kwon, 2008), “avoiding or delaying of starting or completing
assignments” that involve the library (Lee, 2011, p. 4), and “having adverse impact on
students’ cognitive-affective abilities” (Kohrman, 2003, p. 8). Onwuegbuzie, Jiao and
Bostick (2004) indicated that library anxiety affects students’ use of the library, which, in
turn, affects academic task that requires in-depth search in the library like writing a
research proposal.
Library anxiety has also been reported to “limit the mental and cognitive abilities of
students when faced with stressful situations or experiences” (Kohrman, 2003, p. 10).

43
Kohrman (2003) reported that “stress upon the mental and creative processes can hamper
not only finding but also accessing information resources during the information seeking
process” (p. 8). Moreover, library anxiety has been reported to have “debilitating effects on
students’ ability to complete assignments or develop proper information literacy skills”
(Lee, 2011, p. 4). Finally, Onwuegbuzie, Jiao & Bostick (2004) listed some other negative
effects of the library anxiety construct, including “misinterpret directions and cues,”
“refrain from asking for help,” “give up information seeking quickly,” and lack of
confidence in library use and information seeking process (p. 30-33). They reported that
library anxious students usually “undergoes either emotional or physical discomfort when
faced with any library or library related task” (p. 32).
2.5. Characteristics of Anxious Students
Jiao, Onwuegbuzie and Lichtenstein (1996) investigated the factors related to anxiety in
library environment to ascertain the characteristics of at-risk college students (p. 151). In
this study, four hundred and ninety-three (493) college students were administered
using the “Library Anxiety Scale (Bostick, 1992)” and the “Demographic Information
Form (Jiao, Onwuegbuzie & Lichtenstein, 1996)” (p. 154). Variables studied in this study
were: gender, number of library instruction courses undertaken, age, native language, year
of study, GPA, semester course load, number of course credit hours, computer usage
experience, study habits, employment status, distance lived from nearest academic library,
frequency of library visits, and reasons for visiting the library. The results of the study
revealed that the following eight (8) variables were significantly correlated with the library
anxiety: year of study, native language, frequency of library use, age, gender, academic
grades, employment condition, and number of information literacy and library instruction
sessions they have taken.
44
Findings of the study indicated that students who had severe library anxiety were more
likely to be first or second year students, those who did not speak English as their native
language, those who occasionally utilized the academic library, males, those who got
excellent grades, those who worked while studying, young and those who did not take any
library introduction or information literacy skills course (Jiao, Onwuegbuzie &
Lichtenstein, 1996). The finding that GPA was a statistically significant predictor of library
anxiety is in contrast with the research conducted by Ben Omran (2001) and Bowers (2010)
who revealed no statistically significant correlation between the GPA and library anxiety.
Additionally, the finding that gender is a statistically significant predictor of library anxiety
is in contrast with the research conducted by Bostick (1992) and Mech and Brooks (1995,
1997) who found no statistically significant relationship between student’s gender and their
library anxiety. Furthermore, the inverse relationship found between age and library anxiety
lend support to the studies conducted by Bostick (1992), Jiao and Onwuegbuzie (1997b)
and Ben Omran (2001) which found that library anxiety declined linearly as age increased.
Moreover, a negative statistically significant relationship found between the frequency of
library use and levels of library anxiety is in accordance with Jiao and Onwuegbuzie’s
(1997b, 2002a) findings.
According to the Jiao, Onwuegbuzie and Lichtenstein (1996), those students who did their
research in the library were more prone to feel anxiety associated with barriers with staff,
affective barriers and knowledge of the library dimensions of the LAS than those students
who used the library to study (Jiao, Onwuegbuzie & Daley, 1997). Moreover, “when
library anxious students visited the library, they tended to do so either to use online or
computer indexes, to return books, to conduct library search for a thesis or dissertation, to

45
obtain books or articles for assignments, or to study for class projects” (Jiao, Onwuegbuzie
& Lichtenstein, 1996, p. 157).
In another study, Jiao, Onwuegbuzie and Daley (1997) studied various independent
variables associated with different sub-scales of the library anxiety construct. Five hundred
and twenty-two (522) students from a southern and a north-eastern university were
requested to fill out the “Library Anxiety Scale (Bostick, 1992)” and the “Demographic
Information Form (Jiao, Onwuegbuzie & Daley, 1997)” (p. 4, 6). The findings of the study
demonstrated that those students with severe library anxiety associated with the barriers
with staff dimension tended to be males, who had the maximum course load, who worked
full-time, and whom English is not their mother language. High library anxious students
pertaining to the affective barriers dimension were more likely to be students who spoke a
language other than English, who received no library instruction, and who worked full-
time. Additionally, the researchers found that males, young students, students with high
grade average point, and those who did not take part in any library instruction session were
more prone to experience severe library anxiety stemming from the comfort with the library
dimension of the LAS than other students. Moreover, students who suffered from high
levels of library anxiety associated with the knowledge of the library dimension, tended to
be males, who did not participate in any library skill’s sessions, and who lived far from the
academic library. Finally, students who reported high levels of library anxiety stemming
from the mechanical barriers dimension tended to be males, who English is not their native
language, who got excellent grades, who had more credit loads, who lived far from the
library, and who were young.

46
Jiao and Onwuegbuzie (1997a) administered another study to determine what degree of
relationship might exist between reasons for academic library visit and library anxiety.
The “library anxiety Scale (Bostick, 1992)” and the “Demographic Information Form (Jiao
& Onwuegbuzie, 1997a)” were given to five hundred and twenty-two (522) students from a
mid-southern and a north-eastern university in the United States (p. 413). The findings of
the study indicated that those students who utilized the library to study for class projects
and exams were less likely to show evidence of extreme library anxiety associated with
barriers with staff, affective barriers and knowledge of the library dimensions than other
students. Furthermore, those students who conducted their research in the library were
reported to be more likely to experience high levels of library anxiety associated with
barriers with staff, comfort with the library and mechanical barriers subscales. Students
who utilize the library to read newspapers were also found to have higher levels of anxiety
stemming from barriers with the staff dimension than did other students. Additionally, the
researchers revealed that “students with the highest levels of library anxiety tended to use
the library in order to use computerized indexes and online facilities more than did their
low-anxious counterparts” (p. 418). The researchers also found that “freshmen experienced
greater levels of library anxiety than upperclassmen or graduate students, and that males
experienced higher levels of library anxiety than females” (Bowers, 2010, p. 31). The other
variables that did not score statistically significant correlations with the library anxiety
construct were semester course load, number of course credit hours, computer usage
experience, study habits, number of library and information skills courses undertaken, and
distance between home and nearest academic library.

47
2.6. Relationship to Other Academic and Non-academic Anxiety
The relationship between library anxiety and other types of academic or non-academic
anxiety has been reported in the literature. In one of the first studies, Fliotsos (1992)
conducted a survey in order to investigate the relationship between library anxiety and
computer anxiety. Her findings revealed that “computers are simply one source of possible
anxiety connected with library use” (Fliotsos, 1992 as cited by Brannan, 2003, p. 12). The
fear of looking incompetent while attempting to use computers or any other aspect of using
the library was reported as a significant source of library anxiety.
Onwuegbuzie (1997) studied the role of library anxiety, statistics anxiety, composition
anxiety and research process anxiety on postgraduate student’s research proposal writing
performance using quantitative and qualitative approaches. Quantitative data were gathered
from eighty-one (81) postgraduate students at a university in the mid-southern United
States using the “Library Anxiety Scale (Bostick, 1992)”, the “Statistical Anxiety Rating
Scale (Cruise & Wilkins, 1980)” and the “Composition Anxiety Rating Scale (Daly &
Miller, 1975)” (p. 9, 11). Additionally, a scoring rubric was applied to collect qualitative
data related to the quality of the students’ research proposals.
The results of the Onwuegbuzie’s (1997) study revealed that students’ composition anxiety
was negatively correlated with score attained on the research proposal writing (r= -0.33,
p<0.001). Moreover, two components of the library anxiety construct namely, “affective
barriers” (r=-0.35, p<0.001) and knowledge of the library (r=-0.27, p<0.01) as well as two
components of the statistical anxiety construct namely, interpretation anxiety (r=-0.33,
p<0.001), and fear of asking for help (r=-0.27, p<0.01) were statistically significantly
correlated with scores attained on research proposal. More specifically, students who

48
attained low score in their research proposal writing tended to experience higher levels of
anxiety associated with factors namely, affective barriers, knowledge of the library, fear of
interpreting statistical analysis, fear of asking for help and fear of writing the research
proposal. That is, students who attained the lowest levels of performance for their research
proposals tended to have high levels of library anxiety associated with aforementioned
dimensions. Additionally, the qualitative analysis revealed six (6) components for library
anxiety: interpersonal anxiety, perceived library competence, perceived comfort with the
library, location anxiety, mechanical anxiety and resources anxiety. The researcher
concluded that “it is likely that the feeling of research proposal writing anxiety stem from
students’ deficits in library research skills and lack of statistical and methodological
concepts, as well as difficulties and lack of confidence in composing the research proposal”
(p. 6).
Mech and Brooks (1995) reported a negative statistically significant relationship between
library anxiety levels and (a) students’ assessment of their library skills (r=-0.22) and (b)
their confidence on their ability to use the library (r=-0.37). Students with higher levels of
library anxiety tended to have reported lower self-assessment of their own library skills,
and low confidence in their ability to use the library. In the follow up study, Mech and
Brooks (1997) investigated the association between general psychological trait of anxiety
and library anxiety among one hundred and fifty-three (153) undergraduate students by
analyzing their scores on the “Library Anxiety Scale (Bostick, 1992)” and the “State-Trait
Anxiety Inventory (Spielberger, 1970)” (Van Kampen, 2003, p. 28). The results of the
study revealed no statistically significant association between these two (2) anxieties at the
undergraduate level. In light of this evidence, library anxiety has been found to be a unique
phenomenon, which is different from the general trait anxiety and is unique to the library

49
environment. Additionally, results of the study indicated no differences in trait anxiety
among freshmen, sophomores, juniors and seniors. In contrast, freshmen and sophomores
were reported to be more likely to experience library anxiety than did third and fourth year
students. This finding supports that of Jiao, Onwuegbuzie and Lichtenstein (1996) and Jiao
and Onwuegbuzie (1997b) who found first year students were reported to have experienced
higher levels of library anxiety than did other counterparts. The researchers also found no
statistically significant mean differences, in the scores of library anxiety between males and
females. In addition, no association was found between frequency of library use and library
anxiety among undergraduate students.
At the postgraduate level, Jiao and Onwuegbuzie (1999c) examined whether there is a
relationship between library anxiety and trait anxiety among one hundred and fifteen (115)
postgraduate students (p. 278). The “Library Anxiety Scale (Bostick, 1992)” and the “State-
Trait Anxiety Inventory (Spielberger, 1970)” were administered to the study subjects (p.
280). The Pearson’s product-moment correlation coefficient was used to discover if any
correlation between these two (2) types of anxiety existed. The results of the study
confirmed the previous results reported by Mech and Brooks (1997) who reported no
statistically significantly correlation existed between trait anxiety and any subscale of the
library anxiety. Further, researchers concluded that “library anxious graduate students
typically are those who are not anxious in other areas of their lives” (p. 281). Moreover, the
phenomenon of library anxiety found to be “time- and situation-specific phenomenons as
the symptoms only appear when students are in or are contemplating a visit to the library”
(p. 278). Finally, Jiao and Onwuegbuzie (1999c) concluded that the phenomenon of library
anxiety really existed and could affect the postgraduate students’ academic performance.
50
In another study, Ben Omran (2001) investigated the association between Internet and
library anxiety among postgraduate students of the school of Education and the school of
Information Science at the University of Pittsburgh (p. 53). Additionally, correlation of
library anxiety and Internet anxiety with the following demographic variables were also
investigated: gender, age, GPA, information skills instruction courses participated, year of
study, major, race, frequency of library use and frequency of Internet use. One hundred and
ninety-two (192) postgraduate students were surveyed using the “Internet Anxiety Scale
(Reed & Palumbo, 1988)”, the “Library Anxiety Scale (Bostick, 1992)” and the
“Demographic Information Questionnaire (Ben Omran, 2001)” (p. 50). The results of the
study revealed that the students of both schools should be considered as low library and
Internet anxious students. Additionally, Ben Omran (2001) found no association between
student’s library anxiety and frequency of Internet use. Moreover, the analysis of data
indicated that, of the studied variables, age was the only one, which was statistically
significantly correlated with library anxiety among the students of both schools. In contrast,
students major and frequency of Internet use were statistically significantly correlated with
levels of Internet anxiety among the students of both schools. Furthermore, he found that
the number of bibliographic instruction sessions attended did not predict levels of library
anxiety. This finding is in contrast to Jioa, Onwuegbuzie and Lichtenstein’s (1996) finding
that “the number of library instruction courses undertaken by students was reported to
correlate with levels of library anxiety” (Onwuegbuzie, Jiao & Bostick, 2004, p. 46). In
general, the findings of the study demonstrated that Internet anxiety to be significantly
correlated with library anxiety just for students of the school of Information Science.
Jerabek, Meyer and Kordinak (2001) conducted a study to determine what degree of
correlation might exist between library anxiety and computer anxiety among undergraduate

51
students (p. 277). Using the “Library Anxiety Scale (Bostick, 1992)”, the “Computer
Opinion Survey (Maurer, 1984)” and the “Institute for Personality and Ability Testing
(Krug et al, 1976)”, the researchers investigated the association between these two (2)
academic-related anxiety among two hundred and forty-one (241) students enrolled in
English language, Psychology, and Philosophy programs at Sam Houston State University
in the United States (p. 280). A positive statistically significant correlation was found
between library anxiety and computer anxiety for female students only. In contrast, the
researchers found no relationship between library anxiety and computer anxiety among
male students. The researchers concluded that “the phenomenon of computer anxiety and
library anxiety has been sometimes hypothesized as emotional responses to new
technologies” (Battle, 2004, p. 5).
An investigation of the relationship between research anxiety, computer anxiety and library
anxiety was another study conducted by Kohrman (2002). Seventy-nine (79) postgraduate
students at a public American university were administered the survey instrument included
seventy-five (75) statements that dealt with computer, research and library experiences. The
findings of the study revealed that the strongest correlation was existed between computer
anxiety and research anxiety, followed by library anxiety and research anxiety and library
anxiety and computer anxiety. In addition, the results revealed no gender differences on any
of the three (3) examined anxieties. This finding supports Bostick (1992) and Mech and
Brooks’s (1997) claim that found no gender differences in library anxiety. Furthermore,
younger students were reported to have experienced greater levels of library anxiety
regarding to all three (3) studied anxieties than did older students. This finding supports
that of Jiao, Onwuegbuzie and Lichtenstein (1996), Bostick (1992) and Shoham and
Mizrachi (2001) who found younger students to have experienced statistically significantly

52
higher levels of library anxiety than older students. Finally, the researcher concluded that
library anxiety was associated with computer and research anxieties in a statistically
significant way.
2.7. Antecedents of Anxiety
Many antecedents of library anxiety have been identified by previous studies.
Onwuegbuzie, Jiao and Bostick (2004) in their book entitled “library anxiety: theory,
research, and applications”, divided antecedents of library anxiety in three (3) groups
include dispositional antecedents, situational antecedents and environmental antecedents.
Dispositional antecedents include factors that “an individual brings to the setting”
(Onwuegbuzie, Jiao & Bostick, 2004, p. 40). Some of the dispositional antecedents of
library anxiety include self-concept and self-esteem (Mellon, 1986a), self-perception (Jiao
& Onwuegbuzie, 1999b), perfectionism (Jiao & Onwuegbuzie, 1998a), academic
procrastination (Onwuegbuzie & Jiao, 2000), study habits (Jiao & Onwuegbuzie, 2001a),
hope (Onwuegbuzie & Jiao, 1998b), social interdependence (Jiao & Onwuegbuzie, 2002a),
learning styles (Onwuegbuzie & Jiao, 1998a), reading ability (Jiao & Onwuegbuzie, 2003)
and critical thinking (Kwon, Onwuegbuzie & Alexander, 2007; Kwon, 2008).
Situational antecedents of library anxiety include factors that are in the “immediate
environment that surround the stimulus” (Onwuegbuzie, Jiao and Bostick, 2004, p. 40).
Some of the situational antecedents of library anxiety consisted of size of library, frequency
of library visits, mechanical barriers, affective barriers, barriers with staff, reasons for using
library, comfort with the library, number of library instruction courses attended and
computer attitudes. Additionally, environmental antecedents of library anxiety include
“demographic factors that place an individual at risk for library anxiety” such as user’s

53
gender, age, native language, employment status, years of study and race (Onwuegbuzie,
Jiao and Bostick, 2004, p. 40).
In one of the first studies in this area of research, Onwuegbuzie and Jiao (1998a) examined
the extent to which student’s learning styles anticipated levels of library anxiety. Data were
obtained from two hundred and three (203) postgraduate students at a mid-southern
university in the United States using two (2) questionnaires: the “Library Anxiety Scale
(Bostick, 1992)” and the “Productivity Environmental Preference Survey (Dunn, Dunn &
Price, 1985)” (p. 239). The researchers concluded that nine (9) learning style variables
statistically significantly correlated with different dimensions of library anxiety.
Specifically, those students who liked structure, those who lacked persistence, those who
managed complex assignments in the morning, those who were peer-oriented learners,
those who used visual aids during learning process, those who were self-motivated, those
who desired mobility in the library environment, those who were not responsible, and those
who were cooperative learners were reported to have experienced higher level of library
anxiety than other students. Mechanical barriers dimension of the LAS was found to be
significantly related to noise, persistence, responsibility and mobility. Knowledge of library
dimension of the LAS was significantly correlated to persistence, responsibility and
mobility. Comfort with the library sub-scale of the LAS was significantly associated with
persistence, responsibility, structure, tactile and mobility. Affective barriers dimension of
the LAS was significantly related to structure, visual, tactile and mobility. Finally, barriers
with staff dimension of the LAS was significantly correlated with persistence, visual and
mobility. Researchers concluded that by understanding the role of learning styles in
increasing levels of library anxiety among postgraduate students, librarians can plan to
meet students’ needs, and help in developing their library skills.

54
Onwuegbuzie and Jiao’s follow-up study (1998a) focused on the association between five
(5) dimensions of the library anxiety and twenty (20) learning preferences among the same
participants as the previous study. Again, the subjects were surveyed using two (2)
questionnaires: the “Library Anxiety Scale (Bostick, 1992)” and the “Productivity
Environmental Preference Survey (Dunn, Dunn & Price, 1985)” (p. 219). The results of the
study revealed that “the following thirteen (13) learning environmental preferences were
related to one (1) or more dimensions of library anxiety: noise preference, persistence
orientation, responsibility, structure, peer orientation, authority orientation, multiple
perceptual orientation, visual orientation, tactile orientation, kinesthetic orientation,
morning preference, afternoon preference and mobility preference” (p. 217). According to
the results, mobility was the learning preference which was found to be associated with
four (4) dimensions of library anxiety (affective barriers, mechanical barriers, knowledge of
the library and barriers with staff dimensions) while persistence and visual orientation were
predictors of three (3) dimensions of library anxiety (affective barriers, mechanical barriers
and barriers with staff dimensions). According to the findings of the study, the researchers
recommended that a learning-style-based (LSB) approach to library instruction be utilized.
Such an approach would involve “organizing bibliographic instruction around different
learning modalities to accommodate the needs of the majority of library users”
(Onwuegbuzie, Jiao & Bostick, 2004, p. 50).
Perfectionism is a dispositional antecedent which has been associated with library anxiety
among postgraduate students. Particularly, the study conducted by Jiao and Onwuegbuzie
(1998a) sought to investigate whether three (3) perfectionism dimensions, namely, self-
oriented perfectionism, other-oriented perfectionism and socially prescribed perfectionism
were associated with various dimensions of the library anxiety construct among

55
postgraduate students (p. 365). Data were obtained from one hundred and eight (108)
students at a small mid-southern university in the United States who administered the
“Library Anxiety Scale (Bostick, 1992)” and the “Multidimensional Perfectionism Scale
(Frost & Marten, 1990)” (p. 366). Findings of the study demonstrated that postgraduate
students who tended to have socially prescribed perfectionism were more likely to
experience higher levels of anxiety related to mechanical barriers, comfort with the library
and affective barriers sub-dimensions than other students. The findings of the study did not
report a significant association between the self-oriented perfectionism as well as other-
oriented perfectionism and any library anxiety subscales. This finding supports
Onwuegbuzie and Daley’s (1999) result that postgraduate students who “hold unrealistic
standards for significant others tend to have higher levels of statistics anxiety than other
students” (Onwuegbuzie, Jiao & Bostick, 2004, p. 42).
Another antecedent of library anxiety which has been studied by Jiao and Onwuegbuzie
(1999b) is self perception. The aim of the study was to investigate whether any correlation
existed between anxiety in library environment and self perception. For this purpose, the
“Library Anxiety Scale (Bostick, 1992)” and the “Self Perception Profile for College
Students (Neemann & Harter, 1986)” were completed by one hundred and forty-eight (148)
postgraduate students at a mid-southern university in the United States (p. 142). According
to the results, statistically significant relationships were found between four (4) of the seven
(7) dimensions of self perceptions, namely, perceived scholastic competence, perceived
intellectual ability, perceived social acceptance as well as perceived creativity and two (2)
out of five (5) subscales of library anxiety, namely, affective barriers and comfort with the
library dimensions. In other words, library anxious postgraduate students associated with
affective barriers and comfort with the library were perceived to be those students who had

56
poor self perception in the areas of scholastic competence, intellectual ability, social
acceptance and creativity. Further, because “high levels of library anxiety were found to be
associated with low levels of perceived social acceptance”, Jiao and Onwuegbuzie (1999b)
concluded that library anxiety is a “socially based phenomenon” (Onwuegbuzie, Jiao &
Bostick, 2004, p. 41).
Stemming from earlier finding that postgraduate students are prone to procrastinate in their
academic related tasks, Onwuegbuzie and Jiao (2000) studied the relationship between
academic procrastination and library anxiety (p. 45). Study subjects consisted of one
hundred and thirty-five (135) postgraduate students at a southern university in the United
States who were administered the “Library Anxiety Scale (Bostick, 1992)” and the
“Procrastination Assessment Scale for Students (Solomon & Rothblum, 1984)” (p. 47). The
PASS scale has two (2) sections. The first section lists six (6) academic tasks involving
writing a term paper, studying for examinations, keeping up with weekly reading
assignments, performing administrative tasks, attending meetings, and performing
academic tasks in general. The second section asks students to think of the last time they
procrastinated on writing a term paper. The finding of the study demonstrated positive
correlations between procrastination regarding to the academic tasks and three (3) library
anxiety dimensions, namely, mechanical barriers, affective barriers and comfort with the
library dimensions. This result supports that of Onwuegbuzie, Jiao and Bostick’s (2004)
who reported a relationship between “procrastination and generalized and specific kinds of
anxiety such as test anxiety and statistics anxiety” (p. 43). While, the researchers found a
correlation between the library anxiety and academic procrastination, it was not clear
whether library anxiety increased procrastination or procrastination caused higher levels of
library anxiety. It was found to be more probable that a bi-directional relationship existed
57
between academic procrastination and library anxiety, with any of them influenced the
other one. On the one hand, postgraduate students who had severe level of library anxiety
related to three (3) aforementioned dimensions tended to procrastinate while doing
assignments that required using library or performing library research. On the other hand,
high procrastinating postgraduate students may experienced high degree of library anxiety
related to three (3) out of five (5) dimensions of the “Library Anxiety Scale”, namely,
mechanical barriers, affective barriers and comfort with the library dimensions.
Because many students use the library to read, it is probable that, those students who have
inappropriate study habits are the most uncomfortable clients in the library. In examining
the relationship between characteristic strengths and weaknesses of study habits and library
anxiety among postgraduate students, Jiao and Onwuegbuzie (2001a) studied one hundred
and thirty-three (133) postgraduate students at a university in the southeastern United States
(p. 73). Participants were asked to complete the “Study Habits Inventory (Jones & Slate,
1992)” and the “Library Anxiety Scale (Bostick, 1992)” (p. 74). The findings revealed that
study habits related to reading, note-taking and study techniques predicted high or low
levels of library anxiety. Even though library anxiety and study habits were found to be
related, it was not clear whether improper study habits were a reason of library anxiety or
whether library anxiety induced poor study habits. Consequently, the researchers concluded
it to be a bi-directional relationship between study habits and library anxiety, with each
influencing the other one.
In another study carried out by Jiao and Onwuegbuzie (2002a), they explored whether
social interdependence was an antecedent of library anxiety. For this purpose, the “Library
Anxiety Scale (Bostick, 1992)” and the “Social Interdependence Scale (Johnson & Norem-

58
Hebeisen, 1979)” were completed by one hundred and fifteen (115) postgraduate students
at a mid-southern university in the United States (p. 71). It was found that, of the three (3)
dimensions of social interdependence, namely, cooperative perception, competitive
perception and individualistic perception, only cooperative perception was related to three
(3) out of five (5) dimensions of the library anxiety construct. Put differently, postgraduate
students who had the lowest cooperative orientation were reported to have experienced the
highest levels of library anxiety associated with knowledge of the library, barriers with staff
and comfort with the library dimensions. Additionally, individualistic attitudes, affective
barriers, and mechanical barriers were found to serve as suppressor variables.
Examining the relationship between reading comprehension as well as reading vocabulary
and library anxiety was another research conducted by Jiao and Onwuegbuzie (2003). The
aim of this study was to examine the extent to which “reading ability predicted levels of
library anxiety” (p. 165). The study participants consisted of forty-five (45) African-
American postgraduate students enrolled in Counseling Psychology, School Psychology
and Educational Psychology programmes at a university in the eastern United States
(p. 162). Study subjects were required to complete the “Library Anxiety Scale (Bostick,
1992)” and the “Nelson-Denny Reading Test (Brown, Nelson & Denny, 1973)” (p. 163).
The results of the study indicated that postgraduate students with high reading vocabulary
and reading comprehension scores were more likely to experience low levels of library
anxiety stemming from knowledge of the library, comfort with the library and barriers with
staff dimensions. As such, the results revealed that the statistically significant relationship
existed between postgraduate student’s reading ability and their level of library anxiety.

59
In another study investigating the relationship between off-campus adult students’ attitudes
toward the Internet and library anxiety, Collins and Veal (2004) surveyed one hundred and
forty-three (143) off-campus students at a mid-western university in the United States by
using two (2) different questionnaires: the “Library Anxiety Scale (Bostick, 1992)” and the
“Attitude Toward Educational Use of the Internet (Duggan et al., 2001)” (p. 9). The off
campus adult learners have been defined as graduate students attending classes at a distance
of at least fifty (50) miles from their home institution’s library. Research findings indicated
that off-campus students had the highest degree of library anxiety associated with affective
barriers, dimension followed by mechanical barriers, comfort with the library and barriers
with staff dimensions whereas the lowest level of library anxiety was associated with
knowledge of the library sub-scale. This finding supports the results of Onwuegbuzie
(1997), Jiao and Onwuegbuzie (2001) and Brannan (2003) who reported that the
mechanical barrier was the most important source of library anxiety. More importantly,
high library anxious students related to knowledge of the library dimension were reported
to be more likely to experience the most negative attitudes toward the Internet. Results of
the study revealed that “knowledge of the library can predict off-campus adult learners’
attitudes toward the educational use of the Internet” (p. 12). It was concluded that adult
learner’s perception of their abilities to access information is an important component of
their anxiety level while using library resources and the Internet.
In another study using a Canonical Correlation Analysis, Jiao and Onwuegbuzie (2004)
reported a “strong multivariate relationship between computer attitudes and library anxiety
dimensions” (p. 141). Participants in this study were ninety-four (94) African-American
postgraduate students who completed the “Library Anxiety Scale (Bostick, 1992)” and the
“Computer Attitude Scale (Loyd & Gressard, 1984)” (p. 139). It was found that two (2)
60
dimensions of computer attitude (namely, computer likely and computer usefulness) were
associated with all five (5) dimensions of library anxiety. That is to say, students who
enjoyed using computers or those who had a positive attitude toward the usefulness of
computers, were reported to have experienced lower levels of library anxiety stemming
from barriers with staff, affective barriers, comfort with the library, mechanical barriers,
and knowledge of the library dimensions than those who do not enjoy or use computers.
The researcher concluded that student’s computer attitudes predict levels of library anxiety.
Finally, the researchers encouraged future investigations to find out whether library anxiety
places a person more at risk for experiencing poor computer attitudes, or whether the
converse is true.
The impact of postgraduate student’s racial differences on their library anxiety has been
studied by Jiao, Onwuegbuzie and Bostick in two (2) different studies. In the first study,
Jiao, Onwuegbuzie and Bostick (2004) surveyed one hundred and thirty-five (135)
Caucasian-American and forty-five (45) African-American postgraduate students at two (2)
different universities in the United States by administering the “Library Anxiety Scale
(Bostick, 1992)” (p. 231). Utilizing a series of independent samples t-tests using the
Bonferroni adjustment method, the study found that Caucasian-American graduate students
were reported to have experienced statistically significantly higher levels of library anxiety
associated with barriers with staff, affective barriers and comfort with the library
dimensions than did their African-American counterpart. Their finding suggested that “race
appeared to be a predictor of library anxiety” (p. 228). However, because the two (2) racial
groups of students were selected from different universities, the researchers “were unable to
conclude whether the differences found in the library anxiety levels were the result of race

61
or the group’s educational background and experience” (Jiao, Onwuegbuzie & Bostick,
2006, p. 845).
In the replication study which was conducted two (2) years later, (Jiao, Onwuegbuzie &
Bostick 2006), all participants were selected from the same university to control their
educational background. Again, the “Library Anxiety Scale (Bostick, 1992)” was
distributed among one hundred and fifty-five (155) Caucasian-American and twenty-five
(25) African-American students (p. 845). According to the results, Caucasian-American
postgraduate students were reported to have experienced higher levels of library anxiety
associated with Barriers with staff, affective barriers, knowledge of the library, comfort
with the library and mechanical barriers dimensions than did African-American
postgraduate students. The researchers concluded that the findings of the study provided
incremental validity to the inference that (a) race is an environmental antecedent of library
anxiety among graduate students; and (b) library anxiety has a racial context (Jiao,
Onwuegbuzie & Bostick 2006).
Gross and Latham (2007) investigated the relationship between information literacy
skills level, self-estimates of skills, and library anxiety. The study participants consisted of
fifty-one (51) first year students at Florida State University who completed the
“Information Literacy Test (ILT)” and the “Library Anxiety Scale (LAS)” (p. 338). The
results of the study revealed that “the only subscale of library anxiety that demonstrate a
relationship with information literacy skills was knowledge of the library dimension” (p.
348). In other words, students who had lower levels of information literacy skills were
reported to be more likely to experience greater levels of library anxiety associated with
knowledge of the library dimension than did other students. As a result, no statistically
62
significant relationship was seen between information literacy skills and other four (4) out
of five (5) dimensions of library anxiety including: barriers with staff, affective barriers,
comfort with the library and mechanical barriers.
Kwon, Onwuegbuzie and Alexander (2007) examined the extent to which critical thinking
disposition predict levels of library anxiety. The researchers surveyed one hundred and
seventy (170) postgraduate students at two (2) south-eastern universities in the United
States. Participants were required to complete the “California Critical Thinking Disposition
Inventory (Facione & Facione, 1992)” and the “Library Anxiety Scale (Bostick, 1992)” (p.
271). Findings of the study revealed that library anxiety and critical thinking disposition
were significantly correlated together. To explain, “postgraduate students with poor critical
thinking dispositions in the areas of self-confidence, inquisitiveness and systematicity were
reported to have experienced higher levels of library anxiety than others” (p. 276). The
researchers suggested that teaching critical thinking disposition could be an effective way
to decrease library anxiety levels of postgraduate students.
In a follow-up study, Kwon (2008) studied one hundred and thirty-seven (137) students to
determine whether critical thinking disposition related to library anxiety by undertaking
qualitative and quantitative approaches. In the quantitative part, participants were required
to complete two (2) standardized survey instruments: the “Library Anxiety Scale (Bostick,
1992)” and the “California Critical Thinking Disposition Inventory (Facione & Facione,
1992)” (p. 119). Moreover, quantitative data were gathered by analyzing the content of
essays in which the students wrote about their experiences in using academic libraries for
seeking information. In the qualitative study, students were required to write a 500-1000
words essay that describe (a) their past incidents of library use, (b) their feelings and

63
thoughts during the whole assignment process, and (c) their feelings about using the library
resources for writing a research paper.
The results of the study revealed a negative association between library anxiety and critical
thinking disposition. In other words, those students who had poor critical thinking
disposition tended to experience statistically significant higher levels of library anxiety
associated with barriers with staff, comfort with the library, mechanical barriers, affective
barriers and knowledge of the library dimensions than others with strong critical thinking
disposition (p. 122). This finding supports the study conducted by Kwon, Onwuegbuzie and
Alexander (2007) who reported a negative multivariate relationship between library anxiety
and critical thinking disposition. The qualitative study also revealed that library anxiety
negatively affects students’ critical thinking. It also found that students’ critical thinking
abilities and skills “could change over time with the progression of research and library
use” (p. 126). Kwon (2008) concluded that positive critical thinking can reduce the
negative effect on library anxiety and therefore enhance the use of critical thinking in the
information search process. She further introduced a model that described the interaction
between library anxiety and critical thinking as follows:
(a) Stage 1-2: In this stage students normally feel library anxiety;
(b) Stage 2-3: Library anxiety hampers critical thinking skills and abilities;
(c) Stage 4: Students initiate positive critical thinking disposition to overcome the problems
and carry out the library task;
(d) Stage 5: The positive critical thinking disposition initiated in the stage four (4) help to
reinstate the affected critical thinking;
(e) Stage 6: Decrease of library anxiety; and
(f) Stage 7: Accomplish the library task and get the needed information (Kwon, 2008).

64
Jiao, Onwuegbuzie and Waytowich (2008) conducted a study concerning “the role of
library anxiety in both the citation error rate and quality of reference lists of doctoral
dissertation proposals” (p. 948). This research involved the administration of the “Library
Anxiety Scale (Bostick, 1992)” and the “Background Information Form (Jiao,
Onwuegbuzie & Waytowich, 2008)” to ninety-three (93) doctoral level students in
Education at a large southern university in the United States (p. 950, 951). Additionally, the
quality of research references of the doctoral level student’s proposals was assessed using a
scoring rubric. The researchers reported a multivariate association between the student’s
levels of library anxiety and the quality of their proposal references. Accordingly, “those
doctoral students with the most number of citation errors had the highest levels of library
anxiety with the following subscales: barriers with staff, affective barriers and comfort with
the library dimensions” (p. 253). The researchers concluded that level of library anxiety
plays an important role in students’ ability to construct accurate reference lists.
Jiao, Collins and Onwuegbuzie (2008) conducted a study by attempting to correlate
postgraduate student’s cooperative group performance with their library anxiety.
Participants were one hundred and seven (107) students enrolled in research methodology
courses at a mid-southern university in the United States who completed the “Library
Anxiety Scale (Bostick, 1992)” (p. 609). Additionally, student’s cooperative group
performance in paper essays and research proposal writing was evaluated using three (3)
different scoring rubrics. The findings of the study provided evidence that those groups of
students which had the “lowest scores on the article critique and research proposal writing
tended to report the highest levels of library anxiety stemming from knowledge of the
library and barriers with staff dimensions” (p. 606). Another finding of the study was that
“groups of students which contained learners with the greatest variability in affective

65
barriers, tended to achieve the lowest levels of performance” (p. 614). Finally, the results of
the study provided evidence that cooperative group performance is a dispositional
antecedent of library anxiety among postgraduate students.
Studying three hundred and eight (308) undergraduate students at the International Islamic
University of Malaysia, Ansari (2009), investigated the relationship between size of library
collection and library anxiety. Data were gathered using a modified version of the “Library
Anxiety Scale (Bostick, 1992)”. The results of the study revealed that “students who
perceived library collection as big were reported to have experienced higher levels of
library anxiety and lower comfort in the library” than did other students (p. 422). This
finding is in accordance with Mellon (1986a), Jacobsen and Mark (1995) and
Onwuegbuzie, Jiao and Bostick’s (2004) findings that reported a relationship between size
of the library building and library anxiety.
Noor and Ansari (2011) administered a modified version of the “Library Anxiety Scale
(Bostick, 1992)” to three hundred and sixty-seven (367) undergraduate students in a
Malaysian university to investigate the role of nationality, bibliographic instruction and
gender on library anxiety (p. 141). Findings of the study revealed that bibliographic
instruction had no statistically significant effect on any of the dimensions of library anxiety.
Further, the findings indicated greater degree of library anxiety related to one (1) out of five
(5) dimensions, namely, cognitive barriers in female students in comparison to male
students. This finding is in contrast to the studies conducted by Jiao, Onwuegbuzie and
Lichtenstein (1996) and Jiao and Onwuegbuzie (1997b) who found males to be
experiencing higher levels of library anxiety than females. Additionally, Malaysian students
were reported to be more prone to show evidence of library anxiety related to affective

66
barriers dimension than international students. Moreover, the researchers performed a series
of two-way factorial ANOVA to determine whether a combination of the mentioned
independent variables predict the value of library anxiety, as well as, to examine the main
and interaction effects of each independent variable on various dimensions of the library
anxiety construct. The researchers found that the variable gender “moderates the
relationship between the two independent variables (nationality and bibliographic
instruction) with the library anxiety subscales: affective barriers, barriers with service
providers and comfort with library technology” (p. 141).
2.8. Development and Validation of Instruments
Some previous studies have developed and validated the instruments to measure levels of
library anxiety among students. In one of the most important studies, Bostick (1992)
developed and validated the “Library Anxiety Scale”. The study subjects included about
seven hundred (700) students at the University of Toledo, the Wayne State University, the
Macomb County College, and the Madonna College who participated in two (2) different
pilot studies (p. 78). The “Library Anxiety Scale” comprised forty three (43)-item five (5)-
point Likert-format instrument and five (5) dimensions which accounted for 51.8% of the
cumulative variance (p. 55). The first dimension, barriers with staff, consisted of fifteen
(15) statements which explained the highest portion of variance at 25.4% and has
eigenvalue of 10.93. Barriers with staff refer to “students’ perception that librarian
are intimidating, unapproachable and inaccessible” (Onwuegbuzie, Jiao & Bostick, 2004, p.
36). The second dimension, affective barriers, composed of twelve (12) statements which
accounted for 8.0% of the variance (eigenvalue=3.44). Affective barriers stem from
“students’ feeling of ineptness about using the library” (Onwuegbuzie, Jiao & Bostick,
2004, p. 36). It was followed by the third dimension, comfort with the library, with

67
eigenvalue of 3.19 which represented 7.4 % of the variance and included eight (8) items.
This factor pertains to “how safe, secure, welcoming, and nonthreatening students
perceive the library to be” (Onwuegbuzie, Jiao & Bostick, 2004, p. 36).
The fourth factor of the “Library Anxiety Scale” labeled knowledge of the library, included
five (5) statements and explained 6.1% of the total variance (eigenvalue=2.61). This factor
refers to “how familiar with the library students feel they are” (Onwuegbuzie, Jiao &
Bostick, 2004, p. 36). The final dimension, mechanical barrier, contained three (3)
statements and explained 4.9% of the variance (eigenvalue=2.09) (p. 64). This dimension
relates to feelings that arise from students’ reliance on mechanical library equipment
(Onwuegbuzie, Jiao & Bostick, 2004). The claim of internal consistency was confirmed by
a 0.80 Cronbach’s alpha coefficient and a three week test-retest reliability of 0.74. Alpha
reliability coefficients for different dimension were 0.90, 0.80, 0.66, 0.62, and 0.60
respectively.
Additionally, in attempts to examine criterion-related validity of the “Library Anxiety Scale
(LAS)”, various studies has been conducted. In particular, a number of studies established
that library anxiety was statistically significantly related to computer anxiety
(Onwuegbuzie, 1997b, Jerabek, Meyer & Kordinak, 2001; Kohrman, 2002; Jiao &
Onwuegbuzie, 2004), Internet anxiety (Ben Omran, 2001), research anxiety (Onwuegbuzie,
1997a; Kohrman, 2002), composition anxiety (Onwuegbuzie, 1997a), and statistics anxiety
(Onwuegbuzie, 1997a). In addition, library anxiety has been shown to be separate from trait
anxiety in postgraduate (Jiao & Onwuegbuzie, 1999c) and undergraduate students (Mech &
Brooks, 1995, 1997). As a result of these and other studies, criterion-related validity of the
“Library Anxiety Scale (LAS)” has been approved. Additionally, evidence of concurrent

68
validity of the LAS scores has been documented by some researchers. Specifically, library
anxiety has been found to be relates statistically significantly to other academic related
anxiety including statistics anxiety, writing anxiety, Internet anxiety, and computer anxiety
(Onwuegbuzie, Jiao and Bostick, 2004). Moreover, evidence of predictive validity of the
LAS has been provided by Onwuegbuzie (1997). The “Library Anxiety Scale (LAS)” has
been utilized extensively in library anxiety studies.
Shoham and Mizrachi (2001) developed and validated a modified version of the “Library
Anxiety Scale (LAS)” which was culturally appropriate for Israeli population (p. 305). For
this purpose, the researchers dropped eight (8) out of forty-three (43) statements of the
original Bostick’s LAS to adapt it to the cultural situation of this country. Afterwards, six
hundred and sixty-four (664) undergraduate students from different universities were asked
to respond to a thirty-five (35)-item five (5)-point Likert-type questionnaire. Using
Exploratory Factor Analysis, Shoham and Mizrachi identified the following seven (7)
factors: staff factor, knowledge factor, language factor, physical comfort factor, library
computer comfort factor, library policies and hour’s factor and resources factor (Shoham &
Mizrachi, 2001)
Unfortunately, Shoham and Mizrachi (2001) did not report how much of the total variance
that these seven (7) factors explained. Additionally, coefficient alpha reliability for each of
the subscales was as following: barriers with staff, 0.75; knowledge barriers, 0.76; language
barriers, 0.76; physical comfort barriers, 0.60; library computer comfort barriers, 0.51;
library policies and hours barriers, 0.45; and library resources barriers, 0.52. The study
found the language factor to be the most prevalent factor among other library anxiety
factors, followed by library policies and hour’s factor, library computer comfort factor,
69
physical comfort factor, staff factor, knowledge factor, and resources factor respectively.
However, the researchers did not mention which statements were dropped, what additions
or other modifications were made to the original LAS scale, and how these seven factors
were determined. Additionally, considering low score reliability coefficients of four (4) out
of seven (7) dimensions of the “Hebrew-Library Anxiety Scale”, caution should be
observed about the internal consistency of the scale when interpreting the psychometric
properties of the H-LAS.
Van Kampen (2003) updated Bostick’s original “Library Anxiety Scale” to better reflect
current trends in the library as a modern environment. Accordingly, she developed and
validated a new fifty-four (54)-item instrument using the LAS, called the
“Multidimensional Library Anxiety Scale (MLAS)”. Additionally, she aimed to explore
whether doctoral students, who were assumed to be experienced with the information
search process and use of the library, encounter library anxiety and whether their feelings
change overtime. Two hundred and ninety-nine (299) doctoral students at an urban south-
eastern university completed pilot questionnaires in two (2) phases. An Exploratory Factor
Analysis using a varimax rotation was performed to analyze possible patterns between
variables. Furthermore, to establish reliability of the scale, a test-retest method was carried
out. Conducting the factor analysis yielded six (6) components which accounted for 43.39%
of the total variance. Six (6) dimensions of the library anxiety were identified as following:
comfort and confidence using the library (Cronbach’s α= 0.86), information seeking
process and general library anxiety (Cronbach’s α= 0.87), barriers with staff (Cronbach’s
α= 0.73), perceived importance of the library (Cronbach’s α= 0.79), comfort level with
library technologies (Cronbach’s α= 0.73), and comfort level with library building
(Cronbach’s α= 0.74). Van Kampen concluded that, “the Multidimensional Library Anxiety

70
Scale showed satisfactory internal consistency (Cronbach’s α= 0.88) as well as construct
validity and that the scale has the potential to be a valid and reliable tool for determining
what aspects of the library and the information search process perceived to be barriers by
postgraduate students” (p. 34). Van Kampen’s MLAS introduced factors such as the
Internet, the wide availability of electronic databases, the ability to search library resources
remotely and students’ comfort with computers for the first time (Bowers, 2010).
The “Kuwaiti-Library Anxiety Scale (K-LAS)” was developed and validated by Anwar, Al-
Kandari and Al-Qallaf (2004). The objective of the study was to evaluate the suitability of
the Bostick’s “Library Anxiety Scale (LAS)” for a non-American population. The
researchers noted that LAS was developed in one context culture which not necessarily
suits other culture that is completely different. Thus, studies in variety culture and different
educational setting are needed as to allow for more exploration of the phenomenon and
open the way for introducing new or modified scale that will be able to suit different
cultures. The study participants included one hundred and forty-five (145) students of
Biological Sciences at the Kuwait University of Science and Technology who completed a
modified version of the “Library Anxiety Scale” consisted of thirty-four (34) statements (p.
270). Nine (9) of the forty-three original (43) statements of the Bostick’s LAS were
dropped because of their improperness for Kuwaiti library environment. Exploratory Factor
Analysis was carried out to identify the appropriate number of factors and statement
groupings in each of these factors. Consequently, another two (2) statements were omitted
as a result of low correlation with other items. It was discovered that the factor groupings
differed considerably from those of Bostick’s scale. Results of the study revealed four (4)
factors, which explained 47% of the total variance of the scale. The internal reliability
(alpha) coefficients using Cronbach’s alpha for the subscales were 0.90 for staff

71
approachability dimension, 0.78 for feelings of inadequacy barrier, 0.78 for library
confidence barrier, and 0.70 for library constrains dimension (p. 278). The researchers
concluded that the “Kuwaiti-Library Anxiety Scale (K-LAS)” has adequate internal
consistency as well as construct validity for assessing Kuwaiti undergraduate student’s
levels of library anxiety (p. 279). These researchers also developed and validated another
scale for undergraduate students, named, “AQAK: a Library Anxiety Scale for
Undergraduate Students” (Anwar, Al-Qallaf, Al-Kandari & Al-Ansari, 2012). A three-stage
study was conducted, using students of Kuwait University. A variety of statistical
measures, including factor analysis, were used to process the data. A test re-test was
undertaken to estimate the reliability of the scale. The resulting scale consists of 40
statements clustered into five factors which are: (1) library resources, (2) library staff, (3)
user knowledge, (4) library environment, and (5) user education. This new scale with a
Cronbach’s alpha value of 0.904 is 90 percent reliable.
Noor and Ansari (2010) investigated the Bostick’s “Library Anxiety Scale (LAS)”
psychometric properties in a Malaysian university library environment (p. 115). For this
purpose, three hundred and sixty-seven (367) students were given a forty-nine (49)-item
modified version of the “Library Anxiety Scale” which developed by the researchers
according to the original scale. A Principal Component Exploratory Factor Analysis and
an item to total score correlation analysis were performed to demonstrate the validity of the
scale. Using these methods, fourteen (14) statements with factor loading less than 0.40 were
extracted from the instrument. Using factor analysis, five (5) factors were identified which
explained 39.56% of the total variance. The researchers stated that “with
the exception of comfort with library technology sub-dimension (Cronbach’s α= 0.67),
other four sub-dimensions (barriers with staff, 0.91; comfort with library services, 0.73;

72
affective barriers, 0.70; cognitive barriers, 0.80) as well as the overall scale (Cronbach’s
α= 0.78) were found to have adequate internal consistency. Additionally, in order to
increase coefficient alpha value of different subscales of the instrument, five (5) other
statements were dropped. Considering results of this study, the thirty (30)-item Malay
version of the “Library Anxiety Scale” presented as a valid and internally reliable scale
which could be used in future studies in Malaysian academic library setting.
Using the “Library Anxiety Scale (Bostick, 1992)”, the “Multidimensional Library Anxiety
Scale (Van Kampen, 2003)”, the “Hebrew-Library Anxiety Scale (Shoham & Mizrachi,
2001)”, and the “Kuwaiti-Library Anxiety Scale (Anwar, Al-Kandari & Al-Qallaf, 2004)”,
Swigon (2011) developed and validated the “Polish-Library Anxiety Scale (P-LAS)” (p.
144). For this purpose, one hundred (100) participants which included bachelor’s degree
students, master’s degree students, and doctoral degree students as well as faculty members
at three (3) Polish universities were surveyed three (3) times in 2001, 2003 and 2009.
Conducting Exploratory Factor Analysis yielded six factors: barriers with staff (5
statements), affective barriers (9 statements), technological barriers (8 statements), library
knowledge barriers (10 statements), library comfort barriers (8 statements), and resource
barriers (6 statements). The internal reliability of the mentioned dimensions as reported
using Cronbach’s internal reliability coefficient alpha was 0.75, 0.80, 0.73, 0.78, 0.47, and
0.75 respectively. In addition, overall scale was reported to have excellent internal
reliability coefficient with a Cronbach’s coefficient value at 0.91. Consequently, the “Polish
Library Anxiety Scale (P-LAS)” reported to have adequate internal consistency.
Erfanmanesh (2011) validated the “Multidimensional Library Anxiety Scale (MLAS)”
which was developed by Van Kampen (2003) in an Iranian university. One hundred and

73
twenty-three (123) postgraduate students at the Shiraz University completed a translated
version of the questionnaire. An Exploratory Factor Analysis was performed in order to
determine the construct validity of the scale. Also, a test-retest method was used to enhance
internal validity of the overall scale. As a result, two (2) statements out of fifty-four (54)
were omitted. The results of the factor analysis yielded eight (8) subscales, namely, barriers
with library resources (Cronbach’s α= 0.81), barriers with library services (Cronbach’s α=
0.75), barriers with information seeking process (Cronbach’s α= 0.68), mechanical barriers
(Cronbach’s α= 0.78), barriers with library knowledge (Cronbach’s α= 0.72), barriers with
library use (Cronbach’s α= 0.75), barriers with library staff (Cronbach’s α= 0.83), and
barriers with library building (Cronbach’s α= 0.62) (p. 5). Additionally, the resultant alpha
coefficient of 0.84 for overall scale supported internal reliability of the scale. In view of
these findings, the fifty-two (52)-items modified version of “Multidimensional Library
Anxiety Scale” was found to be a valid and internally reliable instrument for assessing
dimensions of library anxiety among Iranian academic library users. Summary of all library
anxiety measures is provided in table 2.1 below.

74
Table 2.1: Summary of All Library Anxiety Instruments
Bostick (1992) Onwuegbuzie (1997)
(1) Barriers with staff
(2) Affective barriers
(3) Comfort with the library
(4) Knowledge of the library
(5) Mechanical barriers
(1) Interpersonal anxiety
(2) Perceived library competence
(3) Perceived comfort with the library
(4) Location anxiety
(5) Mechanical anxiety
(6) Resources anxiety
Shoham & Mizrachi (2001) Van Kampen (2003)
(1) Language factor
(2) Library policies and hours factor
(3) Library computer comfort factor
(4) Physical comfort factor
(5) Staff factor
(6) Knowledge factor
(7) Resources factor
(1) Comfort & confidence using the library
(2) Information search process & general library anxiety
(3) Barriers with staff
(4) Perceived importance of the library
(5) Comfort level with library technologies
(6) Comfort level with library building
Anwar, Al-Kandari & Al-Qallaf (2004) Noor & Ansari (2010)
(1) Staff approachability
(2) Feeling of inadequacy
(3) Library constraint
(4) Library confidence
(1) Comfort with library technologies
(2) Barriers with staff
(3) Comfort with library services
(4) Affective barriers
(5) Cognitive barriers
Erfanmanesh (2011) Swigon (2011)
(1) Barriers with library resources
(2) Barriers with library services
(3) Mechanical barriers
(4) Barriers with library knowledge
(5) Barriers with library use
(6) Barriers with library staff
(7) Barriers with library building
(8) Barriers with information search
process
(1) Barriers with staff
(2) Affective barriers
(3) Technological barriers
(4) Library knowledge barriers
(5) Library comfort barriers
(6) Resources barriers
75
2.9. Theoretical Models Related to Library Anxiety
2.9.1. Kuhlthau’s Information Search Process (ISP) Model
Studies in information behaviors and information seeking are essential areas of research in
Library and Information Science. These studies, which started from the 1940s, had the
system-centered approach at the beginning. During the early 1980s, the user of information
and his/her information needs and behaviors came into focus. Since that time, thousands of
studies have been conducted to investigate information users. Moreover, some information
seeking models have been developed during these three (3) decades. Some of the most
important information seeking models are as following: Sense Making Model of
Information Seeking (Dervin, 1983), Big Six Information Skills Model (Eisenberg &
Berkowitz, 1988), Berry-picking Model of Information Seeking (Bates, 1989), Behavioral
Model for Information System Design (Ellis, 1989), Information Seeking Strategies Model
(Marchionini, 1989), Information Use Environment Model (Taylor, 1991), Information
Search Process Model (Kuhlthau, 1993), and WWW Information Seeking Process Model
(Loeber & Cristia, 2003). However, among all information seeking models, the Kuhlthau’s
Information Search Process (ISP) model is the only one which involves the affective
aspects of the information seeking process, in addition to the cognitiv and physical aspects
(Kuhlthau, 2007, p. 34). Kuhlthau was the first to describe emotions as a natural part of the
information search process.
Kuhlthau (1993) defined information seeking as “a learning process in which the choices
along the way are dependent on personal constructs rather than on one universal predictable
search for everyone” (p. 9). Kuhlthau’s model of Information Search Process (ISP) was
developed and validated after conducting a series of five (5) studies over a period of

76
six (6) years in three (3) different settings: school libraries, academic libraries as well as
public libraries. The model was first developed when Kuhlthau studied high school
students’ information search process and then verified and validated through other studies.
She presented a theoretical framework for the ISP model, which drew from three (3)
theories: George Kelly’s Personal Construct Theory, John Dewey’s Reflecting Thinking
Theory and Jerome Brunner’s Schema Theory (Kuhlthau, 1993). Several qualitative and
quantitative methods of data collection were employed in these five (5) studies including:
“journals, search logs, short written statements, case studies, conceptual maps, teachers’
assessments, and perception questionnaires” (Cheng, 2004, p. 19). Additionally, some
statistical methods like Chi-Square, t-test, and ANOVA were applied in order to analyze
the collected data.
Kuhlthau first discerned the anxiety and frustration of high school students as a school
librarian, when students were searching for information in the school library. From her
observation grew the belief that some of the students were uncomfortable and frustrated in
the library. “However, she was not convinced that this anxiety was related to the library as
a place. Instead, she wondered if it was a natural part of the process of information seeking”
(Van Kampen, 2003, p. 33; Kuhlthau, 1988b). In order to develop the Information Search
Process (ISP) model, Kuhlthau (1983) studied the search process of twenty-six (26) high
school students over a period of one (1) academic year as they worked on two (2) research
papers. The study subjects were required to write their feelings, actions, and thoughts
during their library search process. They were also asked to keep search logs about
resources they used and procedures they passed for finding required information resources.
In addition, the students were given a thirty (30)-item, five (5)-point Likert type
questionnaire to examine their perceptions of information search process. Additionally,

77
interviews were conducted with six (6) out of twenty-six (26) students on several occasions
to verify and explain the collected data. The data were analyzed for patterns of common
experiences by the students in the information search process. As a result of this study,
Kuhlthau developed her six (6)-stage model of the Information Search Process (Kuhlthau,
1988a, p. 257).
After developing the Information Search Process (ISP) model, two (2) longitudinal studies
were conducted in order to validate the model: one used quantitative methods for gathering
data and statistical methods for analyzing data, and the other applied the qualitative
approach using case studies. The first study examined the perception of the same students
as the first study after four (4) years of college education (Kuhlthau, 1988a). Twenty (20)
of the original twenty-six (26) students participated in this study. The same questionnaire
was administered to the study subjects. The results of the study were compared with the
results of the first study and statistical significance was determined using a series of
independent sample t-tests. “Comparison of the participants when they were in high school
and after four (4) years of college revealed certain perceptions of more experienced
information users. The results revealed that the model of ISP held over time for this group
of students” (Kuhlthau, 1993, p. 65). Kuhlthau’s findings indicated that “perceptions of
Information Search Process became more like the model over time, particularly regarding
focus and process” (Kuhlthau, 1993, p. 77). In the second longitudinal study, four (4) out of
the six (6) original interview subjects were interviewed again in one (1) hour sessions after
four (4) years of college education (Kuhlthau, 1988a). Additionally, they were asked to
produce a conceptual map of their process of information seeking. The results of the study
were compared to the results of the first study which showed that “the model of the

78
Information Search Process (ISP) held over time for this group of students” (Kuhlthau,
1991, p. 364).
In the fourth study, the model of Information Search Process (ISP) was validated using a
larger sample of high school students (Kuhlthau, 1988c, p. 1). The total of one hundred
and forty-seven (147) high, middle, and low achieving high school students in six (6) high
schools participated in this study (p. 4). The study subjects were grouped as high, middle,
and low achievers according to their “scores on national standardized tests, grade point
average, and assignment to homogeneously grouped English classes” (p. 4, 5). A research
paper was assigned and process surveys were administered among students. The data from
forty (40) participants “identified as low achievers were incomplete and could not be
analyzed” (Kuhlthau, 1993, p. 55). The results of the study revealed that no significant
differences existed between thoughts, feelings, and actions of high and middle achiever
students.
The fifth study tried to validate the model of Information Search Process (ISP) among a
wider variety of information seekers. Three hundred and eighty-five (385) public library,
academic library and school library users in twenty-one (21) sites participated in this study
(Kuhlthau, 1990a, b). A revised version of the process survey which utilized in previous
studies was administered among study subjects. Also, the perception questionnaires
and flowcharts were utilized to measure participants’ behaviors at the beginning, the
middle, and the end of the information search process. The results of the study “validated
the model of ISP and proved that the model can be used to explain not only the students’
but also other types of populations’ information seeking process” (Cheng, 2004, p. 23). The
series of five (5) studies of library users’ information search process showed that their

79
“thoughts and feelings usually matched the thoughts and feelings described in the model.
However, the tasks identified by users did not match the tasks predicted by the model”
(Hazelwood, 1994, p. 16).
The model of the Information Search Process (ISP) describes users’ feelings (affective
domain), thoughts (cognitive domain), and actions (physical domain) at six (6) different
stages of information seeking process (Kuhlthau, 1999, p. 13). “The stages were named for
the main task undertaken to move on to the next stage: initiation, selection, exploration,
formulation, collection, and presentation” (Kuhlthau, 2007, p. 35). Throughout the stages,
users take different actions and manipulate various strategies, with their feelings changing
in correspondence with the evolution of thinking and the actions of seeking and using
sources (Li, 2006, p. 3). These six (6) stages “differentiate information searched for, ways
of searching and relevance assessments, while moving the seeker from the initial state of
information need to the goal state of resolution” (Hyldegard, 2006, p. 278).
Kuhlthau (1993) found that feelings of anxiety were at their highest at the beginning of the
search process when students suffered from confusion and lack of certainty. Students noted
at the first stage of task initiation that they became upset, suffered anxiety, and experienced
fear. Once they had selected their topics, “those feelings dissipated and the students
experienced greater confidence and a better sense of their courses of action” (Bowers,
2010, p. 26). Students again became confused when searching for information on their
topics and at this stage they often lost their senses of direction. Once students reached the
fourth stage of specific topic focus, their confidence returned and they regained their sense
of direction. Kuhlthau (1993) also found that “anxiety increased when the user was
unfamiliar with the sources and technologies utilized in the search process” (p. 40).
80
Ultimately, the users’ entire experiences, including their emotions and intellects,
“influenced their information seeking behaviors and the levels of anxiety encountered
during the information search process” (Bowers, 2010, p. 26).
During the first stage of Information Search Process, named initiation, a person “becomes
aware of lack of knowledge, information and understanding to solve a complex problem or
accomplish a project” (Fainburg, 2009, p. 459). Thoughts concentrate on the problem,
understanding the task and connecting the problem to existing knowledge and experience.
Actions during this stage involve seeking relevant information and discussing possible
topics and approaches with peers, mentors, instructors and professionals (Kuhlthau, 1993,
p. 44). Negative feelings like apprehension, uncertainty, confusion, and anxiety are
common at this stage of the ISP when individuals first become cognizant of their lack of
knowledge and understanding (Kuhlthau, 1993). Anxiety levels usually increase at the
beginning of the search process when a person needs information related to his/her
assignments or research.
The second stage of the Information Search Process model is topic selection. During this
phase, the goal is to identify the general topic area to be researched and the strategy to be
followed. Thoughts involve weighing the different option in light of personal experience
and interest, assignment requirements, the information available, and the amount of time
available. The consequence of selecting each option is predicted and the method that has
the greatest likelihood of success is selected. During this stage, actions include “consulting
with informal mediators, and making preliminary search of the library and information
resources,” (Kuhlthau, 1993, p. 45). Feelings of uncertainty, confusion and anxiety often
decrease after selection of the general topic has been made. However, when for any reason,

81
selection of the general topic is delayed or postponed, feeling of anxiety are likely to
intensify until a choice is maid.
At the exploration stage, the third stage of the Information Search Process, the individual’s
mission is to investigate information resources on the broad subject in consideration of
increase personal awareness and interest. “Thoughts surround becoming informed about the
general topic, seeking focus in information on the general topic to form a focus, identifying
several possible focuses, and inability to express precise information needed” (Kuhlthau,
1993, p. 47). At this stage an ability to express precisely what information is needed makes
communication awkward between the user and the system. Actions involve “locating
relevant information about a general topic, reading to become informed, taking notes on
facts and ideas, making bibliographic citations and linking new information to what is
already known” (Kuhlthau, 1993, p. 47). Feelings of confusion, uncertainty, doubt, and
anxiety usually increase during this stage of the ISP (Burdick, 1995, p. 33). According to
Kuhlthau (1988a), the exploration stage often is the most anxious producing stage in the
Information Search Process. The anxiety is experienced at this stage if the specific
information is not locates. Because “information found rarely is sufficiently compatible
with previous knowledge and information from different sources often appear to contradict
one another, library users may found this stage frustrating and threatening, resulting in
confusion, uncertainty and anxiety” (Onwuegbuzie, Jiao & Bostick, 2004, p. 60).
The fourth stage of Information Search Process is formulation. In this stage, the mission is
to find a viable focus from the information that emerges in the previous stage(s). Thoughts
involve identifying and choosing ideas contained in the information to develop a focused
perspective of the topic. Actions for choosing a focused topic are consulting about the

82
topic, writing thoughts, and analyzing notes for themes. Feelings of doubt, uncertainty and
anxiety are common at the beginning of the focus formulation. But, once the focus is
formed, interest in search and feelings of optimism, satisfaction and confidence in capacity
to conduct the search increases (Kuhlthau, 1993, p. 48). According to Kuhlthau (1993),
“focus formulation represents a turning point in the ISP because during this stage, feelings
become more positive, with anxiety levels decreasing as confidence increases alongside a
sence of clarity” (Onwuegbuzie, Jiao & Bostick, 2004, p. 60).
At the fifth stage of Information Search Process, named collection, the individual’s task is
to collect information related to the focused topic. At this stage, the interaction between the
library user and the information system is maximized. The following thoughts usually
experience in this stage: “seeking information to support the focus, defining and extending
the focus through information, gathering pertinent information and organizing information
in notes” (Kuhlthau, 1993, p. 50). Additionally, the common actions during this stage
include “using the library to collect information, requesting specific sources from the
librarian and taking detailed notes with bibliographic citations” (Kuhlthau, 1993, p. 50). If
the user has a clear focus at this stage, his/her anxiety and uncertainty will decrease and
feelings of confidence in ability to complete the task will increase. In contrast, “lack of
direction and focus lead to disorganization, frustration, and, consequently, elevated anxiety
levels” (Jiao & Onwuegbuzie, 2003, p. 162). Additionally, confidence continues to increase
and anxiety levels decrease as more information is extracted.
At the sixth stage of the Information Search Process, named presentation, the search
process becomes complete and the information seeker prepares to present the search results.
Thoughts which are typical in this stage are: “identifying the need for any additional

83
information, organizing a synthesis of the topic, weighing the completeness of the
information available, the time and energy needed to complete the process and the
likelihood of success of additional energy expended” (Onwuegbuzie, Jiao & Bostick, 2004,
p. 61). Actions center on organizing or checking information in preparation for
presentation. This stage is usually characterized by feelings of comfort and satisfaction
and substantial anxiety and frustration decrease “if the search has been successful and
feelings of high anxiety levels if the search has not been successful” (Jiao & Onwuegbuzie,
2003, p. 162).
According to the Kuhlthau’s Information Search Process, anxiety can occur at any one of
the six (6) stages of the ISP. However, “episodes of anxiety tend to be more prevalent in the
early stages of the ISP, although anxiety levels can be more pervasive and debilitative at the
later stages of the process if the search terminates unsatisfactorily or is abandoned”
(Onwuegbuzie, Jiao & Bostick, 2004, p. 61). Keefer (1993) indicated that in the first three
(3) stages of the information search process, students experienced more feelings of
apprehension, anxiety, and even fear. However, when they focus on specific topic, they
show more positive mood. But, not all students experienced decrease in their original
anxiety. Some students could not reach the focus stage and they continued to experience
anxiety all the way through their assignments.
Numerous studies has been carried out using the Information Search Process (ISP)
including Branch (2001), Todd (2006), Nahl and Tenopir (1996), Swain (1996), Vakkari,
Pennanem and serola (2003), Hyldegard (2006; 2009), Kracker (2002), Kracker and Wang
(2002), Cheng (2004), Tenopir et al. (2008) and Loerke (1992). For instance, studies by
Fister (1992), Valentine (1993), Pitts (1995) and Swain (1996) directly and indirectly

84
supported the framework of Kuhlthau’s model of ISP and highlighted the importance of
teaching students about the research process. Selden (1999) pointed to the differences
between bachelor’s level students, doctoral level students and researchers’ information
seeking process. According to Harada (2005) elementary school students showed emotional
changes similar to the patterns in Kuhlthau’s Information Search Process model during
their research process. In another study, Swain (1996) validated the Kuhlthau’s ISP model
with college freshmen. Additionally Keefer (1993) indicated that Kuhlthau’s model was
based on the qualitative research that studies the cognitive processes, feelings, and attitudes
of students while they are working to complete their research papers.
2.9.2. Cognitive-Affective Stage Model of Library Anxiety
The Cognitive-Affective Stage Model of library anxiety was proposed by Onwuegbuzie,
Jiao and Bostick (2004). This model describes the thoughts and feelings of the students
before, during and after using the university library for research. At the library preparation
stage, library anxiety may experienced by students in different ways. There are some
dispositional, situational and environmental variables that come into account at this stage.
Dispositional variables like academic procrastination, study habits, perfectionism, self-
esteem, hope, self-concept and social interdependence may influence the library preparation
stage and heighten levels of library anxiety (Onwuegbuzie, Jiao & Bostick, 2004).
Environmental antecedents that play an important role at this stage include student’s
employment status, age and year of study (Onwuegbuzie, Jiao & Bostick, 2004)
Additionally, situational antecedents that may affect the library preparation stage include
learning styles (i.e., noise preference, responsibility, persistence orientation, visual
orientation, tactile orientation, kinesthetic orientation, multiple perceptual orientation,

85
mobility preference, structure, peer orientation, morning preference, afternoon preference
and evening preference) (Onwuegbuzie, Jiao & Bostick, 2004).
The second stage of the Cognitive-Affective Stage Model of library anxiety, library use
stage, represents the time during which the student completes the task. It encompasses the
last four (4) stages of the Kuhlthau’s Information Search Process (ISP) model, including
prefocus exploration, focus formulation, information collection and search closure. The
anxiety experienced at any of these four (4) stages can prevent the completion of library
task and is carried to other stages of the search process. Library anxiety experienced at the
third stage of the model, library reflection stage, occurs depending on student’s attitude.
Students with high anxiety levels tend to blame themselves for being not successful in their
research process. The research shows that success and failure of library task has a greater
impact on the later performance of high anxious students than on the achievement of those
with low library anxiety. The failure at this stage increases worry, emotionality and low
performance of these students further. These three (3) stages of the Cognitive-Affective
Stage Model of library anxiety are cyclic in nature. Thus, a student may go through many
cycles especially when the task is complex (Onwuegbuzie, Jiao & Bostick, 2004).
2.9.3. The Information Literacy Process (ILP) Model of Library Anxiety
According to the ILP model of library anxiety, library anxiety interferes with information
literacy on three (3) distinct levels include input, processing and output stages. At the input
stage, library anxiety occurs when user encounters the target stimulus or information. At
this stage, the anxiety exhibits the efficient preprocessing of the new information. The
anxiety level experienced by user at this stage depends on his ability to recognize, attend to,
concentrate on and encode on external stimuli. Library anxious users with “high levels of

86
anxiety at this phase often attend more to task-irrelevant information and material, thereby
minimizing the capacity to receive input” (Onwuegbuzie, Jiao & Bostick, 2004, p. 71). The
second stage of the ILP model, processing stage, describes the application of new
understanding to the task. The user may “understand the new information but not be unable
to apply the new knowledge to a specific problem” (Onwuegbuzie, Jiao & Bostick, 2004, p.
72). Levels of anxiety experienced by users at this stage of the ILP model “appears to
depend on the complexity of the information extracted, the extent to which memory is
needed, and the degree to which the material is organized in a way that is compatible with
the users learning style” (Onwuegbuzie, Jiao & Bostick, 2004, p. 71-72). At the output
stage, the third stage of the ILP model of library anxiety, library anxiety involves the
uneasiness experienced when users are required to demonstrate their ability to produce
previously learned material. Library anxiety which experienced during the output stage
“might hinder users; ability to present or to use the information” (Onwuegbuzie, Jiao &
Bostick, 2004, p. 72).
2.9.4. Anxiety-Expectation Mediation (AEM) Model of Library Anxiety
Jiao and Onwuegbuzie (2002) propose the Anxiety-Expectation Mediation model of library
anxiety. This model contains variables which are related to the information seeking
performance, as measured by students’ scores on their research proposals. According to this
model, “library anxiety and self-perception serve as factors that mediate the relationship
between performance in writing a research proposal and other cognitive, personality and
demographic variables” including age, grade point average, learning style, academic
procrastination, and self-perception (Jiao & Onwuegbuzie, 2002, p. 2). As shown in figure
2.1 below, the results of the path analysis revealed a direct (positive) path from self-

87
perception to research performance. Additionally, a direct (negative) relationship found
between library anxiety and research performance as well (Onwuegbuzie & Jiao, 2004).
Figure 2.1: Anxiety-Expectation Mediation model of library anxiety
In a follow up study, Onwuegbuzie and Jiao (2004) examined the Anxiety-Expectation
Mediation (AEM) model of library anxiety among two hundred and twenty-five (225)
postgraduate students at a mid-southern university in the United States (P. 41, 46). The
study participants were asked to complete the following seven (7) different instruments: the
“Library Anxiety Scale (Bostick, 1992)”, the “Self-Perception Profile for College Students
(Neeman & Harter, 1986)”, the “Hope Scale (Snyder et al., 1991)”, the “Procrastination

88
Assessment Scale for Students (Solomon & Rothblum, 1984)”, the “Multidimensional
Perfectionism Scale (Hewitt & Flett, 1991)”, the “Productivity Environmental Preference
Survey (Dun, Dun & Price, 1991)”, the “Background Demographic Form (Onwuegbuzie &
Jiao, 2004)” (p. 17). The results of the study reported a negative relationship between the
student’s academic performance and their library anxiety. Moreover, “library anxiety was
found to mediate the relationships between research performance and the following
variables: age, grade point average, learning style, academic procrastination and self
perception” (p. 41). In sum, the AEM model of library anxiety indicated that “ library
anxiety and self-perception serve as factors that mediate the relationship between
performance in writing a research proposal and other cognitive, personality, and
demographic variables” (Onwuegbuzie, Jiao & Bostick, 2004).
2.10. Reduction of Anxiety
There are number of studies which investigating library anxiety prevention and decrease
through information literacy instruction. Mellon (1986b) had designed a library instruction
session based on her findings about students’ anxiety. She stated that acknowledging the
library and its legitimacy and then providing successful experiences to counteract anxiety is
the most effective method of treatment. In the fifty (50) minute session, which was
incorporated in the composition faculty, she noticed that a considerable reduction of library
anxiety occurred as a result of increased interaction between librarian and user, adding that
she discovered how important it was from the students’ standpoint of view. Therefore, she
redesigned the session and maximized this interaction. She also realized that providing
information about library anxiety and assuring students that it is a common phenomenon
was a reasonable contribution in decreasing library anxiety. She further notified that all this
was applied in line with teaching search strategies and library use. Mellon’s (1986b) study

89
was very important in providing an understanding and reflection of reality from the user’s
point of view in the areas of library anxiety and library instruction.
Mohundro (1999) studied the effectiveness of bibliographic instruction courses and library
tours on reducing library anxiety among General Educational Development (GED) students
at a community college in south Texas. Data were collected from fifty-three (53) adult
students who completed the “Library Anxiety Scale (Bostick, 1992)” as the pre-test and
post-test instrument (p. 39). The participants who placed in two (2) experimental groups
received bibliographic instruction courses and library tours as treatment while students in
the control group used the library without any instruction. The results of the study revealed
that no significant differences existed in library anxiety on the pre-test among experimental
and control groups. According to the results, those students who received bibliographic
instructions as treatment, reported lower level of library anxiety in post-test than did in pre-
test, but not in a statistically significant level. In contrast, student who participated in
library tours showed statistically significant reduction in levels of library anxiety in post-
test. It was concluded that library tours conducted by librarians were more effective
treatment than library instructions on reducing library anxiety among adult students. The
researcher concluded that “although this study did not show that bibliographic instruction
lowered library anxiety in a statistically significant manner; skill in obtaining information is
still a necessity for functioning effectively in this age dominated by information” (p. 60).
Cleveland (2001) investigated what effects computer-based library tutorial and traditional
bibliographic instruction has on library anxiety of two hundred and thirty-eight (238) first
year students at the University of North Carolina (p. 10). For this purpose, students in the
experimental group surveyed before and after treatment (computer-based library tutorial

90
and traditional bibliographic instruction) using the “Library Anxiety Scale (Bostick, 1992)”
and they were examined in comparison to the control group which did not receive any kind
of treatment (p. 14). The results showed that students who received any type of treatment
tended to experience lower degree of library anxiety compared to the control group, who
did not participate in either bibliographic instruction or complete a computer-based tutorial.
Furthermore, findings indicated that first year students who enrolled in a 30-40 minute
bibliographic instruction course reported statistically significantly lower levels of library
anxiety than did their counterparts who did not participate in this course, even after
controlling for previous library experience and prior knowledge of the library. Moreover,
traditional bibliographic instruction was found to be more effective in decreasing library
anxiety compare to the computer-based tutorial associated with barriers with staff as well as
affective barriers dimensions.
Utilizing Kuhlthau’s Information Search Process Kracker (2002) and Kracker and Wang
(2002) designed two (2) studies in which students received a thirty (30)-minute orientation
based on the ISP model to determine if the instruction decreased students’ anxiety during
the search process using qualitative and quantitative methods. According to the results,
fifty-nine percent (59%) of students expressed feelings of anxiety and fear when they were
conducting research process. The researchers discovered that emotions related to anxiety
and uncertainty was mentioned more frequently than positive emotions related to
confidence and positive perceptions of the process. The results of the study revealed that
“Kuhlthau’s model presented in a thirty (30)-minute format can reduce the anxiety that is
often associated with research paper assignments for novice researchers” (Kracker, 2002, p.
291). Also Kracker (2002) and Kracker and Wang (2002) found a correlation between the
91
affective experiences and the cognitive activities of the model of Information Search
Process.
Van Scoyoc (2003) investigated whether library anxiety declined with traditional library
instruction sessions as well as computer-based instruction tutorials (p. 329). Two hundred
and thirty-eight (238) first year students were divided into two (2) experimental groups as
well as a control group who surveyed using the “library Anxiety Scale (Bostick, 1992)” as a
pre-test and post-test instrument (p. 333). Students in the control group did not receive any
treatment between the pre- and posttest, while students in two (2) different experimental
groups received traditional library instruction or computer-based tutorials. Findings of the
study indicated that those students who participated in face-to-face bibliographic instruction
sessions reported statistically significantly lower levels of library anxiety compared to the
control group who did not receive either face-to-face or computer-based instruction;
however, the same conclusion could not be declared for those students who received
computer-based instruction tutorials. In particular, those students who received face-to-face
traditional library instruction had significantly lower library anxiety levels pertaining to
barriers with library staff than those in computer-based instruction group. The researcher
concluded that traditional library instruction was more effective method in decreasing
freshmen’s library anxiety than computer-based tutorials.
Battle (2004) studied the effect of the instruction of Kuhlthau’s Information Seeking
Process (ISP) model on reducing library anxiety. The “Speilberger’s State-Trait Anxiety
Inventory (Spielberger, 1970)”, the “Library Anxiety Scale (Bostick, 1992)”, and the
“Demographic Information Form (Battle, 2004)” were completed by fifty-five (55)
international students in both pre- and post-tests (p. 53). Furthermore, in preparation for

92
treatment, the experimental group was given four (4) information literacy instruction
sessions based on Information Seeking Process (ISP) model, while the control group used
the library resources for doing class assignments without receiving any instruction. The
results revealed that no significant differences were found in library anxiety on the pre-test
between experimental and control groups. However, experimental group revealed
statistically significantly lower levels of anxiety compared with the control group on the
post-test. The results of the analysis ascertained that information literacy instruction was
associated with reducing general anxiety state and library anxiety among international
students when given as assignment using library resources.
Brown, Weingart, Johnson and Dance (2004) investigated the effectiveness of library
orientation tours on reducing library anxiety among one thousand and twenty-seven (1027)
freshmen at the Utah State University (p. 394). A modified version of the “Library Anxiety
Scale (Bostick, 1992)” consisted of thirty five (35) statements used as pre-test and post-test
instruments (p. 397). According to the results, no significant correlation was found in pre-
test between both control and experimental groups. However, those in the experimental
group who were enrolled in library orientation sessions reported to have experienced
statistically significantly “lower level of library anxiety in post-test than did their
counterparts in the control group who did not participate in orientation tours” (p. 394). It
was concluded that library orientation sessions were effective in reducing library anxiety
among first year students.
Nicholas, Rudowsky and Valencia (2007) studied the effectiveness of three (3) different
library instruction methods (online tutorial instruction, group library instruction and one-
on-one instruction) on reducing library anxiety to determine the most beneficial method (p.
93
288). Ninety-four (94) students at the Slippery Rock University of Pennsylvania were given
a modified version of the “Library Anxiety Scale (Bostick, 1992)” include forty-six (46)
statements in both pre-test and post-test. Findings of the study indicated that group library
instruction was the most effective approach to minimize library anxiety, followed by one-
on-one instruction and online tutorial instruction. This result is consistent with Cleveland’s
(2001) finding that “the library staff-led bibliographic instruction is more effective in
reducing students’ overall library anxiety than computer-based tutorial” (Cleveland, 2001,
p. 36). Apparently, all three (3) instructional treatments were found to be helpful in
reducing library anxiety among university students.
In another study and in order to find the most appropriate treatment method of library
anxiety, Malvasi, Rudosky and Valencia (2009) undertook the study to test the
effectiveness of four (4) different instructional methods namely, group library instruction,
online library tutorial, one-on-one library instruction and group library instruction followed
by online tutorial in reducing library anxiety among first year students. The “library anxiety
Scale (Bostick, 1992)” was completed by participants in both pre-test and post-test.
Findings demonstrated that first-year students in any of four (4) experimental groups who
received treatment reported to have experienced lower levels of anxiety in post-test than did
those in the control group who did not get any treatment during the study. The researchers
pointed out that a traditional group library instruction reduced library anxiety more than
other types of library instruction. This finding supported the results of the studies
conducted by Cleveland (2001) and Nicholas, Rudowsky and Valencia (2007).
A variety of library and information seeking anxiety intervention methods and procedures
have been identified by previous studies. As barriers with library staff and librarian is the

94
largest of the five (5) sub-scale of the “Library Anxiety Scale (Bostick, 1992)”, there is
general agreement among those using this instrument that student’s perceptions of library
staff are a major part of student’s overall anxiety. As a result, many recommendations
regarding reduction of this dimension of anxiety were provided in the literature. Because
many library users perceive asking for help as a failure (Mellon, 1986a; Keefer, 1993;
Kuhlthau, 1993), “not only should librarians make themselves readily available to users,
but also encourage them to ask questions, while taking considerable note care not to
suggest inadvertently that the answer to the question is obvious” (Battle, 2004, p. 104).
Additionally, some studies stated that the acknowledgment of the anxiety by library staff as
well as positive help and encouragement for the users should play an important role in
lessening their anxiety (Mellon, 1986a; Ben Omran, 2001). Moreover, “defining the role of
the librarian and make it clear to the users raises the latter’s expectations of the librarians”
and encourages them to ask for help (Ben Omran, 2001, p. 23). Looking for and
approaching users who are experiencing difficulties and offering them assistance is another
way to reduce library user’s anxiety (Jiao & Onwuegbuzie, 1997a; Ben Omran, 2001).
Moreover, considering the high anxiety levels among international students, it is suggested
that hiring librarians who “speak more than one language or even multilingual students
would help reduce the anxiety of non-English speaking users and encourage them to
approach librarians for help” (Ben Omran, 2001, p. 24; Jiao & Onwuegbuzie, 1997a). In
sum, the body of the literature indicates that, in order to reduce feelings of anxiety and
frustration experienced by many students in library environment or during the information
seeking process, librarians and library staff “should acknowledge these feelings as
legitimate and then attempt to lessen feelings of inadequacy, confusion and failure by

95
providing positive experiences to counteract the anxiety (Jiao, Onwuegbuzie &
Lichtenstein, 1996, p. 160; Mellon, 1986a, 1988; Zahner, 1993).
One facet of library anxiety results from the perceived threat is the library’s physical
environment. In particular, the library building may intimidate potential users duo to its
size, complexity and ambiguity (Onwuegbuzie, Jiao & Bostick, 2004). As a result, some
recommendations regarding this dimension of anxiety were provided in the literature.
Providing signs and graphics for users who need direction to locate the information
resources or services (Onwuegbuzie, Jiao & Bostick, 2004), comfortable arrangement of
the library’s interior space, including the location of its furniture, stacks, and equipments
(Jiao & Onwuegbuzie, 1997b), providing information brochure or handout about library’s
building (Carlile, 2007), using library furniture in suitable size and shape (Onwuegbuzie,
Jiao & Bostick, 2004), providing safe and secure environment in the library (Ben Omran,
2001; Cleveland, 2004; Carlile, 2007), using mentor and peer tutoring (Keefer, 1993),
creating a pleasant and comfortable study space for users (Onwuegbuzie, Jiao & Bostick,
2004), providing orientation programs, library tours, open houses, self-guided tour using
printed information or interactive multimedia virtual tours to get users familiar with
library’s physical environment (Onwuegbuzie, Jiao & Bostick, 2004; Abusin & Zainab,
2010), providing parking lot for library users (Onwuegbuzie, 1997a), controlling the noise
level in the library (Ben Omran, 2001; Abusin & Zainab, 2010), and providing sufficient
lighting and pleasant temperature in the library environment (Onwuegbuzie, Jiao &
Bostick, 2004) proposed by previous studies to decrease user’s anxiety during library
research.

96
In another study, Jiao, Onwuegbuzie and Daley (1997a) suggested that librarians and
library staff monitor library equipment that is being used by users and approach any student
who appears to be having trouble” (Battle, 2004). Moreover, regarding anxiety associated
with library resources and services, providing “individual information services, efficient
document delivery systems and mediated reference assistance as well as teaching
information retrieval skills, remote access procedures and information seeking and research
process” (Onwuegbuzie, Jiao and Bostick, 2004, p. 273) were found to be helpful in
reducing library and information seeking anxiety among university students.
2.11. Summary of the Chapter
The third chapter of the study reviewed and summarized the literature regarding the anxiety
experienced by students during the information seeking in libraries and information
systems. This chapter was divided into the following sections: investigating anxiety among
different populations, sources of anxiety, negative effect of anxiety, characteristics of
anxious students, relationship to other academic anxieties, antecedents of anxiety,
development and validation of instrument, theoretical models related to library anxiety and
reduction of anxiety. The review of the literature revealed that, to date, no valid and reliable
instrument has been developed to measure levels of information seeking anxiety among
postgraduate students. Also, no previous study has investigated this phenomenon in a
Malaysian university environment. Accordingly, the present study is conducted in order to
develop and validate the Information Seeking Anxiety Scale (ISAS) as well as investigate
this phenomenon in a Malaysian university. The next chapter deals with the methodology
of the research.

97
CHAPTER THREE
RESEARCH METHODS AND PROCEDURES
3.1. Introduction
The review of the literature presented in the second chapter of the thesis supported the need
for a valid and reliable instrument that measures postgraduate students’ anxiety during the
information seeking process. As a result, the main purpose of this study was to develop and
validate the Information Seeking Anxiety Scale (ISAS). In this chapter, the procedures
followed for development and validation of the Information Seeking Anxiety Scale (ISAS)
are explained. Moreover, the research methodology, research population and sample,
sampling technique, data collection procedures, and data analysis of the main study are
discussed in detail.
3.2. Development and Validation of the Information Seeking Anxiety Scale
A non-experimental research design was incorporated in this study to determine whether a
valid and reliable instrument could be developed and validated to measure the information
seeking anxiety construct among postgraduate students. The research to develop and
validate the Information Seeking Anxiety Scale (ISAS) took place in some empirical
phases: develop a list of key components, send the list of key components to a panel of
experts for validation, examine the responses and edit the list of key components, develop a
list of statements according to the list of key components, send the list of statements to the
panel of experts for validation, examine the responses and edit the statements, develop a
pilot instrument, send the pilot instrument to the panel of experts for content validity,

98
distribute the pilot instrument among students for face validity, conduct the first pilot study,
analyze the results, conduct the second pilot study, test for construct validity, and test for
internal consistency (See Figure 3.1). It should be mentioned that in order to validate the
newly developed scale, four hundred (400) postgraduate students in different areas of study
participated in two (2) pilot studies which were carried out during January to March 2011 at
a research-intensive university in Kuala Lumpur, Malaysia. The process of development
and validation of the Information Seeking Anxiety Scale (ISAS) are detailed in the
following sections.

99
Figure 3.1: Procedures of the Development and Validation of the Scale

100
3.2.1. Development of a List of Key Components
The first step in designing a new instrument involved the development of a list of key
components concerning the construct of information seeking anxiety. For this purpose,
various sources were utilized to elicit initial items for the questionnaire development as
well as generate a list of potential key components considered relevant to the construct of
information seeking anxiety:
a) Extensive review of the literature in the areas of library anxiety, library research anxiety,
computer anxiety, Internet anxiety, information anxiety, information seeking process,
academic-related anxiety, and other related areas was conducted to identify factors reported
to associate with information seeking anxiety. Knowledge of the studies which were
conducted in the area of research, has allowed the researcher to decide how the study could
potentially build on existing works in the field;
b) Review of existing instruments in aforementioned constructs was also conducted. Some
of these questionnaires which have been used in previous studies including: the “State-
Trait Anxiety Inventory” (Spielberger, 1970), the “Library Anxiety Scale” (Bostick, 1992),
the “Multidimensional Library Anxiety Scale” (Van Kampen, 2003), the “Computer
Anxiety Scale” (Loyd & Gressard, 1984), the “Information Seeking Process Inventory”
(Kuhlthau, 1991), the “Jacobsen’s Library Anxiety Inventory” (Jacobsen, 1991), the
“Hebrew-Library Anxiety Scale” (Shoham & Mizrachi, 2001), the “Kuwaiti-Library
Anxiety Scale” (Anwar, Al-Kandari & Al-Qallaf, 2004), the “Malay-Library Anxiety
Scale” (Noor & Ansari, 2010), the “Polish-Library Anxiety Scale” (Swigon, 2011) and the
“Persian-Multidimensional Library Anxiety Scale” (Erfanmanesh, 2011);
c) Elicitation study through preliminary interview with ten (10) postgraduate students in
different areas of study was also conducted at the research-intensive university over two (2)
weeks period. These students were interviewed to understand how they search for research-

101
related information and the process they go through as well as to identify what made them
frustrated and anxious in the information seeking process. The length of interviews varied
from fifteen (15) to thirty (30) minutes. All of the interviews were recorded using a digital
voice recorder and were later transcribed to identify potential key components. Interviews
with study subjects helped the researcher to identify some componrnts related to the
construct of information seeking anxiety like comfort with library’s website, language of
information resources, limitation of indormation resources, comfort with kibrary services,
lack of support by faculty members and information search skills.
d) Feedback from the Library and Information Science (LIS) faculty members at the
university were also solicited in the development of the list of potential key components.
As a result, a pool of ninety-four (94) potential key components concerning the information
seeking anxiety construct was formulated by the researcher (See Appendix B). These key
components were categorized into four (4) main groups, namely, comfort with information
resources during information seeking, comfort with computers and the Internet during
information seeking, comfort with libraries during information seeking, and comfort with
the process of information seeking.
3.2.2. Sending out the List of Key Components to a Panel of Experts for Validation
After developing an initial list of potential key components, the list was sent to a panel of
experts for validation. Sixteen (16) panelists in the field of Library and Information Science
and Psychology from the United States of America (nine experts), Malaysia (three experts),
South Korea (one expert), and Iran (three experts) were selected to participate in different
stages of the study. The criterion for selection of the judges included their expertise,
publications and dissertation supervision in the area of academic-related anxiety (e.g.
library anxiety, Internet anxiety and computer anxiety). Of the sixteen (16) experts, thirteen

102
(13) are doctoral degree holders who are either faculty members or librarians and three (3)
are master degree holders. Additionally, twelve (12) experts were female with the
remaining five (5) experts being male (See Appendix A).
All experts were contacted personally by e-mail and were asked to participate in the
study for the purpose of giving their comments and validating the scale, of which fourteen
(14) of them accepted. The list of potential key components was then sent to them to elicit
their expert opinions and comments on each key component. Also, a cover letter, describing
the purpose of the study was provided, as well as a content validity assessment form. The
experts were given two (2) weeks to respond. Two (2) weeks after initial contact, the
researcher sent out a reminder message to experts who had yet to respond and requested
them to reply as soon as possible. A thank you message was also sent to experts who have
returned the list of key components with their comments.
3.2.3. Examining the Responses and Editing the List of Key Components
This stage analyzed the expert’s responses and comments deductively based on the
conceptual framework of the research and available literature in the area of study. The
researcher elicited the items using deductive content analysis through working with the pre-
defined four (4) categories. Content analysis is defined as “a technique for examining
information, or content, in written or symbolic material” (Neuman, 1997, p.31) which can
be best utilized for open-ended questionnaire (Holsti, 1969) like in present study. Using this
method, responses which were received from ten (10) experts out of fourteen (14) analyzed.
Any key component that was eliminated by more than one (1) expert was removed from the
list. Also, any new component that was suggested by at least one (1) expert was added to
other potential components. Based upon the expert’s comments, sixty-five (65) out of

103
ninety-four (94) components were approved, while twenty-nine (29) components were
omitted, five (5) new components were added, and eight (8) components were reworded to
increase clarity (See Table 3.1). The list of key components concerning the information
seeking anxiety was then given to the dissertation committee for approval. As a result, a
revised list of key components was developed, which came to a total of seventy (70) items
(See Appendix C).
Table 3.1: Key Components Revisions by the Panel of Experts
Key components Items
Original key components sent to experts 94
Key components approved 65
Key components omitted 29
Key components added 5
Key components reworded 8
Total approved key components 70
3.2.4. Development of a List of Statements According to the List of Key Components
In the next stage of the study and after the list of seventy (70) key components had been
examined and edited by the panel of experts, statements were written under each of these
components. To ensure that the final instrument was based on a comprehensive item pool, a
list of one hundred and fifty-four (154) statements was created based on the list of seventy
(70) key components (See Appendix D). The large number of primary statements insured
that an adequate number would be retained after factor analysis. Most of the words used to
describe anxiety or an absence of anxiety were based on “Spielberger’s (1970) general
measure of State Anxiety (STAI),” “Bostick’s (1992) Library Anxiety Scale (LAS)” and
“Van Kampen’s (2003) Multidimensional Library Anxiety Scale (MLAS)”. All key
components were addressed in a minimum of one (1) and maximum of four (4) statements.

104
Care was taken to ensure that each statement was brief, simple, clear, and addressed a
particular issue.
3.2.5. Sending out the List of Statements to the Panel of Experts for Validation
The list of statements was submitted again to the same panel of fourteen (14) experts for
validation along with a cover letter as well as a content validity assessment form. They
were given three (3) weeks to respond to the list of statements and return their comments,
modifications and suggestions. Three (3) weeks after initial contact, the researcher sent out
a reminder message to experts who had yet to respond and requested them to reply as soon
as possible. A thank you message was also sent to experts who have returned the list of
statements with their comments. Once results of the experts’ reviews were obtained, the
researcher began the process of item clarification and elimination.
3.2.6. Examination of the Responses and Edition of the Statements/ Development of a
Pilot Instrument
Responses were received from eight (8) experts out of fourteen (14) which incorporated
several changes and modifications. Any statement which was eliminated by more than one
(1) expert was removed from the list. Also, each new item that was suggested by at least
one (1) expert was added to the list of statements. Accordingly, ninety-one (91) statements
were retained in the list, sixty-three (63) items were removed, and two (2) new statements
were added, resulting in a total of ninety-three (93) items (Appendix E). Additionally,
twenty-five (25) items were slightly reworded for increasing clarity (See Table 3.2). The
list of statement was then edited based on feedbacks from expert judges. Accordingly,
wording changes were adopted, similar items were combined, and items rated as irrelevant

105
were deleted. A final set of ninety-three (93) statements were then presented to the
dissertation committee for their approval in December 2010.
Table 3.2: Statements Revisions by the Panel of Experts
Statements Items
Original statements sent to experts 154
Statements approved 91
Statements omitted 64
Statements added 2
Statements reworded 25
Total approved statements 93
Following revisions to the list of statements, a pilot instrument was developed in order to
conduct pilot studies and to determine the potential validity of the instrument (See
Appendix F). The pilot instrument consisted of ninety-three (93) statements, scored on a
“5-point Likert-type scale” ranging from one (1) to five (5) (1=strongly disagree,
2=disagree, 3=undecided, 4=agree, 5=strongly agree). The statements were both in positive
and negative forms and had at least one (1) statement addressing each key component that
was identified previously. Also, a demographic information form was generated
particularly for the current research to collect the primary demographic information of the
students. The following demographic information was collected using this form: age,
gender, major (Art, Humanities, and Social Sciences, Engineering, Medical Sciences, and
Pure Sciences), level of study (master or doctoral), year of study, nationality (Malaysian or
international), frequency of library use, frequency of internet use, and participation in
information literacy skills sessions.

106
3.2.7. Examination of the Content and Face Validity of the Instrument
Two (2) more steps were performed before the instrument was pilot tested (procedure 7 in
Figure 3.1). These steps included determination of the instrument’s content and face
validity. Content validity may be defined as “the extent to which elements of an assessment
instrument are relevant to and representative of the targeted construct for a particular
assessment purpose” which is an essential part of generating new instruments (Haynes,
Richard & Kubany, 1995). In regard to content validity, the researcher defined the concept
of the information seeking anxiety founded on Kuhlthau’s Information Search Process
(ISP) model, Mellon’s theory of library anxiety, and an extensive review of the literature.
Content validity was determined using consultation with expert evaluators, who verified the
identification of key components and related statements.
The panel of experts was requested again to review the pilot instrument and determine
whether or not the questionnaire will actually measure what the researcher think it will
measure. According to DeVellis (2003), one should enlist between six (6) to ten (10)
experts on the measure content to review items for a newly constructed test. At the current
study, seven (7) out of fourteen (14) experts evaluated the content validity of the instrument
and provided some recommendations. They confirmed that the statements of the instrument
appeared to measure the construct of information seeking anxiety. The experts also
signalled items that were unclear, indicated their understanding of the wording, and made
some suggestions to improve clarity of the instrument.
Additionally, fifteen (15) postgraduate students from different faculties at the university
were selected to evaluate the face validity of the pilot instrument. Face validity exists if
“the instrument appears to be reasonable in regard to its stated purpose” (Bowers, 2010, p.

107
45). Also, it pertains to whether the instrument appears valid to the examinees who take it
(Anastasi, 1998). The refinement of items based on the perspective of study participants
may improve response rates and enhance the validity of the data. Accordingly, these
students were informed that their participation and comments would help increase the face
validity of the instrument. After receiving feedback concerning the clarity, phrasing,
terminology, and readability of the statements from the students, the statements were
revised and the pilot instrument was finalized. Overall, the students reported that the
instrument was easy to understand and that the format was pleasant. Therefore, the
questionnaire found to have face validity as the content on items that make up the survey
seem to be appropriate for an instrument that purports to measure the information seeking
anxiety construct of postgraduate students in a Malaysian university.
3.2.8. The First Pilot Study
The first pilot study was conducted in January 2011 at the same research intensive
university in Kuala Lumpur, Malaysia. The aim of this pilot study was to evaluate the
readability and comprehension of the statements. This pilot study aided the researcher in
identifying statements in the instrument which needed modification as well as recognizing
any problems in the process of data collection. Participants were one hundred (100)
postgraduate students in different areas of study who were selected for the pilot study using
the convenience sampling method. The convenience sampling method is defined as “a non-
probability sampling procedure, involving selection of the most available subjects for
study” (Portney & Watkins, 2000, p. 742). The instrument was self-administered to each
participant. The students were informed that their participation was voluntary and that their
responses would be used only for the research. They were asked to respond the pilot
instrument which consisted of ninety-three (93) statements and return it to the researcher.

108
The pilot instrument was seven (7) pages long and took about twenty (20) minutes to
complete. A cover letter was also attached to the questionnaire, which described the aims of
the study, asked for cooperation, and provided some guidance for completing the
questionnaire. Some students sought clarifications of several statements in the instrument
that appeared to them to either overlap with other statements or were considered
ambiguous.
Of the one hundred (100) participants, fifty-seven (57%) were master’s level students and
forty-three (43%) were doctoral level students. In terms of gender, fifty-eight students
(58%) were female with the remaining forty-two students (42%) being male. International
students formed the majority of the sample (78%), while Malaysian students comprised
only twenty-two percent (22%) of the participants. The participants were from different
areas of study include engineering (39%), arts, humanities, social sciences and education
(28%), pure sciences (22%), and medical sciences (11%). Moreover, ages of the
participants ranged from twenty-three (23) years old to fifty-four (54) years old, with a
mean age of 30.5 years (SD=5.59). Participants were reported to use the university library
at a mean rate of 1.76 per week (SD=1.52). Additionally, the frequency of Internet use for
seeking information was reported to range from two (2) to seventy (70) hours per week
(Mean=20.8, SD=12.82). Finally, regarding the participation in information literacy skills
instruction sessions which organized by the university library, forty-two students (42%)
reported they have participated in at least one (1) session, while fifty-eight students (58%)
stated that they have not participated in any information literacy instruction session. The
distribution of demographic data is shown in Table 3.3 and 3.4.

109
Table 3.3: Demographic Information of the First Pilot Study Participants
Characteristic Frequency Percent
Gender
Female 58 58%
Male 42 42%
Total 100 100%
Level of study
Master 57 57%
Doctoral 43 43%
Total 100 100%
Nationality
Malaysian 22 22%
International 78 78%
Total 100 100%
Area of study
Engineering 39 39%
Arts, humanities, and social sciences 28 28%
Pure Sciences 22 22%
Medical Sciences 11 11%
Total 100 100%
Attendance in information literacy sessions
Yes 38 38%
No 62 62%
Total 100 100%
Table 3.4: Age, Frequency of Library Use and Frequency of Internet Use of the First Pilot
Study Participants
Characteristic M SD Range
Age (years) 30.5 5.59 23-54
Frequency of library use (times per week) 1.76 1.52 0-7
Frequency of Internet use (hours per week) 20.5 13.24 2-70
Upon completion of the pilot study, the returned questionnaires were reviewed for
completeness and usability and were coded for data analysis. Responses from three (3)
participants were excluded from the study because they did not complete the entire

110
questionnaire. After that, data were input into the Predictive Analysis Software (PASW) for
statistical analysis.
In an attempt to assess the quality of items and identify problematic statement, an
Exploratory Factor Analysis was performed. Exploratory Factor Analysis is an essential
part of psychometric testing and validation. Items may be considered problematic for a
number of reasons: “if items are poorly written which causes students to become confused
when responding to them, if they have information imbedded in them that may mislead
students, or if they represent a different content area than what is intended” (Popham &
Husek, 1969 as cited in O’Neil, 2005, p. 62). The purpose of the first factor analysis was to
identify statements that were not contributing to the explanation of variance in information
seeking anxiety construct.
Results of running an Exploratory Factor Analysis using principal component and varimax
rotation method yielded seven (7) factors which collectively explained 50.80% of the total
variance. The first factor accounted for 20.21% of the variance (eigenvalue=18.79), the
second factor explained 8.20% of the variance (eigenvalue=7.63), the third factor
represented 5.72% of the variance (eigenvalue=5.32), and the fourth factor accounted for
4.98% of the variance (eigenvalue=4.63). Factors five, six, and seven accounted for 4.44%,
4.03%, and 3.22% of the total variance respectively (eigenvalues=4.13, 3.74, and 3.00
respectively) (See Table 3.5, Appendix G). Items with factor loading less than 0.4 were
reviewed and re-paraphrased again. According to the literature, when factor analysis is used
for research, a minimum of two (2) runs will normally be required (Ho, 2000). It is not
unusual for a data set to “be subjected to a series of factor analysis and rotation before the
obtained factors can be considered clean and interpretable” (Colbeck, 2007, p. 5). As a

111
result, after consultation with the research committee, the decision was made to replicate
the pilot study with a larger sample of students. Consequently, the revised pilot instrument
consisted of ninety-three (93) statements was then utilized again in the second pilot study.
Table 3.5: Description of Factors in the First Pilot Study
Factor Eigenvalues % of Variance Cumulative %
1 18.79 20.21 20.21
2 7.63 8.20 28.41
3 5.32 5.72 34.13
4 4.63 4.98 39.11
5 4.13 4.44 43.55
6 3.74 4.03 47.58
7 3.00 3.22 50.80
3.2.9. The Second Pilot Study
The second pilot study was conducted during February and March 2011 at the same
university. The aim of this pilot study was to develop a final set of statements and validate
the Information Seeking Anxiety Scale (ISAS). Again, the pilot instrument consisted of
ninety-three (93) statements was completed by three hundred (300) postgraduate students
who were selected using the convenience sampling method. The respondents were
requested to indicate the extent to which they had experienced anxiety related to each
statement during the information search process on a 5-point Likert-type scale anchored by
1= strongly disagree and 5=strongly agree.
The study of the subject’s demographic information showed that females made up fifty-
nine percent (59%) of the sample with the remaining forty-one percent (41%) of the
respondents being male. Of the participants, sixty-eight percent (68%) were master’s level
students and thirty-two percent (32%) were doctoral level students. The majority of

112
subjects (70%) were international students, while only thirty percent (30%) were
Malaysian. Regarding the student’s area of specialization, twenty-nine percent (29%) were
studied in engineering and forty-two percent (42%) were in arts, humanities, and social
science disciplines. Additionally, twenty-four percent (24%) and five percent (5%) of
respondents were studied in pure sciences and medical sciences, respectively.
Ages of the participants ranged from twenty-two (22) to fifty-two (52) years old, with the
mean age being 29.49 (SD=5.54). The frequency of library use was reported to range from
zero (0) to seven (7) times per week (Mean=2.31, SD=1.61). Additionally, the frequency of
Internet use was reported to range from two (3) to eighty-five (85) hours per week, with the
mean Internet use being 21 hours and 10 minutes per week (SD=17.99). Finally, regarding
the participation in information literacy skills instruction sessions which organized by the
university library, one hundred and twenty-seven students (42%) reported that they have
participated in at least one (1) session, while one hundred and seventy-three students (58%)
reported that they have not attended in any information literacy session. The distribution of
demographic information is shown in Table 3.6 and 3.7.

113
Table 3.6: Demographic Information of the Second Pilot Study Participants
Characteristic Frequency Percent
Gender
Female 177 59%
Male 123 41%
Total 300 100%
Level of study
Master 204 68%
Doctoral 96 32%
Total 300 100%
Nationality
Malaysian 90 30%
International 210 70%
Total 300 100%
Area of study
Engineering 87 29%
Arts, humanities, and social sciences 126 42%
Pure Sciences 72 24%
Medical Sciences 15 5%
Total 300 100%
Attendance in information literacy sessions
Yes 127 42%
No 173 58%
Total 300 100%
Table 3.7: Age, Frequency of Library Use and Frequency of Internet Use of the Second
Pilot Study Participants
Characteristic M SD Range
Age (years) 29.49 5.54 22-52
Frequency of library use (times per week) 2.31 1.61 0-7
Frequency of Internet use (hours per week) 21.10 17.99 3-85
The returned questionnaires from the second pilot study were reviewed for incomplete or
missing information before being entered into the Predictive Analysis Software (PASW)
for data analysis. Thirteen (13) questionnaires were eliminated due to insufficient data,

114
leaving a final sample of two hundred and eighty-seven (287). Negatively worded
statements were reversed during data input so that all statements were scored in the same
direction.
3.2.10. Testing for Construct Validity and Internal Consistency
Validity determines whether an instrument “truly measures that which it is intended to
measure or how truthful the instrument’s results are” (Golafshani, 2003, p. 599). Construct
validity is “the extent to which a set of measured variables actually represent the theoretical
latent construct they are designed to measure” (Hair et al., 2006). Exploratory Factor
Analysis is a widely utilized and broadly applied statistical data reduction technique that is
employed as a part of the instrument development process to assess the instrument’s
construct validity. This analysis explores whether a set of Likert-type items can be clustered
clearly and meaningfully into small groups or factors. Exploratory Factor Analysis
represents “an analytic technique conducted in the early stages of the research process with
the goal of reducing a large set of variables into a smaller, interpretable set, based on the
observed relationship among the underlying variables” (Onwuegbuzie, Jiao & Bostick,
2004, p. 170)
Prior to conducting the Exploratory Factor Analysis, the “Kaise-Meyer-Olkin (KMO)
measure of sampling adequacy” and the “Bartlett’s Test of Sphericity” were performed to
examine whether the data set was suitable for factor analysis. The “KMO measure of
sampling adequacy is a statistic that indicates the proportion of variance in the variables
which is common variance” (Dinev & Hart, 2006, p. 53). The KMO varies between zero
(0) and one (1), with values greater than or equal to 0.60 are considered acceptable. In the
current study, the value was 0.904, which showed that the scale is suitable for applying

115
factor analysis. Additionally, the “Bartlett’s Test of Sphericity” was conducted to test the
overall significance of the correlation matrix. It tests whether the correlations among the
items are sufficiently high to indicate the existence of factors. The significance of the
Bartlett’s Test (chi-square=6849.087, df=1081, p=0.000) indicated that the items contained
adequate common variance to proceed with Exploratory Factor Analysis (See Table 3.8).
Table 3.8: Results of the KMO and Bartlett Tests
KMO measure of sampling adequacy Bartlett’s Test of Sphericity
Chi-square df Sig
0.904 6849.087 1081 0.000
Exploratory Factor Analysis was performed then, in order to assess the construct validity of
the instrument as well as to determine the appropriate number of factors as well as number
of statements grouping in each of these factors. “To produce meaningful distinctions
between the factors by analyzing only the shared variance between the variables and to
eliminate redundant or unclear items, the Principal Component Analysis method was
utilized” (Rogers, Creed & Searle, 2009, p. 8). Additionally, varimax rotation was selected
as the rotation techniques as it maximize the high loadings on a lesser number of variables
while minimizing the low loadings on other variables for that factor. Using this method,
fifty-three (53) statements with factor loading less than 0.4 were excluded, leaving forty
(40) items.
The initial analysis indicated ten (10) factors with eigenvalues greater than one (1). Using
examinations of eigenvalues and scree plot (See Figure 3.2), it was decided to retain only
seven (7) factors for further investigation. Accordingly, the items were forced into seven

116
(7) factors which accounted for 50.152% of the cumulative variance (See Table 3.9 and
Appendix H).
Table 3.9: Description of Factors in the Second Pilot Study
Factor Eigenvalues % of Variance Cumulative % No. of Items
1 11.479 24.423 24.423 10
2 3.438 7.315 31.739 7
3 2.421 5.150 36.889 4
4 1.965 4.181 41.070 6
5 1.612 3.430 44.500 5
6 1.347 2.865 47.365 3
7 1.310 2.787 50.152 5
Figure 3.2: Scree Plot of Running an Exploratory Factor Analysis
The first factor consisted of ten (10) items and accounted for 24.423% of the total variance
(eigenvalue=11.479). The items within this factor had factor loadings ranging from 0.441 to
0.718 (See Table 3.10). This factor was labeled as barriers associated with libraries. The

117
first sub-scale includes statements associated with library policies and procedures, library
services, library furniture, interaction with librarians, library temperature, library lighting
and library Online Public Access Catalogue (OPAC) and library website. Some examples
of the statements that loaded highly on this factor are: “the university library has too many
confusing policies and procedures for postgraduate students” (0.718), “the university
library does not offer enough information services for postgraduate students” (0.690) and
“The furniture in university library is uncomfortable and makes me feel uneasy” (0.657).
Table 3.10: Factor Loadings for “Barriers Associated with Libraries” Dimension
Number Item Factor Loading
1 The university library has too many confusing policies and procedures for postgraduate students (Item 60)
0.718
2 The university library does not offer enough information
services for postgraduate students (Item 63)
0.690
3 The furniture in university library is uncomfortable and makes me feel uneasy (Item 56)
0.657
4 The university librarian and library staff do not have time
to help me in searching for information resources (Item 61)
0.601
5 I am not comfortable using university library services for seeking information resources (Item 64)
0.585
6 When I use the university library Online Public Access
Catalogue (OPAC) for seeking information resources, I feel frustrated (Item 66)
0.552
7 My previous experiences with the university library affect
my feelings negatively when I use the university library for seeking information (Item 72)
0.466
8 The temperature in the university library is uncomfortable
that I cannot get my information seeking done (Item 58)
0.450
9 Inadequate library lighting makes me feel uneasy when
using the university library for seeking information
resources (Item 57)
0.444
10 I feel anxious when searching for information resources in the university library website (Item 65)
0.441

118
The second factor (eigenvalue=3.438), accounted for 7.315% of the total variance and was
comprised seven (7) items with factor loadings ranging from 0.452 to 0.698 (See Table
3.11). This factor was named as barriers associated with information resources. The
second factor represents some items associated with the quality of information resources,
relevance of information resources, novelty of information resources, familiarity with
information resources, locating information resources and information resources ease of
use. Statements which loaded highly on this factor are: “I feel anxious when the quality of
the retrieved information resources is unreliable” (0.698), “finding poor quality information
resources during the information seeking process make me frustrated” (0.647) and “I feel
anxious when resources found during the information seeking process are irrelevant”
(0.641).
Table 3.11: Factor Loadings for “Barriers Associated with Information Resources”
Dimension
Number Item Factor Loading
1 I feel anxious when the quality of the retrieved information resources is unreliable (Item 18)
0.698
2 Finding poor quality information resources during the
information seeking process make me frustrated (Item 19)
0.647
3 I feel anxious when resources found during the information seeking process are irrelevant (Item 21)
0.641
4 I feel anxious when what is retrieved during the
information seeking process is not up-to-date (Item 22)
0.573
5 I feel frustrated when information resources found during
the information seeking process are not easy to use (Item
16)
0.512
6 The unfamiliarity with the format of information
resources makes me anxious when searching for
information (Item 23)
0.460
7 Locating information resources make me anxious during the information seeking process (Item 12)
0.452

119
The third factor identified as barriers associated with computers, the Internet and
electronic resources and contained four (4) items. These items explained 5.150% of the
total variance and had an eigenvalue of 2.421. The items within the third factor had rotated
factor loadings between 0.442 and 0.752 (See Table 3.12). This sub-scale includes
statements related to the role of computers in the information seeking process as well as
using computers, the World Wide Web and electronic resources to find information related
to the postgraduate student’s research. Statements that loaded highly on this factor are: “I
feel uncomfortable using electronic resources when seeking information” (0.752), “I feel
anxious when searching the World Wide Web for information related to my research”
(0.719) and “When using computers to find information resources, I feel frustrated”
(0.590).
Table 3.12: Factor Loadings for “Barriers Associated Computers, the Internet and
Electronic Resources” Dimension
Number Item Factor Loading
1 I feel uncomfortable using electronic resources when seeking information (Item 26)
0.752
2 I feel anxious when searching the World Wide Web for
information related to my research (Item 43)
0.719
3 When using computers to find information resources, I feel frustrated (Item 28)
0.590
4 The computers do not play an important role in my
information seeking process (Item 31)
0.442
The fourth factor comprised six (6) items and explained only 4.181% of the variance. The
items within this factor exhibited factor loadings ranging from 0.421 to 0.745 (See Table
3.13) with eigenvalue of 1.965. This factor was named as technological barriers. The
fourth factor includes statements associated with rapid change in information technologies,
using different technologies to find information resources, damaging computers when

120
searching for information resources, mechanical or technological issues during the
information seeking process as well as slow internet connection. Some statements that
loaded highly on this factor are: “rapid changes in hardware and software technologies
make me anxious when searching for information resources” (0.745), “I feel anxious when
different computer technologies are required to retrieve the needed information resources”
(0.671) and “any mechanical or technological issues cause anxiety when searching for
information resources (0.639).
Table 3.13: Factor Loadings for “Technological Barriers” Dimension
Number Item Factor Loading
1 Rapid changes in hardware and software technologies
make me anxious when searching for information
resources (Item 38)
0.745
2 I feel anxious when different computer technologies are
required to retrieve the needed information resources
(Item 39)
0.671
3 Any mechanical or technological issues cause anxiety when searching for information resources (Item 37)
0.639
4 I feel fear of damaging computers or other machines when
using them for seeking information (Item 34)
0.572
5 I feel fear of making mistakes that cause system
malfunction during the information seeking process (Item
35)
0.433
6 Slow Internet connection makes me anxious when I
searching for information resources in the World Wide
Web (Item 48)
0.421
The fifth factor with eigenvalue of 1.612 consisted of five (5) items and accounted for
3.430% of the total variance. The items within this factor exhibited rotated factor loadings
ranged from 0.525 to 0.679 (See Table 3.14). This factor was named Affective barriers
which represented some statements associated with negative feelings during the
information seeking process. Statements that loaded highly on this factor are: “I feel

121
anxious and frustrated when searching for information resources related to my research”
(0.679), “I am embarrassed that I do not know how to find information resources for my
research” (0.653) and “I am worried about not being able to find necessary information
resources during the information seeking process” (0.582).
Table 3.14: Factor Loadings for “Affective Barriers” Dimension
Number Item Factor Loading
1 I feel anxious and frustrated when searching for information resources related to my research (Item 73)
0.679
2 I am embarrassed that I do not know how to find
information resources for my research (Item 75)
0.653
3 I am worried about not being able to find necessary
information resources during the information seeking
process (Item 76)
0.582
4 I feel anxious when I need information related to my research (Item 77)
0.570
5 I feel disappointed with the information found during the
information seeking process (Item 84)
0.525
The sixth factor (eigenvalue=1.347) explained only 2.865% of the variance and was
consisted of three (3) items. This factor was named barriers associated with topic
identification, and contained items with rotated factor loadings between 0.642 and 0.825
(See Table 3.15). The emphasis of this factor is on determining search terms, selecting a
general topic and narrowing down the general topic to formulate a focused topic in the
process of information seeking. Example of statements that loaded highly on this factor are:
“selecting a general topic is a difficult part of the information seeking process” (0.825), “I
feel anxious when selecting a search term for seeking information related to my research”
(0.792) and “narrowing the research topic down to develop a focused topic is not easy make
me frustrated” (0.642).

122
Table 3.15: Factor Loadings for “Barriers Associated with Topic Identification”
Dimension
Number Item Factor Loading
1 Selecting a general topic is a difficult part of the
information seeking process (Item 79)
0.825
2 I feel anxious when selecting a search term for seeking information related to my research (Item 80)
0.792
3 Narrowing the research topic down to develop a focused
topic is not easy make me frustrated (Item 82)
0.642
The seventh factor comprised five (5) items and explained only 2.787% of the variance.
The items within this factor exhibited rotated factor loadings ranging from 0.418 to 0.774
(See Table 3.16) with eigenvalue of 1.310. This factor was named as Access barriers. The
seventh factor includes statements associated with accessibility of the information
resources. Statements that loaded highly on this factor are: “restricted access to the required
full text resources make me anxious during the information seeking process” (0.774), “I
feel anxious when I know useful information resource, but I do not have access to them”
(0.684) and “I feel anxious when special equipments are required to have access to
information resources during the information seeking process” (0.613).

123
Table 3.16: Factor Loadings for “Access Barrier” Dimension
Number Item Factor Loading
1 Restricted access to the required full text resources make
me anxious during the information seeking process (Item
13)
0.774
2 I feel anxious when I know useful information resource, but I do not have access to them (Item 10)
0.684
3 I feel anxious when special equipments are required to
have access to information resources during the information seeking process (Item 14)
0.613
4 I cannot usually access information resources which I
need for my research (Item 11)
0.477
5 I feel anxious when special skills are required to access
information resources during the information seeking
process (Item 15)
0.418
In sum, the results of running an Exploratory Factor Analysis yielded seven (7) factors
which collectively explained 50.152% of the total variance of the information seeking
anxiety. Additionally, fifty-three (53) statements with factor loading less than 0.4 were
eliminated from the list of statements, leaving forty (40) items.
The next step was to determine the internal consistency of the Information Seeking Anxiety
Scale (ISAS) and its seven (7) sub-scales. To be psychometrically sound and stable, a scale
as well as its sub-scales must not only be valid but also internally reliable (Noor & Ansari,
2010). The internal consistency value reveals how items cohere or relate to each other.
Cronbach’s (1951) internal reliability coefficient alpha is the most commonly accepted
measure of internal consistency. This measure uses the average correlation among the items
and the number of items in the scale to create the coefficient. Cronbach’s alpha varies from
zero (0) to one (1) which higher values of alpha indicates higher reliability of the
instrument. Alpha coefficients greater than 0.8 “indicate high levels of internal consistency,
whereas values less than 0.7 suggest that the researcher should attempt deleting individual

124
items from the scales to examine whether internal consistency improves” (Vassilis et al.,
2010, p. 4). Coefficient of reliability was calculated for each of the seven (7) sub-scales, as
well as for the total scale to determine the level of internal consistency. The analysis of
internal consistency of the scale revealed that a few items had poor item-total correlations.
Therefore, these items were removed to increase alpha coefficient. This process was
repeated until there were no items to remove that would substantially increase the reliability
of the scale. The first sub-scale presented acceptable internal consistency for the reliability
analysis that yielded an alpha coefficient value of 0.832. Table seventeen (See Table 3.17)
contains the alpha coefficients that would be generated if each item of the factor were to be
deleted from the instrument. According to this table, dropping anyone of the ten (10) items
would not significantly increase the value of alpha coefficient higher than the present value
of 0.832. Therefore, ten (10) statements comprised valid and reliable measures of the first
sub-dimension.
Table 3.17: Internal Reliability Analysis for “Barriers Associated with Libraries”
Dimension
Number Item Alpha if item deleted
1 60 0.814
2 63 0.814
3 56 0.808
4 61 0.810
5 64 0.814
6 66 0.822
7 72 0.819
8 58 0.817
9 57 0.836
10 65 0.816
Alpha Coefficient for the Sub-scale
Barriers Associated with Libraries
0.832
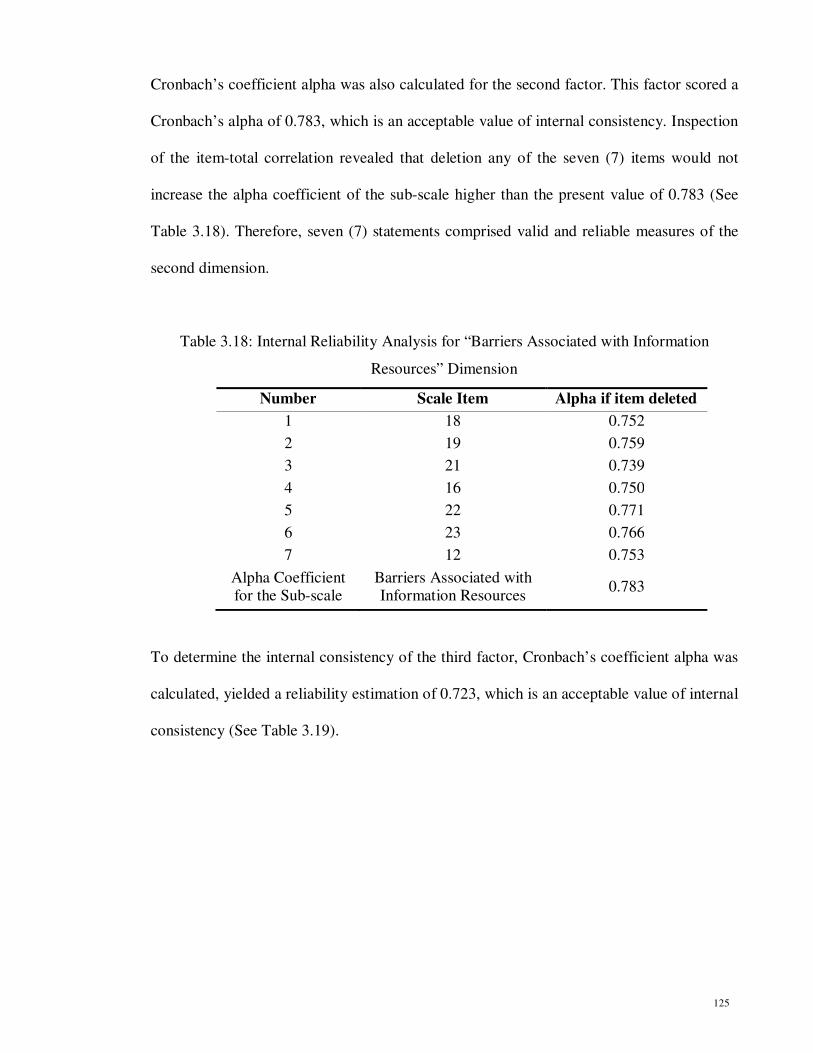
125
Cronbach’s coefficient alpha was also calculated for the second factor. This factor scored a
Cronbach’s alpha of 0.783, which is an acceptable value of internal consistency. Inspection
of the item-total correlation revealed that deletion any of the seven (7) items would not
increase the alpha coefficient of the sub-scale higher than the present value of 0.783 (See
Table 3.18). Therefore, seven (7) statements comprised valid and reliable measures of the
second dimension.
Table 3.18: Internal Reliability Analysis for “Barriers Associated with Information
Resources” Dimension
Number Scale Item Alpha if item deleted
1 18 0.752
2 19 0.759
3 21 0.739
4 16 0.750
5 22 0.771
6 23 0.766
7 12 0.753
Alpha Coefficient for the Sub-scale
Barriers Associated with Information Resources
0.783
To determine the internal consistency of the third factor, Cronbach’s coefficient alpha was
calculated, yielded a reliability estimation of 0.723, which is an acceptable value of internal
consistency (See Table 3.19).

126
Table 3.19: Internal Reliability Analysis for “Barriers Associated with Computers, the
Internet and Electronic Resources” Dimension
Number Item Alpha if item deleted
1 26 0.752
2 43 0.719
3 28 0.590
4 31 0.442
Alpha Coefficient for the Sub-scale
Barriers Associated with
Computers, the Internet
and Electronic Resources
0.723
Inspection of the internal reliability analysis revealed that deletion of item 31 (the
computers do not play an important role in my information seeking process) would improve
the reliability score slightly to 0.745 (See Table 3.20). As a result, the total of three (3)
valid and reliable items remained in the third sub-scale of the Information seeking Anxiety
Scale.
Table 3.20: Internal Reliability Analysis for “Barriers Associated Computers, the Internet
and Electronic Resources” Dimension After Dropping One Item
Number Item Alpha if item deleted
1 26 0.568
2 43 0.604
3 28 0.787
Alpha Coefficient for the Sub-scale
Barriers Associated with
Computers, the Internet
and Electronic Resources
0.745
The alpha coefficient for the fourth factor was 0.784 which indicated a good level of
internal consistency. Further assessment of the item-total correlation revealed that the value
of alpha coefficient of this sub-scale would not increase if any of the statements were
removed from the analysis (See Table 3.21). Therefore, six (6) statements comprised valid
and reliable measures of the fourth sub-dimension.

127
Table 3.21: Internal Reliability Analysis for “Technological Barriers” Dimension
Number Item Alpha if item deleted
1 39 0.744
2 38 0.728
3 37 0.742
4 34 0.758
5 48 0.771
6 35 0.763
Alpha Coefficient for the Sub-scale
Technological Barriers 0.784
The resultant alpha coefficient of 0.794 for the fifth factor provided proof of an acceptable
internal consistency. Inspection of the item-total correlation revealed that deletion any of
the five (5) items would not increase the alpha coefficient of the sub-scale higher than the
present value of 0.794 (See Table 3.22). Therefore, five (5) statements comprised valid and
reliable measures of the third dimension.
Table 3.22: Internal Reliability Analysis for “Affective Barriers” Dimension
Number Item Alpha if item deleted
1 73 0.727
2 75 0.767
3 76 0.773
4 77 0.754
5 84 0.753
Alpha Coefficient for the Sub-scale
Affective Barriers 0.794
The sixth sub-scale presented good internal consistency for the reliability analysis that
yielded an alpha coefficient value of 0.763. Table twenty two (See Table 3.23) contains the
alpha coefficients that would be generated if each item were to be deleted from the
instrument. Further assessment of the item-total correlation revealed that the value of alpha
coefficient of this sub-scale would not increase significantly if any of the statements were

128
removed from the analysis. Therefore, three (3) statements comprised valid and reliable
measures of the sixth sub-dimension.
Table 3.23: Internal Reliability Analysis for “Barriers Associated with Topic Identification”
Dimension
Number Item Alpha if item deleted
1 79 0.606
2 80 0.621
3 82 0.796
Alpha Coefficient for the Sub-scale
Barriers Associated with Topic Identification
0.763
Cronbach’s coefficient alpha was also calculated for the seventh factor. This factor scored
alpha coefficient of 0.704, which is an acceptable value of internal consistency (See Table
3.24).
Table 3.24: Internal Reliability Analysis for “Access Barrier” Dimension
Number Item Alpha if item deleted
1 10 0.652
2 13 0.615
3 11 0.624
4 15 0.661
5 14 0.730
Alpha Coefficient
for the Sub-scale Access Barrier 0.704
Inspection of the internal reliability analysis revealed that dropping items 14 (I feel anxious
when special equipments are required to have access to information resources during the
information seeking process) from the seventh sub-scale had the effect of raising alpha
coefficient from 0.704 to 0.730. As a result, the number of valid and reliable statements in
the seventh factor decreased to only four (4) items (See Table 3.25).

129
Table 3.25: Internal Reliability Analysis for “Access Barriers” Dimension After Dropping
One Item
Number Item Alpha if item deleted
1 41 0.661
2 42 0.646
3 44 0.673
4 34 0.696
Alpha Coefficient for the Sub-scale
Access Barriers 0.730
Dropping two (2) items from the third and seventh sub-scales of the Information Seeking
Anxiety Scale (ISAS) reduced the number of valid and reliable statements to only thirty-
eight (38) items. These thirty-eight (38) statements comprised the final version of the
Information Seeking Anxiety Scale (ISAS). Finally, the excellent value of alpha coefficient
for the total instrument (α=0.922) indicated sufficient internal consistency of the
Information Seeking Anxiety Scale (ISAS) (See Table 3.26). As a result, the newly
developed questionnaire and its sub-scales were found to have adequate internal
consistency (See Appendix I).
Table 3.26: Internal Reliability for Overall Scale and Seven Sub-scales
Number Sub-scale Number
of items
Cronbach’s
alpha
1 Barriers Associated with Libraries 10 0.832
2 Barriers Associated with Information Resources
7 0.783
3 Barriers Associated with Computers, the
Internet and Electronic Resources
3 0.745
4 Technological Barriers 6 0.784
5 Affective Barriers 5 0.794
6 Barriers Associated with Topic Identification 3 0.763
7 Access Barrier 4 0.730
Alpha
Coefficient for
the Overall Scale
Information Seeking Anxiety Scale 38 0.917

130
3.3. The Main Study
The main study was conducted during the March and April 2011 at the same research-
intensive university in Kuala Lumpur, Malaysia. The aim of the study was to investigate
the information seeking anxiety construct among postgraduate students in different areas of
study at a Malaysian university environment. The survey method was utilized to obtain data
about the postgraduate students’ information seeking anxiety. The survey method is one of
the most frequently used methods for collecting data in research studies. The surveys are a
“quantitative method that requires standardized information in order to define or describe
variables or to study relationship between variables” (Bourque & Fielder, 1995, p. 1). The
specifications of the study site, study population and sample, method of sampling, data
collection and data analysis procedures as well as the instrument employed in the main
study will be addressed in the following.
3.3.1. Study Population and Sample
The population of the study comprised postgraduate students from various areas of study at
the university sampled. According to the information obtained form the Institute of
Graduate Studies, the population size at the time of the study was around eleven thousand
(11000). Using the “Krejcie-Morgan (1970)” sampling table and to obtain 95% confidence
interval (5% error rate), three hundred and seventy-five (n=375) postgraduate students
provided the sample for the current study.
The stratified random sampling method was utilized to select the sample of the study.
Stratified random sampling is a type of probability sampling techniques which attempts to
divide a population into sub-populations such that members of each sub-population are
relatively homogeneous with respect to the variable of interest and relatively heterogeneous

131
from members of other sub-groups. In order to obtain a stratified random sample, the
sampling frame is first divided into sub-populations, called strata, then a random sample is
selected from each strata. The aim of stratified random sampling is to select a sample in
such a way that identified sub-groups on the population are represented in the sample in the
same proportion that they exist in the population. In the current study, conducting a
stratified random sampling technique assures that the researcher will be able to get
sufficient data about each sub-group to make a meaningful analysis. The process of
sampling is discussed in detail as following.
At the beginning, all postgraduate students at the university (N=11000) were selected as the
study population. A permission request letter was sent to the dean of the Institute of the
Graduate Studies (IGS) to enable the researcher have access to postgraduate student’s
information. After receiving permission from the dean of IGS, different letters were sent to
the Institute of Graduate Studies as well as different faculties of the university through the
thesis supervisor. They were requested to provide a list of all their postgraduate students’
information include names, contact information, level of study, discipline, gender and
nationality. When all the information has been collected, stratification according to the
student’s gender, nationality, discipline, and level of study was performed. Stratification is
the process of dividing members of the population into homogeneous sub-groups (stratum
or strata) before sampling.
Accordingly, the population was stratified by gender (male / female), nationality
(Malaysian / international), level of study (master’s level / doctoral level), and discipline
(art, humanities, social sciences and education / engineering / medical sciences / pure
sciences). Thirty-two (32) new lists of students were created according to the chosen

132
stratification and each student was assigned a unique number. Also, the proportions of all
sub-groups in the entire population were calculated. Following this, from each stratum, a
requisite number of students were randomly selected. In other words, within each gender ×
nationality × level of study × discipline cell (32 sub-groups), a random sample of the
subjects was selected using a random number table. Accordingly, a total of three hundred
and seventy-five (375) postgraduate students were selected for this study via “stratified
random sampling method”. This method of sampling “provided the researcher with the
sample that is highly representative of the population being studied”. Also, since the units
which selected for inclusion in the sample were chosen using probabilistic methods,
stratified random sampling allowed the researcher to make generalization from the sample
to the whole population.
3.3.2. The Study Instrument
The study subjects were required to fill up the Information Seeking Anxiety Scale (ISAS)
which was developed and validated in the current study. This instrument contains thirty-
eight (38) items, which are measured using a 5-point Likert-type format. The Likert scale is
a commonly utilized measurement scale that was developed by Rensis Likert (1961). It
measures “specific attitudes of respondents who indicate their level of agreement or
disagreement with statements. This scale assigns a numerical value to the level of
agreement or disagreement” (Bowers, 2010, p. 42).
In the current study, for each statement a response of one (1) denotes “strong disagreement
with the statement,” whereas a response of five (5) denotes “strong agreement”. Scores of
the whole scale, which range from thirty-eight (38) to one hundred and ninety (190), were
used as an overall measure of the information seeking anxiety construct, with higher scores

133
on the scale representing greater degree of information seeking anxiety. Additionally, a
higher score on any sub-scale of the ISAS represents higher anxiety as it pertains to that
particular sub-dimension. Like many psychological tests, the Information Seeking Anxiety
Scale (ISAS) have both positive and negative syntax statements in order to avoid inserting a
bias into the responses. In order to calculate the final score, the scores of positive
statements were reversed.
The Information Seeking Anxiety Scale (ISAS) comprised seven (7) sub-scales, namely,
barriers associated with libraries (10 items), barriers associated with information resources
(7 items), barriers associated with computers, the Internet and electronic resources (3
items), technological barriers (6 items), affective barriers (5 items), barriers associated with
topic identification (3 items) and access barriers (4 items). These factors were explained
50.152% of the total variance of the scale. Results of the current study indicate that the
Information Seeking Anxiety Scale (ISAS) possesses good psychometric properties and is
both valid and reliable. Evidence of face, content and construct validity of the scale was
provided before in this chapter. Also, the alpha coefficients were 0.917 for the overall scale
and ranged from 0.730 to 0.832 for different sub-scales, which revealed high internal
consistency of the scale as well as its sub-scales and reliability among the items.
Moreover, a demographic information form was used to collect the essential demographic
information for this study. The following items of information were gathered using this
form: gender, age, discipline, level of study, nationality, frequency of library use, frequency
of Internet use, and number of information literacy or library instruction sessions have
participated.
134
3.3.3. Data Collection Procedures
The main study of the information seeking anxiety among postgraduate students at the
university sampled was conducted using the survey method from March 2011 through
April 2011. The names of the postgraduate students in different faculties and their contact
information were obtained from the Institute of Graduate Studies (IGS) as well as different
faculties and institutions. Using stratified random sampling method, a total of three hundred
and seventy-five (375) postgraduate students was then selected as the subjects of the study.
All these students were contacted personally by e-mail to seek their agreement for
participation in the study. Many students did not reply to the attendance request or declined
to participate. In this case, those subjects who were not available for participation in the
study were replaced by other students from the same sub-group. Some students declared
their preference for participation in the survey electronically. Thus, the questionnaire along
with the cover letter was sent to them using an e-mail. They were asked to complete the
questionnaire and return their responses during a period of Two (2) weeks.
In other cases, the study subjects were visited in their offices, labs, classes or the main
library and the survey was administered to them. The survey instrument along with a cover
letter was distributed by the researcher or two (2) trained undergraduate students who
assisted the researcher in the process of data collection. Students took the Information
Seeking Anxiety Scale (ISAS) were also requested to fill out the demographic information
form. The researcher provided some instructions regarding completion of the questionnaire
to the students. They were told that their participation was voluntary and the information
which they provide will be used only for this research. They were requested to complete the
questionnaire and return it to the researcher. Each instrument was coded so that an efficient

135
follow-up process could be implemented. Questionnaires took an average of twelve (12) to
fifteen (15) minutes to complete.
3.3.4. Data Analysis
After the completed surveys were received, they were reviewed for completeness and
usability before being entered into the software. Eight (8) questionnaires were eliminated
from the study due to partial completion, replaced with other questionnaires. Afterwards,
the data were input into the Statistical Package for the Social Sciences (version 20) for
analysis. Scale values of negatively expressed statements were reverse-scored before data
input was done. Descriptive statistics were used in this study to analyze and report the
results of the study.
Descriptive statistics were used in this study to analyze and report the results of the study.
In order to examine overall information seeking anxiety as well as each of the seven (7)
dimensions, mean score anxiety were computed for the total ISAS and for each of the sub-
scales. A series of paired t-tests were then performed to determine the statistical
significance of mean differences among the seven (7) components of the information
seeking anxiety construct. The researcher also used Anwar, Al-Kandari and Al-Qallaf’s
(2004) proposed levels of library anxiety as a useful way to determine levels of information
seeking anxiety in various sub-dimensions as well as total scale.
A series of independent sample t-tests were employed to determine whether any statistically
significant mean differences exist between various dimensions of the information seeking
anxiety construct and (a) gender, (b) level of study, (c) nationality, (d) information literacy
skills instruction received and (e) major (two groups) (hypothesis 1 to 5). The independent

136
sample t-test is used for “testing the differences between the means of two (2) independent
groups. It is particularly useful when the research question requires the comparison of
variables obtained from two (2) independent samples” (Ho, 2006, p. 41). Additionally,
a series of one-way analysis of variance (ANOVA) tests were employed to determine
whether any statistically significant mean differences exist between student’s major
(four groups) and various sub-scales of the information seeking anxiety construct
(hypothesis 5). The one-way analysis of variance (ANOVA) is used “when the researcher is
interested in whether the means from several (>2) independent groups differ (Ho, 2006,
p.51).
Furthermore, a series of Pearson Product Moment Correlation tests were performed to test
the relationships between student’s age, frequency of library use as well as frequency of
Internet use and various sub-scales of the information seeking anxiety construct (hypothesis
6 to 8). The Pearson correlation tests is concerned with finding out “whether a relationship
exists and with determining its magnitude and direction” (Ho, 2006, p. 183). Finally, a
series of two-way factorial ANOVA were performed to test each of the main and
interaction effects hypotheses. The factorial univariate ANOVA is used in “experimental
designs in which every level of every factor is paired with every level of every other factor.
It allows the researcher to assess the effects of each independent variable separately, as well
as the joint effect or interaction of variables” (Ho, 2006, p. 57). Research hypotheses and
their respective inferential statistical tests present in table below (See Table 3.27):

137
Table 3.27: Research Hypotheses and their Respective Inferential Statistical Tests
Hypotheses Inferential Statistical Test
1 There are statistically significant mean differences in various
dimensions of the information seeking anxiety construct between male and female postgraduate students.
Independent
Sample t-test
2 There are statistically significant mean differences in various
dimensions of the information seeking anxiety construct between master’s level students and doctoral level students.
Independent
Sample t-test
3 There are statistically significant mean differences in various
dimensions of the information seeking anxiety construct between Malaysian students and non-Malaysian students.
Independent
Sample t-test
4 There are statistically significant mean differences in various
dimensions of the information seeking anxiety construct between
students who have received information literacy skills instruction
and those who have not received information literacy skills instructions.
Independent
Sample t-test
5 There are statistically significant mean differences in various
dimensions of the information seeking anxiety construct between postgraduate students from different academic majors.
One-way
ANOVA,
Independent Sample t-test
6 There are statistically significant relationships between various
dimensions of the information seeking anxiety construct and postgraduate student’s age.
Pearson Product
Moment Correlation
7 There are statistically significant relationships between various
dimensions of the information seeking anxiety construct and postgraduate student’s frequency of library use.
Pearson Product
Moment Correlation
8 There are statistically significant relationships between various
dimensions of the information seeking anxiety construct and postgraduate student’s frequency of Internet use.
Pearson Product
Moment Correlation
9 There are statistically significant main and interaction effects of
gender and academic major on various dimensions of the information seeking anxiety construct.
Two-way
Factorial ANOVA
10 There are statistically significant main and interaction effects of
gender and level of study on various dimensions of the information seeking anxiety construct.
Two-way
Factorial ANOVA
11 There are statistically significant main and interaction effects of
gender and nationality on various dimensions of the information seeking anxiety construct.
Two-way
Factorial ANOVA
12 There are statistically significant main and interaction effects of
gender and information literacy skills instruction received on various dimensions of the information seeking anxiety construct.
Two-way
Factorial ANOVA
13 There are statistically significant main and interaction effects of
academic major and level of study on various dimensions of the information seeking anxiety construct.
Two-way
Factorial ANOVA

138
14 There are statistically significant main and interaction effects of
academic major and nationality on various dimensions of the information seeking anxiety construct.
Two-way
Factorial ANOVA
15 There are statistically significant main and interaction effects of
academic major and information literacy skills instruction received
on various dimensions of the information seeking anxiety
construct.
Two-way
Factorial ANOVA
16 There are statistically significant main and interaction effects of
nationality and level of study on various dimensions of the
information seeking anxiety construct.
Two-way
Factorial
ANOVA
17 There are statistically significant main and interaction effects of
nationality and information literacy skills instruction received on
various dimensions of the information seeking anxiety construct.
Two-way
Factorial
ANOVA
18 There are statistically significant main and interaction effects of
level of study and information literacy skills instruction received
on various dimensions of the information seeking anxiety construct.
Two-way
Factorial
ANOVA
3.4. Summary of the Chapter
This chapter contained a description of the steps followed to develop and validate the
Information Seeking Anxiety Scale (ISAS). The research took place in several empirical
phases. In the first place, a list of ninety-four (94) potential key components developed by
the researchers and was sent to a panel of experts for validation. Pursuing this further, a
pilot instrument consisted of ninety-three (93) statements was generated according to the
list of key components and was sent again to experts for content validity. Also, the face
validity of the instrument was evaluated by a group of fifteen (15) postgraduate students.
Finally, the psychometric properties of the instrument were tested in two (2) pilot studies
with a group of four hundred (400) postgraduate students at the sampled university,
subjected to Exploratory Factor Analysis and reliability testing.
Additionally, some information about the main study’s methodology, population and
sample, sampling method, data collection procedures and data analysis was provided.

139
Considering results of this chapter, the thirty-eight (38)-item Information Seeking Anxiety
Scale (ISAS) reported as a valid and reliable instrument which may be used in future
studies to measure information seeking anxiety of postgraduate students. The next chapter
of the study discusses data analysis and presents the findings of the study.

140
CHAPTER FOUR
FINDINGS OF THE STUDY
4.1. Introduction
This chapter presents the results of the study. The purposes of the current study are to
develop and validate the Information Seeking Anxiety Scale, as well as, determine
information seeking anxiety of postgraduate students at a research-intensive university in
Kuala Lumpur, Malaysia. Additionally, the mean differences and relationships between
selected independent variables and various dimensions of the information seeking anxiety
construct are explored. In order to address the objectives of the study, the following
questions are formulated:
1. How can a valid and reliable instrument be developed and validated to measure
information seeking anxiety of postgraduate students?
2. What components of the information seeking anxiety construct have the most and the
least prevalence among postgraduate students at a research-intensive university in
Malaysia?
3. Do statistically significant mean differences, relationships and main and interaction
effects exist between various dimensions of the information seeking anxiety construct and
selected independent variables (gender, level of study, nationality, information literacy
skills instruction received, students’ academic major, age, frequency of library use and
frequency of Internet use) among postgraduate students at a research-intensive university in
Malaysia?
141
In order to respond to the third question of the study, the following eighteen (18)
hypotheses are tested:
Hypotheses 1. There are statistically significant mean differences in various dimensions of
the information seeking anxiety construct between male and female postgraduate students.
Hypotheses 2. There are statistically significant mean differences in various dimensions of
the information seeking anxiety construct between master’s level students and doctoral
level students.
Hypotheses 3. There are statistically significant mean differences in various dimensions of
the information seeking anxiety construct between Malaysian students and non-Malaysian
students.
Hypotheses 4. There are statistically significant mean differences in various dimensions of
the information seeking anxiety construct between students who have received information
literacy skills instruction and those who have not received information literacy skills
instructions.
Hypotheses 5. There are statistically significant mean differences in various dimensions of
the information seeking anxiety construct between postgraduate students from different
academic majors.
Hypotheses 6. There are statistically significant relationships between various dimensions
of the information seeking anxiety construct and postgraduate student’s age.
Hypotheses 7. There are statistically significant relationships between various dimensions
of the information seeking anxiety construct and postgraduate student’s frequency of
library use.
Hypotheses 8. There are statistically significant relationships between various dimensions
of the information seeking anxiety construct and postgraduate student’s frequency of
Internet use.
142
Hypotheses 9. There are statistically significant main and interaction effects of gender and
academic major on various dimensions of the information seeking anxiety construct.
Hypotheses 10. There are statistically significant main and interaction effects of gender and
level of study on various dimensions of the information seeking anxiety construct.
Hypotheses 11. There are statistically significant main and interaction effects of gender and
nationality on various dimensions of the information seeking anxiety construct.
Hypotheses 12. There are statistically significant main and interaction effects of gender and
information literacy skills instruction received on various dimensions of the information
seeking anxiety construct.
Hypotheses 13. There are statistically significant main and interaction effects of academic
major and level of study on various dimensions of the information seeking anxiety
construct.
Hypotheses 14. There are statistically significant main and interaction effects of academic
major and nationality on various dimensions of the information seeking anxiety construct.
Hypotheses 15. There are statistically significant main and interaction effects of academic
major and information literacy skills instruction received on various dimensions of the
information seeking anxiety construct.
Hypotheses 16. There are statistically significant main and interaction effects of nationality
and level of study on various dimensions of the information seeking anxiety construct.
Hypotheses 17. There are statistically significant main and interaction effects of nationality
and information literacy skills instruction received on various dimensions of the
information seeking anxiety construct.
Hypotheses 18. There are statistically significant main and interaction effects of level of
study and information literacy skills instruction received on various dimensions of the
information seeking anxiety construct.

143
4.2. Demographic Characteristics of the Participants
This part of research describes the demographic characteristics of the participants in the
main study. The participants of the main study comprised three hundred and seventy-five
(375) postgraduate students enrolled in different postgraduate programs of study at a
research intensive university in Kuala Lumpur Malaysia, during the 2011-2012 academic
years. The stratified random sampling method was utilized to select the sample of the study.
Additionally, participant’s demographic information was collected using a demographic
information form, which was designed specifically for this study. This form extracted the
following data from the respondents: gender, age, level of study, academic major,
nationality, information literacy skills instruction received, frequency of library use, and
frequency of the Internet use.
Of the three hundred and seventy-five (375) postgraduate students, one hundred and ninety
students (50.7%) were males and one hundred and eighty-five (49.3%) were females. Male
students were from different areas of study include engineering (35.8%), arts, humanities,
social sciences and education (29%), pure sciences (30.5%), and medical sciences (4.7%).
Regarding the female student’s area of study, sixty-six students (35.6%) were from the art,
humanities, social sciences, and education disciplines, while fifty-eight students (31.4%)
were from pure science disciplines. Additionally, fifty-four (29.2%) and seven female
students (3.8%) were from engineering and medical sciences majors, respectively (See
Table 4.1). In sum, concerning the students’ academic major, one hundred and twenty-two
(122) postgraduate students were from engineering which comprised the largest group with
thirty-three percent (32.5%) of the total participants. The next largest academic major was
arts, humanities, social sciences and education (32.3%), followed by pure sciences (30.9%)
and small group of medical sciences disciplines (4.3%) (See Table 4.1).

144
Table 4.1: Participant’s Academic Major and Gender Crosstabulation
Gender
Total Female Male
Major Arts, Humanities, Social
Sciences, Education
Count 66 55 121
% within Major 54.5% 45.5% 100.0%
% within Gender 35.6% 29% 32.3%
% of Total 17.6% 14.7% 32.3%
Pure Sciences Count 58 58 116
% within Major 50.0% 50.0% 100.0%
% within Gender 31.4% 30.5% 30.9%
% of Total 15.5% 15.5% 30.9%
Engineering Count 54 68 122
% within Major 44.3% 55.7% 100.0%
% within Gender 29.2% 35.8% 32.5%
% of Total 14.4% 18.1% 32.5%
Medical Sciences Count 7 9 16
% within Major 43.8% 56.2% 100.0%
% within Gender 3.8% 4.7% 4.3%
% of Total 1.9% 2.4% 4.3%
Total Count 185 190 375
% within Major 49.3% 50.7% 100.0%
% within Gender 100.0% 100.0% 100.0%
% of Total 49.3% 50.7% 100.0%
Of the one hundred and twenty-one students (121) who have studied in arts, humanities,
social sciences and education, eighty-eight students (72.7%) were non-Malaysian with the
remaining of thirty-three students (27.3%) being Malaysia. The majority of students who
have studied in pure sciences were non-Malaysian (65.5%), while only 34.5% were
Malaysian. Additionally, Non-Malaysian students formed the majority (71.3%) of the
students who have studied in engineering disciplines, while Malaysian students comprised
only twenty-eight percent (28.7%). Finally, of the sixteen students (16) who have studied in
medical sciences disciplines, ten students (62.5%) were Malaysian with the remaining six
students (37.5%) being non-Malaysian (See Table 4.2).

145
Table 4.2: Participant’s Academic Major and Nationality Crosstabulation
Nationality
Total Malaysian Non-Malaysian
Major Arts,Humanities,
Social
Sciences, Education
Count 33 88 121
% within Major 27.3% 72.7% 100.0%
% within Gender 28.0% 34.2% 32.3%
% of Total 8.8% 23.5% 32.3%
Pure Sciences Count 40 76 116
% within Major 34.5% 65.5% 100.0%
% within Gender 33.9% 29.6% 30.9%
% of Total 10.7% 20.3% 30.9%
Engineering Count 35 87 122
% within Major 28.7% 71.3% 100.0%
% within Gender 29.7% 33.9% 32.5%
% of Total 9.3% 23.2% 32.5%
Medical Sciences Count 10 6 16
% within Major 62.5% 37.5% 100.0%
% within Gender 8.5% 2.3% 4.3%
% of Total 2.7% 1.6% 4.3%
Total Count 118 257 375
% within Major 31.5% 68.5% 100.0%
% within Gender 100.0% 100.0% 100.0%
% of Total 31.5% 68.5% 100.0%
Regarding the student’s gender and nationality, non-Malaysian students made up (68.5%)
of the participants with the remaining (31.5%) of the respondents being Malaysian. Of the
two hundred and fifty-seven non-Malaysian students (257), one hundred and thirty-six
students (52.9%) were male and one hundred and twenty-one students (47.1%) were
female. Additionally, among one hundred and eighteen (118) Malaysian students, there
were sixty-four (64) females, which comprised fifty-four percent (54.2%) of the
participants, and fifty-four (54) males, which comprised forty-six percent (45.8%) of study
participants (Table 4.3).

146
Table 4.3: Participant’s Gender and Nationality Crosstabulation
Nationality
Total Malaysian Non-Malaysian
Gender Female Count 64 121 185
% within Major 34.6% 65.4% 100.0%
% within Nationality 54.2% 47.1% 49.3%
% of Total 17.1% 32.3% 49.3%
Male Count 54 136 190
% within Major 28.4% 71.6% 100.0%
% within Nationality 45.8% 52.9% 50.7%
% of Total 14.4% 36.3% 50.7%
Total Count 118 257 375
% within Major 31.5% 68.5% 100.0%
% within Nationality 100.0% 100.0% 100.0%
% of Total 31.5% 68.5% 100.0%
Regarding the student’s nationality and level of study, non-Malaysian students who have
studied in master’s level (68.2%) outnumbered Malaysian students who have studied in the
same level of study (31.8%). Additionally, of the one hundred and eight doctoral level
students, seventy-five students (69.4%) were non-Malaysian, while only thirty-three
students (30.6%) were Malaysian (See Table 4.4).

147
Table 4.4: Participant’s Nationality and Level of Study Crosstabulation
Level of Study
Total Master PhD
Nationality Malaysian Count 85 33 118
% within Major 72.0% 28.0% 100.0%
% within Gender
31.8% 30.6% 31.5%
% of Total 22.7% 8.8% 31.5%
Non-Malaysian Count 182 75 257
% within Major 70.8% 29.2% 100.0%
% within Gender
68.2% 69.4% 68.5%
% of Total 48.5% 20.0% 68.5%
Total Count 267 108 375
% within Major 71.2% 28.8% 100.0%
% within
Gender 100.0% 100.0% 100.0%
% of Total 71.2% 28.8% 100.0%
Table 4.5 displays areas of specialization of master’s level and doctoral level students. As
can be seen, of the two hundred and sixty seven (267) master’s level students, ninety-one
students (34.1%) have studied in arts, humanities, social sciences and education disciplines,
eighty-six students (32.2%) were in pure sciences, eighty-two students (30.7%) were in
engineering and eight students (3%) have studied in medical sciences. Additionally, among
one hundred and eight (108) doctoral level students, there were thirty students (27.8%)
from arts, humanities, social sciences and education disciplines, thirty students (27.8%)
from pure sciences disciplines, forty students (37%) from engineering with the remaining
eight students (7.4%) from medical sciences disciplines (See Table 4.5).
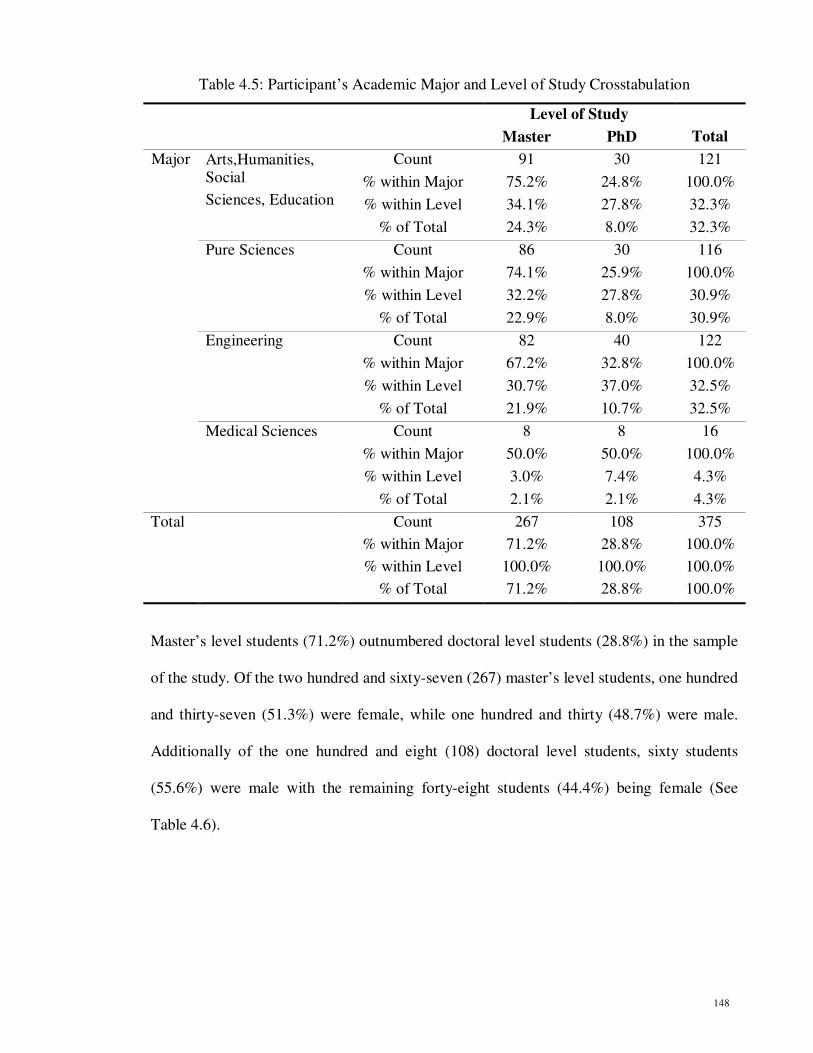
148
Table 4.5: Participant’s Academic Major and Level of Study Crosstabulation
Level of Study
Total Master PhD
Major Arts,Humanities, Social
Sciences, Education
Count 91 30 121
% within Major 75.2% 24.8% 100.0%
% within Level 34.1% 27.8% 32.3%
% of Total 24.3% 8.0% 32.3%
Pure Sciences Count 86 30 116
% within Major 74.1% 25.9% 100.0%
% within Level 32.2% 27.8% 30.9%
% of Total 22.9% 8.0% 30.9%
Engineering Count 82 40 122
% within Major 67.2% 32.8% 100.0%
% within Level 30.7% 37.0% 32.5%
% of Total 21.9% 10.7% 32.5%
Medical Sciences Count 8 8 16
% within Major 50.0% 50.0% 100.0%
% within Level 3.0% 7.4% 4.3%
% of Total 2.1% 2.1% 4.3%
Total Count 267 108 375
% within Major 71.2% 28.8% 100.0%
% within Level 100.0% 100.0% 100.0%
% of Total 71.2% 28.8% 100.0%
Master’s level students (71.2%) outnumbered doctoral level students (28.8%) in the sample
of the study. Of the two hundred and sixty-seven (267) master’s level students, one hundred
and thirty-seven (51.3%) were female, while one hundred and thirty (48.7%) were male.
Additionally of the one hundred and eight (108) doctoral level students, sixty students
(55.6%) were male with the remaining forty-eight students (44.4%) being female (See
Table 4.6).

149
Table 4.6: Participant’s Gender and Level of Study Crosstabulation
Level of Study
Total Master PhD
Gender Female Count 137 48 185
% within Gender 74.1% 25.9% 100.0%
% within Level 51.3% 44.4% 49.3%
% of Total 36.5% 12.8% 49.3%
Male Count 130 60 190
% within Gender 68.4% 31.6% 100.0%
% within Level 48.7% 55.6% 50.7%
% of Total 34.7% 16.0% 50.7%
Total Count 267 108 375
% within Gender 71.2% 28.8% 100.0%
% within Level 100.0% 100.0% 100.0%
% of Total 71.2% 28.8% 100.0%
Furthermore, ages of the participants ranged from twenty-two (22) to fifty-two (52) years
old, with a mean age of 30.27 years (SD=5.72) (See Table 4.7, Figure 4.1).
Table 4.7: Age of the Participants
Characteristic Mean SD Median Mode Variance Min Max
Age (Years) 30.27 5.72 29.00 26.00 32.717 22.00 52.00
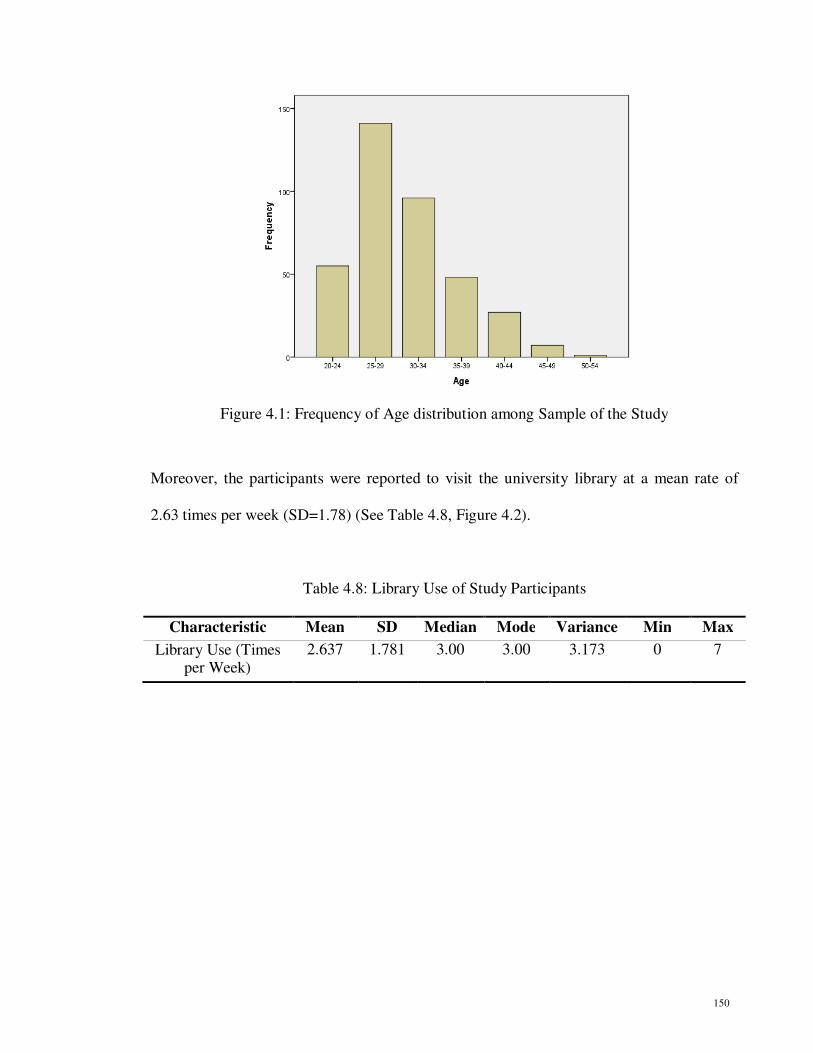
150
Figure 4.1: Frequency of Age distribution among Sample of the Study
Moreover, the participants were reported to visit the university library at a mean rate of
2.63 times per week (SD=1.78) (See Table 4.8, Figure 4.2).
Table 4.8: Library Use of Study Participants
Characteristic Mean SD Median Mode Variance Min Max
Library Use (Times per Week)
2.637 1.781 3.00 3.00 3.173 0 7

151
Figure 4.2: Frequency of University Library Visit among Sample of the Study
Additionally, the frequency of the Internet use (hours per week) among sample of the study
ranged from two (2) hours to one hundred (100) hours with the mean use of 19.2 hours per
week (SD=17.415) (See Table 4.9, Figure 4.3).
Table 4.9: Internet Use of Study Participants
Characteristic Mean SD Median Mode Variance Min Max
Internet Use (Hours per
Week)
19.213 17.415 13.50 5.00 303.289 2 100

152
Figure 4.3: Frequency of Internet Use among Sample of the Study
Regarding the participation in information literacy skills instruction sessions which was
organized by the university, one hundred and forty-four students (38.4%) reported that they
have participated in at least one (1) information literacy skills session, while two hundred
and thirty-one students (61.6%) reported that they have not participated in any information
literacy instruction session. Of the one hundred and forty-four (144) students who have
participated in information literacy instruction sessions, seventy-nine students (55%) were
females and sixty-five students (65) were male. Additionally, one hundred and eight
students (75%) who have participated in instruction sessions were master’s level students
with the remaining thirty-six (25%) of the participants being doctoral students.
In sum, the distribution of the participant’s demographic data is summarized in table 4.10
below.
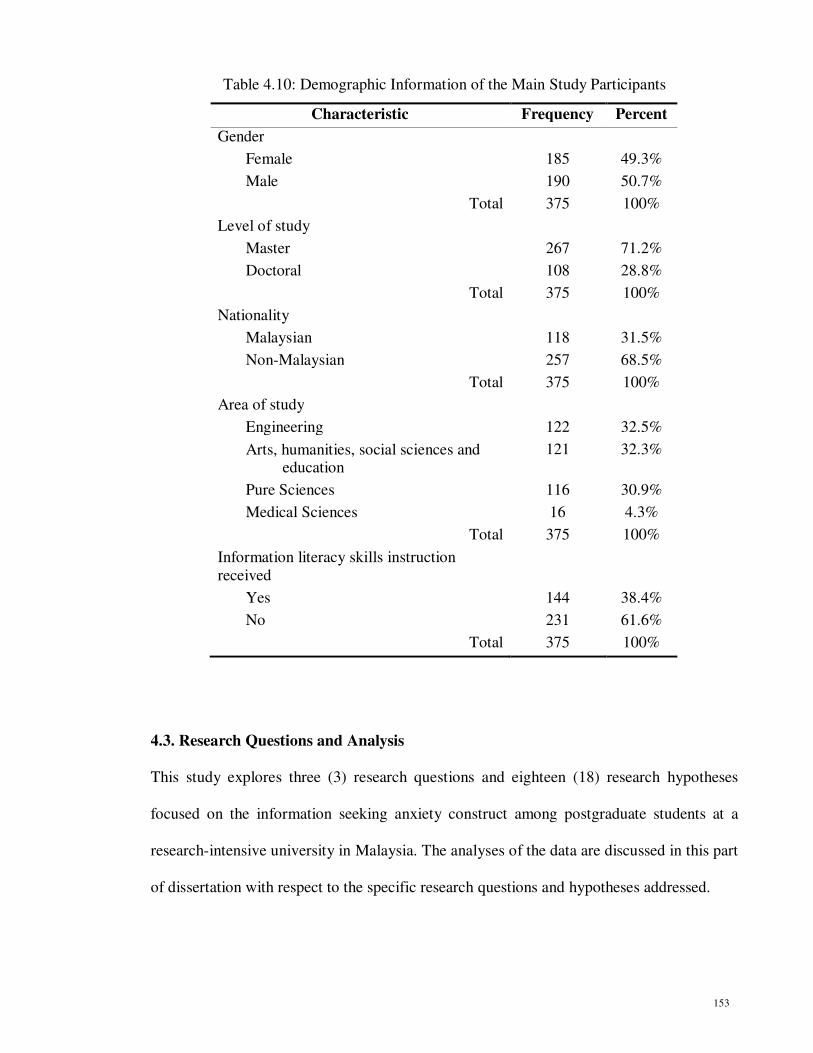
153
Table 4.10: Demographic Information of the Main Study Participants
Characteristic Frequency Percent
Gender
Female 185 49.3%
Male 190 50.7%
Total 375 100%
Level of study
Master 267 71.2%
Doctoral 108 28.8%
Total 375 100%
Nationality
Malaysian 118 31.5%
Non-Malaysian 257 68.5%
Total 375 100%
Area of study
Engineering 122 32.5%
Arts, humanities, social sciences and education
121 32.3%
Pure Sciences 116 30.9%
Medical Sciences 16 4.3%
Total 375 100%
Information literacy skills instruction
received
Yes 144 38.4%
No 231 61.6%
Total 375 100%
4.3. Research Questions and Analysis
This study explores three (3) research questions and eighteen (18) research hypotheses
focused on the information seeking anxiety construct among postgraduate students at a
research-intensive university in Malaysia. The analyses of the data are discussed in this part
of dissertation with respect to the specific research questions and hypotheses addressed.

154
4.3.1. Research Question 1. How can a valid and reliable instrument be developed and
validated to measure information seeking anxiety of postgraduate students?
The present study is conducted in order to develop and validate a scale that could be
employed to assess postgraduate student’s anxiety during the information seeking process
of their research. The development and validation of the Information Seeking Anxiety
Scale (ISAS) followed a standard pattern for psychometric research. In the first stage, a list
of ninety-four (94) potential key components was generated using different resources.
Possible components were gleaned from literature review, existing instruments, interviews
with ten (10) postgraduate students in different areas of study as well as consultation with
research supervisors and other faculty members in the department of Library and
Information Science at the sampled university. The list of key components was then sent to
a panel for validation. Seventeen (17) researchers in the area of LIS were selected to form
the panel of experts for validation. These researchers were contacted personally by e-mail
and requested to participate in the study, of which fourteen (14) of them accepted. The
experts were given the list of key components and requested to indicate their comments and
feedback. Based on the responses received from the experts, twenty-nine (29) components
were eliminated from the list, and five (5) new components were added, leaving seventy
(70) components.
In the next stage of the study, a total of one hundred and fifty-four (154) statements were
created with respect to each of the key components. The list of statement was sent again to
experts for validation. Based upon the experts’ comments, sixty-three (63) statements were
removed from the list, and two (2) new statements were added, resulting in a total of
ninety-three (93) items. Further changes were made to the wording of some statements
according to expert’s comments. Following revisions to the list of statements, a pilot

155
instrument was constructed which consisted ninety-three (93) statements. Two (2) pilot
studies were conducted during January to March 2011 at a research intensive university in
Kuala Lumpur, Malaysia. A total of four hundred (400) postgraduate students took part in
pilot studies. The aim of the first pilot study was to identify statements in the instrument
which needed modifications as well as to recognize any problems in the process of data
collection. Additionally, the second pilot study was conducted with the aim of developing a
final set of statements and validating the Information Seeking Anxiety Scale (ISAS). In
both studies, the Predictive Analysis Software (PASW) was utilized for data analysis. A
demographic information form was also designed specifically for these pilot studies which
extracted some demographic information of participants, such as, gender, level of study,
nationality, participation in information literacy skills sessions, area of study, age,
frequency of library use as well as frequency of the Internet use.
The study of the participant’s demographic information showed that of the four hundred
students (400) who attended in two (2) pilot studies, two hundred and thirty-five students
(59%) were female, while one hundred and twenty-three students (41%) were male.
Additionally, master’s level students made up sixty-five percent (65%) of the sample with
the remaining thirty-five percent (35) were doctoral level students. Non-Malaysian students
(72%) outnumbered Malaysian students (28%) in both pilot studies. Regarding the
student’s area of specialization, one hundred and twenty-six students (31.5%) studied
engineering and one hundred and fifty-four students (38.5%) were from arts, humanities,
and social science disciplines. Additionally, ninety-four students (23.5%) and twenty-six
students (6.5%) of respondents were from the pure sciences and medical sciences
disciplines, respectively. Finally, with regard to participate in information literacy skills
instruction sessions which organized by the university library, one hundred and sixty-five

156
students (41%) reported that they have attended in at least one (1) instructional session,
while two hundred and thirty-five (59%) declared that they have not received any
information literacy skills instruction.
In the first pilot study, a total of one hundred (100) postgraduate students were asked to
complete the ninety-three (93) items five (5)-point Likert type pilot instrument. For each
statement, a response of one (1) denoted strong disagreement with the statement, whereas a
response of five (5) denoted strong agreement. The pilot instrument was seven (7) pages
long and required approximately twenty (20) minutes to complete. Of the overall one
hundred (100) returned questionnaires, ninety-seven (97) had been completed in full and
were submitted to analysis. In an attempt to assess the quality of items and identify
problematic statement, an Exploratory Factor Analysis was then performed. Statement with
factor loading less than 0.4 were reviewed again and some changes made to improve
readability and clarity of the items. The second pilot study was then performed to replicate
the study with a larger sample of participants. In the second pilot study, three hundred (300)
postgraduate students were administered using a revised version of the pilot instrument
consisted of ninety-three (93) statements during two (2) months period. Thirteen (13) out of
three hundred (300) returned questionnaires contained some missing data, which were
eliminated from the analysis. An exploratory factor analysis was then performed to reduce
the number of statements and to determine the factor structure of the instrument.
In order to assess the validity of the newly developed instrument, several approaches were
used included face, content, and construct validation. A group of fifteen (15) postgraduate
students in different areas of study at the sampled university were asked to review and
evaluate the instrument for face validity, clarity of wording, and ease of completion and

157
understanding of the questionnaire. There were some minor adjustments on wording of the
statements suggested by the students. They reported that the instrument was complete and
easy to understand. Overall, the students unanimously agreed that face validity was evident
in the instrument. In order to determine the content validity of the instrument, it was
presented to the panel of experts for suggestions and validation. They were requested to
review the instrument and determine whether or not the questionnaire will actually measure
what the researcher think it will measure. Seven (7) experts out of fourteen (14) established
content validity of the instrument and confirmed that the statements of the questionnaire
appeared to measure the concept of the information seeking anxiety. They also provided
some suggestions to improve validity of the instrument.
In an attempt to determine the construct validity of the instrument, an Exploratory Factor
Analysis using principal component method and varimax rotation was carried out. Prior to
conducting the Exploratory Factor Analysis, two (2) tests were conducted to assess the
suitability of the data for factor analysis. The Kaiser-Meyer-Olkin (KMO) measure of
sampling adequacy (0.904) and the Bartlett’s Test of Sphericity (chi-square=6849.087,
df=1081, p=0.000), indicated the suitability of the data for factor analysis. Results of
running an Exploratory Factor Analysis with principal component and varimax rotation
yielded seven (7) factors which collectively explained 50.152% of the total variance. While
the initial analysis indicated ten (10) factors, inspection of the eigenvalues and scree plot
identified only seven (7) main factors. Using this method, fifty-three (53) statements with
factor loading less than 0.4 were excluded from the instrument, leaving forty (40)
statements.

158
The first factor, barriers associated with libraries, consisted of ten (10) statements which
explained 24.423% of the total variance. The rotated factor loadings on this factor ranged
from 0.441 to 0.718. Examples of items retained in this sub-scale are, “the university
library has too many confusing policies and procedures for postgraduate students” and “the
university library does not offer enough information services for postgraduate students”.
The second factor, barriers associated with information resources, contained seven (7)
statements that were accounted for 7.315% of the variance. The items within this factor had
rotated factor loadings between 0.452 and 0.698. Examples of items retained in this sub-
scale are, “I feel anxious when the quality of the retrieved information resources is
unreliable” and “finding poor quality information resources during the information seeking
process make me frustrated”.
The third factor contained four (4) statements and accounted for 5.150% of the variance.
This factor was labelled barriers associated with computers, the Internet and electronic
resources. The rotated factor loadings for this dimension were between0.442 and 0.752.
Examples of items retained in this sub-scale are, “I feel uncomfortable using electronic
resources when seeking information” and “I feel anxious when searching the World Wide
Web for information related to my research”. The fourth dimension of the Information
Seeking Anxiety Scale, technological barriers, represented 4.181% of the variance and
included six (6) statements. The rotated factor loadings on this factor ranged from0.421 to
0.745. Examples of items retained in this sub-scale are, “rapid changes in hardware and
software technologies make me anxious when searching for information resources” and “I
feel anxious when different computer technologies are required to retrieve the needed
information resources”.

159
Factor five, Affective barriers, comprised five (5) statements and accounted only for
3.430% of the variance. The rotated factor loadings for this dimension were between0.525
to 0.679. Examples of items retained in this sub-scale are, ” I feel anxious and frustrated
when searching for information resources related to my research” and “I am embarrassed
that I do not know how to find information resources for my research”. Three (3)
statements were loaded on the sixth factor, barriers associated with topic identification,
which explained 2.865% of the total variance. The items within this factor had rotated
factor loadings between 0.642 and 0.825. Examples of items are, “selecting a general topic
is a difficult part of the information seeking process” and “I feel anxious when selecting a
search term for seeking information related to my research”. Finally, the seventh factor
comprised five (5) items and explained only 2.787% of the variance. The items within this
factor exhibited rotated factor loadings ranging from 0.418 to 0.774. This factor was named
as Access barriers. Examples of items retained in this sub-scale are, “restricted access to
the required full text resources make me anxious during the information seeking process”
and “I feel anxious when I know useful information resource, but I do not have access to
them”.
To determine the internal reliability of all seven (7) sub-scales as well as the overall scale,
Cronbach’s coefficient alpha was calculated. Reliability analysis using Cronbach’s alpha
revealed two (2) problematic items from two (2) out of the seven (7) dimensions of the
scale which were subsequently eliminated. Score reliability as measured by coefficient
alpha was 0.832 for the first subscale. Dropping any of the ten (10) items would not
significantly raise the value of Cronbach’s alpha coefficient higher than the present value of
0.832. Hence all the ten (10) items are necessary for the measure of continuance
commitment to be internally reliable. The second sub-scale presented acceptable internal
160
consistency for the reliability analysis that yielded an alpha coefficient value of 0.783.
Further assessment of the item-total correlation revealed that the value of alpha coefficient
of this sub-scale would not increase if any of the statements were removed from the
analysis. Therefore, seven (7) statements comprised valid and reliable measures of the
second sub-dimension.
Cronbach’s coefficient alpha was also calculated for the third factor. This factor scored a
Cronbach’s alpha of 0.723, which is an acceptable value of internal consistency. Inspection
of the internal reliability analysis revealed that dropping item 31 from the subscale had the
effect of raising alpha coefficient from 0.723 to 0.745. As a result, the number of valid and
reliable items in the third factor decreased to only three (3) items. The resultant alpha
coefficient of 0.784 for the fourth factor provided evidence of adequate internal
consistency. Inspection of the internal reliability analysis revealed that deletion any of the
six (6) items would not increase the alpha coefficient of the sub-scale higher than the
present value. Therefore, six (6) statements comprised valid and reliable measures of the
second dimension.
The alpha coefficient for the fifth factor was 0.794 which indicated a good level of internal
consistency. Further assessment of the item-total correlation revealed that the value of
alpha coefficient of this sub-scale would not increase if any of the statements were removed
from the analysis. Therefore, five (5) statements comprised valid and reliable measures of
the sixth sub-dimension. To determine the internal consistency of the sixth factor,
Cronbach’s coefficient alpha was calculated, yielded a reliability estimation of 0.763,
which is an acceptable value of internal consistency. Dropping any one of the three (3)
items would not significantly increase the value of alpha coefficient. As a result, the totals

161
of three (3) valid and reliable items remained in the sixth sub-scale. Finally, the internal
consistency coefficient of the seventh factor was 0.704, which is an acceptable value. After
examining the internal reliability analysis, it was decided to drop item 14 from this factor
which increased the Cronbach’s alpha from 0.704 to 0.730. As a result, the number of valid
and reliable statements in the seventh factor decreased to only four (4) items.
After examining the item-total statistics output for each sub-scale, it was determined to
drop two (2) items from the third and seventh sub-scales of the Information Seeking
Anxiety Scale (ISAS), which increased the Cronbach’s coefficient alpha. Dropping these
two (2) items reduced the number of valid and reliable statements to only thirty-eight (38)
items. No other modifications or deletions were made as a result of the reliability analysis.
Additionally, the resultant alpha coefficient of 0.917 for overall scale provided evidence of
adequate internal consistency of the Information Seeking Anxiety Scale.
Descriptive statistics for each sub-scale of the Information Seeking Anxiety Scale (ISAS)
was also analyzed. Table 4.13 shows the mean, median, mode, standard deviation, variance,
minimum and maximum for each of the seven (7) dimensions of the ISAS (See Table 4.11).

162
Table 4.11: Descriptive Statistics for sub-scales of the ISAS
Composite
Variable
Mean Median Mode SD Variance Min Max
Barriers Assoc.
with Libraries
23.261 23.2 18.2 6.293 39.603 9.1 42.4
Barriers Assoc.
with Information
Resources
21.541 22.285 24.57 4.153 17.251 6.14 30.71
Barriers Assoc.
with Computers,
the Internet &
Elec. Resources
7.146 6.5 6.5 2.682 7.196 3.25 16
Technological Barriers
14.816 14.666 10.33 4.07 16.568 5.17 24.67
Affective
Barriers
12.345 12.4 10.4 3.458 11.958 4.20 21
Barriers Assoc.
with Topic
Identification
7.556 8 9.33 2.141 4.584 2.33 11.67
Access Barrier 11.509 12 13 2.617 6.853 4.25 16.25
The results of the test of normality using skewness and kurtosis confirmed the assumption
that the variables are normally distributed (See Table 4.14). Skewness measures the degree
of symmetry in the distribution while kurtosis measures the degree to which the frequencies
are distributed close to the mean or closer to the extremes. A variable is reasonably close to
normal if its skewness and kurtosis indexes have values between – 1.0 and 1.0. Analysis of
univariate outliers was examined using histograms and normality curves. While some of the
items were slightly skewed, there were no clear univariate outliers for any of the variables.
As a result of running skewness and kurtosis tests, it was considered acceptable to run
parametric tests using each of the seven (7) sub-scales of the Information Seeking Anxiety
Scale (ISAS) as the dependant variable. The normal distribution of the seven (7) sub-scales
of the Information Seeking Anxiety Scale (ISAS) is further cleared by histogram for each
dimension (See Table 4.12, Figures 4.4 to 4.10).

163
Table 4.12: Test of Normality Using Skewness and Kurtosis
Composite Variable Skewness Std. Error of
Skewness
Kurtosis Std. Error
of Kurtosis
Barriers Assoc. with Libraries -0.011 0.126 0.847 0.251
Barriers Assoc. with Information
Resources
-0.503 0.126 0.384 0.251
Barriers Assoc. with Computers, the Internet & Elec. Resources
0.644 0.126 0.060 0.251
Technological Barriers -0.300 0.126 -0.341 0.251
Affective Barriers -0.033 0.126 -0.647 0.251
Barriers Assoc. with Topic Identification
-0.311 0.126 -0.767 0.251
Access Barrier -0.440 0.126 -0.464 0.251
Figure 4.4: Histogram for the “Barriers Associated with Libraries” Dimension

164
Figure 4.5: Histogram for the “Barriers Associated with Information Resources” Dimension
Figure 4.6: Histogram for the “Barriers Associated with Computers, the Internet and
Electronic Resources” Dimension

165
Figure 4.7: Histogram for the “Technological Barriers” Dimension
Figure 4.8: Histogram for the “Affective Barriers” Dimension

166
Figure 4.9: Histogram for the “Barriers Associated with Topic Identification” Dimension
Figure 4.10: Histogram for the “Access Barriers” Dimension
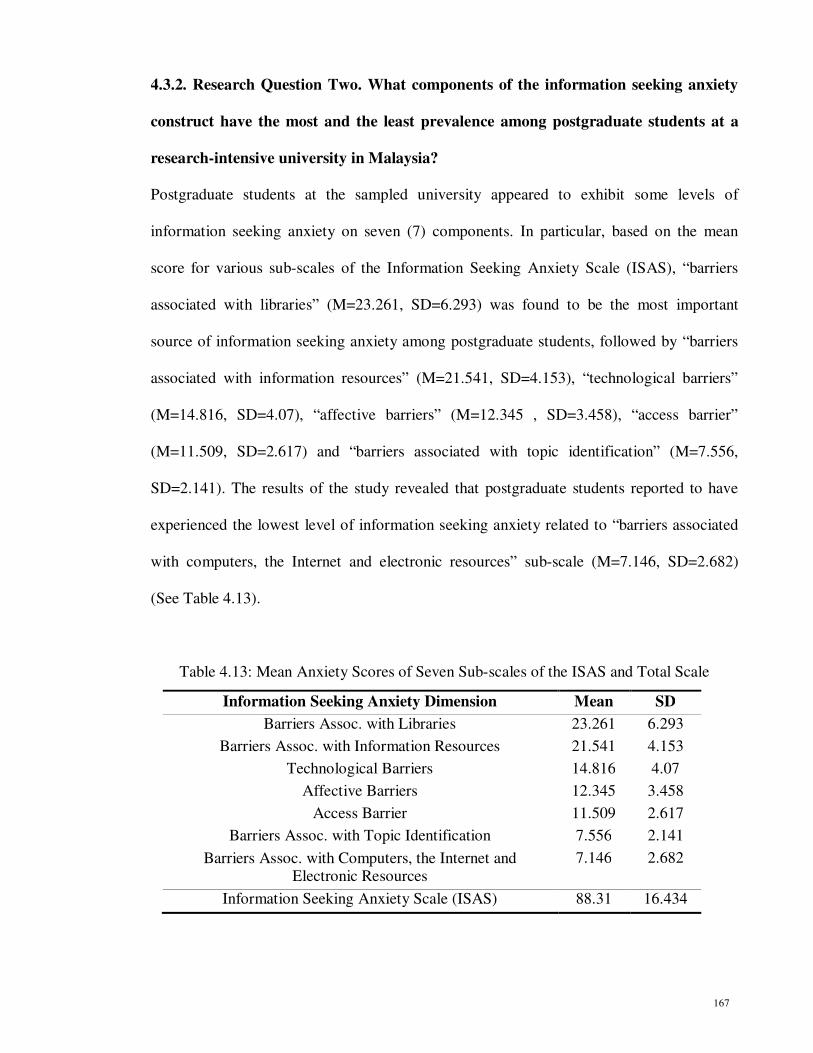
167
4.3.2. Research Question Two. What components of the information seeking anxiety
construct have the most and the least prevalence among postgraduate students at a
research-intensive university in Malaysia?
Postgraduate students at the sampled university appeared to exhibit some levels of
information seeking anxiety on seven (7) components. In particular, based on the mean
score for various sub-scales of the Information Seeking Anxiety Scale (ISAS), “barriers
associated with libraries” (M=23.261, SD=6.293) was found to be the most important
source of information seeking anxiety among postgraduate students, followed by “barriers
associated with information resources” (M=21.541, SD=4.153), “technological barriers”
(M=14.816, SD=4.07), “affective barriers” (M=12.345 , SD=3.458), “access barrier”
(M=11.509, SD=2.617) and “barriers associated with topic identification” (M=7.556,
SD=2.141). The results of the study revealed that postgraduate students reported to have
experienced the lowest level of information seeking anxiety related to “barriers associated
with computers, the Internet and electronic resources” sub-scale (M=7.146, SD=2.682)
(See Table 4.13).
Table 4.13: Mean Anxiety Scores of Seven Sub-scales of the ISAS and Total Scale
Information Seeking Anxiety Dimension Mean SD
Barriers Assoc. with Libraries 23.261 6.293
Barriers Assoc. with Information Resources 21.541 4.153
Technological Barriers 14.816 4.07
Affective Barriers 12.345 3.458
Access Barrier 11.509 2.617
Barriers Assoc. with Topic Identification 7.556 2.141
Barriers Assoc. with Computers, the Internet and Electronic Resources
7.146 2.682
Information Seeking Anxiety Scale (ISAS) 88.31 16.434

168
The mean information seeking anxiety score for overall scale was 88.31, which was
virtually the same as the median, at 88.395. The standard deviation was 16.434 with the
minimum score being 40 (the lowest possible score for the Information Seeking Anxiety
Scale) and the maximum score being 135 – the maximum score possible for the
Information Seeking Anxiety Scale is 200 – for a range of 95. The mean information
seeking anxiety score for overall scale indicated that while information seeking anxiety is
present, overall levels are not high.
The researcher also chose Anwar, Al-Kandari and Al-Qallaf’s (2004) proposed levels of
library anxiety as a useful way to analyzing the information seeking anxiety data. They
proposed five (5) levels of library anxiety including “no anxiety, low anxiety, mild anxiety,
moderate anxiety and severe anxiety” (Anwar, Al-Kandari & Al-Qallaf, 2004, p.274). Any
individual may be characterized as a mild anxious if his composite information seeking
anxiety score falls within one (1) standard deviation from the mean, or M ± SD. A person is
determine to have low anxiety if his composite score falls outside of one (1) standard
deviation to the left of the mean, but within two (2) standard deviations of the left of the
mean, or between M – SD and M – 2SD. However, if the anxiety falls within M + SD and
M + 2SD, the individual consider experiencing moderate level of anxiety. There will be no
anxiety if the anxiety score is below M – 2SD. Moreover, the anxiety level will be severe if
the score is above M + 2SD (Anwar, Al-Kandari & Al-Qallaf, 2004). Accordingly, levels
of information seeking anxiety determined using this method for each of the seven (7)
dimensions as well as the total scale.
Table 4.16 and Figure 4.11 present levels of information seeking anxiety stemming from
“barriers associated with libraries” dimension. As can be seen, the largest segment of

169
participants (68.4%) reported to have experienced mild information seeking anxiety
associated with this dimension. The number of respondents who reported to experiencing
no anxiety (1.9%) or severe anxiety (1.9%) was very limited (See Table 4.14, Figure 4.11).
Table 4.14: Levels of Information Seeking Anxiety Stemming from “Barriers Associated
with Libraries” Dimension
Dimension Levels of Anxiety Frequency Percent
Barriers Associated with Libraries
No Anxiety 7 1.9%
Low Anxiety 50 13.3%
Mild Anxiety 257 68.5%
Moderate Anxiety 54 14.4%
Severe Anxiety 7 1.9%
Figure 4.11: Bar Chart of Levels of Anxiety Stemming from “Barriers Associated with
Libraries” Dimension
Results of the study revealed that mild level of information seeking anxiety related to
“barriers associated with information resources” dimension were reported by 72.9% of the
participants. The number of respondents who reported to have experienced no anxiety

170
(3.5%) or severe anxiety (0.8%) was very limited. Additionally, those students who have
suffered from low anxiety (11.7%) or moderate anxiety (10.6%) were also quite small (See
Table 4.15 ,Figure 4.12).
4.15: Levels of Information Seeking Anxiety Stemming from “Barriers Associated with
Information Resources” Dimension
Dimension Levels of Anxiety Frequency Percent
Barriers Associated with Information Resources
No Anxiety 13 3.5%
Low Anxiety 44 11.8%
Mild Anxiety 274 73.3%
Moderate Anxiety 40 10.7%
Severe Anxiety 3 0.8%
Figure 4.12: Bar Chart of Levels of Anxiety Related to “Barriers Associated with
Information Resources” Dimension
It is clear from the data presented in table and figure below (See Table 4.18, Figure 4.13)
that 84.3% of the respondents reported to have experienced low or mild levels of
information seeking anxiety related to “barriers associated with computers, the Internet and
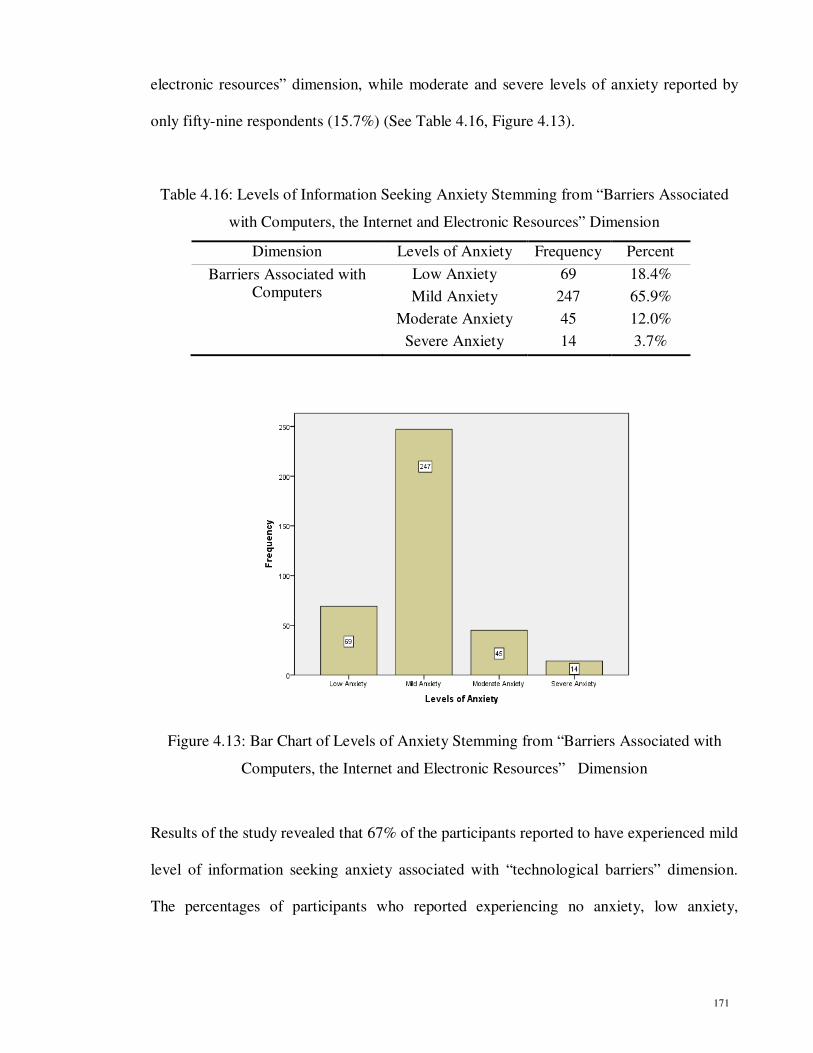
171
electronic resources” dimension, while moderate and severe levels of anxiety reported by
only fifty-nine respondents (15.7%) (See Table 4.16, Figure 4.13).
Table 4.16: Levels of Information Seeking Anxiety Stemming from “Barriers Associated
with Computers, the Internet and Electronic Resources” Dimension
Dimension Levels of Anxiety Frequency Percent
Barriers Associated with Computers
Low Anxiety 69 18.4%
Mild Anxiety 247 65.9%
Moderate Anxiety 45 12.0%
Severe Anxiety 14 3.7%
Figure 4.13: Bar Chart of Levels of Anxiety Stemming from “Barriers Associated with
Computers, the Internet and Electronic Resources” Dimension
Results of the study revealed that 67% of the participants reported to have experienced mild
level of information seeking anxiety associated with “technological barriers” dimension.
The percentages of participants who reported experiencing no anxiety, low anxiety,
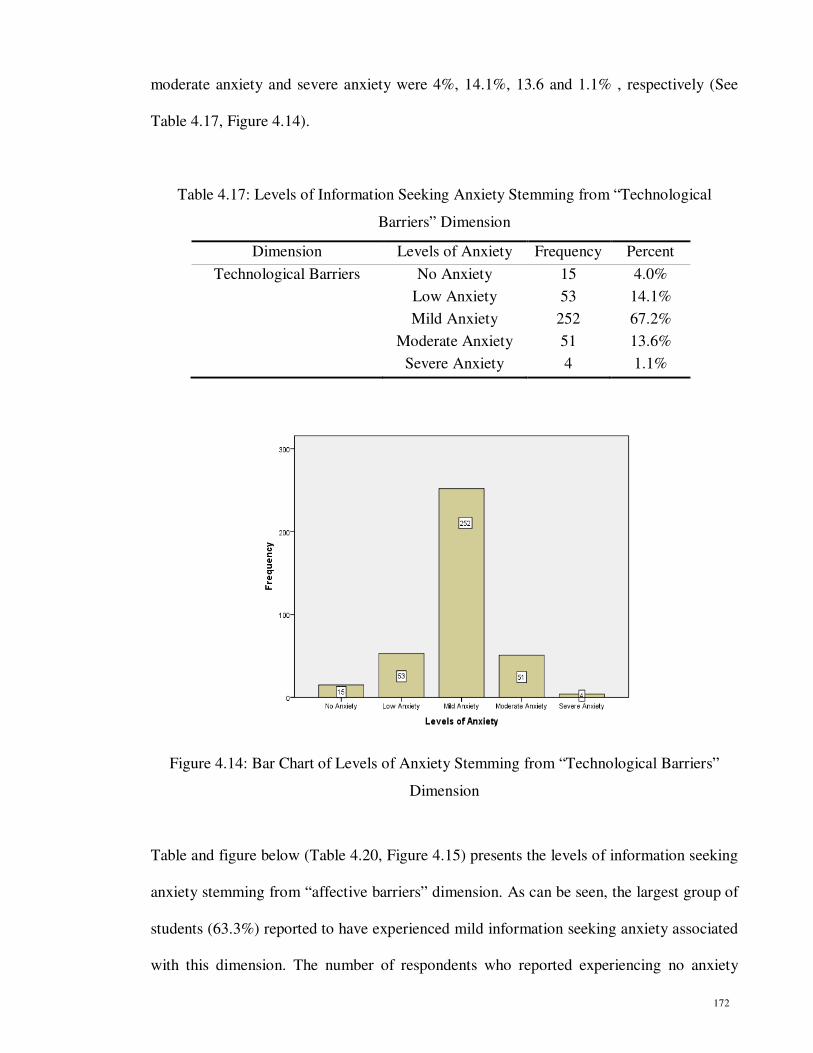
172
moderate anxiety and severe anxiety were 4%, 14.1%, 13.6 and 1.1% , respectively (See
Table 4.17, Figure 4.14).
Table 4.17: Levels of Information Seeking Anxiety Stemming from “Technological
Barriers” Dimension
Dimension Levels of Anxiety Frequency Percent
Technological Barriers No Anxiety 15 4.0%
Low Anxiety 53 14.1%
Mild Anxiety 252 67.2%
Moderate Anxiety 51 13.6%
Severe Anxiety 4 1.1%
Figure 4.14: Bar Chart of Levels of Anxiety Stemming from “Technological Barriers”
Dimension
Table and figure below (Table 4.20, Figure 4.15) presents the levels of information seeking
anxiety stemming from “affective barriers” dimension. As can be seen, the largest group of
students (63.3%) reported to have experienced mild information seeking anxiety associated
with this dimension. The number of respondents who reported experiencing no anxiety

173
(2.9%) or severe anxiety (0.5%) was very limited. Additionally, low and moderate levels of
information seeking anxiety were reported to have experienced by only 13.6% and 19.4%
of students, respectively (See Table 4.18 and Figure 4.15).
Table 4.18: Levels of Information Seeking Anxiety Stemming from “Affective Barriers”
Dimension
Dimension Levels of Anxiety Frequency Percent
Affective Barriers No Anxiety 11 2.9%
Low Anxiety 51 13.6%
Mild Anxiety 238 63.5%
Moderate Anxiety 73 19.5%
Severe Anxiety 2 0.5%
Figure 4.15: Bar Chart of Levels of Anxiety Stemming from “Affective Barriers”
Dimension
It is clear from the data presented in table and figure below (Table 4.21, Figure 4.16) that
aboout 90% of the respondents reported to have experienced no, low or mild levels of
information seeking anxiety stemming from “barriers associated with topic identification”

174
dimension, while none of the respondnets reported suffering from severe information
seeking anxiety (See Table 4.19, Figure 4.16).
Table 4.19: Levels of Information Seeking Anxiety Stemming from “Barriers Associated
with Topic Identification” Dimension
Dimension Levels of Anxiety Frequency Percent
Barriers Associated with Topic Identification
No Anxiety 7 1.9%
Low Anxiety 86 22.9%
Mild Anxiety 244 65.1%
Moderate Anxiety 38 10.1%
Figure 4.16: Bar Chart of Levels of Anxiety Stemming from “Barriers Associated with
Topic Identification” Dimension
Results of the study revealed that 68.8% of the participants reported to have experienced
mild level of information seeking anxiety associated with “access barriers” dimension. The
percentages of the participants who reported to have experienced no anxiety, low anxiety
and moderate anxiety were 2.7%, 16% and 12.5%, respectively. Additionally, none of the

175
participants reported experiencing severe information seeking anxiety associated with the
“affective barriers” dimension (See Table 4.20 and Figure 4.17).
Table 4.20: Levels of Information Seeking Anxiety Stemming from “Access Barriers”
Dimension
Dimension Levels of Anxiety Frequency Percent
Access Barriers No Anxiety 10 2.7%
Low Anxiety 60 16.0%
Mild Anxiety 258 68.8%
Moderate Anxiety 47 12.5%
Figure 4.17: Bar Chart of Levels of Anxiety Stemming from “Access Barriers” Dimension
Finally, investigating overall information seeking anxiety scores of participants showed that
about 70% of the postgraduate students at the sampled university reported to have
experienced mild level of information seeking anxiety, while moderate and severe levels of
information seeking anxiety were reported only by fifty-eight (15.5%) postgraduate

176
students. In sum, different levels of the information seeking anxiety phenomenon were
reported by 96.5% of the postgraduate students at the sampled university (Table 4.21
Figure 4.18).
Table 4.21: Overall Levels of Information Seeking Anxiety
Dimension Levels of Anxiety Frequency Percent
Mechanical Barriers No Anxiety 13 3.5%
Low Anxiety 44 11.8%
Mild Anxiety 259 69.3%
Moderate Anxiety 52 13.9%
Severe Anxiety 6 1.6%
Figure 4.18: Bar Chart of Overall Levels of Information Seeking Anxiety

177
4.3.3. Research Question 3. Do statistically significant mean differences, relationships
and main and interaction effects exist between various dimensions of the information
seeking anxiety construct and selected independent variables (gender, level of study,
nationality, information literacy skills instruction received, students’ academic major,
age, frequency of library use and frequency of Internet use) among postgraduate
students at a research-intensive university in Malaysia?
After identifying the seven (7) dimensions of the information seeking anxiety (i.e. barriers
associated with libraries, barriers associated with information resources, barriers associated
with computers, the Internet and electronic resources, technological barriers, affective
barriers, barriers associated with topic identification and access barrier), statistical analysis
were performed to test the eighteen (18) research hypotheses. The tests were performed to
see whether there are any statistically significant mean differences, relationships or
interactions between seven (7) dimensions of the Information Seeking Anxiety Scale
(ISAS) and selected demographic variables. These variables are as follow: gender, level of
study, nationality, participation in information literacy skills instruction sessions, academic
major, age, frequency of library use and frequency of the Internet use. A series of
Independent sample t-tests were employed to determine whether any statistically significant
mean differences exist between:
a) Gender and various dimensions of the information seeking anxiety;
b) Level of study and various dimensions of the information seeking anxiety;
c) Nationality and various dimensions of the information seeking anxiety;
d) Information literacy skills instruction received and various dimensions of the
information seeking anxiety; and
e) Academic major (two groups) and various dimensions of the information seeking
anxiety.

178
A series of one way analysis of variance (ANOVA) tests were employed to determine
whether any statistically significant mean differences exist between student’s academic
major (four groups) and various sub-scales of the information seeking anxiety construct.
Additionally, Pearson Product Moment Correlation tests were performed to test the
relationships between:
a) Age and various dimensions of the information seeking anxiety;
b) Frequency of library use and various dimensions of the information seeking anxiety; and
c) Frequency of the Internet use and various dimensions of the information seeking anxiety.
Finally a series of 2 × 2 factorial ANOVAs were performed to test each of the main effects
and interaction effects of:
a) Gender and nationality on various dimensions of the information seeking anxiety;
b) Gender and level of study on various dimensions of the information seeking anxiety;
c) Gender and nationality on various dimensions of the information seeking anxiety;
d) Gender and participation in information literacy skills instruction sessions on various
dimensions of the information seeking anxiety;
e) Academic major and level of study on various dimensions of the information seeking
anxiety;
f) Academic major and nationality on various dimensions of the information seeking
anxiety;
g) Academic Major and participation in information literacy skills instruction sessions on
various dimensions of the information seeking anxiety;
h) Nationality and level of study on various dimensions of the information seeking anxiety;
179
i) Nationality and participation in information literacy skills instruction sessions on various
dimensions of the information seeking anxiety; and
j) Level of study and participation in information literacy skills instruction sessions on
various dimensions of the information seeking anxiety.
4.3.3.1. Hypotheses 1. There are statistically significant mean differences in various
dimensions of the information seeking anxiety construct between male and female
postgraduate students.
The independent sample t-test is used for testing the differences between the means of two
(2) independent groups. In any one analysis there must be:
a) Only one (1) independent variable (IV) (e.g., subject’s gender)
b) Only two (2) levels for that independent variable (IV) (e.g., male and female)
c) Only one (1) dependent variable.
In order to investigate whether any statistically significant mean differences exist in the
various dimensions of the information seeking anxiety construct between male and female
postgraduate students, a series of independent sample t-tests were employed. This section
reports gender differences with the various sub-scales of the information seeking anxiety:
a) Gender and barriers associated with libraries;
b) Gender and barriers associated with information resources;
c) Gender and barriers associated with computers, the Internet and electronic resources;
d) Gender and technological barriers;
e) Gender and affective barriers;

180
f) Gender and barriers associated with topic identification; and
g) Gender and access barriers.
4.3.3.1.1. Gender and Barriers Associated with Libraries Dimension
The results of running an independent sample t-test revealed that no statistically significant
mean difference existed [t (373) = -0.346, p>0.05] between male (M=23.372, SD= 6.615)
and female (M=23.147, SD=5.959) postgraduate students with regard to their scores on
“barriers associated with libraries” dimension of the information seeking anxiety (See
Table 4.22).
Table 4.22: Gender and “Barriers Associated with Libraries” Dimension
Gender N Mean SD t df Sig.
Female 185 23.147 5.959
-0.346 373 0.730
Male 190 23.372 6.615
p>0.05
4.3.3.1.2. Gender and Barriers Associated with Information Resources Dimension
The results of running an independent sample t-test revealed a statistically significant mean
difference [t (373) = 3.009, p<0.05] between male (M=20.911, SD=4.108) and female
(M=22.188, SD=4.109) postgraduate students with regard to their scores on “barriers
associated with information resources” dimension of the information seeking anxiety (See
Table 4.23). Female postgraduate students were found to have experienced statistically
significantly higher levels of information seeking anxiety related to “barriers associated
with information resources” dimension than male postgraduate students.

181
Table 4.23: Gender and “Barriers Associated with Information Resources” Dimension
Gender N Mean SD t df Sig.
Female 185 22.188 4.109
3.009 373 0.003
Male 190 20.911 4.108
P<0.05
4.3.3.1.3. Gender and Barriers Associated with Computers, the Internet and Electronic
Resources Dimension
The results of running an independent sample t-test revealed no statistically significant
mean difference [t (373) = -0.944, p>0.05] between male (M=7.275, SD=2.912) and female
(M=7.013, SD=2.423) postgraduate students with regard to their scores on “barriers
associated with computers, the Internet and electronic resources” dimension of the
information seeking anxiety (See Table 4.24).
Table 4.24: Gender and “Barriers Associated with Computers, the Internet and Electronic
Resources” Dimension
Gender N Mean SD t df Sig.
Female 185 7.013 2.423
-0.944 373 0.346
Male 190 7.275 2.912
p>0.05
4.3.3.1.4. Gender and Technological Barriers Dimension
The results of running an independent sample t-test revealed no statistically significant
mean difference [t (373) =1.659, p>0.05] between male (M=14.472, SD=4.110) and female
(M=15.168, SD=4.008) postgraduate students with regard to their scores on “technological
barriers” dimension of the information seeking anxiety (See Table 4.25).

182
Table 4.25: Gender and “Technological Barriers” Dimension
Gender N Mean SD t df Sig.
Female 185 15.168 4.008
1.659 373 0.098
Male 190 14.472 4.110
p>0.05
4.3.3.1.5. Gender and Affective Barriers Dimension
The results of running an independent sample t-test showed that no statistically significant
mean difference existed [t (373) =1.471, p>0.05] between female postgraduate students
(M=12.610, SD=3.555) and male postgraduate students (M=12.086, SD=3.349) with regard
to their scores on “affective barriers” sub-scale of the information seeking anxiety (See
Table 4.26).
Table 4.26: Gender and “Affective Barriers” Dimension
Gender N Mean SD t df Sig.
Female 185 12.610 3.555
1.471 373 0.142
Male 190 12.086 3.349
p>0.05
4.3.3.1.6. Gender and Barriers Associated with Topic Identification Dimension
The results of running an independent sample t-test showed that no statistically significant
mean difference existed [t (373) =0.003, p>0.05] between female postgraduate students
(M=7.556, SD=2.198) and male postgraduate students (M=7.556, SD=2.089) with regard to
their scores on “barriers associated with topic identification” sub-scale of the information
seeking anxiety (See Table 4.27).

183
Table 4.27: Gender and “Barriers Associated with Topic Identification” Dimension
Gender N Mean SD t df Sig.
Female 185 7.556 2.198
0.003 373 0.998
Male 190 7.556 2.089
p>0.05
4.3.3.1.7. Gender and Access Barriers Dimension
The results of running an independent sample t-test revealed a statistically significant mean
difference [t (373) =2.474, p<0.05] between male (M=11.181, SD=2.715) and female
(M=11.845, SD=2.475) postgraduate students with regard to their scores on “access
barriers” dimension of the information seeking anxiety (See Table 4.28). Female
postgraduate students were found to have experienced statistically significantly higher
levels of information seeking anxiety related to “access barriers” dimension than male
postgraduate students.
Table 4.28: Gender and “Access Barriers” Dimension
Gender N Mean SD t df Sig.
Female 185 11.845 2.475
2.474 373 0.014
Male 190 11.181 2.715
P<0.05
A series of independent sample t-tests were employed to determine if there were any gender
differences in the mean anxiety of various sub-dimensions of the information seeking
anxiety. Female postgraduate students were found to have experienced higher levels of
information seeking anxiety associated with five (5) out of seven (7) dimensions of the
ISAS than their male counterparts. Statistically significant differences in anxiety levels

184
were found between male and female postgraduate students in the “barriers associated
with information resources” and “access barriers” dimensions, that is, female students
were found to experience statistically significantly higher levels of information seeking
anxiety with regard to these two (2) dimensions than male students (See Table 4.29). The
differences found between female and male postgraduate students in mean anxiety values
of other five (5) sub-scales of information seeking anxiety were not statistically significant
(p<0.05).
Table 4.29: Means and Standard Deviations for Information Seeking Anxiety Dimensions
as a Function of Gender
Sub-scales Male Female P value
Mean SD Mean SD
Barriers Associated with Libraries 23.372 6.615 23.147 5.959 0.730
Barriers Associated with Information
Resources
20.911 4.108 22.188 4.109 0.003 *
Barriers Associated with Computers, the Internet and Electronic Resources
7.275 2.912 7.013 2.423 0.346
Technological Barriers 14.472 4.110 15.168 4.008 0.098
Affective Barriers 12.086 3.349 12.610 3.555 0.142
Barriers Associated with Topic
Identification
7.556 2.089 7.556 2.198 0.998
Access Barriers 11.181 2.715 11.845 2.475 0.014 *
* p<0.05
4.3.3.2. Hypotheses 2. There are statistically significant mean differences in various
dimensions of the information seeking anxiety construct between master’s level
students and doctoral level students.
In order to investigate whether any statistically significant mean differences exist in the
various dimensions of the information seeking anxiety construct between master’s level and
doctoral level students, a series of independent sample t-tests were employed. This section
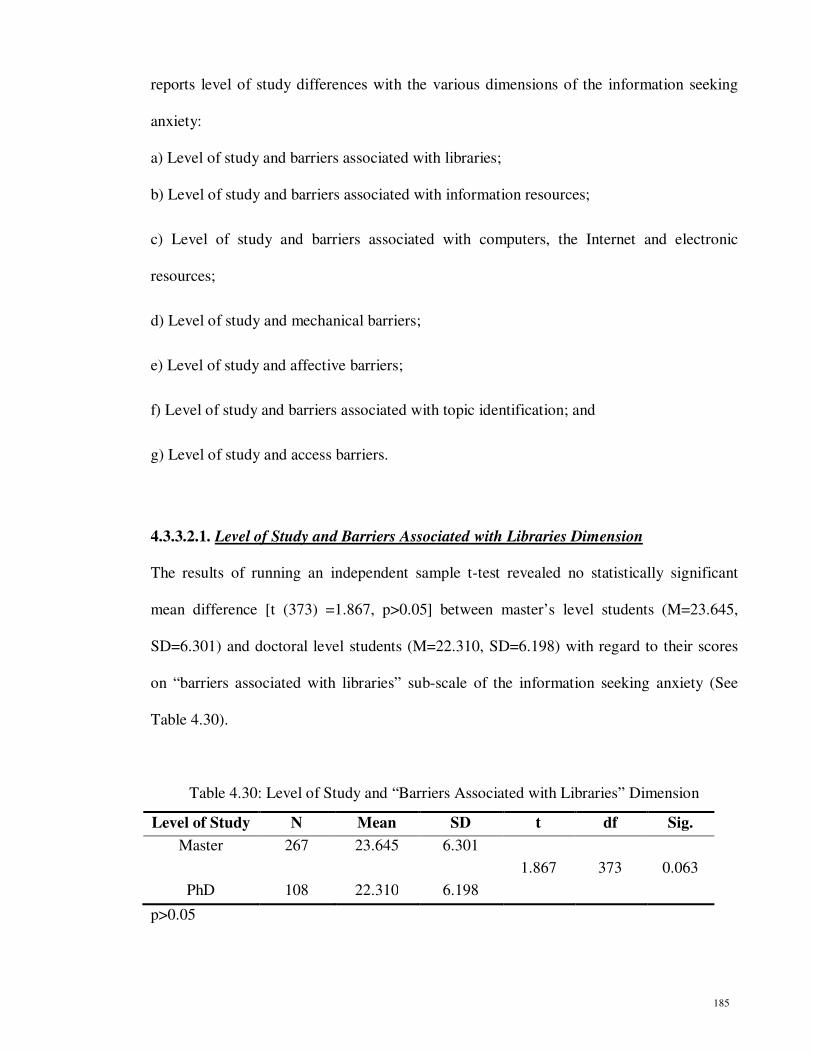
185
reports level of study differences with the various dimensions of the information seeking
anxiety:
a) Level of study and barriers associated with libraries;
b) Level of study and barriers associated with information resources;
c) Level of study and barriers associated with computers, the Internet and electronic
resources;
d) Level of study and mechanical barriers;
e) Level of study and affective barriers;
f) Level of study and barriers associated with topic identification; and
g) Level of study and access barriers.
4.3.3.2.1. Level of Study and Barriers Associated with Libraries Dimension
The results of running an independent sample t-test revealed no statistically significant
mean difference [t (373) =1.867, p>0.05] between master’s level students (M=23.645,
SD=6.301) and doctoral level students (M=22.310, SD=6.198) with regard to their scores
on “barriers associated with libraries” sub-scale of the information seeking anxiety (See
Table 4.30).
Table 4.30: Level of Study and “Barriers Associated with Libraries” Dimension
Level of Study N Mean SD t df Sig.
Master 267 23.645 6.301
1.867 373 0.063
PhD 108 22.310 6.198
p>0.05

186
4.3.3.2.2. Level of Study and Barriers Associated with Information Resources Dimension
The results of running an independent sample t-test revealed no statistically significant
mean difference [t (373) =1.850, p>0.05] between master’s level students (M=21.792,
SD=4.196) and doctoral level students (M=20.919, SD=3.996) with regard to their scores
on “barriers associated with information resources” dimension of the information seeking
anxiety (See Table 4.31).
Table 4.31: Level of Study and “Barriers Associated with Information Resources”
Dimension
Level of Study N Mean SD t df Sig.
Master 267 21.792 4.196
1.850 373 0.065
PhD 108 20.919 3.996
p>0.05
4.3.3.2.3. Level of Study and Barriers Associated with Computers, the Internet and
Electronic Resources Dimension
The results of running an independent sample t-test revealed a statistically significant mean
difference [t (373) =2.277, p<0.05] between master’s level students (M=7.345, SD=2.631)
and doctoral level students (M=6.652, SD=2.755) with regard to their scores on “barriers
associated with computers, the Internet and electronic resources” dimension of the
information seeking anxiety (See Table 4.32). Master’s level students were found to have
experienced statistically significantly higher levels of information seeking anxiety
stemming from “barriers associated with computers, the Internet and electronic resources”
dimension than doctoral level students.
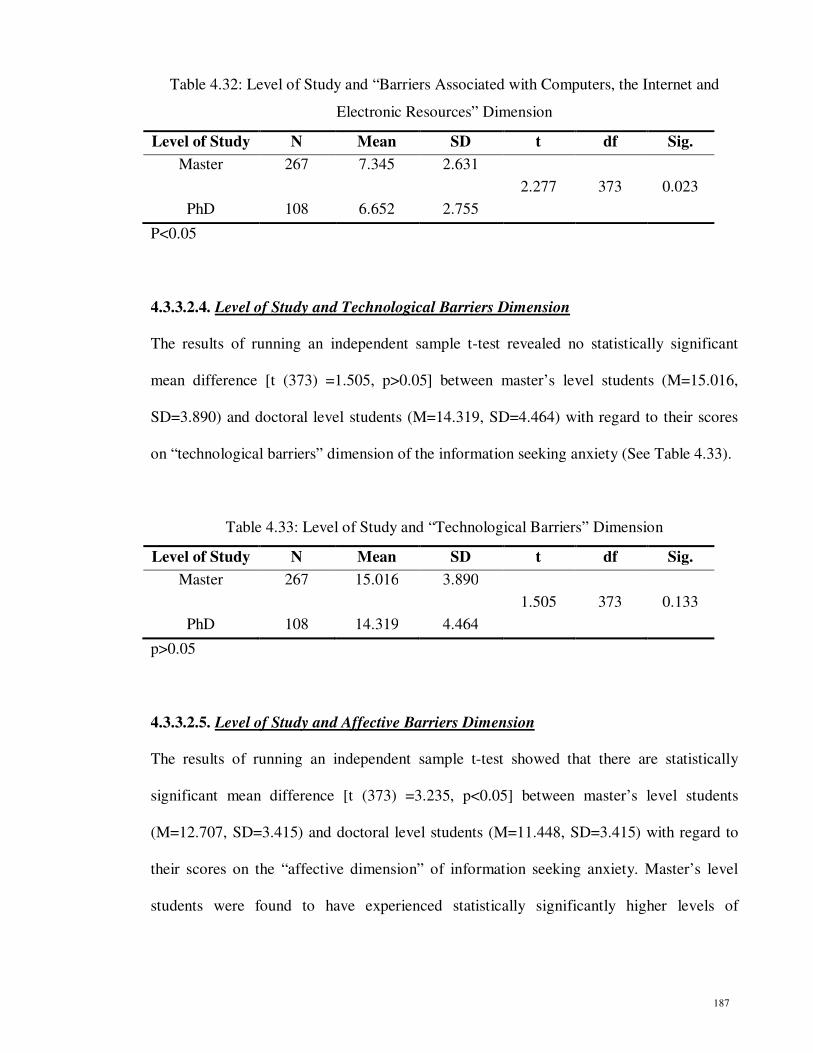
187
Table 4.32: Level of Study and “Barriers Associated with Computers, the Internet and
Electronic Resources” Dimension
Level of Study N Mean SD t df Sig.
Master 267 7.345 2.631
2.277 373 0.023
PhD 108 6.652 2.755
P<0.05
4.3.3.2.4. Level of Study and Technological Barriers Dimension
The results of running an independent sample t-test revealed no statistically significant
mean difference [t (373) =1.505, p>0.05] between master’s level students (M=15.016,
SD=3.890) and doctoral level students (M=14.319, SD=4.464) with regard to their scores
on “technological barriers” dimension of the information seeking anxiety (See Table 4.33).
Table 4.33: Level of Study and “Technological Barriers” Dimension
Level of Study N Mean SD t df Sig.
Master 267 15.016 3.890
1.505 373 0.133
PhD 108 14.319 4.464
p>0.05
4.3.3.2.5. Level of Study and Affective Barriers Dimension
The results of running an independent sample t-test showed that there are statistically
significant mean difference [t (373) =3.235, p<0.05] between master’s level students
(M=12.707, SD=3.415) and doctoral level students (M=11.448, SD=3.415) with regard to
their scores on the “affective dimension” of information seeking anxiety. Master’s level
students were found to have experienced statistically significantly higher levels of

188
information seeking anxiety associated with “affective barriers” dimension than doctoral
students (See Table 4.34).
Table 4.34: Level of Study and “Affective Barriers” Dimension
Level of Study N Mean SD t df Sig.
Master 267 12.707 3.415
3.235 373 0.001
PhD 108 11.448 3.415
P<0.05
4.3.3.2.6. Level of Study and Barriers Associated with Topic Identification Dimension
The results of running an independent sample t-test showed that no statistically significant
mean difference existed [t (373) =1.553, p>0.05] between master’s level students
(M=7.665, SD=2.139) and doctoral level students (M=7.287, SD=2.131) with regard to
their scores on “barriers associated with topic identification” dimension of information
seeking anxiety (See Table 4.35).
Table 4.35: Level of Study and “Barriers Associated with Topic Identification” Dimension
Level of Study N Mean SD t df Sig.
Master 267 7.665 2.139
1.553 373 0.121
PhD 108 7.287 2.131
p>0.05
4.3.3.2.7. Level of Study and Access Barriers Dimension
The results of running an independent sample t-test showed that no statistically significant
mean difference existed [t (373) =0.708, p>0.05] between master’s level students
(M=11.570, SD=2.603) and doctoral level students (M=11.358, SD=2.660) with regard to

189
their scores on “access barriers” dimension of information seeking anxiety (See Table
4.36).
Table 4.36: Level of Study and “Access Barriers” Dimension
Level of Study N Mean SD t df Sig.
Master 267 11.570 2.603
0.708 373 0.480
PhD 108 11.358 2.660
p>0.05
A series of independent sample t-tests were employed to determine if there were any
statistically significant differences in the mean anxiety of various dimensions of
information seeking anxiety between master’s level students and doctoral level students.
The results of study revealed that master’s level students experienced higher level of
information seeking associated with all seven (7) dimensions of the ISAS, than their
doctoral level counterparts. Statistically significant differences in anxiety levels were found
between master’s level and doctoral level students in the “barriers associated with
computers, the Internet and electronic resources” and “affective barriers” dimensions, that
is, master’s level students were found to experience statistically significantly higher levels
of information seeking anxiety regard to these two (2) dimensions than did doctoral level
students. The differences found in mean anxiety values of other five (5) sub-scales of
information seeking anxiety between master’s level and doctoral level students were not
statistically significant (p<0.05) (See Table 4.37).

190
Table 4.37: Means and Standard Deviations for Information Seeking Anxiety Dimensions
as a Function of Level of Study
Sub-scales Master PhD P value
Mean SD Mean SD
Barriers Associated with Libraries 23.645 6.301 22.310 6.198 0.063
Barriers Associated with Information
Resources
21.792 4.196 20.919 3.996 0.065
Barriers Associated with Computers, the Internet and Electronic Resources
7.345 2.631 6.652 2.755 0.023 *
Technological Barriers 15.016 3.890 14.319 4.464 0.133
Affective Barriers 12.707 3.415 11.448 3.415 0.001 *
Barriers Associated with Topic
Identification
7.665 2.139 7.287 2.131 0.121
Access Barriers 11.570 2.603 11.358 2.660 0.480
* p<0.05
4.3.3.3. Hypotheses 3. There are statistically significant mean differences in various
dimensions of the information seeking anxiety construct between Malaysian students
and non-Malaysian students.
In order to investigate whether any statistically significant mean differences exist in the
various dimensions of the information seeking anxiety construct between Malaysian and
non-Malaysian postgraduate students, a series of independent sample t-tests were
employed. This section reports nationality differences with the various sub-scales of the
information seeking anxiety:
a) Nationality and barriers associated with libraries;
b) Nationality and barriers associated with information resources;
c) Nationality and barriers associated with computers, the Internet and electronic resources;
d) Nationality and technological barriers;
e) Nationality and affective barriers;

191
f) Nationality and barriers associated with topic identification; and
g) Nationality and access barriers.
4.3.3.3.1. Nationality and Barriers Associated with Libraries Dimension
An independent sample t-test was employed to examine mean difference between non-
Malaysian and Malaysian postgraduate student’s information seeking anxiety stemming
from “barriers associated with libraries”. No statistically significant mean difference was
identified between non-Malaysian (M=23.609, SD=6.071) and Malaysian (M=22.501,
SD=6.714) postgraduate students in terms of “barriers associated with libraries” dimension
of the information seeking anxiety [t (373) =-1.587, p>0.05] (See Table 4.38).
Table 4.38: Nationality and “Barriers Associated with Libraries” Dimension
Nationality N Mean SD t df Sig.
Malaysian 118 22.501 6.714
-1.587 373 0.113
Non-Malaysian
257 23.609 6.071
p>0.05
4.3.3.3.2. Nationality and Barriers Associated with Information Resources Dimension
The results of running an independent sample t-test revealed that no statistically significant
mean difference existed [t (373) =0.466, p>0.05] between Malaysian postgraduate students
(M=21.688, SD=4.074) and non-Malaysian postgraduate students (M=21.473, SD=4.195)
with regard to their scores on “barriers associated with information resources” dimension of
the information seeking anxiety (See Table 4.39).

192
Table 4.39: Nationality and “Barriers Associated with Information Resources” Dimension
Nationality N Mean SD t df Sig.
Malaysian 118 21.688 4.074
0.466 373 0.642
Non-Malaysian
257 21.473 4.195
p>0.05
4.3.3.3.3. Nationality and Barriers Associated with Computers, the Internet and
Electronic Resources Dimension
The results of running an independent sample t-test showed that no statistically significant
mean difference existed [t (373) =0.311, p>0.05] between Malaysian postgraduate students
(M=7.209, SD=2.788) and non-Malaysian postgraduate students (M=7.116, SD=2.637)
with regard to their scores on “barriers associated with computers, the Internet and
electronic resources” dimension of the information seeking anxiety (See Table 4.40).
Table 4.40: Nationality and “Barriers Associated Computers, the Internet and Electronic
Resources” Dimension
Nationality N Mean SD t df Sig.
Malaysian 118 7.209 2.788
0.311 373 0.756
Non-
Malaysian
257 7.116 2.637
p>0.05
4.3.3.3.4. Nationality and Technological Barriers Dimension
The results of running an independent sample t-test showed that no statistically significant
mean difference existed [t (373) =1.396, p>0.05] between Malaysian postgraduate students
(M=15.248, SD=4.381) and non-Malaysian postgraduate students (M=14.617, SD=3.912)

193
with regard to their scores on “technological barriers” dimension of the information seeking
anxiety (See Table 4.41).
Table 4.41: Nationality and “Technological Barriers” Dimension
Nationality N Mean SD t df Sig.
Malaysian 118 15.248 4.381
1.396 373 0.163
Non-Malaysian
257 14.617 3.912
p>0.05
4.3.3.3.5. Nationality and Affective Barriers Dimension
The results of running an independent sample t-test revealed no statistically significant
mean difference [t (373) =-0.010, p>0.05] between Malaysian (M=12.342, SD=3.672) and
non-Malaysian (M=12.346, SD=3.362) postgraduate students with regard to their scores on
“affective barrier” dimension of the information seeking anxiety (See Table 4.42).
Table 4.42: Nationality and “Affective Barriers” Dimension
Nationality N Mean SD t df Sig.
Malaysian 118 12.342 3.672
-0.010 373 0.992
Non-
Malaysian
257 12.346 3.362
p>0.05
4.3.3.3.6. Nationality and Barriers Associated with Topic Identification Dimension
The results of running an independent sample t-test revealed that no statistically significant
mean difference existed [t (373) =-0.086, p>0.05] between Malaysian postgraduate students
(M=7.542, SD=2.122) and non-Malaysian postgraduate students (M=7.562, SD=2.153)

194
with regard to their scores on the “barriers associated with topic identification” sub-scale of
the information seeking anxiety (See Table 4.43).
Table 4.43: Nationality and “Barriers Associated with Topic Identification” Dimension
Nationality N Mean SD t df Sig.
Malaysian 118 7.542 2.122
-0.086 373 0.931
Non-Malaysian
257 7.562 2.153
p>0.05
4.3.3.3.7. Nationality and Access Barriers Dimension
The results of running an independent sample t-test revealed that no statistically significant
mean difference existed [t (373) =0.144, p>0.05] between Malaysian postgraduate students
(M=11.538, SD=2.642) and non-Malaysian postgraduate students (M=11.496, SD=2.611)
with regard to their scores on the “barriers associated with topic identification” sub-scale of
the information seeking anxiety (See Table 4.44).
Table 4.44: Nationality and “Access Barriers” Dimension
Nationality N Mean SD t df Sig.
Malaysian 118 11.538 2.642
0.144 373 0.885
Non-Malaysian
257 11.496 2.611
p>0.05
A series of independent sample t-tests were employed to determine if there were any
statistically significant differences in the mean anxiety of various dimensions of the
information seeking anxiety construct between Malaysian and non-Malaysian postgraduate

195
students. The results of study revealed that Malaysian postgraduate students were reported
to have experienced higher level of information seeking associated with four (4) out of
seven (7) sub-dimensions of the Information Seeking Anxiety Scale, namely “barriers
associated with information resources,” “barriers associated with computers, the Internet
and electronic resources,” “technological barriers” and “access barriers” than their doctoral
level counterparts. No statistically significant differences were found between Malaysian
and non-Malaysian postgraduate students in terms of mean anxiety of seven (7) sub-scales
of the information seeking anxiety. In other words, the differences found in mean anxiety
values of all seven (7) sub-scales of information seeking anxiety between Malaysian and
non-Malaysian students were not statistically significant (p<0.05) (See Table 4.45).
Table 4.45: Means and Standard Deviations for Information Seeking Anxiety Dimensions
as a Function of Nationality
Sub-scales Malaysian Non-Malaysian P value
Mean SD Mean SD
Barriers Associated with Libraries 22.501 6.714 23.609 6.071 0.113
Barriers Associated with Information
Resources
21.688 4.074 21.473 4.195 0.642
Barriers Associated with Computers, the Internet and Electronic Resources
7.209 2.788 7.116 2.637 0.756
Technological Barriers 15.248 4.381 14.617 3.912 0.163
Affective Barriers 12.342 3.672 12.346 3.362 0.992
Barriers Associated with Topic
Identification
7.542 2.122 7.562 2.153 0.931
Access Barriers 11.538 2.642 11.496 2.611 0.885
p>0.05

196
4.3.3.4. Hypotheses 4. There are statistically significant mean differences in various
dimensions of the information seeking anxiety construct between students who have
received information literacy skills instruction and those who have not received
information literacy skills instructions.
In order to investigate whether any statistically significant mean differences exist in the
various dimensions of the information seeking anxiety construct between students who
have received information literacy skills instruction and those who have not, a series of
independent sample t-tests were employed. This section reports differences in the various
dimensions of the information seeking anxiety between those students who have received
information literacy skills instruction and those who have not:
a) Information literacy skills instruction received and barriers associated with libraries;
b) Information literacy skills instruction received and barriers associated with information
resources;
c) Information literacy skills instruction received and barriers associated with computers,
the Internet and electronic resources;
d) Information literacy skills instruction received and technological barriers;
e) Information literacy skills instruction received and affective barriers;
f) Information literacy skills instruction received and barriers associated with topic
identification; and
g) Information literacy skills instruction received and access barriers.

197
4.3.3.4.1. Information Literacy Skills Instruction Received and Barriers Associated with
Libraries Dimension
The results of running an independent sample t-test revealed no statistically significant
mean difference [t (373) =0.091, p>0.05] between students who have received information
literacy skills instruction (M=23.237, SD=6.763) and students who have not received
instruction (M=23.298, SD=5.478) with regard to their scores on “barriers associated with
libraries” dimension of the information seeking anxiety (See Table 4.46).
Table 4.46: Information Literacy Skills Instruction Received and “Barriers Associated with
Libraries” Dimension
Information Literacy Instruction Received
N Mean SD t df Sig.
Yes 144 23.237 6.763
0.091 373 0.927
No 231 23.298 5.478
p>0.05
4.3.3.4.2. Information Literacy Skills Instruction Received and Barriers Associated with
Information Resources Dimension
The results of running an independent sample t-test revealed no statistically significant
mean difference [t (373) =0.848, p>0.05] between students who have received information
literacy skills instruction (M=21.397, SD=4.293) and students who have not received
instruction (M=21.771, SD=3.921) with regard to their scores on “barriers associated with
information resources” dimension of the information seeking anxiety (See Table 4.47).
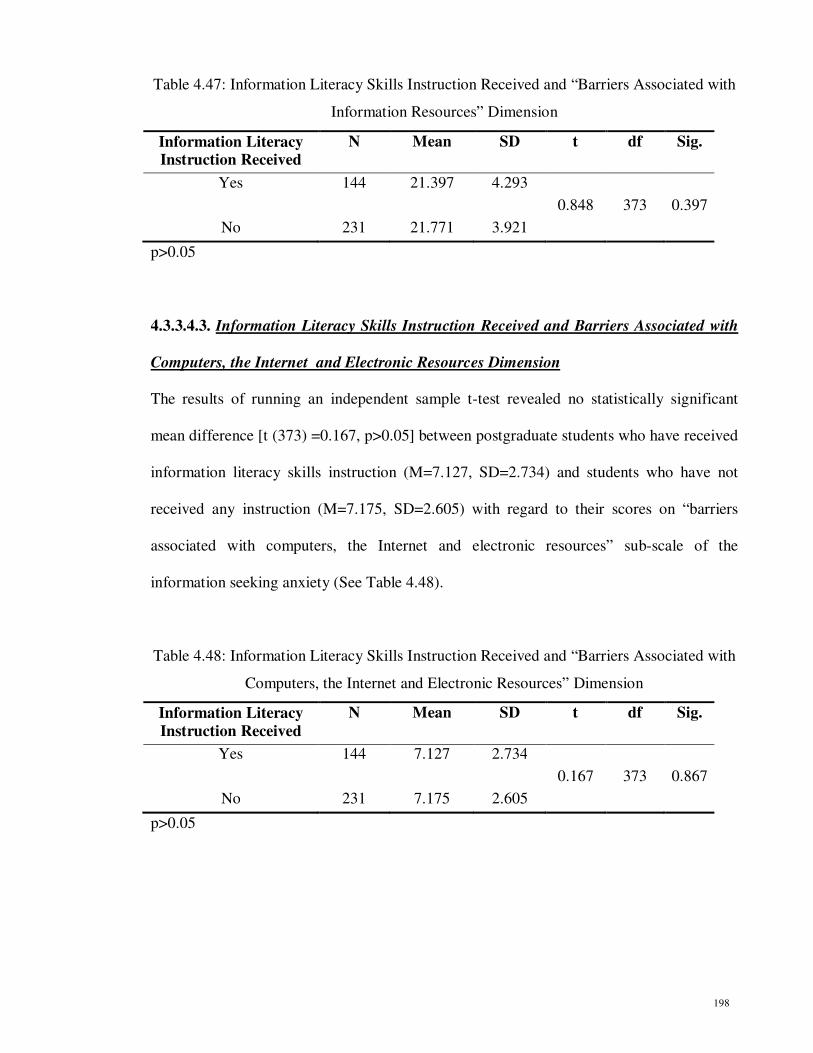
198
Table 4.47: Information Literacy Skills Instruction Received and “Barriers Associated with
Information Resources” Dimension
Information Literacy Instruction Received
N Mean SD t df Sig.
Yes 144 21.397 4.293
0.848 373 0.397
No 231 21.771 3.921
p>0.05
4.3.3.4.3. Information Literacy Skills Instruction Received and Barriers Associated with
Computers, the Internet and Electronic Resources Dimension
The results of running an independent sample t-test revealed no statistically significant
mean difference [t (373) =0.167, p>0.05] between postgraduate students who have received
information literacy skills instruction (M=7.127, SD=2.734) and students who have not
received any instruction (M=7.175, SD=2.605) with regard to their scores on “barriers
associated with computers, the Internet and electronic resources” sub-scale of the
information seeking anxiety (See Table 4.48).
Table 4.48: Information Literacy Skills Instruction Received and “Barriers Associated with
Computers, the Internet and Electronic Resources” Dimension
Information Literacy
Instruction Received
N Mean SD t df Sig.
Yes 144 7.127 2.734
0.167 373 0.867
No 231 7.175 2.605
p>0.05
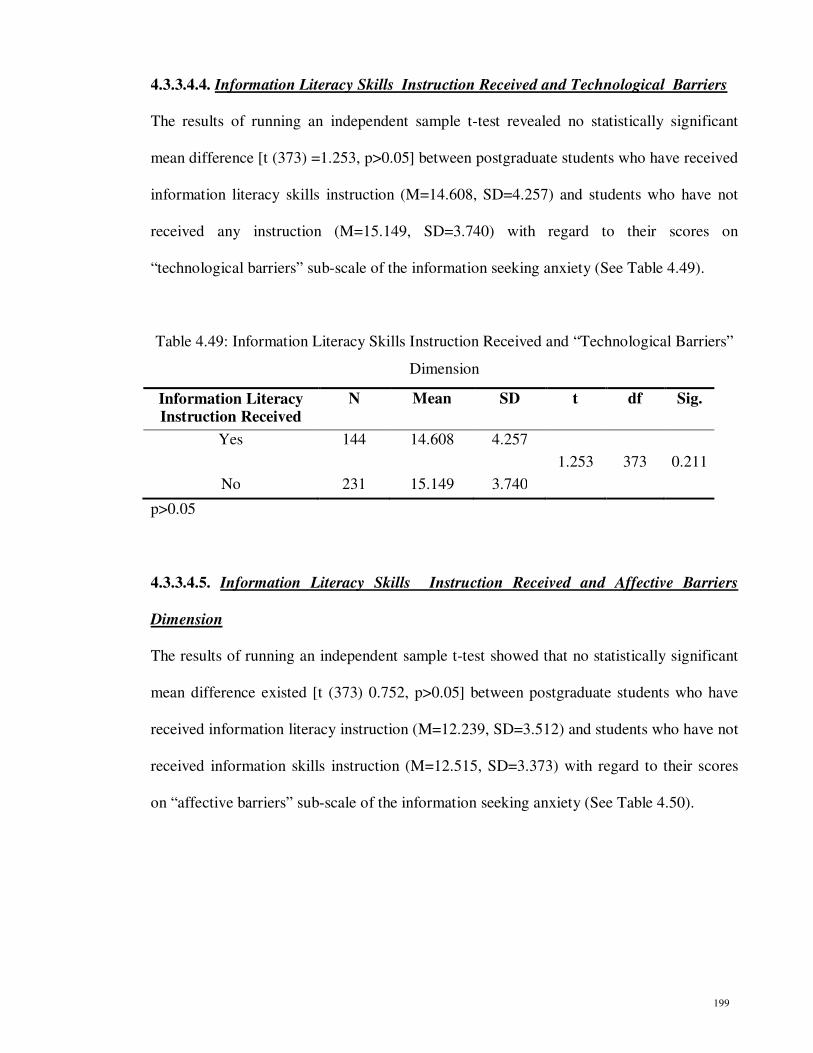
199
4.3.3.4.4. Information Literacy Skills Instruction Received and Technological Barriers
The results of running an independent sample t-test revealed no statistically significant
mean difference [t (373) =1.253, p>0.05] between postgraduate students who have received
information literacy skills instruction (M=14.608, SD=4.257) and students who have not
received any instruction (M=15.149, SD=3.740) with regard to their scores on
“technological barriers” sub-scale of the information seeking anxiety (See Table 4.49).
Table 4.49: Information Literacy Skills Instruction Received and “Technological Barriers”
Dimension
Information Literacy Instruction Received
N Mean SD t df Sig.
Yes 144 14.608 4.257
1.253 373 0.211
No 231 15.149 3.740
p>0.05
4.3.3.4.5. Information Literacy Skills Instruction Received and Affective Barriers
Dimension
The results of running an independent sample t-test showed that no statistically significant
mean difference existed [t (373) 0.752, p>0.05] between postgraduate students who have
received information literacy instruction (M=12.239, SD=3.512) and students who have not
received information skills instruction (M=12.515, SD=3.373) with regard to their scores
on “affective barriers” sub-scale of the information seeking anxiety (See Table 4.50).

200
Table 4.50: Information Literacy Skills Instruction Received and “Affective Barriers”
Dimension
Information Literacy Instruction Received
N Mean SD t df Sig.
Yes 144 12.239 3.512
0.752 373 0.452
No 231 12.515 3.373
p>0.05
4.3.3.4.6. Information Literacy Skills Instruction Received and Barriers Associated with
Topic Identification Dimension
The results of running an independent sample t-test revealed no statistically significant
mean difference [t (373) =0.406, p>0.05] between postgraduate students who have received
information literacy instruction (M=7.520, SD=2.209) and students who have not received
information skills instruction (M=7.613, SD=2.033) with regard to their scores on “barriers
associated with topic identification” sub-scale of the information seeking anxiety (See
Table 4.51).
Table 4.51: Information Literacy Skills Instruction Received and “Barriers Associated with
Topic Identification” Dimension
Information Literacy
Instruction Received
N Mean SD t df Sig.
Yes 144 7.520 2.209
0.406 373 0.685
No 231 7.613 2.033
p>0.05

201
4.3.3.4.7. Information Literacy Skills Instruction Received and Access Barriers
Dimension
The results of running an independent sample t-test revealed no statistically significant
mean difference [t (373) =1.899, p>0.05] between postgraduate students who have received
information literacy instruction (M=11.307, SD=2.647) and students who have not received
information skills instruction (M=11.833, SD=2.544) with regard to their scores on
“barriers associated with topic identification” sub-scale of the information seeking anxiety
(See Table 4.52).
Table 4.52: Information Literacy Skills Instruction Received and “Access Barriers”
Dimension
Information Literacy Instruction Received
N Mean SD t df Sig.
Yes 144 11.307 2.647
1.899 373 0.058
No 231 11.833 2.544
p>0.05
A series of independent sample t-tests were employed to determine if there were any
statistically significant differences in the mean anxiety of various dimensions of the
Information Seeking Anxiety Scale (ISAS) between students who have received
information literacy skills instruction and those who have not received information literacy
skills instruction. The results of study revealed that those students who have received
information literacy skills instruction were found to have experienced lower levels of
information seeking anxiety associated with all seven (7) sub-dimensions of the
information seeking anxiety than their counterparts who have not received any information
literacy skills instruction. The results of running a series of independent sample t-tests
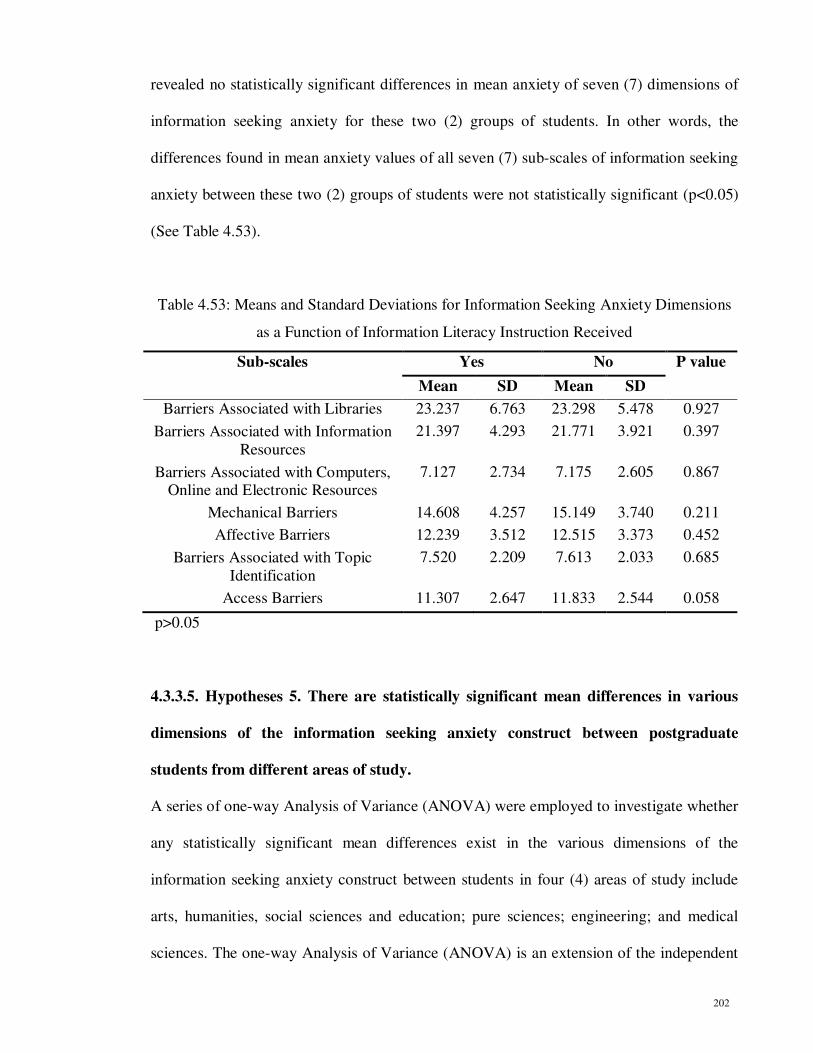
202
revealed no statistically significant differences in mean anxiety of seven (7) dimensions of
information seeking anxiety for these two (2) groups of students. In other words, the
differences found in mean anxiety values of all seven (7) sub-scales of information seeking
anxiety between these two (2) groups of students were not statistically significant (p<0.05)
(See Table 4.53).
Table 4.53: Means and Standard Deviations for Information Seeking Anxiety Dimensions
as a Function of Information Literacy Instruction Received
Sub-scales Yes No P value
Mean SD Mean SD
Barriers Associated with Libraries 23.237 6.763 23.298 5.478 0.927
Barriers Associated with Information
Resources
21.397 4.293 21.771 3.921 0.397
Barriers Associated with Computers, Online and Electronic Resources
7.127 2.734 7.175 2.605 0.867
Mechanical Barriers 14.608 4.257 15.149 3.740 0.211
Affective Barriers 12.239 3.512 12.515 3.373 0.452
Barriers Associated with Topic
Identification
7.520 2.209 7.613 2.033 0.685
Access Barriers 11.307 2.647 11.833 2.544 0.058
p>0.05
4.3.3.5. Hypotheses 5. There are statistically significant mean differences in various
dimensions of the information seeking anxiety construct between postgraduate
students from different areas of study.
A series of one-way Analysis of Variance (ANOVA) were employed to investigate whether
any statistically significant mean differences exist in the various dimensions of the
information seeking anxiety construct between students in four (4) areas of study include
arts, humanities, social sciences and education; pure sciences; engineering; and medical
sciences. The one-way Analysis of Variance (ANOVA) is an extension of the independent

203
sample t-test. It is used when the researcher is interested in whether the means from several
(more than 2) independent groups differ. In any analysis there must be:
a) Only one (1) independent variable;
b) More than Two (2) levels for that independent variable; and
c) Only one (1) dependent variable.
This section reports mean differences in the various dimensions of the information seeking
anxiety between students from four (4) groups of disciplines:
a) Academic major (four groups) and barriers associated with libraries;
b) Academic major (four groups) and barriers associated with information resources;
c) Academic major (four groups) and barriers associated with computers, the Internet and
electronic resources;
d) Academic major (four groups) and technological barriers;
e) Academic major (four groups) and affective barriers;
f) Academic major (four groups) and barriers associated with topic identification; and
g) Academic major (four groups) and access barriers.
4.3.3.5.1. Academic Major (Four Groups) and Barriers Associated with Libraries
Dimension
The results of running a one way ANOVA showed that no statistically significant mean
differences existed [F (3, 371) = 2.268, P>0.05] between postgraduate students who have
studied in arts, humanities, social sciences and education disciplines (M=23.866,
SD=6.611), and those who have studied in pure sciences (M=22.001, SD=6.023),

204
engineering (M=23.782, SD=5.753) and medical sciences disciplines (M=23.837,
SD=8.648) with regard to their scores on “barriers associated with libraries” sub-scale of
the information seeking anxiety (See Table 4.54, Figure 4.19).
Table 4.54: Academic Major and “Barriers Associated with Libraries” Dimension
Sum of Squares df Mean Squares F Sig.
Between Groups 266.789 3 88.930 2.268 .080
Within Groups 14544.842 371 39.204
Total 14811.632 374
p>0.05
Figure 4.19: One-way AVOVA Means Plot for “Barriers Associated with Libraries”
Dimension
4.3.3.5.2. Academic Major (Four Groups) and Barriers Associated with Information
Resources Dimension
The results of running a one way ANOVA revealed that no statistically significant mean
differences existed [F (3, 371) = 0.701, P>0.05] between postgraduate students who have
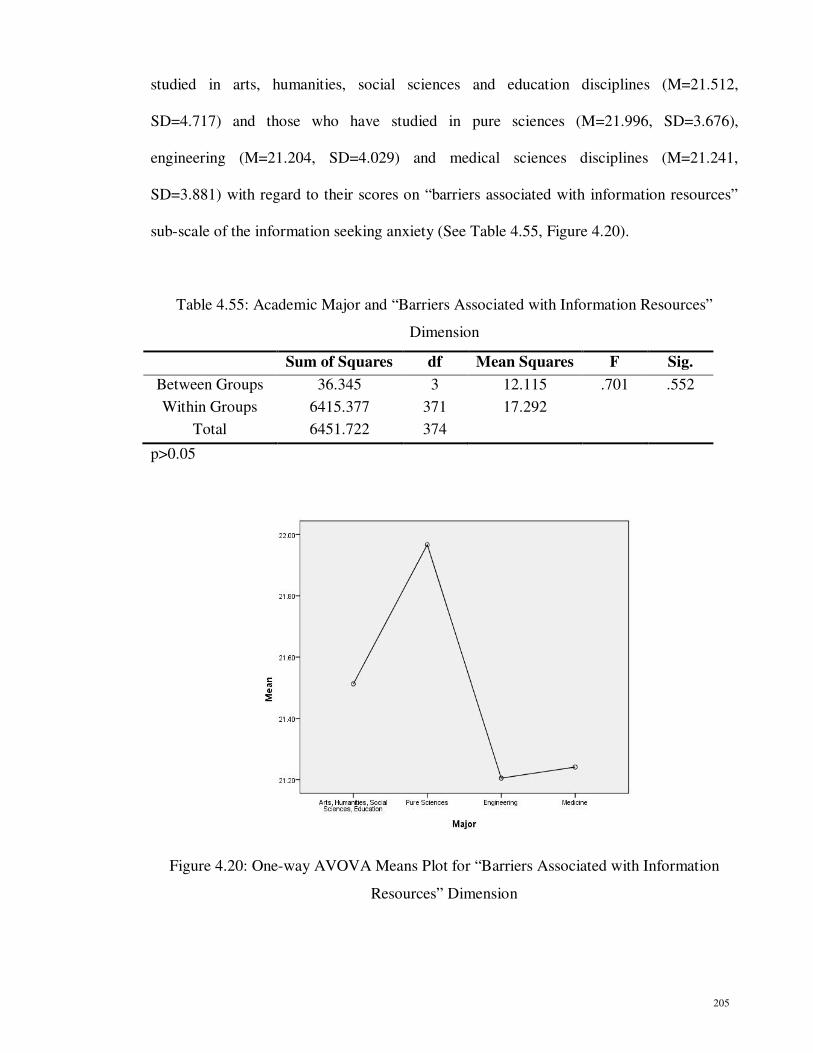
205
studied in arts, humanities, social sciences and education disciplines (M=21.512,
SD=4.717) and those who have studied in pure sciences (M=21.996, SD=3.676),
engineering (M=21.204, SD=4.029) and medical sciences disciplines (M=21.241,
SD=3.881) with regard to their scores on “barriers associated with information resources”
sub-scale of the information seeking anxiety (See Table 4.55, Figure 4.20).
Table 4.55: Academic Major and “Barriers Associated with Information Resources”
Dimension
Sum of Squares df Mean Squares F Sig.
Between Groups 36.345 3 12.115 .701 .552
Within Groups 6415.377 371 17.292
Total 6451.722 374
p>0.05
Figure 4.20: One-way AVOVA Means Plot for “Barriers Associated with Information
Resources” Dimension

206
4.3.3.5.3. Academic Major (Four Groups) and Barriers Associated with Computers, the
Internet and Electronic Resources Dimension
The results of running a one-way ANOVA showed that no statistically significant mean
difference existed [F (3, 371) = 1.511, P>0.05] between students who have studied in arts,
humanities, social sciences and education (M=7.225, SD=2.711) and those who have
studied in pure sciences (M=7.128, SD=2.706), students who have studied in engineering
(M=7.241, SD=2.718) and those in medical sciences (M=7.08, SD=2.682) with regard to
their scores on “barriers associated with computers, the Internet and electronic resources”
dimension of the information seeking anxiety (See Table 4.56, Figure 4.21).
Table 4.56: Academic Major and Barriers Associated with “Computers, the Internet and
Electronic Resources” Dimension
Sum of Squares df Mean Squares F Sig.
Between Groups 32.487 3 10.829 1.511 .211
Within Groups 2658.707 371 7.166
Total 2691.194 374
p>0.05

207
Figure 4.21: One-way AVOVA Means Plot for “Barriers Associated with Computers, the
Internet and Electronic Resources” Dimension
4.3.3.5.4. Academic Major (Four Groups) and Technological Barriers Dimension
The results of running a one-way ANOVA showed that no statistically significant mean
difference existed [F (3, 371) = 0.550, P>0.05] between students who have studied in arts,
humanities, social sciences and education (M=15.039, SD=3.944), those who have studied
in pure sciences (M=14.479, SD=4.150), students who have studied in engineering
(M=14.985, SD=3.969) and those in medical sciences (M=14.270, SD=5.257) with regard
to their scores on “technological barriers” dimension of the information seeking anxiety
(See Table 4.57, Figure 4.22).
Table 4.57: Academic Major and “Technological Barriers” Dimension
Sum of Squares df Mean Squares F Sig.
Between Groups 27.412 3 9.137 .550 .649
Within Groups 6169.059 371 16.628
Total 6196.471 374
p>0.05

208
Figure 4.22: One-way AVOVA Means Plot for “Technological Barriers” Dimension
4.3.3.5.5. Academic Major (Four Groups) and Affective Barriers Dimension
A one-way Analysis of Variance (ANOVA) was also conducted for comparing the mean
scores of anxiety associated with “affective barriers” among postgraduate students from
different areas of study. No statistically significant differences [F (3, 371) = 1.837, P>0.05]
were found between the mean anxiety scores of the students who have studied in arts,
humanities, social sciences and education (M=12.942, SD=3.748) and students who have
studied in pure sciences (M=12.020, SD=3.419), engineering (M=12.131, SD=3.195) and
medical sciences (M=11.812, SD=3.064) with regard to their scores on “affective barriers”
dimension of the information seeking anxiety (See Table 4.58, Figure 4.23).

209
Table 4.58: Academic Major and “Affective Barriers” Dimension
Sum of Squares df Mean Squares F Sig.
Between Groups 65.464 3 21.821 1.837 .140
Within Groups 4406.885 371 11.878
Total 4472.348 374
p>0.05
Figure 4.23: One-way AVOVA Means Plot for “Affective Barriers” Dimension
4.3.3.5.6. Academic Major (Four Groups) and Barriers Associated with Topic
Identification Dimension
The results of running a one way ANOVA showed that no statistically significant mean
differences existed [F (3, 371) = 1.00, P>0.05] between postgraduate students who have
studied in arts, humanities, social sciences and education disciplines (M=7.713,
SD=42.222) and those who have studied in pure sciences (M=7.689, SD=2.078),
engineering (M=7.316, SD=2.152) and medical sciences disciplines (M=7.229, SD=1.840)

210
with regard to their scores on “barriers associated with topic identification” sub-scale of the
information seeking anxiety (See Table 4.59, Figure 4.24).
Table 4.59: Academic Major and “Barriers Associated with Topic Identification”
Dimension
Sum of Squares df Mean Squares F Sig.
Between Groups 13.755 3 4.585 1.000 .393
Within Groups 1700.800 371 4.584
Total 1714.555 374
p>0.05
Figure 4.24: One-way AVOVA Means Plot for “Barriers Associated with Topic
Identification” Dimension
4.3.3.5.7. Academic Major (Four Groups) and Access Barriers Dimension
The results of running a one-way ANOVA showed that no statistically significant mean
difference existed [F (3, 371) = 1.717, P>0.05] between students who have studied in arts,
humanities, social sciences and education (M=11.952, SD=2.420), those who have studied
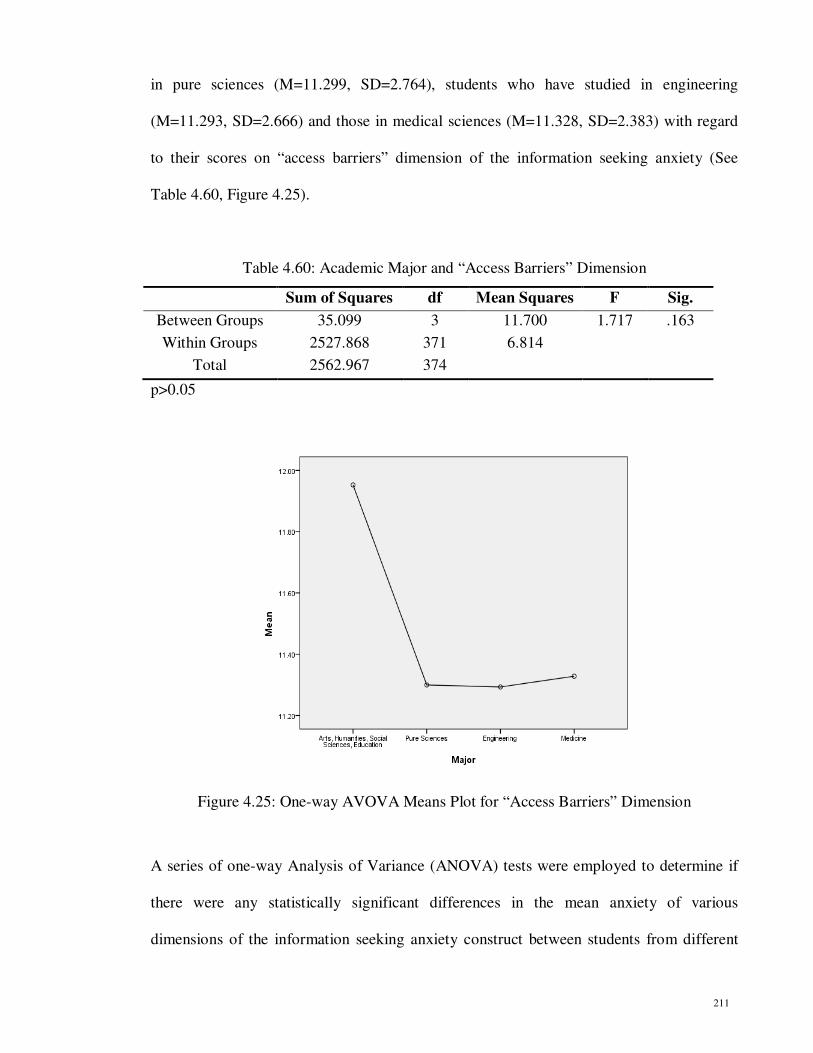
211
in pure sciences (M=11.299, SD=2.764), students who have studied in engineering
(M=11.293, SD=2.666) and those in medical sciences (M=11.328, SD=2.383) with regard
to their scores on “access barriers” dimension of the information seeking anxiety (See
Table 4.60, Figure 4.25).
Table 4.60: Academic Major and “Access Barriers” Dimension
Sum of Squares df Mean Squares F Sig.
Between Groups 35.099 3 11.700 1.717 .163
Within Groups 2527.868 371 6.814
Total 2562.967 374
p>0.05
Figure 4.25: One-way AVOVA Means Plot for “Access Barriers” Dimension
A series of one-way Analysis of Variance (ANOVA) tests were employed to determine if
there were any statistically significant differences in the mean anxiety of various
dimensions of the information seeking anxiety construct between students from different

212
disciplines. The results of study revealed that those students who have studied in arts,
humanities, social sciences and education disciplines were reported to have experienced
higher level of information seeking associated with six (6) out of seven (7) sub-dimensions
of the information seeking anxiety than their counterparts who have studied in other
disciplines. However, the differences found in mean anxiety values of all seven (7) sub-
scales of the information seeking anxiety between these four (4) groups of students were
not statistically significant (p<0.05).
It was hypothesized that there are statistically significant mean differences in information
seeking anxiety between postgraduate students from different academic majors. The results
of running a series of ANOVA tests as a function of academic major did not produce any
statistical significant results. Consequently, using a recoding technique in the Predictive
Analysis Software (PASW), the variable academic major which was measured using a
polychotomous level has been transferred into a dichotomous level variable. In other words,
anxiety values of three (3) groups of academic majors including pure sciences, engineering
and medical sciences modified to create a new variable for comparison to arts, humanities,
social sciences and education disciplines. After that, in order to investigate whether any
statistically significant mean differences exist in the various dimensions of the information
seeking anxiety construct between those students who have studied in art, humanities,
social sciences and education and those who were in pure sciences, engineering and
medical sciences, a series of independent sample t-test were employed. This section reports
differences in the various dimensions of the information seeking anxiety between these two
(2) groups of students:
a) Academic Major (two groups) and barriers associated with libraries;
b) Academic Major (two groups) and barriers associated with information resources;

213
c) Academic Major (two groups) and barriers associated with computers, the Internet and
electronic resources;
d) Academic Major (two groups) and technological barriers;
e) Academic Major (two groups) and affective barriers;
f) Academic Major (two groups) and barriers associated with topic identification; and
g) Academic Major (two groups) and access barriers.
4.3.3.5.8. Academic Major (Two Groups) and Barriers Associated with Libraries
Dimension
The results of running an independent sample t-test showed that no statistically significant
mean difference existed [t (373) =1.286, p>0.05] between postgraduate students who have
studied in arts, humanities, social sciences and education disciplines (M=23.866,
SD=6.611) and those who have studied in pure sciences, engineering and medical sciences
disciplines (M=22.972, SD=6.128) with regard to their scores on “barriers associated with
libraries” sub-scale of the information seeking anxiety (See Table 4.61).
Table 4.61: Academic Major and “Barriers Associated with Libraries” Dimension
Academic Major N Mean SD t df Sig.
Arts, Humanities, Social Sciences, Education
121 23.866 6.611
1.286 373 0.199
Pure Sciences,
Engineering, Medical Sciences
254 22.972 6.128
p>0.05
214
4.3.3.5.9. Academic Major (Two Groups) and Barriers Associated with Information
Resources Dimension
The results of running an independent sample t-test showed that no statistically significant
mean difference existed [t (373) =-0.093, p>0.05] between postgraduate students who have
studied in arts, humanities, social sciences and education disciplines (M=21.512,
SD=4.717) and those who have studied in pure sciences, engineering and medical sciences
disciplines (M=21.555, SD=3.865) with regard to their scores on “barriers associated with
information resources” sub-scale of the information seeking anxiety (See Table 4.62).
Table 4.62: Academic Major and “Barriers Associated with Information Resources”
Dimension
Academic Major N Mean SD t df Sig.
Arts, Humanities, Social Sciences, Education
121 21.512 4.717
-0.093 373 0.926
Pure Sciences,
Engineering, Medical Sciences
254 21.555 3.865
p>0.05
4.3.3.5.10. Academic Major (Two Groups) and Barriers Associated with Computers, the
Internet and Electronic Resources Dimension
The results of running an independent sample t-test revealed a statistically significant mean
difference [t (373) =2.040, p<0.05] between postgraduate students who have studied in arts,
humanities, social sciences and education disciplines (M=7.553, SD=2.791) and those who
have studied in pure sciences, engineering and medical sciences disciplines (M=6.951,
SD=2.612) with regard to their scores on “barriers associated with computers, the Internet
and electronic resources” sub-scale of the information seeking anxiety (See Table 4.63).

215
Postgraduate students who have studied in arts, humanities, social sciences and education
disciplines were found to have experienced statistically significantly higher levels of
information seeking anxiety related to “barriers associated with computers, the Internet and
electronic resources” dimension, than their counterparts in pure sciences, engineering and
medical sciences disciplines.
Table 4.63: Academic Major and “Barriers Associated with Computers, the Internet and
Electronic Resources” Dimension
Academic Major N Mean SD t df Sig.
Arts, Humanities, Social
Sciences, Education
121 7.553 2.791
2.040 373 0.042
Pure Sciences,
Engineering, Medical Sciences
254 6.951 2.612
P<0.05
4.3.3.5.11. Academic Major (Two Groups) and Technological Barriers Dimension
The results of running an independent sample t-test revealed no statistically significant
mean difference [t (373) =0.735, p>0.05] between postgraduate students who have studied
in arts, humanities, social sciences and education disciplines (M=15.039, SD=3.944) and
those who have studied in pure sciences, engineering and medical sciences disciplines
(M=14.709, SD=4.132) with regard to their scores on “technological barriers” sub-scale of
the information seeking anxiety (See Table 4.64).

216
Table 4.64: Academic Major and “Technological Barriers” Dimension
Academic Major N Mean SD t df Sig.
Arts, Humanities, Social Sciences, Education
121 15.039 3.944
0.735 373 0.463
Pure Sciences,
Engineering, Medical Sciences
254 14.709 4.132
p>0.05
4.3.3.5.12. Academic Major (Two Groups) and Affective Barriers Dimension
The results of running an independent sample t-test revealed a statistically significant mean
difference [t (373) =2.321, p<0.05] between postgraduate students who have studied in arts,
humanities, social sciences and education disciplines (M=12.942, SD=3.748) and those
who have studied in pure sciences, engineering and medical sciences disciplines
(M=12.060, SD=3.280) with regard to their scores on “affective barriers” sub-scale of the
information seeking anxiety (See Table 4.65). Postgraduate students who have studied in
arts, humanities, social sciences and education disciplines were found to have experienced
statistically significantly higher levels of information seeking anxiety related to “affective
barriers” dimension, than their counterparts in pure sciences, engineering and medical
sciences disciplines.
Table 4.65: Academic Major and “Affective Barriers” Dimension
Academic Major N Mean SD t df Sig.
Arts, Humanities, Social Sciences, Education
121 12.942 3.748
2.321 373 0.021
Pure Sciences,
Engineering, Medical Sciences
254 12.060 3.280
P<0.05

217
4.3.3.5.13. Academic Major (Two Groups) and Barriers Associated with Topic
Identification Dimension
The results of running an independent sample t-test showed that no statistically significant
mean difference existed [t (373) =0.980, p>0.05] between students who have studied in
arts, humanities, social sciences and education disciplines (M=7.713, SD=2.222) and those
who have studied in Pure Sciences, Engineering and Medical Sciences disciplines
(M=7.481, SD=2.101) with regard to their scores on “barriers associated with topic
identification” dimension of the information seeking anxiety (See Table 4.66).
Table 4.66: Academic Major and “Barriers Associated with Topic Identification”
Dimension
Academic Major N Mean SD t df Sig.
Arts, Humanities, Social Sciences, Education
121 7.713 2.222
0.980 373 0.328
Pure Sciences,
Engineering, Medical Sciences
254 7.481 2.101
p>0.05
4.3.3.5.14. Academic Major (Two Groups) and Access Barriers Dimension
The results of running an independent sample t-test showed that there are statistically
significant mean difference [t (373) =2.275, p<0.05] between postgraduate students in arts,
humanities, social sciences and education disciplines (M=11.952, SD=2.420) and those in
pure sciences, engineering and medical sciences disciplines (M=11.298, SD=2.685) with
regard to their scores on “access barriers” dimension of the information seeking anxiety
(See Table 4.67). Postgraduate students who have studied in arts, humanities, social
sciences and education disciplines at University of Malaya were found to have experienced

218
statistically significantly higher levels of information seeking anxiety related to the “access
barriers” than those who have studied in pure sciences, engineering and medical sciences
disciplines.
Table 4.67: Academic Major and “Access Barriers” Dimension
Academic Major N Mean SD t df Sig.
Arts, Humanities, Social Sciences, Education
121 11.952 2.420
2.275 373 0.023
Pure Sciences,
Engineering, Medical Sciences
254 11.298 2.685
P<0.05
A series of independent sample t-tests were employed to determine if there were any
statistically significant differences in the mean anxiety of various sub-dimensions of the
information seeking anxiety construct between students in arts, humanities, social sciences
and education disciplines and those in pure sciences, engineering and medical sciences
disciplines. The results of study revealed that postgraduate students majoring in arts,
humanities, social sciences and education disciplines were reported to have experienced
higher levels of information seeking anxiety associated with six (6) out of seven (7)
dimensions of the Information Seeking Anxiety Scale than their counterparts in pure
sciences, engineering and medical sciences disciplines. Additionally, statistically
significant differences in anxiety levels were found between these two (2) groups of
postgraduate students in the “access barriers,” “affective barriers” as well as “barriers
associated with computers, the Internet and electronic resources” dimensions. In other
words arts, humanities, social sciences and education students were found to have
statistically significantly higher levels of information seeking anxiety regards to three (3)
219
aforementioned sub-scales than students in pure sciences, engineering and medical sciences
disciplines. The differences found in mean anxiety values of other four (4) sub-scales of the
Information Seeking Anxiety Scale between these two (2) groups of students were not at
the level of significance (p<0.05) (See Table 4.68).
Table 4.68: Means and Standard Deviations for Information Seeking Anxiety Dimensions
as a Function of Academic Major
Sub-scales Art, Humanities,
Social Sci., Education
Pure Sci.,
Engineering,
Medical Sci.
P value
Mean SD Mean SD
Barriers Associated with Libraries 23.866 6.611 22.972 6.128 0.199
Barriers Associated with Information
Resources
21.512 4.717 21.555 3.865 0.926
Barriers Associated with Computers, Online and Electronic Resources
7.553 2.791 6.951 2.612 0.042 *
Mechanical Barriers 15.039 3.944 14.709 4.132 0.463
Affective Barriers 12.942 3.748 12.060 3.280 0.021 *
Barriers Associated with Topic
Identification
7.713 2.222 7.481 2.101 0.328
Access Barriers 11.952 2.420 11.298 2.685 0.023 *
P<0.05
4.3.3.6. Hypotheses 6. There are statistically significant relationships between the
various dimensions of the postgraduate student’s information seeking anxiety
construct and their age.
In order to determine the relationship between various dimensions of the postgraduate
student’s information seeking anxiety and their age, a series of Pearson product moment
correlation tests were employed. The Pearson product moment correlation indicated the
degree of linear association of two (2) numerical variables. Correlation is primarily
concerned with finding out whether a relationship exists and with determining its

220
magnitude and direction. When two (2) variables vary together, they are said to be
correlated. Accordingly, correlational studies are attempts to find the extent to which two
(2) or more variables are related. To quantitatively express the extent to which two (2)
variables are related, it is necessary to calculate a correlation coefficient. The values of the
correlation coefficients vary between +1.00 and –1.00. Both of these extremes represent
perfect relationships between the variables, and 0.00 represents the absence of a
relationship. A positive relationship means that individuals obtaining high scores on one
variable tend to obtain high scores on a second variable. A negative relationship means that
individuals scoring low on one variable tend to score high on a second variable.
This section reports the relationship between postgraduate student’s age and various sub-
scales of the information seeking anxiety:
a) Age and barriers associated with libraries;
b) Age and barriers associated with information resources;
c) Age and barriers associated with computers, online and electronic resources;
d) Age and mechanical barriers;
e) Age and affective barriers;
f) Age and barriers associated with topic identification; and
g) Age and access barriers.
4.3.3.6.1. Age and Barriers Associated with Libraries Dimension
The results of running a Pearson product moment correlation test revealed a statistically
significant but weak negative relationship between age and “barriers associated with
libraries” dimension of the information seeking anxiety construct. In other words, as the
postgraduate student’s age increased, levels of information seeking anxiety related to
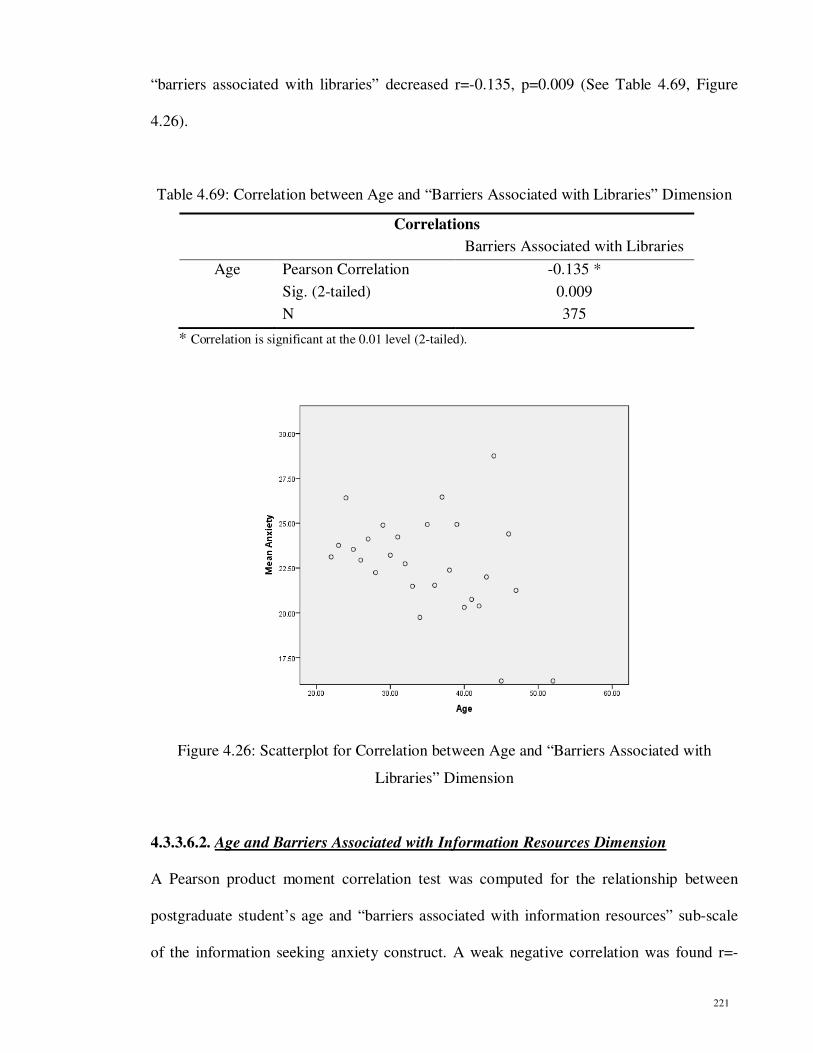
221
“barriers associated with libraries” decreased r=-0.135, p=0.009 (See Table 4.69, Figure
4.26).
Table 4.69: Correlation between Age and “Barriers Associated with Libraries” Dimension
Correlations
Barriers Associated with Libraries
Age Pearson Correlation -0.135 *
Sig. (2-tailed) 0.009
N 375
* Correlation is significant at the 0.01 level (2-tailed).
Figure 4.26: Scatterplot for Correlation between Age and “Barriers Associated with
Libraries” Dimension
4.3.3.6.2. Age and Barriers Associated with Information Resources Dimension
A Pearson product moment correlation test was computed for the relationship between
postgraduate student’s age and “barriers associated with information resources” sub-scale
of the information seeking anxiety construct. A weak negative correlation was found r=-

222
0.123, p=0.017, indicating a statistically significant relationship between the two (2)
variables. In other words, as the postgraduate student’s age increased, levels of information
seeking anxiety related to “barriers associated with information resources” decreased (See
Table 4.70, Figure 4.27).
Table 4.70: Correlation between Age and “Barriers Associated with Information
Resources” Dimension
Correlations
Barriers Associated with Information Resources
Age Pearson Correlation -0.123 *
Sig. (2-tailed) 0.017
N 375
* Correlation is significant at the 0.05 level (2-tailed).
Figure 4.27: Scatterplot for Correlation between Age and “Barriers Associated with
Information Resources” Dimension

223
4.3.3.6.3. Age and Barriers Associated with Computers, the Internet and Electronic
Resources Dimension
A Pearson product moment correlation was used to identify whether there was any
statistically significant relationship between postgraduate student’s age and their
information seeking anxiety related to “barriers associated with computers, the Internet and
electronic resources”. No statistically significant relationship was found between these two
(2) variables r=-0.071, p=0.169 (See Table 4.71, Figure 4.28).
Table 4.71: Correlation between Age and “Barriers Associated with Computers, the
Internet and Electronic Resources” Dimension
Correlations
Barriers Associated with Computers, the Internet and Electronic Resources
Age Pearson Correlation -0.071
Sig. (2-tailed) 0.169
N 375

224
Figure 4.28: Scatterplot for Correlation between Age and “Barriers Associated with
Computers, the Internet and Electronic Resources” Dimension
4.3.3.6.4. Age and Technological Barriers Dimension
The results of running a Pearson product moment correlation test revealed that no
statistically significant relationship existed r=-0.088, p=0.090 between postgraduate
student’s age and their information seeking anxiety associated with “technological barriers”
dimension (See Table 4.72, Figure 4.29).
Table 4.72: Correlation between Age and “Technological Barriers” Dimension
Correlations
Technological Barriers
Age Pearson Correlation -0.088
Sig. (2-tailed) 0.090
N 375

225
Figure 4.29: Scatterplot for Correlation between Age and “Technological Barriers”
Dimension
4.3.3.6.5. Age and Affective Barriers Dimension
To determine the correlation between postgraduate student’s age and their information
seeking anxiety associated with “affective barriers” dimension, a Pearson product moment
correlation test was computed. A statistically significant but weak negative relationship was
found between these two (2) variables r373=-0.103, p=0.047. Accordingly, as postgraduate
student’s age increased, level of information seeking anxiety associated with “affective
barriers” dimension decreased (See Table 4.73, Figure 4.30).
Table 4.73: Correlation between Age and “Affective Barriers” Dimension
Correlations
Affective Barriers
Age Pearson Correlation -0.103 *
Sig. (2-tailed) 0.047
N 375
* Correlation is significant at the 0.05 level (2-tailed).

226
Figure 4.30: Scatterplot for Correlation between Age and “Affective Barriers” Dimension
4.3.3.6.6. Age and Barriers Associated with Topic Identification Dimension
The results of running a Pearson product moment correlation revealed that no statistically
significant relationship existed r=-0.100, p=0.054 between postgraduate student’s age and
levels of information seeking anxiety related to “barriers associated with topic
identification” dimension (See Table 4.74, Figure 4.31).
Table 4.74: Correlation between Age and “Barriers Associated with Topic Identification”
Dimension
Correlations
Barriers Associated with Topic Identification
Age Pearson Correlation -0.100
Sig. (2-tailed) 0.054
N 375

227
Figure 4.31: Scatterplot for Correlation between Age and “Barriers Associated with Topic
Identification” Dimension
4.3.3.6.7. Age and Access Barriers Dimension
A Pearson product moment correlation test was computed to identify the correlation
between postgraduate student’s age and “access barriers” dimension of the information
seeking anxiety construct. There was no statistically significant relationship between these
two (2) variables r=-0.089, p=0.086 (See Table 4.75, Figure 4.32).
Table 4.75: Correlation between Age and “Access Barriers” Dimension
Correlations
Access Barriers
Age Pearson Correlation -0.089
Sig. (2-tailed) 0.086
N 375
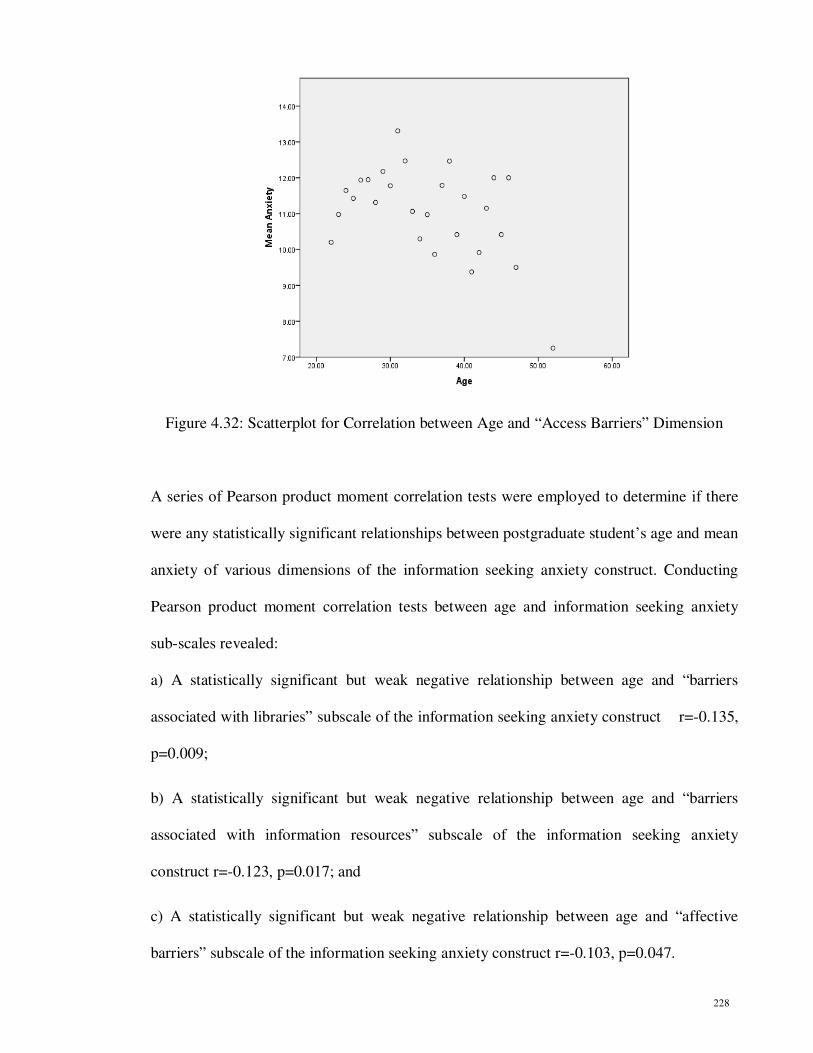
228
Figure 4.32: Scatterplot for Correlation between Age and “Access Barriers” Dimension
A series of Pearson product moment correlation tests were employed to determine if there
were any statistically significant relationships between postgraduate student’s age and mean
anxiety of various dimensions of the information seeking anxiety construct. Conducting
Pearson product moment correlation tests between age and information seeking anxiety
sub-scales revealed:
a) A statistically significant but weak negative relationship between age and “barriers
associated with libraries” subscale of the information seeking anxiety construct r=-0.135,
p=0.009;
b) A statistically significant but weak negative relationship between age and “barriers
associated with information resources” subscale of the information seeking anxiety
construct r=-0.123, p=0.017; and
c) A statistically significant but weak negative relationship between age and “affective
barriers” subscale of the information seeking anxiety construct r=-0.103, p=0.047.

229
No statistically significant relationships were found between postgraduate student’s age and
information seeking anxiety associated with the other four (4) sub-scales of the Information
Seeking Anxiety Scale (See Table 4.76).
Table 4.76: Correlation between Age and Seven Dimensions of the Information Seeking
Anxiety Scale
Correlations
Age
Barriers Associated with Libraries Pearson Correlation -0.135 *
Sig. (2-tailed) 0.009
N 375
Barriers Associated with Information Pearson Correlation -0.123 **
Resources Sig. (2-tailed) 0.017
N 375
Barriers Associated with Computers, Pearson Correlation -0.071
The Internet and Electronic Resources Sig. (2-tailed) 0.169
N 375
Technological Barriers Pearson Correlation -0.088
Sig. (2-tailed) 0.090
N 375
Affective Barriers Pearson Correlation -0.103 **
Sig. (2-tailed) 0.047
N 375
Barriers Associated with Topic Pearson Correlation -0.100
Identification Sig. (2-tailed) 0.054
N 375
Access Barriers Pearson Correlation -0.089
Sig. (2-tailed) 0.086
N 375
* Correlation is significant at the 0.01 level (2-tailed).
** Correlation is significant at the 0.05 level (2-tailed).

230
4.3.3.7. Hypotheses 7. There are statistically significant relationships between the
various dimensions of the postgraduate student’s information seeking anxiety
construct and their frequency of library use.
In order to determine the relationship between postgraduate students library use and various
dimensions of the postgraduate student’s information seeking anxiety construct, a series of
Pearson product moment correlation tests were employed. This section reports the
relationship between postgraduate student’s library use and various sub-scales of the
information seeking anxiety construct:
a) Frequency of library use and barriers associated with libraries;
b) Frequency of library use and barriers associated with information resources;
c) Frequency of library use and barriers associated with computers, the Internet and
electronic resources;
d) Frequency of library use and technological barriers;
e) Frequency of library use and affective barriers;
f) Frequency of library use and barriers associated with topic identification; and
g) Frequency of library use and access barriers.
4.3.3.7.1. Frequency of Library Use and Barriers Associated with Libraries Dimension
The results of running a Pearson product moment correlation test revealed that no
statistically significant relationship existed r=-0.101, p=0.051 between postgraduate
student’s frequency of library use and “barriers associated with libraries” dimension of the
information seeking anxiety construct (See Table 4.77, Figure 4.33).
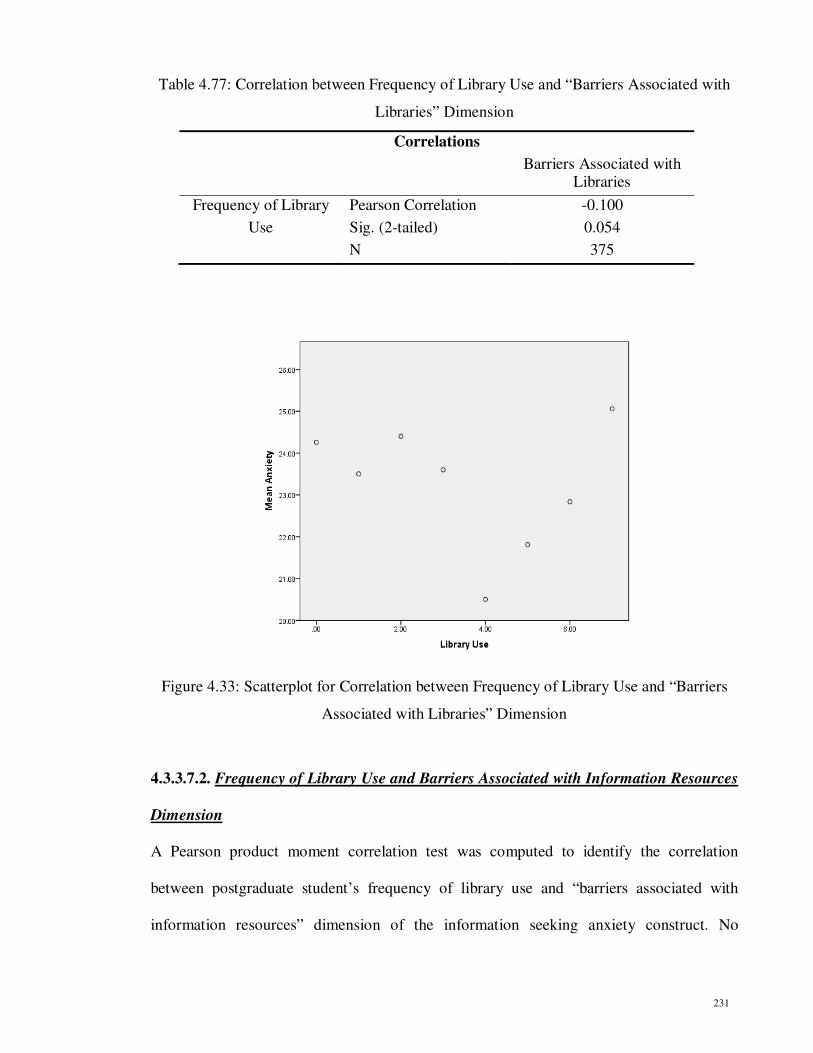
231
Table 4.77: Correlation between Frequency of Library Use and “Barriers Associated with
Libraries” Dimension
Correlations
Barriers Associated with Libraries
Frequency of Library Pearson Correlation -0.100
Use Sig. (2-tailed) 0.054
N 375
Figure 4.33: Scatterplot for Correlation between Frequency of Library Use and “Barriers
Associated with Libraries” Dimension
4.3.3.7.2. Frequency of Library Use and Barriers Associated with Information Resources
Dimension
A Pearson product moment correlation test was computed to identify the correlation
between postgraduate student’s frequency of library use and “barriers associated with
information resources” dimension of the information seeking anxiety construct. No

232
statistically significant relationship was found between these two (2) variables r=-0.048,
p=0.357 (See Table 4.78, Figure 4.34).
Table 4.78: Correlation between Frequency of Library Use and “Barriers Associated with
Information Resources” Dimension
Correlations
Barriers Associated with
Information Resources
Frequency of Library Pearson Correlation -0.048
Use Sig. (2-tailed) 0.357
N 375
Figure 4.34: Scatterplot for Correlation between Frequency of Library Use and “Barriers
Associated with Information Resources” Dimension

233
4.3.3.7.3. Frequency of Library Use and Barriers Associated with Computers, the
Internet and Electronic Resources Dimension
A Pearson product moment correlation test was also calculated to determine the
relationship between frequency of library use and “barriers associated with computers, the
Internet and electronic resources” sub-scale of the information seeking anxiety construct.
There was no statistically significant relationship between these two (2) variables r=-0.028,
p=0.586 (See Table 4.79, Figure 4.35).
Table 4.79: Correlation between Frequency of Library Use and “Barriers Associated with
Computers, the Internet and Electronic Resources” Dimension
Correlations
Barriers Associated with Computers
Frequency of Library Pearson Correlation -0.028
Use Sig. (2-tailed) 0.586
N 375
Figure 4.35: Scatterplot for Correlation between Frequency of Library Use and “Barriers
Associated with Computers, the Internet and Electronic Resources” Dimension

234
4.3.3.7.4. Frequency of Library Use and Technological Barriers Dimension
The results of running a Pearson product moment correlation test revealed that no
statistically significant relationship existed r=-0.041, p=0.424 between postgraduate
student’s frequency of library use and their information seeking anxiety associated with
“technological barriers” dimension (See Table 4.80, Figure 4.36).
Table 4.80: Correlation between Frequency of Library Use and “Technological Barriers”
Dimension
Correlations
Technological Barriers
Frequency of Library Pearson Correlation -0.041
Use Sig. (2-tailed) 0.424
N 375
Figure 4.36: Scatterplot for Correlation between Frequency of Library Use and
“Technological Barriers” Dimension

235
4.3.3.7.5. Frequency of Library Use and Affective Barriers Dimension
The results of running a Pearson product moment correlation test revealed no statistically
significant relationship r=-0.083, p=0.110 between postgraduate student’s frequency of
library use and “affective barriers” sub-scale of the information seeking anxiety construct
(See Table 4.81, Figure 4.37).
Table 4.81: Correlation between Frequency of Library Use and “Affective Barriers”
Dimension
Correlations
Affective Barriers
Frequency of Library Pearson Correlation -0.083
Use Sig. (2-tailed) 0.110
N 375
Figure 4.37: Scatterplot for Correlation between Frequency of Library Use and “Affective
Barriers” Dimension
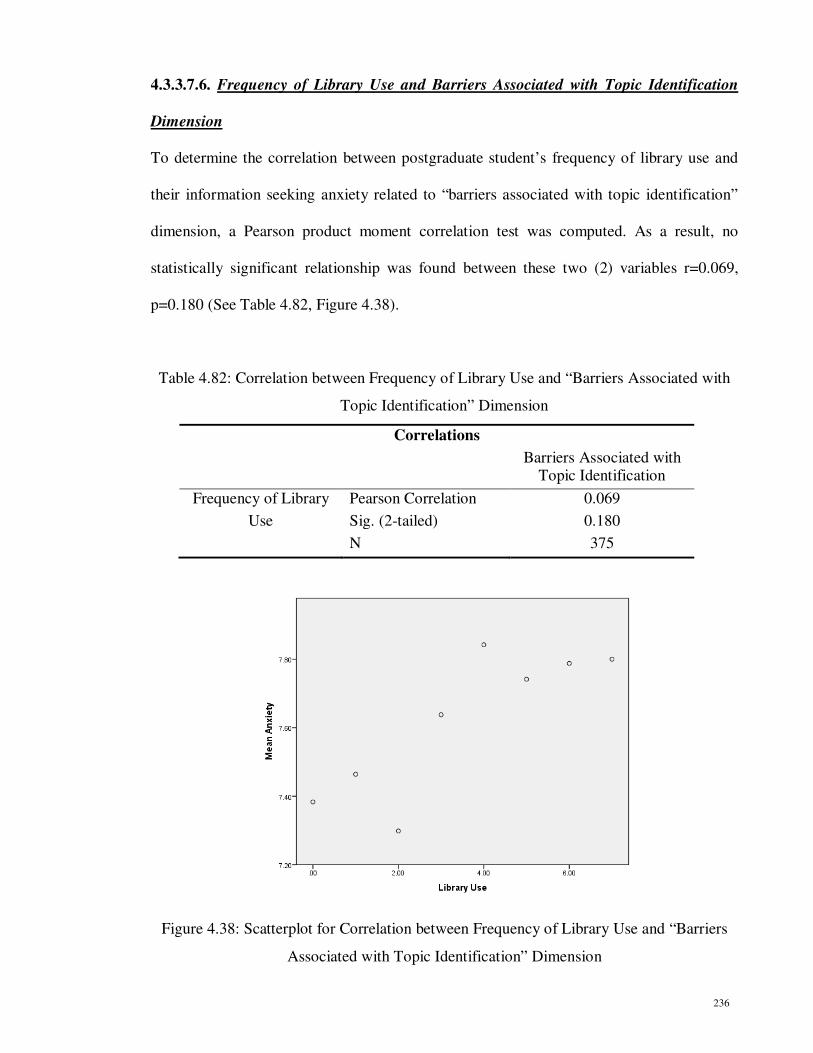
236
4.3.3.7.6. Frequency of Library Use and Barriers Associated with Topic Identification
Dimension
To determine the correlation between postgraduate student’s frequency of library use and
their information seeking anxiety related to “barriers associated with topic identification”
dimension, a Pearson product moment correlation test was computed. As a result, no
statistically significant relationship was found between these two (2) variables r=0.069,
p=0.180 (See Table 4.82, Figure 4.38).
Table 4.82: Correlation between Frequency of Library Use and “Barriers Associated with
Topic Identification” Dimension
Correlations
Barriers Associated with Topic Identification
Frequency of Library Pearson Correlation 0.069
Use Sig. (2-tailed) 0.180
N 375
Figure 4.38: Scatterplot for Correlation between Frequency of Library Use and “Barriers
Associated with Topic Identification” Dimension

237
4.3.3.7.7. Frequency of Library Use and Access Barriers Dimension
The results of running a Pearson product moment correlation test revealed a statistically
significant but weak positive relationship between frequency of library use and “access
barriers” dimension of the information seeking anxiety construct. In other words, as the
postgraduate student’s frequency of library use increased, so did their information seeking
anxiety related to the “access barriers” dimension r=0.114, p=0.028 (See Table 4.83, Figure
4.39).
Table 4.83: Correlation between Frequency of Library Use and “Access Barriers”
Dimension
Correlations
Access Barriers
Frequency of Library Pearson Correlation 0.114*
Use Sig. (2-tailed) 0.028
N 375
* Correlation is significant at the 0.01 level (2-tailed).
Figure 4.39: Scatterplot for Correlation between Frequency of Library Use and “Access
Barriers” Dimension

238
A series of Pearson product moment correlation tests were employed to determine if there
were any statistically significant relationships between postgraduate student’s frequency of
library use and various sub-dimensions of the information seeking anxiety construct.
Conducting Pearson product moment correlation tests revealed a statistically significant but
weak positive relationship between frequency of library use and “access barriers” sub-scale
of the information seeking anxiety construct r=0.114, p=0.028. No statistically significant
relationships were found between postgraduate student’s frequency of library use and other
six (6) sub-scales of the Information Seeking Anxiety Scale (See Table 4.84).
Table 4.84: Pearson Correlation between Frequency of Library Use and Seven Information
Seeking Anxiety Dimensions
Correlations
Library Use
Barriers Associated with Libraries Pearson Correlation -0.100
Sig. (2-tailed) 0.054
N 375
Barriers Associated with Information Pearson Correlation -0.048
Resources Sig. (2-tailed) 0.357
N 375
Barriers Associated with Computers, Pearson Correlation -0.028
The Internet and Electronic Resources Sig. (2-tailed) 0.586
N 375
Technological Barriers Pearson Correlation -0.041
Sig. (2-tailed) 0.424
N 375
Affective Barriers Pearson Correlation -0.083
Sig. (2-tailed) 0.110
N 375
Barriers Associated with Topic Pearson Correlation 0.069
Identification Sig. (2-tailed) 0.180
N 375
Access Barriers Pearson Correlation 0.114*
Sig. (2-tailed) 0.028
N 375
* Correlation is significant at the 0.05 level (2-tailed).

239
4.3.3.8. Hypotheses 8. There are statistically significant relationships between the
various dimensions of the postgraduate student’s information seeking anxiety
construct and their frequency of Internet use.
In order to determine the relationship between postgraduate student’s frequency of the
Internet use and various dimensions of the information seeking anxiety construct, a series
of Pearson product moment correlation tests were employed. This section reports the
relationship between postgraduate student’s frequency of the Internet use and various sub-
scales of the information seeking anxiety:
a) Frequency of the Internet use and barriers associated with libraries;
b) Frequency of the Internet use and barriers associated with information resources;
c) Frequency of the Internet use and barriers associated with computers, the Internet and
electronic resources;
d) Frequency of the Internet use and technological barriers;
e) Frequency of the Internet use and affective barriers;
f) Frequency of the Internet use and barriers associated with topic identification; and
g) Frequency of the Internet use and access barriers.
4.3.3.8.1. Frequency of the Internet Use and Barriers Associated with Libraries
Dimension
The results of running a Pearson product moment correlation test revealed that no
statistically significant relationship existed r=-0.098, p=0.058 between postgraduate
student’s frequency of the Internet use and their information seeking anxiety stemming
from “barriers associated with libraries” dimension (See Table 4.85, Figure 4.40).

240
Table 4.85: Correlation between Frequency of the Internet Use and “Barriers Associated
with Libraries” Dimension
Correlations
Barriers Associated with Libraries
Frequency of Internet Pearson Correlation -0.098
Use Sig. (2-tailed) 0.058
N 375
Figure 4.40: Scatterplot for Correlation between Frequency of the Internet Use and
“Barriers Associated with Libraries” Dimension
4.3.3.8.2. Frequency of the Internet Use and Barriers Associated with Information
Resources Dimension
A Pearson product moment correlation test was calculated to determine the relationship
between frequency of the Internet use and “barriers associated with information resources”
sub-scale of the information seeking anxiety construct. There was no statistically significant
relationship between these two (2) variables r=-0.056, p=0.284 (See Table 4.86, Figure
4.41).

241
Table 4.86: Correlation between Frequency of the Internet Use and “Barriers Associated
with Information Resources” Dimension
Correlations
Barriers Associated with Information Resources
Frequency of Internet Pearson Correlation -0.056
Use Sig. (2-tailed) 0.284
N 375
Figure 4.41: Scatterplot for Correlation between Frequency of the Internet Use and
“Barriers Associated with Information Resources” Dimension

242
4.3.3.8.3. Frequency of the Internet Use and Barriers Associated with Computers, the
Internet and Electronic Resources Dimension
To determine the correlation between postgraduate student’s frequency of the Internet use
and their information seeking anxiety related to “barriers associated with computers, the
Internet and electronic resources”, a Pearson product moment correlation test was
computed. No statistically significant relationship was found between these two (2)
variables r=-0.065, p=0.209 (See Table 4.87, Figure 4.42).
Table 4.87: Correlation between Frequency of the Internet Use and “Barriers Associated
with Computers, the Internet and Electronic Resources” Dimension
Correlations
Barriers Associated with Computers
Frequency of Internet Pearson Correlation -0.065
Use Sig. (2-tailed) 0.209
N 375
Figure 4.42: Scatterplot for Correlation between Frequency of the Internet Use and
“Barriers Associated with Computers, the Internet and Electronic Resources” Dimension

243
4.3.3.8.4. Frequency of the Internet Use and Technological Barriers Dimension
The results of running a Pearson product moment correlation test revealed no statistically
significant relationship r=-0.056, p=0.280 between postgraduate student’s frequency of the
Internet use and “technological barriers” sub-scale of the information seeking anxiety
construct (See Table 4.88, Figure 4.43).
Table 4.88: Correlation between Frequency of the Internet Use and “Technological
Barriers” Dimension
Correlations
Technological Barriers
Frequency of Internet Pearson Correlation -0.056
Use Sig. (2-tailed) 0.280
N 375
Figure 4.43: Scatterplot for Correlation between Frequency of the Internet Use and
“Technological Barriers” Dimension

244
4.3.3.8.5. Frequency of the Internet Use and Affective Barriers Dimension
The results of running a Pearson product moment correlation test revealed no statistically
significant relationship r=-0.085, p=0.102 between postgraduate student’s frequency of the
Internet use and “affective barriers” sub-scale of the information seeking anxiety construct
(See Table 4.89, Figure 4.44).
Table 4.89: Correlation between Frequency of the Internet Use and “Affective Barriers”
Dimension
Correlations
Affective Barriers
Frequency of Internet Pearson Correlation -0.085
Use Sig. (2-tailed) 0.102
N 375
Figure 4.44: Scatterplot for Correlation between Frequency of the Internet Use and
“Affective Barriers” Dimension

245
4.3.3.8.6. Frequency of the Internet Use and Barriers Associated with Topic
Identification Dimension
The results of running a Pearson product moment correlation test revealed that no
statistically significant relationship existed r=0.004, p=0.944 between postgraduate
student’s frequency of the Internet use and their “barriers associated with topic
identification” dimension of the information seeking anxiety construct (See Table 4.90,
Figure 4.45).
Table 4.90: Correlation between Frequency of the Internet Use and “Barriers Associated
with Topic Identification” Dimension
Correlations
Barriers Associated with Topic Identification
Frequency of Internet Pearson Correlation 0.004
Use Sig. (2-tailed) 0.944
N 375
Figure 4.45: Scatterplot for Correlation between Frequency of the Internet Use and
“Barriers Associated with Topic Identification” Dimension

246
4.3.3.8.7. Frequency of the Internet Use and Access Barriers Dimension
A Pearson product moment correlation test was used to identify whether there was any
statistically significant relationship between postgraduate student’s frequency of the
Internet use and their information seeking anxiety related to “access barriers” dimension.
No statistically significant relationship was found between these two (2) variables r=-0.048,
p=0.350 (See Table 4.91, Figure 4.46).
Table 4.91: Correlation between Frequency of the Internet Use and “Access Barriers”
Dimension
Correlations
Access Barriers
Frequency of Internet Pearson Correlation -0.048
Use Sig. (2-tailed) 0.350
N 375
Figure 4.46: Scatterplot for Correlation between Frequency of the Internet Use and “Access
Barriers” Dimension

247
A series of Pearson product moment correlation tests were employed to determine if there
were any statistically significant relationships between postgraduate student’s frequency of
the Internet use and various sub-dimensions of the information seeking anxiety construct.
The results revealed that no statistically significant relationships existed between
postgraduate student’s frequency of the Internet use and all seven (7) sub-scales of the
Information Seeking Anxiety Scale (See Table 4.92).
Table 4.92: Correlation between Frequency of the Internet Use and Seven Dimensions of
the Information Seeking Anxiety Scale
Correlations
Internet Use
Barriers Associated with Libraries Pearson Correlation -.098
Sig. (2-tailed) .058
N 374
Barriers Associated with Information Pearson Correlation -.056
Resources Sig. (2-tailed) .284
N 374
Barriers Associated with Computers, Pearson Correlation -.065
The Internet and Electronic Resources Sig. (2-tailed) .209
N 374
Technological Barriers Pearson Correlation -.056
Sig. (2-tailed) .280
N 374
Affective Barriers Pearson Correlation -.085
Sig. (2-tailed) .102
N 374
Barriers Associated with Topic Pearson Correlation .004
Identification Sig. (2-tailed) .944
N 374
Access Barriers Pearson Correlation .048
Sig. (2-tailed) .350
N 374

248
4.3.3.9. Hypotheses 9. There are statistically significant main and interaction effects of
gender and academic major on various dimensions of the information seeking anxiety
construct.
In order to respond to the hypotheses number nine (9) to eighteen (18), a series of 2 × 2
factorial ANOVA test were performed to determine each of the main and interaction effects
hypotheses. The factorial univariate ANOVA is an extension of the one-way ANOVA in
that it involves the analysis of two (2) or more independent variables. It is used in
experimental designs in which every level of every factor is paired with every level of
every other factor. It allows the researcher to assess the effects of each independent variable
separately, as well as the join effect or interaction of variables. In any analysis, there must
be:
a) Two (2) or more independent variables;
b) Two (2) or more levels for each independent variable; and
c) Only one (1) dependent variable.
A series of 2 × 2 factorial ANOVAs were conducted to test main and interaction effects of
gender and academic major on various dimensions of the information seeking anxiety
construct:
4.3.3.9.1. Main and Interaction Effects of Gender and Academic Major on Barriers
Associated with Libraries Dimension
The results of running a 2 × 2 factorial ANOVA revealed gender to have no statistically
significant main effect on “barriers associated with libraries” dimension (F(1,371)=0.00,
p>0.05). Additionally, no statistically significant main effect was found due to academic

249
major on “barriers associated with libraries” dimension (F(1,371)=1.597, p>0.05). The
results of running a 2 × 2 factorial ANOVA revealed no statistically significant interaction
effect of gender and academic major on “barriers associated with libraries” dimension of
the information seeking anxiety construct (F(1,371)=1.405, p>0.05) (See Table 4.93).
Table 4.93: Main and Interaction Effects of Gender and Academic Major on “Barriers
Associated with Libraries” Dimension
Barriers Assoc. wit Libraries df MS F Sig.
Main Effect of Gender 1 0.005 0.000 0.991
Main Effect of Major 1 63.192 1.597 0.207
Gender × Major 1 55.602 1.405 0.237
Within-Cells Error 371 39.577
p> 0.05
4.3.3.9.2. Main and Interaction Effects of Gender and Academic Major on Barriers
Associated with Information Resources Dimension
The results of running a 2 × 2 factorial ANOVA revealed academic major to be having no
statistically significant main effect on “barriers associated with information resources” sub-
scale (F(1,371)=0.89, p>0.05). There was however, statistically significant main effect due
to gender on “barriers associated with information resources” dimension (F(1,371)=7.336,
p<0.05). Additionally, the interaction effect of gender and academic major on “barriers
associated with information resources” sub-scale of the information seeking anxiety
construct was not statistically significant (F(1,371)=0.094, p>0.05) (See Table 4.94).

250
Table 4.94: Main and Interaction Effects of Gender and Academic Major on “Barriers
Associated with Information Resources” Dimension
Barriers Assoc. with Information Resources
df MS F Sig.
Main Effect of Gender 1 124.485 7.336 .007 *
Main Effect of Major 1 1.504 0.089 0.766
Gender × Major 1 1.599 0.094 0.759
Within-Cells Error 371 16.969
* p< 0.05
4.3.3.9.3. Main and Interaction Effects of Gender and Academic Major on Barriers
Associated with Computers, the Internet and Electronic Resources Dimension
The results of running a 2 × 2 factorial ANOVA revealed gender to have no statistically
significant main effect on “barriers associated with computers, the Internet and electronic
resources” sub-scale (F(1,371)=0.900, p>0.05). However, when major was examined for its
main effect on “barriers associated with computers, the Internet and electronic resources”
dimension, a statistically significant effect was found (F(1,371)=4.414, p<0.05).
Additionally, the interaction effect of gender and academic major on this sub-scale of the
information seeking anxiety construct was not statistically significant (F(1,371)=0.045,
p>0.05) (See Table 4.95).
Table 4.95: Main and Interaction Effects of Gender and Academic Major on “Barriers
Associated with Computers, the Internet and Electronic Resources” Dimension
Barriers Assoc. with Computers df MS F Sig.
Main Effect of Gender 1 6.432 0.900 0.343
Main Effect of Major 1 31.561 4.414 .036 *
Gender × Major 1 0.322 0.045 0.832
Within-Cells Error 371 7.150
* p< 0.05

251
4.3.3.9.4. Main and Interaction Effects of Gender and Academic Major on Technological
Barriers Dimension
The results of running a 2 × 2 factorial ANOVA revealed gender to have no statistically
significant main effect on “technological barriers” sub-scale (F(1,371)=1.104, p>0.05).
Additionally, no statistically significant main effect was found due to academic major on
“technological barriers” dimension (F(1,371)=0.451, p>0.05). The results of running a 2 ×
2 factorial ANOVA revealed no statistically significant interaction effect of gender and
academic major on “technological barriers” dimension of the information seeking anxiety
construct (F(1,371)=1.615, p>0.05) (See Table 4.96).
Table 4.96: Main and Interaction Effects of Gender and Academic Major on
“Technological Barriers” Dimension
Technological Barriers df MS F Sig.
Main Effect of Gender 1 18.209 1.104 0.294
Main Effect of Major 1 7.434 0.451 0.502
Gender × Major 1 26.628 1.615 0.205
Within-Cells Error 371 16.491
p> 0.05
4.3.3.9.5. Main and Interaction Effects of Gender and Academic Major on Affective
Barriers Dimension
The results of running a 2 × 2 factorial ANOVA revealed gender to be having no
statistically significant main effect on “affective barriers” sub-scale (F(1,371)=2.056,
p>0.05). There was however, statistically significant main effect due to academic major on
“affective barriers” dimension (F(1,371)=4.818, p<0.05. Additionally, the interaction effect
of gender and academic major on “affective barriers” sub-scale of the information seeking

252
anxiety construct was not statistically significant (F(1,371)=0.336, p>0.05) (See Table
4.97).
Table 4.97: Main and Interaction Effects of Gender and Academic Major on “Affective
Barriers” Dimension
Affective Barriers df MS F Sig.
Main Effect of Gender 1 24.297 2.056 0.152
Main Effect of Major 1 56.939 4.818 .029 *
Gender × Major 1 3.972 0.336 0.562
Within-Cells Error 371 11.818
* p< 0.05
4.3.3.9.6. Main and Interaction Effects of Gender and Academic Major on Barriers
Associated with Topic Identification Dimension
The results of running a 2 × 2 factorial ANOVA revealed gender to have no statistically
significant main effect on “barriers associated with topic identification” sub-scale
(F(1,371)=0.094, p>0.05). Additionally, no statistically significant main effect was found
due to academic major on “barriers associated with topic identification” dimension
(F(1,371)=0.879, p>0.05). The results of running a 2 × 2 factorial ANOVA showed no
statistically significant interaction effect of gender and academic major on “barriers
associated with topic identification” dimension of the information seeking anxiety construct
(F(1,371)=1.075, p>0.05) (See Table 4.98).

253
Table 4.98: Main and Interaction Effects of Gender and Academic Major on “Barriers
Associated with Topic Identification” Dimension
Barriers Assoc. with Topic Identification df MS F Sig.
Main Effect of Gender 1 0.431 0.094 0.760
Main Effect of Major 1 4.041 0.879 0.349
Gender × Major 1 4.942 1.075 0.300
Within-Cells Error 371 4.596
p> 0.05
4.3.3.9.7. Main and Interaction Effects of Gender and Academic Major on Access
Barriers Dimension
The results of running a 2 × 2 factorial ANOVA revealed gender to have no statistically
significant main effect on “access barriers” sub-scale (F(1,371)=3.151, p>0.05). There was
however, statistically significant main effect due to academic major on “access barriers”
dimension (F(1,371)=4.668, p<0.05). Additionally, the interaction effect of gender and
academic major on “access barriers” sub-scale of the information seeking anxiety construct
was not statistically significant (F(1,371)=1.254, p>0.05) (See Table 4.99).
Table 4.99: Main and Interaction Effects of Gender and Academic Major on “Access
Barriers” Dimension
Access Barriers df MS F Sig.
Main Effect of Gender 1 21.092 3.151 0.077
Main Effect of Major 1 31.243 4.668 0.031 *
Gender × Major 1 8.396 1.254 0.263
Within-Cells Error 371 6.693
* p< 0.05

254
4.3.3.10. Hypotheses 10. There are statistically significant main and interaction effects
of gender and level of study on various dimensions of the information seeking anxiety
construct.
A series of 2 × 2 factorial ANOVAs were conducted to test main and interaction effects of
gender and level of study on various dimensions of the information seeking anxiety
construct:
4.3.3.10.1. Main and Interaction Effects of Gender and Level of Study on Barriers
Associated with Libraries Dimension
The results of running a 2 × 2 factorial ANOVA revealed gender to be having no
statistically significant main effect on “barriers associated with libraries” sub-scale
(F(1,371)=0.032, p>0.05). Additionally, no statistically significant main effect was found
due to level of study on “barriers associated with libraries” dimension (F(1,371)=3.399,
p>0.05). The results of running a 2 × 2 factorial ANOVA revealed no statistically
significant interaction effect of gender and level of study on “barriers associated with
libraries” dimension of the information seeking anxiety construct (F(1,371)=0.313, p>0.05)
(See Table 4.100).
Table 4.100: Main and Interaction Effects of Gender and Level of Study on “Barriers
Associated with Libraries” Dimension
Barriers Assoc. with Libraries df MS F Sig.
Main Effect of Gender 1 1.263 0.032 0.858
Main Effect of Level of Study 1 134.237 3.399 0.066
Gender × Level of Study 1 12.369 .313 0.576
Within-Cells Error 371 39.498
p> 0.05

255
4.3.3.10.2. Main and Interaction Effects of Gender and Level of Study on Barriers
Associated with Information Resources Dimension
The results of running a 2 × 2 factorial ANOVA revealed level of study to have no
statistically significant main effect on “barriers associated with information resources” sub-
scale (F(1,371)=2.668, p>0.05). There was however, statistically significant main effect
due to gender on “barriers associated with information resources” dimension
(F(1,371)=8.370, p<0.05). Additionally, the interaction effect of gender and level of study
on “barriers associated with information resources” sub-scale of the information seeking
anxiety construct was not statistically significant (F(1,371)=0.397, p>0.05) (See Table
4.101).
Table 4.101: Main and Interaction Effects of Gender and Level of Study on “Barriers
Associated with Information Resources” Dimension
Barriers Assoc. with Information Resources
df MS F Sig.
Main Effect of Gender 1 140.886 8.370 0.004 *
Main Effect of Level of Study 1 44.910 2.668 0.103
Gender × Level of Study 1 6.687 0.397 0.529
Within-Cells Error 371 16.831
* p< 0.05
4.3.3.10.3. Main and Interaction Effects of Gender and Level of Study on Barriers
Associated with Computers, the Internet and Electronic Resources Dimension
The results of running a 2 × 2 factorial ANOVA revealed gender to have no statistically
significant main effect on “barriers associated with computers, the Internet and electronic
resources” sub-scale (F(1,371)=0.852, p>0.05). There was however, statistically significant
main effect due to level of study on “barriers associated with computers, the Internet and
electronic resources” dimension (F(1,371)=5.390, p<0.05). Additionally, no statistically

256
significant interaction effect of gender and level of study was found on “barriers associated
with computers, the Internet and electronic resources” sub-scale of the information seeking
anxiety construct (F(1,371)=0.022, p>0.05) (See Table 4.102).
Table 4.102: Main and Interaction Effects of Gender and Major on “Barriers Associated
with Computers, the Internet and Electronic Resources” Dimension
Barriers Assoc. with Computers df MS F Sig.
Main Effect of Gender 1 6.078 0.852 0.357
Main Effect of Level of Study 1 38.437 5.390 0.021 *
Gender × Level of Study 1 0.154 0.022 0.883
Within-Cells Error 371 7.131
* p< 0.05
4.3.3.10.4. Main and Interaction Effects of Gender and Level of Study on Technological
Barriers Dimension
The results of running a 2 × 2 factorial ANOVA revealed gender to be having no
statistically significant main effect on “technological barriers” sub-scale (F(1,371)=2.640,
p>0.05). Additionally, no statistically significant main effect was found due to level of
study on “technological barriers” dimension (F(1,371)=1.870, p>0.05). The results of
running a 2 × 2 factorial ANOVA revealed no statistically significant interaction effect of
gender and level of study on “technological barriers” dimension of the information seeking
anxiety construct (F(1,371)=0.235, p>0.05) (See Table 4.103).

257
Table 4.103: Main and Interaction Effects of Gender and Level of Study on “Technological
Barriers” Dimension
Technological Barriers df MS F Sig.
Main Effect of Gender 1 43.513 2.640 0.105
Main Effect of Level of Study 1 30.819 1.870 0.172
Gender × Level of Study 1 3.878 0.235 0.628
Within-Cells Error 371 16.482
p> 0.05
4.3.3.10.5. Main and Interaction Effects of Gender and Level of Study on Affective
Barriers Dimension
The results of running a 2 × 2 factorial ANOVA revealed that level of study has statistically
significant main effect on “affective barriers” dimension (F(1,371)=10.052, p<0.05).
However, when gender was examined for its main effect on “affective barriers” dimension,
no statistically significant main effect was found (F(1,371)=0.956, p>0.05). Additionally,
the results of running a 2 × 2 factorial ANOVA revealed no statistically significant
interaction effect of gender and level of study on “affective barriers” dimension of the
information seeking anxiety construct (F(1,371)=0.187, p>0.05) (See Table 4.104).
Table 4.104: Main and Interaction Effects of Gender and Level of Study on “Affective
Barriers” Dimension
Affective Barriers df MS F Sig.
Main Effect of Gender 1 11.159 0.956 0.329
Main Effect of Level of Study 1 117.288 10.052 0.002 *
Gender × Level of Study 1 2.185 0.187 0.665
Within-Cells Error 371 11.668
* p< 0.05

258
4.3.3.10.6. Main and Interaction Effects of Gender and Level of Study on Barriers
Associated with Topic Identification Dimension
The results of running a 2 × 2 factorial ANOVA revealed gender to be having no
statistically significant main effect on “barriers associated with topic identification” sub-
scale (F(1,371)=0.379, p>0.05). Additionally, no statistically significant main effect was
found due to level of study on “barriers associated with topic identification” dimension
(F(1,371)=2.688, p>0.05). The results of running a 2 × 2 factorial ANOVA revealed no
statistically significant interaction effect of gender and level of study on “barriers
associated with topic identification” dimension of the information seeking anxiety construct
(F(1,371)=1.533, p>0.05) (See Table 4.105).
Table 4.105: Main and Interaction Effects of Gender and Level of Study on “Barriers
Associated with Topic Identification” Dimension
Barriers Assoc. with Topic Identification Df MS F Sig.
Main Effect of Gender 1 1.734 0.379 0.538
Main Effect of Level of Study 1 12.291 2.688 0.102
Gender × Level of Study 1 7.011 1.533 0.216
Within-Cells Error 371 4.573
p> 0.05
4.3.3.10.7. Main and Interaction Effects of Gender and Level of Study on Access
Barriers Dimension
The results of running a 2 × 2 factorial ANOVA revealed gender to be having no
statistically significant main effect on “access barriers” sub-scale (F(1,371)=3.702, p>0.05).
Additionally, no statistically significant main effect was found due to level of study on
“access barriers” dimension (F(1,371)=0.364, p>0.05). Moreover, the results of running a
2 × 2 factorial ANOVA revealed no statistically significant interaction effect of gender and
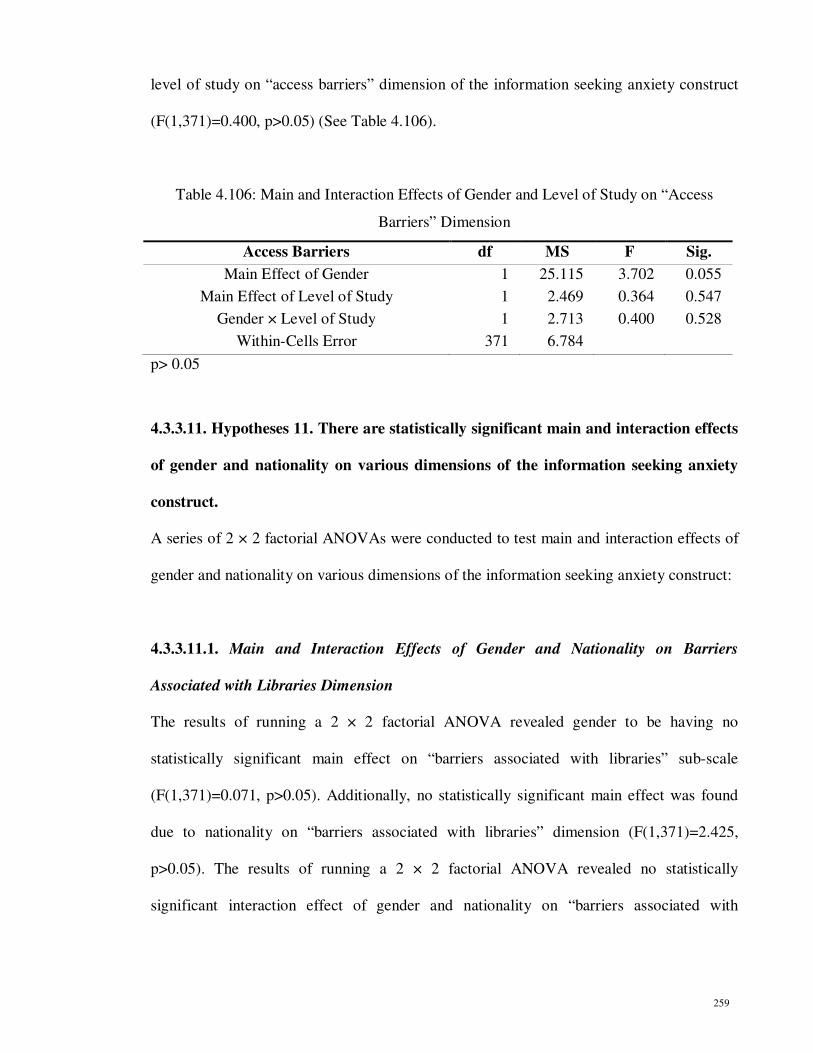
259
level of study on “access barriers” dimension of the information seeking anxiety construct
(F(1,371)=0.400, p>0.05) (See Table 4.106).
Table 4.106: Main and Interaction Effects of Gender and Level of Study on “Access
Barriers” Dimension
Access Barriers df MS F Sig.
Main Effect of Gender 1 25.115 3.702 0.055
Main Effect of Level of Study 1 2.469 0.364 0.547
Gender × Level of Study 1 2.713 0.400 0.528
Within-Cells Error 371 6.784
p> 0.05
4.3.3.11. Hypotheses 11. There are statistically significant main and interaction effects
of gender and nationality on various dimensions of the information seeking anxiety
construct.
A series of 2 × 2 factorial ANOVAs were conducted to test main and interaction effects of
gender and nationality on various dimensions of the information seeking anxiety construct:
4.3.3.11.1. Main and Interaction Effects of Gender and Nationality on Barriers
Associated with Libraries Dimension
The results of running a 2 × 2 factorial ANOVA revealed gender to be having no
statistically significant main effect on “barriers associated with libraries” sub-scale
(F(1,371)=0.071, p>0.05). Additionally, no statistically significant main effect was found
due to nationality on “barriers associated with libraries” dimension (F(1,371)=2.425,
p>0.05). The results of running a 2 × 2 factorial ANOVA revealed no statistically
significant interaction effect of gender and nationality on “barriers associated with

260
libraries” dimension of the information seeking anxiety construct (F(1,371)=0.013, p>0.05)
(See Table 4.107).
Table 4.107: Main and Interaction Effects of Gender and Nationality on “Barriers
Associated with Libraries” Dimension
Barriers Assoc. with Libraries df MS F Sig.
Main Effect of Gender 1 2.811 0.071 0.790
Main Effect of Nationality 1 96.137 2.425 0.120
Gender × Nationality 1 0.509 0.013 0.910
Within-Cells Error 371 39.648
p> 0.05
4.3.3.11.2. Main and Interaction Effects of Gender and Nationality on Barriers
Associated with Information Resources Dimension
The results of running a 2 × 2 factorial ANOVA revealed nationality to have no statistically
significant main effect on “barriers associated with information resources” sub-scale
(F(1,371)=0.051, p>0.05). There was however, statistically significant main effect due to
gender on “barriers associated with information resources” dimension (F(1,371)=10.150,
p<0.05). Additionally, the interaction effect of gender and nationality on “barriers
associated with information resources” sub-scale of the information seeking anxiety
construct was not statistically significant (F(1,371)=1.264, p>0.05) (See Table 4.108).

261
Table 4.108: Main and Interaction Effects of Gender and Nationality on “Barriers
Associated with Information Resources” Dimension
Barriers Assoc. with Information Resources
df MS F Sig.
Main Effect of Gender 1 171.701 10.150 0.002 *
Main Effect of Nationality 1 0.867 0.051 0.821
Gender × Nationality 1 21.390 1.264 0.262
Within-Cells Error 371 16.917
* p< 0.05
4.3.3.11.3. Main and Interaction Effects of Gender and Nationality on Barriers
Associated with Computers, the Internet and Electronic Resources Dimension
The results of running a 2 × 2 factorial ANOVA revealed gender to be having no
statistically significant main effect on “barriers associated with computers, the Internet and
electronic resources” sub-scale (F(1,371)=2.358, p>0.05). Additionally, no statistically
significant main effect was found due to nationality on “barriers associated with computers,
the Internet and electronic resources” dimension (F(1,371)=0.197, p>0.05). The results of
running a 2 × 2 factorial ANOVA revealed no statistically significant interaction effect of
gender and nationality on “barriers associated with computers, the Internet and electronic
resources” dimension of the information seeking anxiety construct (F(1,371)=2.931,
p>0.05) (See Table 4.109).
Table 4.109: Main and Interaction Effects of Gender and Nationality on “Barriers
Associated with Computers, the Internet and Electronic Resources” Dimension
Barriers Assoc. with Computers df MS F Sig.
Main Effect of Gender 1 16.927 2.358 0.125
Main Effect of Nationality 1 1.413 0.197 0.657
Gender × Nationality 1 21.039 2.931 0.088
Within-Cells Error 371 7.177
p> 0.05

262
4.3.3.11.4. Main and Interaction Effects of Gender and Nationality on Technological
Barriers Dimension
The results of running a 2 × 2 factorial ANOVA revealed gender to be having no
statistically significant main effect on “technological barriers” sub-scale (F(1,371)=2.392,
p>0.05). Additionally, no statistically significant main effect was found due to nationality
on “technological barriers” dimension (F(1,371)=1.636, p>0.05). The results of running a 2
× 2 factorial ANOVA revealed no statistically significant interaction effect of gender and
nationality on “technological barriers” dimension of the information seeking anxiety
construct (F(1,371)=0.059, p>0.05) (See Table 4.110)
Table 4.110: Main and Interaction Effects of Gender and Nationality on “Technological
Barriers” Dimension
Technological Barriers df MS F Sig.
Main Effect of Gender 1 39.469 2.392 0.123
Main Effect of Nationality 1 27.005 1.636 0.202
Gender × Nationality 1 0.980 0.059 0.808
Within-Cells Error 371 16.503
p> 0.05
4.3.3.11.5. Main and Interaction Effects of Gender and Nationality on Affective Barriers
Dimension
The results of running a 2 × 2 factorial ANOVA revealed gender to be having no
statistically significant main effect on “affective barriers” sub-scale (F(1,371)=2.224,
p>0.05). Additionally, no statistically significant main effect was found due to nationality
on “affective barriers” dimension (F(1,371)=0.015, p>0.05). The results of running a 2 × 2
factorial ANOVA revealed no statistically significant interaction effect of gender and

263
nationality on “affective barriers” dimension of the information seeking anxiety construct
(F(1,371)=0.115, p>0.05) (See Table 4.111).
Table 4.111: Main and Interaction Effects of Gender and Nationality on “Affective
Barriers” Dimension
Affective Barriers df MS F Sig.
Main Effect of Gender 1 26.643 2.224 0.137
Main Effect of Nationality 1 0.176 0.015 0.903
Gender × Nationality 1 1.372 0.115 0.735
Within-Cells Error 371 11.981
p> 0.05
4.3.3.11.6. Main and Interaction Effects of Gender and Nationality on Barriers
Associated with Topic Identification Dimension
The results of running a 2 × 2 factorial ANOVA revealed gender to have no statistically
significant main effect on “barriers associated with topic identification” sub-scale
(F(1,371)=0.041, p>0.05). Additionally, no statistically significant main effect was found
due to nationality on “barriers associated with topic identification” dimension
(F(1,371)=0.004, p>0.05). The results of running a 2 × 2 factorial ANOVA revealed no
statistically significant interaction effect of gender and nationality on “barriers associated
with topic identification” dimension of the information seeking anxiety construct
(F(1,371)=0.318, p>0.05) (See Table 4.112).

264
Table 4.112: Main and Interaction Effects of Gender and Nationality on “Barriers
Associated with Topic Identification” Dimension
Barriers Assoc. with Topic Identification df MS F Sig.
Main Effect of Gender 1 0.189 0.041 0.840
Main Effect of Nationality 1 0.019 0.004 0.949
Gender × Nationality 1 1.469 0.318 0.573
Within-Cells Error 371 4.617
p> 0.05
4.3.3.11.7. Main and Interaction Effects of Gender and Nationality on Access Barriers
Dimension
The results of running a 2 × 2 factorial ANOVA revealed nationality to have no statistically
significant main effect on “access barriers” sub-scale (F(1,371)=0.002, p>0.05). There was
however, statistically significant main effect due to gender on “access barriers” dimension
(F(1,371)=6.520, p<0.05). Additionally, the interaction effect of gender and nationality on
“access barriers” sub-scale of the information seeking anxiety construct was not statistically
significant (F(1,371)=0.510, p>0.05) (See Table 4.113).
Table 4.113: Main and Interaction Effects of Gender and Nationality on “Access Barriers”
Dimension
Access Barriers df MS F Sig.
Main Effect of Gender 1 44.254 6.520 0.011 *
Main Effect of Nationality 1 .015 0.002 0.962
Gender × Nationality 1 3.462 0.510 0.476
Within-Cells Error 371 6.787
* p< 0.05

265
4.3.3.12. Hypotheses 12. There are statistically significant main and interaction effects
of gender and information literacy skills instruction received on various dimensions of
the information seeking anxiety construct.
A series of 2 × 2 factorial ANOVAs were conducted to test main and interaction effects of
gender and information literacy skills instruction received on various dimensions of the
information seeking anxiety construct:
4.3.3.12.1. Main and Interaction Effects of Gender and Information Literacy Skills
Instruction Received on Barriers Associated with Libraries Dimension
The results of running a 2 × 2 factorial ANOVA revealed gender to be having no
statistically significant main effect on “barriers associated with libraries” sub-scale
(F(1,371)= 0.246, p>0.05). Additionally, no statistically significant main effect was found
due to information literacy skills instruction received on “barriers associated with libraries”
dimension (F(1,371)= 0.020, p>0.05). The results of running a 2 × 2 factorial ANOVA
revealed no statistically significant interaction effect of gender and information literacy
skills instruction received on “barriers associated with libraries” dimension of the
information seeking anxiety construct (F(1,371)= 0.421, p>0.05) (See Table 4.114).
Table 4.114: Main and Interaction Effects of Gender and Information Literacy Skills
Instruction Received on Barriers Associated with Libraries Dimension
Barriers Assoc. with Libraries df MS F Sig.
Main Effect of Gender 1 9.809 0.246 0.620
Main Effect of Information Literacy Instruction 1 0.780 0.020 0.889
Gender × Information Literacy Instruction 1 16.793 0.421 0.517
Within-Cells Error 371 39.864
p> 0.05
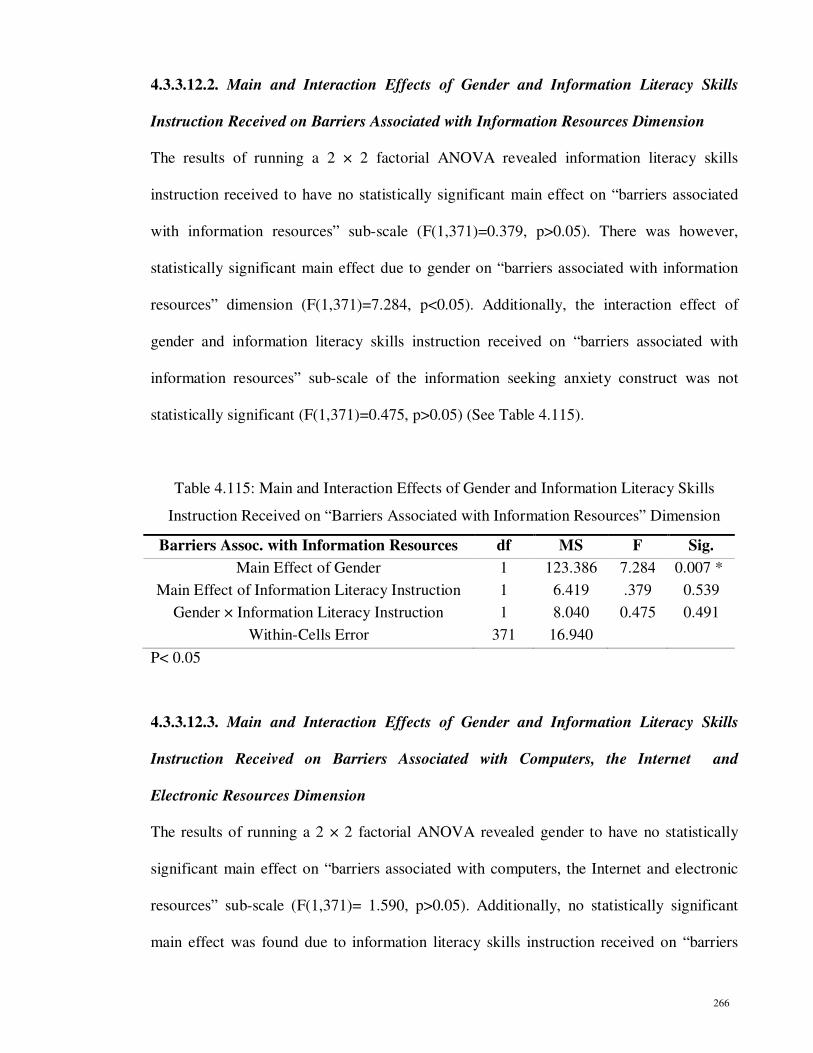
266
4.3.3.12.2. Main and Interaction Effects of Gender and Information Literacy Skills
Instruction Received on Barriers Associated with Information Resources Dimension
The results of running a 2 × 2 factorial ANOVA revealed information literacy skills
instruction received to have no statistically significant main effect on “barriers associated
with information resources” sub-scale (F(1,371)=0.379, p>0.05). There was however,
statistically significant main effect due to gender on “barriers associated with information
resources” dimension (F(1,371)=7.284, p<0.05). Additionally, the interaction effect of
gender and information literacy skills instruction received on “barriers associated with
information resources” sub-scale of the information seeking anxiety construct was not
statistically significant (F(1,371)=0.475, p>0.05) (See Table 4.115).
Table 4.115: Main and Interaction Effects of Gender and Information Literacy Skills
Instruction Received on “Barriers Associated with Information Resources” Dimension
Barriers Assoc. with Information Resources df MS F Sig.
Main Effect of Gender 1 123.386 7.284 0.007 *
Main Effect of Information Literacy Instruction 1 6.419 .379 0.539
Gender × Information Literacy Instruction 1 8.040 0.475 0.491
Within-Cells Error 371 16.940
P< 0.05
4.3.3.12.3. Main and Interaction Effects of Gender and Information Literacy Skills
Instruction Received on Barriers Associated with Computers, the Internet and
Electronic Resources Dimension
The results of running a 2 × 2 factorial ANOVA revealed gender to have no statistically
significant main effect on “barriers associated with computers, the Internet and electronic
resources” sub-scale (F(1,371)= 1.590, p>0.05). Additionally, no statistically significant
main effect was found due to information literacy skills instruction received on “barriers

267
associated with computers, the Internet and electronic resources” dimension (F(1,371)=
0.084, p>0.05). The results of running a 2 × 2 factorial ANOVA showed no statistically
significant interaction effect of gender and information literacy skills instruction received
on “barriers associated with computers, the Internet and electronic resources” dimension of
the information seeking anxiety construct (F(1,371)= 1.948, p>0.05) (See Table 4.116).
Table 4.116: Main and Interaction Effects of Gender and Information Literacy Skills
Instruction Received on “Barriers Associated with Computers, the Internet and Electronic
Resources” Dimension
Barriers Assoc. with Computers df MS F Sig.
Main Effect of Gender 1 11.445 1.590 0.208
Main Effect of Information Literacy Instruction 1 0.606 0.084 0.772
Gender × Information Literacy Instruction 1 14.024 1.948 0.164
Within-Cells Error 371 7.198
p> 0.05
4.3.3.12.4. Main and Interaction Effects of Gender and Information Literacy Skills
Instruction Received on Technological Barriers Dimension
The results of running a 2 × 2 factorial ANOVA revealed gender to be having no
statistically significant main effect on “technological barriers” sub-scale (F(1,371)= 1.952,
p>0.05). Additionally, no statistically significant main effect was found due to information
literacy skills instruction received on “technological barriers” dimension (F(1,371)= 1.270,
p>0.05). The results of running a 2 × 2 factorial ANOVA revealed no statistically
significant interaction effect of gender and information literacy skills instruction received
on “technological barriers” dimension of the information seeking anxiety construct
(F(1,371)= 0.239, p>0.05) (See Table 4.117).

268
Table 4.117: Main and Interaction Effects of Gender and Information Literacy Skills
Instruction Received on “Technological Barriers” Dimension
Technological Barriers df MS F Sig.
Main Effect of Gender 1 32.229 1.952 0.163
Main Effect of Information Literacy Instruction 1 20.976 1.270 0.260
Gender × Information Literacy Instruction 1 3.940 0.239 0.626
Within-Cells Error 371 16.514
p> 0.05
4.3.3.12.5. Main and Interaction Effects of Gender and Information Literacy Skills
Instruction Received on Affective Barriers Dimension
The results of running a 2 × 2 factorial ANOVA revealed gender to have no statistically
significant main effect on “affective barriers” sub-scale (F(1,371)= 1.395, p>0.05).
Additionally, no statistically significant main effect was found due to information literacy
skills instruction received on “affective barriers” dimension (F(1,371)= 0.422, p>0.05). The
results of running a 2 × 2 factorial ANOVA revealed no statistically significant interaction
effect of gender and information literacy skills instruction received on “affective barriers”
dimension of the information seeking anxiety construct (F(1,371)= 0.654, p>0.05) (See
Table 4.118).
Table 4.118: Main and Interaction Effects of Gender and Information Literacy Skills
Instruction Received on “Affective Barriers” Dimension
Affective Barriers df MS F Sig.
Main Effect of Gender 1 16.669 1.395 0.238
Main Effect of Information Literacy Instruction 1 5.045 0.422 0.516
Gender × Information Literacy Instruction 1 7.817 0.654 0.419
Within-Cells Error 371 11.952
p> 0.05

269
4.3.3.12.6. Main and Interaction Effects of Gender and Information Literacy Skills
Instruction Received on Barriers Associated with Topic Identification Dimension
The results of running a 2 × 2 factorial ANOVA revealed gender to be having no
statistically significant main effect on “barriers associated with topic identification” sub-
scale (F(1,371)= 0.015, p>0.05). Additionally, no statistically significant main effect was
found due to information literacy skills instruction received on “barriers associated with
topic identification” dimension (F(1,371)= 0.174, p>0.05). The results of running a 2 × 2
factorial ANOVA revealed no statistically significant interaction effect of gender and
information literacy skills instruction received on “barriers associated with topic
identification” dimension of the information seeking anxiety construct (F(1,371)= 0.147,
p>0.05) (See Table 4.119).
Table 4.119: Main and Interaction Effects of Gender and Information Literacy Skills
Instruction Received on “Barriers Associated with Topic Identification” Dimension
Barriers Assoc. with Topic Identification df MS F Sig.
Main Effect of Gender 1 0.068 0.015 0.903
Main Effect of Information Literacy Instruction 1 0.805 0.174 0.677
Gender × Information Literacy Instruction 1 0.680 0.147 0.701
Within-Cells Error 371 4.618
p> 0.05
4.3.3.12.7. Main and Interaction Effects of Gender and Information Literacy Skills
Instruction Received on Access Barriers Dimension
The results of running a 2 × 2 factorial ANOVA revealed gender to be having no
statistically significant main effect on “access barriers” sub-scale (F(1,371)= 3.844,
p>0.05). Additionally, no statistically significant main effect was found due to information
literacy skills instruction received on “access barriers” dimension (F(1,371)= 3.018,

270
p>0.05). The results of running a 2 × 2 factorial ANOVA revealed no statistically
significant interaction effect of gender and information literacy skills instruction received
on “access barriers” dimension of the information seeking anxiety construct (F(1,371)=
1.649, p>0.05) (See Table 4.120).
Table 4.120: Main and Interaction Effects of Gender and Information Literacy Skills
Instruction Received on “Access Barriers” Dimension
Access Barriers df MS F Sig.
Main Effect of Gender 1 25.810 3.844 0.051
Main Effect of Information Literacy Instruction 1 20.267 3.018 0.083
Gender × Information Literacy Instruction 1 11.069 1.649 0.200
Within-Cells Error 371 6.715
p> 0.05
4.3.3.13. Hypotheses 13. There are statistically significant main and interaction effects
of academic major and level of study on various dimensions of the information
seeking anxiety construct.
A series of 2 × 2 factorial ANOVAs were conducted to test main and interaction effects of
academic major and level of study on various dimensions of the information seeking
anxiety construct:
4.3.3.13.1. Main and Interaction Effects of Academic Major and Level of Study on
Barriers Associated with Libraries Dimension
The results of running a 2 × 2 factorial ANOVA revealed academic major to be having no
statistically significant main effect on “barriers associated with libraries” sub-scale
(F(1,371)=0.444, p>0.05). Additionally, no statistically significant main effect was found
due to level of study on “barriers associated with libraries” dimension (F(1,371)=3.844,

271
p>0.05). The results of running a 2 × 2 factorial ANOVA revealed no statistically
significant interaction effect of academic major and level of study on “barriers associated
with libraries” dimension of the information seeking anxiety construct (F(1,371)=0.633,
p>0.05) (See Table 4.121).
Table 4.121: Main and Interaction Effects of Academic Major and Level of Study on
“Barriers Associated with Libraries” Dimension
Barriers Assoc. with Libraries df MS F Sig.
Main Effect of Major 1 17.466 0.444 0.506
Main Effect of Level of Study 1 151.208 3.844 0.051
Major × Level of Study 1 24.915 0.633 0.427
Within-Cells Error 371 39.340
p> 0.05
4.3.3.13.2. Main and Interaction Effects of Academic Major and Level of Study on
Barriers Associated with Information Resources Dimension
The results of running a 2 × 2 factorial ANOVA revealed academic major to have no
statistically significant main effect on “barriers associated with information resources” sub-
scale (F(1,371)=0.147, p>0.05). Additionally, no statistically significant main effect was
found due to level of study on “barriers associated with information resources” dimension
(F(1,371)=3.487, p>0.05). The results of running a 2 × 2 factorial ANOVA showed no
statistically significant interaction effect of academic major and level of study on “barriers
associated with information resources” dimension of the information seeking anxiety
construct (F(1,371)=0.184, p>0.05) (See Table 4.122).

272
Table 4.122: Main and Interaction Effects of Academic Major and Level of Study on
“Barriers Associated with Information Resources” Dimension
Barriers Assoc. with Information Resources df MS F Sig.
Main Effect of Major 1 2.531 0.147 0.702
Main Effect of Level of Study 1 60.059 3.487 0.063
Major × Level of Study 1 3.165 0.184 0.668
Within-Cells Error 371 17.221
p> 0.05
4.3.3.13.3. Main and Interaction Effects of Academic Major and Level of Study on
Barriers Associated with Computers, the Internet and Electronic Resources Dimension
The results of running a 2 × 2 factorial ANOVA revealed academic major to be having no
statistically significant main effect on “barriers associated with computers, the Internet and
electronic resources” sub-scale (F(1,371)=1.664, p>0.05). However, when level of study
was examined for its main effect on “barriers associated with computers, the Internet and
electronic resources” dimension, a statistically significant effect was found
(F(1,371)=5.392, p>0.05).The results of running a 2 × 2 factorial ANOVA revealed no
statistically significant interaction effect of academic major and level of study on “barriers
associated with computers, the Internet and electronic resources” dimension of the
information seeking anxiety construct (F(1,371)=0.725, p>0.05) (See Table 4.123).
Table 4.123: Main and Interaction Effects of Academic Major and Level of Study on
“Barriers Associated with Computers, the Internet and Electronic Resources” Dimension
Barriers Assoc. with Computers df MS F Sig.
Main Effect of Major 1 11.767 1.664 0.198
Main Effect of Level of Study 1 38.128 5.392 0.021 *
Major × Level of Study 1 5.126 0.725 0.395
Within-Cells Error 371 7.071
P< 0.05

273
4.3.3.13.4. Main and Interaction Effects of Academic Major and Level of Study on
Technological Barriers Dimension
The results of running a 2 × 2 factorial ANOVA revealed academic major to have no
statistically significant main effect on “technological barriers” sub-scale (F(1,371)=0.004,
p>0.05). Additionally, no statistically significant main effect was found due to level of
study on “technological barriers” dimension (F(1,371)=3.159, p>0.05). The results of
running a 2 × 2 factorial ANOVA revealed no statistically significant interaction effect of
academic major and level of study on “technological barriers” dimension of the information
seeking anxiety construct (F(1,371)=1.170, p>0.05) (See Table 4.124).
Table 4.124: Main and Interaction Effects of Academic Major and Level of Study on
“Technological Barriers” Dimension
Technological Barriers df MS F Sig.
Main Effect of Major 1 0.065 0.004 0.950
Main Effect of Level of Study 1 52.214 3.159 0.076
Major × Level of Study 1 19.335 1.170 0.280
Within-Cells Error 371 16.531
p> 0.05
4.3.3.13.5. Main and Interaction Effects of Academic Major and Level of Study on
Affective Barriers Dimension
The results of running a 2 × 2 factorial ANOVA revealed that level of study has statistically
significant main effect on “affective barriers” dimension (F(1,371)=13.709, p<0.05).
However, when academic major was examined for its main effect on “affective barriers”
dimension, no statistically significant main effect was found (F(1,371)=0.878, p>0.05).
Moreover, the results of running a 2 × 2 factorial ANOVA revealed a statistically
significant interaction effect of academic major and level of study on “affective barriers”

274
dimension of the information seeking anxiety construct (F(1,371)=4.301, p<0.05) (See
Table 125).
Table 4.125: Main and Interaction Effects of Academic Major and Level of Study on
“Affective Barriers” Dimension
Affective Barriers df MS F Sig.
Main Effect of Major 1 10.052 0.878 0.349
Main Effect of Level of Study 1 156.951 13.709 0.000 *
Major × Level of Study 1 49.237 4.301 0.039 *
Within-Cells Error 371 11.449
* p< 0.05
The results of the study showed that master’s level students who have studied in arts,
humanities, social sciences and education were reported to have experienced the highest
levels of information seeking anxiety associated with “affective barriers” (M=13.549) when
compared to (a) master’s level students in pure sciences, engineering and medical sciences
(M=12.273), (b) doctoral level students in pure sciences, engineering and medical sciences
(M=11.582) and (c) doctoral level students in arts, humanities, social sciences and
education (M=11.100) (See Table 4.126) .
Table 4.126: Mean Anxiety for Academic Major and Level of Study on “Affective
Barriers” Dimension
“Affective Barriers” and Major “Affective Barriers” and Level of Study Mean
Arts, Humanities, Social Sciences and Education
Master 13.549
PhD 11.100
Pure Sciences, Engineering and Medical Sciences
Master 12.273
PhD 11.582

275
4.3.3.13.6. Main and Interaction Effects of Academic Major and Level of Study on
Barriers Associated with Topic Identification Dimension
The results of running a 2 × 2 factorial ANOVA revealed that level of study has statistically
significant main effect on “barriers associated with topic identification” dimension
(F(1,371)=7.508, p<0.05). However, when academic major was examined for its main
effect on “barriers associated with topic identification” dimension, no statistically
significant main effect was found (F(1,371)=0.572, p>0.05). Moreover, the results of
running a 2 × 2 factorial ANOVA revealed a statistically significant interaction effect of
academic major and level of study on “barriers associated with topic identification”
dimension of the information seeking anxiety construct (F(1,371)=10.935, p<0.05) (See
Table 127).
Table 4.127: Main and Interaction Effects of Academic Major and Level of Study on
“Barriers Associated with Topic Identification” Dimension
Affective Barriers df MS F Sig.
Main Effect of Major 1 2.548 0.572 0.450
Main Effect of Level of Study 1 33.416 7.508 0.006 *
Major × Level of Study 1 48.671 10.935 0.001 *
Within-Cells Error 371 4.451
* p< 0.05
Results of the study revealed that master’s level students who have studied in arts,
humanities, social sciences and education were reported to have experienced the highest
levels of information seeking anxiety associated with “barriers associated with topic
identification” (M=8.110) when compared to (a) doctoral level students in pure sciences,
engineering and medical sciences (M=7.585), (b) master’s level students in pure sciences,

276
engineering and medical sciences (M=7.436) and (c) doctoral level students in arts,
humanities, social sciences and education (M=6.511) (See Table 4.128).
Table 4.128: Mean Anxiety for Academic Major and Level of Study on “Barriers
Associated with Topic Identification” Dimension
“Barriers Assoc. with Topic Identification” and Major
“Barriers Assoc. with Topic Identification” and level of Study
Mean
Arts, Humanities, Social Sciences
and Education
Master 8.110
PhD 6.511
Pure Sciences, Engineering and
Medical Sciences
Master 7.436
PhD 7.585
4.3.3.13.7. Main and Interaction Effects of Academic Major and Level of Study on
Access Barriers Dimension
The results of running a 2 × 2 factorial ANOVA revealed academic major to have no
statistically significant main effect on “access barriers” sub-scale (F(1,371)=1.489, p>0.05).
Additionally, no statistically significant main effect was found due to level of study on
“access barriers” dimension (F(1,371)=1.408, p>0.05). The results of running a 2 × 2
factorial ANOVA revealed no statistically significant interaction effect of academic major
and level of study on “access barriers” dimension of the information seeking anxiety
construct (F(1,371)=2.598, p>0.05) (See Table 4.129).

277
Table 4.129: Main and Interaction Effects of Academic Major and Level of Study on
“Access Barriers” Dimension
Access Barriers df MS F Sig.
Main Effect of Major 1 10.068 1.489 0.223
Main Effect of Level of Study 1 9.520 1.408 0.236
Major × Level of Study 1 17.564 2.598 0.108
Within-Cells Error 371 6.760
p> 0.05
4.3.3.14. Hypotheses 14. There are statistically significant main and interaction effects
of academic major and nationality on various dimensions of the information seeking
anxiety construct.
A series of 2 × 2 factorial ANOVAs were conducted to test main and interaction effects of
academic major and nationality on various dimensions of the information seeking anxiety
construct:
4.3.3.14.1. Main and Interaction Effects of Academic Major and Nationality on Barriers
Associated with Libraries Dimension
The results of running a 2 × 2 factorial ANOVA revealed that academic major has
statistically significant main effect on “barriers associated with libraries” dimension
(F(1,371)=4.556, p<0.05). However, when nationality was examined for its main effect on
“barriers associated with libraries” dimension, no statistically significant main effect was
found (F(1,371)=0.145, p>0.05). Moreover, the results of running a 2 × 2 factorial ANOVA
revealed a statistically significant interaction effect of academic major and nationality on
“barriers associated with libraries” dimension of the information seeking anxiety construct
(F(1,371)=6.250, p<0.05) (See Table 130).

278
Table 4.130: Main and Interaction Effects of Academic Major and Nationality on “Barriers
Associated with Libraries” Dimension
Barriers Assoc. with Libraries df MS F Sig.
Main Effect of Major 1 177.018 4.556 0.033 *
Main Effect of Nationality 1 5.629 0.145 0.704
Major × Nationality 1 242.819 6.250 0.013 *
Within-Cells Error 371 38.851
* p< 0.05
As can be seen in table 4.133 below, Malaysian students who have studied in arts,
humanities, social sciences and education were reported to have experienced the highest
levels of information seeking anxiety related to “barriers associated with libraries”
(M=25.036) when compared to (a) non-Malaysian students in pure sciences, engineering
and medical sciences (M=23.705), (b) non-Malaysian students in arts, humanities, social
sciences and education (Mean=23.427) and (c) Malaysian students in pure sciences,
engineering and medical sciences (M=21.518) (See Table 4.131).
Table 4.131: Mean Anxiety for Academic Major and Nationality on “Barriers Associated
with Libraries” Dimension
“Barriers Assoc. with Libraries” and Major
“Barriers Assoc. with Libraries” and Nationality
Mean
Arts, Humanities, Social Sciences
and Education
Malaysian 25.036
Non-Malaysian 23.427
Pure Sciences, Engineering and
Medical Sciences
Malaysian 21.518
Non-Malaysian 23.705

279
4.3.3.14.2. Main and Interaction Effects of Academic Major and Nationality on Barriers
Associated with Information Resources Dimension
The results of running a 2 × 2 factorial ANOVA revealed academic major to have no
statistically significant main effect on “barriers associated with information resources” sub-
scale (F(1,371)=0.071, p>0.05). Additionally, no statistically significant main effect was
found due to nationality on “barriers associated with information resources” dimension
(F(1,371)=0.539, p>0.05). The results of running a 2 × 2 factorial ANOVA revealed no
statistically significant interaction effect of academic major and nationality on “barriers
associated with information resources” dimension of the information seeking anxiety
construct (F(1,371)=0.601, p>0.05) (See Table 4.132).
Table 4.132: Main and Interaction Effects of Academic Major and Nationality on “Barriers
Associated with Information Resources” Dimension
Barriers Assoc. with Information Resources Df MS F Sig.
Main Effect of Major 1 1.224 0.071 0.791
Main Effect of Nationality 1 9.345 0.539 0.463
Major × Nationality 1 10.427 0.601 0.439
Within-Cells Error 371 17.352
p> 0.05
4.3.3.14.3. Main and Interaction Effects of Academic Major and Nationality on Barriers
Associated with Computers, the Internet and Electronic Resources Dimension
The results of running a 2 × 2 factorial ANOVA revealed academic major to have no
statistically significant main effect on “barriers associated with computers, the Internet and
information resources” sub-scale (F(1,371)=3.545, p>0.05). Additionally, no statistically
significant main effect was found due to nationality on “barriers associated with computers,
the Internet and information resources” dimension (F(1,371)=0.172, p>0.05). The results of

280
running a 2 × 2 factorial ANOVA revealed no statistically significant interaction effect of
academic major and nationality on “barriers associated with computers, the Internet and
information resources” dimension of the information seeking anxiety construct
(F(1,371)=0.001, p>0.05) (See Table 4.133).
Table 4.133: Main and Interaction Effects of Academic Major and Nationality on “Barriers
Associated with Computers, the Internet and Electronic Resources” Dimension
Barriers Assoc. with Computers df MS F Sig.
Main Effect of Major 1 25.419 3.545 0.061
Main Effect of Nationality 1 1.232 0.172 0.679
Major × Nationality 1 0.006 0.001 0.976
Within-Cells Error 371 7.170
p> 0.05
4.3.3.14.4. Main and Interaction Effects of Academic Major and Nationality on
Technological Barriers Dimension
The results of running a 2 × 2 factorial ANOVA revealed academic major to have no
statistically significant main effect on “technological barriers” sub-scale (F(1,371)=1.349,
p>0.05). Additionally, no statistically significant main effect was found due to nationality
on “technological barriers” dimension (F(1,371)=2.958, p>0.05). The results of running a
2 × 2 factorial ANOVA revealed no statistically significant interaction effect of academic
major and nationality on “technological barriers” dimension of the information seeking
anxiety construct (F(1,371)=0.974, p>0.05) (See Table 4.134).

281
Table 4.134: Main and Interaction Effects of Academic Major and Nationality on
“Technological Barriers” Dimension
Technological Barriers df MS F Sig.
Main Effect of Major 1 22.309 1.349 0.246
Main Effect of Nationality 1 48.932 2.958 0.086
Major × Nationality 1 16.106 0.974 0.324
Within-Cells Error 371 16.542
p> 0.05
4.3.3.14.5. Main and Interaction Effects of Academic Major and Nationality on Affective
Barriers Dimension
The results of running a 2 × 2 factorial ANOVA revealed nationality to be having no
statistically significant main effect on “affective barriers” sub-scale (F(1,371)=0.690,
p>0.05). However, when academic major was examined for its main effect on “affective
barriers” dimension, a statistically significant effect was found (F(1,371)= 8.105, p<0.05).
The results of running a 2 × 2 factorial ANOVA revealed no statistically significant
interaction effect of academic major and nationality on “affective barriers” dimension of
the information seeking anxiety construct (F(1,371)=0.3.065, p>0.05) (See Table 4.135).
Table 4.135: Main and Interaction Effects of Academic Major and Nationality on
“Affective Barriers” Dimension
Affective Barriers df MS F Sig.
Main Effect of Major 1 95.519 8.105 0.005 *
Main Effect of Nationality 1 8.136 0.690 0.407
Major × Nationality 1 36.123 3.065 0.081
Within-Cells Error 371 11.785
P< 0.05
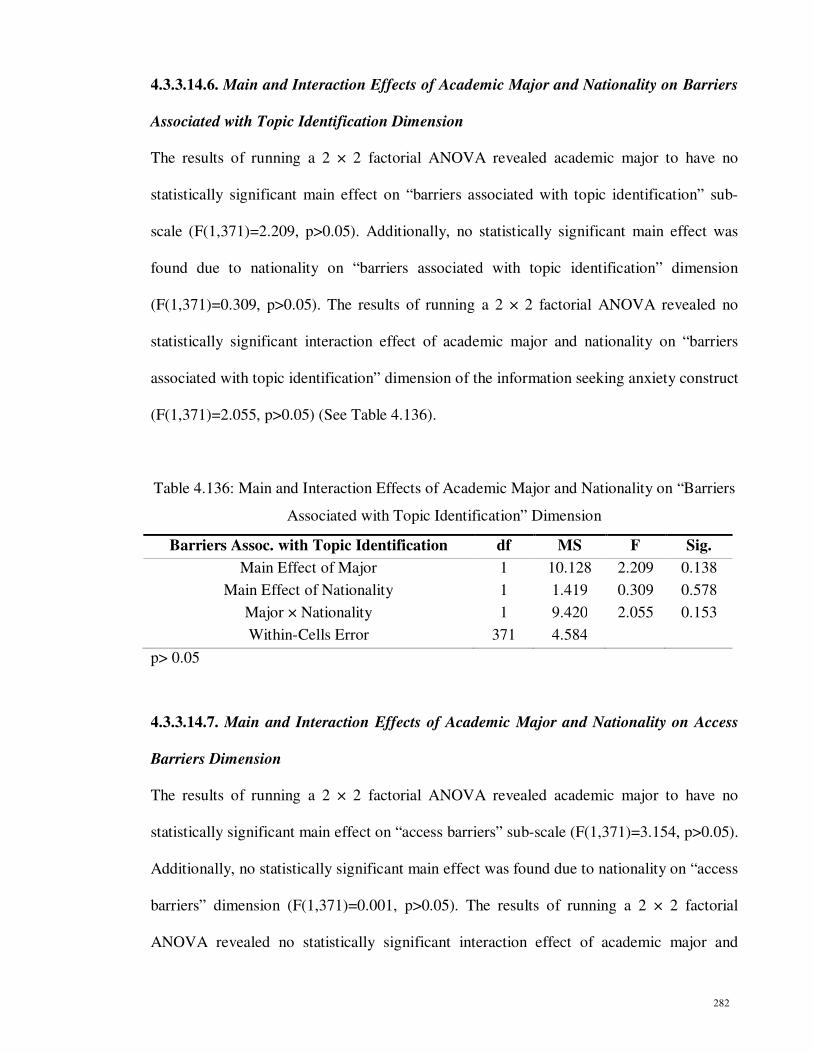
282
4.3.3.14.6. Main and Interaction Effects of Academic Major and Nationality on Barriers
Associated with Topic Identification Dimension
The results of running a 2 × 2 factorial ANOVA revealed academic major to have no
statistically significant main effect on “barriers associated with topic identification” sub-
scale (F(1,371)=2.209, p>0.05). Additionally, no statistically significant main effect was
found due to nationality on “barriers associated with topic identification” dimension
(F(1,371)=0.309, p>0.05). The results of running a 2 × 2 factorial ANOVA revealed no
statistically significant interaction effect of academic major and nationality on “barriers
associated with topic identification” dimension of the information seeking anxiety construct
(F(1,371)=2.055, p>0.05) (See Table 4.136).
Table 4.136: Main and Interaction Effects of Academic Major and Nationality on “Barriers
Associated with Topic Identification” Dimension
Barriers Assoc. with Topic Identification df MS F Sig.
Main Effect of Major 1 10.128 2.209 0.138
Main Effect of Nationality 1 1.419 0.309 0.578
Major × Nationality 1 9.420 2.055 0.153
Within-Cells Error 371 4.584
p> 0.05
4.3.3.14.7. Main and Interaction Effects of Academic Major and Nationality on Access
Barriers Dimension
The results of running a 2 × 2 factorial ANOVA revealed academic major to have no
statistically significant main effect on “access barriers” sub-scale (F(1,371)=3.154, p>0.05).
Additionally, no statistically significant main effect was found due to nationality on “access
barriers” dimension (F(1,371)=0.001, p>0.05). The results of running a 2 × 2 factorial
ANOVA revealed no statistically significant interaction effect of academic major and

283
nationality on “access barriers” dimension of the information seeking anxiety construct
(F(1,371)=0.515, p>0.05) (See Table 4.137).
Table 4.137: Main and Interaction Effects of Academic Major and Nationality on “Access
Barriers” Dimension
Access Barriers df MS F Sig.
Main Effect of Major 1 21.454 3.154 0.077
Main Effect of Nationality 1 0.005 0.001 0.978
Major × Nationality 1 3.504 0.515 0.473
Within-Cells Error 371 6.803
p> 0.05
4.3.3.15. Hypotheses 15. There are statistically significant main and interaction effects
of academic major and information literacy skills instruction received on various
dimensions of the information seeking anxiety construct.
A series of 2 × 2 factorial ANOVAs were conducted to test main and interaction effects of
academic major and information literacy skills instruction received on various dimensions
of the information seeking anxiety construct:
4.3.3.15.1. Main and Interaction Effects of Academic Major and Information Literacy
Skills Instruction Received on Barriers Associated with Libraries Dimension
The results of running a 2 × 2 factorial ANOVA revealed academic major to have no
statistically significant main effect on “barriers associated with libraries” sub-scale
(F(1,371)=0.636, p>0.05). Additionally, no statistically significant main effect was found
due to information literacy skills instruction received on “barriers associated with libraries”
dimension (F(1,371)=0.257, p>0.05). The results of running a 2 × 2 factorial ANOVA
revealed no statistically significant interaction effect of academic major and information

284
literacy skills instruction received on “barriers associated with libraries” dimension of the
information seeking anxiety construct (F(1,371)=0.2.930, p>0.05) (See Table 4.138).
Table 4.138: Main and Interaction Effects of Academic Major and Information Literacy
Skills Instruction Received on “Barriers Associated with Libraries” Dimension
Barriers Assoc. with Libraries df MS F Sig.
Main Effect of Major 1 25.070 0.636 0.426
Main Effect of Information Literacy Instruction 1 10.125 0.257 0.613
Major × Information Literacy Instruction 1 115.527 2.930 0.088
Within-Cells Error 371 39.434
p> 0.05
4.3.3.15.2. Main and Interaction Effects of Academic Major and Information Literacy
Skills Instruction Received on Barriers Associated with Information Resources
Dimension
The results of running a 2 × 2 factorial ANOVA revealed academic major to have no
statistically significant main effect on “barriers associated with information resources” sub-
scale (F(1,371)=0.001, p>0.05). Additionally, no statistically significant main effect was
found due to information literacy skills instruction received on “barriers associated with
information resources” dimension (F(1,371)=0.805, p>0.05). The results of running a 2 × 2
factorial ANOVA revealed no statistically significant interaction effect of academic major
and information literacy skills instruction received on “barriers associated with information
resources” dimension of the information seeking anxiety construct (F(1,371)=0.096,
p>0.05) (See Table 4.139).

285
Table 4.139: Main and Interaction Effects of Academic Major and Information Literacy
Skills Instruction Received on “Barriers Associated with Information Resources”
Dimension
Barriers Assoc. with Information Resources df MS F Sig.
Main Effect of Major 1 0.011 0.001 0.980
Main Effect of Information Literacy Instruction 1 13.976 0.805 0.370
Major × Information Literacy Instruction 1 1.661 0.096 0.757
Within-Cells Error 371 17.352
p> 0.05
4.3.3.15.3. Main and Interaction Effects of Academic Major and Information Literacy
Skills Instruction Received on Barriers Associated with Computers, the Internet and
Electronic Resources Dimension
The results of running a 2 × 2 factorial ANOVA revealed academic major to have no
statistically significant main effect on “barriers associated with computers, the Internet and
electronic resources” sub-scale (F(1,371)=2.451, p>0.05). Additionally, no statistically
significant main effect was found due to information literacy skills instruction received on
“barriers associated with computers, the Internet and electronic resources” dimension
(F(1,371)=0.125, p>0.05). The results of running a 2 × 2 factorial ANOVA revealed no
statistically significant interaction effect of academic major and information literacy skills
instruction received on “barriers associated with computers, the Internet and electronic
resources” dimension of the information seeking anxiety construct (F(1,371)=2.464,
p>0.05) (See Table 4.140).

286
Table 4.140: Main and Interaction Effects of Academic Major and Information Literacy
Skills Instruction Received on “Barriers Associated with Computers, the Internet and
Electronic Resources” Dimension
Barriers Assoc. with Computers df MS F Sig.
Main Effect of Major 1 17.461 2.451 0.118
Main Effect of Information Literacy Instruction 1 0.893 0.125 0.723
Major × Information Literacy Instruction 1 17.558 2.464 0.117
Within-Cells Error 371 7.125
p> 0.05
4.3.3.15.4. Main and Interaction Effects of Academic Major and Information Literacy
Skills Instruction Received on Technological Barriers Dimension
The results of running a 2 × 2 factorial ANOVA revealed academic major to have no
statistically significant main effect on “technological barriers” sub-scale (F(1,371)=0.185,
p>0.05). Additionally, no statistically significant main effect was found due to information
literacy skills instruction received on “technological barriers” dimension (F(1,371)=0.521,
p>0.05). The results of running a 2 × 2 factorial ANOVA revealed no statistically
significant interaction effect of academic major and information literacy skills instruction
received on “technological barriers” dimension of the information seeking anxiety construct
(F(1,371)=1.575, p>0.05) (See Table 4.141).
Table 4.141: Main and Interaction Effects of Academic Major and Information Literacy
Skills Instruction Received on “Technological Barriers” Dimension
Technological Barriers df MS F Sig.
Main Effect of Major 1 3.060 0.185 0.667
Main Effect of Information Literacy Instruction 1 8.613 0.521 0.471
Major × Information Literacy Instruction 1 26.034 1.575 0.210
Within-Cells Error 371 16.534
p> 0.05

287
4.3.3.14.5. Main and Interaction Effects of Academic Major and Information Literacy
Skills Instruction Received on Affective Barriers Dimension
The results of running a 2 × 2 factorial ANOVA revealed that academic major has
statistically significant main effect on “affective barriers” dimension (F(1,371)=4.063,
p<0.05). However, when information literacy skills instruction received was examined for
its main effect on “affective barriers” dimension, no statistically significant main effect was
found (F(1,371)=0.183, p>0.05). The results of running a 2 × 2 factorial ANOVA revealed
no statistically significant interaction effect of academic major and information literacy
skills instruction received on “affective barriers” dimension of the information seeking
anxiety construct (F(1,371)=0.938, p>0.05) (See Table 142).
Table 4.142: Main and Interaction Effects of Academic Major and Information Literacy
Skills Instruction Received on “Affective Barriers” Dimension
Affective Barriers df MS F Sig.
Main Effect of Major 1 48.063 4.063 0.045 *
Main Effect of Information Literacy Instruction 1 2.162 0.183 0.669
Major × Information Literacy Instruction 1 11.102 0.938 0.333
Within-Cells Error 371 11.830
* p< 0.05
4.3.3.15.6. Main and Interaction Effects of Academic Major and Information Literacy
Skills Instruction Received on Barriers Associated with Topic Identification Dimension
The results of running a 2 × 2 factorial ANOVA revealed academic major to be having no
statistically significant main effect on “barriers associated with topic identification” sub-
scale (F(1,371)=0.189, p>0.05). Additionally, no statistically significant main effect was
found due to information literacy skills instruction received on “barriers associated with
topic identification” dimension (F(1,371)=0.116, p>0.05). However, the results of running

288
a 2 × 2 factorial ANOVA revealed statistically significant interaction effect of academic
major and information literacy skills instruction received on “barriers associated with topic
identification” dimension of the information seeking anxiety construct (F(1,371)=4.088,
p<0.05) (See Table 4.143).
Table 4.143: Main and Interaction Effects of Academic Major and Information Literacy
Skills Instruction Received on “Barriers Associated with Topic Identification” Dimension
Barriers Assoc. with Topic Identification df MS F Sig.
Main Effect of Major 1 .859 0.189 0.664
Main Effect of Information Literacy Instruction 1 .527 0.116 0.734
Major × Information Literacy Instruction 1 18.626 4.088 0.044 *
Within-Cells Error 371 4.557
* p< 0.05
As can be seen in table 4.146 below, students who have studied in arts, humanities, social
sciences and education and have received information literacy instruction were reported to
have experienced the highest levels of information seeking anxiety related to “barriers
associated with topic identification” (M=7.919) when compared to (a) students in pure
sciences, engineering and medical sciences who have not received information literacy
instruction (M=7.729), (b) students in arts, humanities, social sciences and education who
have not received information literacy instruction (M=7.341) and (c) students in pure
sciences, engineering and medical sciences who have received information literacy
instruction (M=7.318) (See Table 4.144).

289
Table 4.144: Mean Anxiety for Academic Major and Information Literacy Skills
Instruction Received on Barriers Associated with Topic Identification Dimension
“Barriers Assoc. with Topic Identification” and Major
“Barriers Assoc. with Topic
Identification” and Information
Literacy instruction
Mean
Arts, Humanities, Social Sciences
and Education
No 7.341
Yes 7.919
Pure Sciences, Engineering and Medical Sciences
No 7.729
Yes 7.318
4.3.3.15.7. Main and Interaction Effects of Academic Major and Information Literacy
Skills Instruction Received on Access Barriers Dimension
The results of running a 2 × 2 factorial ANOVA revealed academic major to be having no
statistically significant main effect on “access barriers” sub-scale (F(1,371)=3.095, p>0.05).
Additionally, no statistically significant main effect was found due to information literacy
skills instruction received on “access barriers” dimension (F(1,371)=1.235, p>0.05).
However, the results of running a 2 × 2 factorial ANOVA revealed a statistically significant
interaction effect of academic major and information literacy skills instruction received on
“access barriers” dimension of the information seeking anxiety construct (F(1,371)=4.083,
p<0.05) (See Table 4.145).
Table 4.145: Main and Interaction Effects of Academic Major and Information Literacy
Skills Instruction Received on “Access Barriers” Dimension
Access Barriers df MS F Sig.
Main Effect of Major 1 20.635 3.095 0.079
Main Effect of Information Literacy Instruction 1 8.237 1.235 0.267
Major × Information Literacy Instruction 1 27.226 4.083 0.044 *
Within-Cells Error 371 6.667
* p< 0.05

290
Results of the study revealed that students who have studied in arts, humanities, social
sciences and education and have received information literacy instruction were reported to
experiencing the highest levels of information seeking anxiety related to “access barriers”
dimension (M=12.048) when compared to (a) students in pure sciences, engineering and
medical sciences who have not received information literacy instruction (M=11.856), (b)
students in arts, humanities, social sciences and education who have not received
information literacy instruction (M=11.779) and (c) those in pure sciences, engineering and
medical sciences who have received information literacy instruction sessions (M=10.930)
(See Table 4.146).
Table 4.146: Mean Anxiety for Academic Major and Information Literacy Skills
Instruction Received on “Access Barriers” Dimension
“Access Barriers” and Major “Access Barriers” and Information Literacy instruction
Mean
Arts, Humanities, Social Sciences
and Education
No 11.779
Yes 12.048
Pure Sciences, Engineering and
Medical Sciences
No 11.856
Yes 10.930
4.3.3.16. Hypotheses 16. There are statistically significant main and interaction effects
of nationality and level of study on various dimensions of the information seeking
anxiety construct.
A series of 2 × 2 factorial ANOVAs were conducted to test main and interaction effects of
nationality and level of study on various dimensions of the information seeking anxiety
construct:

291
4.3.3.16.1. Main and Interaction Effects of Nationality and Level of Study on Barriers
Associated with Libraries Dimension
The results of running a 2 × 2 factorial ANOVA revealed nationality to have no statistically
significant main effect on “barriers associated with libraries” sub-scale (F(1,371)=0.185,
p>0.05). Additionally, no statistically significant main effect was found due to level of
study on “barriers associated with libraries” dimension (F(1,371)=0.521, p>0.05). The
results of running a 2 × 2 factorial ANOVA revealed no statistically significant interaction
effect of nationality and level of study on “barriers associated with libraries” dimension of
the information seeking anxiety construct (F(1,371)=1.575, p>0.05) (See Table 4.147).
Table 4.147: Main and Interaction Effects of Nationality and Level of Study on “Barriers
Associated with Libraries” Dimension
Barriers Assoc. with Libraries df MS F Sig.
Main Effect of Nationality 1 3.060 0.185 0.667
Main Effect of Level of Study 1 8.613 0.521 0.471
Nationality × Level of Study 1 26.034 1.575 0.210
Within-Cells Error 371 16.534
p> 0.05
4.3.3.16.2. Main and Interaction Effects of Nationality and Level of Study on Barriers
Associated with Information Resources Dimension
The results of running a 2 × 2 factorial ANOVA revealed nationality to have no statistically
significant main effect on “barriers associated with information resources” sub-scale
(F(1,371)=0.095, p>0.05). There was however, statistically significant main effect due to
level of study on “barriers associated with information resources” dimension
(F(1,371)=5.440, p<0.05). Additionally, the interaction effect of nationality and level of
study on “barriers associated with information resources” sub-scale of the information

292
seeking anxiety construct was not statistically significant (F(1,371)=2.685, p>0.05) (See
Table 4.148).
Table 4.148: Main and Interaction Effects of Nationality and Level of Study on “Barriers
Associated with Information Resources” Dimension
Barriers Assoc. with Information Resources df MS F Sig.
Main Effect of Nationality 1 1.628 0.095 0.758
Main Effect of Level of Study 1 93.025 5.440 0.020 *
Nationality × Level of Study 1 45.906 2.685 0.102
Within-Cells Error 371 17.099
P< 0.05
4.3.3.16.3. Main and Interaction Effects of Nationality and Level of Study on Barriers
Associated with Computers, the Internet and Electronic Resources Dimension
The results of running a 2 × 2 factorial ANOVA revealed nationality to have no statistically
significant main effect on “barriers associated with computers, the Internet and electronic
resources” sub-scale (F(1,371)=0.357, p>0.05). Additionally, no statistically significant
main effect was found due to level of study on “barriers associated with computers, the
Internet and electronic resources” dimension (F(1,371)=3.231, p>0.05). The results of
running a 2 × 2 factorial ANOVA revealed no statistically significant interaction effect of
nationality and level of study on “barriers associated with computers, the Internet and
electronic resources” dimension of the information seeking anxiety construct
(F(1,371)=0.619, p>0.05) (See Table 4.149).

293
Table 4.149: Main and Interaction Effects of Nationality and Level of Study on “Barriers
Associated with Computers, the Internet and Electronic Resources” Dimension
Barriers Assoc. with Computers df MS F Sig.
Main Effect of Nationality 1 2.548 0.357 0.551
Main Effect of Level of Study 1 23.071 3.231 0.073
Nationality × Level of Study 1 4.420 0.619 0.432
Within-Cells Error 371 7.141
p> 0.05
4.3.3.16.4. Main and Interaction Effects of Nationality and Level of Study on
Technological Barriers Dimension
The results of running a 2 × 2 factorial ANOVA revealed nationality to have no statistically
significant main effect on “technological barriers” sub-scale (F(1,371)=0.901, p>0.05).
Additionally, no statistically significant main effect was found due to level of study on
“technological barriers” dimension (F(1,371)=2.671, p>0.05). The results of running a 2 ×
2 factorial ANOVA revealed no statistically significant interaction effect of nationality and
level of study on “technological barriers” dimension of the information seeking anxiety
construct (F(1,371)=0.459, p>0.05) (See Table 4.150).
Table 4.150: Main and Interaction Effects of Nationality and Level of Study on
“Technological Barriers” Dimension
Technological Barriers df MS F Sig.
Main Effect of Nationality 1 14.870 0.901 0.343
Main Effect of Level of Study 1 44.057 2.671 0.103
Nationality × Level of Study 1 7.568 0.459 0.499
Within-Cells Error 371 16.496
p> 0.05

294
4.3.3.16.5. Main and Interaction Effects of Nationality and Level of Study on Affective
Barriers Dimension
The results of running a 2 × 2 factorial ANOVA revealed nationality to have no statistically
significant main effect on “affective barriers” sub-scale (F(1,371)=0.00, p>0.05). There was
however, statistically significant main effect due to level of study on “affective barriers”
dimension (F(1,371)=8.560, p<0.05). Additionally, the interaction effect of nationality and
level of study on “affective barriers” sub-scale of the information seeking anxiety construct
was not statistically significant (F(1,371)=0.022, p>0.05) (See Table 4.151).
Table 4.151: Main and Interaction Effects of Nationality and Level of Study on “Affective
Barriers” Dimension
Affective Barriers df MS F Sig.
Main Effect of Nationality 1 0.004 0.000 .985
Main Effect of Level of Study 1 100.367 8.560 0.004 *
Nationality × Level of Study 1 0.257 0.022 0.882
Within-Cells Error 371 11.725
P< 0.05
4.3.3.16.6. Main and Interaction Effects of Nationality and Level of Study on Barriers
Associated with Topic Identification Dimension
The results of running a 2 × 2 factorial ANOVA revealed nationality to have no statistically
significant main effect on “barriers associated with topic identification” sub-scale
(F(1,371)=0.680, p>0.05). There was however, statistically significant main effect due to
level of study on “barriers associated with topic identification” dimension (F(1,371)=4.328,
p<0.05). Additionally, the interaction effect of nationality and level of study on “barriers
associated with topic identification” sub-scale of the information seeking anxiety construct
was not statistically significant (F(1,371)=2.834, p>0.05) (See Table 4.152).
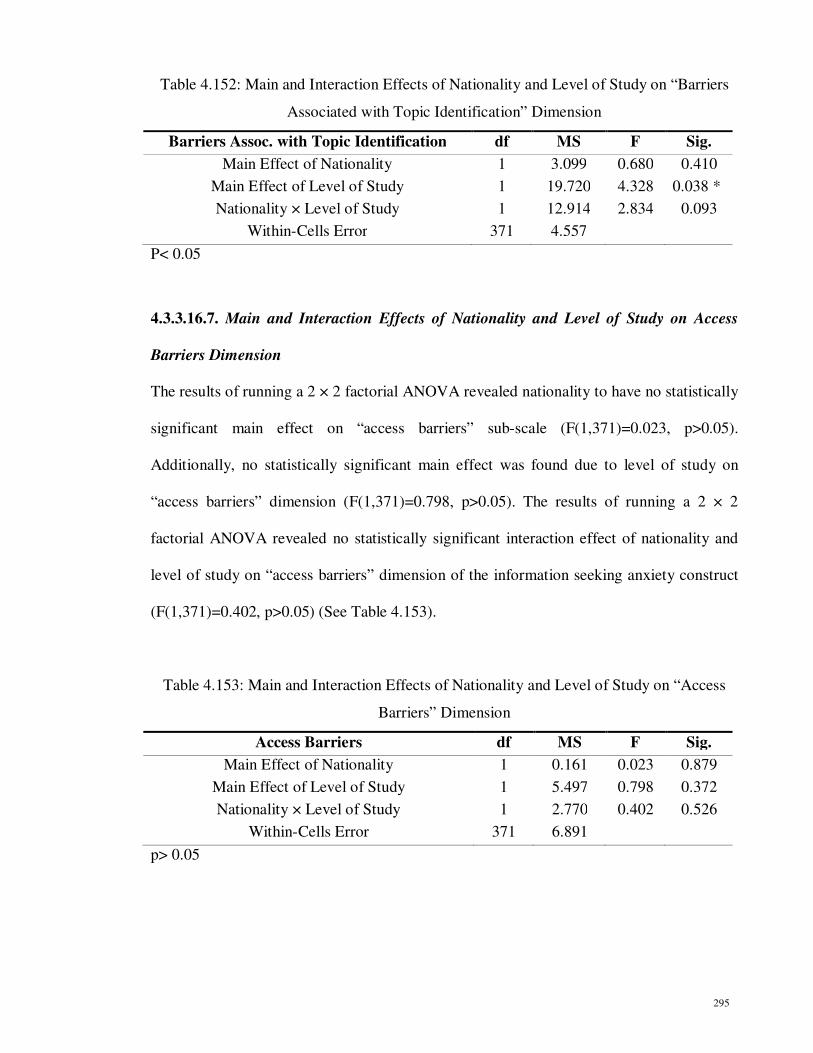
295
Table 4.152: Main and Interaction Effects of Nationality and Level of Study on “Barriers
Associated with Topic Identification” Dimension
Barriers Assoc. with Topic Identification df MS F Sig.
Main Effect of Nationality 1 3.099 0.680 0.410
Main Effect of Level of Study 1 19.720 4.328 0.038 *
Nationality × Level of Study 1 12.914 2.834 0.093
Within-Cells Error 371 4.557
P< 0.05
4.3.3.16.7. Main and Interaction Effects of Nationality and Level of Study on Access
Barriers Dimension
The results of running a 2 × 2 factorial ANOVA revealed nationality to have no statistically
significant main effect on “access barriers” sub-scale (F(1,371)=0.023, p>0.05).
Additionally, no statistically significant main effect was found due to level of study on
“access barriers” dimension (F(1,371)=0.798, p>0.05). The results of running a 2 × 2
factorial ANOVA revealed no statistically significant interaction effect of nationality and
level of study on “access barriers” dimension of the information seeking anxiety construct
(F(1,371)=0.402, p>0.05) (See Table 4.153).
Table 4.153: Main and Interaction Effects of Nationality and Level of Study on “Access
Barriers” Dimension
Access Barriers df MS F Sig.
Main Effect of Nationality 1 0.161 0.023 0.879
Main Effect of Level of Study 1 5.497 0.798 0.372
Nationality × Level of Study 1 2.770 0.402 0.526
Within-Cells Error 371 6.891
p> 0.05

296
4.3.3.17. Hypotheses 17. There are statistically significant main and interaction effects
of nationality and information literacy skills instruction received on various
dimensions of information seeking anxiety construct.
A series of 2 × 2 factorial ANOVAs were conducted to test main and interaction effects of
nationality and information literacy skills instruction received on various dimensions of the
information seeking anxiety construct:
4.3.3.17.1. Main and Interaction Effects of Nationality and Information Literacy Skills
Instruction Received on Barriers Associated with Libraries Dimension
The results of running a 2 × 2 factorial ANOVA revealed nationality to be having no
statistically significant main effect on “barriers associated with libraries” sub-scale
(F(1,371)=3.093, p>0.05). Additionally, no statistically significant main effect was found
due to information literacy skills instruction received on “barriers associated with libraries”
dimension (F(1,371)=0.31, p>0.05). The results of running a 2 × 2 factorial ANOVA
revealed no statistically significant interaction effect of nationality and information literacy
skills instruction received on “barriers associated with libraries” dimension of the
information seeking anxiety construct (F(1,371)=1.103, p>0.05) (See Table 4.154).
Table 4.154: Main and Interaction Effects of Nationality and Information Literacy Skills
Instruction Received on “Barriers Associated with Libraries” Dimension
Barriers Assoc. with Libraries df MS F Sig.
Main Effect of Nationality 1 122.286 3.093 0.079
Main Effect of Information Literacy Instruction 1 1.215 0.031 0.861
Nationality × Information Literacy Instruction 1 43.590 1.103 0.294
Within-Cells Error 371 39.534
p> 0.05

297
4.3.3.17.2. Main and Interaction Effects of Nationality and Information Literacy Skills
Instruction Received on Barriers Associated with Information Resources Dimension
The results of running a 2 × 2 factorial ANOVA revealed nationality to be having no
statistically significant main effect on “barriers associated with information resources” sub-
scale (F(1,371)=0.029, p>0.05). Additionally, no statistically significant main effect was
found due to information literacy skills instruction received on “barriers associated with
information resources” dimension (F(1,371)=0.106, p>0.05). The results of running a 2 × 2
factorial ANOVA revealed no statistically significant interaction effect of nationality and
information literacy skills instruction received on “barriers associated with information
resources” dimension of the information seeking anxiety construct (F(1,371)=1.659,
p>0.05) (See Table 4.155).
Table 4.155: Main and Interaction Effects of Nationality and Information Literacy Skills
Instruction Received on “Barriers Associated with Libraries” Dimension
Barriers Assoc. with Information Resources df MS F Sig.
Main Effect of Nationality 1 0.493 0.029 0.866
Main Effect of Information Literacy Instruction 1 1.827 0.106 0.745
Nationality × Information Literacy Instruction 1 28.654 1.659 0.199
Within-Cells Error 371 17.272
p> 0.05
4.3.3.17.3. Main and Interaction Effects of Nationality and Information Literacy Skills
Instruction Received on Barriers Associated with Computers, the Internet and Electronic
Resources Dimension
The results of running a 2 × 2 factorial ANOVA revealed nationality to be having no
statistically significant main effect on “barriers associated with computers, the Internet and
electronic resources” sub-scale (F(1,371)=0.030, p>0.05). Additionally, no statistically

298
significant main effect was found due to information literacy skills instruction received on
“barriers associated with computers, the Internet and electronic resources” dimension
(F(1,371)=0.008, p>0.05). The results of running a 2 × 2 factorial ANOVA revealed no
statistically significant interaction effect of nationality and information literacy skills
instruction received on “barriers associated with computers, the Internet and electronic
resources” dimension of the information seeking anxiety construct (F(1,371)=0.444,
p>0.05) (See Table 4.156).
Table 4.156: Main and Interaction Effects of Nationality and Information Literacy Skills
Instruction Received on “Barriers Associated with Computers, the Internet and Electronic
Resources” Dimension
Barriers Assoc. with Computers df MS F Sig.
Main Effect of Nationality 1 0.220 0.030 0.862
Main Effect of Information Literacy Instruction 1 0.061 0.008 0.927
Nationality × Information Literacy Instruction 1 3.214 0.444 0.506
Within-Cells Error 371 7.243
p> 0.05
4.3.3.17.4. Main and Interaction Effects of Nationality and Information Literacy Skills
Instruction Received on Technological Barriers Dimension
The results of running a 2 × 2 factorial ANOVA revealed nationality to be having no
statistically significant main effect on “technological barriers” sub-scale (F(1,371)=0.868,
p>0.05). Additionally, when information literacy skills instruction received was examined
for its main effect on “technological barriers” dimension, no statistically significant effect
was found (F(1,371)= 0.161, p>0.05). However, the results of running a 2 × 2 factorial
ANOVA revealed statistically significant interaction effect of nationality and information

299
literacy skills instruction received on “technological barriers” dimension of the information
seeking anxiety construct (F(1,371)=4.083, p<0.05) (See Table 4.157).
Table 4.157: Main and Interaction Effects of Nationality and Information Literacy Skills
Instruction Received on “Technological Barriers” Dimension
Technological Barriers df MS F Sig.
Main Effect of Nationality 1 14.221 0.868 0.352
Main Effect of Information Literacy Instruction 1 2.634 0.161 0.689
Nationality × Information Literacy Instruction 1 66.864 4.083 .044 *
Within-Cells Error 371 16.375
P< 0.05
According to the results of the study, Malaysian students who have received information
literacy instruction were reported to have experienced the highest levels of information
seeking anxiety associated with “technological barriers” (M=15.570) when compared to (a)
non-Malaysian students who have not received information literacy instruction
(M=15.326), (b) Malaysian students who have not received information literacy instruction
(Mean=14.827) and (c) non-Malaysian students who have received information literacy
skills instruction (Mean=14.215) (See Table 4.158)
Table 4.158: Mean Anxiety for Nationality and Information Literacy Skills Instruction
Received on “Technological Barriers” Dimension
“Technological Barriers” and Nationality
“Technological Barriers” and Information Literacy instruction
Mean
Malaysian No 14.827
Yes 15.570
Non-Malaysian No 15.326
Yes 14.215
.

300
4.3.3.17.5. Main and Interaction Effects of Nationality and Information Literacy Skills
Instruction Received on Affective Barriers Dimension
The results of running a 2 × 2 factorial ANOVA revealed nationality to be having no
statistically significant main effect on “affective barriers” sub-scale (F(1,371)=0.129,
p>0.05). Additionally, no statistically significant main effect was found due to information
literacy skills instruction received on “affective barriers” dimension (F(1,371)=0.020,
p>0.05). The results of running a 2 × 2 factorial ANOVA revealed no statistically
significant interaction effect of nationality and information literacy skills instruction
received on “affective barriers” dimension of the information seeking anxiety construct
(F(1,371)=2.710, p>0.05) (See Table 4.159).
Table 4.159: Main and Interaction Effects of Nationality and Information Literacy Skills
Instruction Received on “Affective Barriers” Dimension
Affective Barriers df MS F Sig.
Main Effect of Nationality 1 1.541 0.129 0.720
Main Effect of Information Literacy Instruction 1 0.243 0.020 0.887
Nationality × Information Literacy Instruction 1 32.388 2.710 0.101
Within-Cells Error 371 11.949
p> 0.05
4.3.3.17.6. Main and Interaction Effects of Nationality and Information Literacy Skills
Instruction Received on Barriers Associated with Topic Identification Dimension
The results of running a 2 × 2 factorial ANOVA revealed nationality to be having no
statistically significant main effect on “barriers associated with topic identification” sub-
scale (F(1,371)=0.003, p>0.05). Additionally, no statistically significant main effect was
found due to information literacy skills instruction received on “barriers associated with
topic identification” dimension (F(1,371)=0.244, p>0.05). The results of running a 2 × 2

301
factorial ANOVA revealed no statistically significant interaction effect of nationality and
information literacy skills instruction received on “barriers associated with topic
identification” dimension of the information seeking anxiety construct (F(1,371)=0.096,
p>0.05) (See Table 4.160).
Table 4.160: Main and Interaction Effects of Nationality and Information Literacy Skills
Instruction Received on “Barriers Associated with Topic Identification” Dimension
Barriers Assoc. with Topic Identification df MS F Sig.
Main Effect of Nationality 1 0.014 0.003 0.956
Main Effect of Information Literacy Instruction 1 1.126 0.244 0.622
Nationality × Information Literacy Instruction 1 0.445 0.096 0.756
Within-Cells Error 371 4.618
p> 0.05
4.3.3.17.7. Main and Interaction Effects of Nationality and Information Literacy Skills
Instruction Received on Access Barriers Dimension
The results of running a 2 × 2 factorial ANOVA revealed nationality to be having no
statistically significant main effect on “access barriers” sub-scale (F(1,371)=0.00, p>0.05).
Additionally, no statistically significant main effect was found due to information literacy
skills instruction received on “access barriers” dimension (F(1,371)=3.100, p>0.05). The
results of running a 2 × 2 factorial ANOVA revealed no statistically significant interaction
effect of nationality and information literacy skills instruction received on “access barriers”
dimension of the information seeking anxiety construct (F(1,371)=0.001, p>0.05) (See
Table 4.161).
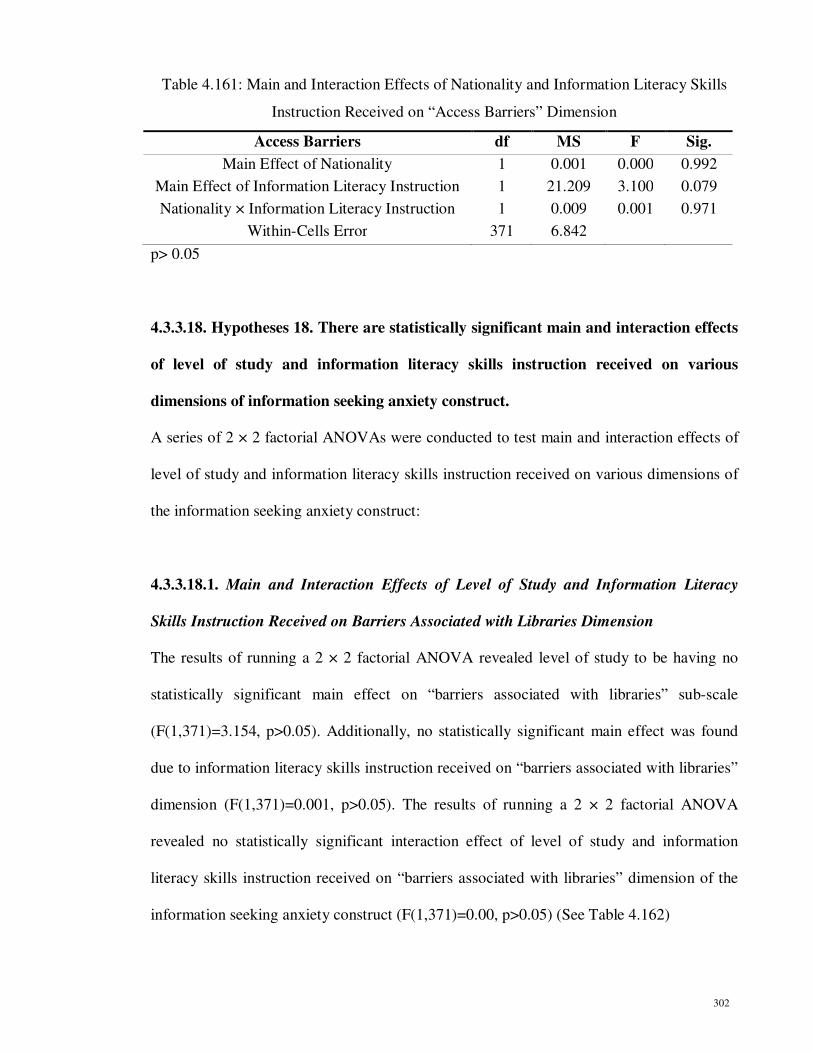
302
Table 4.161: Main and Interaction Effects of Nationality and Information Literacy Skills
Instruction Received on “Access Barriers” Dimension
Access Barriers df MS F Sig.
Main Effect of Nationality 1 0.001 0.000 0.992
Main Effect of Information Literacy Instruction 1 21.209 3.100 0.079
Nationality × Information Literacy Instruction 1 0.009 0.001 0.971
Within-Cells Error 371 6.842
p> 0.05
4.3.3.18. Hypotheses 18. There are statistically significant main and interaction effects
of level of study and information literacy skills instruction received on various
dimensions of information seeking anxiety construct.
A series of 2 × 2 factorial ANOVAs were conducted to test main and interaction effects of
level of study and information literacy skills instruction received on various dimensions of
the information seeking anxiety construct:
4.3.3.18.1. Main and Interaction Effects of Level of Study and Information Literacy
Skills Instruction Received on Barriers Associated with Libraries Dimension
The results of running a 2 × 2 factorial ANOVA revealed level of study to be having no
statistically significant main effect on “barriers associated with libraries” sub-scale
(F(1,371)=3.154, p>0.05). Additionally, no statistically significant main effect was found
due to information literacy skills instruction received on “barriers associated with libraries”
dimension (F(1,371)=0.001, p>0.05). The results of running a 2 × 2 factorial ANOVA
revealed no statistically significant interaction effect of level of study and information
literacy skills instruction received on “barriers associated with libraries” dimension of the
information seeking anxiety construct (F(1,371)=0.00, p>0.05) (See Table 4.162)

303
Table 4.162: Main and Interaction Effects of Level of Study and Information Literacy
Skills Instruction Received on “Barriers Associated with Libraries” Dimension
Barriers Assoc. with Libraries df MS F Sig.
Main Effect of Level of Study 1 124.743 3.154 0.077
Main Effect of Information Literacy Instruction 1 0.027 0.001 0.979
Level of Study × Information Literacy
Instruction 1 0.001 0.000 0.995
Within-Cells Error 371 39.554
p> 0.05
4.3.3.18.2. Main and Interaction Effects of Level of Study and Information Literacy
Skills Instruction Received on Barriers Associated with Information Resources
Dimension
The results of running a 2 × 2 factorial ANOVA revealed information literacy skills
instruction received to have no statistically significant main effect on “barriers associated
with information resources” sub-scale (F(1,371)=0.00, p>0.05). There was however,
statistically significant main effect due to level of study on “barriers associated with
information resources” dimension (F(1,371)=4.600, p<0.05). Additionally, the interaction
effect of level of study and information literacy skills instruction received on “barriers
associated with information resources” sub-scale of the information seeking anxiety
construct was not statistically significant (F(1,371)=2.083, p>0.05) (See Table 4.163).
Table 4.163: Main and Interaction Effects of Level of Study and Information Literacy
Skills Instruction received on “Barriers Associated with Information Resources” Dimension
Barriers Assoc. with Information Resources df MS F Sig.
Main Effect of Level of Study 1 78.719 4.600 0.033 *
Main Effect of Information Literacy Instruction 1 0.001 0.000 0.993
Level of Study × Information Literacy
Instruction 1 35.642 2.083 0.150
Within-Cells Error 371 17.111
P< 0.05

304
4.3.3.18.3. Main and Interaction Effects of Level of Study and Information Literacy
Skills Instruction Received on Barriers Associated with Computers, the Internet and
Electronic Resources Dimension
The results of running a 2 × 2 factorial ANOVA revealed information literacy skills
instruction received to have no statistically significant main effect on “barriers associated
with computers, the Internet and electronic resources” sub-scale (F(1,371)=0.015, p>0.05).
There was however, statistically significant main effect due to level of study on “barriers
associated with computers, the Internet and electronic resources” dimension
(F(1,371)=4.390, p<0.05). Additionally, the interaction effect of level of study and
information literacy skills instruction received on “barriers associated with computers, the
Internet and electronic resources” sub-scale of the information seeking anxiety construct
was not statistically significant (F(1,371)=0.055, p>0.05) (See Table 4.164).
Table 4.164: Main and Interaction Effects of Level of Study and Information Literacy
Skills Instruction received on “Barriers Associated with Computers, the Internet and
Electronic Resources” Dimension
Barriers Assoc. with Computers df MS F Sig.
Main Effect of Level of Study 1 31.401 4.390 0.037 *
Main Effect of Information Literacy Instruction 1 0.108 0.015 0.902
Level of Study × Information Literacy
Instruction 1 0.396 0.055 0.814
Within-Cells Error 371 7.153
P< 0.05
4.3.3.18.4. Main and Interaction Effects of Level of Study and Information Literacy
Skills Instruction Received on technological Barriers Dimension
The results of running a 2 × 2 factorial ANOVA revealed level of study to be having no
statistically significant main effect on “technological barriers” sub-scale (F(1,371)=1.720,

305
p>0.05). Additionally, no statistically significant main effect was found due to information
literacy skills instruction received on “technological barriers” dimension (F(1,371)=1.220,
p>0.05). The results of running a 2 × 2 factorial ANOVA revealed no statistically
significant interaction effect of level of study and information literacy skills instruction
received on “technological barriers” dimension of the information seeking anxiety construct
(F(1,371)=0.028, p>0.05) (See Table 4.165).
Table 4.165: Main and Interaction Effects of Level of Study and Information Literacy
Skills Instruction Received on “Technological Barriers” Dimension
Technological Barriers df MS F Sig.
Main Effect of Level of Study 1 28.455 1.720 0.190
Main Effect of Information Literacy Instruction 1 20.173 1.220 0.270
Level of Study × Information Literacy Instruction
1 0.457 0.028 0.868
Within-Cells Error 371 16.540
p> 0.05
4.3.3.18.5. Main and Interaction Effects of Level of Study and Information Literacy
Skills Instruction Received on Affective Barriers Dimension
The results of running a 2 × 2 factorial ANOVA revealed information literacy skills
instruction received to have no statistically significant main effect on “affective barriers”
sub-scale (F(1,371)=0.007, p>0.05). There was however, statistically significant main
effect due to level of study on “affective barriers” dimension (F(1,371)=10.942, p<0.05).
Additionally, the interaction effect of level of study and information literacy skills
instruction received on “affective barriers” sub-scale of the information seeking anxiety
construct was not statistically significant (F(1,371)=0.792, p>0.05) (See Table 4.166).
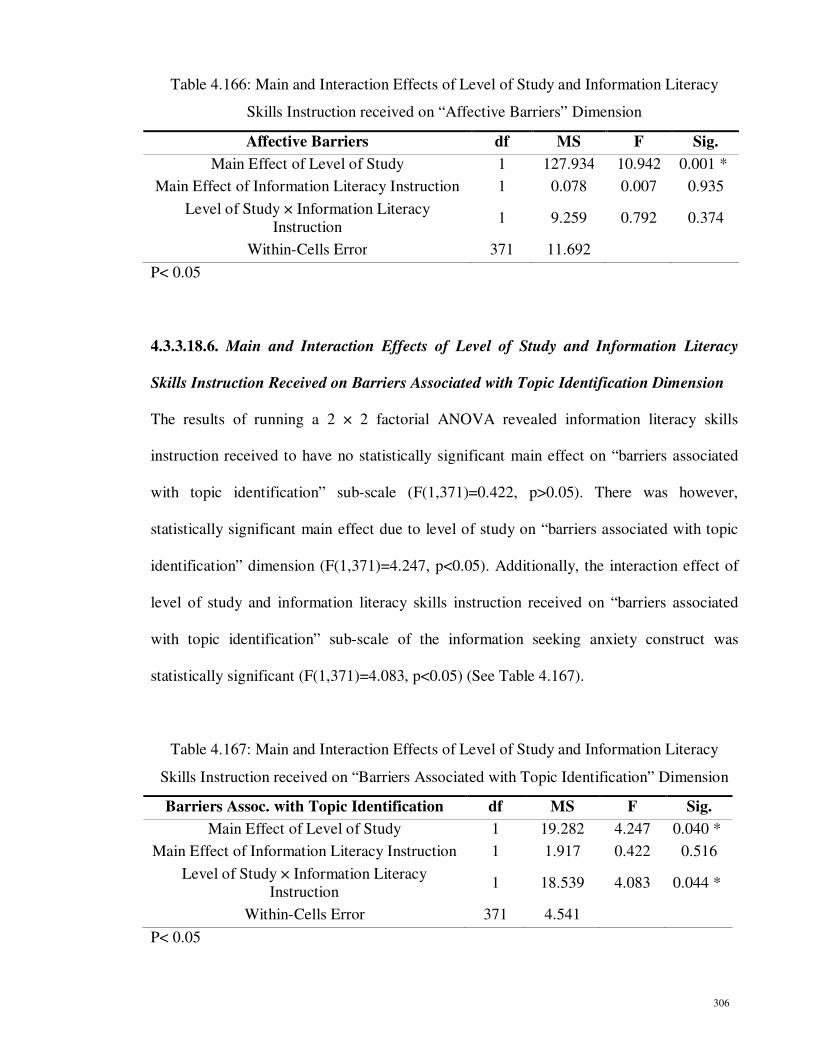
306
Table 4.166: Main and Interaction Effects of Level of Study and Information Literacy
Skills Instruction received on “Affective Barriers” Dimension
Affective Barriers df MS F Sig.
Main Effect of Level of Study 1 127.934 10.942 0.001 *
Main Effect of Information Literacy Instruction 1 0.078 0.007 0.935
Level of Study × Information Literacy
Instruction 1 9.259 0.792 0.374
Within-Cells Error 371 11.692
P< 0.05
4.3.3.18.6. Main and Interaction Effects of Level of Study and Information Literacy
Skills Instruction Received on Barriers Associated with Topic Identification Dimension
The results of running a 2 × 2 factorial ANOVA revealed information literacy skills
instruction received to have no statistically significant main effect on “barriers associated
with topic identification” sub-scale (F(1,371)=0.422, p>0.05). There was however,
statistically significant main effect due to level of study on “barriers associated with topic
identification” dimension (F(1,371)=4.247, p<0.05). Additionally, the interaction effect of
level of study and information literacy skills instruction received on “barriers associated
with topic identification” sub-scale of the information seeking anxiety construct was
statistically significant (F(1,371)=4.083, p<0.05) (See Table 4.167).
Table 4.167: Main and Interaction Effects of Level of Study and Information Literacy
Skills Instruction received on “Barriers Associated with Topic Identification” Dimension
Barriers Assoc. with Topic Identification df MS F Sig.
Main Effect of Level of Study 1 19.282 4.247 0.040 *
Main Effect of Information Literacy Instruction 1 1.917 0.422 0.516
Level of Study × Information Literacy
Instruction 1 18.539 4.083 0.044 *
Within-Cells Error 371 4.541
P< 0.05

307
The results of the study revealed that Master’s level students who have not received
information literacy instruction were reported to have experienced the highest levels of
information seeking anxiety related to “barriers associated with topic identification”
(M=7.873) when compared to (a) master’s level students who have received information
literacy instruction (M=7.524), (b) doctoral level students who have received information
literacy instruction (Mean=6.833) and (c) doctoral level students who have not received
information literacy skills instruction (Mean=7.514) (See Table 4.168).
Table 4.168: Mean Anxiety for Level of Study and Information Literacy Skills Instruction
Received on Barriers Associated with Topic Identification
“Barriers Assoc. with Topic
Identification” and Level of
Study
“Barriers Assoc. with Topic
Identification” and Information
Literacy instruction
Mean
Master No 7.873
Yes 7.524
PhD No 6.833
Yes 7.514
4.3.3.18.7. Main and Interaction Effects of Level of Study and Information Literacy
Skills Instruction Received on Access Barriers Dimension
The results of running a 2 × 2 factorial ANOVA revealed level of study to be having no
statistically significant main effect on “access barriers” sub-scale (F(1,371)=0.988, p>0.05).
Additionally, no statistically significant main effect was found due to information literacy
skills instruction received on “access barriers” dimension (F(1,371)=0.962, p>0.05). The
results of running a 2 × 2 factorial ANOVA revealed no statistically significant interaction
effect of level of study and information literacy skills instruction received on “access
barriers” dimension of the information seeking anxiety construct (F(1,371)=2.164, p>0.05)
(See Table 4.169).

308
Table 4.169: Main and Interaction Effects of Level of Study and Information Literacy
Skills Instruction Received on “Access Barriers” Dimension
Access Barriers df MS F Sig.
Main Effect of Level of Study 1 6.714 0.988 0.321
Main Effect of Information Literacy Instruction 1 6.539 0.962 0.327
Level of Study × Information Literacy
Instruction 1 14.704 2.164 0.142
Within-Cells Error 371 6.796
p> 0.05
4.4. Summary of the Chapter
This chapter contained the findings of the study. In order to respond to the first research
question, the process of development and validation of the Information Seeking Anxiety
Scale was discussed. Using mean scores of various sub-scales of the Information Seeking
Anxiety Scale as well as the overall scale, the most and the least prevalent dimensions of
the information seeking anxiety construct were identified. Finally, the mean differences and
relationships between various dimensions of the information seeking anxiety construct and
selected demographic variables were studied using a series of inferential tests.
309
CHAPTER FIVE
DISCUSSIONS AND CONCLUSIONS
5.1. Introduction
The current study is conducted in order to (a) develop and validate the Information Seeking
Anxiety Scale (ISAS) (b) determine components of the information seeking anxiety
construct which have the most and the least prevalence among postgraduate students at a
research-intensive university in Malaysia and (c) determine whether statistically significant
mean differences and relationships exist between selected independent variables and
various dimensions of the information seeking anxiety construct among postgraduate
students at the sampled university. The research objectives were represented in the
following research questions:
a) How can a valid and reliable instrument be developed and validated to measure
information seeking anxiety of postgraduate students?
b) What components of the information seeking anxiety construct have the most and the
least prevalence among postgraduate students at a research-intensive university in
Malaysia?
c) Do statistically significant mean differences, relationships and main and interaction
effects exist between various dimensions of the information seeking anxiety construct and
selected independent variables (gender, level of study, nationality, information literacy
skills instruction received, students’ academic major, age, frequency of library use and
frequency of Internet use) among postgraduate students at a research-intensive university in
Malaysia?

310
This chapter integrates and discusses the findings from Chapter four (4) within the context
of other research developments in relation to the research questions. The majority of this
chapter is devoted to the summary and discussion of the research findings. It also discusses
the contribution of the study to existing body of the literature on information seeking
behaviors and the anxiety experienced in the process of information seeking in libraries and
information systems. The chapter further considers the implication of the study at both
theoretical and empirical levels. Finally, the limitations of the study are discussed, along
with the possible directions for future research.
5.2. Addressing the Research Objectives and Questions
The research findings are discussed with respect to the specific research questions and
hypotheses addressed:
5.2.1. Development and Validation of an Instrument to Measure Information Seeking
Anxiety among Postgraduate Students
An extensive review of the literature on feelings and emotions during the information
seeking process was conducted for this study. It was found that hitherto no scale was ever
developed, let alone validated, to assess the anxiety that was experienced by students
during the information seeking process in libraries or information systems. Subsequently,
this study was conducted to address a gap in the literature by developing and validating the
Information Seeking Anxiety Scale (ISAS). The research to develop the Information
Seeking Anxiety Scale (ISAS) took place in several empirical phases. In the first step, a list
of ninety-four (94) potential key components was generated using different resources.
Possible components were gleaned from several sources include: a) extensive review of the
literature in the areas of library anxiety, computer anxiety, Internet anxiety, information
311
anxiety, information seeking process, and other related areas; b) existing instruments in
aforementioned constructs; c) interviews with ten (10) postgraduate students to identify
what made them anxious when they were seeking information related to their research in
libraries or information systems and d) consultation with the Library and Information
Science (LIS) faculty members at the university. As a result, a pool of ninety-four (94) key
components was formulated by the researcher.
The initial list of key components was sent to a panel of experts for validation. Based on the
responses received from ten (10) experts, twenty-nine (29) components were eliminated
from the list, and five (5) new components were added, leaving seventy (70) components.
In the next step of the instrument development, a list of one hundred and fifty-four (154)
statements was created based on the list of seventy (70) key components. The list of
statements was submitted again to the same panel of experts for validation. Responses were
received from eight (8) experts out of fourteen (14) which incorporated several changes and
modifications. Statements were then revised based on feedback from expert judges.
Accordingly, ninety-one (91) statements were retained in the list, sixty-three (63)
statements were removed, and two (2) new statements were added, resulting in a total of
ninety-three (93) items. Additionally, twenty-five (25) items were slightly reworded for
clarity. Following revisions to the list of statements, a pilot instrument was developed in
order to determine its potential validity. The pilot instrument consisted of ninety-three (93)
statements, scored on a 5-point Likert-type scale ranging from 1 (strongly disagree) to 5
(strongly agree). The statements were both in positive and negative forms and had at least
one (1) statement addressing each key component that was identified before. Additionally,
a demographic information form was developed to collect the essential demographic
information for this study. The following demographic information were collected using

312
this form: age, gender, academic major, level of study, nationality, frequency of library use,
frequency of the Internet use, and information literacy skills instruction received. Two (2)
pilot studies were conducted during January to March 2011 at a research-intensive
university in Kuala Lumpur, Malaysia. A total of four hundred (400) postgraduate students
took part in the pilot studies. The returned questionnaires from the respondents were
reviewed for incomplete or missing information before being entered into the Predictive
Analysis Software (PASW) for statistical analysis.
In order to assess the validity of the instrument, several approaches were used included
face, content, and construct validation. A group of fifteen (15) postgraduate students
evaluated the instrument for face validity. Overall, they reported that the instrument was
complete and easy to understand. In order to assess the content validity of the instrument, it
was presented to a panel of experts for suggestions and validation. Seven (7) experts
established content validity of the instrument and confirmed that the statements of the
instrument appeared to measure the construct of information seeking anxiety. Construct
validity of the instrument was determined using an Exploratory Factor Analysis. The
Kaiser-Meyer-Olkin (KMO) measure of sampling adequacy (0.904) and Bartlett’s Test of
Sphericity (chi-square=6849.087, df=1081, p=0.000), indicated the suitability of the data
for factor analysis.
Exploratory Factor Analysis using varimax rotation method was performed in order to
assess the construct validity of the instrument as well as to determine the appropriate
number of factors and statements grouping in each of these factors. To produce
meaningfully distinct factors, the principal component analysis method was utilized. Using
this method, fifty-three (53) statements with factor loading less than 0.4 were excluded

313
from the study, remaining forty (40) items. Results of running an Exploratory Factor
Analysis yielded seven (7) factors which collectively explained 50.152% of the total
variance of the instrument. This finding was less than Bostick’s (1992) study which yielded
(5) factors that collectively explained 51.8% of the total variance in library anxiety.
Additionally, Abusin’s (2010) study also resulted in seven (5) factors that collectively
explained 50.74% of the total variance in library anxiety. Conversely, total variance in
information seeking anxiety found in current study was more than that of Noor and Ansari
(2011) who reported 39.6% of the total variance in library anxiety. The finding of this study
was also more than Van Kampen’s (2004) study which yielded five (5) factors that
collectively explained 43.39% of the total variance in library anxiety.
The first factor of the Information Seeking Anxiety Scale, barriers associated with
libraries, consisted of ten (10) statements which explained 24.423% of the total variance.
The factor had items loading from 0.441 to 0.718. This factor represents some aspects of
library including policies and procedures, services, furniture, temperature, lighting, library
staff as well as library website and OPAC which contribute to students’ feeling of anxiety
during information seeking process in libraries (See Table 3.10). Dissatisfaction with
library policies and procedures were found to be associated with feeling of information
seeking anxiety. This is similar to the findings of Bostick (1992), Shoham and Mizrachi
(2001), Van Kampen (2004) and Abusin (2010). Referring to Shoham and Mizrachi’s
(2001) “library policies and hour factor”, they found that some students have negative
attitudes and feelings toward library regulations, rules and hours. Additionally,
uncomfortable library furniture found to be associated with information seeking anxiety
among postgraduate students. This finding supports that of Onwuegbuzie, Jiao and Bostick
(2004) and Abusin (2010) who found that library anxiety can be influenced by library

314
furniture. The finding that library staff and librarians have effect on student’s levels of
information seeking anxiety is consistent with the large body of literature (Bostick, 1992;
Shoham & Mizrachi, 2001; Onwuegbuzie, Jiao & Bostick, 2004; Van Kampen, 2004; Noor
& Ansari, 2011; Swigon, 2011; Erfanmanesh, 2011) which indicated that student’s negative
attitude toward librarians plays an important role with respect to their feelings toward the
library. Bostick (1992), Shoham and Mizrachi (2001), Van Kampen (2004), Anwar, Al-
Kandari and Al-Qallaf (2004), Noor and Ansari (2011) and Swigon (2011) referred to
anxiety which stem from interaction with librarians and library staff as “barriers with staff”,
“staff factor”, “barriers concerning staff”, “staff approachability”, “barriers with staff” and
“barriers with staff” respectively. Moreover, the study indicated that postgraduate students
were reported to have experienced anxiety while they were using library services during the
information search process. The same results were obtained from the study conducted by
Bostick (1992), Onwuegbuzie, Jiao and Bostick (1992), Abusin (2010), Erfanmanesh
(2011) and Noor and Ansari (2010). Finally, inappropriate library temperature and
inadequate library lighting were found to be associated with students’ anxiety when they
were seeking for information resources in libraries. This finding is somewhat consistent
with Bostick (1992), Van Kampen (2004) and Abusin (2010) findings.
The second factor of the Information Seeking Anxiety Scale, barriers associated with
information resources, contained seven (7) statements that were accounted for 7.315% of
the total variance. The items within this factor had factor loadings between 0.452 and
0.698. This factor represents some aspects of information resources including quality of
information resources, relevance of information resources, novelty of information
resources, familiarity with information resources and information resources ease of use
which contributes to students’ feeling of anxiety during the information seeking process
315
(See Table 3.11). Similarly, Onwuegbuzie (1997), Shoham and Mizrachi (2001), Swigon
(2011) and Erfanmanesh (2011) referred to anxiety which stem from interaction with
information resources as “resources anxiety”, “resources factor”, “resources barriers” and
“barriers with library resources” respectively. The fact that finding poor quality information
resources during the information seeking process cause anxiety is consistent with the
findings of Bostick (1992) and Chowdhury and Gibb (2009). Additionally, finding
irrelevant and out-of-date information resources were found to be associated with student’s
information seeking anxiety (Bostick, 1992; Chowdhury & Gibb, 2009; Abusin, 2010).
Finally, the finding that unfamiliarity with information resources associated with levels of
information seeking anxiety is in accordance with findings of Chowdhury and Gibb (2009)
and Bowers (2010).
Only four (4) items were loaded on the third dimension of the Information Seeking Anxiety
Scale, barriers associated with computers, the Internet and electronic resources. These
items ranged from factor loading as low as 0.442 to factor loading as high as 0.752 and
collectively explained 5.150% of the total variance in information seeking anxiety. This
sub-scale includes statements related to using computers and the Internet for seeking
information resources as well as using electronic resources (See Table 3.12). This factor is
similar in way to Shoham and Mizrachi’s (2001) “computer comfort”, Van Kampen’s
(2004) “comfort with technology” and Noor and Ansari’s (2011) “comfort with library
technology” dimensions. The finding that postgraduate students experienced levels of
anxiety when using computers and the Internet in order to search for information resources
is consistent with a large body of literature in the area of computer anxiety as well as
Internet anxiety (Fliotsos, 1992; Presno, 1988; Otomo, 1998; Jerabek, Meyer & Kordinak,

316
2001; Ben Omran, 2001; Kohrman, 2002; Cooper & Weaver, 2003; Jiao & Onwuegbuzie,
2004; Barbiete & Weiss, 2004).
Six (6) items were loaded on the fourth dimension of the Information Seeking Anxiety
Scale, technological barriers, which explained 4.181% of the total variance. The fourth
factor had items loading from 0.421 to 0.745. This sub-scale includes statements related to
the influence of system malfunction, mechanical issues, computer errors, computer
damages and slow downloading of pages and resources during the information seeking
process in information systems (See Table 3.13). This factor is similar to Bostick (2001)
and Erfanmanesh’s (2011) “mechanical barriers” and Swigin’s (2011) “technological
barriers” dimension of library anxiety. The fact that occurrence of mechanical and
technological problems during the information seeking process cause anxiety and
frustration in students is consistent with the findings of Bostick (1992), Ben Omran (2001),
Kohrman (2003), Van Kampen (2003), Brannan (2003), Onwuegbuzie, Jiao and Bostick
(2004). Moreover, Onwuegbuzie (1997), Jiao and Onwuegbuzie (1999a), Jiao and
Onwuegbuzie (2001b) Brannan (2003) reported that the “mechanical barrier” dimension
was the most important and prevalent source of library anxiety among students.
Factor five, Affective barriers, comprised five (5) statements and accounted for 3.430% of
the total variance in information seeking anxiety. This factor had factor loadings that
ranged from 0.525 to 0.679. Affective barriers dimension represents some statements
associated with negative feelings during the information seeking process (See Table 3.14).
This dimension is somewhat similar to Bostick (1992), Noor & Ansari (2010), Abusin
(2010) and Swigon’s (2011) “affective barriers” dimensions and Anwar, Al-Kandari and
Al-Qallaf’s (2004) “feeling of inadequacy” dimension of library anxiety. The finding that
317
student’s negative attitudes toward their information seeking skills and ability to find
required information resources during the information seeking process make them anxious
and frustrated is consistent with the findings of Mellon (1986a), Kuhlthau (1988b, 1993)
and Van Kampen (2003).
Three (3) statements were loaded on the sixth dimension of the Information Seeking
Anxiety Scale, barriers associated with topic identification, which explained 2.865% of the
total variance. The items within this factor had factor loadings between 0.642 and 0.825.
The emphasis of this factor is on determining search terms, selecting general topic and
narrowing down the general topic to formulating a focused topic in the process of
information seeking (See Table 3.16). No previous study has identified “barriers associated
with topic identification” as a factor which associated with levels of anxiety during
information seeking process in libraries or information systems.
Finally, the seventh dimension of the Information Seeking Anxiety Construct comprised
five (5) items and explained only 2.787% of the total variance. The items within this factor
exhibited factor loadings ranging from 0.418 to 0.774. This factor was named as Access
barriers. The seventh factor includes statements associated with accessibility of
information resources. This is the first study to identify “access barriers” as a factor which
associated with levels of anxiety during information seeking process in libraries or
information systems (See Table 3.17).
To determine the internal reliability of all sub-scales as well as the overall scale,
Cronbach’s coefficient alpha was calculated. Reliability analysis using Cronbach’s alpha
revealed two (2) problematic items which were subsequently eliminated. Dropping these

318
two (2) items from third and seventh factors had the effect of raising alpha coefficient
values of these factors. The reliability (alpha) coefficients of the seven (7) sub-scales were
0.832, 0.783, 0.745, 0.784, 0.794, 0.763 and 0.730 respectively. Additionally, resultant
alpha coefficient of 0.917 for overall scale provided evidence of adequate internal
consistency of the instrument.
Results of the study indicated that the newly developed scale, Information Seeking Anxiety
Scale (ISAS), had satisfactory face, content, and construct validity as well as internal
reliability. The Information Seeking Anxiety Scale (ISAS) contains thirty-eight (38) 5-point
Likert-format items that measures seven (7) facets of information seeking anxiety construct.
This scale has the potential to be a useful tool for determining what aspects of the
information seeking process in libraries or information systems are perceived to be barriers
by postgraduate students. Furthermore, the study found that information seeking anxiety is
a multidimensional construct. This finding is consistent with Bostick (1992), Shoham and
Mizrachi (2001), Van Kampen (2004) and Noor and Ansari’s (2011) findings that library
anxiety to be a multidimensional construct.
5.2.2. Components of the Information Seeking Anxiety Construct That Have the Most
and the Least Prevalence among Postgraduate Students
In order to examine overall information seeking anxiety as well as each of the seven (7)
dimensions, mean anxiety was computed for the total Information Seeking Anxiety Scale
(ISAS) and for each of the seven (7) dimensions. By comparing mean scores, information
seeking anxiety could be compared across the full scale and its sub-scales. A higher score
indicated higher levels of information seeking anxiety. The overall information seeking
anxiety mean score was 88.31, which was virtually the same as the median, at 88.395. The

319
standard deviation was 16.434 with the minimum score being 40 and the maximum score
being 135 for a range of 95. Information seeking anxiety total score for the sample of the
study indicated that while information seeking anxiety is present, overall levels are not
high. With regard to the seven (7) sub-dimensions, levels of information seeking anxiety
ranges from a low of 7.146 to a high of 23.261. The results of the study revealed that
“barriers associated with libraries” dimension was the most important source of information
seeking anxiety among postgraduate students, followed by “barriers associated with
information resources” , “technological barriers”, “affective barriers”, “access barrier” and
“barriers associated with topic identification”. The results revealed that postgraduate
students were reported to have experienced the lowest levels of information seeking anxiety
associated with “barriers associated with computers, the Internet and electronic resources”
dimension of the Information Seeking Anxiety Scale (ISAS).
Postgraduate students at the sampled university had the greatest levels of information
seeking anxiety as it pertained to the “barriers associated with libraries” with a mean score
of 23.261. Based on the items that comprise this component, postgraduate students
appeared to have less comfort with using university libraries in order to search for
information resources. Conversely, postgraduate students had the least levels of information
seeking anxiety as it pertained to “barriers associated with computers, the Internet and
electronic resources” dimension with a mean score of 7.146. This finding indicated that
postgraduate students experienced low levels of information seeking anxiety in regard to
using computers, the Internet, online and electronic resources during the information
seeking process.

320
The researcher also used Anwar, Al-Kandari and Al-Qallaf’s (2004) proposed levels of
library anxiety as a useful way to determine levels of information seeking anxiety in
various sub-dimensions as well as total scale. The results revealed that about 70% of
postgraduate students at a research-intensive university in Malaysia were reported to have
experienced mild level of information seeking anxiety, while moderate and severe levels of
information seeking anxiety were reported only by fifty-eight (15.5%) postgraduate
students. Different levels (low, mild, moderate and severe levels) of the information
seeking anxiety construct were reported by 96.5% of the postgraduate students at the
sampled university. The results of the study showed that the information seeking anxiety is
prevalent among postgraduate students which is present in 96.5% of the postgraduate
students at a research-intensive university in Kuala Lumpur, Malaysia. It should be noted
that information needs, seeking and use are situational, and the information
seeking anxiety is a contextual phenomenon. Context is the site (research-intensive
university) where the phenomenon (information seeking anxiety) is consitituted as the
research object. The prevalence and levels of information seeking anxiety will probably be
different if the research object is gauged in another research setting.
5.2.3. The mean differences, relationships and main and interaction effects between
Various Dimensions of the Information Seeking Anxiety Construct and Selected
Independent Variables
In the following sections the findings are reviewed for each hypothesis followed by
discussions of the findings:

321
5.2.3.1. Gender and Information Seeking Anxiety Construct
The results of running an independent sample t-test revealed that although female
postgraduate students were found to have experienced higher levels of information seeking
anxiety associated with five (5) out of seven (7) dimensions of the Information Seeking
Anxiety Scale, statistically significant mean differences between males and females were
found in only two (2) out of seven (7) dimensions. Accordingly, female postgraduate
students were found to have experienced statistically significantly higher levels of
information seeking anxiety regard to “barriers associated with information resources” and
“access barriers” dimensions than male postgraduate students. The differences found
between female and male postgraduate students in other five (5) sub-scales of the
Information Seeking Anxiety Scale were not at the level of significance (p<0.05). Hence,
gender has statistically significant effect on only two (2) dimensions of the information
seeking anxiety construct.
Previous studies have had mixed results as to whether or not anxiety experienced by
students during information seeking process in libraries or information systems differed
between males and females. Some previous studies have reported higher levels of anxiety
in males than females. Jacobson (1991), Jiao, Onwuegbuzie and Lichtenstein (1996), Jiao
and Onwuegbuzie (1997b) and Anwar, Al-Kandari and Al-Qallaf (2004) found males to be
experiencing higher levels of library anxiety than females. In another study, Brosnan and
Lee (2000) found males to be experiencing higher levels of computer anxiety than did
females.
One group of research findings has reported higher levels of anxiety in females compared
to males. Shoham and Mizrachi (2001) found that female Israeli students reported to have

322
experienced higher levels of library anxiety associated with three (3) out of seven (7)
dimensions of the Hebrew-Library Anxiety Scale namely, “staff barriers”, “language
barriers” and “resource barriers”, than did male students. Additionally, Noor and Ansari
(2011) found that Malaysian female students experienced higher levels of library anxiety
stemming from “cognitive barriers” than their male counterparts. Brown et al. (2004) found
higher library anxiety scores in females than in males. In another study, Durndell and Haag
(2002) reported female students to be experiencing higher levels of computer anxiety than
male students. Consistent with this finding, Anderson (1987), Clarke and Teague (1987),
Sigurdsson (1991), Massoud (1991), Okebukola (1993), Rosen and Weil (1995), Chua,
Chen and Wong (1999) and Todman (2000) have found higher computer anxiety scores in
females than in males.
Other studies reported no gender differences in levels of anxiety. Neither Bostick (1992)
nor Mech and Brooks (1997) found gender differences in levels of library anxiety.
Onwuegbuzie and Jiao (2000), Ben Omran (2001), Kohrman (2002), Bowers (2010) and
Lee (2011) reported that gender was not a statistically significant contributor to the library
anxiety construct. Additionally, No gender differences in levels of library anxiety were also
identified in Bowers (2010) and Lee’s (2011) studies. Additionally, Dyck and Smither
(1994), Todman and Monaghan (1994) and Scott and Rockwell (1997) found no
relationship between computer anxiety and gender.
The finding that female students were found to have experienced statistically significantly
higher levels of information seeking anxiety stemming from “barriers associated with
information resources” than male students is consistent with the finding of Shoham and
Mizrachi (2001) who found that females to be experiencing higher levels of library anxiety
323
associated with “resources barriers” dimension than did male students. Additionally,
Onwuegbuzie (1997) found resources anxiety to be one of the most prevalent dimensions of
library anxiety. Accordingly, students who were unable to obtain required information
resources found in a library search, were more likely to experience higher levels of anxiety
than others. Previous studies revealed that anxiety increase when necessary information
resources may not be available (Onwuegbuzie, 1997a), “when what is found is not wanted”
or when different technologies or skills are required to find needed information resources”
(Wiberley & Jones, 2000 as cited in Kohrman, 2002, p. 17).
The finding that female postgraduate students reported to have experienced higher levels of
information seeking anxiety associated with five (5) out of seven (7) sub-dimensions, might
be explained by the fact that female students (M=2.556, SD=1.699) were found to have
used the university library less frequently than their male counterparts (M=2.715,
SD=1.858). An earlier studies by Jiao, Onwuegbuzie and Lichtenstein (1996), Jiao and
Onwuegbuzie (1997a) and Onwuegbuzie, Jiao and Bostick (2004) found a negative
relationship between frequency of library use and levels of library anxiety. Additionally,
Jiao and Onwuegbuzie (2002a) found that “high anxious students are approximately two-
and-a-half times less likely to visit the library than the low anxious students” (Jiao and
Onwuegbuzie, 2002a as cited in Onwuegbuzie, Jiao and Bostick, 2004, p. 47).
The finding that male students were reported to have experienced higher levels of
information seeking anxiety stemming from “barriers associated with libraries” than their
female counterparts, somewhat supports that of Jiao, Onwuegbuzie and Lichtenstein (1996)
and Jiao and Onwuegbuzie (1997b) who found that males experienced higher levels of
anxiety in library environment than did females. In another study Jacobson (1991) found

324
that males will feel hesitant to approach a female for assistance whereas a female will feel
more comfortable to ask a female for help. He named this situation as “female-based library
culture”. Consistent with these findings, Battle (2004) revealed that on their visit to the
library to find information resources, males seemed to become more frustrated, but they
appeared more reluctant to ask for assistance.
5.2.3.2. Level of Study and Information Seeking Anxiety Construct
The results of running an independent sample t-test revealed that although master’s level
students experienced higher levels of information seeking anxiety associated with all seven
(7) dimensions of the Information Seeking Anxiety Scale than did their doctoral level
counterparts, statistically significant differences in anxiety levels between these two (2)
groups were only found in the “barriers associated with computers, the Internet and
electronic resources” and “affective barriers” dimensions. As a result, master’s level
students were found to experience statistically significantly higher levels of information
seeking anxiety regard to “barriers associated with computers, the Internet and electronic
resources” and “affective barriers” dimensions than did doctoral level students. The
differences found in mean anxiety values of other five (5) sub-scales of the Information
Seeking Anxiety Scale between master’s level and doctoral level students were not at the
level of significance (p<0.05). Hence, level of study has statistically significant effect on
only two (2) dimensions of the information seeking anxiety construct.
With regard to the relationship between level of study and library anxiety, research findings
have been mixed. Whereas most of researchers have found that library anxiety declines
linearly as a function of year of study (Bostick, 1992; Mech & Brooks, 1995; Jiao,
Onwuegbuzie & Lichtenstein, 1996; Onwuegbuzie, 1997a; Jiao & Onwuegbuzie, 1997b;

325
Onwuegbuzie, Jiao & Bostick, 2004), others have reported no statistically significant
differences between levels of study in regard to library anxiety (Shoham & Mizrachi, 2001;
Bowers, 2010). The finding that doctoral level students reported to have experienced lower
levels of information seeking anxiety associate with all seven (7) dimensions of the
information seeking anxiety than did their master’s level counterparts, might be explained
by the fact that doctoral level students have more experience in conducting postgraduate
level research. The explanation for this could be that most, if not all, of doctoral level
students have conducted a postgraduate level research in their master’s level study. They
have experience of searching topics for research, seeking for related information resources,
conducting a literature review, writing a research proposal and eventually settling on the
dissertation topic. Conversely, although master’s level students have used the library and
online resources for research purposes in their undergraduate level study, they have
probably never needed to use as many resources and services as they may need at the
master’s level research. The intricacy of graduate level research requires searching beyond
the Internet and information systems for resources, and students find the need to learn
research skills, some truly for the first time (Kohrman, 2002). Consequently, many of the
master’s level students who are unprepared for conducting postgraduate-level research face
high levels of anxiety. These students discover their research and information seeking skills
are inadequate for conducting a postgraduate level research and that’s why they show
evidence of high levels of information seeking anxiety associated with “affective barriers”
dimension.
Moreover, a possible explanation for the finding that doctoral level students were reported
to have experienced statistically significantly lower levels of information seeking anxiety
related to “barriers associated with computers” than did master’s level students, might be

326
that doctoral students may have on average more experience and use of computers and the
Internet than master’s level students. Consistent with this explanation, Bessiere et al. (2002)
found that people with higher levels of experience with computing were the least often
frustrated and anxious by the Internet. Additionally, Ben Omran (2001) found a relationship
between Internet experience and Internet anxiety.
5.2.3.3. Nationality and Information Seeking Anxiety Construct
The results of running an independent sample t-test revealed that although Malaysian
postgraduate students were reported to have experienced higher levels of information
seeking anxiety associated with four (4) out of seven (7) dimensions of the Information
Seeking Anxiety Scale, no statistically significant differences were found between
Malaysian and non-Malaysian postgraduate students with regard to their scores on various
dimensions of the information seeking anxiety construct. In other words, the differences
found in mean anxiety values of all seven (7) dimensions of the information seeking
anxiety between Malaysian and non-Malaysian students were not at the level of
significance (p<0.05). Hence, nationality is not an antecedent of the information seeking
anxiety construct.
With regard to the relationship between race and library anxiety, Jiao, Onwuegbuzie and
Bostick (2004) and Jiao, Onwuegbuzie and Bostick, (2006) found that African American
students reported to have experienced lower levels of library anxiety associated with
various dimensions of the Library Anxiety Scale than did Caucasian American students. In
another study, Noor and Ansari (2011) found that Malaysian students experienced higher
levels of library anxiety associated with “affective barriers” than their non-Malaysian
counterparts. Lee’s (2011) study revealed Asian students to be experiencing the highest and

327
African American students to be experiencing the lowest levels of library anxiety in a
California community college. Additionally, Ben Omran (2001) found that international
students evidenced more Internet anxiety than did American students. The findings from
this study somewhat was in contrast to aforementioned findings that race to be an
environmental antecedent of library anxiety. In contrast, findings of this study lend support
to the research conducted by Jiao, Onwuegbuzie and Lichtenstein (1996) and Shoham and
Mizrachi (2001) who found no difference existed in library anxiety levels concerning
nationality. Moreover, findings of this study supports that of Ben Omran (2001) who found
no statistically significant mean differences in the library anxiety between American and
non-Malaysian students.
A possible explanation for the finding that Malaysian students reported to have experienced
higher levels of information seeking anxiety related to “barriers associated with computers,
the Internet” and “technological barriers” than did non-Malaysian students is the fact that
Malaysian students (M=18.415, SD=16.178) were found to have used the Internet for
searching information resources less frequently than their non-Malaysian counterparts
(M=19.582, SD=17.975). Ben Omran (2001) reported a statistically significant negative
relationship between frequency on Internet use and levels of Internet anxiety. Moreover,
statistically significantly negative correlations between computer usage and computer
anxiety were reported by Barrier and Margavio (1993), Otomo (1998) and Shoham and
Mizrachi (2001).
The finding that non-Malaysian students reported to have experienced higher levels of
information seeking anxiety stemming from “barriers associated with libraries” than their
Malaysian counterparts, might be explained by language differences between these two (2)

328
groups of students. Some previous studies conducted by Jiao, Onwuegbuzie and
Lichtenstein (1996), Jiao and Onwuegbuzie (1997b), Jiao and Onwuegbuzie (1997c), Liu
and Redfern (1997), Jiao and Onwuegbuzie (2001b) found that non-native language
students were more likely to experience higher levels of library anxiety that did native
language students. Consistent with these findings, Goudy and Moushey (1984) reported
that non-native language students experience more difficulty using the university library
than do native language students. Additionally, Jiao, Onwuegbuzie and Lichtenstein (1996)
stated that “foreign students may experience significantly greater problems adapting to and
using the library than did their native counterparts” (P. 158). In another study, Shoham and
Mizrachi (2001) found that Arabic speakers reported higher levels of library anxiety than
did Hebrew speakers, despite the fact that the language of instruction at the institution
under study was Hebrew. Shoham and Mizrachi (2001) named the “language factor” as the
most prevalent and debilitating library anxiety dimension. These findings were in
accordance with Ormondroyd (1989) who found communication barriers experienced
between language-minority students and librarians.
The high levels of anxiety related to “barriers associated with libraries” among non-
Malaysian students that has been reported in this study may stem from cultural differences,
communication difficulties and the inability to conceptualize and to apply a different
language would presumably inhibit many non-Malaysian students from using libraries.
Since interaction with librarians and library stuff inhibit many foreign students from
approaching librarians (Jiao, Onwuegbuzie & Bostick, 2004), library administrators may
consider hiring qualified librarians who speak more than one language fluently in order to
assist students who are not native, as well as hiring student assistants from different
cultures to work as peer tutors (Swope & Katzer, 1072; Jiao & Onwuegbuzie, 1999a).
329
Moreover, providing information literacy skills instruction and library tours in the language
of foreign students was reported to be an effective method to ease non-Malaysian student’s
difficulties during the information search process (Liestman & Wu, 1990).
Another possible explanation for the finding that non-Malaysian students reported to have
experienced higher levels of information seeking anxiety stemming from “barriers
associated with libraries” than did Malaysian students, might be the fact that non-Malaysian
students (M=2.572, SD=1.816) were reported to use the university library less frequently
than Malaysian students (M=2.779, SD=1.7). This finding was in contrast to that of Jiao,
Onwuegbuzie and Lichtenstein (1996) and Jiao and Onwuegbuzie (1997b), Jiao and
Onwuegbuzie (1997c) and Whitmire (2002) who found non-native language students use
the university library more frequently than native language students.
5.2.3.4. Information Literacy Skills Instruction Received and Information Seeking
Anxiety Construct
The results of running an independent sample t-test revealed that although those students
who have received information literacy skills instruction were reported to have experienced
lower levels of information seeking anxiety associated with all seven (7) dimensions of the
Information Seeking Anxiety Scale than their counterparts who have not received
information literacy skills instruction, no statistically significant differences were found
between these two (2) groups of students with regard to their scores on various dimensions
of the information seeking anxiety construct. In other words, the differences found in mean
anxiety values of all seven (7) dimensions of the information seeking anxiety construct
between students who have received information literacy instruction and student who have
not, were not at the level of significance (p<0.05). Hence, information literacy skills
instruction received is not an antecedent of the information seeking anxiety construct.

330
With regard to the relationship between participation in information literacy skills
instruction and library anxiety, Jiao, Onwuegbuzie and Lichtenstein (1996) found that the
number of library instruction courses undertaken by students was statistically significantly
related to levels of library anxiety. In another study, Abusin (1998) found that Malaysian
undergraduate students who participated in a library instruction course reported statistically
significantly lower levels of library anxiety than those students who had not received any
instruction. Additionally, Cleveland (2001) found that students who were participated in
information literacy instruction course reported statistically significantly lower levels of
library anxiety than did students who had not attended instruction courses. Consistent with
these results, Jiao and Onwuegbuzie (1997b), Kracker (2002), Kracker and Wang (2002),
Van Scoyoc (2003), Battle (2004), Brown et al. (2004), Nicholas, Rudowsky and Valencia
(2007) and Malvasi, Rudosky and Valencia (2009) found that students who received
information literacy skills instruction reported statistically significantly lower levels of
library anxiety than their counterparts who have not received information literacy skills
instruction. Moreover, Palumbo and Reed (1990) and Barrier and Margavio (1993) reported
statistically significant negative correlations between the number of computer courses
attended and levels of computer anxiety. Additionally, some othet studies (Anderson &
Reed, 1998; Ayersman, 1996; Ealy, 1999) indicated that Internet skills instruction reduced
the level of Internet anxiety.
One possible reason for the finding that students who have received information literacy
skills instruction were reported to have experienced lower levels of information seeking
anxiety associated with all seven (7) dimensions than their counterparts who have not
received information literacy skills instruction, might be the fact that student’s familiarity

331
with the information seeking anxiety construct during the information literacy skills
instruction session would increase students’ awareness that this phenomenon is prevalent
among postgraduate students and they are not the only one who experience this negative
feeling, which help to keep them engaged in the search process. Another possible reason for
this finding is that students who have received information literacy skills instruction are
likely to feel more comfortable using the library after attending an instructional session,
mainly due to the interaction with the librarian. Additionally, motivating students to learn
information literacy skills and utilize these skills in order to search for information in
libraries and information systems can secure some degree of success in information seeking
process of student’s research which is an important step toward the end of the information
seeking anxiety. Another explanation is that participation in information literacy skills
instruction sessions will help students to develop a positive attitude toward the library
search part of their research.
5.2.3.5. Academic Major and Information Seeking Anxiety Construct
The results of running a one-way Analysis of Variance (ANOVA) revealed that although
those students who have studied in arts, humanities, social sciences and education
disciplines were reported to have experienced higher levels of information seeking anxiety
associated with six (6) out of seven (7) dimensions of the Information Seeking Anxiety
Scale than their counterparts who have studied in pure sciences, engineering and medical
sciences, no statistically significant differences were found between these four (4) groups
of students with regard to their scores on various dimensions of the information seeking
anxiety construct. In other words, the differences found in mean anxiety values of all seven
(7) information seeking anxiety sub-scales between students from four (4) groups of
academic majors were not at the level of significance (p<0.05).

332
It was hypothesized that there are statistically significant mean differences in information
seeking anxiety between postgraduate students from different academic majors. The results
of running a series of ANOVA tests as a function of academic major did not produce any
statistical significant results. Consequently, using a recoding technique in the Predictive
Analysis Software (PASW), the variable academic major which was measured using a
polychotomous level has been transferred into a dichotomous level variable. In other words,
anxiety values of three (3) groups of academic majors including pure sciences, engineering
and medical sciences modified to create a new variable for comparison to arts, humanities,
social sciences and education disciplines. After that, in order to investigate whether any
statistically significant mean differences exist in the various dimensions of the information
seeking anxiety construct between those students who have studied in art, humanities,
social sciences and education and those who were in pure sciences, engineering and
medical sciences, a series of independent sample t-test were employed. Results of the study
revealed that although postgraduate students who have studied in arts, humanities, social
sciences and education were reported to have experienced higher levels of information
seeking anxiety associated with six (6) out of seven (7) dimensions of the Information
Seeking Anxiety Scale than their counterparts in pure sciences, engineering and medical
sciences discipline, statistically significant mean differences between these two (2) groups
were found only in three (3) out of seven (7) dimensions. In other words students who have
studied in arts, humanities, social sciences and education were found to have experienced
statistically significantly higher levels of information seeking anxiety stemming from
“access barriers,” “affective barriers” as well as “barriers associated with computers, the
Internet and electronic resources” dimensions than those students who have studied in pure
sciences, engineering and medical sciences. The differences found in mean anxiety values
333
of other four (4) sub-scales of the ISAS between these two (2) groups of students were not
at the level of significance (p<0.05).
With regard to the relationship between students’ academic major and academic related
anxiety, Ben Omran (2001) found that student’s major was a factor that contributed to the
levels of Internet anxiety construct. Conversely, he revealed no differences in library
anxiety levels concerning students’ academic major. In another study, Reed et al. (1995)
reported a statistically significant effect of the academic major’s of the students on their
level of computer anxiety. Consistent with this result, Yang, Mohamed and Beyerbach
(1999) reported that student’s major was a significant contributor to computer anxiety.
The findings of this study showed that students who have studied in engineering, pure
sciences and medical sciences were reported to have experienced statistically significantly
lower levels of information seeking anxiety related to the “barriers associated with
computers, the Internet and electronic resources” than their counterparts in arts, humanities,
social sciences and education disciplines. Considering that the students in engineering, pure
sciences and medical sciences have more computer and Internet related curricula than the
students in arts, humanities, social sciences and education, which in turn increased their
experience in these areas, it can be suggested that the more a major is computer and
technology oriented, the more likely it is that its students are less computer and Internet
anxious than students from other majors. The results of the study revealed that students
who have studied in pure sciences, engineering and medical sciences use the Internet in
order to search for information resources more frequently (M=19.975, SD=19.177) than
students who have studied in arts, humanities, social sciences and education disciplines
(M=18.854, SD=16.545). In contrast, art, humanities, social sciences and education
students have more library related curricula than the students in pure sciences, engineering

334
and medical sciences. The results of the study revealed that students who have studied in
arts, humanities, social sciences and education use the university libraries more frequently
(M=2.776 , SD=1.850) than students who have studied in pure sciences, engineering and
medical sciences (M=2.570 , SD=1.474). This result is consistent with the findings of
Chrzastowsky and Joseph (2006) and Bridges (2008) who found that arts, humanities and
social sciences graduate students reported using libraries at a higher percentage than other
disciplines.
5.2.3.6. Age and Information Seeking Anxiety Construct
The results of running a Pearson product moment correlation test revealed statistically
significant but weak negative relationships between age and “barriers associated with
libraries”, “barriers associated with information resources” and “affective barriers”
dimensions of the information seeking anxiety. Accordingly, as the postgraduate student’s
age increased, levels of information seeking anxiety related to three (3) aforementioned
dimensions decreased. No statistically significant relationships were found between
postgraduate student’s age and four (4) other sub-scales of the Information Seeking Anxiety
Scale. Hence, age has statistically significant effect on only three (3) dimensions of the
information seeking anxiety construct.
The finding that older students were reported to experienced less anxiety with regard to
three (3) dimensions of the information seeking anxiety construct than did younger
students, was in contrast to some previous studies which suggested that older people may
have more difficulty in using computer and information technologies to perform
information search and retrieval tasks than younger people (Rousseau et al., 1998; Czaja et

335
al., 2001). Vicente and Williges (1988) and Seagull and Walker (1992) found age to be a
significant predictor of efficiency in retrieving information from a database. Additionally,
Westerman et al. (1995) found that older students were slower than the younger students in
retrieving information resources. In another study, Stronge, Rogers and Fisk (2006) found
that older students were less successful and had more difficulty than younger students when
searching for information on the web. Moreover, Chin, Fu and Kannampallil (2009)
reported that older students performed worse in web search tasks than did younger students.
With regard to the relationship between age and library anxiety, previous studies had mixed
results as to whether or not library anxiety differed based on a student’s age and whether
anxiety was higher in older or younger students. Consistent with the results of the current
study, Jiao, Onwuegbuzie and Lichtenstein (1996), Jiao and Onwuegbuzie (1997b),
Shoham and Mizrachi (2001), Kohrman (2001) found an inverse correlation between
library anxiety and age. Conversely, Bostick (1992) and Lee (2011) found that students
over fifty (50) years old had higher levels of library anxiety than did younger students. In
some other studies, no age differences were found in levels of library anxiety and Internet
anxiety (Mech & Brooks, 1995; Ben Omran 2001). Moreover, Parker (1990) and Yang,
Mohamed and Beyerbach (1999) found no significant differences for computer anxiety
according to age.
A possible explanation for the finding that older students were reported to have experienced
lower levels of information seeking anxiety related to “barriers associated with libraries”
than did younger students, is that these students accumulated more experience of
information seeking in libraries as they became older which decreased their information
seeking anxiety levels. Additionally, Gorman (1984), Jiao, Onwuegbuzie and Lichtenstein
336
(1996) and Jiao and Onwuegbuzie (1997a) found a positive relationship between age and
frequency of library visit. This relationship also may reflect library experience, since a
positive relationship was also found to exist between age and the number of library
instruction courses taken (Jiao & Onwuegbuzie, 1997a). Dholakia and Bagozzi (2001)
found that individuals with minimal prior knowledge and experience are likely to exhibit
high levels of frustration during information search tasks. Additionally Coupey et al. (1998)
found that experienced students perform more efficient information searches because they
know what is important and useful and where to get it. However, postgraduate student’s age
was not statistically significantly correlated with frequency of library use and frequency on
the Internet use. Finally, the finding that older students were reported to have experienced
lower levels of information seeking anxiety related to “barriers associated with information
resources” than did their younger counterparts, might be explained by the finding of Jiao
and Onwuegbuzie (1997a) who reported that older students utilize the library resources
more extensively than younger students.
5.2.3.7. Frequency of Library Use and Information Seeking Anxiety Construct
The results of running a Pearson product moment correlation test revealed a statistically
significant but weak positive relationship between frequency of library use and “access
barriers” sub-scale of the Information Seeking Anxiety Scale. In other words, students who
used university library more frequently, reported higher levels of information seeking
anxiety associated with “access barriers” dimension than students who used university
library less frequently. No statistically significant relationships were found between
postgraduate student’s frequency of library use and other six (6) dimensions of the

337
information seeking anxiety construct. Hence, frequency of library use has statistically
significant effect on only one (1) dimension of the information seeking anxiety construct.
With regard to the relationship between frequency of library use and library anxiety, Jiao,
Onwuegbuzie and Lichtenstein (1996), Jiao and Onwuegbuzie (1997b), Jiao and
Onwuegbuzie (2002b) and Jiao, Onwuegbuzie and Bostick (2004) found statistically
significant negative relationships between these two (2) variables. In other words, students
who avoid utilize the university library were reported to have experienced greater levels of
library anxiety than students who use the library frequently. Consistent with this result,
Bowers (2010) discovered that students who used the library more frequently were reported
to have experienced lower levels of library anxiety than students who used the library less
frequently. Conversely, Lee (2011) found that student’s levels of library anxiety increased
as the length of time since they had last visited a library increased.
The finding of this study that revealed no statistically significant relationships between
frequency of library use and six (6) out of seven (7) dimensions of the Information Seeking
Anxiety Scale somewhat supports Ben Omran’s (2001) finding that found no statistically
significant correlation between frequency of library use and levels of library and Internet
anxiety. Consistent with the results of this study, Mech and Brooks (1995) and Anwar, Al-
Kandari and Al-Qallaf (2004) found no significant correlation between the frequency of
library use and levels of library anxiety.
One possible explanation for the finding that statistically significant positive relationship
existed between frequency of library use and “access barriers” dimension of the
Information Seeking Anxiety Scale might be that most of the students used the university

338
library to study rather than to conduct research. Clougherty et al. (1998) reported that
students used the library most often as a place to study and not for research purposes. This
finding is consistent with that of Berger and Hines (1994), Talbot, Loweil and Martin
(1998) and Whitmire (2002). Consequently, these students experience high levels of
anxiety when they use library for seeking information resources and conducting library
research. Another explanation for this finding could be that students who can not find
required information resources in the library environment will experience high levels of
anxiety associated with “access barriers” dimension. Consistent with this result,
Chowdhury and Gib (2009) found that having to pay for access to information resources
and restricted access to needed information resources increase student’s uncertainty and
anxiety during the information seeking in libraries. In another study, Kohrman (2003)
reported that students get nervous when necessary information resources may not be
quickly accessible or when different technologies or skills are required to access
information resources.
5.2.3.8. Frequency of the Internet Use and Information Seeking Anxiety Construct
The results of running a Pearson product moment correlation test revealed that no
statistically significant relationships existed between postgraduate student’s frequency of
the Internet use and seven (7) sub-scales of the Information Seeking Anxiety Scale. Hence,
frequency of the Internet use is not an antecedent of the information seeking anxiety
construct.
With regard to the relationship between frequency of the Internet use and academic related
anxiety, previous studies had mixed results. Some previous studies reported statistically
significant negative correlations between frequency of the Internet and computer use and

339
levels of library, computer or Internet anxiety. In one of these studies, Ben Omran (2001)
found a statistically inverse correlation between frequency of the Internet use and Internet
anxiety. Barrier, Margavio (1993) and Otomo (1998) found that the increment in frequency
of computer use decrease levels of computer anxiety. Additionally, Shoham and Mizrachi
(2001) reported a correlation between frequency of computer use and levels of library
anxiety. In another study, Scott and Rockwell (1997) reported that computer anxiety was
negatively correlated with the likelihood to use e-mail, electronic discussion groups, online
services and video conferencing. Moreover, Collins and Veal (2004) found low levels of
library anxiety related to “knowledge of the library” and “affective barriers” were
associated with the most positive attitudes toward the Internet. Consistent with these
findings, Mawhinney and Sarawat (1991), Okebukola (1993) and Carlson and Wright
(1993), Jackson et al. (2001), Cooper and Weaver (2003) and Barbiete and Weiss (2004)
reported inverse correlation between computer and Internet use and levels of computer and
Internet anxiety. In contrast to these findings, Jiao and Onwuegbuzie (1997a) found that
students who use the computers and online resources more frequently experienced higher
levels of library anxiety than did students who use these facilities less frequently.
Consistent with the results of this study and in contrast with the results of aforementioned
studies, Ealy (1999) reported no statistically significant correlation between computer and
Internet experience and levels of computer and Internet anxiety. Additionally, Haris and
Grandgenett (1996) found no relationship between Internet use and computer anxiety. In
another study, Jiao, Onwuegbuzie and Lichtenstein (1996) found that computer usage
experience did not statistically significantly correlate with library anxiety. Ben Omran
(2001) revealed no statistically significant relationship between frequency of Internet use
and levels of library anxiety.

340
5.2.3.9. Main and Interaction Effects of Gender and Academic Major on Information
Seeking Anxiety Construct.
The results of running a 2 × 2 factorial ANOVA revealed a statistically significant main
effect for gender on the “barriers associated with information resources” dimension.
Additionally, significant main effects for academic major were found on “barriers
associated with computers, the Internet and electronic resources”, “affective barriers” and
“access barriers” dimensions of the Information Seeking Anxiety Scale. No statistically
significant interaction effects of gender and academic major were found on various
dimensions of the information seeking anxiety construct. In other words, there were no
statistically significant differences in the effect of gender on information seeking anxiety
for students who have studied in arts, humanities, social sciences and education and
students who have studied in pure sciences, engineering and medical sciences.
Gender has been found to have effect on the information seeking anxiety construct. The
results of running an independent sample t-test revealed that gender had effect on the
information seeking anxiety dimensions “barriers associated with information resources”
and “access barriers”. Female students were found to have reported statistically
significantly higher levels of information seeking anxiety related to these two (2)
dimensions than did male students. Moreover, the results of running a 2 × 2 factorial
ANOVA to test main and interaction effects of gender and academic major on various
dimensions of the information seeking anxiety construct revealed gender to be having main
effects on the information seeking anxiety dimension “barriers associated with information
resources”. This indicated that there was a statistically significant difference in information
seeking anxiety by gender. This finding somewhat consistent with Jiao, Onwuegbuzie and
Lichtenstein (1996), Jiao and Onwuegbuzie (1997b), Jacobson (1991), Shoham and

341
Mizrachi (2001) and Noor and Ansari (2011) who found gender differences is levels of
library anxiety construct.
Academic major was another antecedent variable studied in this study. The results of
running an independent sample t-test revealed that academic major had effect on the
information seeking anxiety dimensions “barriers associated with computers, the Internet
and electronic resources”, “affective barriers” and “access barriers” dimension.
Accordingly, students who have studied in arts, humanities, social sciences and education
were found to have experienced statistically significantly higher levels of information
seeking anxiety regards to three (3) aforementioned sub-scales than students who have
studied in pure sciences, engineering and medical sciences disciplines. The results of
running a 2 × 2 factorial ANOVA to test main and interaction effects of gender and
academic major on various dimensions of the information seeking anxiety construct
revealed the same result. This indicated that there was a statistically significant difference
in information seeking anxiety by academic major of students. This finding is somewhat
consistent with the results of Ben Omran (2001) and Reed et al. (1995) who found
academic major to have effects on the Internet and computer anxiety constructs.
5.2.3.10. Main and Interaction Effects of Gender and Level of Study on Information
Seeking Anxiety Construct.
The results of running a 2 ×2 factorial ANOVA revealed a statistically significant main
effect for gender on “barriers associated with information resources” dimension of the
information seeking anxiety. Additionally, the results revealed statistically significant main
effects for level of study on “barriers associated with computers, the Internet and electronic
resources” and “affective barriers” dimensions of the information seeking anxiety

342
construct. The test for interaction of gender and level of study on various dimensions of the
information seeking anxiety construct was not statistically significant. In other words, there
were no statistically significant differences in the effect of gender on information seeking
anxiety for students studying at the master’s level and those who studying at the doctoral
level.
Gender has been found to have effect on the information seeking anxiety construct. The
results of running an independent sample t-test revealed that female students were found to
have reported statistically significantly higher levels of information seeking anxiety related
to “barriers associated with information resources” and “access barriers” dimensions than
did male students. Moreover, the results of running a 2 × 2 factorial ANOVA to test main
and interaction effects of gender and level of study on various dimensions of the
information seeking anxiety construct revealed gender to be having main effects on the
information seeking anxiety dimension “barriers associated with information resources”.
This finding indicated that there was a statistically significant difference in information
seeking anxiety by gender. This result is in contrast to that of Bostick (1992), Mech and
Brooks (1995), Onwuegbuzie and Jiao (2000), Ben Omran (2001) and Kohrman (2004)
who found no gender differences in levels of library anxiety.
The results of running an independent sample t-test revealed that level of study had effect
on information seeking anxiety construct. In other words, master’s level students were
found to experience statistically significantly higher levels of information seeking anxiety
related to “barriers associated with computers, the Internet and electronic resources” and
“affective barriers” dimensions than did doctoral level students. The results of running a
2 × 2 factorial ANOVA to test main and interaction effects of gender and level of study on

343
various dimensions of the information seeking anxiety construct revealed the same results.
This indicated that there was a statistically significant difference in information seeking
anxiety by level of study. This finding somewhat supports that of Bostick (1992), Mech and
Brooks (1995), Jiao, Onwuegbuzie and Lichtenstein (1996), Onwuegbuzie (1997) and Jiao
and Onwuegbuzie (1997b) who found level of study has an effect on various dimensions of
the library anxiety construct.
5.2.3.11. Main and Interaction Effects of Gender and Nationality on Information
Seeking Anxiety Construct.
The results of running a 2 × 2 factorial ANOVA test revealed that nationality had no
statistically significant main effect on various dimensions of the information seeking
anxiety construct. There were however, statistically significant main effects due to gender
on “barriers associated with information resources” and “access barriers” dimensions of the
information seeking anxiety construct. Additionally, the test for interaction of gender and
nationality on various dimensions of the information seeking anxiety construct was not
statistically significant. In other words, there were no significant differences in the effect of
gender on information seeking anxiety for Malaysian and non-Malaysian students.
The results of running an independent sample t-test showed that gender had an effect on
“barriers associated with information resources” and “access barriers” dimensions of the
information seeking anxiety construct. Moreover, the results of running a 2 × 2 factorial
ANOVA to test main and interaction effects of gender and nationality on various
dimensions of the information seeking anxiety construct revealed gender to be having main
effects on aforementioned dimensions of the information seeking anxiety construct.
Further, the results of running an independent sample t-test showed that nationality had no

344
effect on various dimensions of the information seeking anxiety construct. No statistically
significant main effect for nationality was also found on various dimensions of the
information seeking anxiety construct. This finding supports that of Jiao, Onwuegbuzie and
Lichtenstein (1996) and Shoham and Mizrachi (2001) who found nationality has no effect
on various dimensions of the library anxiety construct. Additionally, the finding that no
significant interaction was found between gender and nationality on various dimensions of
the information seeking anxiety reflect the fact that the effect of gender on the information
seeking anxiety construct do not depend on the nationality of postgraduate students.
5.2.3.12. Main and Interaction Effects of Gender and Information Literacy Skills
Instruction Received on Information Seeking Anxiety Construct.
The results of running a 2 × 2 factorial ANOVA test revealed that there was a statistically
significant main effect for gender on “barriers associated with information resources”
dimension of the information seeking anxiety construct, but no statistically significant main
effect for information literacy skills instruction received on various dimensions of the
information seeking anxiety construct. Additionally, no statistically significant interaction
was found between these two (2) variables. In other words, there were no statistically
significant differences in the effect of gender on information seeking anxiety for students
who have received information literacy instruction and those students who have not
received instruction.
The results of running an independent sample t-test revealed that female students were
reported to have experienced statistically significant higher levels of information seeking
anxiety stemming from “barriers associated with information resources” and “access
barriers” dimensions than their male counterparts. The results of running a 2 × 2 factorial
345
ANOVA to test main and interaction effects of gender and information literacy instruction
received on various dimensions of the information seeking anxiety construct revealed
gender to be having main effects on the information seeking anxiety dimensions “barriers
associated with information resources”. With regard to the information literacy instruction
received, the results of running an independent sample t-test showed that information
literacy instruction received had no effect on various dimensions of the information seeking
anxiety construct. Additionally, the results of running a 2 × 2 factorial ANOVA to test main
and interaction effects of gender and information literacy instruction received on various
dimensions of the information seeking anxiety construct revealed the same result. This
finding somewhat conflicts with Jiao, Onwuegbuzie and Lichtenstein (1996), Onwuegbuzie
(1997b), Abusin (1998), Kracker (2002), Kracker and Wang (2002), Van Scoyoc (2003),
Battle (2004), Brown et al. (2004), Nicholas, Rudowsky and Valencia (2007) and Malvasi,
Rudosky and Valencia (2009) results who found information literacy instruction received
had statistically significant effect on various dimensions of the library anxiety construct.
5.2.3.13. Main and Interaction Effects of Academic Major and Level of Study on
Information Seeking Anxiety Construct.
The results of running a 2 × 2 factorial ANOVA test revealed that academic major had no
statistically significant main effects on various dimensions of information seeking anxiety.
There were however, statistically significant main effects due to level of study on “barriers
associated with computers, the Internet and electronic resources”, “affective barriers” and
“barriers associated with topic identification” dimension of the Information Seeking
Anxiety Scale. Moreover, the results revealed statistically significant interactions between
academic major and level of study on “affective barriers” as well as “barriers associated
with topic identification” dimensions of the information seeking anxiety construct.
346
Accordingly, master’s level students who have studied in arts, humanities, social sciences
and education were reported to have experienced higher levels of information seeking
anxiety associated with “affective barriers” than (a) master’s level students in pure
sciences, engineering and medical sciences, (b) doctoral level students in pure sciences,
engineering and medical sciences and (c) doctoral level students in arts, humanities, social
sciences and education. Additionally, master’s level students who have studied in arts,
humanities, social sciences and education were reported to have experienced higher levels
of information seeking anxiety related to “barriers associated with topic identification” than
did (a) doctoral level students in pure sciences, engineering and medical sciences, (b)
master’s level students in pure sciences, engineering and medical sciences and (c) doctoral
level students in arts, humanities, social sciences and education. In other words, there were
statistically significant differences in the effect of academic major on information seeking
anxiety for master’s level and doctoral level students.
The results of running an independent sample t-test showed that academic major had effects
on the information seeking anxiety construct associated with “affective barriers”, “access
barriers” and “barriers associated with computers, the Internet and electronic resources”
dimension. However, the results of running a 2 × 2 factorial ANOVA to test main and
interaction effects of academic major and levels of study on various dimensions of the
information seeking anxiety construct revealed major had no statistically significant effect
on any of the seven (7) dimensions of the information seeking anxiety construct. This
finding somewhat supports that of Ben Omran (2001), Reed et al. (1995) and Yang,
Mohamed and Beyerbach (1999) who found major had statistically significant effect on
various dimensions of the library and computer anxiety constructs.

347
Another antecedent variable studied in this study was level of study. The results of running
an independent sample t-test revealed that level of study had statistically significant effects
on “barriers associated with computers, the Internet and electronic resources” and
“affective barriers” dimensions of the information seeking anxiety construct. The results of
running a 2 × 2 factorial ANOVA to test main and interaction effects of academic major
and levels of study on various dimensions of the information seeking anxiety construct
revealed level of study to be having statistically significant main effects on the “barriers
associated with computers, the Internet and electronic resources”, “affective barriers” and
“barriers associated with topic identification” dimensions of the information seeking
anxiety construct. This finding therefore conflicts with that of Shoham and Mizrachi (2001)
and Bowers (2010) who found level of study had no effect on the various dimensions of the
information seeking anxiety construct.
5.2.3.14. Main and Interaction Effects of Academic Major and Nationality on
Information Seeking Anxiety Construct.
A 2 × 2 factorial ANOVA test were conducted to determine main and interaction effects of
academic major and nationality on information seeking anxiety construct. No statistically
significant main effect for nationality was found on various dimensions of the information
seeking anxiety scale. There were however, statistically significant main effects due to
academic major on the “barriers associated with libraries” and “affective barriers”
dimension. Moreover, the results revealed statistically significant interactions between
major and nationality on “barriers associated with libraries” dimension of the information
seeking anxiety construct. Accordingly, Malaysian students who have studied in arts,
humanities, social sciences and education were reported to have experienced the highest
levels of information seeking anxiety related to “barriers associated with libraries” when

348
compared to (a) non-Malaysian students in pure sciences, engineering and medical
sciences, (b) Non-Malaysian students in arts, humanities, social sciences and education and
(c) Malaysian students in pure sciences, engineering and medical sciences. In other words,
there were significant differences in the effect of major on information seeking anxiety for
Malaysian and non-Malaysian students.
The results of running an independent sample t-test revealed that students who have studied
in arts, humanities, social sciences and education were reported to have experienced higher
levels of information seeking anxiety related to “barriers associated with computers, the
Internet and electronic resources”, “affective barriers” and “access barriers” dimensions of
the Information Seeking Anxiety Scale. Additionally, the results of running a 2 × 2 factorial
ANOVA to test main and interaction effects of academic major and nationality on various
dimensions of the information seeking anxiety construct revealed academic major had
statistically significant effect on “barriers associated with libraries” as well as “affective
barriers” dimension of the information seeking anxiety construct. This finding is consistent
with that of Ben Omran (2001) who found that student’s academic major was a factor that
contributed to the levels of Internet anxiety construct.
Nationality has been found to have no effect on the information seeking anxiety construct.
The results of running an independent sample t-test revealed no statistically significantly
differences between Malaysian and non-Malaysian students on various dimensions of the
information seeking anxiety construct. Additionally, conducting a 2 × 2 factorial ANOVA
to test main and interaction effects of academic major and nationality on various
dimensions of the information seeking anxiety construct revealed nationality to have no
main effects on various dimensions of the information seeking anxiety. This finding is
somewhat consistent with that of Jiao, Onwuegbuzie and Lichtenstein (1996), Shoham and

349
Mizrachi (2001) and Ben Omran (2001) who found no nationality differences in levels of
library anxiety.
5.2.3.15. Main and Interaction Effects of Academic Major and Information Literacy
Skills Instruction Received on Information Seeking Anxiety Construct.
The results of running a 2 × 2 factorial ANOVA revealed that information literacy
instruction received had no statistically significant main effect on various dimensions of
information seeking anxiety. There was however, statistically significant main effect due to
academic major on “affective barriers” dimension of the information seeking anxiety
construct. Additionally, the results revealed statistically significant interactions between
academic major and information literacy instruction received on “access barriers” as well as
“barriers associated with topic identification” dimensions of the information seeking
anxiety construct. Accordingly, students who have studied in arts, humanities, social
sciences and education and have received information literacy skills instruction were
reported to have experienced the highest levels of information seeking anxiety related to
“barriers associated with topic identification” when compared to (a) students in pure
sciences, engineering and medical sciences who have not received information literacy
skills instruction, (b) students in arts, humanities, social sciences and education who have
not received information literacy skills instruction and (c) students in pure sciences,
engineering and medical sciences who have received information literacy skills instruction.
Additionally, students who have studied in arts, humanities, social sciences and education
and have received information literacy skills instruction were reported to have experienced
the highest levels of information seeking anxiety related to “access barriers” when
compared to (a) students in pure sciences, engineering and medical sciences who have not
received information literacy skills instruction, (b) students in arts, humanities, social

350
sciences and education who have not received information literacy skills instruction and (c)
those in pure sciences, engineering and medical sciences who have received information
literacy skills instruction. Consequently, there were statistically significant differences in
the effect of academic major on information seeking anxiety for students who have
received information literacy skills instructions and those who have not received
instruction.
The results of running an independent sample t-test showed that academic major had effects
on the information seeking anxiety construct associated with “affective barriers”, “access
barriers” and “barriers associated with computers, the Internet and electronic resources”.
Additionally, the results of running a 2 × 2 factorial ANOVA to test main and interaction
effects of academic major and information literacy skills instruction received on various
dimensions of the information seeking anxiety construct revealed academic major had
statistically significant effect on “affective barriers” dimension. This finding therefore
conflict with that of Reed (1995) and Yang, Mohamed and Beyerbach (1999) who reported
that academic major had no effect on computer anxiety construct.
The results of running an independent sample t-test showed that information literacy skills
instruction received had no statistically significant effect on various dimensions of the
information seeking anxiety construct. Additionally, the results of running a 2 × 2 factorial
AVOVA also revealed information literacy skills instruction received to be having no
statistically significant main effects on any of the seven (7) dimensions of the information
seeking anxiety construct. The finding therefore conflict with that of Jiao and Onwuegbuzie
(1997b), Kracker (2002), Kracker and Wang (2002), Van Scoyoc (2003), Battle (2004),
Brown et al. (2004), Nicholas, Rudowsky and Valencia (2007) and Malvasi, Rudosky and
351
Valencia (2009) who found who found statistically significant correlation between
information literacy skills instruction received and library anxiety.
5.2.3.16. Main and Interaction Effects of Nationality and Level of Study on
Information Seeking Anxiety Construct.
The results of running a 2 × 2 factorial ANOVA revealed that nationality had no
statistically significant main effects on any dimension of the information seeking anxiety
construct. However, statistically significant main effect for level of study was found on
“barriers associated with information resources”, “affective barriers” and “barriers
associated with topic identification” dimensions of the information seeking anxiety
construct. Additionally, no statistically significant interaction was found between
nationality and level of study on various dimensions of the Information Seeking Anxiety
Scale.
The results of running an independent sample t-test revealed that master’s level students
were reported to have experienced greater levels of information seeking anxiety associates
with “affective barriers” and “barriers associated with computers, the Internet and
electronic resources” dimensions of the information seeking anxiety construct. Moreover,
the results of running a 2 × 2 factorial ANOVA to test main and interaction effects of
nationality and levels of study on various dimensions of the information seeking anxiety
construct showed that level of study to be having main effects on the information seeking
anxiety dimensions “barriers associated with information resources”, “affective barriers”
and “barriers associated with topic identification”. With regard to the nationality, the results
of running an independent sample t-test showed that students’ nationality had no effect on
various dimensions of the information seeking anxiety construct. Additionally, the results

352
of running a 2 × 2 factorial ANOVA to test main and interaction effects of nationality and
level of study on various dimensions of the information seeking anxiety construct revealed
no statistically significant interactions. This finding somewhat conflict with that of Jiao,
Onwuehbuzie and Bostick (2004, 2006), Noor and Ansari (2011) and Lee (2011) who
found nationality to be an antecedent of library anxiety construct.
5.2.3.17. Main and Interaction Effects of Nationality and Information Literacy Skills
Instruction Received on Information Seeking Anxiety Construct.
The results of running a 2 × 2 factorial ANOVA revealed that neither nationality nor
information literacy instruction received had no statistically significant main effects on
various dimensions of the information seeking anxiety construct. However, the results
revealed statistically significant interaction of nationality and information literacy
instruction received on “technological barriers” dimension of the information seeking
anxiety. In other words, Malaysian students who have received information literacy skills
instruction were reported to have experienced the highest levels of information seeking
anxiety associated with “technological barriers” when compared to (a) non-Malaysian
students who have not received information literacy skills instruction, (b) Malaysian
students who have not received information literacy skills instruction and (c) non-
Malaysian students who have received information literacy skills instruction. Consequently,
there were statistically significant differences in the effect of nationality on information
seeking anxiety for students who have received information literacy instructions and those
who have not received instruction.
The results of running an independent sample t-test showed that nationality had no effect on
various dimensions of the information seeking anxiety construct. Additionally, the results

353
of running a 2 × 2 factorial ANOVA to test main and interaction effects of nationality and
information literacy skills instruction received on various dimensions of the information
seeking anxiety construct revealed no statistically significant interactions between these
variables. With regard to the information literacy skills instruction received, the results of
running an independent sample t-test as well as a 2 × 2 factorial ANOVA showed no
statistically significant main effect on various dimensions of the information seeking
anxiety construct. This finding was in contrast to findings of Bostick, (1992), Mech and
Brooks (1995), Jiao, Onwuegbuzie and Lichtenstein (1996), Onwuegbuzie (1997), Jiao and
Onwuegbuzie (1997b) and Onwuegbuzie, Jiao and Bostick (2004) who found library
anxiety declines linearly as a function of level of study.
5.2.3.18. Main and Interaction Effects of Level of Study and Information Literacy
Skills Instruction Received on Information Seeking Anxiety Construct.
A 2 × 2 factorial ANOVA test was conducted to test main and interaction effects of level of
study and information literacy skills instruction received on various dimensions of the
information seeking anxiety construct. Statistically significant main effects for level of
study were found on “barriers associated with information resources”, “barriers associated
with computers, the Internet and electronic resources”, “affective barriers” and “barriers
associated with topic identification” dimension of the information seeking anxiety
construct. However, when information literacy skills instruction received was examined for
its main effect on various dimensions of the information seeking anxiety construct, no
statistically significant main effect was found. The test for interaction of level of study and
information literacy skills instruction received on various dimensions of the information
seeking anxiety construct revealed a statistically significant interaction on “barriers
associated with topic identification”. In other words, Master’s level students who have not

354
received information literacy skills instruction were reported to have experienced the
highest levels of information seeking anxiety associated with “barriers associated with topic
identification”, when compared to (a) master’s level students who have received
information literacy skills instruction, (b) doctoral level students who have received
information literacy skills instruction and (c) doctoral level students who have not received
information literacy skills instruction. Consequently, there was a statistically significant
difference in the effect of level of study on information seeking anxiety for students who
have received information literacy instruction and those who have not received instruction.
Level of study has been found to have effect on the information seeking anxiety construct.
The results of running an independent sample t-test revealed that master’s level students
were reported to have experienced statistically significantly higher levels of information
seeking anxiety related to “barriers associated with computers, the Internet and electronic
resources” and “affective barriers” dimensions than did doctoral students. Moreover, the
results of running a 2 × 2 factorial ANOVA to test main and interaction effects of level of
study and information literacy skills instruction received on various dimensions of the
information seeking anxiety construct revealed level of study to be having main effects on
the information seeking anxiety dimensions “barriers associated with information
resources”, “barriers associated with computers, the Internet and electronic resources”,
“affective barriers” and “barriers associated with topic identification. This result was in
contrast to that of Shoham and Mizrachi (2001) and Bowers (2010) who found no
statistically significant level of study differences in regard to library anxiety construct.
The results of running an independent sample t-test revealed that information literacy skills
instruction received had no effect on information seeking anxiety construct. Additionally,
the results of running a 2 × 2 factorial ANOVA to test main and interaction effects of level

355
of study and information literacy instruction received on various dimensions of the
information seeking anxiety construct revealed the same results. This finding somewhat
conflict with that of Palumbo and Reed (1991) and Barrier and Margavio (1993) who
reported the effect of information literacy instruction on computer anxiety construct.
5.3. Research Implications
The purpose of the present study was to investigate information seeking anxiety construct
among postgraduate students at a research-intensive university in Malaysia. Despite the
prevalence of anxiety among students during the information seeking process (Mellon,
1986a; Kuhlthau, 1988a, 1993; Van Kampen, 2003; Jiao, Onwuegbuzie & Bostick, 2004)
and the fact that this anxiety has been found to negatively affect students’ academic
achievement and research performance (Onwuegbuzie & Jiao, 2004; Jiao, Onwuegbuzie &
Bostick, 20044; Jiao, Onwuegbuzie & Waytowich, 2008), prior to the present study, no
researcher has examined empirically this phenomenon. Furthermore, no scale has ever been
developed, let alone validated, to assess the anxiety that experienced by students during the
information seeking process of their research. The current study is the first to develop and
validate an instrument to measure levels of information seeking anxiety among
postgraduate students. From the theoretical aspect, the results of this study make an
important contribution to the literature of academic related anxiety in general and
information seeking anxiety in particular.
From the practical aspects, the Information Seeking Anxiety Scale (ISAS) which was
developed and validated in this study may be used by other researchers in the area of
information seeking behaviors in order to study the information seeking anxiety construct.
The instrument could be used as a diagnostic tool for improvement of information literacy

356
skills instruction as well. Additionally, through the use of this instrument it may be possible
to identify specific factors which may cause anxiety among postgraduate students during
the information seeking process. By being aware of the antecedents of information seeking
anxiety, librarians will be in a better position to provide services and instructions which is
the most effective to reduce level of anxiety and, thus, prepare postgraduate students to be
more successful in their research. Additionally, identifying factors which may influence the
information seeking process negatively is a useful step toward redesigning library services,
information literacy instruction programmes, and information systems more appropriate to
help in remedying this phenomenon. Additionally, many researchers assert that if anxious
students are made aware that others are feeling the same way, their own anxiety may be
reduced (Carlile, 2007). It is therefore suggested that librarians inform students that the
negative feelings experienced by most students in several stages of the information seeking
process are normal. Bringing the concept of information seeking anxiety into information
literacy skills instruction programs is a useful way to increase students’ awareness about
this phenomenon. Additionally, sharing other students’ fears and difficulties during the
information seeking process via video, brochure, discussion or humorous tales can serve to
lessen students’ fear.
Providing information literacy skills programs was reported to be an effective method to
ease students’ difficulties in library environment (Onwuehbuzie, Jiao and Bostick, 2004).
However, results of the current study revealed that participation in information literacy
skills instruction sessions had no statistically significant effect on any of the seven (7)
dimensions of the information seeking anxiety construct. The possible reason behind such a
result might be due to the method of instruction provided for postgraduate students in the
university studied. Academic librarians and administrators should conduct experimental

357
studies using pre- and post-test method utilizing the Information Seeking Anxiety Scale
(ISAS) to measure the effectiveness of information literacy skills instruction programs on
reducing information seeking anxiety. They might also consider studies that assess the
differences in reduction of information seeking anxiety due to different types of
information literacy skills programs like formal class setting, small group sessions, one-on-
one encounters, written guides and brochures, audiovisual presentations and computer-
assisted instruction. More decreases in information seeking anxiety could then be
associated with success of the treatment. Additionally, the role of academic reference
services and reference librarians in reducing students’ negative feelings during the process
of information seeking is crucial. Reference librarians are playing a major role in
interpreting students’ inquiries, identifying appropriate sources, teaching and assisting
students to find information related to their research and deciding whether or not the
retrieved information is useful or adequate, which all can help students overcome their
anxiety. Furthermore, to facilitate postgraduate students’ library research, providing
individualized reference services by librarian liaisons who are expert in that area of
research can help students handling the intricacies and challenges of the information
seeking process.
Results of the study showed that barriers associated with libraries dimension was the most
problematic source of information seeking anxiety among postgraduate students. By
providing students with positive information seeking experience in university library - and
this includes friendly, approachable and accessible staff and non-threatening environment -
students may feel more confident and comfortable with using the library for conducting
research. Some previous researchers recommended that if librarians are seen as visible,
approachable, and unintimidating and conduct reference interviews in a professional

358
manner that is sensitive to students’ fears and concerns, students may begin to feel more
comfortable in seeking help when they feel lost or anxious (Carlile, 2007). Additionally, the
literature shows that the manner in which library décor and furniture are placed can either
help reduce or increase users’ anxiety levels. The library space and layout, building,
location of stacks and equipments, lighting and temperature also make a difference in users’
behavior and emotions. As a result, it is very important for librarians to make efforts to
create a pleasant environment for students to conduct their research.
Barriers associated with information resources was also found to produce low, mild or
moderate levels of information seeking anxiety in 95.7% of postgraduate students studied.
Librarians should make their best effort in selection, acquisition, organizations and
promotion of collection to increase availability, accessibility, novelty, quality and ease of
use of information resources for postgraduate students. Additionally, providing maximum
access to full text resources may help reduce information seeking anxiety of students.
Because some levels of information seeking anxiety were reported due to barriers
associated with computers, the Internet and electronic resources as well as technological
barriers, librarians should monitor library equipments used by students for information
seeking, checking periodically that all machinery are functioning properly and assisting
students to solve mechanical problems. Finally we should mention that, along with the
efforts made by librarians in acquisition, organization and dissemination of information in
academic libraries, investigating psychological barriers which hinder students from use of
information resources as well as finding methods to overcome these barriers could also be
beneficial.

359
5.4. Limitations of the study
The following aspects of the research were not subject to the researcher’s control and can
be considered as limitations of the study:
a) The researcher conducted the study at a research-intensive university in Kuala Lumpur,
Malaysia. The results of the study may not be generalizable to the entire population of
postgraduate students in Malaysia.
b) Students were self-reporting their anxiety, gender, age, nationality, level of study,
academic major, frequency of library and the Internet use as well as information literacy
skills instruction received which might imply inaccurate or flawed information.
c) Some academic programmes may incorporate courses that may influence the attitudes
and emotions of postgraduate students toward the information seeking process and
information seeking anxiety. This influence was measured by study the mean differences in
various dimensions of the information seeking anxiety construct between postgraduate
students from different areas of study.
5.5. Directions for Future Research
The present study aimed to develop and validate the Information Seeking Anxiety Scale as
well as determine the prevalence and correlates of this phenomenon among postgraduate
students at a research-intensive university in Kuala Lumpur, Malaysia. However, one
cannot address all theoretical and methodological issues, many questions remained
unanswered, and new ones are raised in the process of research. As such, further study is
necessary for addressing the limitations of the present study. Following are some
recommendations for future research that can be made reflecting the limitations of the
present study:

360
a) Further validation studies in different educational setting must be conducted in order to
determine the extent of construct validity of the Information Seeking Anxiety Scale.
Additionally, criterion validity of the instrument needs to be determined to ensure that the
Information Seeking Anxiety Scale is adequately measuring postgraduate student’s state
anxiety during the information seeking process. The instrument, if used on another
population, should be sufficiently stable to measure the seven (7) dimensions of the
information seeking anxiety construct identified through the factor analysis. Additional
Exploratory Factor Analysis and Confirmatory Factor Analysis should be completed with
another population of students.
b) The possible correlation between information seeking anxiety construct and other
academic anxieties like library anxiety, information anxiety, Internet anxiety and computer
anxiety should be investigated.
c) Information Seeking Anxiety Scale might be tested in other research-intensive
universities in Malaysia to determine if postgraduate students share the same type of
anxiety related to searching for information resources. Moreover, replication of the study
with a larger and more representative sample will improve the generalizability of the
findings.
d) Additional research on providing information literacy skills instruction to postgraduate
students with an objective of information seeking anxiety reduction is required. Future
studies should be undertaken to determine how best to reduce the information seeking
anxiety of postgraduate students.
e) In order to determine which types of treatment are affective in reducing information
seeking anxiety phenomenon, researchers should conduct experimental studies using pre-
and post-test method utilizing the Information Seeking Anxiety Scale. Decreases in
information seeking anxiety could then be associated with success of the treatment.

361
Researchers might also consider studies that assess whether there is a difference in the
reduction of information seeking anxiety depending on whether the information literacy
instruction courses occur face-to-face or online.
f) Future research should be conducted in order to determine whether postgraduate students
experience different levels of information seeking anxiety at various stages of the
Kuhlthau’s Information Search Process Model. Future research should determine the stages
of the ISP model at which anxiety is most prevalent and debilitative.
g) Replicating this study with a sample of undergraduate students and comparing
information seeking anxiety experienced by postgraduate and undergraduate students
should be conducted by researchers.
h) Replication of this study using qualitative approach is recommended as another way to
increase our understanding of the information seeking anxiety construct. Such research
could include interviews, student journals, focus groups, and observational methods.
Moreover, mixed methods studies should be designed in which both qualitative and
quantitative data are collected within the same study or series of studies.
i) Future studies should investigate the nature of the relationship between levels of
information seeking anxiety and different personal, educational, and psychological
variables
j) Information seeking anxiety among different ethnic and cultural groups of postgraduate
students should be examined using the Information Seeking Anxiety Scale.
k) Information Seeking Anxiety Scale should be translated to Malay language and validity
and reliability of the Malay version the instrument should be investigated.

362
REFERENCES

363
Abusin, K. A. (2010). An exploratory study of library anxiety among Sudanese university
students. PhD dissertation, University of Malaya, Kuala Lumpur.
Abusin, K. A. & Zainab, A. N. (2010). Exploring library anxiety among Sudanese
university students. Malaysian Journal of Library & Information Science, 15(1), 55-81.
Abusin, K. A., Zainab, A. N. & Noor, H. A. K. (2011). Sudanese library anxiety constructs.
Information Development, 27(3), 161-175.
Anastasi, A. (1988). Psychological testing. NY: Macmillan.
Anderson, D. K. (1987). Females surpass males in computer problem solving: Findings
from the Minnesota Computer Literacy Assessment. Journal of Educational Computing
Research, 3, 39-51.
Anderson, D. K. & Reed, W. M. (1998). The effects of Internet instruction, prior computer
experience, and learning style on teachers’ Internet attitude and knowledge. Journal of
Educational Computing Research, 19(3), 227-246.
Andrews, J. (1991). An exploration of students’ library use problems. Library Review,
40(1), 5-14.
Ansari, N. A. (2009). The relationship between perceived size of library collection and
library anxiety among undergraduate students at International Islamic University
Malaysia. Paper presented at the International Conference on Academic Libraries,
University of Delhi, India.
Ansari, N. A. (2008). Library anxiety among undergraduate students in International
Islamic University Malaysia: An empirical study. Master thesis, International Islamic
University Malaysia, Kuala Lumpur, Malaysia.
Anwar, M. A., Al-Kandari, N. M. & Al-Qallaf, C. L. (2004). Use of Bostick’s Library
Anxiety Scale on undergraduate Biological Sciences students of Kuwait University.
Library & Information Science Research, 26, 266-283.
Anwar, M. A., Al-Kandari, N. M., Al-Qallaf, C. L. & Al-Ansari, A. (2012). AQAK: A
library anxiety scale for undergraduate students. Journal of Librarianship and Information
Science, 44(1), 36-46.
Arapakis, I., Jose, J. M. & Gray, P. D. (2008). Affective feedback: An investigation into the
role of emotions in the information seeking process. Paper presented at the 31st Annual
International ACM SIGIR Conference on Research & Development in Information
Retrieval, Singapore.

364
Ayersman, D. J. (1996). Effects of computer instruction, learning style, gender, and
experience on computer anxiety. Computers in the Schools, 12(4), 15-30.
Bailey, P., Onwuegbuzie, A. J. & Daley, C. E. (1998). Anxiety about foreign language:
Comparison of French, Spanish and German classes. Psychological Reports, 82, 1007-
1010.
Bailey, P., Onwuegbuzie, A. J. & Daley, C. E. (2000). Study habits and anxiety about
learning foreign languages. Perceptual & Motor Skills, 90, 1151-1156.
Balanli, A., Ozturk, A., Vural, N. M. & Kucukcan, B. (2007). University library buildings
in Turkey: A survey and a case study of Yildiz Technical University main library building.
Journal of Academic Librarianship, 33, 714-718.
Bander, R. S. & Betz, N. E. (1981). The relationship of sex and sex role to trait and
situationally specific anxiety types. Journal of Research in Personality, 15(3), 312-322.
Barbiete, F. G., & Weiss, E. M. (2004). Computer self-efficacy and anxiety scales for an
Internet sample: Testing measurement equivalence of existing measures and development
of new scales. Computers in Human Behavior, 20, 1-15.
Barrier, T. B. & Margavio, T. M. (1993). Pretest-posttest measure of introductory computer
students’attitudes toward computers. Journal of Information Systems Education, 5(3), 1-6.
Bates, M. (1989). The design of browsing and berry picking techniques for the online
search interface. Online Review, 13(5), 407-423.
Battle, J. C. (2004). The effect of information literacy instruction on library anxiety among
international students. PhD dissertation, University of North Texas, Denton, Texas.
Ben Omran, A. I. (2001). Library anxiety and internet anxiety among graduate students of
a major research university. PhD dissertation, University of Pittsburgh, Pittsburg,
Pennsylvania.
Berger, K. & Hines R. (1994). What does the user really want? The library survey project at
Duke University. Journal of Academic Librarianship, 20(5/6), 306-309.
Bessiere, K., Ceaparu, I., Lazar, J., Robinson, J. & Shneiderman, B. (2002). Understanding
computer user frustration: Measuring and modeling the disruption from poor designs.
Submitted for publication, University of Maryland, CS Technical Report, 4409.
Bostick, S. L. (1992). The development and validation of the Library Anxiety Scale. PhD
dissertation, Wayne State University, Michigan.

365
Bourque, L. & Fielder, E. (1995). How to conduct self-administered and mail surveys.
Thousand Oaks, CA: Sage.
Bowers, S. L. (2010). Library anxiety of law students: A study utilizing the
Multidimensional Library Anxiety Scale. PhD dissertation, University of Denver, Denver,
Colorado.
Branch, J. L. (2001). Information seeking process of junior high school students: A case
study of CD-ROM encyclopedia use. School Libraries Worldwide, 7(1), 11-27.
Brannan, J. A. (2003). A study of library anxiety in History and Physical Education majors.
Master theses, University of Southern Mississippi, Hattiesburg, Mississippi.
Bridges, J. (2008). Who is not using the library? A comparison of undergraduate academic
disciplines and library use. Portal: Libraries and the Academy, 8(2), 159-170.
Brod, C. (1984). Technostress: The human cost of the computer revolution. MA: Addison-
Wesley.
Brown, A. G., Weingart, S., Johnson, J. R. J. & Dance, B. (2004). Librarians don’t bite:
Assessing library orientation for freshmen. Reference Services Review, 32(4), 394-403.
Brown, J. L., Nelson, M. J. & Denny, E. C. (1973). The Nelson-Denny Reading Test.
Chicago: Riverside.
Burdick, T. (1995). Gender in the information search process: An exploratory study of
student experience. PhD dissertation, Florida State University, Tallahassee, Florida.
Carlson, R. & Wright, D. (1993) Computer anxiety and communication apprehension:
Relationship and introductory college course effects. Journal of Educational Computing
Research, 9, 329-338.
Carlile, H. (2007). The implications of library anxiety for academic reference services: A
review of the literature. Australian Academic & Research Libraries, 38(2), 129-147.
Cheng, Y. (2004). Thoughts, feelings, and actions: Quantitative comparisons of
interactions and relationship among three factors in college students’ information seeking.
PhD dissertation, Indiana University, Indiana.
Chin J., Fu W. & Kannampallil T. (2009). Adaptive information search: Age-dependent
interactions between cognitive profiles and strategies. Proceedings of the 27th
International Conference on Human Factors in Computing Systems. Boston, MA:
Association for Computing Machinery.

366
Chowdhury, S. & Gibb, F. (2009). Relationship among activities and problems causing
uncertainty in information seeking and retrieval. Journal of Documentation, 65(3), 470-
499.
Chrzastowski, T. E. & Joseph, L. (2006). Surveying graduate and professional students’
perspectives on library services, facilities and collections at the University of Illinois at
Urbana Champaign: Does subject discipline continue to influence library use?. Issues in
Science & Technology Librarianship, 45, 82-93.
Chua, S. L., Chen, D. & Wong, A. F. L. (1999). Computer anxiety and its correlates: A
meta-analysis. Computers in Human Behavior, 15, 609-623.
Clarke, V. A. & Teague, J. (1996). Characterizations of computing careers: Students and
professionals disagree. Computers in Education, 26(4), 241-246.
Cleveland, A. M. (2001). Reducing library anxiety in first year students: computer assisted
instruction vs. bibliographic instruction. Master thesis, University of North Carolina,
Chapel Hill, North Carolina.
Cleveland, A. M. (2004). Library anxiety: A decade of empirical research. Library Review,
53(3), 177-185.
Clougherty, J., Forys, J., Lyles, T., Persson, D., Walters, C., & Washington-Hoagland, C.
(1998). The University of Iowa libraries undergraduate user needs assessment. College &
Research Libraries, 59, 6572-6584.
Colbeck, D. (2007). Understanding knowledge genesis by means of multivariate factor
analysis of epistemological belief structures. Information Research: An International
Electronic Journal, 12(4), 1-10.
Collins, K. & Veal, R. (2004). Off-campus adult learners’ levels of library anxiety as a
predictor of attitudes toward the internet. Library & Information Science Research, 26(1),
5-14.
Cooper, J., & Weaver, K. D. (2003). Gender and computers: Understanding the digital
divide. New York: Erlbaum
Coupey, E., Irwin, R. & Payne, J. (1998). Product category familiarity and preference
construction. Journal of Consumer Research, 24,459-468.
Cruise, R. J. & Wilkins, E. M. (1980). STARS: Statistical Anxiety Rating Scale.
Unpublished manuscript, Andrews University, Berrien Springs, MI.

367
Czaja, S. J., Sharit, J., Ownby, R., Roth, D. L., & Nair, S. (2001). Examining age
differences in performance of a complex information search and retrieval task. Psychology
& Aging, 16(4), 564-579.
Dalrymple, P. W. & Zweizig, D. L. (1992). Users’ experience of information retrieval
systems: An exploration of the relationship between search experience and affective
measures. Library & Information Science Research, 14(2), 167-181.
Daly, J. & Miller, M. D. (1975). The empirical development of an instrument to measure
writing apprehension. Research in the Teaching of English, 9(3), 242-249.
Dervin, B. (1983). An overview of sense-making: concepts, methods, and results to
date. Paper delivered at the International Communication Association Annual Meeting.
Dallas, Texas.
DeVellis, R. F. (2003). Scale development: Theory and applications. Thousand Oaks,
California: SAGE Publications, 2003.
Dholakia, U. & Bagozzi, R. P. (2001). Consumer behavior in digital environments. in
Digital Marketing, Eds. Jerry Wind and Vijay Mahajan, John Wiley & Sons, Inc.
Dinev, T. & Hart, P. (2006). An extended privacy calculus model for E-commerce
transactions. Information Systems Research, 17(1), 61-80.
Dreifuss, R. A. (1981). Library instruction and graduate students: More work for George.
Reference & User Services Quarterly, 21(2), 121-123.
Duggan, A., Hess, B., Morgan, D., Kim, S. y. & Wilson, K. (2001). Measuring students’
attitudes toward educational use of the Internet. Journal of Educational Computing
Research, 25(3), 267-281.
Dunn, R., Dunn, K., & Price, G. (1985). Manual: Learning style inventory. Lawrence, KS:
Price Systems.
Dunn, R., Griggs, S. A., Olson, J., Beasley, M. & Gorman, B. S. (1995). A meta-analytic
validation of the Dunn and Dunn model of learning-style preferences. Journal of
Educational Research, 88(6), 353-362.
Durndell, A., & Haag, Z. (2002). Computer self-efficacy, computer anxiety, attitudes
towards the Internet and reported experience with the Internet by gender in an East
European sample. Computers in Human Behavior, 18, 521-535.
Dyck, J. L., & Smither, J. A. (1994). Age differences in computer anxiety: The role of
computer experiences, gender, and education. Journal of Educational Computing Research,
10(3), 239-248.

368
Ealy, D. A. (1999). The effects of an Internet skill-building module on safety and
environmental graduate students’ Internet anxiety, likelihood to use the Internet, and
learning Internet/Intranet content. PhD Dissertation, West Virginia University,
Morgantown.
Eisenberg, M.B. & Berkowitz, R. (1988). Information problem solving: The Big Six
approach to library and information skills instruction. Norwood, NJ: Ablex.
Ellis. D. (1989). Behavioral approach to information retrieval system design. Journal of
Documentation, 45(3), 171-212.
Erfanmanesh, M. A. (2011). Use of Multidimensional Library Anxiety Scale on education
and psychology students in Iran. Library Philosophy & Practice, 9, 1-10.
Facione, P. A. & Facione, N. C. (1992). The California Critical Thinking Disposition
Inventory. Millbrae, CA: California Academic Press.
Fainburg, L. I. (2009). Information seeking and learning: A comparison of Kuhlthau’s
information seeking model and John Dewey’s problem solving model. New Library World,
110(9/10), 457-466.
Fister, B. (1992). The Research process of undergraduate students. Journal of Academic
Librarianship, 18 (3), 163-169.
Fliotsos, A. (1992). Anxiety layering: The effects of library and computer anxiety on CD-
ROM use. The Southeastern Library, 42, 47-49.
Frost, R. O. & Marten, P. A. (1990). Perfectionism and evaluative threat. Cognitive
Therapy & Research, 14, 559-572.
Golafshani, N. (2003). Understanding reliability and validity in qualitative research. Test,
8(4), 597-606.
Gorman, K.L. (1984). Use of the University of Minnesota’s Walter Library: A follow-up
survey of student users. Minnesota University.
Goudy, F. W. & Moushey, E. (1984). Library instruction and foreign students: A survey of
opinions and practices among selected libraries. The Reference Librarian, 10, 215-226.
Gross, M. & Latham, D. (2007). Attaining information literacy: An investigation of the
relationship between skill level, self-estimate of skill, and library anxiety. Library &
Information Science Research, 29, 332-353.
Hadfield, O. D., Martin, J. V. & Wooden, S. (1992). Mathematics anxiety and learning
style of the Navajo middle school student. School Science & Mathematics, 92, 171-176.

369
Hair, J. F., Black, W. C., Babin, B. J., Anderson, R. E. & Tatham, R. L. (2006).
Multivariate data analysis. New Jersey: Pearson.
Harada, V. H. (2005). Librarians and teachers as research partners: Reshaping practices
based on assessment and reflection. School Libraries Worldwide, 11, 49-72.
Harris, J. B. & Grandgenett, N. (1996). Correlates among teachers’ anxieties,
demographics, and telecomputing activity. Journal of Research on Computing in
Education, 28, 300-317.
Haynes, S., Richard, D. & Kubany, E. (1995). Content validity in psychological
assessment: A functional approach to concepts and methods. Psychological Assessment, 7,
238-247.
Hewitt, P. L. & Flett, G. L. (1991). Dimensions of perfectionism in unipolar depression.
Journal of Abnormal Psychology, 100, 98-101.
Higgins, C. C. (2001). Factors associated with research anxiety of human resource
education faculty in higher education. PhD dissertation, University of Arkansas,
Fayetteville, Arkansas.
Hill, K. T. & Wigfield, A. (1984). Test anxiety: A major educational problem and what can
be done about it. The Elementary School Journal, 85(1), 105-126.
Ho, R. (2006). Handbook of univariate and multivariate data analysis and interpretation
with SPSS. London, New York: Taylor & Francis Group.
Holsti, O. R. (1969). Content Analysis for the Social Sciences and Humanities. Reading,
MA: Addison-Wesley.
Hyldegard, J. (2006). Collaborative information behavior: Exploring Kuhlthau’s
Information Search Process model in a group-based educational setting. Information
Processing & Management, 42(1), 276-298.
Hyldegard, J. (2009). Beyond the search process: Exploring group members’ information
behavior in context. Information Processing & Management, 45(1), 142-158.
Jackson, L. A., Ervin, K. S., Gardner, P. D., & Schmitt, N. (2001). Gender and the Internet:
women communicating and men searching. Sex Roles, 4, 363-379.
Jacobsen, T. F. (1991). Gender differences in attitudes toward using computers in libraries:
An exploratory study. Library & Information Science Research, 13(3), 269-279.
Jacobsen, T. E. & Mark, B. L. (1995). Teaching in the information age: Active learning
techniques to empower students. The Reference Librarian, 51-52, 105-120.

370
Jerabek, J. A., Meyer, L. S. & Kordinak, S. T. (2001). Library anxiety and computer
anxiety: Measures, validity, and research implications. Library & Information Science
Research, 23, 277-289.
Jiao, Q. C., Collins, K. M. T. & Onwuegbuzie, A. J. (2008). Role of library anxiety on
cooperative group performance. Library Review, 57(8), 606-618.
Jiao, Q. C. & Onwuegbuzie, A. J. (1997a). Prevalence and reasons for university library
usage. Library Review, 46(6), 411-420.
Jiao, Q. C. & Onwuegbuzie, A. J. (1997b). Antecedents of library anxiety. Library
Quarterly, 67, 372-389.
Jiao, Q. C. & Onwuegbuzie, A. J. (1998a). Perfectionism and library anxiety among
graduate students. Journal of Academic Librarianship, 24, 365-372.
Jiao, Q. C. & Onwuegbuzie, A. J. (1998b). Understanding library anxious graduate student.
Library Review, 47(4), 217-224.
Jiao, Q. C. & Onwuegbuzie, A. J. (1999a). Library anxiety among international students.
Paper presented at the annual meeting of the Mid-South Education Research Association.
Point Clear, Alabama.
Jiao, Q. C. & Onwuegbuzie, A. J. (1999b). Self-perception and library anxiety: An
empirical study. Libray Review, 48, 140-147.
Jiao, Q. C. & Onwuegbuzie, A. J. (1999c). Is library anxiety important?. Library Review,
48, 278-282.
Jiao, Q. C. & Onwuegbuzie, A. J. (1999d). Identifying library anxiety through students
learning modality preferences. Library Quarterly, 69, 202-211.
Jiao, Q. C. & Onwuegbuzie, A. J. (2001a). Library anxiety and characteristics strengths and
weakness of graduate student’s study habits. Library Review, 50(2), 73-78.
Jiao, Q. C. & Onwuegbuzie, A. J. (2001b). Library anxiety among international students.
Urban Library Journal, 11, 16-27.
Jiao, Q. C. & Onwuegbuzie, A. J. (2002a). Dimensions of library anxiety and social
interdependence: implications of library services. Library Review, 51(2), 71-78.
Jiao, Q. C. & Onwuegbuzie, A. J. (2002b). Anxiety-Expectation Mediation model of library
anxiety. Paper presented at the annual meeting of the Mid-south Educational Research
Association, Chattanooga, United States.

371
Jiao, Q. C. & Onwuegbuzie, A. J. (2003). Reading ability as a predictor of library anxiety.
Library Review, 52(4), 159-169.
Jiao, Q. C. & Onwuegbuzie, A. J. (2004). The impact of information technology on library
anxiety: The role of computer attitudes. Information Technology & Libraries, 23(4), 138-
142.
Jiao, Q. C., Onwuegbuzie, A. J. & Bostick, S. L. (2004). Racial differences in library
anxiety among graduate students. Library Review, 53(4), 228-235.
Jiao, Q. C., Onwuegbuzie, A. J. & Bostick, S. L. (2006). The relationship between race and
library anxiety among graduate students: A replication study. Information Processing &
Management, 42, 843-851.
Jiao, Q. C., Onwuegbuzie, A. J. & Lichtenstein, A. A. (1996). Library anxiety:
Characteristics of at-risk college students. Library & Information Science Research, 18(2),
151-163.
Jiao, Q. C., Onwuegbuzie, A. J. & Daley, C. E. (1997). Factors associated with library
anxiety. Paper presented at the annual American Educational Research Association
Conference, Chicago, United States.
Jiao, Q. C., Onwuegbuzie, A. J. & Waytowich, V. L. (2008). The relationship between
citation errors and library anxiety: An empirical study of doctoral students in education.
Information processing & management, 44(2), 948-956.
Johnson, D. W. & Norem-Hebeisen, A. A. (1979). A measure of cooperative, competitive,
and individualistic attitudes. The Journal of Social Psychology, 109, 253-261.
Jones, C. H. & Slate, J. R. (1992). Technical manual for the Study Habits Inventory.
Unpublished manuscript, Arkansas State University, Jonesboro, AR.
Julien, H., Mckechnie, L. E. & Hart, S. (2005). Affective issues in library and information
science systems work: A content analysis. Library & Information Science Research, 27(4),
453-466.
Keefer, J. (1993). The hungry rats’ syndrome: Library anxiety, information literacy and the
academic reference process. Reference & User Services Quarterly, 32, 332-339.
Kim, S. U. & Todd, R. J. (2008). The information search process of English language
learner students in a guided inquiry project: An in-depth case study of two Korean high
school students in the United States. Paper presented at the annual conference of the
International Association of School Librarianship, Berkeley, California.

372
Kohrman, R. A. (2002). When you aren’t in Kansas any more: Computer, research and
library anxieties of graduate education students. Master thesis, Grand Valley State
University, Allendale, Michigan.
Kohrman, R. A. (2003). Computer anxiety in the 21st century: When you are not in Kansas
any more. Paper presented at the eleventh Association of College & Research Libraries
conference, Charlotte, United States.
Kracker, J. (2002). Research anxiety and students’ perceptions of research: An experiment.
Part I. Effect of teaching Kuhlthau’s ISP model. Journal of the American society for
Information Science & Technology, 53(4), 282-294.
Kracker, J. & Wang, P. (2002). Research anxiety and students’ perceptions of research: An
experiment. Part II. Content analysis of their writings on two experiences. Journal of the
American society for Information Science & Technology, 53(4), 295-307.
Krejcie, R. V. & Morgan, D. W. (1970). Determining sample size for research activities.
Educational & Psychological Measurement. 30(3), 607-610.
Krug, S. E., Scheier, I. H. & Cattell, R. B. (1976). Handbook for the IPAT Anxiety Scale.
Champaign, IL: Institute of Personality and Ability Testing.
Kuhlthau, C. C. (1988a). Longitudinal case studies of the information search process of
users in libraries. Library & Information Science Research, 10, 257-304.
Kuhlthau, C. C. (1988b). Perceptions of the information search process in libraries: A study
of changes from high school through college. Information Processing & Management, 24,
419-427.
Kuhlthau, C. C. (1988c). The information search process of high, middle, and low
achieving high school seniors. Paper presented at the research forum of the American
Association of School Librarians, New Orleans, Louisiana.
Kuhlthau, C. C. (1990a). Reflections on the development of the model of the Information
Search Process (ISP). Bulletin of the American Society for Information Science &
Technology, 33(5), 32-37.
Kuhlthau, C. C. (1990b). The information search process: From theory to practice. Journal
of Education for Library & Information Science, 31(1), 72-75.
Kuhlthau, C. C. (1991). Inside the search process: Information seeking from the user’s
perspective. Journal of the American Society for Information Science, 42(5), 361-371.
Kuhlthau, C. C. (1993). Seeking meaning: A process approach to library and information
services. Norwood, NJ: Ablex.

373
Kuhlthau, C. C. (2007). Reflections on the development of the model of the Information
Search Process (ISP). Bulletin of the American Society for Information Science &
Technology, 33(5), 32-37.
Kuhlthau, C. C. & Tama, S. L. (2001). Information search process of lawyers: A call for
just for me information services. Journal of Documentation, 57(1), 25-43.
Kwon, N., Onwuegbuzie, A. J. & Alexander, L. (2007). Critical thinking disposition and
library anxiety: Affective domains on the space of information seeking and use in academic
libraries. College & Research Libraries, 68(3), 268-278.
Kwon, N. (2008). A mixed-method investigation of the relationship between critical
thinking and library anxiety among undergraduate students in their information search
process. College & Research Libraries, 69(2), 117-131.
Latham, D. & Gross, M. (2007). What they don’t know can hurt them: Competency theory,
library anxiety, and student self-assessments of their information literacy skills. Paper
presented at the thirteen Association of College & Research Libraries Conference,
Baltimore, United States.
Lee, S. W. (2011). An exploratory case study of library anxiety and basic skills English
students in a California Community College district. PhD dissertation, University of
California, Los Angeles, California.
Li, Q. (2006). The influence of continuous concept map construction on the information
seeking process. PhD dissertation, Utah State University, Logan, Utah.
Liu, M. & Redfern, B. (1997). Information seeking behavior of multicultural students: A
case study at San José State University. College & Research Libraries, 58, 348-354.
Loeber, S. & Cristia, A. (2003). A WWW information seeking process model. Educational
Technology & Sociology, 6(3), 43-52.
Loerke, K. (1992). An understanding of how junior high school students experience the
library research process. Master thesis, University of Alberta, Edmonton, Alberta.
Loyd, B. H. & Gressard, C. (1984). The effects of sex, age, and computer experience on
computer attitudes. Paper presented at the Annual Meeting of the Easter Educational
Research Association, Florida, United States.
Malvasi, M., Rudowsky, C. & Valencia, J. M. (2009). Library RX: Measuring and treating
library anxiety. Chicago: Association of College and Research Libraries.
Marchionini, G. (1989). Information seeking strategies of novices using a full-text
electronic encyclopedia. Journal of the American Society for Information Science, 29, 165-
176.

374
Massoud, S. L. (1991). Computer attitudes and computer knowledge of adult students.
Journal of Educational Computing Research, 7(3), 269-291.
Maurer, M. M. (1994). Computer anxiety correlates and what they tell us: A literature
review. Computers in Human Behavior, 10(3), 369-376.
Mawhinney, C. H. & Sarawat, S. P. (1991). Personality type, computer anxiety and
students performance: An empirical indicator. Journal of Educational Computing
Research, 13, 101-103.
Mech, T. F. & Brooks, C. I. (1995). Library anxiety among college students: An
exploratory study. Paper presented at the 7th National Conference of the Association of
College and Research Libraries, Pittsburgh, United States.
Mech, T. F. & Brooks, C. I. (1997). Anxiety and confidence in using a library by college
freshmen and seniors. Psychological Reports, 81(3), 929-930.
Mellon, C. A. (1986a). Library anxiety: A grounded theory and its development. College &
Research Libraries, 47, 160-165.
Mellon, C. A. (1986b). Understanding library use from the standpoint of the user:
Naturalistic inquiry for library research. Journal of Educational Media & Library Sciences,
23(4), 348-364.
Mellon, C. A. (1988). Attitude: The forgotten dimension in library instruction. Library
Journal, 113, 137-139.
Mizrachi, D. & Shoham, S. (2004). English-use anxiety in Israeli college libraries.
Academic Exchange Quarterly, 8(4), 1-5.
Mohundro, J. L. (1999). The effectiveness of bibliographic instruction on reducing library
anxiety in GED students at a community college. PhD dissertation, Texas A&M University,
Texas.
Morner, C. J. (1993). A test of library research skills for education doctoral students. PhD
dissertation, Boston College, Chestnut Hill, Massachusetts.
Nahl, D. & Tenopir, C. (1996). Affective and cognitive searching behavior of novice end-
users of a full-text database. Journal of the American Society for Information Science &
Technology, 47(4), 276-286.
Neemann, J. & Harter, S. (1986). Manual for the self-perception profile for college
students, Unpublished manuscript, University of Denver, Denver, United States.
375
Neuman, W. (1997). Social research methods, qualitative and quantitative approaches.
Boston: Allyn and Bacon.
Nicholas, M., Rudowsky, C. & Valencia, J. M. (2007). Who’s afraid of the big bad
library?. Paper presented at the 13th National Conference of the Association of College and
Research Libraries, Baltimore, Maryland.
Noor, H. A. K. & Ansari, N. (2010). A cross cultural evaluation of Bostick’s Library
Anxiety Scale: Investigating the scale’s psychometric properties in a Malaysian university
library environment. Malaysian Journal of Library & Information Science, 15(1), 115-134.
Noor, H. A. K. & Ansari, N. (2011). Examining the effects of gender, nationality and
bibliographic instruction on library anxiety. Malaysian Journal of Library & Information
Science, 16(2), 141-154.
Oberman, C. (1991). Avoiding the cereal syndrome, or critical thinking in the electronic
environment. Library Trends, 39(3), 189-202.
Okebukola, P. A. (1993). The gender factor in computer anxiety and interest among some
Australian high school. Educational Research, 35(2), 181–189.
O’Neil, P. M. B. (2005). Development and validation of the Beile test of information
literacy for education. PhD dissertation, University of Central Florida, Florida.
Onwuegbuzie, A. J. (1997a). Writing a research proposal: The role of library anxiety,
statistics anxiety and composition anxiety. Library & Information Science Research, 19(1),
5-33.
Onwuegbuzie, A. J. (1997b). The role of technology in the library anxiety of Arkansas
college students. Arkansas Association of Instructional Media Quarterly, 30(3), 6-8.
Onwuegbuzie, A. J. (2003). Modeling statistics achievement among graduate students.
Educational & Psychological Measurement, 63(6), 1020-1038.
Onwuegbuzie, A. J. & Daley, C. E. (1999) Perfectionism and statistics anxiety. Personality
and Individual Differences, 26, 1089–1102.
Onwuegbuzie, A. J. & Jiao, Q. C. (1998a). The relationship between library anxiety and
learning styles among graduate students: Implications for library instruction. Library &
Information Science Research, 20(3), 235-249.
Onwuegbuzie, A. J. & Jiao, Q. C. (1998b). I hope that I am not anxious about using the
library: The relationship between hope and library anxiety among graduate students.
Florida Journal of Educational Research, 38(1), 13-26.

376
Onwuegbuzie, A. J. & Jiao, Q. C. (1998c). Understanding library-anxious graduate
students. Library Review, 47(4), 217-224.
Onwuegbuzie, A. J. & Jiao, Q. C. (2000). I’ll go to the library later: The relationship
between academic procrastination and library anxiety. College & Research Libraries, 6(1),
45-54.
Onwuegbuzie, A. J. & Wilson, V. A. (2003). Statistics anxiety: Nature, etiology,
antecedents, effects, and treatments: A comprehensive review of the literature. Teaching in
Higher Education, 8, 195-209.
Onwuegbuzie, A. J. & Jiao, Q. C. (2004). Information search performance and research
achievement: An empirical test of the anxiety-expectation mediation (AEM) model of
library anxiety. Journal of American Society for Information Science & Technology, 55 (1),
41-54.
Onwuegbuzie, A. J., Jiao, Q. C. & Bostick, S. L. (2004). Library anxiety: Theory, research,
and applications. Lanham, Md.; Oxford: Scarecrow Press.
Ormondroyd, J. (1989). The international student and course-integrated instruction: The
librarian’s perspective. Research Strategies, 7, 148-58.
Otomo, Y. (1998). The relationship of computer anxiety, mathematics anxiety, trait anxiety,
test anxiety, gender, and demographic characteristics among community college students.
PhD dissertation, Columbia University, New York.
Palumbo, D. B. & Reed, W. M. (1990). The effect of BASIC programming language
instruction on high school students’ problem solving ability and computer anxiety. Paper
presented at the Annual Conference of the Eastern Educational Research Association, Clear
Water, Florida.
Parker, J. (1990). Computer anxiety as it relates to age, gender, and Myers Bnggs
Personality Type. Unpublished Thesis, Wright State University. USA.
Pitts, J. M. (1995). Mental models of information. School Library Media Quarterly, 23(3),
177-184.
Popham, W. J. & Husek, T. R. (1969). Implications of criterion-referenced measurement.
Journal of Educational Measurement. 6(1), 1-9.
Portney, L. G. & Watkins, M. P. (2000). Statistical measures of reliability. In: Foundations
of clinical research: Applications to practice, 2nd
ed. Prentice Hall, New Jersey.
Presno, C. (1988). Taking the byte out of the Internet anxiety. Journal of Educational
Computing Research, 18(2), 147-161.

377
Reed, W. M. & Palumbo, D. B. (1988). The effects of BASIC instruction on problem
solving skills over an extended period of time. Paper presented at the Annual Conference of
the Eastern Educational Research Association, Miami, United States.
Reed, W., Anderson, D., Ervin, J. & Oughton, J. (1995). Computers and teacher education
students: A ten year analysis. Journal of Computing in Childhood Education, 6, 5-24.
Rogers, M. E., Creed, P. A. & Searle, J. (2009). The development and initial validation of
social cognitive career theory instruments to measure choice of medical specialty and
practice location. Journal of Career Assessment, 17, 324-337.
Rousseau G., Jamieson B., Rogers W., Mead S. & Sit R. (1998). Assessing the usability of
on-line library systems. Behavioral & Information Technology, 17, 274-281.
Rosen, L. D. & Weil, M. M. (1995). Adult and teenage use of consumer, business, and
entertainment technology: potholes on the information super highway?. Journal of
Consumer Affairs, 29(1), 55-84.
Scott, C. R. & Rockwell, S. C. (1997). The effect of communication, writing and
technology apprehension on likelihood to use new communication technologies.
Communication Education, 46, 44-62.
Seagull, F. & Walker, N. (1992). The effects of hierarchy structure and visualization ability
on computerized information retrieval. International Journal of Human Computer
Interaction, 4, 369–385.
Selden, L. (1999). Kapital och karriär. Informationssökning i forskningens vardagspraktik.
Göteborg: Valfrid.
Shoham, S. & Mizrachi, D. (2001). Library anxiety among undergraduates: A study of
Israeli B. Ed. Students. Journal of Academic Librarianship, 27(4), 305-319.
Shuman, B. (1999). Library security and safety handbook, Chicago: American
LibraryAssociation.
Sigurdsson, J. F. (1991) Computer experience, attitudes toward computers and personality
characteristics in Psychology undergraduates. Personality & Individual Differences, 12,
617–624.
Snyder, C. R., Harris, C., Anderson, J. R., Holleran, S. A., Irving, L. M. & Sigmon, S. T.
(1991). The will and the ways: Development and validation of an individual differences
measure of hope. Journal of Personality & Social Psychology, 60(4), 570–585.
Solomon, L. J. & Rothblum, E. D. (1984). Academic procrastination: Frequency and
cognitive-behavioral correlates. Journal of Counseling Psychology, 31(4), 503-509.

378
Spielberger, C. D. (1970). Manual for the state-trait anxiety inventory. Palo Alto, CA:
Consulting Psychologists Press, Inc.
Stebelman, S. (1987). Teaching manuscript and archival resources. Literary Research,
12(1), 23-34.
Stronge, A., Rogers, W. & Fisk, A. (2006). Web-based information search and retrieval:
Effects of strategy use and age on search success. Human Factors, 48(3), 434-446.
Swain, D. E. (1996). Information search process model: How freshmen being research.
Proceedings of the ASIS Annual Meeting, 33, 95-99.
Swigon, M. (2011). Library anxiety among Polish students: Development and validation of
the Polish Library Anxiety Scale. Library & Information Science Research, 33(2), 144-150.
Swope, M. J. & Katzer, J. (1972). Why don’t they ask questions?. Reference & Users
Services Quarterly, 12(2), 161-166.
Talbot, D. E., Lowell, G.R. & Martin, K. (1998). From the users’ perspective-The UCSD
libraries user project. The Journal of Academic Librarianship, 24, 357-364.
Taylor, R. (1991). Information use environments. In Progress in communication sciences,
edited by B. Dervin, & M. J. Voigt. Norwood, Ablex Publishing, NJ
Tenopir, C., Wang, P., Zhang, Y., Simmons, B. & Pollard, R. (2008). Academic users’
interactions with Science Direct in search tasks: affective and cognitive behaviors. Journal
of the American Society for Information Science & Technology, 44(1), 105-21.
Todd, R. J. (2006). From information to knowledge: Charting and measuring changes in
students’ knowledge of a curriculum topic. Information Research, 11(4), 1-10.
Todman, J. & Monaghan, E. (1994). Qualitative differences in computer experience,
computer anxiety, and students’ use of computers: A path model. Computer Human
Behavior, 10(4), 529-539.
Todman, J. (2000). Gender differences in computer anxiety among university entrants since
1992. Computers & Education, 34, 27–35.
Turkzadeh, G. R. & Angulo, I. E. (1992). The concept and correlates of computer anxiety.
Behavior & Information Technology, 11(2), 99-108.
Vakkari, P., Pennanen, M. & Serola, S. (2003). Change of search terms and tactics while
writing a research proposal: A longitudinal case study. Information Processing &
Management, 39(3), 445-463.

379
Valentine, B. (1993). Undergraduate research behavior: using focus groups to generate
theory. Journal of Academic Librarianship, 19(5), 300-304.
Van Kampen, D. J. (2003). Library anxiety, the information search process and doctoral
use of the library. PhD dissertation, University of Central Florida, Orlando, Florida.
Van Kampen, D. J. (2004). Development and validation of the multidimensional library
anxiety scale. College & Research Libraries, 65(1), 28-34.
Van Scoyoc, A. M. (2003). Reducing library anxiety in first year students. Reference &
User Services Quarterly, 42(4), 329-341.
Veal, R. (2002). The relationship between library anxiety and off-campus adult learners.
Journal of Library Administration, 37(3-4), 529-536.
Vicente, K. J. & Williges, R. C. (1988). Accomodating individual differences in searching a
hierarchical fiel system. International Journal of Man-Machine Studies, 29, 647-668.
Westerman, S., Davies, D., Glendon, A., Stammers, R. & Matthews, G. (1995). Age and
cognitive ability as predictors of computerised information retrieval. Behaviour &
Information Technology, 14, 107-20.
Whitmire, E. (2002). The relationship between undergraduates' background characteristics
and college experiences and their academic library use. College & Research Libraries, 62,
528−540.
Wiberley, S. & Jones, W. G. (2000). Time and technology: A decade long look at
humanists’ use of electronic information technology. College & Research Libraries, 61,
421-431.
Yang, H. H., Mohamed, D., & Beyerbach, B. (1999) An investigation of computer anxiety
among vocational technical teachers. Journal of Industrial Teacher Education, 37(1), 64–
82.
Young, N. J. & Von Seggern, M. (2001). General information seeking in changing times: A
focus group study. Reference & Users Services Quarterly, 41(2), 159-169.
Zahner, J. E. (1993). Thoughts, feelings and actions: Integrating domains in library
instruction. Paper presented at the annual meeting of Association for Educational
Communications & Technology, New Orleans, Louisiana.
Zhang, M. & Jansen, B. J. (2009). Influences of mood on information seeking behavior.
Paper presented at the 27th international conference on Human Factors in Computing
Systems, Boston, Massachusetts.
380
APPENDIX A
THE PROFILE OF EXPERTS

381
Expert Academic
Qualification
Research Expertise University Country
A Professor Academic related
anxiety
Sam Houston
State University
United
States
B Assistant
Professor
Information seeking
behaviours
Tarbiat Moalem
University
Iran
C Professor (Dean
of libraries)
Library anxiety University of
Missouri
United
States
D Professor Library anxiety City University
of New York
United
States
E Professor Information seeking
behaviours
University of
Hawaii
United
States
F Professor Information seeking
behaviours
Rutgers
University
United
States
G Professor Library anxiety Myongji
University
South
Korea
H Associate
Professor
Information seeking
behaviours
Shiraz
University
Iran
I Professor Academic related
anxiety
Shiraz
University
Iran
J Professor Library anxiety University of
Malaya
Malaysia
K Assistant
Professor
Information seeking
behaviours
University of
Malaya
Malaysia
L PhD Students Library anxiety University of
Malaya
Malaysia
M Librarian Library anxiety Saint Leo
University
United
States
N Assistant
Professor
Academic related
anxiety
Pittsburg
University
United
States
O Librarian Library anxiety University of
North Carolina
United
States
P Librarian Library anxiety Grand Valley
State University
United
States

382
Appendix B
LIST OF KEY COMPONENTS
(INITIAL LIST)

383
I. Comfort with Information Resources during the Information Seeking Process
1. Limitation of information resources
2. Information resources overload
3. Scattering of information resources
4. Availability of information resources
5. Not available on shelves or checked out books
6. Open and close library stacks
7. Unarranged library shelves
8. Accessibility of information resources
9. Restricted access to information resources
10. Special equipments required to access information resources
11. Special skills required to access information resources
12. Limited access to full-text resources
13. Quality of information resources
14. Making judgment about the quality of information resources
15. Unreliability of information resource quality
16. Poor quality of information resources
17. Relevance of information resources
18. Making judgment about the relevance of information resources
19. Finding too many irrelevant information resources
20. Finding out-of-date information resources
21. Novelty of information resources
22. Familiarity with information resources
23. Finding unfamiliar information resources
24. Finding different types of information resources
25. Ease of use of information resources
26. Locating information resources
27. Language of information resources
II. Comfort with Computers and the Internet during the information seeking process
28. Comfort with library and information technologies
29. Different technologies required for seeking information
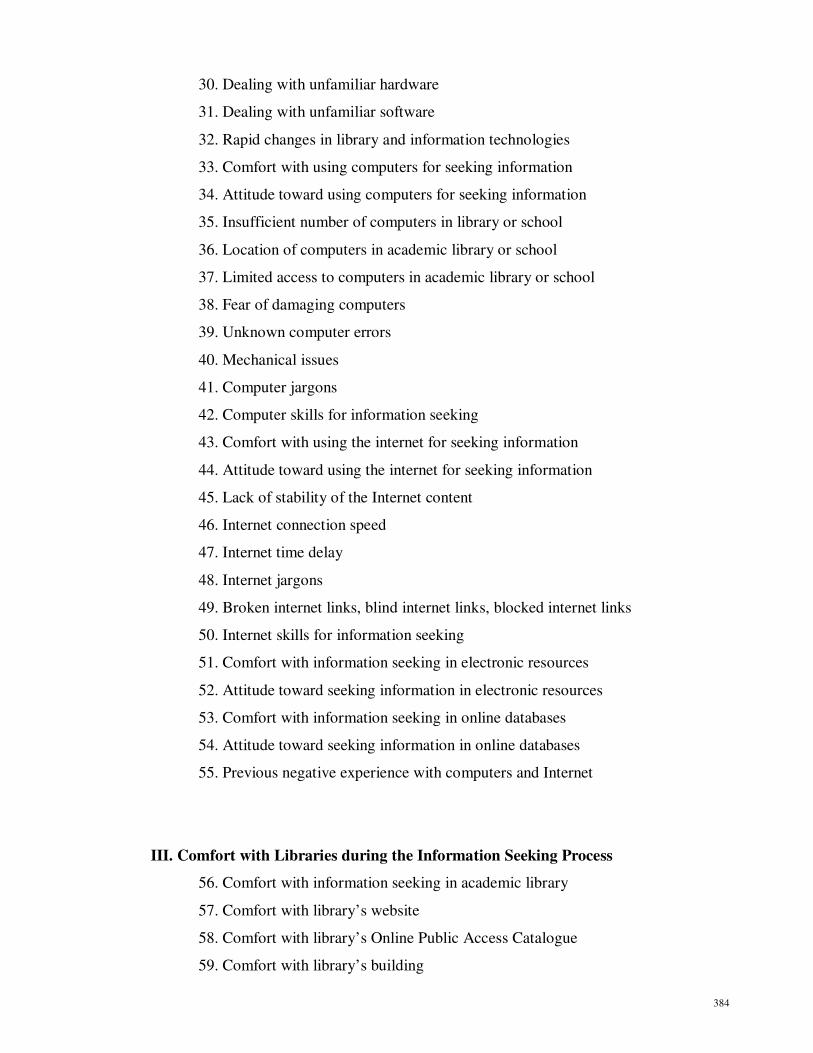
384
30. Dealing with unfamiliar hardware
31. Dealing with unfamiliar software
32. Rapid changes in library and information technologies
33. Comfort with using computers for seeking information
34. Attitude toward using computers for seeking information
35. Insufficient number of computers in library or school
36. Location of computers in academic library or school
37. Limited access to computers in academic library or school
38. Fear of damaging computers
39. Unknown computer errors
40. Mechanical issues
41. Computer jargons
42. Computer skills for information seeking
43. Comfort with using the internet for seeking information
44. Attitude toward using the internet for seeking information
45. Lack of stability of the Internet content
46. Internet connection speed
47. Internet time delay
48. Internet jargons
49. Broken internet links, blind internet links, blocked internet links
50. Internet skills for information seeking
51. Comfort with information seeking in electronic resources
52. Attitude toward seeking information in electronic resources
53. Comfort with information seeking in online databases
54. Attitude toward seeking information in online databases
55. Previous negative experience with computers and Internet
III. Comfort with Libraries during the Information Seeking Process
56. Comfort with information seeking in academic library
57. Comfort with library’s website
58. Comfort with library’s Online Public Access Catalogue
59. Comfort with library’s building

385
60. Comfort with library’s size
61. Comfort with library’s décor and furniture
62. Comfort with noise, light and temperature in academic library
63. Disturbance caused by peers in academic library
64. Feeling secure in library
65. Comfort with library policies, procedures and hours
66. Comfort with library staff
67. Comfort with library services
68. Comfort with reference services
69. Comfort with circulation services
70. Comfort with document delivery services
71. Comfort with interlibrary loan services
72. Comfort with reserve services
73. Attitude toward academic library
74. Library skills for information seeking
75. Library research skills for information seeking
76. Previous negative experience with academic library
IV. Comfort with the Process of Information Seeking
77. Comfort with information seeking
78. Attitude toward information seeking
79. Comfort with task initiation
80. Comfort with topic selection
81. Comfort with pre-focus exploration
82. Comfort with focus formulation
83. Comfort with information collection
84. Comfort with information presentation
85. Attitude toward information seeking
86. Information seeking issues
87. Time limitation during information seeking
88. Costs of information seeking
89. Previous negative experience with information seeking

386
90. Pressure of faculty members
91. Lack of support by faculty members
92. Language factor
93. Information seeking skills
94. Determining search terms

387
APPENDIX C
LIST OF KEY COMPONENTS
(REVISED LIST)
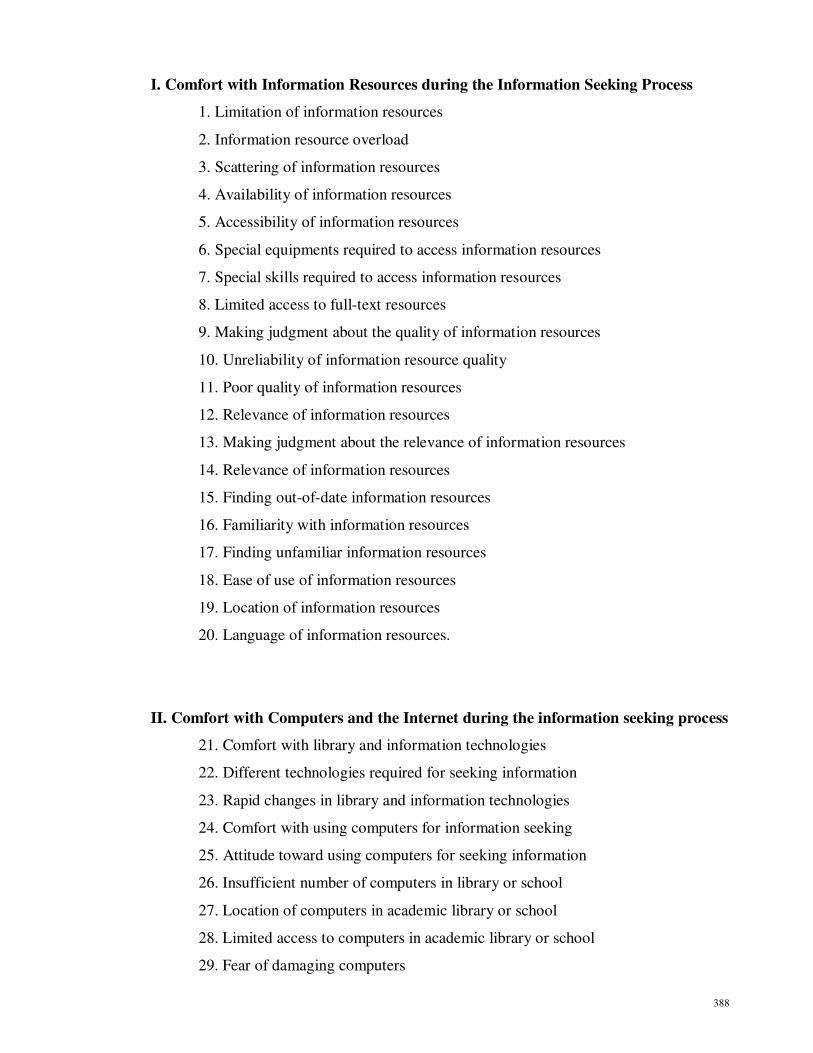
388
I. Comfort with Information Resources during the Information Seeking Process
1. Limitation of information resources
2. Information resource overload
3. Scattering of information resources
4. Availability of information resources
5. Accessibility of information resources
6. Special equipments required to access information resources
7. Special skills required to access information resources
8. Limited access to full-text resources
9. Making judgment about the quality of information resources
10. Unreliability of information resource quality
11. Poor quality of information resources
12. Relevance of information resources
13. Making judgment about the relevance of information resources
14. Relevance of information resources
15. Finding out-of-date information resources
16. Familiarity with information resources
17. Finding unfamiliar information resources
18. Ease of use of information resources
19. Location of information resources
20. Language of information resources.
II. Comfort with Computers and the Internet during the information seeking process
21. Comfort with library and information technologies
22. Different technologies required for seeking information
23. Rapid changes in library and information technologies
24. Comfort with using computers for information seeking
25. Attitude toward using computers for seeking information
26. Insufficient number of computers in library or school
27. Location of computers in academic library or school
28. Limited access to computers in academic library or school
29. Fear of damaging computers

389
30. Unknown computer errors
31. Mechanical issues
32. Computer skills for information seeking
33. Comfort with using the internet for seeking information
34. Attitude toward using the internet for seeking information
35. Lack of stability of the Internet content
36. Internet connection speed
37. Internet jargons
38. Internet skills for information seeking
39. Comfort with information seeking in electronic resources
40. Attitude toward seeking information in electronic resources
41. Comfort with information seeking in online databases
42. Attitude toward seeking information in online databases
43. Previous negative experience with computers and Internet
III. Comfort with Libraries during the Information Seeking Process
44. Comfort with information seeking in academic library
45. Comfort with library’s website
46. Comfort with library’s Online Public Access Catalogue
47. Comfort with library’s building
48. Comfort with library’s décor and furniture
49. Comfort with noise, light and temperature in academic library
50. Comfort with library policies, procedures and hours
51. Comfort with library staff
52. Comfort with library services
53. Attitude toward academic library
54. Library skills for information seeking
55. Previous negative experience with academic library

390
IV. Comfort with the Process of Information Seeking
56. Comfort with information seeking
57. Attitude toward information seeking
58. Comfort with task initiation
59. Comfort with topic selection
60. Comfort with pre-focus exploration
61. Comfort with focus formulation
62. Comfort with information collection
63. Comfort with information presentation
64. Time limitation during information seeking
65. Costs of information seeking
66. Previous negative experience with information seeking
67. Language factor
68. Pressure and lack of support by faculty members
69. Information seeking skills
70. Determining search terms

391
APPENDIX D
LIST OF STATEMENTS
(INITIAL LIST)
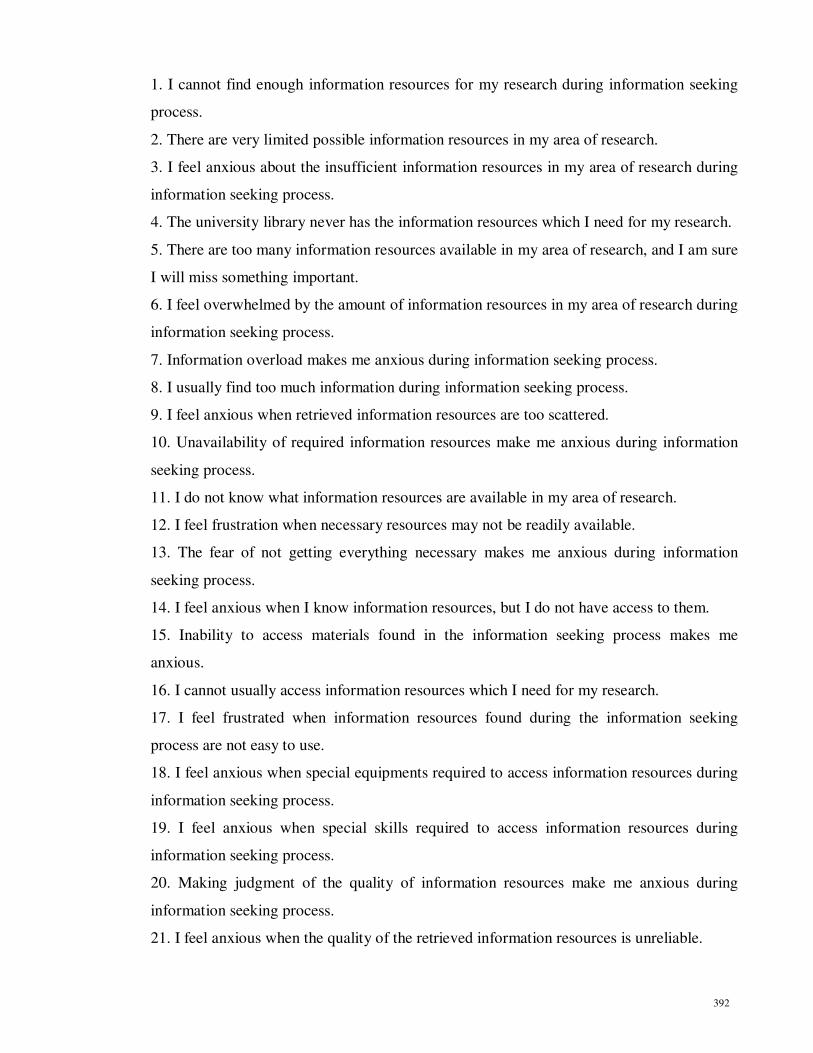
392
1. I cannot find enough information resources for my research during information seeking
process.
2. There are very limited possible information resources in my area of research.
3. I feel anxious about the insufficient information resources in my area of research during
information seeking process.
4. The university library never has the information resources which I need for my research.
5. There are too many information resources available in my area of research, and I am sure
I will miss something important.
6. I feel overwhelmed by the amount of information resources in my area of research during
information seeking process.
7. Information overload makes me anxious during information seeking process.
8. I usually find too much information during information seeking process.
9. I feel anxious when retrieved information resources are too scattered.
10. Unavailability of required information resources make me anxious during information
seeking process.
11. I do not know what information resources are available in my area of research.
12. I feel frustration when necessary resources may not be readily available.
13. The fear of not getting everything necessary makes me anxious during information
seeking process.
14. I feel anxious when I know information resources, but I do not have access to them.
15. Inability to access materials found in the information seeking process makes me
anxious.
16. I cannot usually access information resources which I need for my research.
17. I feel frustrated when information resources found during the information seeking
process are not easy to use.
18. I feel anxious when special equipments required to access information resources during
information seeking process.
19. I feel anxious when special skills required to access information resources during
information seeking process.
20. Making judgment of the quality of information resources make me anxious during
information seeking process.
21. I feel anxious when the quality of the retrieved information resources is unreliable.

393
22. Finding poor quality information resources during the information seeking process
make me frustrated.
23. Controlling quality of the retrieved information resources during information seeking
make me anxious.
24. I feel frustration when what is retrieved during information seeking process is not
wanted.
25. I feel anxious when resources found during the information seeking process are
irrelevant.
26. Making judgment of the relevancy of retrieved information resources make me anxious
during information seeking process.
27. Finding too many irrelevant resources during information seeking process make me
anxious.
28. I cannot usually determine which items I have found are related to my research.
29. I feel anxious when what is retrieved during the information seeking process is not up-
to-date.
30. The unfamiliarity with the format of information resources makes me anxious when
searching for information.
31. I feel anxious when I find too many unfamiliar information resources during
information seeking process.
32. I feel frustrated when information resources are not ease of use.
33. Locating information resources make me anxious during the information seeking
process.
34. I can usually find materials I need for my research during information seeking process.
35. It is not easy to locate information resources which I need during information seeking
process.
36. Finding useful resources in a language which I can not understand make me anxious.
37. I feel comfortable using library and information technologies for seeking information.
38. I feel anxious when different computer technologies are required to retrieve the needed
information resources.
39. Rapid changes in hardware and software technologies makes me anxious when
searching for information resources.
40. High rate of changes in library and information technologies make me anxious when
seeking information.

394
41. I feel anxious when online resources and databases change and my skills no longer are
applicable.
42. I am comfortable using computers in seeking information process.
43. When using computers to find information resources, I feel frustrated.
44. I feel frightened when I think I need to use computers for seeking information
resources.
45. I think computers are useful devices for seeking information resources.
46. The computers do not play an important role in my information seeking process.
47. The insufficient number of computers in the library or school is a source of frustration
for me.
48. Shortage of computers, photocopiers and printers in the library makes frustration.
49. The computers are not located in a convenient place in library or school.
50. Limited access to computers in library or school cause anxiety during information
seeking process.
51. I feel fear of damaging computers or other machines when using them for seeking
information.
52. Unknown computer errors make me anxious during information seeking process.
53. I feel fear of making mistakes that cause system malfunction during the information
seeking process.
54. Any mechanical or technological issues cause anxiety when searching for information
resources.
55. My knowledge of how to use computers for seeking information is not adequate.
56. I think my poor computer skills have affected my information seeking negatively.
57. I am embarrassed that I do not know how to use computers for seeking information.
58. I feel overwhelmed when seeking information on the web.
59. I am comfortable using the internet for seeking information resources.
60. I feel anxious when I cannot find necessary information resources on the web.
61. I feel anxious when searching the World Wide Web for information related to my
research.
62. I think using the internet for seeking information resources is useful and necessary.
63. The internet plays an important role in my information seeking process.
64. When seeking information for my research, I always start by searching internet
resources.

395
65. I would rather seeking information on the internet without going to the library.
66. I feel anxious when the internet doesn’t do what I want.
67. I feel anxious during information seeking process because the lack of stability of
internet contents.
68. Slow Internet connection makes me anxious when I searching for information resources
in the World Wide Web.
69. Slow downloading of pages and files makes me anxious when I seeking for information
on the web.
70. Overwhelming unknown Internet jargons and vocabulary makes me anxious during
information seeking process.
71. My internet skills are not adequate for completing information seeking process
successfully.
72. I think my poor internet skills have affected my information seeking negatively.
73. I am embarrassed that I do not know how to use the Internet for seeking information
resources.
74. I feel uncomfortable using electronic resources when seeking information.
75. When seeking information for my research, I always start searching electronic
resources.
76. I feel uncomfortable when seeking information in online databases.
77. I can find important information for my research through online databases.
78. I prefer searching the online databases first, then the library and other resources.
79. My previous negative experiences affect my feelings negatively when I use computers
and the internet for information seeking.
80. I become anxious when seeking for information in the academic library.
81. When I think about my research as it relates to the library, I feel anxious.
82. I feel comfortable using the academic library for research.
83. When I use library’s website for research, I feel overwhelmed.
84. I feel anxious when searching for information resources in the university library
website.
85. When I use library’s Online Public Access Catalogue for seeking information, I feel
frustrated.
86. When I use the university library Online Public Access Catalogue (OPAC) for seeking
information resources, I feel frustrated.
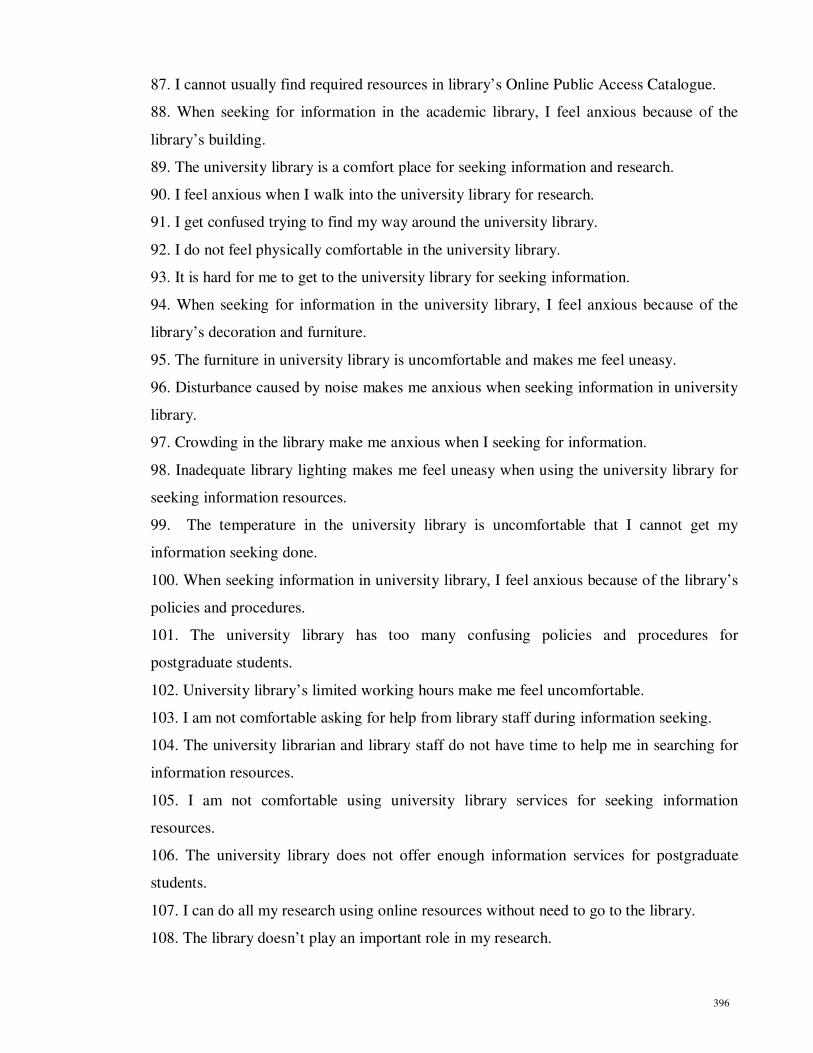
396
87. I cannot usually find required resources in library’s Online Public Access Catalogue.
88. When seeking for information in the academic library, I feel anxious because of the
library’s building.
89. The university library is a comfort place for seeking information and research.
90. I feel anxious when I walk into the university library for research.
91. I get confused trying to find my way around the university library.
92. I do not feel physically comfortable in the university library.
93. It is hard for me to get to the university library for seeking information.
94. When seeking for information in the university library, I feel anxious because of the
library’s decoration and furniture.
95. The furniture in university library is uncomfortable and makes me feel uneasy.
96. Disturbance caused by noise makes me anxious when seeking information in university
library.
97. Crowding in the library make me anxious when I seeking for information.
98. Inadequate library lighting makes me feel uneasy when using the university library for
seeking information resources.
99. The temperature in the university library is uncomfortable that I cannot get my
information seeking done.
100. When seeking information in university library, I feel anxious because of the library’s
policies and procedures.
101. The university library has too many confusing policies and procedures for
postgraduate students.
102. University library’s limited working hours make me feel uncomfortable.
103. I am not comfortable asking for help from library staff during information seeking.
104. The university librarian and library staff do not have time to help me in searching for
information resources.
105. I am not comfortable using university library services for seeking information
resources.
106. The university library does not offer enough information services for postgraduate
students.
107. I can do all my research using online resources without need to go to the library.
108. The library doesn’t play an important role in my research.

397
109. I would rather use the library than internet and online resources for seeking
information.
110. The academic library is an important part of my research.
111. My library skills are not adequate for success in information seeking part of my
research.
112. I think my ability to use the library has affected my research negatively.
113. I am embarrassed that I do not know how to find information resources for my
research.
114. My previous experiences with the university library affect my feelings negatively
when I use the university library for seeking information.
115. When I thinking about seeking information for my research, I feel anxious.
116. I am worried about not being able to find necessary information resources during the
information seeking process.
117. I feel anxiety from the beginning to the end of the information seeking process.
118. When seeking information related to my research, I experience negative feelings like
anxiety and frustration.
119. I am confident that I will find appropriate information related to my research.
120. I feel overwhelmed when dealing with the amount of information and work toward to
the information seeking.
121. I enjoy the information search process of my research.
122. I feel anxious when I need information related to my research.
123. I am not sure how to start information seeking process.
124. I feel anxious and frustrated when searching for information resources related to my
research.
125. I feel frustrated when become aware of my information need.
126. Selecting a general topic is a difficult part of the information seeking process.
127. I feel anxious when choosing a general topic for my research.
128. Identifying general topic in information seeking process decreased my stress.
129. Exploring information on general topic for finding a focus makes me anxious.
130. Narrowing the research topic down to develop a focused topic is not easy make me
frustrated.
131. I feel anxious when developing a focused topic during information seeking process.
132. I find it easy to narrow down my topic and develop a focused topic.

398
133. Gathering information related to my specific topic makes me anxious.
134. I feel anxious when determine which items I have found are related to my research.
135. I become more interested in my topic as I gather information.
136. I feel disappointed with the information found during the information seeking process.
137. I am unsure about how to complete the information seeking process.
138. I usually know when I have enough information to complete the information seeking
process.
139. I feel satisfaction with the information found during information seeking process.
140. Making use of the retrieved items to perform research makes me anxious.
141. I just want to finish information seeking process of my research.
142. I feel more comfortable after finish the information search process of my research.
143. Time limitations for seeking information resources make me anxious.
144. I feel frustrated if I cannot find necessary information within a few minutes.
145. Have to pay for access to information resources makes my anxious.
146. My previous negative experiences affect my feelings negatively during information
seeking process.
147. Seeking information in a language which is not my native language makes me
anxious.
148. The lack of support by faculty during information seeking process is a source of
anxiety.
149. Pressure of faculty to finish information seeking process of my research makes me
anxious.
150. High expectations of faculty in information seeking process make me anxious.
151. I feel anxious because of the multiple skills I need to learn when seeking information.
152. I am embarrassed that I do not know how to seeking for information.
153. My information seeking skills are not adequate for success in information seeking
process.
154. I feel anxious when selecting a search term for seeking information related to my
research.

399
APPENDIX E
LIST OF STATEMENTS
(REVISED LIST)

400
1. I cannot find enough information resources for my research during information seeking
process.
2. There are very limited possible information resources in my area of research.
3. I feel anxious about the insufficient information resources in my area of research during
information seeking process.
4. There are too many information resources available in my area of research, and I am
sure I will miss something important.
5. I feel anxious by the amount of information resources in my area of research.
6. I usually find too much information for my research during information seeking process.
7. I feel anxious when retrieved information resources are too scattered.
8. I do not know what information resources are available in my area of research.
9. Unavailability of required information resources make me anxious during information
seeking process.
10. I feel anxious when I know useful information resource, but I do not have access to
them.
11. I cannot usually access information resources which I need for my research.
12. Locating information resources make me anxious during the information seeking
process.
13. Restricted access to the required full text resources make me anxious during the
information seeking process.
14. I feel anxious when special equipments are required to have access to information
resources during the information seeking process.
15. I feel anxious when special skills are required to access information resources during
the information seeking process.
16. I feel frustrated when information resources found during the information seeking
process are not easy to use.
17. Making judgment of the quality of information resources make me anxious during
information seeking process.
18. I feel anxious when the quality of the retrieved information resources is unreliable.
19. Finding poor quality information resources during the information seeking process
make me frustrated.
20. Making judgment of the relevancy of retrieved information resources make me anxious

401
during information seeking process.
21. I feel anxious when resources found during the information seeking process are
irrelevant.
22. I feel anxious when what is retrieved during the information seeking process is not up-
to-date.
23. The unfamiliarity with the format of information resources makes me anxious when
searching for information.
24. I feel anxious when I find too many unfamiliar information resources during
information seeking process.
25. I am not comfortable using printed resources during information seeking process.
26. I feel uncomfortable using electronic resources when seeking information.
27. I do not feel comfortable using online resources when seeking information.
28. When I use computers to find information resources, I feel frustrated.
29. When I try to use computers for seeking information resources, I feel frustrated.
30. I think computers are useful devices for seeking information resources.
31. The computers do not play an important role in my information seeking process.
32. The insufficient number of computers in the library or school is a source of frustration
for me.
33. The computers are not located in a convenient place in library or school.
34. I feel fear of damaging computers or other machines when using them for seeking
information.
35. I feel fear of making mistakes that cause system malfunction during the information
seeking process.
36. Unknown computer errors make me anxious during information seeking process.
37. Any mechanical or technological issues cause anxiety when searching for information
resources.
38. Rapid changes in hardware and software technologies make me anxious when
searching for information resources.
39. I feel anxious when different computer technologies are required to retrieve the needed
information resources.
40. My computer skills are not adequate for success in information seeking part of my
research.

402
41. I am embarrassed that I do not know how to use computers for seeking information
resources.
42. I feel overwhelmed when seeking information on the World Wide Web.
43. I feel anxious when searching the World Wide Web for information related to my
research.
44. I feel anxious when I cannot find necessary information on the World Wide Web.
45. When seeking information for my research, I always start by searching internet
resources.
46. The Internet plays an important role in my information seeking process.
47. I feel anxious because the lack of stability of Internet contents.
48. Slow Internet connection makes me anxious when I searching for information
resources in the World Wide Web.
49. Slow downloading of pages and files makes me anxious when I seeking for
information.
50. Overwhelming unknown Internet jargons and vocabulary makes me anxious during
information seeking process.
51. My Internet skills are not adequate for success in information seeking part of my thesis.
52. I am embarrassed that I do not know how to use the Internet for seeking information.
52. I feel anxious when seeking for information in the university library.
53. It is hard for me to get to the university library for seeking information.
54. The university library is so big that it overwhelms me.
55. The furniture in university library is uncomfortable and makes me feel uneasy.
56. Inadequate library lighting makes me feel uneasy when using the university library for
seeking information resources.
57. The temperature in the university library is uncomfortable that I cannot get my
information seeking done.
58. Disturbance caused by noise makes me anxious when seeking information in university
library.
59. The university library has too many confusing policies and procedures for postgraduate
students.
60. The university librarian and library staff do not have time to help me in searching for
information resources.

403
61. I feel uncomfortable asking for help from library staff during information seeking.
62. The university library does not offer enough information services for postgraduate
students.
63. I am not comfortable using university library services for seeking information
resources.
64. I feel anxious when searching for information resources in the university library
website.
65. When I use the university library Online Public Access Catalogue (OPAC) for seeking
information resources, I feel frustrated.
66. I can do all my research using online resources without need to go to the university
library.
67. I would rather use the library than internet and online resources for seeking
information.
68. The academic library is an important part of my research.
69. I think my ability to use the university library has affected my research negatively.
70. My library skills are not adequate for success in information seeking part of my
research.
71. My previous experiences with the university library affect my feelings negatively when
I use the university library for seeking information.
72. I feel anxious and frustrated when searching for information resources related to my
research.
73. I feel anxious from the beginning to the end of the information seeking process.
74. I am embarrassed that I do not know how to find information resources for my
research.
75. I am worried about not being able to find necessary information resources during the
information seeking process.
76. I feel anxious when I need information related to my research.
77. I am not sure how to start seeking for information.
78. Selecting a general topic is a difficult part of the information seeking process.
79. I feel anxious when selecting a search term for seeking information related to my
research.
80. Exploring information on general topic for finding a focus makes me anxious.

404
81. Narrowing the research topic down to develop a focused topic is not easy make me
frustrated.
82. Gathering information related to my specific topic is a difficult part information
seeking process.
83. I feel disappointed with the information found during the information seeking process.
84. I am unsure about how to complete the information seeking process.
85. I usually know when I have enough information to complete the information seeking
process.
86. I feel satisfied with the information found during information seeking process.
87. Time limitations for seeking information resources make me anxious.
88. I feel frustrated if I cannot find necessary information within a few minutes.
89. Have to pay for access to information resources makes my anxious.
90. I feel anxious during information seeking process because of my previous negative
experiences.
91. Seeking information in a language which is not my native language makes me anxious.
92. Finding helpful resource in a language which I do not understand makes me anxious.

405
APPENDIX F
PILOT INSTRUMENT

406
Dear Sir/ Madam,
QUESTIONNAIRE ON INFORMATION SEEKING ANXIETY AMONG
POSTGRADUATE STUDENTS IN MALAYSIA
I am Mohammadamin Erfanmanesh, a postgraduate student at the Faculty of Computer
Science and Information Technology, University of Malaya. I am currently undertaking my
doctoral research project as part of the requirements for the degree of Doctor of Philosophy
in the area of Library and Information Science. This questionnaire is part of a study to
investigate the information seeking anxiety among postgraduate students at research
intensive universities in Malaysia. Your input is valuable for the researcher to find out the
dimensions of information seeking anxiety and factors associated with this phenomenon.
The information you provide here will be used only for academic research purposes.
None of this information will be disclosed to any individual or organization.
Should you have any question do not hesitate to contact the researcher at: 017-2213053 or
e-mail: [email protected].
Your cooperation in completing the attached survey instrument is highly appreciated.
Thank you
Yours Sincerely,
Amin Erfanmanesh
PhD Student
Department of Information Science
Faculty of Computer Science & Information Technology
University of Malaya

407
Demographic Information Form
Please provide the appropriate response or information in the blanks provided
Gender: Female Male
Age: …
Discipline: Art, Humanities, Social Science Pure Sciences Engineering
Medicine
Level of Study: Master PhD
Nationality: Malaysian Non-Malaysian
On average, how often do you use the university library
for seeking information resources? (Times per week)
On average, how often do you use the Internet for seeking
information resources? (Hours per week)
Have you ever participated in information literacy skills
instruction sessions which held in the university library?
Yes No
Information Seeking Anxiety Scale (ISAS)
Please answer the following questions regarding your feelings during information
seeking process of your research. Please circle the number that most closely matches your
feelings about the statement using the following key:
1= Strongly Disagree 2= Disagree 3= Undecided 4= Agree 5=Strongly Agree
1. I cannot find enough information resources for my research
during information seeking process.
1 2 3 4 5
2. There are very limited possible information resources in my area
of research.
1 2 3 4 5
3. I feel anxious about the insufficient information resources in my
area of research during information seeking process.
1 2 3 4 5
4. There are too many information resources available in my area of
research, and I am sure I will miss something important.
1 2 3 4 5

408
5. I feel anxious by the amount of information resources in my area
of research.
1 2 3 4 5
6. I usually find too much information for my research during
information seeking process.
1 2 3 4 5
7. I feel anxious when retrieved information resources are too
scattered.
1 2 3 4 5
8. I do not know what information resources are available in my
area of research.
1 2 3 4 5
9. Unavailability of required information resources make me
anxious during information seeking process.
1 2 3 4 5
10. I feel anxious when I know useful information resource, but I
do not have access to them.
1 2 3 4 5
11. I cannot usually access information resources which I need for
my research.
1 2 3 4 5
12. Locating information resources make me anxious during the
information seeking process.
1 2 3 4 5
13. Restricted access to the required full text resources make me
anxious during the information seeking process.
1 2 3 4 5
14. I feel anxious when special equipments are required to have
access to information resources during the information seeking
process.
1 2 3 4 5
15. I feel anxious when special skills are required to access
information resources during the information seeking process.
1 2 3 4 5
16. I feel frustrated when information resources found during the
information seeking process are not easy to use.
1 2 3 4 5
17. Making judgment of the quality of information resources make
me anxious during information seeking process.
1 2 3 4 5
18. I feel anxious when the quality of the retrieved information
resources is unreliable.
1 2 3 4 5
19. Finding poor quality information resources during the
information seeking process make me frustrated.
1 2 3 4 5
20. Making judgment of the relevancy of retrieved information 1 2 3 4 5

409
resources make me anxious during information seeking process.
21. I feel anxious when resources found during the information
seeking process are irrelevant.
1 2 3 4 5
22. I feel anxious when what is retrieved during the information
seeking process is not up-to-date.
1 2 3 4 5
23. The unfamiliarity with the format of information resources
makes me anxious when searching for information.
1 2 3 4 5
24. I feel anxious when I find too many unfamiliar information
resources during information seeking process.
1 2 3 4 5
25. I am not comfortable using printed resources during information
seeking process.
1 2 3 4 5
26. I feel uncomfortable using electronic resources when seeking
information.
1 2 3 4 5
27. I do not feel comfortable using online resources when seeking
information.
1 2 3 4 5
28. When I use computers to find information resources, I feel
frustrated.
1 2 3 4 5
29. When I try to use computers for seeking information resources,
I feel frustrated.
1 2 3 4 5
30. I think computers are useful devices for seeking information
resources.
1 2 3 4 5
31. The computers do not play an important role in my information
seeking process.
1 2 3 4 5
32. The insufficient number of computers in the library or school is
a source of frustration for me.
1 2 3 4 5
33. The computers are not located in a convenient place in library
or school.
1 2 3 4 5
34. I feel fear of damaging computers or other machines when
using them for seeking information.
1 2 3 4 5
35. I feel fear of making mistakes that cause system malfunction
during the information seeking process.
1 2 3 4 5
36. Unknown computer errors make me anxious during information 1 2 3 4 5

410
seeking process.
37. Any mechanical or technological issues cause anxiety when
searching for information resources.
1 2 3 4 5
38. Rapid changes in hardware and software technologies make me
anxious when searching for information resources.
1 2 3 4 5
39. I feel anxious when different computer technologies are
required to retrieve the needed information resources.
1 2 3 4 5
40. My computer skills are not adequate for success in information
seeking part of my research.
1 2 3 4 5
41. I am embarrassed that I do not know how to use computers for
seeking information resources.
1 2 3 4 5
42. I feel overwhelmed when seeking information on the web. 1 2 3 4 5
43. I feel anxious when searching the World Wide Web for
information related to my research.
1 2 3 4 5
44. I feel anxious when I cannot find necessary information on the
World Wide Web.
1 2 3 4 5
45. When seeking information for my research, I always start by
searching internet resources.
1 2 3 4 5
46. The Internet plays an important role in my information seeking
process.
1 2 3 4 5
47. I feel anxious because the lack of stability of Internet contents. 1 2 3 4 5
48. Slow Internet connection makes me anxious when I searching
for information resources in the World Wide Web.
1 2 3 4 5
49. Slow downloading of pages and files makes me anxious when I
seeking for information.
1 2 3 4 5
50. Overwhelming unknown Internet jargons and vocabulary makes
me anxious during information seeking process.
1 2 3 4 5
51. My Internet skills are not adequate for success in information
seeking part of my thesis.
1 2 3 4 5
52. I am embarrassed that I do not know how to use the Internet for
seeking information.
1 2 3 4 5
53. I feel anxious when seeking for information in the university 1 2 3 4 5

411
library.
54. It is hard for me to get to the university library for seeking
information.
1 2 3 4 5
55. The university library is so big that it overwhelms me . 1 2 3 4 5
56. The furniture in university library is uncomfortable and makes
me feel uneasy.
1 2 3 4 5
57. Inadequate library lighting makes me feel uneasy when using
the university library for seeking information resources.
1 2 3 4 5
58. The temperature in the university library is uncomfortable that I
cannot get my information seeking done.
1 2 3 4 5
59. Disturbance caused by noise makes me anxious when seeking
information in university library.
1 2 3 4 5
60. The university library has too many confusing policies and
procedures for postgraduate students.
1 2 3 4 5
61. The university librarian and library staff do not have time to
help me in searching for information resources.
1 2 3 4 5
62. I feel uncomfortable asking for help from library staff during
information seeking.
1 2 3 4 5
63. The university library does not offer enough information
services for postgraduate students.
1 2 3 4 5
64. I am not comfortable using university library services for
seeking information resources.
1 2 3 4 5
65. I feel anxious when searching for information resources in the
university library website.
1 2 3 4 5
66. When I use the university library Online Public Access
Catalogue (OPAC) for seeking information resources, I feel
frustrated.
1 2 3 4 5
67. I can do all my research using online resources without need to
go to the university library.
1 2 3 4 5
68. I would rather use the library than internet and online resources
for seeking information.
1 2 3 4 5
69. The academic library is an important part of my research. 1 2 3 4 5

412
70. I think my ability to use the university library has affected my
research negatively.
1 2 3 4 5
71. My library skills are not adequate for success in information
seeking part of my research.
1 2 3 4 5
72. My previous experiences with the university library affect my
feelings negatively when I use the university library for seeking
information.
1 2 3 4 5
73. I feel anxious and frustrated when searching for information
resources related to my research.
1 2 3 4 5
74. I feel disappointed with the information found during the
information seeking process.
1 2 3 4 5
75. I am embarrassed that I do not know how to find information
resources for my research.
1 2 3 4 5
76. I am worried about not being able to find necessary information
resources during the information seeking process.
1 2 3 4 5
77. I feel anxious when I need information related to my research. 1 2 3 4 5
78. I am not sure how to start seeking for information. 1 2 3 4 5
79. Selecting a general topic is a difficult part of the information
seeking process.
1 2 3 4 5
80. I feel anxious when selecting a search term for seeking
information related to my research.
1 2 3 4 5
81. Exploring information on general topic for finding a focus
makes me anxious.
1 2 3 4 5
82. Narrowing the research topic down to develop a focused topic is
not easy make me frustrated.
1 2 3 4 5
83. Gathering information related to my specific topic is a difficult
part information seeking process.
1 2 3 4 5
84. I feel disappointed with the information found during
information seeking process.
1 2 3 4 5
85. I am unsure about how to complete the information seeking
process.
1 2 3 4 5
86. I usually know when I have enough information to complete the 1 2 3 4 5

413
information seeking process.
87. I feel satisfied with the information found during information
seeking process.
1 2 3 4 5
88. Time limitations for seeking information resources makes me
anxious.
1 2 3 4 5
89. I feel frustrated if I cannot find necessary information within a
few minutes.
1 2 3 4 5
90. Have to pay for access to information resources makes my
anxious.
1 2 3 4 5
91. I feel anxious during information seeking process because of
my previous negative experiences.
1 2 3 4 5
92. Seeking information in a language which is not my native
language makes me anxious.
1 2 3 4 5
93. Finding helpful resource in a language which I do not
understand makes me anxious.
1 2 3 4 5

414
APPENDIX G
EXPLORATORY FACTOR ANALYSIS
(FIRST PILOT STUDY)

415
Number
Item
Factors
1 2 3 4 5 6 7
1 71 0.718
2 83 0.714
3 80 0.702
4 75 0.673
5 79 0.670
6 81 0.666
7 84 0.647
8 76 0.640
9 74 0.637
10 72 0.593
11 91 0.577
12 78 0.567
13 77 0.539
14 55 0.532
15 85 0.513
16 70 0.483
17 44 0.455
18 52 0.451
19 82 0.445
20 61 0.444
21 89 0.430
22 50 0.416
23 66 0.399
24 92 0.377
25 40 0.374
26 38 0.644
27 10 0.637
28 13 0.548
29 16 0.546
30 9 0.544

416
31 15 0.536
32 14 0.524
33 21 0.524
34 7 0.522
35 12 0.499
36 49 0.486
37 41 0.484
38 19 0.472
39 18 0.470
40 20 0.407
41 39 0.397
42 68 0.640
43 35 0.638
44 34 0.624
45 51 0.606
46 45 0.570
47 11 0.467
48 47 0.423
49 27 0.414
50 42 0.392
51 17 0.388
52 26 0.376
53 32 0.331
54 43 0.312
55 90 0.630
56 37 0.623
57 23 0.613
58 36 0.557
59 88 0.556
60 93 0.523
61 24 0.500
62 62 0.469

417
63 22 0.409
64 4 0.732
65 6 0.726
66 2 0.683
67 1 0.658
68 3 0.586
69 5 0.462
70 25 0.445
71 73 0.441
72 48 0.418
73 86 0.415
74 67 0.399
75 53 0.397
76 29 0.351
77 56 0.730
78 33 0.693
79 57 0.610
80 54 0.592
81 58 0.540
82 60 0.528
83 59 0.473
84 63 0.440
85 64 0.321
86 46 0.619
87 30 0.436
88 8 0.397
89 31 0.395
90 87
91 65
92 69
93 28

418
APPENDIX H
EXPLORATORY FACTOR ANALYSIS
(SECOND PILOT STUDY)

419
Number
Item
Factors
1 2 3 4 5 6 7
1 60 0.718
2 63 0.690
3 56 0.657
4 61 0.601
5 64 0.585
6 66 0.552
7 72 0.466
8 58 0.450
9 57 0.444
10 65 0.441
11 18 0.698
12 19 0.647
13 21 0.641
14 22 0.573
15 16 0.512
16 23 0.460
17 12 0.452
18 26 0.752
19 43 0.719
20 28 0.590
21 31 0.442
22 38 0.745
23 39 0.671
24 37 0.639
25 34 0.572
26 35 0.433
27 48 0.421
28 73 0.679
29 75 0.653
30 76 0.582

420
31 77 0.570
32 84 0.525
33 79 0.825
34 80 0.792
35 82 0.642
36 13 0.774
37 10 0.684
38 14 0.613
39 11 0.477
40 15 0.418
41 1
42 2
43 3
44 4
45 5
46 6
47 7
48 8
49 9
50 17
51 20
52 24
53 25
54 27
55 29
56 30
57 32
58 33
59 36
60 40
61 41
62 42

421
63 44
64 45
65 46
66 47
67 49
68 50
69 51
70 52
71 53
72 54
73 55
74 59
75 62
76 67
77 68
78 69
79 70
80 71
81 74
82 78
83 81
84 83
85 85
86 86
87 87
88 88
89 89
90 90
91 91
92 92
93 93
422
APPENDIX I
THE INFORMATION SEEKING ANXIETY SCALE
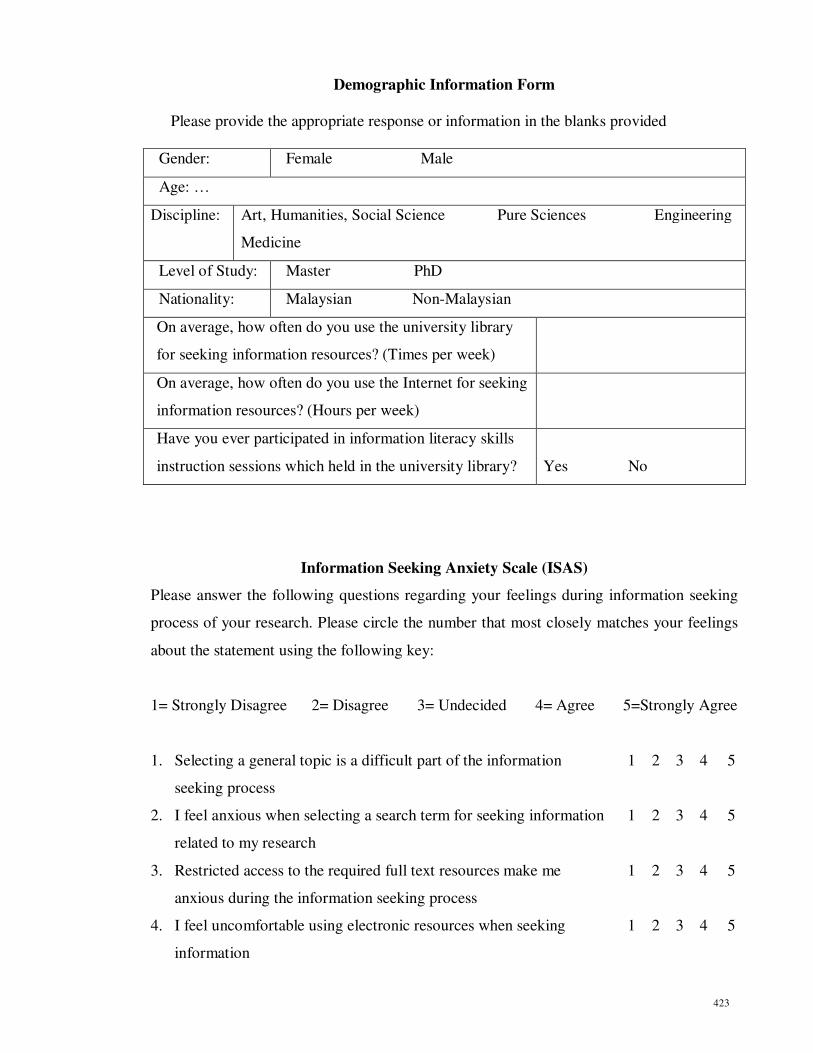
423
Demographic Information Form
Please provide the appropriate response or information in the blanks provided
Gender: Female Male
Age: …
Discipline: Art, Humanities, Social Science Pure Sciences Engineering
Medicine
Level of Study: Master PhD
Nationality: Malaysian Non-Malaysian
On average, how often do you use the university library
for seeking information resources? (Times per week)
On average, how often do you use the Internet for seeking
information resources? (Hours per week)
Have you ever participated in information literacy skills
instruction sessions which held in the university library?
Yes No
Information Seeking Anxiety Scale (ISAS)
Please answer the following questions regarding your feelings during information seeking
process of your research. Please circle the number that most closely matches your feelings
about the statement using the following key:
1= Strongly Disagree 2= Disagree 3= Undecided 4= Agree 5=Strongly Agree
1. Selecting a general topic is a difficult part of the information
seeking process
1 2 3 4 5
2. I feel anxious when selecting a search term for seeking information
related to my research
1 2 3 4 5
3. Restricted access to the required full text resources make me
anxious during the information seeking process
1 2 3 4 5
4. I feel uncomfortable using electronic resources when seeking
information
1 2 3 4 5
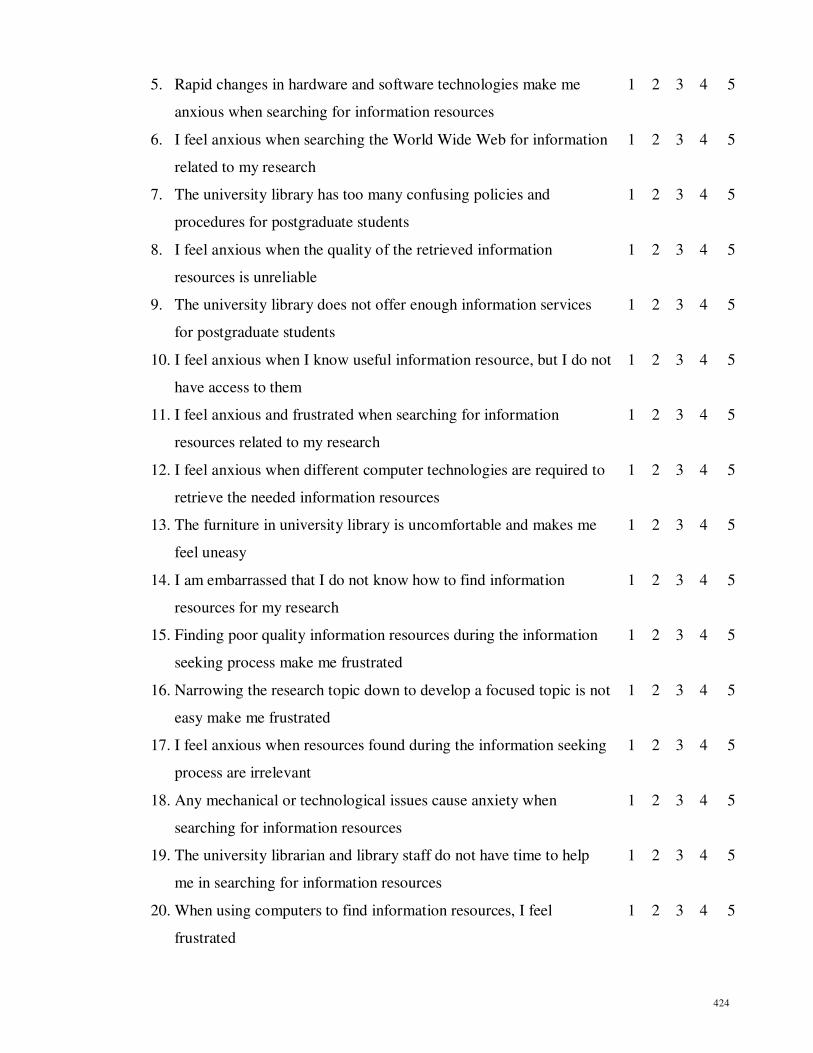
424
5. Rapid changes in hardware and software technologies make me
anxious when searching for information resources
1 2 3 4 5
6. I feel anxious when searching the World Wide Web for information
related to my research
1 2 3 4 5
7. The university library has too many confusing policies and
procedures for postgraduate students
1 2 3 4 5
8. I feel anxious when the quality of the retrieved information
resources is unreliable
1 2 3 4 5
9. The university library does not offer enough information services
for postgraduate students
1 2 3 4 5
10. I feel anxious when I know useful information resource, but I do not
have access to them
1 2 3 4 5
11. I feel anxious and frustrated when searching for information
resources related to my research
1 2 3 4 5
12. I feel anxious when different computer technologies are required to
retrieve the needed information resources
1 2 3 4 5
13. The furniture in university library is uncomfortable and makes me
feel uneasy
1 2 3 4 5
14. I am embarrassed that I do not know how to find information
resources for my research
1 2 3 4 5
15. Finding poor quality information resources during the information
seeking process make me frustrated
1 2 3 4 5
16. Narrowing the research topic down to develop a focused topic is not
easy make me frustrated
1 2 3 4 5
17. I feel anxious when resources found during the information seeking
process are irrelevant
1 2 3 4 5
18. Any mechanical or technological issues cause anxiety when
searching for information resources
1 2 3 4 5
19. The university librarian and library staff do not have time to help
me in searching for information resources
1 2 3 4 5
20. When using computers to find information resources, I feel
frustrated
1 2 3 4 5
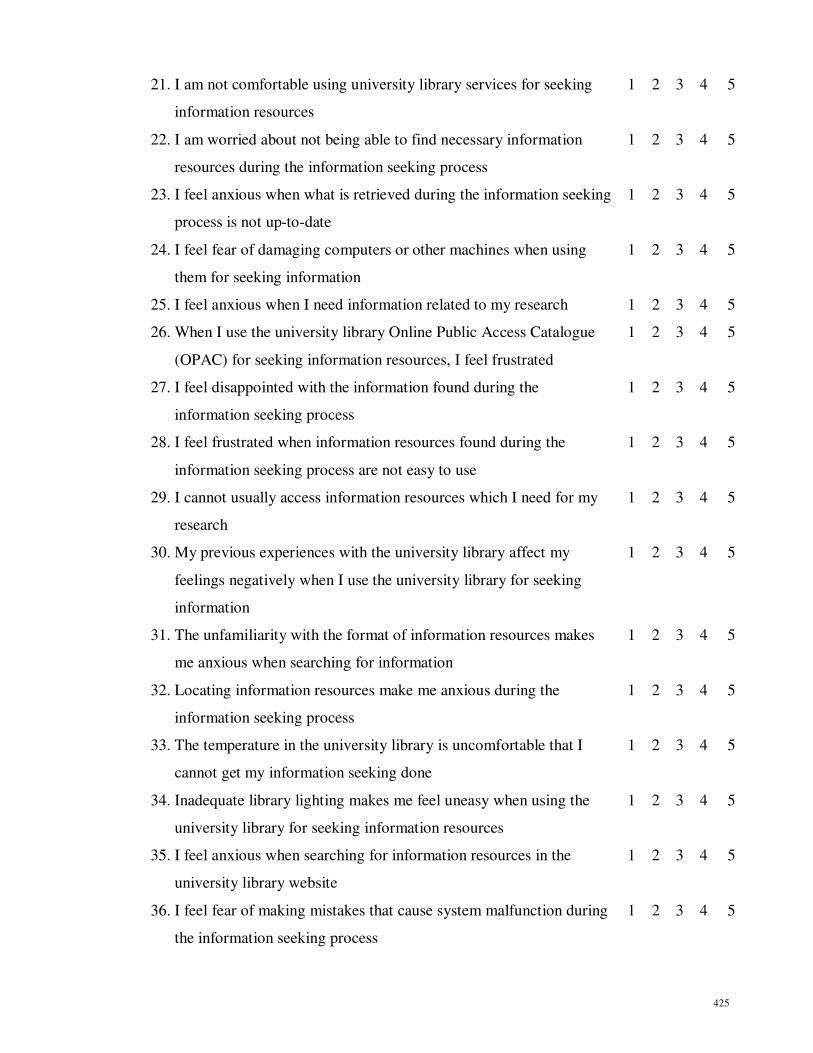
425
21. I am not comfortable using university library services for seeking
information resources
1 2 3 4 5
22. I am worried about not being able to find necessary information
resources during the information seeking process
1 2 3 4 5
23. I feel anxious when what is retrieved during the information seeking
process is not up-to-date
1 2 3 4 5
24. I feel fear of damaging computers or other machines when using
them for seeking information
1 2 3 4 5
25. I feel anxious when I need information related to my research 1 2 3 4 5
26. When I use the university library Online Public Access Catalogue
(OPAC) for seeking information resources, I feel frustrated
1 2 3 4 5
27. I feel disappointed with the information found during the
information seeking process
1 2 3 4 5
28. I feel frustrated when information resources found during the
information seeking process are not easy to use
1 2 3 4 5
29. I cannot usually access information resources which I need for my
research
1 2 3 4 5
30. My previous experiences with the university library affect my
feelings negatively when I use the university library for seeking
information
1 2 3 4 5
31. The unfamiliarity with the format of information resources makes
me anxious when searching for information
1 2 3 4 5
32. Locating information resources make me anxious during the
information seeking process
1 2 3 4 5
33. The temperature in the university library is uncomfortable that I
cannot get my information seeking done
1 2 3 4 5
34. Inadequate library lighting makes me feel uneasy when using the
university library for seeking information resources
1 2 3 4 5
35. I feel anxious when searching for information resources in the
university library website
1 2 3 4 5
36. I feel fear of making mistakes that cause system malfunction during
the information seeking process
1 2 3 4 5

426
37. Slow Internet connection makes me anxious when I searching for
information resources in the World Wide Web
1 2 3 4 5
38. I feel anxious when special skills are required to access information
resources during the information seeking process
1 2 3 4 5