chapter six probability sir naseer shahzada. there is a 99% chance we’ll do… …in today’s...
TRANSCRIPT

Chapter Six
ProbabilitySir Naseer Shahzada

There is a 99% chance we’ll do…
…in today’s class !

Random Experiment…
…a random experiment is an action or process that leads to one of several possible outcomes. For example:
Experiment Outcomes
Flip a coin Heads, Tails
Exam Marks Numbers: 0, 1, 2, ..., 100
Assembly Time t > 0 seconds
Course Grades F, D, C, B, A, A+
Probabilities…
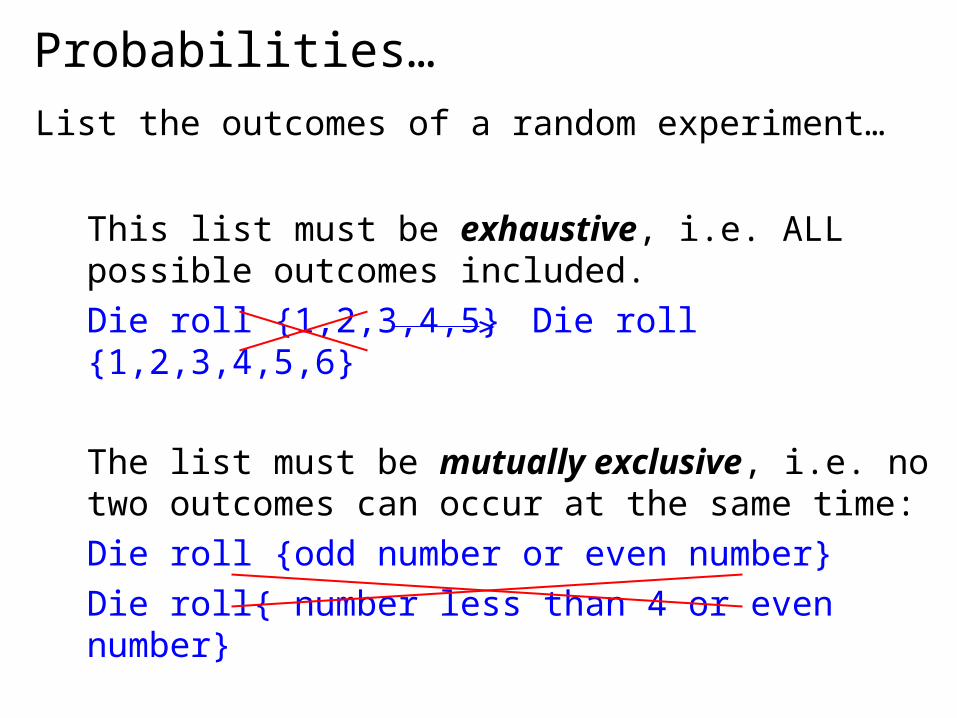
List the outcomes of a random experiment…
This list must be exhaustive, i.e. ALL possible outcomes included.
Die roll {1,2,3,4,5} Die roll {1,2,3,4,5,6}
The list must be mutually exclusive, i.e. no two outcomes can occur at the same time:
Die roll {odd number or even number}
Die roll{ number less than 4 or even number}
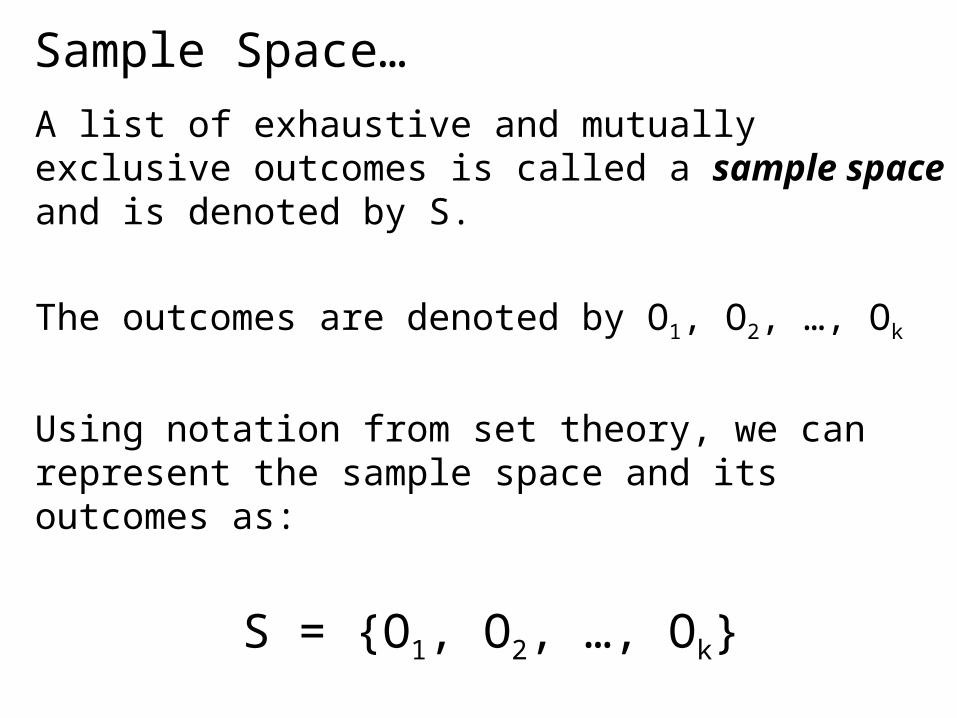
Sample Space…
A list of exhaustive and mutually exclusive outcomes is called a sample space and is denoted by S.
The outcomes are denoted by O1, O2, …, Ok
Using notation from set theory, we can represent the sample space and its outcomes as:
S = {O1, O2, …, Ok}

Requirements of Probabilities…
Given a sample space S = {O1, O2, …, Ok}, the probabilities assigned to the outcome must satisfy these requirements:
(1) The probability of any outcome is between 0 and 1
i.e. 0 ≤ P(Oi) ≤ 1 for each i, and
(2) The sum of the probabilities of all the outcomes equals 1
i.e. P(O1) + P(O2) + … + P(Ok) = 1
P(Oi) represents the probability of outcome i

Approaches to Assigning Probabilities…There are three ways to assign a probability, P(Oi), to an outcome, Oi, namely:
Classical approach: make certain assumptions (such as equally likely, independence) about situation.
Relative frequency: assigning probabilities based on experimentation or historical data.
Subjective approach: Assigning probabilities based on the assignor’s judgment.

Classical Approach…
If an experiment has n possible outcomes, this method would assign a probability of 1/n to each outcome.
Experiment: Rolling a die
Sample Space: S = {1, 2, 3, 4, 5, 6}
Probabilities: Each sample point has a 1/6 chance of occurring.

Classical Approach…
Experiment: Rolling dice
Sample Space: S = {2, 3, …, 12}
Probability Examples:
P(2) = 1/36
P(7) = 6/36
P(10) = 3/36
1 2 3 4 5 6
1 2 3 4 5 6 7
2 3 4 5 6 7 8
3 4 5 6 7 8 9
4 5 6 7 8 9 10
5 6 7 8 9 10 11
6 7 8 9 10 11 12
What are the underlying, unstated
assumptions??

Relative Frequency Approach…
Bits & Bytes Computer Shop tracks the number of desktop computer systems it sells over a month (30 days):
For example,
10 days out of 30
2 desktops were sold.
From this we can construct
the probabilities of an event
(i.e. the # of desktop sold on a given day)…
Desktops Sold # of Days
0 1
1 2
2 10
3 12
4 5

Relative Frequency Approach…
“There is a 40% chance Bits & Bytes will sell 3 desktops on any given day”
Desktops Sold # of Days Desktops Sold
0 1 1/30 = .03
1 2 2/30 = .07
2 10 10/30 = .33
3 12 12/30 = .40
4 5 5/30 = .17
∑ = 1.00

Subjective Approach…“In the subjective approach we define probability as the degree of belief that we hold in the occurrence of an event”
E.g. weather forecasting’s “P.O.P.”“Probability of Precipitation” (or P.O.P.) is defined in different ways by different forecasters, but basically it’s a subjective probability based on past observations combined with current weather conditions.
POP 60% – based on current conditions, there is a 60% chance of rain (say).

Events & Probabilities…
An individual outcome of a sample space is called a simple event, while
An event is a collection or set of one or more simple events in a sample space.
Roll of a die: S = {1, 2, 3, 4, 5, 6}
Simple event: the number “3” will be rolled
Event: an even number (one of 2, 4, or 6) will be rolled

Events & Probabilities…
The probability of an event is the sum of the probabilities of the simple events that constitute the event.
E.g. (assuming a fair die) S = {1, 2, 3, 4, 5, 6} and
P(1) = P(2) = P(3) = P(4) = P(5) = P(6) = 1/6
Then:
P(EVEN) = P(2) + P(4) + P(6) = 1/6 + 1/6 + 1/6 = 3/6 = 1/2

Interpreting Probability…
One way to interpret probability is this:
If a random experiment is repeated an infinite number of times, the relative frequency for any given outcome is the probability of this outcome.
For example, the probability of heads in flip of a balanced coin is .5, determined using the classical approach. The probability is interpreted as being the long-term relative frequency of heads if the coin is flipped an infinite number of times.

Joint, Marginal, Conditional Probability…We study methods to determine probabilities of events that result from combining other events in various ways.
There are several types of combinations and relationships between events:•Complement of an event•Intersection of two events•Union of two events

Example 6.1…
Why are some mutual fund managers more successful than others? One possible factor is where the manager earned his or her MBA. The following table compares mutual fund performance against the ranking of the school where the fund manager earned their MBA:
Venn Diagrams
Mutual fund outperforms the market
Mutual fund doesn’t outperform the market
Top 20 MBA program .11 .29
Not top 20 MBA program .06 .54
E.g. This is the probability that a mutual fund outperforms AND the manager was in a top-20 MBA program; it’s a joint probability.

Example 6.1…
Alternatively, we could introduce shorthand notation to represent the events:
A1 = Fund manager graduated from a top-20 MBA program
A2 = Fund manager did not graduate from a top-20 MBA program
B1 = Fund outperforms the market
B2 = Fund does not outperform the market
B1 B2
A1.11 .29
A2.06 .54
E.g. P(A2 and B1) = .06= the probability a fund outperforms the marketand the manager isn’t from a top-20 school.

Marginal Probabilities…
Marginal probabilities are computed by adding across rows and down columns; that is they are calculated in the margins of the table:
B1 B2 P(Ai)
A1.11 .29 .40
A2.06 .54 .60
P(Bj) .17 .83 1.00
P(B1) = .11 + .06
P(A2) = .06 + .54
“what’s the probability a fundoutperforms the market?”
“what’s the probability a fundmanager isn’t from a top school?”
BOTH margins must add to 1(useful error check)

Conditional Probability…
Conditional probability is used to determine how two events are related; that is, we can determine the probability of one event given the occurrence of another related event.
Conditional probabilities are written as P(A | B) and read as “the probability of A given B” and is calculated as:

Conditional Probability…
Again, the probability of an event given that another event has occurred is called a conditional probability…
Note how “A given B” and “B given A” are related…

Conditional Probability…
Example 6.2 • What’s the probability that a fund will outperform the market given that the manager graduated from a top-20 MBA program?
Recall:
A1 = Fund manager graduated from a top-20 MBA program
A2 = Fund manager did not graduate from a top-20 MBA program
B1 = Fund outperforms the market
B2 = Fund does not outperform the market
Thus, we want to know “what is P(B1 | A1) ?”

Conditional Probability…
We want to calculate P(B1 | A1)
Thus, there is a 27.5% chance that that a fund will outperform the market given that the manager graduated from a top-20 MBA program.
B1 B2 P(Ai)
A1.11 .29 .40
A2.06 .54 .60
P(Bj) .17 .83 1.00

Independence…One of the objectives of calculating conditional probability is to determine whether two events are related.
In particular, we would like to know whether they are independent, that is, if the probability of one event is not affected by the occurrence of the other event.
Two events A and B are said to be independent ifP(A|B) = P(A)
orP(B|A) = P(B)

Independence…For example, we saw that
P(B1 | A1) = .275
The marginal probability for B1 is: P(B1) = 0.17
Since P(B1|A1) ≠ P(B1), B1 and A1 are not independent events.
Stated another way, they are dependent. That is, the probability of one event (B1) is affected by the occurrence of the other event (A1).

Union…
The union of two events is denoted is the event that occurs when either or both event occurs. It is denoted as:
A or B
We can use this concept to answer questions like:
Determine the probability that a fund outperforms the market or the manager graduated from a top-20 MBA program.

Union…Determine the probability that a fund outperforms (B1)
or the manager graduated from a top-20 MBA program (A1).
B1 B2 P(Ai)
A1.11 .29 .40
A2.06 .54 .60
P(Bj) .17 .83 1.00
A1 or B1 occurs whenever:
A1 and B1 occurs, A1 and B2 occurs, or A2 and B1 occurs…
P(A1 or B1) = .11 + .06 + .29 = .46

Union…Determine the probability that a fund outperforms (B1)
or the manager graduated from a top-20 MBA program (A1).
B1 B2 P(Ai)
A1.11 .29 .40
A2.06 .54 .60
P(Bj) .17 .83 1.00
P(A1 or B1) = .11 + .06 + .29 = .46
B1
A1

B1 B2 P(Ai)
A1.11 .29 .40
A2.06 .54 .60
P(Bj) .17 .83 1.00
B1
A1
Alternatively…
Take 100% and subtract off “when doesn’t A1 or B1 occur”?
i.e. at A2 and B2
P(A1 or B1) = 1 – P(A2 and B2) = 1 – .54 = .46

Probability Rules and Trees…
We introduce three rules that enable us to calculate the probability of more complex events from the probability of simpler events…
The Complement Rule
The Multiplication Rule
The Addition Rule

Complement Rule…
The complement of an event A is the event that occurs when A does not occur.
The complement rule gives us the probability of an event NOT occurring. That is:
P(AC) = 1 – P(A)
For example, in the simple roll of a die, the probability of the number “1” being rolled is 1/6. The probability that some number other than “1” will be rolled is 1 – 1/6 = 5/6.

Multiplication Rule…
The multiplication rule is used to calculate the joint probability of two events. It is based on the formula for conditional probability defined earlier:
If we multiply both sides of the equation by P(B) we have:
P(A and B) = P(A | B)•P(B)
Likewise, P(A and B) = P(B | A) • P(A)
If A and B are independent events, then P(A and B) = P(A)•P(B)

Example 6.5…
A graduate statistics course has seven male and three female students. The professor wants to select two students at random to help her conduct a research project. What is the probability that the two students chosen are female?
Let A represent the event that the first student is female
P(A) = 3/10 = .30
What about the second student?

Example 6.5…
Let B represent the event that the second student is female
P(B | A) = 2/9 = .22
That is, the probability of choosing a female student given that the first student chosen is 2 (females) / 9 (remaining students) = 2/9

Example 6.5…A graduate statistics course has seven male and three female students. The professor wants to select two students at random to help her conduct a research project. What is the probability that the two students chosen are female?
Thus, we want to answer the question: what is P(A and B) ?
P(A and B) = P(A)•P(B|A) = (3/10)(2/9) = 6/90 = .067
“There is a 6.7% chance that the professor will choose two female students from her grad class of 10.”

Example 6.6…
The professor in Example 6.5 is unavailable. Her replacement will teach two classes. His style is to select one student at random and pick on him or her in the class. What is the probability that the two students chosen are female?
Let A represent the event that the student picked at random in the first is female
P(A) = 3/10 = .30
What about the second class?

Example 6.5…
Let B represent the event that the second student is female. Because the same student in the first class can be picked again for the second class
P(B | A) = P(B) = 3/10 = .30

Example 6.6…What is the probability that the two students chosen are female?
Thus, we want to answer the question: what is P(A and B) ?
P(A and B) = P(A)•P(B) = (3/10)(3/10) = 9/100 = .09
“There is a 9% chance that the replacement professor will choose two female students from his two classes.”

Addition Rule…
Recall: the addition rule was introduced earlier to provide a way to compute the probability of event A or B or both A and B occurring; i.e. the union of A and B.
P(A or B) = P(A) + P(B) – P(A and B)
Why do we subtract the joint probability P(A and B) from the sum of the probabilities of A and B?
P(A or B) = P(A) + P(B) – P(A and B)

Addition Rule…P(A1) = .11 + .29 = .40
P(B1) = .11 + .06 = .17
By adding P(A) plus P(B) we add P(A and B) twice. To correct we subtract P(A and B) from P(A) + P(B)
B1 B2 P(Ai)
A1.11 .29 .40
A2.06 .54 .60
P(Bj) .17 .83 1.00
P(A1 or B1) = P(A) + P(B) –P(A and B) .40 + .17 - .11 = .46
B1
A1
Addition Rule for Mutually Excusive EventsIf and A and B are mutually exclusive the occurrence of one event makes the other one impossible. This means that
P(A and B) = 0
The addition rule for mutually exclusive events is
P(A or B) = P(A) + P(B)
We often use this form when we add some joint probabilities calculated from a probability tree

Example 6.7…
In a large city, two newspapers are published, the Sun and the Post. The circulation departments report that 22% of the city’s households have a subscription to the Sun and 35% subscribe to the Post. A survey reveals that 6% of all households subscribe to both newspapers. What proportion of the city’s households subscribe to either newspaper?
That is, what is the probability of selecting a household at random that subscribes to the Sun or the Post or both?
i.e. what is P(Sun or Post) ?

Example 6.7…In a large city, two newspapers are published, the Sun and the Post. The circulation departments report that 22% of the city’s households have a subscription to the Sun and 35% subscribe to the Post. A survey reveals that 6% of all households subscribe to both newspapers. What proportion of the city’s households subscribe to either newspaper?
P(Sun or Post) = P(Sun) + P(Post) – P(Sun and Post)= .22 + .35 – .06 = .51
“There is a 51% probability that a randomly selected household subscribes to one or the other or both papers”

Probability Trees…A probability tree is a simple and effective method of applying the probability rules by representing events in an experiment by lines. The resulting figure resembles a tree.: Recall Example 6.5
First selection Second selection
P(F) = 3/10
P( M) = 7/10P(F|M) = 3/9
P(F|F) = 2/9
P( M|M) = 6/9
P( M|F) = 7/9
This is P(F), the probability of selecting a female student first
This is P(F|F), the probability of selecting a female student second, given that a female was already chosen first

Probability Trees…
At the ends of the “branches”, we calculate joint probabilities as the product of the individual probabilities on the preceding branches.
First selection Second selection
P(F) = 3/10
P( M) = 7/10P(F|M) = 3/9
P(F|F) = 2/9
P( M|M) = 6/9
P( M|F) = 7/9
P(FF)=(3/10)(2/9)
P(FM)=(3/10)(7/9)
P(MF)=(7/10)(3/9)
P(MM)=(7/10)(6/9)
Joint probabilities

Probability Trees…
In Example 6.6 the tree and joint probabilites now look like:
FF
MF
MM
FMP(F) = 3/10
P( M) = 7/10 P(F|M) = 3/10
P(F|F) = 3/10
P( M|M) =7/10
P( M|F) = 7/10
P(FF)=(3/10)(3/10)
P(FM)=(3/10)(7/10)
P(MF)=(7/10)(3/10)
P(MM)=(7/10)(7/10)

3/9 + 6/9= 9/9 = 1
2/9 + 7/9= 9/9 = 1
3/10 + 7/10= 10/10 = 1
Probability Trees…
The probabilities associated with any set of branches from one “node” must add up to 1.00…
First selection Second selection
P(F) = 3/10
P( M) = 7/10P(F|M) = 3/9
P(F|F) = 2/9
P( M|M) = 6/9
P( M|F) = 7/9
Handy way to checkyour work !

Probability Trees…
Note: there is no requirement that the branches splits be binary, nor that the tree only goes two levels deep, or that there be the same number of splits at each sub node…
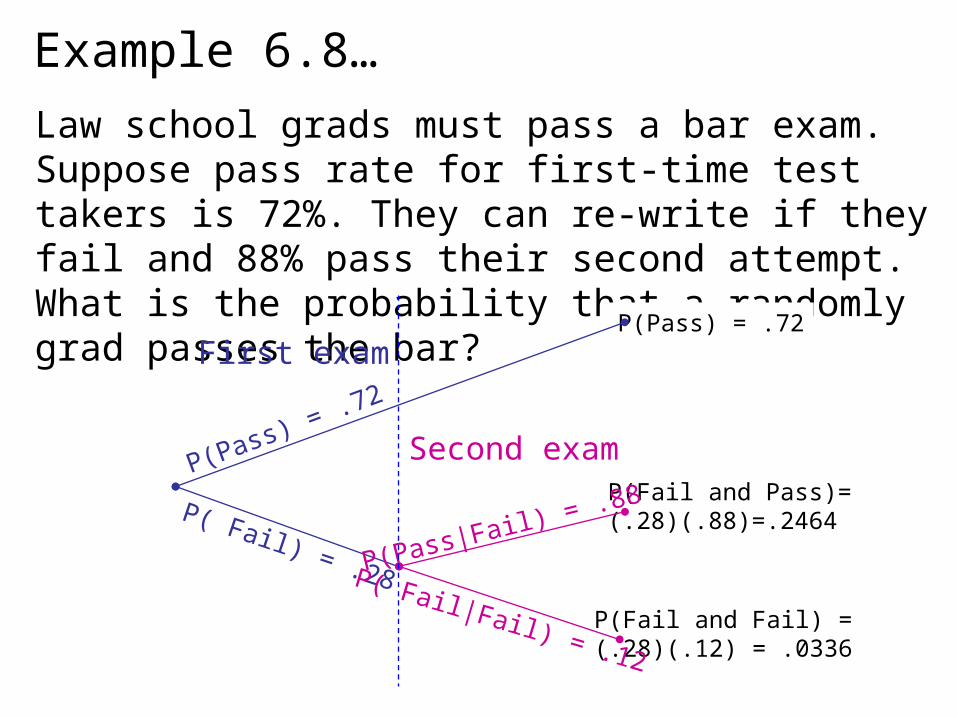
Example 6.8…
Law school grads must pass a bar exam. Suppose pass rate for first-time test takers is 72%. They can re-write if they fail and 88% pass their second attempt. What is the probability that a randomly grad passes the bar?
P(Pass) = .72
P(Fail and Pass)=(.28)(.88)=.2464
P(Fail and Fail) = (.28)(.12) = .0336
First exam
P(Pass) = .72
P( Fail) = .28
Second exam
P(Pass|Fail) = .88
P( Fail|Fail) = .12

Example 6.8…
What is the probability that a randomly grad passes the bar?
“There is almost a 97% chance they will pass the bar”
P(Pass) = P(Pass 1st) + P(Fail 1st and Pass 2nd) =
= 0.7200 + 0.2464 = .9664P(Pass) = .72
P(Fail and Pass)=(.28)(.88)=.2464
P(Fail and Fail) = (.28)(.12) = .0336
First exam
P(Pass) = .72
P( Fail) = .28
Second exam
P(Pass|Fail) = .88
P( Fail|Fail) = .12

Bayes’ Law…
Bayes’ Law is named for Thomas Bayes, an eighteenth century mathematician.
In its most basic form, if we know P(B | A),
we can apply Bayes’ Law to determine P(A | B)
P(B|A) P(A|B)
for example …

Example 6.9 – Pay $500 for MBA prep??A survey of MBA students revealed that among GMAT scorers above 650, 52% took a preparatory course, whereas among GMAT scorers of less than 650 only 23% took a preparatory course.
An applicant to an MBA program has determined that he needs a score of more than 650 to get into a certain MBA program, but he feels that his probability of getting that high a score is quite low: 10%. He is considering taking a preparatory course that cost $500. He is willing to do so only if his probability of achieving 650 or more doubles. What should he do?

Example 6.9 – Convert to Statistical NotationLet A = GMAT score of 650 or more,
hence AC = GMAT score less than 650
Our student has determined their probability of getting greater than 650 (without any prep course) as 10%, that is:
P(A) = .10
(and it follows that P(AC) = 1 – .10 = .90)

Example 6.9 – Convert to Statistical NotationLet B represent the event “take the prep course”
and thus, BC is “do not take the prep course”
From our survey information, we’re told that among GMAT scorers above 650, 52% took a preparatory course, that is:
P(B | A) = .52
(Probability of finding a student who took the prep course given that they scored above 650…)
But our student wants to know P(A | B), that is, what is the probability of getting more than 650 given that a prep course is taken?
If this probability is > 20%, he will spend $500 on the prep course.

Example 6.9 – Continued…
We are trying to determine P(A | B), perhaps the definition of conditional probability from earlier will assist us…
We don’t know P(A and B) and we don’t know P(B). Hmm.
Perhaps if we construct a probability tree…

Example 6.9 – Continued…
In order to go from
P(B | A) = 0.52 to P(A | B) = ??
we need to apply Bayes’ Law. Graphically:
Score ≥ 650 Prep Test
A .10
AC .90
B|A .52
BC|A .48
B|AC .23
BC|AC .77
A and B 0.052
A and BC 0.048
AC and B 0.207
AC and BC 0.693
Now we just need P(B) !

Example 6.9 – Continued…
In order to go from
P(B | A) = 0.52 to P(A | B) = ??
we need to apply Bayes’ Law. Graphically:
Score ≥ 650 Prep Test
A .10
AC .90
B|A .52
BC|A .48
B|AC .23
BC|AC .77
A and B 0.052
A and BC 0.048
AC and B 0.207
AC and BC 0.693
Marginal Prob.P(B) = P(A and B) +P(AC and B) = .259

Example 6.9 – FYI
Thus,
The probability of scoring 650 or better doubles to 20.1% when the prep course is taken.

Bayesian Terminology…
The probabilities P(A) and P(AC) are called prior probabilities because they are determined prior to the decision about taking the preparatory course.
The conditional probability P(A | B) is called a posterior probability (or revised probability), because the prior probability is revised after the decision about taking the preparatory course.