chapter twelve correlational research and multiple regressionmedia.usm.maine.edu/~jbeaudry/research...
TRANSCRIPT

1
CHAPTER TWELVE
CORRELATIONAL RESEARCH AND MULTIPLE REGRESSION
Chapter objectives:
• Understand that correlation does not mean causation
• Understand that correlations research may be explanatory or predictive.
• Understand the difference between bivariate and multivariate analysis
• Understand the purpose of explanatory correlational
research, predictive correlational research (regression
analysis), and factor analysis research.
• Understand how logistic regression, hierarchical linear
modelling, and causal modelling approaches are used in
correlational predictive studies.
• Understand what the statistical tests used in data analysis in
correlational research
2
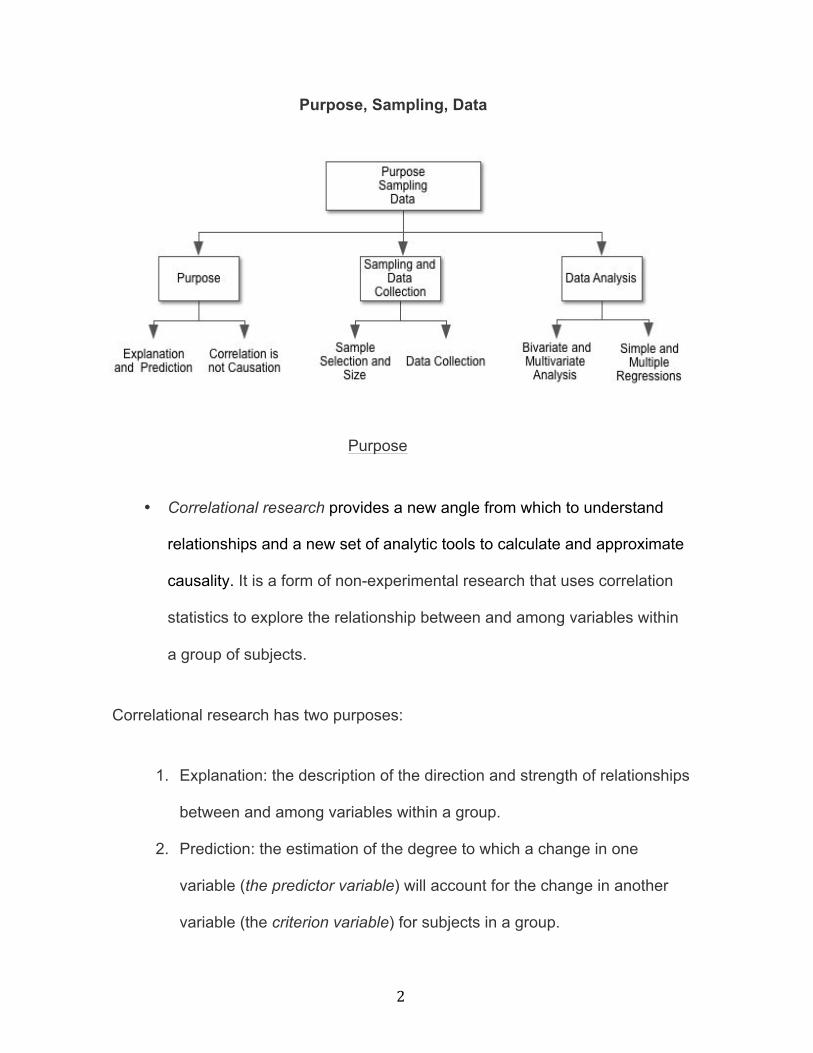
Purpose, Sampling, Data
Purpose
• Correlational research provides a new angle from which to understand
relationships and a new set of analytic tools to calculate and approximate
causality. It is a form of non-experimental research that uses correlation
statistics to explore the relationship between and among variables within
a group of subjects.
Correlational research has two purposes:
1. Explanation: the description of the direction and strength of relationships
between and among variables within a group.
2. Prediction: the estimation of the degree to which a change in one
variable (the predictor variable) will account for the change in another
variable (the criterion variable) for subjects in a group.

3
Though based on weaker causal inferences than experiments, correlational
research explores possible relationships in a way that experiments cannot.
Findings from correlational studies may be used to suggest ideas for treatments as
well as outcomes for experimental research.
Correlational research is non-experimental research and, as such, is similar
to non-experiments of group differences in several ways. Like non-experiments of
groups differences correlational research (1) is a non-experiment that cannot
confirm a casual relationship, even though it can be used to explore complex
causal relationships. “Correlation does not mean causation” is a mantra for
correlations, (2) does not involve an intervention or allow the researcher to
manipulate the independent variable, (3) uses inferential statistics to determine
statistical significance, (4) is evaluated on the basis of statistical conclusion validity
and external validity, (5) is used when experimental conditions cannot be met in
social settings or when it would be unethical to expose a group of subjects to a
dangerous treatment or deny them access to a promising one.
Sampling and Data Collection
Samples in correlation studies should be randomly selected from a target
population and described in detail. This enables the researcher to generalize
results to other subjects in the population and to similar samples. In addition, the
sample should be of adequate size to enable the researcher to apply the
appropriate statistics, In fact, the lager the sample, the better. Larger samples add
to representativeness and also help to reduce error.
4
The most commonly used data collection instruments are survey
questionnaires academic and psychological tests. These allow researchers to
investigate relationships between and among variables for one group. The data
may be archived or a collected for the purpose of the study. Measures with strong
construct validity and predictive validity are preferred.
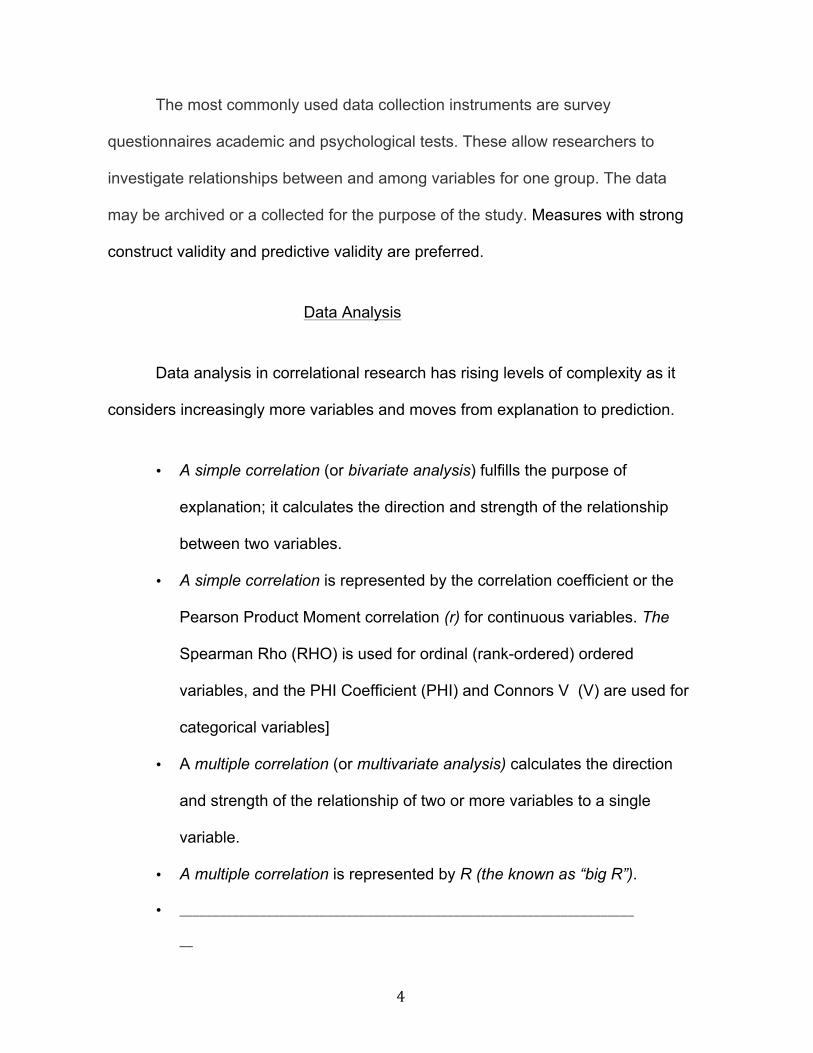
Data Analysis
Data analysis in correlational research has rising levels of complexity as it
considers increasingly more variables and moves from explanation to prediction.
• A simple correlation (or bivariate analysis) fulfills the purpose of
explanation; it calculates the direction and strength of the relationship
between two variables.
• A simple correlation is represented by the correlation coefficient or the
Pearson Product Moment correlation (r) for continuous variables. The
Spearman Rho (RHO) is used for ordinal (rank-ordered) ordered
variables, and the PHI Coefficient (PHI) and Connors V (V) are used for
categorical variables]
• A multiple correlation (or multivariate analysis) calculates the direction
and strength of the relationship of two or more variables to a single
variable.
• A multiple correlation is represented by R (the known as “big R”).
• ____________________________________________________________________
__

5
• A simple regression fulfills the purpose of prediction: it estimates the
degree to which a variable (called the predictor variable or PV) accounts
for change in another variable (called the criterion variable or CV).
• A simple regression It is represented by the coefficient of determination
(r2)
• A multiple regression predicts how a combination of predictor variables
accounts for change in a criterion variable.
• A multiple regression is represented by the correlation of determination
(R2: also known as “big R squared).”
Basic Designs
The most basic correlational designs use simple correlations and
regressions and multiple correlations and regressions. The two examples below
demonstrate how these designs work.
A Study of College Success
Most selective colleges use the SAT as a filter for admitting students. The
assumption is that the SAT is The Senate of the University of California at Santa

6
Cruz conducted a study of the relationship of SAT to freshman success, which they
operationalized as the GPA at the end of the freshman year at the university
(UCSCGPA).
Figure 1. SAT as PV (predictor): Freshman GAP as CV (criterion)
The results showed a weak positive correlation (r= .290) that was statistically
significant (p ≤ 0.00001).
The conclusion of this study might be presented as, “There is a significant
positive correlation between SAT scores and success in college.” While true in
fact, this statement overlooks an important consideration: a weak, statistically
significant correlation is still a weak correlation. In effect, this correlation is not
substantial enough to be important or useful; nor does it account for much in the
way of differences in freshman GPA, as evidenced by the simple regression
analyse that followed. The researchers calculated the variance (change) in the
freshman GPA (the criterion variable) that could be accounted for by the SAT I
(predictor variable). This required squaring the r (r 2 = .084). This means the SAT I
predicted 8.4% of the variance (or change) in freshman GP, leaving 93.6 % of the
variance unaccounted for.

7
To investigate further the predictors of college success, the researchers
added two more predictor variables (SAT II scores and high school GPA) and
conducted a multiple regression analysis.
Figure 2. PV’s = SAT I, SAT II, HSGPA CV= Freshman GPA
The first step in the analysis was to calculate the correlation of each PV to
the CV. The correlation matrix below shows these correlations.
UCSC GPA
SAT I
SAT II
HSGPA
UCSC GPA Pearson Sig
1.0
SAT I Pearson r Sig
0.290 0.000
1.000
SAT II Pearson r Sig
0.306 0.000
0.816 0.000
1.000
HSGPA Pearson r Sig
0.345 0.000
0.159 0.000
O. 220 0.000
1.000
Table 1. Correlation Matrix of UCSC GPA and SAT I. SAT II, HSGPA

8
To read the matrix, look across each row or look down each column. You will see
that there is a perfect correlation of UCSCGPA to itself, a weak correlation to SAT
II (r= .029), and a somewhat stronger correlation to SAT II ( r= .306), and the
strongest correlation to o HSGPA (r=0.345). Note that all of these correlations are
also statistically significant (p=.0000).
The next step was to calculate the Multiple Correlation, R = .425. The R is
not equal to the sum of the individual r- values; instead it is based on a complex
algorithm: To calculate the combined variance for the three-predictor variables, the
R was squared : R2 = .181. This means that together the three variables
accounted for 18.1% of the variance in freshman GPA. This is better than any one
criterion taken separately, but it still leaves 81.9% of the difference in freshman
GPA unaccounted for.
The researchers concluded that for UCSC freshmen: (1) The single best
predictor of first-year GPA was High School GPA, which accounted for 11.9% of
the variance (2) The next best predictor was SAT II scores, which accounted for
9.4% of the variance, (3) SAT I scores were the lowest predictor and accounted
8.4% of the variance respectively, and (4) The combination of all three of the
predictor variables explained more of the variance in freshman GPA then any of
the variables taken alone. Together they accounted for 18.1% of the UCSC
freshman GPA.
Predictors of Teacher Stress:
Adams (1991) conducted a more complex multiple regression study which
began with six predictor variables. Drawing the sample from vocational teachers in

9
one state, the researcher examined to what degree the variables could predict
teacher stress. The researcher selected these predictor variables after conducting
an extensive review of prior research.
PV’s= role preparation, job satisfaction, life satisfaction, illness symptoms,
locus of control, and self esteem
CV= teacher stress
In the first step of analysis, the researchers correlated each of the predictor
variables to the criterion variable. The figure below represents those correlations.
Figure 3. Simple correlations of PV’s to CV in Stress Study
As this figure shows, each predictor variable had a moderate to moderately
high correlation with teacher stress. One variable, locus of control, had a negative
correlation, r=-0.375, with teacher stress. That means that as the locus of control
10
goes up (feeling in control of yourself) teacher stress goes down. That is, “the less
control vocational teachers believe they have over the events that occur in their
lives, the more intense is their stress” (1999, p. 9)
In the next two steps, the researchers calculated the R (multiple correlation),
the combination of all predictor variables and then squared the R.
R = 0.746659
R2 = 55.75%.
This meant that almost 56% of the variance in stress was accounted for by the
combination of variables.
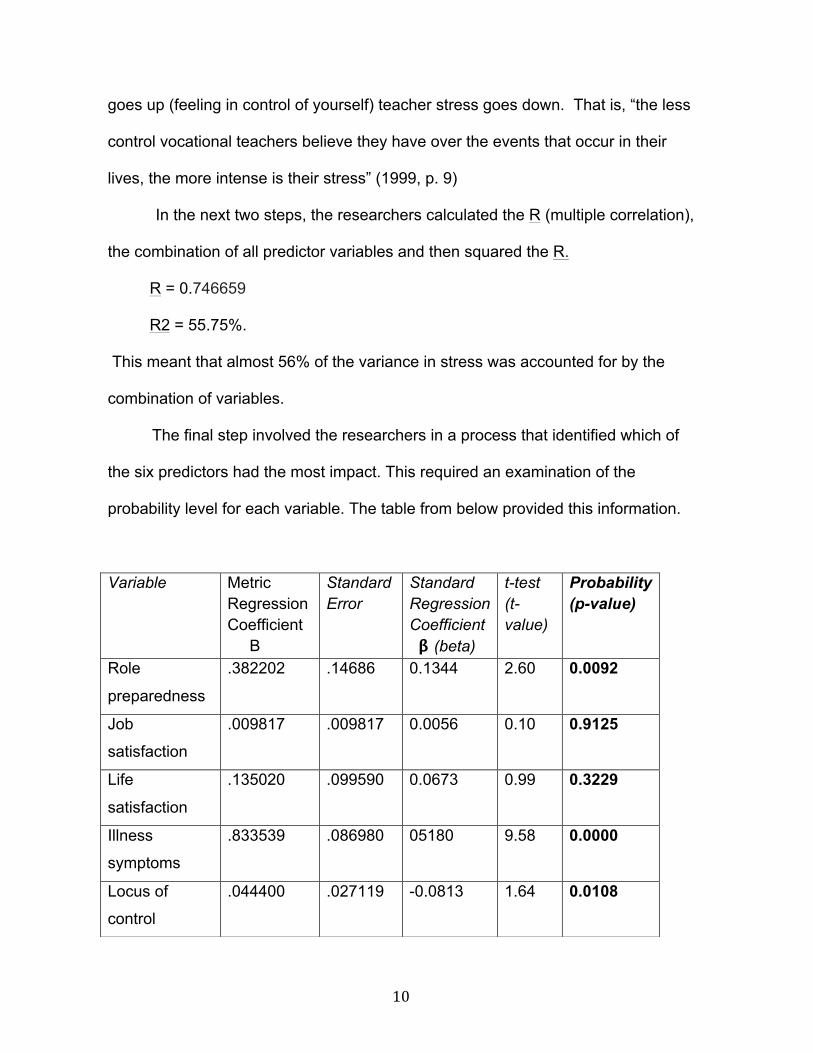
The final step involved the researchers in a process that identified which of
the six predictors had the most impact. This required an examination of the
probability level for each variable. The table from below provided this information.
Variable Metric Regression Coefficient B
Standard Error
Standard Regression Coefficient β (beta)
t-test (t-value)
Probability (p-value)
Role
preparedness
.382202 .14686 0.1344 2.60 0.0092
Job
satisfaction
.009817 .009817 0.0056 0.10 0.9125
Life
satisfaction
.135020 .099590 0.0673 0.99 0.3229
Illness
symptoms
.833539 .086980 05180 9.58 0.0000
Locus of
control
.044400 .027119 -0.0813 1.64 0.0108

11
R2= .5575
Table 2. Teacher Internal Characteristics-multiple Regression Results Variables of Internal –Related Variables on Vocational Teacher Stress ( Adams )
To explain how this works, we like to make an analogy to the TV program
Survivor. In the program, a large group of contestants begin on the island, but
there is progressive elimination of contestants. With multiple regressions, the same
process occurs. The researcher can “kick some variables off the island” by looking
at the p-values.to see which re significant correlations. In the last column on the
right on Table 4, you will see the p values (in bold) for each predictor.
• The three with p > .05 “leave the island” and are not included in the
calculation of R and R2. These are job satisfaction (p=. 0925), life
satisfaction (p= .03229), and locus of control (p=. 1018).
• The three with p< .05 get to stay. These are illness symptoms (p =.0000),
role preparedness (p=. 0092),and self-esteem ( p= .0053).
These are the three variables that are included in the calculation of R and the R2.
What the R2 tells us, then, is the following. Taken together, illness symptoms, role
preparedness, and self-esteem account for 55.75% of the variance in teacher
stress.
This table also lists the metric regression coefficient or β weight for each
predictor variable. These appear in the first column on the left. These are special
correlations that indicate how much of the change in the criterion variable can be
attributed to each predictor variable. The three highest β weights are
Self Esteem .379038 .136080 0.1586 2.69 0.0053

12
β for illness symptoms = .518;
β for role preparedness= .134
β for self esteem = .156
This means that that for every one-unit change in the measure of illness
symptoms, there is a 0.518 unit change in the measure of teacher stress; for
every unit of role preparedness there is a .134 unit of change in stress; and for
each unit of change in self-esteem, there is a .158 unit of change in teacher
stress. The size of the beta weights is another indication of the pre-eminence of
some predictor variables over others.
This is a rather complicated study and requires careful attention to detail.
It is important to remember the researcher can eliminate some variables from
consideration by looking at their beta-weights and p-values.
Advanced Regression Analyses
In addition to the approaches described above, you may encounter more
complex regressions that use more complex statistics. The aim of these
approaches is to more closely approximate causation. The most commonly used
are logistic regression, hierarchical linear modeling, and causal modeling.
13
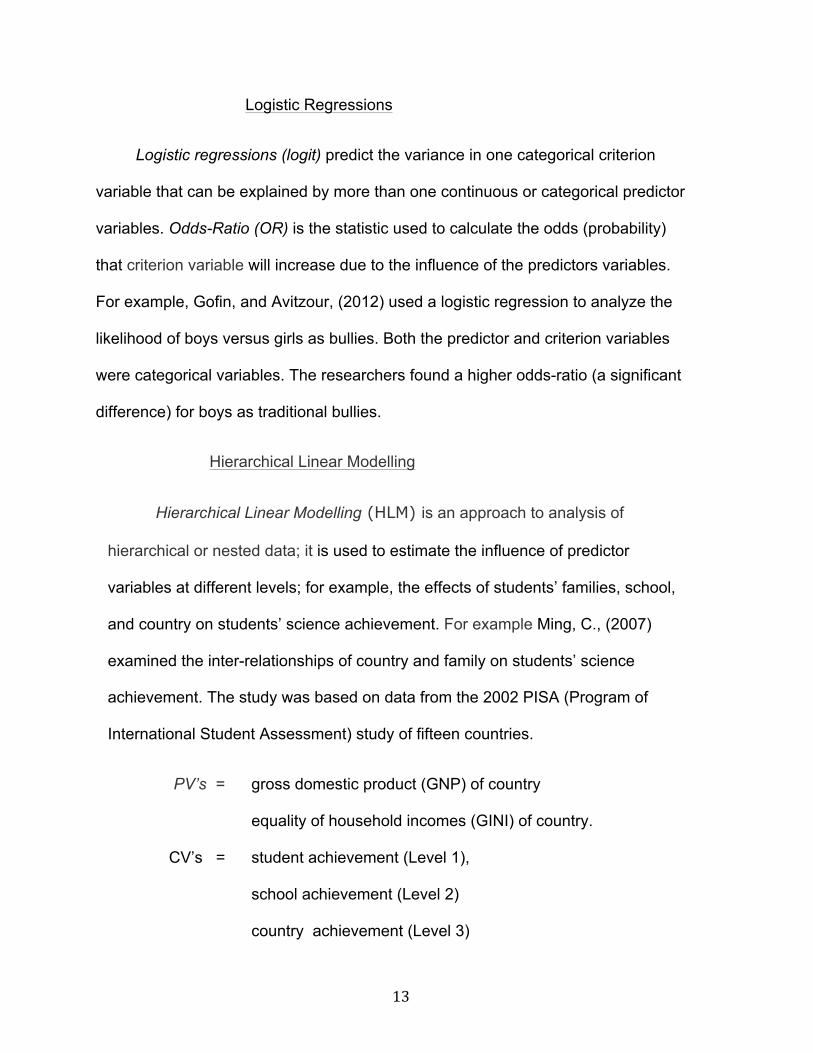
Logistic Regressions
Logistic regressions (logit) predict the variance in one categorical criterion
variable that can be explained by more than one continuous or categorical predictor
variables. Odds-Ratio (OR) is the statistic used to calculate the odds (probability)
that criterion variable will increase due to the influence of the predictors variables.
For example, Gofin, and Avitzour, (2012) used a logistic regression to analyze the
likelihood of boys versus girls as bullies. Both the predictor and criterion variables
were categorical variables. The researchers found a higher odds-ratio (a significant
difference) for boys as traditional bullies.
Hierarchical Linear Modelling
Hierarchical Linear Modelling (HLM) is an approach to analysis of
hierarchical or nested data; it is used to estimate the influence of predictor
variables at different levels; for example, the effects of students’ families, school,
and country on students’ science achievement. For example Ming, C., (2007)
examined the inter-relationships of country and family on students’ science
achievement. The study was based on data from the 2002 PISA (Program of
International Student Assessment) study of fifteen countries.
PV’s = gross domestic product (GNP) of country
equality of household incomes (GINI) of country.
CV’s = student achievement (Level 1),
school achievement (Level 2)
country achievement (Level 3)

14
Causal Modeling
Causal modeling regressions predict outcome of multiple PV’s on one or
more CV’s, calculate the interactions/indirect effects of PV’s on CV’s, and calculate
interactions / indirect effects of PV’s on other PV’s. Causal modeling is based on
correlations with the purpose of examining complex interactions of variables. For
example, Phan (2010) combined two separate theoretical orientations achievement
goals and study processing strategies into one overall causal model. Over a two-
year period theoretical constructs were measured with a variety of self-reported
inventories and academic performance as measured by overall course marks and
final examination scores. The results showed that there was a relationship
between two sets of predictors: 1) performance-approach goals, mastery goals,
effort, and academic performance, and 2) performance-approach goals, deep
processing, mastery goals, effort, and academic performance.
Factor Analysis

15
• Factor analysis is a special application of correlations research that is
used to explore and develop the meaning of a theoretical construct that
is being measured.
Krathwohl (2004, p. 430) defined factor analysis “a statistical procedure that,
by examining interrelationships among items or tests, help to identify the
dimensions underlying a measure and hence what it is measuring.” Because
research concerns itself with understanding theoretical constructs, like
achievement, stress, and motivation, it is important to develop a measure or
instrument that quantifies the construct, which is also known as a factor. Factor
analysis is used to examine and identify connections and patterns in lengthy
surveys and tests and to identify the general construct that is being measured. In
standardized tests that measure achievement or evaluate a clinical condition, all of
the items on the test relate to one factor. That is, they all measure different aspects
of the same construct and their supporting ideas. For example, tests are labelled
with the general construct they measure, such as general intelligence, and they
have sub-scales or sub-tests that measure aspects of the construct, like spatial,
quantitative, and verbal intelligence.
Factor analysis sounds more complicated than it really is. It all comes back
to understanding the coefficient of correlation, with values ranging from +1.0 to -
1.0. A factor analysis quantifies the interrelationships among ideas, thus making it
an empirical, quantitative reasoning process. The values or loadings of factors are
special types of correlations. The results are interpreted similarly to correlations,
and in this case, the bigger the correlations, called factor scores or factor loadings,

16
the better. There are no tests of statistical significance, no p-values, so the
interpretation is done strictly with the factor scores (factor loadings).
Types of Factor Analysis
There are two types of factor analysis, exploratory and confirmatory.
• Exploratory factor analysis seeks to discover the patterns of
interrelationships among factors,
• Confirmatory factor analysis is a follow up procedure to determine
whether the predicted interrelationships are found.
Both types examine the complex interrelationships of general constructs and their
unique, underlying factors; and both types yield quantitative results that represent
the size of the empirical relationships between and among these factors and
constructs.
Example of Factor Analysis
Cheng (2011) completed a factor analysis of a survey instrument that
explored the relationship between self-regulated learning and learning
performance. The abstract reads as follows.
The paper aims to explore the relationship between students’ self-regulation
ability and their learning performance. In this study, self-regulation ability is
conceptualized by four dimensions: learning motivation, goal setting, action
control and learning strategies. 6,524 students from 20 aided secondary
schools in Hong Kong participated in the questionnaire survey. Factor
analysis and reliability test were used to confirm the constructed validity and

17
the reliability of the survey instrument.
Below is a visual representation of the four factors that comprise the construct of
learning performance in this article.
Figure 4. Theoretical Construct and Factors
Since there is no way to observe all of these processes directly, the survey
approach is used to elicit responses to these correlated processes. The
researchers developed a survey questionnaire based on prior research models to
measure relevant variables and used factor analysis to detect whether specific
items in the questionnaire corresponded to the theoretical constructs of self-
regulated learning. Through factor analysis, the authors concluded that the
variables were, in fact, measured in the questionnaire and that the questionnaire
was valid and reliable, with all Cronbach’s alpha coefficients of variables higher
than 0.5. This showed there were positive relationships between learning
strategies, action control, goal setting, learning motivation and learning
18
performance. The authors also conducted multiple regression analyses to sort out
the relative effects of each factor as a predictor of learning performance
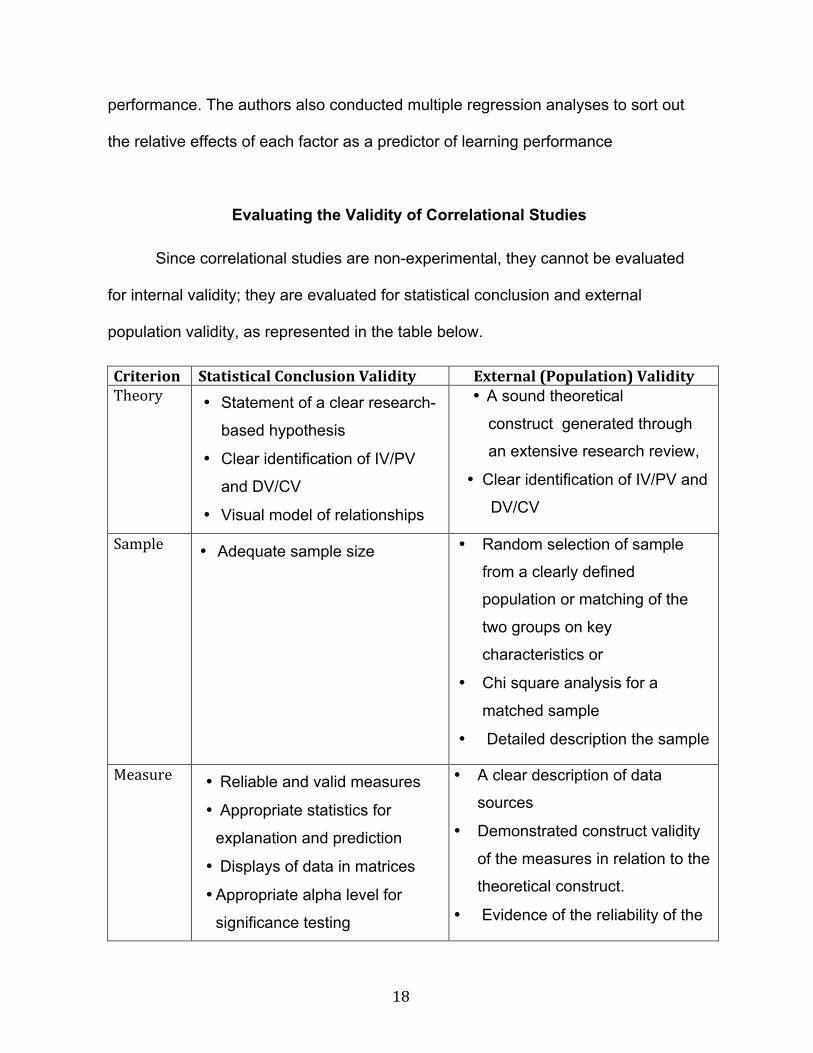
Evaluating the Validity of Correlational Studies
Since correlational studies are non-experimental, they cannot be evaluated
for internal validity; they are evaluated for statistical conclusion and external
population validity, as represented in the table below.
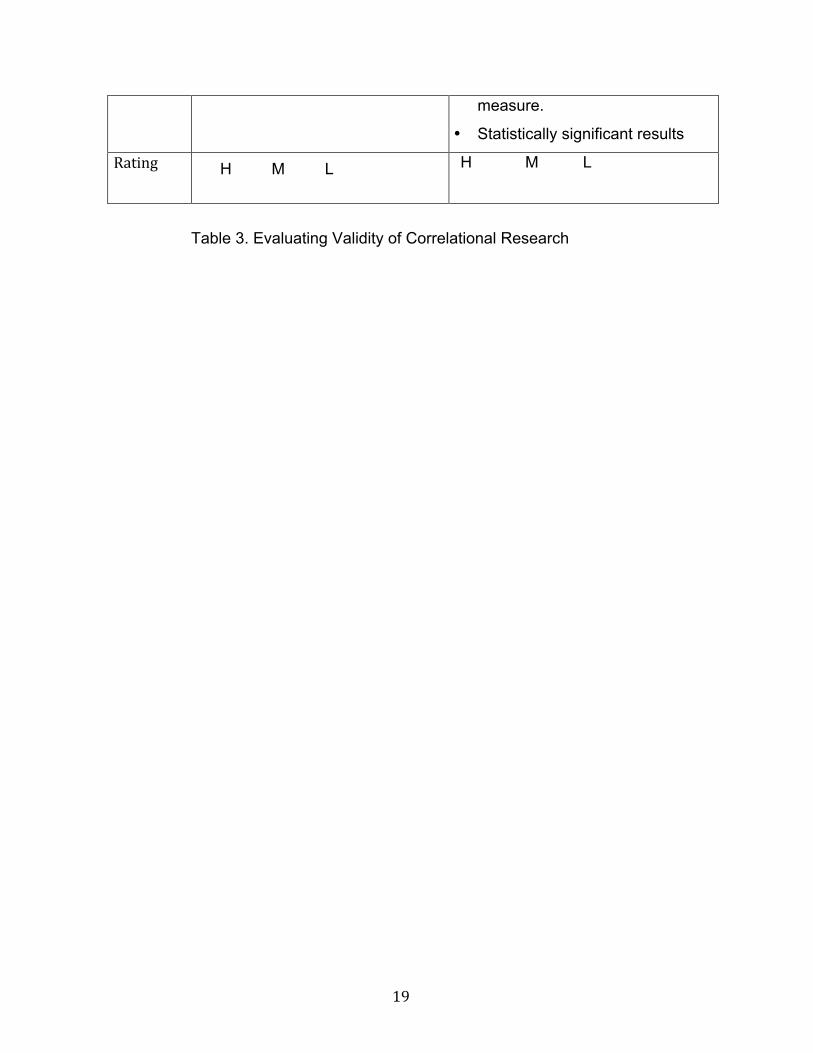
Criterion Statistical Conclusion Validity External (Population) Validity Theory • Statement of a clear research-
based hypothesis
• Clear identification of IV/PV
and DV/CV
• Visual model of relationships
• A sound theoretical
construct generated through
an extensive research review,
• Clear identification of IV/PV and
DV/CV
Sample • Adequate sample size
• Random selection of sample
from a clearly defined
population or matching of the
two groups on key
characteristics or
• Chi square analysis for a
matched sample
• Detailed description the sample
Measure • Reliable and valid measures
• Appropriate statistics for
explanation and prediction
• Displays of data in matrices
• Appropriate alpha level for
significance testing
• A clear description of data
sources
• Demonstrated construct validity
of the measures in relation to the
theoretical construct.
• Evidence of the reliability of the
19
measure.
• Statistically significant results
Rating H M L H M L
Table 3. Evaluating Validity of Correlational Research

20
Summary
• Correlations research is a form of non-experimental research that uses
correlation statistics to quantify the relationship or associations between and
among variables.
• Correlation does not mean causation.
• Correlations research may be explanatory or predictive.
• Correlational research depends on large, representative samples.
• Correlational research depends on surveys and questionnaires as
measures.

21
• Data analysis rises in complexity as it moves form explanation to prediction
and as the number of variables increases.
• The basic correlational designs are simple correlations / regressions and
multivariate correlations/ multiple regressions.
• Simple correlations are represented by a correlation coefficient (r); simple
regressions are represented by the coefficient of determination (r 2).
• Multivariate correlations are represented by the multiple correlation (R);
multiple regressions are represented by the coefficient of determination
(R 2)
• Advanced regression analyses are logical regression, hierarchical linear
modeling, and causal modeling.
• Factor analysis is a special application of correlations research that is used
to explore and develop the meaning of a theoretical construct that is being
measured.
• The two types of factorial analysis are explanatory and confirmatory.
• Correlational research is evaluated on the basis of statistical conclusion
validity and external validity.
Key Terms and Concepts
correlation research simple correlations
bivariate analysis r , coefficient of correlation
simple regression ( r2) multivariate analysis
R multiple correlation multiple regression
R2 coefficient of determination Beta weight
22
predictor variable criterion variable
logistic regression causal modelling
Hierarchical Linear Modelling (HLM)
factor analysis factor
exploratory factor confirmatory factor
Review, Consolidation, and Extension of Knowledge
1. In your own words,
a. Describe how correlational studies are similar to and different from
non- experiments of group differences
b. Identify the statistics that explain relationships between and among
variables
c. Identify the statistics that predict how one variable predicts an outcome
on another variable
d. Explain how a correlation can be significant but not important
2. . Using an electronic database, search for regression study in your of
interest. Read the article and answer the questions in the Guide below.

23
3. Using the guide as a template write a critique of about 750 words of
the non-experimental group differences study you selected. See the
Appendix for an Exemplar.
Guide to Reading and Critiquing a Regression Study
Research Review and Theory:
What is the purpose of the research review?
Does it establish an underlying theory (big ideas) for the research?
Purpose and Design:
What is the purpose of the study?
Is there a hypothesis or a research question? If so, what is it? If not, can
you infer the question from the text of the article?
What is the design?
What are the predictor and criterion variables? Identify each type of variable
in the study. ( PV=, CV=)
Sampling:
How is the sample selected?
Who is in the sample? What are the characteristics of the sample?
What is the sample size?
Data Collection:
What measures are used for the criterion variable?
What is the format of the measure (s)
24
Are there indications of validity and reliability of the measures? What are
they ( r-values)?
Data Analysis and Results:
What statistics are used to analyze the data?
Were the results (p-values) significant or non-significant?
What does the researcher conclude about the findings?
Evaluation of Validity:
How do you evaluate statistical conclusion validity? What is your rationale?
How do you evaluate external population validity ?What is you rationale?

25