chapter two the power of competitiveness of the toy …
TRANSCRIPT

10
CHAPTER TWO
THE POWER OF COMPETITIVENESS OF THE TOY SECTOR IN TURKEY AND THE
NECCESITY OF SPECIALIZED TOY ORGANISED INDUSTRIAL ZONES
ASST.PROF.DR. OĞUZ KARA (DUZCE UNIVERSITY, TURKEY)
GRADUATE STUDENT NECLA ERDOĞAN (DUZCE UNIVERSITY, TURKEY)
ASSOC. PROF.DR. BİROL ERKAN (USAK UNIVERSITY, TURKEY)
Introduction
Toy sector is a sector which creates employment and has the potential to contribute to the national economy through domestic production. In addition to economic contributions of the sector, toys are reflections of our cultural values and also constitute an important starting point for the future of our children (Peter and Tiffany 1984: 213). As old as human history, the word “toy” was first used in the 18th century as a “toy” in English which refers to the production of daily objects' minimized versions. Toys are entertaining materials that diversify children's play, as well as game materials which regulate children's behaviors and they also contribute to children's mental, physical and psychosocial development (Özyürek and Erzurumluoğlu, 2016: 14).

THE POWER OF COMPETITIVENESS OF THE TOY SECTOR IN TURKEY AND THE NECCESITY OF SPECIALIZED TOY ORGANISED INDUSTRIAL ZONES
11
Even though toys exist throughout history, a sector which directly targets children never occurred until the 18th century. With the discovery of the market need for children, first children's literature, then toys designed especially for children and toy sector have developed. The first industrial toys were started to be produced in the US in the 1820s. Today, due to contract manufacturing, cheap labor as well as integrated side industry, toys are produced in a number of countries which are mainly based in China.
Turkey meets toy need through import and a significant part of the import is comprised of toys originated in China. In 2015, the total world toy production reached 370 billion dollars and plastic toy production reached 140 billion dollars. By 2015, the top three toy importer countries around the world were comprised of the USA, Germany and England; the top three exporter countries were China, Hong Kong and the USA. Turkey receives % 0,6 shares from toy import and % 0,1 shares from toy export around the world. The total toy production in Turkey in 2016 amounted to 72 thousand tons and 440 million dollars by increasing %4,7 on the basis of an average amount and %2,4 on the basis of value per year between the periods of 2012-2016 (PAGEV, 2017: 5). China, which becomes an important threat to the development of Turkey in toy sector, is today a country that realizes over 40-billion-dollars-export to the world.
According to industrial registry certificate of the Ministry of Science, Industry and Technology (MoSIT), there are 156 companies which produce toys in Turkey as of 2016. These companies are situated mostly in larger cities such as Istanbul, Ankara, Bursa and Konya (PAGEV, 2017: 5). It is obvious that there is need to provide industrial creative designs that could reflect our cultural values as well as clustering of toy producers in order to enable Turkish toys to open to world market. The support of the MoSIT for the establishment of "Specialized Toy OIZ" by taking toy sector into the scope of its plans within the scope of "Turkey's Industrial Strategy and Action Plan" is a significant step towards developing and branding domestic toy industry.
Due to increasing competitive pressure, methods which enable to improve efficiency in industry, are developed. Among these methods, clustering method has gained importance in recent years and has been supported by being included in the development programs of a variety of countries. The most important step in adopting the clustering method in Turkish industry was the

THE POWER OF COMPETITIVENESS OF THE TOY SECTOR IN TURKEY AND THE NECCESITY OF SPECIALIZED TOY ORGANISED INDUSTRIAL ZONES
12
establishment of Specialized OIZs and the increase of their numbers as a result of the amendment in Organized Industrial Zone Law. Specialized OIZ is defined as the Organized Industrial Zone which harbors facilities operating in the same sector group and sub-sector included in this sector group, which overlaps with the clustering method approach in the industry in Organized Industrial Zone Law numbered 4562. The first Specialized OIZ practice in Turkey is Istanbul Leather OIZ, which was resolved to be established in Tuzla with the resolution of Istanbul Municipality in 1981, and was started to be constructed in 1982 and became operational in 1994. Currently, there are many operating specialized OIZs which have also been declared by the Ministry of Science, Industry and Technology, and their number is increasing rapidly. As of 2017, there are 303 OIZs which have 91.919 hectares, and 45 Specialized OIZs in Turkey. 1.709.000 people are employed in these OIZs (The Ministry of Science, Industry and Technology 2017).
The establishment of Specialized OIZs in the toy sector will enable SME's making production in this field, to make easier and cheaper productions in the planned field by benefiting from a common infrastructure. In addition, the opportunities of the companies situated in OIZ to benefit from the external economy will increase. With the Specialized Toy OIZs, cost reduction which occurs during the production process and productivity growth could contribute to the international competitive advantage of the sector (Eyüboğlu, 2005: 50). The positive contributions of the Specialized OIZs to the sector could be observed in Istanbul Leather OIZ and Iscehisar/Afyon Marble OIZ. Istanbul Leather Organized Industrial Zone has become an important production and employment center with a total number of 40.000 employees in 1000 offices together with its strategic position, infrastructure, environmental planning, treatment facility as well as mosque and market complex. Iscehisar Marble OIZ was also established in 1997 and it currently continues operating with 50 companies. While marble export in Turkey was 320 thousand tons in 1996, it reached to 2.1 million tons in 2003. While the share of marble export within the total export share in 2007 was %2,5, it increased to % 2,7 in 2015. Within the scope of these examples, it is envisaged that toy production as well as toy export could increase with the planned Toy OIZ.

THE POWER OF COMPETITIVENESS OF THE TOY SECTOR IN TURKEY AND THE NECCESITY OF SPECIALIZED TOY ORGANISED INDUSTRIAL ZONES
13
Toy Sector Around the World and in Turkey
Total world toy production increased averagely %1,3 and plastic toy production increased averagely % 6,1 per year between the years of 2012- 2015. The total world toy production increased to 370 billion dollars, while plastic toy production increased to 140 billion dollars in 2015. The share of plastic toy production within the total toy production share which was %33 in 2012, increased to % 38 in 2015 (PAGEV, 2017: 3-5).
Table 1. World Toy Production (Billion$)
2012 2013 2014 2015 Compound Annual Growth Rate(%)
Total Toy 357 354 368 370 1,3 Plastic Toy 117 125 136 140 6,1 Percent. of P.Toy (%) 33 35 37 38 Source: PAGEV, Monitoring Report of Toy Sector 2017: 5
There are generally four players in the world toy production. These are global brand owner companies, contract companies in which productions are made, distributors and toy stores. Due to cheap labor and integrated side industry, contract manufacturing is mainly done in China as well as in Italy, Spain, England, and especially in Germany.
Table 2. Leading Countries In World Toy Import and Export (Billion$)
Importing Countries
Import %Share Exporting Coutnries
Export %Share
USA 31,3 29,5 China 42,7 46,1 Germany 6,7 6,3 Hong Kong 7,4 8,0 England 6,4 6,0 USA 6,2 6,7 Hong Kong 5,8 5,4 Germany 4,5 4,9 Japan 5,2 4,9 Czech Republic 3,2 3,4 France 4,5 4,3 Holland 2,3 2,5 Canada 4,1 3,9 Taiwan 2,1 2,3 Holland 2,4 2,3 England 2,0 2,1 Italy 2,3 2,2 Italy 1,7 1,8 Turkey 0,6 0,6 Turkey 0,1 0,1 Source: PAGEV, Report of Toy Sector 2017: 6

THE POWER OF COMPETITIVENESS OF THE TOY SECTOR IN TURKEY AND THE NECCESITY OF SPECIALIZED TOY ORGANISED INDUSTRIAL ZONES
14
%67 of the total world toy import and %80 of world export are guided by 10 countries. In 2015, the top three toy importer countries around the world were comprised of the USA, Germany and England; the top three exporter countries were China, Hong Kong and the USA.
The total world toy import declined with an average of %2 per year, while plastic toy import increased %3,7 between the years of 2012- 2015. In 2015, the total world toy import increased to 106 billion dollars and plastic toy import increased to 45 billion dollars. The share of plastic toy import within the total share of toy import, which was %38 in 2012, increased to %43 in 2015.
The total world toy export increased at an average rate of % 1,3, while plastic toy export increased % 6,1 per year between the years of 2012-2015. In 2015, the total world toy export reached 93 billion dollars; plastic toy export reached 35 billion dollars. The share of plastic toy export within the total share of toy export, which was %33 in 2012, rose to %38 in 2015.
The Lego Group based in Denmark is the most valuable toy brand around the world. As of 2017, the brand value of the Lego Group is 7.6 billion American dollar. Since the establishment of the company, it has succeeded in selling a total number of 480 billion toys. The second largest company is Namco Bandai Holdings based in Japan. Among the toys produced by the company, there are Digimon, Power Ranger, Tamagotchi Virtual Domestic Animal and Gundam, etc. In addition to the toys, Bandai Namco Holdings also produce stationery, clothing and other accessories. The companies whose added-value is also high in toy production are shown in the table below (Brand Finance, 2017: 1-3).

THE POWER OF COMPETITIVENESS OF THE TOY SECTOR IN TURKEY AND THE NECCESITY OF SPECIALIZED TOY ORGANISED INDUSTRIAL ZONES
15
Table 3. 10 Companies Having the Highest Toy Brand Value 2017
2016
Brand Country Brand
Value 2017
(Bil. $)
Change %
Brand Rating
2017
Brand Rating
2016
1 1 Lego Denmark 7,597 68% AAA+ AAA+
2 16 Brandai Namco
Japan 1,024 662% AA+ A+
3 2 Fisher -Price
USA 773 -13% AAA- AAA-
4 3 Barbie USA 388 -32% AAA- AAA- 5 6 Nerf USA 297 29% AAA- AAA- 6 7 Mattel USA 252 10% AA+ AAA- 7 5 Gundam Japan 247 2% AA A+
8 12 Hot Wheels
USA 232 33% AAA- AA+
9 18 Hasbro USA 211 1% AAA- AAA-
10 14 My Little Ponny
USA 198 41% AAA AAA-
Source: Brand Finance, 2017, www.brandfinance.com (Accessed 10.10.2017)
The size of ever-growing toy market in Turkey is estimated to be 800 million dollars. Toy production in Turkey amounts to 19.400 tons and 165.1 million dollars. The total toy import in Turkey in 2016 amounted to 65 thousand tons and 609 million dollars by declining %0,4 on the basis of an average amount and by increasing % 0,2 on a value basis per year between the years of 2012-2016. Turkey could receive the share of % 0,6 from the total world toy import and %0,1 from the export.
Total domestic sales of toys in Turkey amounted to 119 thousand tons and 933 million dollars in 2016 by increasing % 1,8 on the basis of an average amount and % 1 on the value basis between the years of 2012- 2016. The toy need in Turkey is met largely through import and important part of import is comprised of toys originated in China. %55 of domestic consumption was met through import in 2016.

THE POWER OF COMPETITIVENESS OF THE TOY SECTOR IN TURKEY AND THE NECCESITY OF SPECIALIZED TOY ORGANISED INDUSTRIAL ZONES
16
Figure 1. Turkey's Toy İmport (Milion $)
Source: PAGEV, Monitoring Report of Toy Sector 2017: 7
The total export in Turkey amounted to 18 thousand tons and 108 million dollars in 2016 by increasing % 4,7 on the average amount basis and % 2,5 on the value basis between the years of 2012- 2016. It is expected that the total toy export will increase to 20 thousand tons and 126 million dollars at the end of 2017, which was 10 thousand tons and 63 million dollars in the first 6 months of 2017 (PAGEV, 2017: 7).
Figure 2. Turkey's Toy Export (Milion $)
Source: PAGEV, Monitoring Report of Toy Sector 2017: 7
Turkey had 47 thousand tons and 501 million dollars deficit in toy foreign trade in 2016. The foreign trade deficit declined %2 on the basis of an average amount and %0,2 on the value basis per year between the years of 2012- 2016. %82, 4 of the total import was made from China. Italy, Taiwan, the USA and Vietnam constitute the other
0
200
400
600
800
2012 2013 2014 2015 2016 2017/6 2017/T
Turkey's Toy İmport
Milyon$ 1000 Ton
0
50
100
150
2012 2013 2014 2015 2016 2017/6 2017/T
Turkey's Toy Export
Milyon$ 1000 Ton

THE POWER OF COMPETITIVENESS OF THE TOY SECTOR IN TURKEY AND THE NECCESITY OF SPECIALIZED TOY ORGANISED INDUSTRIAL ZONES
17
important countries from which toy imports are done. %37,1 of Turkey's total toy export was made to 10 countries in the first 6 months of 2017. %11,1 of the total export was made to France. China, Iraq, Russian Federation and Greece are another important countries from which the toys are exported (PAGEV, 2017: 11).
Table 4. Turkey's Toy Import and Export Countries (Million $) Importing Countries
Import %
Share Exporting Countries
Export %
Share China 272 82,4 France 7,0 11,1 Italy 9 3,2 China 6,2 9,8 Taiwan 4 1,6 Iraq 5,8 9,2
USA 4 1,3 Russian Federation
3,9 6,2
Vietnam 4 1,2 Greece 3,8 6,0 Germany 3 1,2 Italy 2,6 4,2 Czech Republic 3 1,0 Saudi Arabia 2,0 3,2 Malaysia 2 0,7 Bulgaria 2,0 3,1 Indonesia 2 0,7 England 1,9 3,1
Hungary 2 0,6 Turkish Republic of Northern Cyprus
1,8 2,9
Source: PAGEV, Monitoring Report of Toy Sector 2017: 11
Countries and a lower level of enterprises should give importance the issues in accordance with the economic system is export. (Kayabaşı et al., 2010:10) One of the most important problems in toy sector is that it has a trade deficit, and unit import price is two and a half more than unit export price. The sector imports expensive toys and exports toys whose added-value is low, which leads to increase of trade deficit.
In the literature, there are a variety of theoretical and applied studies regarding toy sector. Most of these studies examine the effect of the toy on the child development. Some of these studies is based on toy sector's growth efficiency and its competitive structure (Wong et al. (2005), Izushi and Aoyama (2006), Sun and Wing (2005), Lau et al. (2010), Peng and Chen (2011), Horaa et al. (2011)), (Hamlin (2004), Mok et al. (2007)).
Dataset and Method
Revealed comparative advantage indices have been calculated with the aim of measuring the competitiveness of Turkey and China in the toy exports between the years of 2000-2016. “Vollrath Index” and

THE POWER OF COMPETITIVENESS OF THE TOY SECTOR IN TURKEY AND THE NECCESITY OF SPECIALIZED TOY ORGANISED INDUSTRIAL ZONES
18
“Balassa Index” have been used in calculating the revealed comparative advantage indices. The indices of the revealed comparative advantage of the abovementioned two countries' toy exports have been calculated by using the data of UN Statistics Office and Standard International Trade Classification (SITC). In this regard, the data in SITC Rev 3,4-digit-classification "8942- toys for children" have been used in index calculations.
Instead of basing the study on the arithmetic average of Vollrath and Balassa index values in toy export, “appropriate average” has been applied. The aim is here to calculate the arithmetic average of the lines by means of eliminating the highest and the lowest values in the lines. In the case of using only arithmetic average, it is possible that competitiveness scores regarding the toy export figures might be very low or very high periodically. Therefore, “appropriate average” has been calculated in order to obtain more reliable data for the average values (Küçükkiremitçi, 2006: 11).
In the literature, “Balassa” and “Vollrath” Indices are frequently used in order to be able to calculate the revealed comparative advantages of any country’s any exported product which has been carried out at any given time. The obtained comparative advantage scores show a country’s revealed comparative advantage regarding any production export i.e. the competitiveness of an export. In other words, if a country has international competitiveness in any production export, then it is accepted that the country has advantage against the rest of the world (Bobirca and Gabriel, 2007: 264).
Revealed comparative advantages, which was first proposed by Liesner in 1958, was developed and introduced into the literature by Balassa in 1965 (Erkan and Sarıçoban, 2014: 120). Balassa Index (revealed comparative advantage index) is defined as the ratio of a country's exports in a particular commodity category to its share in total merchandise exports (Balassa and Noland, 1989: 9). Where x symbolizes export, k represents a product, j represents a country, t represents a year, and w represent the world. Thus, Balassa Index (BI) is obtained as follows.
𝐵𝐵𝐵𝐵𝑘𝑘𝑡𝑡𝑗𝑗 =
𝑋𝑋𝑘𝑘𝑡𝑡𝑗𝑗
𝑋𝑋𝑡𝑡𝑗𝑗�
𝑋𝑋𝑘𝑘𝑡𝑡𝑤𝑤𝑋𝑋𝑡𝑡𝑤𝑤�

THE POWER OF COMPETITIVENESS OF THE TOY SECTOR IN TURKEY AND THE NECCESITY OF SPECIALIZED TOY ORGANISED INDUSTRIAL ZONES
19
Balassa Index also compares a country's domestic specialization in the product export with the specialization around the world (Beningo, 2005: 3-5). Balassa Index takes the value between 0 and infinity. If any product's Balassa index value is greater than 1, then it means that the product's export share in the "t" period is greater than the total world export share in the same period. In other words, the country of the product has competitiveness in the product export and is specialized (Coxhead, 2007: 1105). If the index is smaller than 1, then it means that the country has disadvantage in the competitiveness of the product export (Kara and Erkan, 2012: 71). If the value equals to 0, it shows that the country has never exported the given product. If the value approaches to infinity, it shows that the country holds an important share for the given product export around the world (Rivlin, 2000: 60).
If Balassa index value is between 0 and 1, it implies export competitive disadvantage. If the index value is between 1 and 2, then it refers to weak competitive advantage. If the index value is between 2 and 4, then it means medium competitive advantage. Lastly, if the index value is bigger than 4, it refers to strong competitive advantage (Hinloopen, 2001: 1-35).
Unlike Balassa Index, Revealed Comparative Advantage Index of Vollrath (Vollrath Index) prevents double counting of the country and the product (sector) (Lederman et al. 2006: 5).
𝑅𝑅𝑅𝑅𝑅𝑅𝑘𝑘𝑡𝑡𝑗𝑗 =
𝑋𝑋𝑘𝑘𝑡𝑡𝑗𝑗
𝑋𝑋−𝑘𝑘𝑡𝑡𝑗𝑗�
𝑋𝑋𝑘𝑘𝑡𝑡−𝑗𝑗
𝑋𝑋−𝑘𝑘𝑡𝑡−𝑗𝑗�
𝑋𝑋𝑘𝑘𝑡𝑡𝑗𝑗 →country "j"'s export for the good "k" (sector) during the period of "t"
𝑋𝑋−𝑘𝑘𝑡𝑡𝑗𝑗 → country "j"'s total export except the good "k" (sector) during the
period of "t"
𝑋𝑋𝑘𝑘𝑡𝑡−𝑗𝑗 →world export for the good "k" (sector) except 𝑋𝑋𝑘𝑘𝑡𝑡
𝑗𝑗 during the period of "t"
𝑋𝑋−𝑘𝑘𝑡𝑡−𝑗𝑗
t → total world export except 𝑋𝑋−𝑘𝑘𝑡𝑡𝑗𝑗 and 𝑋𝑋−𝑘𝑘𝑡𝑡
𝑗𝑗 during the period of "t"
Index results are analyzed in the same way as Balassa Index results are done. In the tables in which Vollrath and Balassa index values regarding the countries' competitiveness in export are shown, "In" values whose logarithmic equivalence refers to appropriate average values, are also given. The objective here is to demonstrate that

THE POWER OF COMPETITIVENESS OF THE TOY SECTOR IN TURKEY AND THE NECCESITY OF SPECIALIZED TOY ORGANISED INDUSTRIAL ZONES
20
negative aspect of "In" values refer to export competitive disadvantage (Faustino, 2008: 8). In addition to this, coefficient of variability (CV) values have been calculated with the aim of demonstrating the yearly deviations of competitiveness scores from appropriate average.
Results of the Analysis
Turkey has comparative disadvantage in toy export as released by the revealed comparative advantage index results (Vollrath Index) regarding the toy export between the years of 2000-2016 (Vollrath Index value is 0,13). In other words, Turkey has competitive disadvantage in the global markets in toy export.
Table 5: Competitiveness of Turkey in Toy Export (Vollrath Index, 2000-2016)
Prod. Code
2000-2008 Average
2009-2016 Average
Appropriate Average
LN CV Degree Of Competıtıveness
8942 0,14 0,13 0,13 -2,02 17,18 DISADVANTAGE
The revealed comparative advantage indices (Vollrath Index, 2000-2016) in toy exports have been shown yearly with the help of the figure below.
Figure 3. Competitiveness of Turkey in Toy Export (Vollrath Index, 2000-2016)
As of 2000-2016, Turkey's competitiveness in toy exports has been generally on the decline. An average Vollrath index value in the periods of 2009-2016 was on the decline when compared to the
0
0,2
0,4
0,6
0,8
1
2000
2001
2002
2003
2004
2005
2006
2007
2008
2009
2010
2011
2012
2013
2014
2015
2016
VOLL
RATH
EN
DEKS
İ
TİME

THE POWER OF COMPETITIVENESS OF THE TOY SECTOR IN TURKEY AND THE NECCESITY OF SPECIALIZED TOY ORGANISED INDUSTRIAL ZONES
21
previous periods of 2000-2008. In addition to this, as it is seen in Figure 5, Vollrath index values which show the export competitiveness, are on the decline even if it is a slight decline.
The fact that obtained coefficient of variability of the scores regarding the competitiveness of Turkey in the toy exports is not very high (%17) shows relative stabilization in the competitive disadvantage. Balassa Index values of Turkey's toy exports between the years of 2000-2016 have parallels with Vollrath Index values.
Table 6. Competitiveness of Turkey in Toy Export (Balassa Index, 2000-2016)
Prod. Code
2000-2008 Average
2009-2016 average
Appropriate average
LN CV Degree Of Competıtıveness
8942 0,14 0,13 0.13 -2,01 17,05 DISADVANTAGE
The revealed comparative advantage indices (Balassa Index, 2000-2016) in toy exports have been shown yearly with the help of the figure below.
Figure 4. Competitiveness of Turkey in Toy Export (Balassa Index, 2000-2016)
Turkey does not have the right to comment on the toy exports in international markets; therefore, it is disadvantageous in terms of competitiveness. This situation clearly indicates the net position of Turkey in the toys foreign trade. The results of Vollrath-Balassa Indices have been compared by means of Figure 7 below.
Figure 5. Vollrath-Balassa Index Results of Turkey
0
0,2
0,4
0,6
0,8
1
2000
2001
2002
2003
2004
2005
2006
2007
2008
2009
2010
2011
2012
2013
2014
2015
2016
BALA
SSA
ENDE
KSİ
TIME

THE POWER OF COMPETITIVENESS OF THE TOY SECTOR IN TURKEY AND THE NECCESITY OF SPECIALIZED TOY ORGANISED INDUSTRIAL ZONES
22
Both Vollrath and Balassa Index values reveal the comparative disadvantage of Turkey in the toy exports. In addition to this, Turkey's comparative disadvantageous state is gradually increasing despite being in a low rate. That linear trend lines are negative biased curves in Figure 7 clearly justifies this situation.
Vollrath's and Balassa's revealed comparative advantage indices (Vollrath and Balassa Index) have been used in order to calculate and analyze the competitiveness of China, who is the largest toy exporter around the world, in the toy exports in 2000-2016. Vollrath Index results regarding toy exports between the periods of 2000-2016 present that China has very high level of global competitiveness. The fact that Balassa Index values show such a high score as 10,27 reveals that China realizes an important part of the toy exports around the world.
Table 7. Competitiveness of China in Toy Export (Vollrath Index, 2000-2016)
Product Code
2000-2008 Average
2009-2016 Average
Appropriate Average
LN CV Degree Of Competıtıveness
8942 13,98 7,26 10,27 2,33 44,41 VERY STRONG
The revealed comparative advantage indices (Vollrath Index, 2000-2016) of China in the toy exports have been shown yearly with the help of the figure below.
Figure 6. Competitiveness of China in Toy Export (Vollrath Index, 2000-2016)
0
0,05
0,1
0,15
0,2
0,25
2000
2002
2004
2006
2008
2010
2012
2014
2016
VOLL
RATH
-BAL
ASSA
EN
DEKS
İ
TIME
Vollrath Endeksi
Balassa Endeksi
Линейная (Balassa Endeksi)
THE POWER OF COMPETITIVENESS OF THE TOY SECTOR IN TURKEY AND THE NECCESITY OF SPECIALIZED TOY ORGANISED INDUSTRIAL ZONES
23
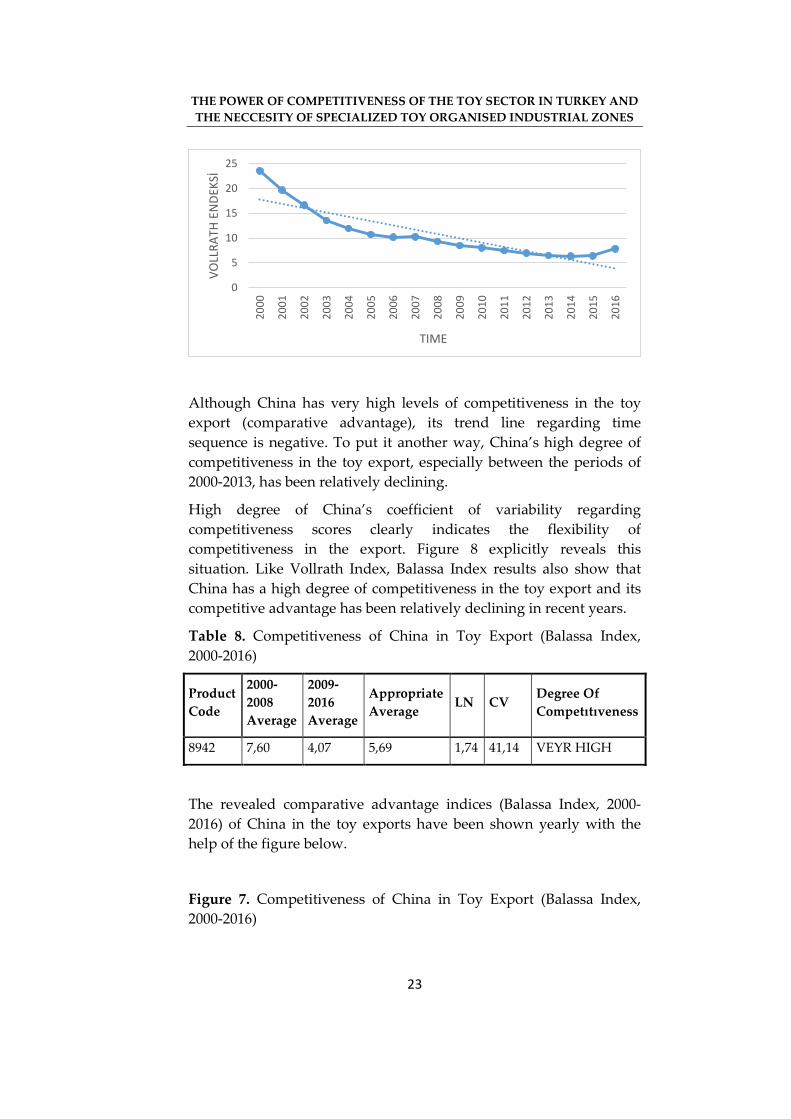
Although China has very high levels of competitiveness in the toy export (comparative advantage), its trend line regarding time sequence is negative. To put it another way, China’s high degree of competitiveness in the toy export, especially between the periods of 2000-2013, has been relatively declining.
High degree of China’s coefficient of variability regarding competitiveness scores clearly indicates the flexibility of competitiveness in the export. Figure 8 explicitly reveals this situation. Like Vollrath Index, Balassa Index results also show that China has a high degree of competitiveness in the toy export and its competitive advantage has been relatively declining in recent years.
Table 8. Competitiveness of China in Toy Export (Balassa Index, 2000-2016)
Product Code
2000-2008 Average
2009-2016 Average
Appropriate Average
LN CV Degree Of Competıtıveness
8942 7,60 4,07 5,69 1,74 41,14 VEYR HIGH
The revealed comparative advantage indices (Balassa Index, 2000-2016) of China in the toy exports have been shown yearly with the help of the figure below.
Figure 7. Competitiveness of China in Toy Export (Balassa Index, 2000-2016)
0
5
10
15
20
25
2000
2001
2002
2003
2004
2005
2006
2007
2008
2009
2010
2011
2012
2013
2014
2015
2016
VOLL
RATH
EN
DEKS
İ
TIME

THE POWER OF COMPETITIVENESS OF THE TOY SECTOR IN TURKEY AND THE NECCESITY OF SPECIALIZED TOY ORGANISED INDUSTRIAL ZONES
24
Even though Turkey’s Vollrath and Balassa Index values share the same results, there are significant differences between the same index values of China.
Figure 8. Vollrath and Balassa Index Results of China
As seen in Figure 10, China’s Balassa index scores regarding the toy export are lower than of Vollrath index. It results from the lack of double counting in Vollrath index. The fact that China plays a crucial role in the toy export within the total world toy export has demonstrated Vollrath index much higher. Apart from this, Balassa index values, despite its lowness, show China’s high degree of competitiveness in the toy export as Vollrath index values do. Comparative advantage scores of China and Turkey have been evaluated in Figure 11.
Figure 9. Competitiveness of China and Turkey in Toy Export
02468
101214
2000
2001
2002
2003
2004
2005
2006
2007
2008
2009
2010
2011
2012
2013
2014
2015
2016
BALA
SSA
ENDE
KSİ
TIME
0
5
10
15
20
25
2000
2002
2004
2006
2008
2010
2012
2014
2016
VOLL
RATH
-BAL
ASSA
EN
DEKS
İ
TIME
Vollrath Endeksi
Balassa Endeksi
Линейная (Balassa Endeksi)

THE POWER OF COMPETITIVENESS OF THE TOY SECTOR IN TURKEY AND THE NECCESITY OF SPECIALIZED TOY ORGANISED INDUSTRIAL ZONES
25
When the competitiveness of China and Turkey in the toy export is analyzed together, it becomes obvious that China has high scores (despite its declining line) and the competitiveness scores of Turkey has absolutely and relatively (when compared to China) low scores.
Results and Suggestions
Toy industry in Turkey has an important potential in terms of both domestic market and export. The fact that children constitute % 33 of the country's population clearly shows the most important potential power of the sector. The toy is of pivotal importance in the child development in addition to its economic value. As old as human history, toys are entertaining materials that diversify children's play as well as game materials which regulate children's behaviours and they also contribute to children's mental, physical and psychosocial development. Therefore, the development of the toy sector plays an important role in shaping a country's future apart from its economic contribution.
In this study, where competitiveness of Turkish toy sector and specialization level have been calculated for the years 2000- 2016, Balassa and Vollrath Indices have been used. The results obtained as well as economic and social policy arguments suggested for policymakers so that Turkish toy sector could improve, can be summarized as follows.
Turkey has comparative disadvantage in toy export according to the revealed comparative advantage index results in toy export (Vollrath Index value is 0, 13 and Balassa Index value is 0, 13). In other words, Turkey is disadvantageous in terms of its competitiveness in the
-4
-2
0
2
4
2000
2001
2002
2003
2004
2005
2006
2007
2008
2009
2010
2011
2012
2013
2014
2015
2016
Bala
ssa
ve V
ollra
th E
ndek
si(ln
)
TIME
Türkiye Balassa Türkiye Vollrath Çin Balassa Çin Vollrath

THE POWER OF COMPETITIVENESS OF THE TOY SECTOR IN TURKEY AND THE NECCESITY OF SPECIALIZED TOY ORGANISED INDUSTRIAL ZONES
26
global markets in toy export. As of the years 2000- 2016, competitiveness of Turkish toy export was generally disposed to decline. This is an indication of Turkey's certain importer position in toy foreign trade.
Even though China has a high degree of competitiveness in toy export (Vollrath Index value is 10,27 and Balassa Index value is 5,69), its trendline regarding time sequence is negative. To put it another way, China's high degree of competitiveness in toy exports (especially in the periods of 2000-2013) is relatively declining. Toy need in Turkey is largely met through the import and an important part of the import is comprised of toys originated in China. Cheap labor costs of the Far East results in attracting productions around the world to this region. Today, a number of renowned brands make their productions in the Far East. The fact that China's competitive advantage is declining in time provides crucial opportunities in terms of the development of Turkish toy sector. Economic and social aspects for the development of national toy sector could be analyzed as follows.
The establishment of Specialized Toy OIZs must be supported. Specialized OIZs are important steps for the development of domestic toy sector and branding. Since the toy sector requires intensive labor on the ground of handmade assembly, developing promoted areas in the toy sector will provide significant gains in employment. Thus, there is a cooperation between the Ministry of Science, Industry and Technology, and Duzce University with the aim of establishing Specialized Toy Organized Industrial Zone and producing National Toy in Duzce. Turkey’s first Specialized Toy OIZ is planned to be established in Duzce. It is thought that the establishment of the toy OIZ will affect its success in a positive way when the geographical position of Duzce, its proximity to toy producers as well as its position within the 4th Promotion area is taken into account. With the establishment of Specialized Toy OIZ, Turkey will have an opportunity to produce certified and value-added products.
Public awareness regarding national products should be provided for the promotion and development of domestic toy production. According to the data released by the International Council of Toy Industries (ICTI), an average toy expenditure per child around the world is 175 dollars. This figure amounts to 250 euro in Europe, 300 dollars in the USA and only 40 dollars in Turkey. Consumers who

THE EFFECTS OF TEACHING BASED ON CRITICAL THINKING SKILLS
ON ENVIRONMENTAL ATTITUDES OF PRE-SERVICE TEACHERS
27
know the reliability of domestic production especially in terms of
human health will prefer these products. The imported toys to
Turkey should be controlled in psychological and pedagogical terms,
and also to determine whether they contain a carcinogen. Control
mechanisms should also be well managed in order to prevent
unreliable and deleterious products.
We should be able to reflect our basic ethical and cultural values on
the toys that we produce. Advertising domestic toys, especially
cartoons, is required in order to enable them to reach the large
masses. National and cultural characters should be created in
national kids channels (such as TRT Kids) and the producers of these
characters should be supported. Domestic products should be
preferred for the toys distributed by high state officials and
institutions.
Customs tariff should be applied to the products which are produced
or are possible to be produced in Turkey in an attempt to protect
domestic products from foreign competition. Value-added-tax (VAT)
rate in domestic toy productions should be reduced from %18 to %8.
A model, which could promote the master brand companies
dominating the world market without distorting competitiveness of
domestic industry to produce in Turkey, should be set up. In order to
increase export, raising the quality perception of Turkish toys should
be a significant objective. Intellectual industrial property rights of
domestically produced productions should also be well protected.

THE EFFECTS OF TEACHING BASED ON CRITICAL THINKING SKILLS
ON ENVIRONMENTAL ATTITUDES OF PRE-SERVICE TEACHERS
28
References Akbulut, D. (2009). Günümüzde Geleneksel Oyuncaklar. Milli Folklor,
Yıl. 21, (84), 182-191.
Balassa, B. (1965). “Traded Liberalization and ‘Revealed’ Comparative
Advantage”, The Manchester School of Economic and Social Studies, 99-123
Balassa, B., Noland, M. (1989). Revealed Comparative Advantage in
Japan and the US, Journal of International Economic Integration. 4(2). 8-22
Beningo, S. (2005) “Trade and Transportation Between the United States
and China, and Between the United States and India”, 2006 Conference of
the Society of Government Economists, Washington.
Bilim Sanayi ve Teknoloji Bakanlığı (2017), Sanayi Bölgeleri
İstatistikleri, http://vi.sanayi.gov.tr/ (Erişim Tarihi, 10.10.2017)
Bobircă A., Miclăuş P.G. (2007), “A Multilevel Comparative Assessment
Approach to International Services Trade Competitiveness: The Cases of
Romania and Bulgaria”, Proceedings of World Academy of Science,
Engineering and Technology, Volume 24
Brand Finance. (2017), “Lego Brand Value Grows 68% in a Year”,
http://brandfinance.com /press-releases/lego-brand-value-grows-68-in-a-
year/ (Erisim Tarihi, 10.10.2017)
Wong, C.Y., Arlbjørn, J.S., Johansen, J. (2005) "Supply chain
management practices in toy supply chains", Supply Chain Management:
An International Journal, Vol. 10 Issue: 5, pp.367-378,
Coxhead, I. (2007). “A New Resource Curse?Impacts of China’s Boom
on Comparative Advantage and Resource Dependence in Southeast Asia”,
World Development, Vol:35, No:7, July 2007, s.1109
Erkan, B., Sarıçoban, K. (2014). “Comparative Analysis of the
Competitiveness in the Export of Science-Based Goods Regarding Turkey
and the EU+13 Countries”, International Journal of Business and Social
Science, Center for Promoting Ideas, USA, Vol:5, Issue: 8(1), (2014)
Faustino, H.C. (2008). “Intra-Industry Trade and Revealed Comparative
Advantage: An Inverted-U Relationship, SOCIUS Working Paper. 03. 7. 1-13
Gürpinar, A. (2012). “Küreselleşen Kentte Oyuncak: İstanbul’da
Bölgesel Bir Oyuncakçı Kümelenmesi Üzerine”. İLETİŞİM, 133-146.
Hamlin D. (2004). “Flexible specialization and the German toy industry,
1870-1914”, Social History, 29:1, 30-40,
Hinloopen, J. (2001). “On the empirical distribution of the Balassa
Index”, Review of World Economics.137(1). 13. 1-49
Izushi, H., Aoyama, Y. (2006). “Industry Evolution and Cross-sectoral
Skill Transfers: A Comparative Analysis of the Video Game Industry in

THE POWER OF COMPETITIVENESS OF THE TOY SECTOR IN TURKEY AND THE NECCESITY OF SPECIALIZED TOY ORGANISED INDUSTRIAL ZONES
29
Japan, the United States, and the United Kingdom”, Environment and Planning A 38: 1843–61
Kara, O., Erkan, B., “Türkiye’nin Emek Yoğun Mal İhracatındaki Karşılaştırmalı Üstünlüklerin Makro Ekonomik Büyüklüklerle İlişkisi”, Abant İzzet Baysal Üniversitesi İİBF Ekonomik ve Sosyal Araştırmalar Dergisi, Cilt:7, Yıl:7, Sayı:1 (2012)
Karaman G., Nas E. (2006), “Çorum İskilip’te Geçmişten Günümüze Aktarılan Bir Miras; Ahşap Oyuncaklar” Black Sea Sosyal Bilimler Dergisi, 4 (14), s. 103-116
Kayabaşı, A., Kiracı, H., Kanberoğlu, Z., Oğuz, A. (2010), “KOBİ’lerde İhracat Performansını Belirleyen Unsurların İncelenmesi: İnegöl de Faaliyette Bulunan İşletmeler Üzerinde Bir Alan Araştırması”, Dumlupınar Üniversitesi, Sosyal Bilimler Enstitüsü Dergisi Sayı 28 s.1-13.
Küçükkiremitçi O. (2006), “Sanayi Sektörünün Dış Ticaret Performansının Rekabet Gücüne Göre Değerlendirilmesi (1995-2005 Dönemi)”, Ulusal Bağımsızlık İçin Türkiye İktisat Politikaları Kurultayı, Haziran 13-16, 2006, Malatya
Lau, A.K.W., Tang, E., Yam, R., (2010). “Effects of supplier and customer integration on product innovation and performance: empirical evidence in Hong Kong manufacturers”. Journal of Product Innovation Management 27 (5), 761–777.
Lederman, D. Olarreage, M., Rubiano, E. (2006).“Latin America’s Trade Specialization and China and India’s Growth.”, Office of the Chief Economist for Latin America and the Caribbean, The World Bank, www.worldbank.org/lac.
Horaa, M., Bapuji, H., Roth, A.V. (2011), “Safety hazard and time to recall: The role of recall strategy, product defect type, and supply chain player in the U.S. toy industry”, Journal of Operations Management 29 (2011) 766–777
Mok V., Yeung, G., Han, Z., Li, Z. (2007). “Leverage, Technical Efficiency and Profitability: an application of DEA to foreign-invested toy manufacturing firms in China”, Journal of Contemporary China, 16:51, 259-274,
Özhan M. (1997), Türkiye’de Çocuk Oyunları Kültürü, Feryal Matbaası, Ankara
Özyürek, A., Erzurumluoğlu, Ş. (2016). “Oyuncak Satıcılarının Bakış Açısından Bireylerin Oyuncak Satın Alma Davranışlarının İncelenmesi”. Uluslararası Erken Çocukluk Eğitimi Çalışmaları Dergisi, 1(1).

THE POWER OF COMPETITIVENESS OF THE TOY SECTOR IN TURKEY AND THE NECCESITY OF SPECIALIZED TOY ORGANISED INDUSTRIAL ZONES
30
PAGEV (2007), “Türkiye Oyuncak Sektör İzleme Raporu”, https://www.pagev.org/turkiye-oyuncak-sektor-raporu-2017-6-aylik-599296886bb66
Peng, M.W., Chen H. (2011) “Strategic Responses to Domestic and Foreign Institutional Pressures”, International Studies of Management & Organization, 41:2, 88-105
Peter, O. and Tiffany, M. (1984). “Parental toychoice stereotyping and its effects on child toy preference and sex-role typing”. Journal of Social behavior and personality, 12(2): 213–216.
Rivlin, P. (2000). Trade Potential in the Middle East: Some Optimistic Findings. Middle East Review of International Affairs. 4(1). 60. 56-66)
Rüşvanlı, H.O. (2007). “Türkiye’de Oyuncak Sektöründe Yeni Ürün Tasarımını Tetikleyen Faktörler”, Yayımlanmamış Yüksek Lisans Tezi, İstanbul Teknik Üniversitesi, İstanbul
Sun, H., Wing W.C. (2005), “Critical success factors for new product development in the Hong Kong toy industry”, Technovation 25 (2005) 293–303
Vollrath, T. L., (1991) “A Theoretical Evaluation of Alternative Trade Intensity Measures of Revealed Comparative Advantage”, Weltwirtschaftliches Archiv, 127: 265-280.