chapter vi- moderate risk waste management
TRANSCRIPT

Chapter 5: Moderate Risk Waste Management
Solid Waste in Washington State – 21st Annual Status Report 115
Total MRW collected in 2011 was about 23.8
million pounds.
The average amount of HHW disposed of per
participant was 53.4 pounds, and per capita was
1.62 pounds.
More than 3.3 percent of Washington residents
used a fixed facility or collection event to remove
hazardous waste from their households, about 7.8
percent of all households.
Counties that publicly collected the most CESQG
waste per capita were Lewis, Yakima, Skagit,
Whatcom and Kitsap.
Counties that collected the most used oil per capita
were Garfield, Stevens, Skamania, Columbia,
Lincoln and Wahkiakum.
Approximately 81 percent of all MRW collected
was recycled, reused or used for energy recovery.
Chapter 5: Moderate Risk Waste Management
The term “moderate risk waste” (MRW) was created by
revisions to Washington State’s 1986 Hazardous Waste
Management Act (RCW 70.105). MRW is a combination of
household hazardous waste (HHW) and conditionally exempt small quantity generator (CESQG)
waste. HHW is waste created in the home, while CESQG is small quantities of business or non-
household waste. Both HHW and
CESQG waste are exempt from state
hazardous waste regulations.
MRW collections started in the
early 1980s primarily as HHW-
only events, also known as
“roundups” or collection events.
These events usually happened
once or twice a year.
In the late 1980s, permanent
collection facilities now known as
fixed facilities began to replace
collection events to fulfill the need
for year-round collection. In
addition, collection facilities have
further developed with mobile
units and satellite facilities. These
efforts resulted in a larger number
of customers served, decreased
costs and increased reuse and
recycling of MRW.
Please note the data in this chapter
is only a portion of the MRW
waste stream. The MRW data
presented here is reported through local governments, with a few private companies also
reporting because they have a solid waste permit issued by the appropriate local authority.
Chapter 4 includes additional statewide data.

Chapter 5: Moderate Risk Waste Management
Solid Waste in Washington State – 21st Annual Status Report 116
Funding
RCW 70.105.235 authorizes Ecology to provide financial assistance through grants to locals for
preparing, updating and implementing local Hazardous Waste Plans, which detail local MRW
programs. Ecology uses the Coordinated Prevention Grants program (CPG) to provide pass-
through funding to local governments for these purposes. CPG is historically funded by the
Local Toxics Control Account (LTCA).1 However, the 2009-11 funding comes from the State
Building and Construction Account (SBCA). LTCA funds were transferred to the General Fund
to help balance the state budget. SBCA is funded through bonds that are sold by the state
treasurer.
All local governments in the state of Washington have completed Hazardous Waste (HW) Plans.
See Chapter 2 for the status of plans in each county. Every local HW plan must address:
HHW collection.
Household and public education.
Small business technical assistance.
Small business collection assistance.
Enforcement.
Used oil collection and education.
Accuracy of Data Collection
Ecology created and circulates a standard reporting form to all MRW programs. However, the
reported data can vary depending on a program’s collection process, and how data is reported and
interpreted. All programs must provide individual MRW reports.
2011 Data
Chapter 173-350 WAC, Solid Waste Handling Standards, requires local programs to submit MRW
report forms annually. Annual reports are required to be submitted by April 1 for the previous
calendar year collections. Information received from local programs through MRW annual reports
provides Ecology with data on MRW infrastructure, collection trends, costs, waste types received
at collection events and fixed facilities, and disposition of wastes collected. Ecology translates this
data into the information contained in this chapter and designs it to be specifically useful to those
who operate or work in MRW programs in Washington State.
1 Authorized by RCW 82.21.030 (Chapter 82.21 RCW, Hazardous substance tax -- Model toxics control act).

Chapter 5: Moderate Risk Waste Management
Solid Waste in Washington State – 21st Annual Status Report 117
This year’s report focuses on 2011 data with some comparisons to data published in previous
years’ reports. In an effort to provide useful information for individual programs, data is provided
in categories by county size.
In 2011, Douglas and Mason Counties did not report any HHW or used oil collections. Private
collectors provided the numbers shown in this report for Douglas and Mason Counties. Due to
budget constraints some counties have decided to reduce hours of operations at their fixed
facilities or have discontinued or reduced collection events. Figure 5.1 shows the percentage of
the state population that resides in counties of less than 50,000, 50,000 to 100,000, and more than
100,000.
Permanent fixed facilities now service most of the state. In 2011, Benton, Chelan, Douglas,
Ferry, Garfield, San Juan, Skamania and Wahkiakum counties did not have fixed facilities.
Garfield residents can use the facility in Asotin County and Cowlitz County conducts a mobile
event in Wahkiakum County. Benton, Chelan, Douglas, Ferry, San Juan and Skamania counties
conduct collection events.
In past reports, Ferry County was shown to have a fixed facility, but the facility is more properly
categorized as a limited MRW Facility. Benton County had a permanent fixed facility until
about mid-2010 when the facility was destroyed by a fire.
Collection services for CESQGs have leveled off statewide. In 2011, 17 fixed facilities serviced
CESQGs, and 4 different counties provided collection events for CESQGs.
6%
10%
84%
Figure 5.1 Percent of State Population by County Size
< 50 K
50 K-100 K
>100 K

Chapter 5: Moderate Risk Waste Management
Solid Waste in Washington State – 21st Annual Status Report 118
Table 5.1 shows the estimated population (based on data provided by the Office of Financial
Management) by size of individual counties. In Washington State there are 42 programs that
manage MRW. These programs include all 39 counties.
Table 5.1 Individual County Population by Size (2011)
< 50 K 50 K – 100 K > 100 K
Garfield 2,250 Walla Walla 58,800 Cowlitz 102,700
Wahkiakum 4,000 Mason 61,100 Skagit 117,400
Columbia 4,100 Clallam 71,600 Benton 177,900
Ferry 7,600 Chelan 72,700 Whatcom 202,100
Lincoln 10,600 Grays Harbor 72,900 Yakima 244,700
Skamania 11,150 Lewis 76,000 Kitsap 253,900
Pend Oreille 13,000 Island 78,800 Thurston 254,100
San Juan 15,900 Franklin 80,500 Clark 428,000
Adams 18,950 Grant 90,100 Spokane 472,650
Klickitat 20,500 50 K – 100 K Total 662,500 Snohomish 717,000
Pacific 20,900
Pierce 802,150
Asotin 21,650
King 1,942,600
Jefferson 30,050
> 100K Total 5,715,200
Douglas 38,650 Okanogan 41,200 Kittitas 41,300 Stevens 43,600 Whitman 44,800 < 50K Total 390,200
State Total 6,767,900

Chapter 5: Moderate Risk Waste Management
Solid Waste in Washington State – 21st Annual Status Report 119
Map 5.A shows which counties have permanent fixed facilities, the number of fixed facilities in
each county and which counties are likely to develop a permanent fixed facility in the future.
MRW Collected
As shown in Table 5.2, Washington programs collected approximately10.9 million pounds of
HHW, 7.8 million pounds of used oil (UO) and 4.9 million pounds of CESQG waste, for a total
of 23.8 million pounds of MRW during 2011.
Note: A computer programming error resulted in inflating numbers in the 2009 and 2010
reports. Table 5.2 below has been updated with the correct numbers for those years. The
numbers originally reported in 2009 and 2010 respectively were:
Collection Year HHW lbs (no UO)
Used Oil lbs CESQG lbs Total MRW lbs
2009 14,704,355 8,925,818 5,637,850 29,268,023
2010 14,858,912 9,435,676 5,198,109 29,492,697
Map 5.A 57 MRW Facilities as of 2011

Chapter 5: Moderate Risk Waste Management
Solid Waste in Washington State – 21st Annual Status Report 120
Table 5.2 Total Pounds per Waste Category 2000-11
Collection Year HHW lbs (no UO)
Used Oil lbs CESQG lbs Total
MRW lbs
2000 10.5M 8.3M 1.1M 19.8M
2001 15.6M 11.3M 1.0M 27.9M
2002 13.5M 9.2M 1.4M 24.1M
2003 16.0M 11.7M 1.3M 29.0M
2004 15.3M 12.4M 2.4M 30.1M
2005 14.7M 11.3M 6.3M 32.3M
2006 15.2M 10.0M 7.1M 32.3M
2007 14.9M 9.7M 7.6M 32.2M
2008 14,163,842 8,606,794 8,336,030 31,106,666
2009 12,257,316 8,916,633 4,867,334 26,041,283
2010 11,572,466 9,218,395 5,387,903 26,178,764
2011 10,965,429 7,857,614 4,977,625 23,800,668
Collection by Waste Category and Type
As shown in Table 5.3, the most dominant waste types of MRW collected in 2011 were non-
contaminated used oil, antifreeze, latex paint, oil-based paint, paint related materials, and
flammable liquids. These totals include used oil and antifreeze collected at all collection sites.
These six specific waste types accounted for approximately 70 percent of the estimated 23.8
million pounds of MRW collected in 2011.
Table 5.3
Six Most Dominant MRW Waste Types Collected in 2011
Waste Type Total Lbs.
Non-Contaminated Used Oil 7,822,541
Antifreeze 2,501,624
Latex Paint 2,198,653
Oil-based Paint 1,672,954
Paint Related Materials 1,418,887
Flammable Liquids 1,010,074
Total 16,624,733

Chapter 5: Moderate Risk Waste Management
Solid Waste in Washington State – 21st Annual Status Report 121
Table 5.4 provides summary information on total pounds of MRW collected from HHW and
CESQG (publicly and privately collected) categories by waste types. Some waste type
categories were changed and a few new ones added to the annual report form beginning in 2007.
Table 5.4 Total Pounds of MRW Collected by Waste Category in 2011
Waste Type HHW CESQG Total
Acids 146,220 37,348 183,568
Acids (Aerosol Cans) 514 373 887
Aerosols (Consumer Commodities) 150,816 33,241 184,057
Antifreeze 662,695 1,838,929 2,501,624
Bases 205,851 28,862 234,713
Bases, Aerosols 107 3 110
Batteries (Auto Lead Acid) 816,183 52,929 869,112
Batteries (Small Lead Acid) 19,975 7,219 27,194
Batteries (Dry Cell) 320,862 22,003 342,865
Batteries (Nicad/NIMH/Lithium) 32,573 15,533 48,106
CFCs 3,497 350 3,847
Chlorinated Solvents 942 4,147 5,089
Compressed Gas Cylinders 291 653 944
CRT’s 616,786 12,774 629,560
Cyanide Solutions 72 69 141
Dioxins 0 5,500 5,500
Electronics 587,414 30,176 617,590
Fire Extinguishers 10,335 1,445 11,780
Flammable Solids 5,766 25,494 31,260
Flammable Liquids 704,341 305,733 1,010,074
Flammable Liquids, Aerosols 0 0 0
Flammable Liquids Poison 116,160 13,746 129,906
Flammable Liquid Poison, Aerosols 26,801 114 26,915
Flammable Gas (Butane/Propane) 107,981 2,710 110,691
Flammable Gas Poison 1,287 0 1,287
Flammable Gas Poison, Aerosols 70,088 1,509 71,597
Latex Paint 2,075,971 122,682 2,198,653
Latex Paint, Contaminated 279,180 49,309 328,489
Mercury Compounds (Dental Amalgam) 30 8,038 8,068

Chapter 5: Moderate Risk Waste Management
Solid Waste in Washington State – 21st Annual Status Report 122
Waste Type HHW CESQG Total
Mercury Containing Batteries (Button, etc) 90 3 93
Mercury Devices (Monometers, Barometers, etc.) 654 36 690
Mercury (Fluorescent Lamps & CFLs) 253,737 178,751 432,488
Mercury (Pure Elemental) 380 199 579
Mercury (Switches & Relays) 35 18 53
Mercury (Thermostats/Thermometers) 1,525 658 2,183
Nitrate Fertilizer 4,920 40 4,960
Non-PCB Containing Light Ballasts 2,382 10,159 12,541
Non-Regulated Liquids 49,024 276,932 325,956
Non-Regulated Solids 122,851 282,762 405,613
Oil-Based Paint 1,479,170 193,784 1,672,954
Oil-Based Paint, Contaminated 41,620 84,574 126,194
Oil Contaminated (oily H2O, oil w/PCB’s, etc.) 14,171 336,525 350,696
Oil Filters 196,517 10,677 207,194
Oil Filters Crushed 12,462 600 13,062
Oil Non-Contaminated 7,611,321 211,220 7,822,541
Oil Stained Rags, Absorbent Pads, etc. 3,793 14,186 17,979
Organic Peroxides 1,850 673 2,523
Other Dangerous Waste 10,758 671,548 682,306
Oxidizers 42,493 4,971 47,464
Paint Related Materials 1,171,529 247,358 1,418,887
PCB Containing Light Ballasts 28,061 16,935 44,996
Pesticide/Poison Liquid 312,999 18,640 331,639
Pesticide/Poison Solid 181,350 15,335 196,685
Photo/Silver Fixer 324 17,799 18,123
Reactives 18,277 2,264 20,541
Tar and/or Adhesives 14,528 3,757 18,285
Used Cooking Oil 39,816 0 39,816
MRW TOTAL 18,579,375 5,221,293 23,800,668
* These totals do not match the HHW and CESQG totals in Table 5.2 because these contain used oil, which was separated out in
Table 5.2. Also, in past reports most of the used oil was included with the CESQG totals. It is impossible to know if used oil
collected at facilities such as Jiffy Lube is HHW or CESQG. However, it seems more reasonable that most of it is HHW rather
than CESQG. Therefore, since 2008 it is now included with the HHW total in Table 5.4 instead of the CESQG total as in the
past. Note: In 2011 MRW facilities recycled 292,229 pounds of materials such as propane tanks, cardboard, paint cans, etc.
This number is not included in any of the data in the above table or elsewhere in this Chapter. It is noted here because it is a
waste stream that MRW facilities must deal with. The majority of MRW facilities manage these recyclables appropriately.

Chapter 5: Moderate Risk Waste Management
Solid Waste in Washington State – 21st Annual Status Report 123
Disposition of MRW Waste
The disposition of MRW collected is generally well managed. Most MRW is recycled or used
for energy recovery. Very little of the MRW collected is safe for solid waste disposal. Seven
percent of all MRW is disposed at a hazardous waste landfill or incinerator. Figure 5.2 shows
final disposition of MRW between recycled, reused, energy recovery, hazardous waste landfill or
incineration, solid waste landfill, and disposal through a wastewater treatment plant.
Figure 5.2 2011 MRW Final Disposition
MRW Data
Table 5.5 shows various data by county. HHW data is based on fixed facility and collection
event information, but does not include HHW collected at used oil sites as participation numbers
are not tracked at these sites. This last column of this table represents all MRW collected in that
county, including privately collected CESGQ wastes. The included private collection data was
first presented this way in 2008, with previous reports including this data for Pierce and King
Counties only. This information can be used to evaluate efficiencies within each county by
comparing percentage of participants per housing units and costs, and HHW pounds per
participant.
Housing units are the number of households in each county. This data is used instead of per
capita because participants typically represent a household.
Solid Waste Landfill 11%
Energy Recovery 31%
Haz Waste Landfill/
Incineration 7%
Recycled 49%
Waste Water Treatment 1%
Reused 1%

Chapter 5: Moderate Risk Waste Management
Solid Waste in Washington State – 21st Annual Status Report 124
Table 5.5 Various HHW Data by County
County Housing
Units
HHW
Participants
% Participant / Housing
Units
HHW Cost /
Participant
HHW lbs / Participant
HHW Total lbs
HHW, SQG, & Used Oil
From Limited
Sites Total lbs
Adams^ 6,277 0 0% $0 0.00 858 4,803
Asotin 9,901 2,000 20.2% $64.74 78.08 156,159 191,609
Benton^^ 69,615 0 0% $0 0.00 4,234 104,909
Chelan 35,534 730 2.1% $123.38 197.30 144,029 280,243
Clallam 35,767 658 1.8% $119.12 152.42 100,295 295,304
Clark 168,414 13,006 7.7% $52.82 157.80 2,052,345 3,242,735
Columbia^ 2,147 0 0% $0 0.00 960 15,822
Cowlitz 43,584 1,638 3.8% $81.70 281.23 460,658 757,921
Douglas* 16,098 0 0% $0 0.00 0 7,064
Ferry 4,419 22 .5% $78.39 17.63 388 2,956
Franklin 25,017 308 1.2% $27.78 11.86 3,652 18,849
Garfield 1,231 Inc. w/ Asotin
Inc. w/ Asotin
Inc. w/ Asotin
Inc. w/ Asotin
Inc. w/ Asotin 18,267
Grant 35,399 253 .7% $200.55 104.00 26,309 75,643
Grays Harbor 35,261 1,715 4.9% $169.69 63.38 108,690 262,356
Island 40,420 2,513 6.2% $92.27 198.15 497,943 710,634
Jefferson 17,883 1,035 5.8% $63.07 42.47 43,953 105,589
King 857,359 67,271 7.9% $49.78 44.31 2,980,584 6,340,255
Kitsap 107,357 8,406 7.8% $95.04 86.24 724,915 1,225,795
Kittitas 22,096 581 2.6% $132.55 118.74 68,987 175,436
Klickitat 9,888 8,400 85% $2.94 9.19 77,220 199,567
Lewis 34,300 961 2.8% $113.62 251.01 241,221 492,515
Lincoln 5,811 308 5.3% $30.38 166.48 51,276 93,406
Mason* 32,687 0 0% $0 0.00 0 2,968
Okanogan 22,257 399 1.8% $139.73 28.32 11,300 39,592
Pacific 15,551 192 1.2% $100.91 85.94 16,500 52,692
Pend Oreille 7,939 7,910 99.6% $5.69 12.00 94,928 117,761
Pierce 327,308 9,575 2.9% $56.55 40.44 387,205 1,565,283
San Juan 13,403 217 1.6% $165.59 165.76 35,970 61,589
Skagit 51,725 4,721 9.1% $69.03 42.66 201,400 443,447
Skamania 5,662 169 3% $105.81 135.50 22,899 90,037
Snohomish 288,439 9,972 3.5% $70.78 80.70 804,739 2,248,793
Spokane 202,445 34,000 16.8% $8.92 17.04 579,320 1,719,458
Stevens^^ 21,238 0 0% $0 0.00 3,259 188,864
Thurston 109,197 14,491 13.3% $30.00 29.20 423,025 756,090

Chapter 5: Moderate Risk Waste Management
Solid Waste in Washington State – 21st Annual Status Report 125
County Housing
Units
HHW
Participants
% Participant / Housing
Units
HHW Cost /
Participant
HHW lbs / Participant
HHW Total lbs
HHW, SQG, & Used Oil
From Limited
Sites Total lbs
Wahkiakum 2,080
Inc. w/ Cowlitz
Inc. w/ Cowlitz
Inc. w/ Cowlitz
Inc. w/ Cowlitz
Inc. w/ Cowlitz 16,597
Walla Walla 23,530 1,858 7.9% $86.38 36.86 68,487 138,685
Whatcom 91,219 7,046 7.7% $43.50 28.04 197,559 519,417
Whitman 19,367 894 4.6% $51.08 32.64 29,184 51,946
Yakima 85,911 4,012 4.7% $76.98 86.00 344,978 1,165,771
STATEWIDE 2,903,736 205,261 7.1% $56.39 53.42 10,965,429 23,800,668
* These counties did not report in 2011 and total pounds shown represents the amount private companies collected from CESQG's in those jurisdictions. ^^ These counties scaled back operations in 2011 and HHW pounds reported represent those collected at limited MRW sites and CESQG amounts reported are from private companies. ^ These counties did not report participation or cost information numbers in 2011
Household Hazardous Waste (HHW)
Participants per Housing Unit
Counties that exhibit ten percent or higher of participants per housing unit provide excellent
public education to encourage use of facilities or events, have very convenient locations for their
collection facilities, or both. The participation number and rate for Klickitat and Pend Oreille
counties seem high, but were verified before this report was completed.
Cost per Participant and Overall HHW Cost Breakdown
This statistic is hard to compare, because of the many variables in program costs. Some programs
record every cost, whether direct or indirect; others record only the disposal and basic operation
costs.
Larger counties have the advantage of efficiency in scale, both in quantities received and in
disposition options. Also, there are differences in service levels of the basic program, accounting
differences, and errors. However, this data does provide an idea of what is possible and an incentive
to contact those counties that seem to operate efficiently. According to annual reports submitted to
Ecology, HHW programs spent just more than $11.5 million in 2011 statewide (does not include
CESQG costs). In 2010, HHW programs spent approximately $8.5 million. The increase in HHW
costs by approximately $3 million is mostly due to the construction of a new facility. Figure 5.3
shows the overall breakdown of HHW costs as reported to Ecology.

Chapter 5: Moderate Risk Waste Management
Solid Waste in Washington State – 21st Annual Status Report 126
HHW Pounds per Participant and per Capita The average pounds collected statewide per participant for HHW was 53.42. Table 5.6 shows
the top five counties with the highest collections of HHW in pounds per capita (not participant)
for 2009-2011. Statewide, HHW pounds per capita collected was 1.62 pounds.
Table 5.6
High Collections of HHW (No Used Oil Sites) Pounds per Capita by County in 2009-11
HHW 2009 HHW 2010
HHW 2011
County Size Lbs County Size Lbs County Size Lbs
Employee/ Contractor
Costs 35.5%
Educational Costs .5%
Advertising Costs 1%
Operating Costs 11%
Disposal Costs 32%
Capital Costs 20%
Figure 5.3 2011 HHW Costs
Pend Oreille <50K 6.28 Thurston >100K 7.68 Pend Oreille <50K 7.30
San Juan <50K 5.80 Cowlitz >100K 6.65 Asotin <50K 7.21
Thurston >100K 5.41 Clark >100K 5.15 Island 50-100K 6.32
Snohomish >100K 4.61 Lincoln <50K 4.67 Lincoln <50K 4.84
Klickitat <50K 4.27 Klickitat <50K 4.25 Clark >100K 4.80
Chapter 5: Moderate Risk Waste Management
Solid Waste in Washington State – 21st Annual Status Report 127
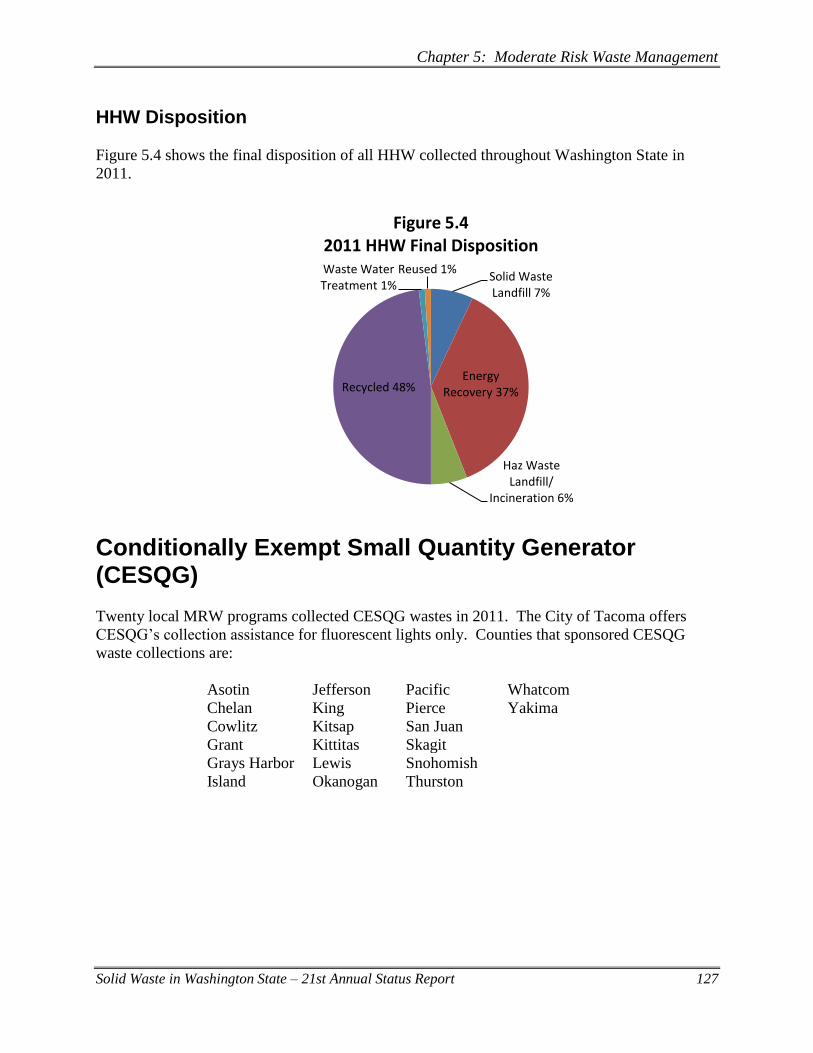
HHW Disposition
Figure 5.4 shows the final disposition of all HHW collected throughout Washington State in
2011.
Conditionally Exempt Small Quantity Generator (CESQG)
Twenty local MRW programs collected CESQG wastes in 2011. The City of Tacoma offers
CESQG’s collection assistance for fluorescent lights only. Counties that sponsored CESQG
waste collections are:
Asotin Jefferson Pacific Whatcom
Chelan King Pierce Yakima
Cowlitz Kitsap San Juan
Grant Kittitas Skagit
Grays Harbor Lewis Snohomish
Island Okanogan Thurston
Solid Waste Landfill 7%
Energy Recovery 37%
Haz Waste Landfill/
Incineration 6%
Recycled 48%
Waste Water Treatment 1%
Reused 1%
Figure 5.4 2011 HHW Final Disposition

Chapter 5: Moderate Risk Waste Management
Solid Waste in Washington State – 21st Annual Status Report 128
The top five counties that publicly collected the most CESQG waste per capita in 2011 were:
Lewis
Yakima
Skagit
Whatcom
Kitsap
Table 5.7 shows the total amount of CESQG waste collected publicly and privately in each
county. When we take into account both public and private collection numbers, the top five
counties for CESQG collections per capita in 2011 were:
Klickitat
Clark
Skamania
Spokane
Yakima

Chapter 5: Moderate Risk Waste Management
Solid Waste in Washington State – 21st Annual Status Report 129
Table 5.7
2011 Washington State Public and Private CESQG Collections in Pounds by County
County
Publicly Collected CESGQ Waste
Public CESQG
Waste Collected/Capita
Privately Collected CESGQ Waste
Total CESQG Waste Collected
Total CESQG Waste
Collected/Capita
Adams 0 0 3,682 3,682 .19
Asotin 1,095 .05 1,573 2,668 .12
Benton 0 0 28,791 28,791 .16
Chelan 8,502 .12 17,270 25,772 .35
Clallam 0 0 26,717 26,717 .37
Clark 0 0 1,110,753 1,110,753 2.60
Columbia 0 0 792 792 .19
Cowlitz 11,122 .11 7,344 18,466 .18
Douglas 0 0 7,064 7,064 .18
Ferry 0 0 0 0 0
Franklin 0 0 15,197 15,197 .19
Garfield 0 0 267 267 .12
Grant 1,238 .01 13,790 15,028 .17
Grays Harbor 12,761 .18 8,596 21,357 .29
Island 25,139 .32 5,873 31,012 .39
Jefferson 6,272 .21 4,059 10,331 .34
King 172,727 .09 1,210,263 1,382,990 .71
Kitsap 104,052 .41 25,970 130,022 .51
Kittitas 1,264 .03 8,430 9,694 .24
Klickitat 0 0 86,013 86,013 4.20
Lewis 66,194 .87 9,505 75,699 .99
Lincoln 0 0 7,130 7,130 .67
Mason 0 0 2,968 2,968 .05
Okanogan 0 0 3,879 3,879 .09
Pacific 3,854 .18 1,073 4,927 .24
Pend Oreille 0 0 260 260 .02
Pierce* 4,568 .01 695,855 700,423 .87
San Juan^ ? ? 0 ? ?
Skagit 71,628 .61 24,694 96,322 .82
Skamania 0 0 22,098 22,098 1.98
Snohomish 103,623 .15 120,301 223,924 .31
Spokane 0 0 621,298 621,298 1.31
Stevens 0 0 3,763 3,763 .09
Thurston 25,010 .10 46,308 71,318 .28
Wahkiakum 0 0 3,772 3,772 .94
Walla Walla 0 0 21,114 21,114 .36
Whatcom 93,522 .46 83,308 176,830 .88
Whitman 0 0 8,332 8,332 .19
Yakima 207,064 .85 43556 250,620 1.02
Statewide Totals
919,635 .14 4,301,658 5,221,293 .77
* City of Tacoma’s CESQG program collects fluorescent lighting only.
^ San Juan’s CESQG totals were included in the HHW numbers and cannot be pulled out

Chapter 5: Moderate Risk Waste Management
Solid Waste in Washington State – 21st Annual Status Report 130
Table 5.8 shows the total amount of CESQG waste collected publicly and privately by waste
type. Excluding the “Other DW” category, the top five CESQG waste types collected in 2010
were:
Antifreeze
Used Oil – Contaminated (oily water, etc)
Flammable Liquids
Oil-Base Paint
Paint Related Materials

Chapter 5: Moderate Risk Waste Management
Solid Waste in Washington State – 21st Annual Status Report 131
Table 5.8 Washington State Public and Private CESQG Collections
for 2011 by Waste Type
Waste Type Public
Collections Private
Collections Totals
Antifreeze 17,146 1,821,783 1,838,929
Other DW 7,356 664,192 671,548
Used Oil-Cont. (oily water, etc) 20,349 316,176 336,525
Flammable Liquids 119,727 186,006 305,733
Paint - Oil Base 161,871 31,913 193,784
Paint Related Materials 46,564 200,794 247,358
Non-Regulated Solids 4,006 278,756 282,762
Non-Regulated Liquids 38,018 238,914 276,932
Mercury Collections 131,368 56,335 187,703
Used Oil - Non-Contaminated 43,768 167,452 211,220
Paint – Latex 115,471 7,211 122,682
Paint - Oil Base –Contaminated 6,358 78,216 84,574
Batteries – Auto Lead Acid 50,127 2,802 52,929
Paint - Latex Contaminated 14,397 34,912 49,309
Acids 23,134 14,214 37,348
Aerosols - Consumer Commodities 6,643 26,598 33,241
Electronics 3,272 26,904 30,176
Bases 17,768 11,094 28,862
Flammable Solids 3,254 22,240 25,494
Batteries - Alkaline/Carbon 8,381 13,622 22,003
Pesticides - Poison/Liquid 6,137 12,503 18,640
Photo/Silver Fixer 6,915 10,884 17,799
PCB Containing Light Ballasts 10,127 6,808 16,935
Batteries-Nicad/Lithium 5,077 10,456 15,533
Pesticides - Poison/Solids 12,111 3,224 15,335
Oil Stained Rags, Absorbent Pads, etc. 2,982 11,204 14,186
Flammable Liquid Poison 13,746 0 13,746
CRT’s 0 12,774 12,774
Oil Filters 3,991 7,286 11,277
Non-PCB Containing Light Ballasts 8,893 1,266 10,159
Batteries - Small Lead Acid 2,468 4,751 7,219
Dioxins 0 5,500 5,500
Oxidizers 2,602 2,369 4,971
Chlorinated Solvents 194 3,953 4,147
Tar/Adhesives 2,122 1,635 3,757
Flammable Butane/Propane 111 2,599 2,710
Reactives 40 2,224 2,264
Flammable Gas Poison – Aerosols 1,509 0 1,509
Fire Extinguishers 422 1,023 1,445
Organic Peroxides 476 197 673
Compressed Gas Cylinders 49 604 653
Acids – Aerosols 376 0 376
CFC’s 50 300 350
Flammable Liquid Poison – Aerosols 114 0 114
Cyanide Solutions 4 65 69
Nitrate Fertilizer 40 0 40
Totals 919,635 4,301,658 5,221,293

Chapter 5: Moderate Risk Waste Management
Solid Waste in Washington State – 21st Annual Status Report 132
CESQG Disposition
Sixty-five percent of all CESQG waste collected in 2011 was either recycled or used for energy
recovery. See Figure 5.5 for the complete disposition of CESQG wastes in 2011. There are
several differences between final disposition of HHW and CESQG wastes worth noting:
37 percent of HHW was sent for energy recovery versus 13 percent of CESQG wastes.
Less HHW waste gets landfilled (13%) compared to CESQG waste (31%).
Figure 5.5 2011 CESQG Final Disposition
Collection/Mobile Events
Table 5.9 represents the number of mobile and collection events held statewide from 2009-11.
The number of events decreased from for the first time since we began tracking this number over
the last two years (141 events in 2009 to the 120 events in 2011).
The amount of waste collected through these types of events was approximately 2 million
pounds in 2011, which is approximately 8 percent of all MRW collected in 2011. The Waste
Mobile in King County conducted 45 mobile events that collected a little more than 1 million
pounds of MRW in 2011.
Solid Waste (Landfilled) 23%
Energy Recovery 13%
Haz Waste Landfill/
Incineration 8%
Recycled 52%
Waste Water Treatment 3%
Reused 1%

Chapter 5: Moderate Risk Waste Management
Solid Waste in Washington State – 21st Annual Status Report 133
Table 5.9 2009-11 Collection/Mobile Event Collection Amounts
Used Oil Sites
In 2011, facilities and collection sites reported collecting a total of 7,857,614 pounds of used oil.
Used oil collection peaked statewide (12.4 million pounds) in 2004 and has mostly steadily
declined over the years. Used oil collections need to be continually monitored. There are more
cars on the road than ever, so one would expect this category to keep increasing. The recent
trend to change oil every 5,000 miles compared to 3,000 miles and less do-it-yourself oil
changers may be impacting this category. Table 5.10 shows the six counties with the highest
collections in pounds per capita by county size for 2009-11.
Table 5.10 Used Oil High Collection Counties - Pounds per Capita by County Size
Collected at Facilities and Used Oil Collection Sites 2009-11
Used Oil Sites - 2009 Used Oil Sites - 2010 Used Oil Sites – 2011
County Size Lbs County Size Lbs County Size Lbs
Statewide Level of Service
The Washington State Office of Financial Management reported that as of 2011, Washington
State had an estimated 2,903,736 housing units2. MRW Annual Reports revealed there were
205,261 participants who used the services of either an MRW collection event or MRW fixed
2This information was downloaded from Web site http://ww.ofm.wa.gov/
Type of Event
Number of Events
2009 2010 2011
Pounds Collected
2009 2010 2011
Mobile 99 79 73 1,574,873 1,606,286 1,130,122
Collection 42 46 47 507,311 439,572 876,410
Totals: 141 125 120 2,082,184 2,045,858 2,006,532
Garfield <50K 8.0 Garfield <50K 7.8 Garfield <50K 8.0
Stevens <50K 4.3 Skamania <50K 4.1 Stevens <50K 4.2
Skamania <50K 3.8 Stevens <50K 4.0 Skamania <50K 4.0
Pend Oreille <50K 3.8 Lincoln <50K 3.8 Columbia <50K 3.4
Wahkiakum <50K 2.9 Wahkiakum <50K 3.5 Lincoln <50K 3.3
Cowlitz 50-100K
3.2 Cowlitz 50-100K 2.9 Wahkiakum <50K 3.1

Chapter 5: Moderate Risk Waste Management
Solid Waste in Washington State – 21st Annual Status Report 134
facility. The actual number of households served is larger, because most used oil sites do not
record or report numbers of participants. The actual number of households served is also larger,
because some participants counted at events or by facilities bring HHW from multiple
households.
One way to estimate the approximate number of households served is to add ten percent to the
participant values. This method gives an estimate of 225,787 participants served in 2011. This
number represents 7.8 percent of all households in Washington State. Table 5.11 shows the
percent of participants served statewide since 2001.
Table 5.11 Percent of Participants Served Statewide
Year Percent
Participants Served
Year Percent
Participants Served
2001 6.1 2007 9.1
2002 6.8 2008 8.7
2003 8.9 2009 8.3
2004 8.9 2010 7.9
2005 9.0 2011 7.8
2006 8.6
Trends in Collection
The majority of counties in Washington State have at least one fixed facility. While the number
of collection events held in 2011 declined, collection events can be a useful strategy to reach
residents inconveniently located from fixed facilities.
Overall, MRW collections leveled off between 2005 and 2007. 2008-11 has seen a significant
reduction in the amount of MRW collected with the biggest drops in 2009 and 2011. This is
most likely due to local policies of no longer collecting latex paint, a decrease in CESQG
antifreeze collections by private companies, and the overall state of the economy.
Also, as product stewardship programs become more prevalent in the future, collection numbers
may go down or up depending on how MRW programs are utilized by stewardship programs.
The Electronics Recycling Program started collecting covered electronic products in 2009. As
expected, MRW programs collected approximately 1.3 million pounds less in 2009 than 2008.
MRW programs collected close to two million pounds of electronics and CRTs in 2008
compared to a little more than 700,000 pounds in 2009, a little more than 1 million pounds in
2010, and a little more than 1.2 million pounds in 2011. For more information about the E-Cycle
Washington Program, see Chapter 2.

Chapter 5: Moderate Risk Waste Management
Solid Waste in Washington State – 21st Annual Status Report 135
Product Stewardship
Some other methods of managing MRW are gaining wider acceptance in Washington State and
across the country.
Product stewardship efforts have resulted in the statewide electronics recycling program. In
2010, the Washington State Legislature passed a product stewardship bill for mercury-containing
lighting products. Paint and rechargeable batteries legislation was introduced in the 2012
legislative session and brought back again in the 2013 legislative session.
This is a positive shift in MRW management as some manufacturers are beginning to accept
responsibility for the end-of-life management costs of their products versus externalizing those
costs onto public agencies.
It remains to be seen what role MRW facilities will play in the future as product stewardship
becomes more widespread. Will MRW facilities continue to collect products, but be reimbursed
by industry for management of their products, or will MRW facilities choose to let industry find
alternative locations and personnel to manage their programs?
Product stewardship principles have also guided establishment of the Take-it-Back Network in
King County, Snohomish County, Pierce County, Yakima County, and the city of Tacoma.
The Take-it-Back Network was set up by local governments and consists of “a group of
retailers, repair shops, nonprofit organizations, waste haulers and recyclers that offer
convenient options for recycling certain products that should not be disposed in the trash.”
Because the Take-it-Back Network is a voluntary program for businesses, it can be difficult to
get data on the total amount of materials brought back to them.

Chapter 5: Moderate Risk Waste Management
Solid Waste in Washington State – 21st Annual Status Report 136