chapter viii on the optical properties of blown and cast ... · immediately above the die itself....
TRANSCRIPT
Matthew B. Johnson Chapter VIII Optical Properties of PE Films ________________________________________________________________________
287
CHAPTER VIII
On the Optical Properties of Blown and Cast Polyethylene Films: Surface Versus Bulk Structural Considerations
ABSTRACT
In this paper we report on some surprising, and we believe new, findings regarding the
factors affecting the optical properties (haze) of polyethylene (PE) blown and cast films. A
comprehensive investigation of blown and cast films made from conventional Ziegler-Natta
catalyzed linear low density PE (LLDPE) as well as metallocene-catalyzed LLDPE
(mLLDPE) resins was conducted. The large majority of the contribution to the total haze in
the blown and cast films was observed to come from the surface roughness of the films, with
the bulk (internal) contribution being relatively minor. Using a variety of analysis and
characterization methods, including atomic force microscopy (AFM), small angle light
scattering (SALS), and wide angle x-ray scattering (WAXS), we determined that the surface
roughness in these films was a result of the development of distinct spherulitic-like
superstructures formed during the blown or cast film processing. Furthermore, these
superstructures were observed only in the mLLDPE blown films, and not in the LLDPE
blown films processed at similar conditions. Analysis of the rheological and molecular
characteristics of these various mLLDPE and LLDPE resins revealed that the mLLDPE resins
exhibited considerably lower molecular weight, narrower molecular weight distribution, lower
zero shear viscosity, and lower melt elasticity compared to the LLDPE resins of similar melt
index (MI). These observations support our general finding and primary conclusion from this
work that in PE blown and cast films made using typical processing conditions, the optical
haze properties are adversely affected due to enhanced surface roughness caused by the
formation of spherulitic-like superstructures in polymer melts that possess fast relaxing and
low melt elasticity rheological characteristics.
Matthew B. Johnson Chapter VIII Optical Properties of PE Films _______________________________________________________________________
288
8.1 INTRODUCTION The market for polyethylene film is enormous and is continually growing with a major
component of that market being for packaging. The optical properties of films (such as haze,
transparency or clarity, and transmittance) are key issues in packaging applications, since they
allow the consumer to “see” what is contained within the package. Hence the optical
properties are important features in the marketability of a particular product and control of
these properties is therefore required whether the film is utilized for food packaging, pallet
wrap, or other related applications.
The terms clarity, haze, turbidity, transparency, etc. are often used interchangeably, and
sometimes without distinction, to describe the optical properties of a product. However, it is
important to realize that these various terms and measures are different and can, on some
occasions, point in opposite directions. In this work, we have focused primarily on the haze
measurement as a proxy for the optical properties. Furthermore, since haze and clarity are
generally observed to be inversely dependent, i.e., high haze yields low (poor) clarity and
vice-versa, we use these two terms interchangeably.
In the case of polyethylene blown films, haze is affected by light scattering and
reflection/refraction due to both bulk and surface roughness effects. Previous publications1-4
have mentioned a loss of film clarity arising from bulk scattering and/or surface irregularities
that also promote turbidity due to surface effects. Such publications have rightly noted that
bulk scattering can arise from a number of sources including voids or any other internal
structural fluctuations that promote changes in refractive index on the scale of the wavelength
of light (400-700 nm), which are responsible for turbidity enhancement. In fact, there have
been numerous fundamental studies on the light-scattering characterization of semicrystalline
films of polyethylene as well as other polymers whereby the superstructure effects that
promote this turbidity are well quantified.5-10 For example in the case of spherulitic
superstructure, a morphology common to polymers crystallized without deformation, the
general theoretical relations indicate that the scattering by such structures roughly scales with
the sixth power of the radius11 and thereby indicate that, other factors being equal, a smaller
size superstructure will lead to higher clarity relative to a comparable anisotropic larger-scale
body. As a result, this particular point has distinctly been recognized in the cases of many
products such as molded bottles, etc. (particularly for isotactic polypropylene) where
clarifying agents (nucleating agents) are added for purposes of promoting a finer scale
superstructure which leads to a higher clarity product resulting in a higher margin of profit. A
Matthew B. Johnson Chapter VIII Optical Properties of PE Films _______________________________________________________________________
289
higher nucleation density also tends to enhance not only clarity but in addition, generally
improves mechanical properties - another desired side benefit from higher nucleation.
While the bulk scattering effects discussed above are important, it is now generally
recognized and accepted that the primary cause of poor optical properties (i.e. high haze) in
blown films is the surface roughness of the film.2-4,12,13 If indeed surface asperities exist on
the scale of the wavelength of light, considerable diffuse reflection and refraction effects
occur providing enhanced turbidity. Film or product smoothness is critical to decrease
turbidity as promoted by surface effects. For molded articles, surface roughness can often be
minimized by appropriate mold design and suitable release agents. However, in the case of
free-surface flows such as film blowing, the surface roughness is principally due to two main
causes viz. melt flow-induced phenomena and crystallization – the latter of which can be of
great importance to surface texture.
Surface roughness due to melt flow-induced phenomena occurs as a consequence of the
polymer melt elasticity and can range from the fine-scale surface irregularities (often referred
to as extrusion haze) to more gross scale surface irregularities such as sharkskin melt fracture,
“orange-peel” and “apple-sauce” textures.1 The severity of these various surface irregular ities
generally increase with output (shear) rate and are readily observed in the melt bubble
immediately above the die itself. Hence, there is often a balance in terms of what process
speeds can be utilized in order to minimize surface irregularities resulting from these
rheological instabilities. The crystallization-induced surface roughness phenomena in blown
films, while known to occur, are much less understood.
For the sake of completeness, it should be added that inhomogeneities such as gels,
inorganic particulate additives (such as talc or silica), scratches, etc. can also contribute to
poor clarity as a result of added light scattering either in the bulk or reflection/refraction
effects at the surface or some combination thereof.
Recently, we have undertaken a thorough study of the optical haze (or its inverse, clarity)
for blown polyethylene films. Specific focus has been directed toward a more complete
understanding of controlling the contribution from the surface roughness to film haze and i t is
this topic which we address. Of particular interest is the recognition that the newer
metallocene narrow molecular-weight distribution polymers tend to provide lower relaxation
times within the melt process thereby leading to the development of a somewhat spherulitic-
like superstructure in the final blown film – a point evidently not well recognized by the
Matthew B. Johnson Chapter VIII Optical Properties of PE Films _______________________________________________________________________
290
“blown film” community. This superstructure can play a major role in causing haze and it
will be considered as a focal point for the contents of this report.
8.2 EXPERIMENTAL Melt Rheological Characterization The resin samples were compression molded at 182 °C for a total of three minutes. The
samples were allowed to melt at a relatively low pressure for one minute and then subjected to
a high molding pressure for an additional two minutes. The molded samples were then
quenched in a cold (room temperature) press. 2 mm x 25.4 mm diameter disks were stamped
out of the molded slabs for rheological characterization.
Small-strain (10%) oscillatory shear measurements were performed at 190°C on a
Rheometrics Scientific, Inc. ARES rheometer using parallel-plate geometry to obtain the
complex viscosity (η*) versus frequency (ω) raw data. The test chamber of the rheometer
was blanketed in nitrogen in order to minimize polymer degradation. The rheometer was
preheated to the initial temperature of the study. Upon sample loading and after oven thermal
equilibration, the specimens were squeezed between the plates to a 1.6 mm thickness and the
excess was trimmed. A total of 8.0 minutes elapsed between the time the sample was inserted
between the plates and the time the frequency sweep (0.03 – 95 rad/s) was started. The |η*|
versus ω data were then curve fitted using the modified three parameter Carreau-Yasuda (CY)
empirical model to obtain the zero shear viscosity – η0. Details of the significance and
interpretation of the CY model may be found elsewhere.14,15,16,17
Melt Index (MI) was measured in accordance with ASTM D-1238, condition F (190°C,
2.16 kg). Density was measured using density gradient columns in accordance with ASTM
D-1505.
Molecular Weight Measurements By Gel Permeation Chromatography (GPC)
Molecular weight distribution (MWD), molecular weight averages (Mn, Mw, Mz) and
polydispersity (Mw/Mn) were obtained using a Waters 150 CV Plus Gel Permeation
Chromatograph using trichlorobenzene as the solvent with a flow rate of 1 mL/min at a
temperature of 140°C. BHT at a concentration of 0.5 g/L was used as a stabilizer in the
solvent. An injection volume of 220 µL was used with a nominal polymer concentration of 5
mg/3.5 mL of solvent (at room temperature). The column set consisted of two Waters
Styragel HMW 6E mixed-bed columns. A broad-standard integral method of universal
Matthew B. Johnson Chapter VIII Optical Properties of PE Films _______________________________________________________________________
291
calibration was used based on a Phillips Marlex BHB 5003 broad linear polyethylene
standard. Parameter values used in the Mark-Houwink equation ([η] = K· Ma) for
polyethylene were K = 39.5(10-3) mL/g and a = 0.726.
Blown Film Processing All the blown film samples were made on a laboratory-scale blown film line using typical
linear low-density (LLDPE) conditions as follows: 100 mm (4 inch) die diameter, 1.5 mm
(0.060 inch) die gap, 37.5 mm (1.5 inch) diameter single-screw extruder fitted with a barrier
screw with a Maddock mixing section at the end (L/D=24, 2.2:1 compression ratio), 115 RPM
screw speed [about 27 kg/h (60 lb/h) output rate], 2.5:1 blow up ratio (BUR), “in-pocket”
bubble with a “freeze line height” (FLH) between 20-28 cm (8-11 inch), 190 °C (375 °F)
barrel and die set temperatures and 1 mil (25 micron) thick film. Cooling was accomplished
with a Dual Lip air ring using ambient (laboratory) air at about 25 °C (75-80 °F). These
particular processing conditions were chosen since the film properties so obtained are
representative of those obtained from larger, commercial scale film blowing conditions.18
Cast Film Processing
The cast films for the study involving metallocene resin H spiked with the high Mw
Sample P, were obtained as follows. The cast films were all made on a Randcastle
Microtruder CF [Model RC-0625] which consisted of a table-top 16 mm (5/8 inch) single
screw extruder. The extruder was fitted with a 127 mm (5 inch) wide slot die with a die gap
of 0.5 mm (0.020 inch). The extruder and die temperatures were maintained at 204 °C (400
°F) and 215 °C (420 °F), respectively, resulting in a melt temperature of 196 °C (385 °F).
The screw speed was adjusted to maintain a constant output rate of about 520 g/h. The melt
as it exited the die was quenched using a pair of high velocity air-knives, held 25 mm (1 inch)
above and below the melt and at a distance of 100 mm (4 inch) downstream from the die exit.
The film, subsequent to crystallization and solidification, was taken up through a pair of
primary and secondary rollers onto a film winder. The take-up speed was adjusted to
maintain a nominal film thickness of 75 microns (3 mils) for all samples.
Matthew B. Johnson Chapter VIII Optical Properties of PE Films _______________________________________________________________________
292
Structural and Optical Techniques Utilized Atomic Force Microscopy (AFM) AFM micrographs were obtained with the use of a Digital Instruments Nanoscope III
Scanning Probe Microscope operated in tapping mode. Nanosensor TESP single-beam
cantilever tips possessing force constants of 35±7 N/m and oscillated at frequencies of ca. 290
kHz were used. The films were placed upon glass slides using double-sided tape with raster
scanning of the sample done parallel to the machine direction of the film.
Small-Angle Light Scattering (SALS)
Small-angle light scattering was accomplished utilizing a He-Ne laser with a wave length
of 632.8 nm. Only the Hv mode was utilized which represents where the polarization
direction of the incident beam is vertical (as is the machine direction, MD, of the films
discussed in this report) while the analyzer is horizontally oriented, respectively. The sample-
to-film distance was 10 centimeters unless otherwise stated within the text or figure captions.
Further details of this technique are described in detail elsewhere. 19
Differential Scanning Calorimetry (DSC)
DSC measurement was performed with a Perkin-Elmer DSC-7 operating at cooling rates
of 5°C/min, 30°C/min, or 80°C/min utilizing sample weights ca. 5 milligrams. Sample
temperatures were raised to 160°C for 10 minutes followed by cooling to follow
crystallization. The samples were then reheated to 160°C for 15 minutes followed by a second
crystallization run. In limited cooling studies on samples A, B, and C, trends within the DSC
cooling data remained the same for the three cooling rates used as well as being independent
of time spent in the melt. Heating scans were also done utilizing a heating rate of
30°C/minute with samples sizes of either 7.5 or 5 milligrams. Instrument calibration was
done using indium and tin samples. Baseline corrections were applied the standard
Perkin-Elmer software package.
Transmission Electron Microscopy (TEM) Transmission electron micrographs were taken with a Philips EM-420 scanning
transmission electron microscope (STEM) operated in the transmission mode at l00 kV.
Samples were prepared by staining with chlorosulfonic acid20,21 to greatly increase the
electron density of the amorphous phase thus providing sufficient contrast between the
amorphous and crystalline phases. The samples were placed in the chlorosulfonic acid
solution for approximately 2 hours at 60°C followed by washing and drying prior to being
Matthew B. Johnson Chapter VIII Optical Properties of PE Films _______________________________________________________________________
293
microtomed at room temperature. As a result the micrographs display darkened amorphous
regions and lighter crystalline lamella.
Haze Measurement
Haze is that percentage of the total transmitted light which, in passing through the
specimen, is scattered from the incident beam by more than 2.5°. The haze (%) was measured
in accordance with the procedures specified in ASTM D 1003-97. It should be noted here that
haze is a different measure than clarity (also referred to as transparency) since the latter, in
contrast, is the percentage of incident light which, in passing through the specimen, is
deflected by less than 0.1° from the axis of the incident light. The measurements were made
on a Haze Gard PlusTM instrument (Model 4725) made by the BYK-Gardner Company.
To separate the measured total haze into its bulk (or internal haze) and surface (or external
haze) components, the following procedure was employed. First, the haze of the as-blown
film sample was measured. This is the total haze of the film. Then a very thin layer of a
silicone oil [A-Series oil, refractive index (n) = 1.512 from Cargille Oil Company] of similar
refractive index to that of the film was applied to both sides, i.e. the outside surface of the
bubble and the inside surface of the bubble. The haze was measured again. This value is the
bulk contribution. Finally, the difference between the total haze value and bulk haze value
provided the surface haze contribution directly.
Materials
Several different metallocene (resins A, B, C, E, F, G and H) and Ziegler-Natta (Z-1 and
Z-2) catalyzed linear low density PE resins were used in this study. In addition, a chromium
catalyst resin (resin P) was used in the second part of this study as a minority blend
component. The basic resin specifications, molecular and thermal characteristics are provided
in Table 1.
8.3 RESULTS & DISCUSSION Details regarding molecular weight, rheological parameters, melting and melt
crystallization temperatures for the individual resins are given in Table 8.1. These will be
utilized in subsequent discussion.
Matthew B. Johnson Chapter VIII Optical Properties of PE Films _______________________________________________________________________
294
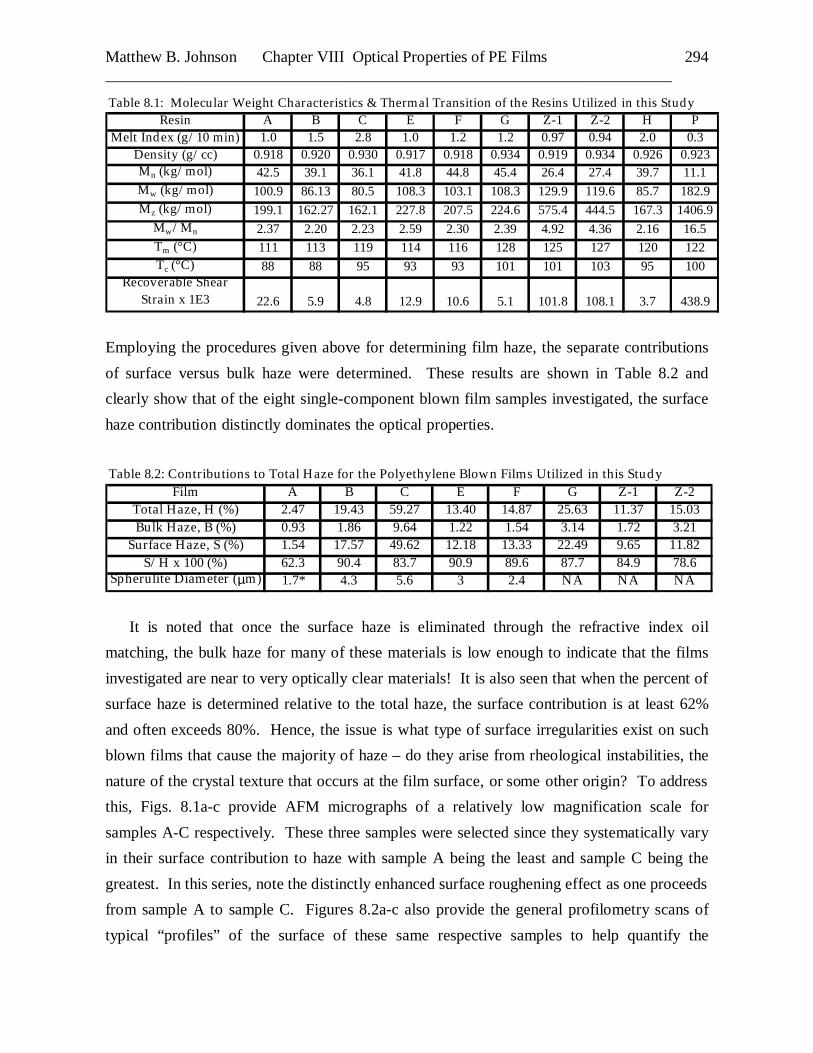
Table 8.1: Molecular Weight Characteristics & Thermal Transition of the Resins Utilized in this StudyResin A B C E F G Z-1 Z-2 H P
Melt Index (g/10 min) 1.0 1.5 2.8 1.0 1.2 1.2 0.97 0.94 2.0 0.3Density (g/cc) 0.918 0.920 0.930 0.917 0.918 0.934 0.919 0.934 0.926 0.923Mn (kg/mol) 42.5 39.1 36.1 41.8 44.8 45.4 26.4 27.4 39.7 11.1Mw (kg/mol) 100.9 86.13 80.5 108.3 103.1 108.3 129.9 119.6 85.7 182.9Mz (kg/mol) 199.1 162.27 162.1 227.8 207.5 224.6 575.4 444.5 167.3 1406.9
Mw/Mn 2.37 2.20 2.23 2.59 2.30 2.39 4.92 4.36 2.16 16.5Tm (°C) 111 113 119 114 116 128 125 127 120 122Tc (°C) 88 88 95 93 93 101 101 103 95 100
Recoverable Shear Strain x 1E3 22.6 5.9 4.8 12.9 10.6 5.1 101.8 108.1 3.7 438.9
Employing the procedures given above for determining film haze, the separate contributions
of surface versus bulk haze were determined. These results are shown in Table 8.2 and
clearly show that of the eight single-component blown film samples investigated, the surface
haze contribution distinctly dominates the optical properties.
Table 8.2: Contributions to Total Haze for the Polyethylene Blown Films Utilized in this StudyFilm A B C E F G Z-1 Z-2
Total Haze, H (%) 2.47 19.43 59.27 13.40 14.87 25.63 11.37 15.03Bulk Haze, B (%) 0.93 1.86 9.64 1.22 1.54 3.14 1.72 3.21
Surface Haze, S (%) 1.54 17.57 49.62 12.18 13.33 22.49 9.65 11.82S/H x 100 (%) 62.3 90.4 83.7 90.9 89.6 87.7 84.9 78.6
Spherulite Diameter (µm) 1.7* 4.3 5.6 3 2.4 NA NA NA
It is noted that once the surface haze is eliminated through the refractive index oil
matching, the bulk haze for many of these materials is low enough to indicate that the films
investigated are near to very optically clear materials! It is also seen that when the percent of
surface haze is determined relative to the total haze, the surface contribution is at least 62%
and often exceeds 80%. Hence, the issue is what type of surface irregularities exist on such
blown films that cause the majority of haze – do they arise from rheological instabilities, the
nature of the crystal texture that occurs at the film surface, or some other origin? To address
this, Figs. 8.1a-c provide AFM micrographs of a relatively low magnification scale for
samples A-C respectively. These three samples were selected since they systematically vary
in their surface contribution to haze with sample A being the least and sample C being the
greatest. In this series, note the distinctly enhanced surface roughening effect as one proceeds
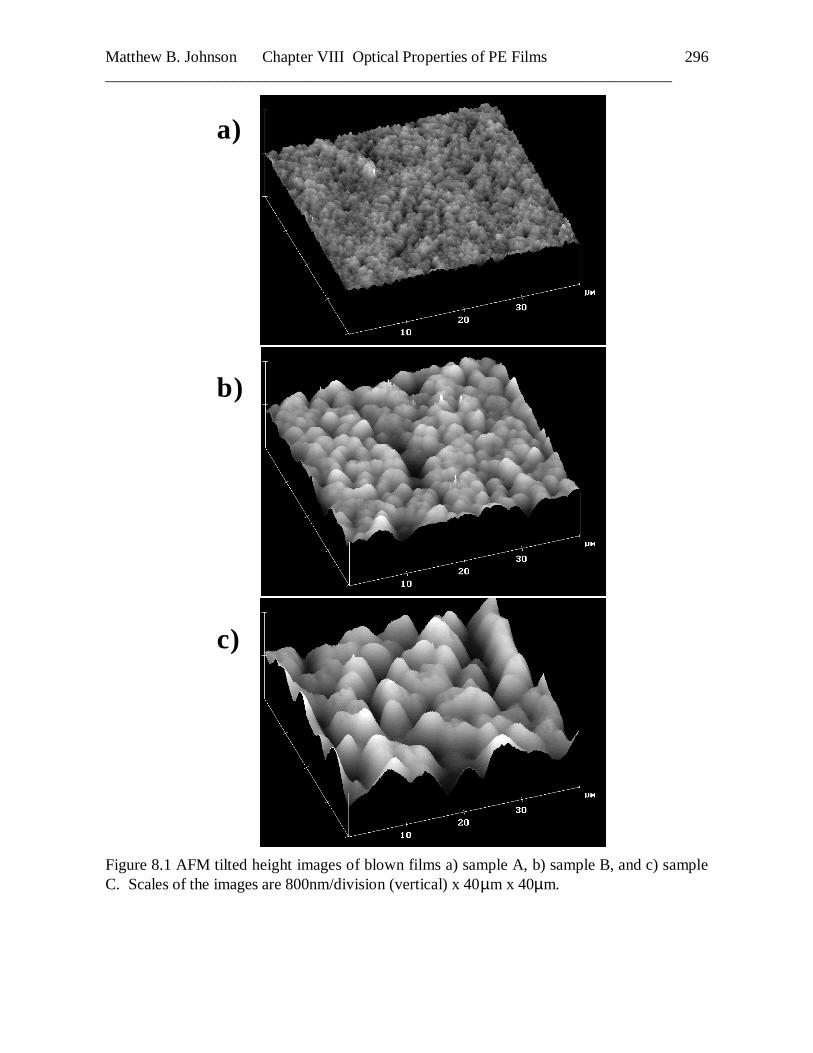
from sample A to sample C. Figures 8.2a-c also provide the general profilometry scans of
typical “profiles” of the surface of these same respective samples to help quantify the
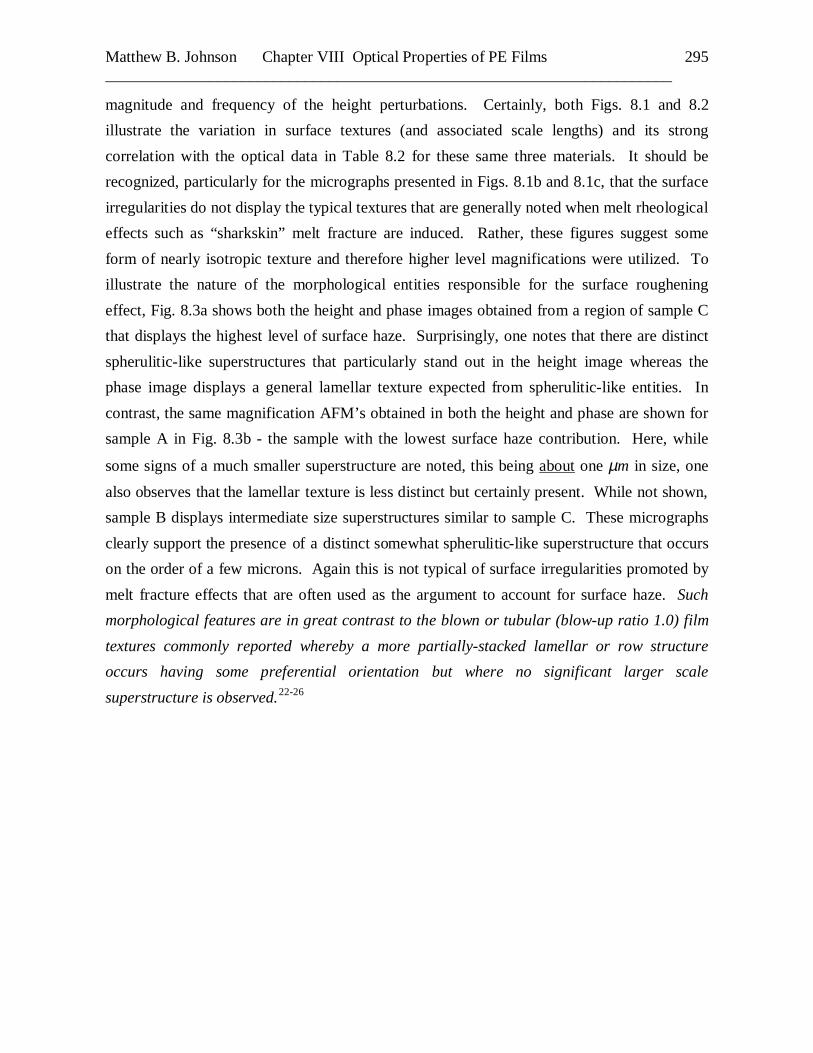
Matthew B. Johnson Chapter VIII Optical Properties of PE Films _______________________________________________________________________
295
magnitude and frequency of the height perturbations. Certainly, both Figs. 8.1 and 8.2
illustrate the variation in surface textures (and associated scale lengths) and its strong
correlation with the optical data in Table 8.2 for these same three materials. It should be
recognized, particularly for the micrographs presented in Figs. 8.1b and 8.1c, that the surface
irregularities do not display the typical textures that are generally noted when melt rheological
effects such as “sharkskin” melt fracture are induced. Rather, these figures suggest some
form of nearly isotropic texture and therefore higher level magnifications were utilized. To
illustrate the nature of the morphological entities responsible for the surface roughening
effect, Fig. 8.3a shows both the height and phase images obtained from a region of sample C
that displays the highest level of surface haze. Surprisingly, one notes that there are distinct
spherulitic-like superstructures that particularly stand out in the height image whereas the
phase image displays a general lamellar texture expected from spherulitic-like entities. In
contrast, the same magnification AFM’s obtained in both the height and phase are shown for
sample A in Fig. 8.3b - the sample with the lowest surface haze contribution. Here, while
some signs of a much smaller superstructure are noted, this being about one µm in size, one
also observes that the lamellar texture is less distinct but certainly present. While not shown,
sample B displays intermediate size superstructures similar to sample C. These micrographs
clearly support the presence of a distinct somewhat spherulitic-like superstructure that occurs
on the order of a few microns. Again this is not typical of surface irregularities promoted by
melt fracture effects that are often used as the argument to account for surface haze. Such
morphological features are in great contrast to the blown or tubular (blow-up ratio 1.0) film
textures commonly reported whereby a more partially-stacked lamellar or row structure
occurs having some preferential orientation but where no significant larger scale
superstructure is observed.22-26
Matthew B. Johnson Chapter VIII Optical Properties of PE Films _______________________________________________________________________
296
a)
b)
c)
Figure 8.1 AFM tilted height images of blown films a) sample A, b) sample B, and c) sample C. Scales of the images are 800nm/division (vertical) x 40µm x 40µm.
Matthew B. Johnson Chapter VIII Optical Properties of PE Films _______________________________________________________________________
297
a)
0µµµµm
b)
c)
Figure 8.2 General profilometry scans of blown films a) sample A, b) sample B, and c) sample C. Scales of the images are 800nm/division (vertical) x 40µm x 40µm.

Matthew B. Johnson Chapter VIII Optical Properties of PE Films _______________________________________________________________________
298
a)
b)
MD
TD
MD
TD
MDTD MD
TD
Figure 8.3 AFM height (left) and phase (right) images of blown films a) sample C and b) sample A. Images are 10µm (vertical) x 7µm (horizontal).
Matthew B. Johnson Chapter VIII Optical Properties of PE Films _______________________________________________________________________
299
The AFM method, however, is a surface technique and while this is critical to address the
features of surface roughness stated above, a major question is whether this suspected
superstructural texture is truly a bulk phenomenon or not. To provide further support for the
general spherulitic-like arrangement of lamellar textures, i.e., it should be more random than a
stacked or oriented lamella structure, two TEM micrographs are shown in Figs. 8.4a and 8.4b
for samples B and C, respectively. Here it is distinctly observed that for sample B, the
lamella are generally randomly oriented whereas in sample C, there are even signs of the
lamella extending and potentially twisting (see arrow) along a radius that would correlate to
the radius of the spherulitic-like superstructure as seen in Fig. 8.3a. In addition, optical
microscopy suggested support for this morphology but resolution limits hindered good
imaging of all films. However, the very critical method to distinctly establish the
confirmation of these superstructures as being optically anisotropic spherulitic-like bodies
was through the use of small angle light scattering (SALS). This technique, developed in
1960 by Rhodes and Stein and addressed considerably in subsequent publications by these
same coworkers5,8,9,27-29 and others.2,7,16,10,30,31 is particularly effective in denoting the
presence of optically anisotropic superstructures.

Matthew B. Johnson Chapter VIII Optical Properties of PE Films _______________________________________________________________________
300
a)
b)
Figure 8.4 TEM micrographs of a) sample B and b) sample C. Note in sample C an arrow indicates the radial direction and twisting of a specific lamellae where as in sample B a more random lamellae morphology exists.
Matthew B. Johnson Chapter VIII Optical Properties of PE Films _______________________________________________________________________
301
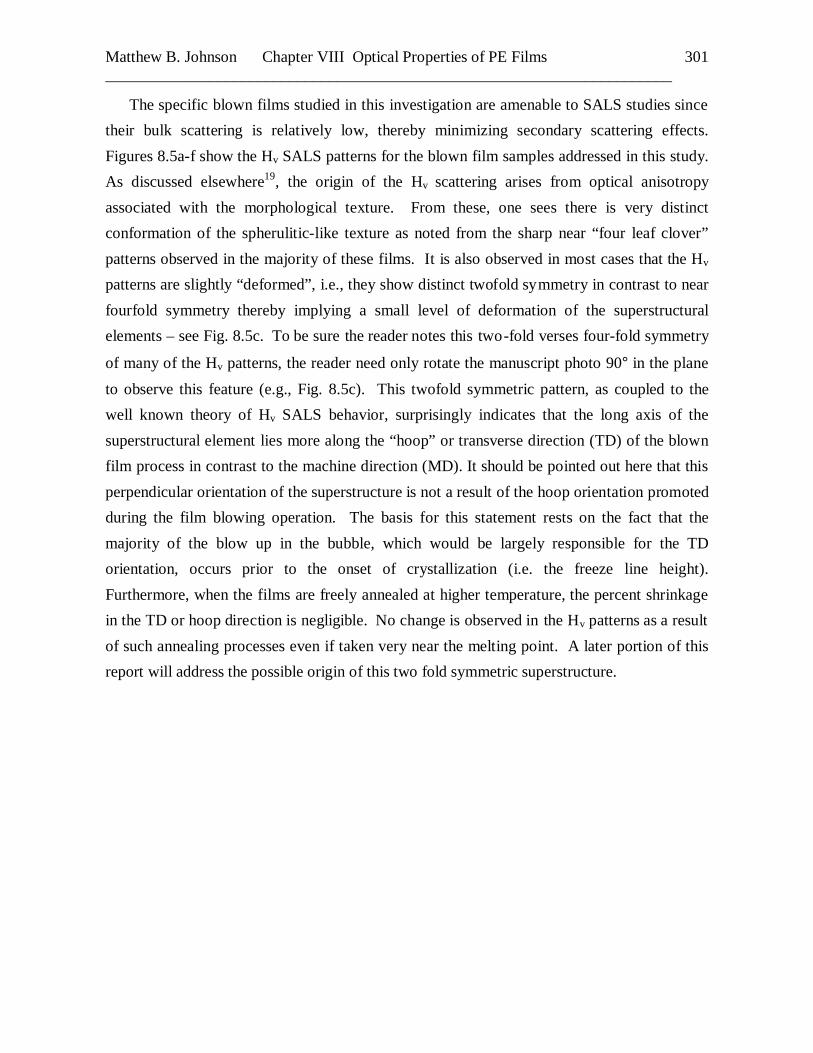
The specific blown films studied in this investigation are amenable to SALS studies since
their bulk scattering is relatively low, thereby minimizing secondary scattering effects.
Figures 8.5a-f show the Hv SALS patterns for the blown film samples addressed in this study.
As discussed elsewhere19, the origin of the Hv scattering arises from optical anisotropy
associated with the morphological texture. From these, one sees there is very distinct
conformation of the spherulitic-like texture as noted from the sharp near “four leaf clover”
patterns observed in the majority of these films. It is also observed in most cases that the Hv
patterns are slightly “deformed”, i.e., they show distinct twofold symmetry in contrast to near
fourfold symmetry thereby implying a small level of deformation of the superstructural
elements – see Fig. 8.5c. To be sure the reader notes this two-fold verses four-fold symmetry
of many of the Hv patterns, the reader need only rotate the manuscript photo 90° in the plane
to observe this feature (e.g., Fig. 8.5c). This twofold symmetric pattern, as coupled to the
well known theory of Hv SALS behavior, surprisingly indicates that the long axis of the
superstructural element lies more along the “hoop” or transverse direction (TD) of the blown
film process in contrast to the machine direction (MD). It should be pointed out here that this
perpendicular orientation of the superstructure is not a result of the hoop orientation promoted
during the film blowing operation. The basis for this statement rests on the fact that the
majority of the blow up in the bubble, which would be largely responsible for the TD
orientation, occurs prior to the onset of crystallization (i.e. the freeze line height).
Furthermore, when the films are freely annealed at higher temperature, the percent shrinkage
in the TD or hoop direction is negligible. No change is observed in the Hv patterns as a result
of such annealing processes even if taken very near the melting point. A later portion of this
report will address the possible origin of this two fold symmetric superstructure.
Matthew B. Johnson Chapter VIII Optical Properties of PE Films _______________________________________________________________________
302
Figure 8.5 SALS Hv patterns of blown films a) sample A, b) sample B, c) sample C, d) sample E, e) sample F, and f) sample G. All sample to film distances are 10cm with the exception of sample A which is 5cm. The MD is along the long axis of the patterns.
Matthew B. Johnson Chapter VIII Optical Properties of PE Films _______________________________________________________________________
303
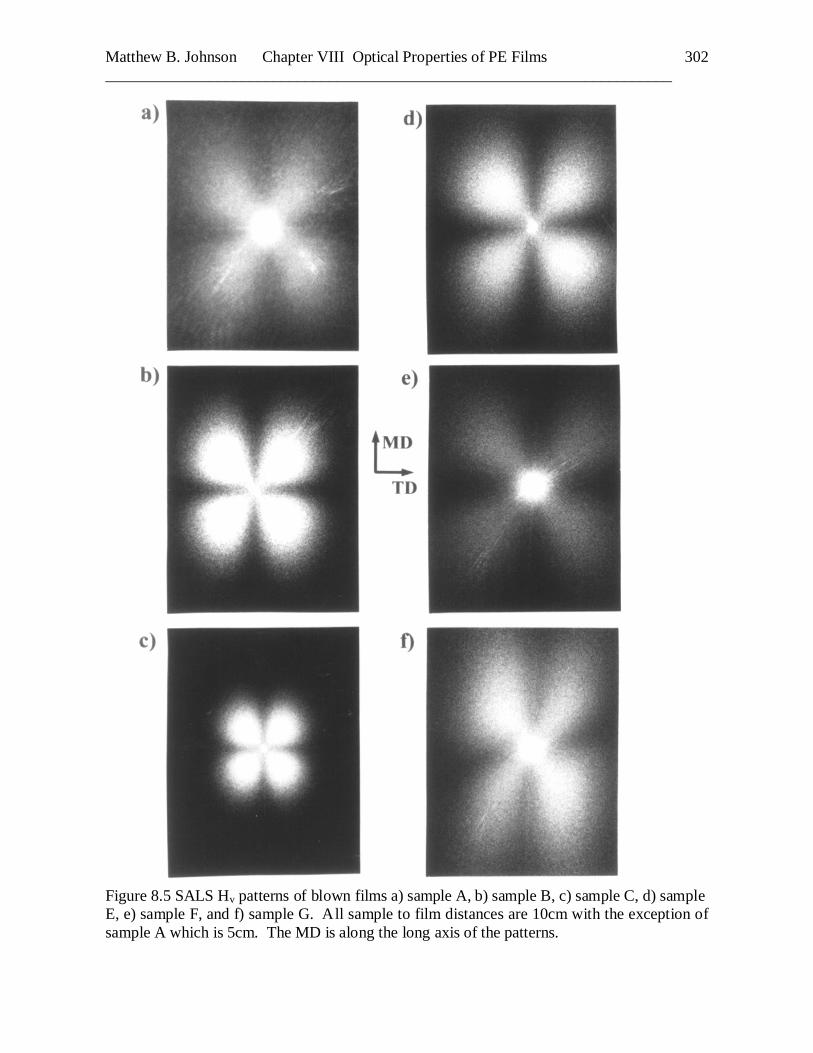
As is well established, the average radius, R, of an anisotropic spherulite can be
determined from the Hv pattern19,32 by use of the relationship
)2/(4
13.4 maxθλπ
SinR
m
= Eqn 8.1
where λm is the wavelength in the medium and θmax is the radial scattering angle defined by
the maximum in the scattering intensity in any lobe of the four fold symmetric Hv pattern.
The value of λm is determined by dividing the wavelength of the incident beam (632.8 nm) by
the average refractive index of the polymer (1.51).
As noted in Fig. 8.5, several of the measured Hv patterns do not show a major deviation
from four-fold symmetry although some slight orientation occurs in the transverse or hoop
direction of the film. Hence, Eqn 8.1 was still utilized to estimate the diameter of the
anisotropic superstructures for many of the films. These results are given in Table 8.3 and the
general diameters obtained quite closely match the values determined by AFM. Note that
these comparisons obtained by either AFM and Hv scattering only best apply to those systems
which display the less oriented Hv patterns shown in Fig. 8.5.
Table 8.3: Spherulitic Diameters based upon SALS Patterns for some Samples Studied
Resin A B C E F G Z-1 Z-2Spherulite Diameters (µm)
for Blown Film 1.7* 4.3 5.6 3.0 2.4 NA NA NAfor Quench sample 5.7 9.4 10.2 - - - - -
for Slow Cool sample 6.7 9.6 10.6 - - - - -
Reinspecting Fig. 8.5 for the remainder of the SALS patterns not yet addressed, one notes
that for sample A (lowest surface haze material) the presence of an anisotropic superstructure
is also apparent from the SALS pattern. However, no distinct maximum in any of the four
lobes occurs thereby making it impossible to clearly establish a superstructure size. However,
the scattering does occur at distinctly higher angles relative to samples B and C, (note - a
much smaller sample to film distance was utilized to record the Hv pattern for sample A)
thereby implying that sample A possesses smaller superstructural elements as was verified
earlier by AFM – recall Fig. 8.3d-e. Sample E, which also possesses considerable surface
haze, displays a near symmetric four-fold pattern and provides a superstructure on the order of
3 µm as estimated by SALS. The Hv pattern for sample F is less distinct than sample E yet
does display a near four-fold symmetry. Interestingly, sample G shows an even more
perpendicularly oriented superstructure to the MD direction and did not allow easy estimation
Matthew B. Johnson Chapter VIII Optical Properties of PE Films _______________________________________________________________________
304
of superstructural size by use of the SALS approach. However, SALS theory developed by
Stein and coworkers,33 Samuels,7,32 and Hashimoto and coworkers10,34 have attempted to
quantitatively account for how such superstructure is deformed from tracking the changes in
the SALS patterns as a function of draw ratio in uniaxially deformed systems. Finally, for the
two films produced by using the broader molecular weight distribution Ziegler-Natta resins,
Z-1 and Z-2, while there were signs of some very weak azimuthal dependence to the Hv
scattering, no discrete pattern was noted to confirm the presence of a distinct superstructure
and these patterns are therefore not included in Fig. 8.5.
It might be pointed out in passing that all the associated resins A – Z-2 (excluding H & P)
were also compression molded into thin films and crystallized quiescently whereby all
displayed the typical Hv light scattering patterns expected of unoriented optically anisotropic
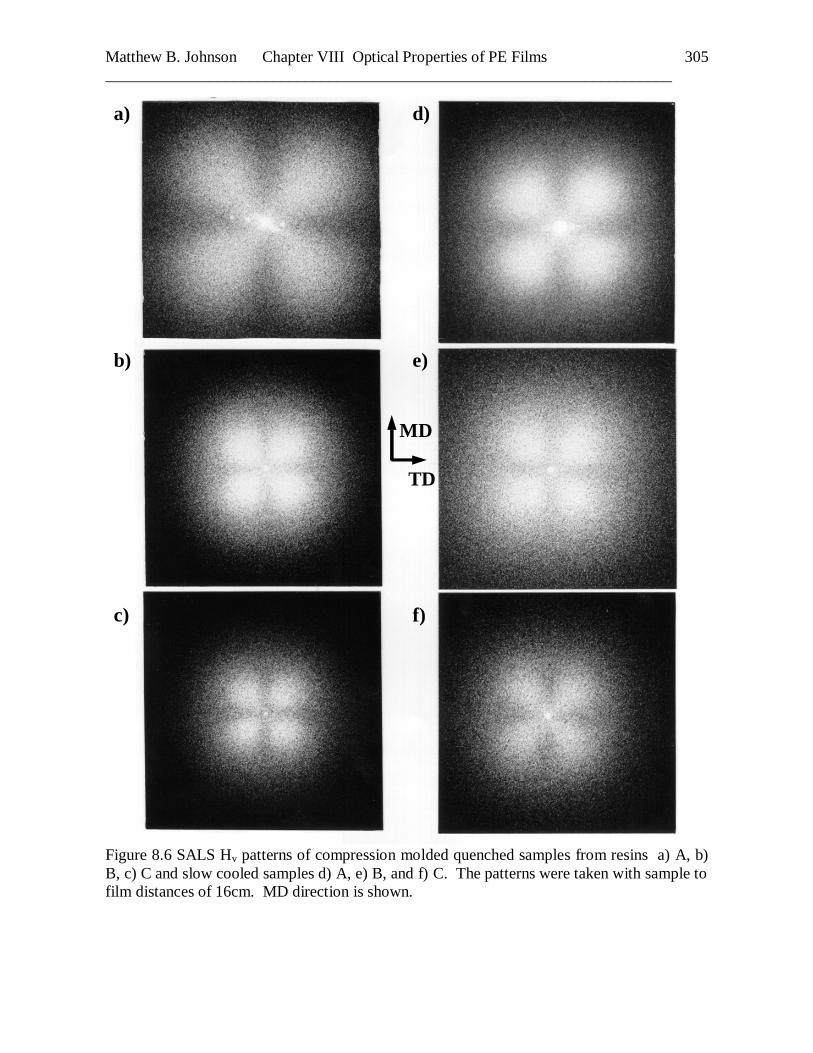
spherulites. To illustrate this point, Figs. 8.6a-f show the Hv patterns obtained from the
respective quenched and slow cooled samples of only materials A, B and C produced by this
compression molding process. As expected, lower-angle scattering is observed for each
respective sample when prepared by the slow cool process which leads to lower nucleation
density and somewhat larger superstructure. While for the “slowly cooled” thermal history,
sample C tended to display the largest superstructure (smaller Hv pattern), its size is also
nearly equal to those of samples A and B when prepared by the slow cooling process although
sample A certainly displays a somewhat smaller superstructure when prepared by quenching –
compare Fig. 8.6a with Fig. 8.6d.
Matthew B. Johnson Chapter VIII Optical Properties of PE Films _______________________________________________________________________
305
a)
b)
c)
d)
e)
f)
MD
TD
Figure 8.6 SALS Hv patterns of compression molded quenched samples from resins a) A, b) B, c) C and slow cooled samples d) A, e) B, and f) C. The patterns were taken with sample to film distances of 16cm. MD direction is shown.
Matthew B. Johnson Chapter VIII Optical Properties of PE Films _______________________________________________________________________
306
In summary of the data presented thus far, we reiterate that the surface haze is the
dominating contributor to the total haze behavior of these systems in blown film form and is
attributed to the development of superstructural spherulitic-like elements. The exceptions are
samples Z-1 and Z-2; these will be addressed later. However, note that the melt index (MI)
values for all eight materials in Table 8.1 are quite similar except for sample C, which is
higher. It is worth reemphasizing here that all samples in Table 8.1, excluding Z-1 and Z-2
(and the broad MWD chromium catalyzed resin P), represent narrow MWD metallocene
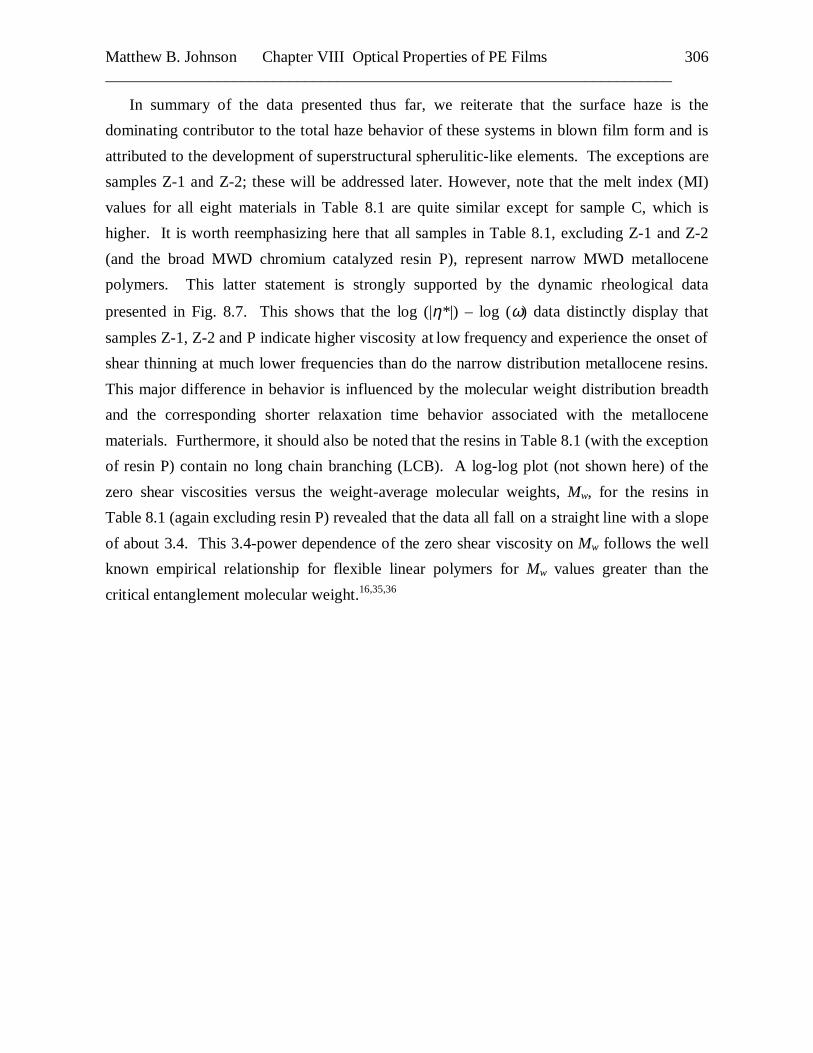
polymers. This latter statement is strongly supported by the dynamic rheological data
presented in Fig. 8.7. This shows that the log (|η*|) – log (ω) data distinctly display that
samples Z-1, Z-2 and P indicate higher viscosity at low frequency and experience the onset of
shear thinning at much lower frequencies than do the narrow distribution metallocene resins.
This major difference in behavior is influenced by the molecular weight distribution breadth
and the corresponding shorter relaxation time behavior associated with the metallocene
materials. Furthermore, it should also be noted that the resins in Table 8.1 (with the exception
of resin P) contain no long chain branching (LCB). A log-log plot (not shown here) of the
zero shear viscosities versus the weight-average molecular weights, Mw, for the resins in
Table 8.1 (again excluding resin P) revealed that the data all fall on a straight line with a slope
of about 3.4. This 3.4-power dependence of the zero shear viscosity on Mw follows the well
known empirical relationship for flexible linear polymers for Mw values greater than the
critical entanglement molecular weight.16,35,36
Matthew B. Johnson Chapter VIII Optical Properties of PE Films _______________________________________________________________________
307
1.E+03
1.E+04
1.E+05
0.01 0.10 1.00 10.00 100.00FREQUENCY (rad/sec)
CO
MP
LE
X V
ISC
OSI
TY
(P
a.s) A B C E F
G Z-1 Z-2 H P
Figure 8.7 Complex viscosity versus frequency data for all the resins from this study obtained via dynamic oscillatory shear measurements at 190°C.
Matthew B. Johnson Chapter VIII Optical Properties of PE Films _______________________________________________________________________
308
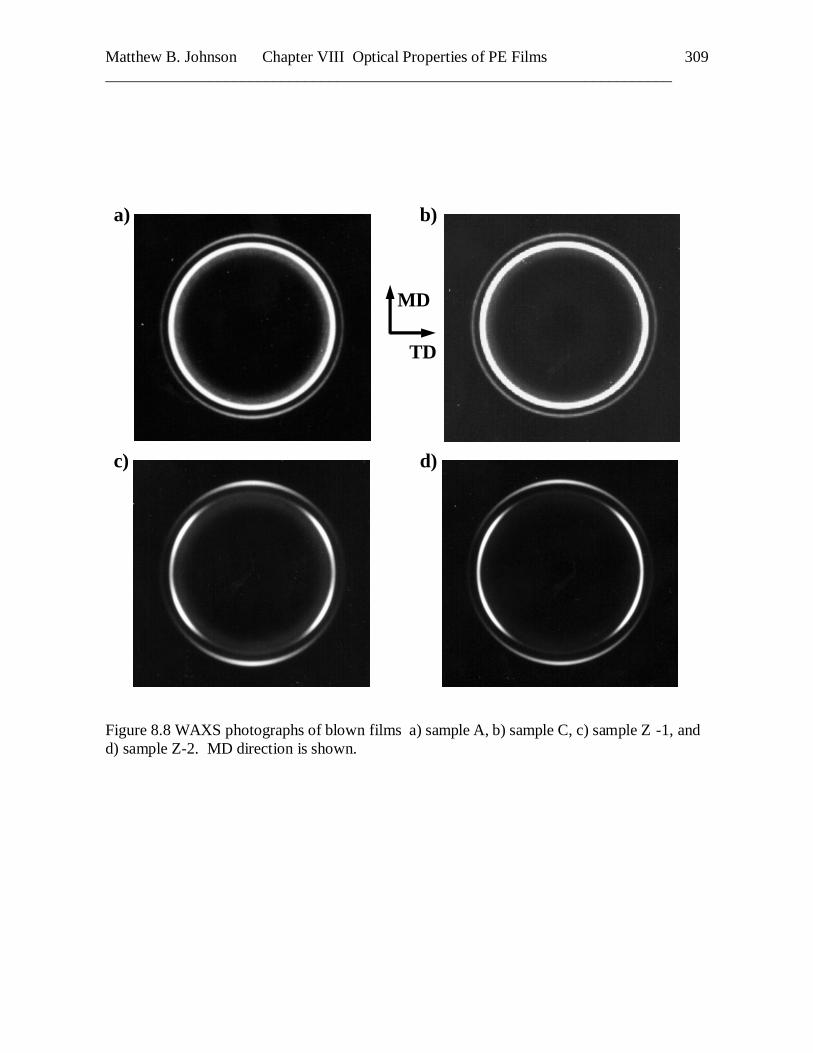
It is generally accepted that blown or tubular film processing of polyethylene resins
possessing lower molecular weights and narrower molecular weight distributions often leads
to preferential “a”-axis orientation.22-24,26,37 WAXS patterns obtained on samples A-C
indicate that some slight “a”-axis orientation also exists, although it is hardly detectable. To
illustrate this, Figs. 8.8a and 8.8b are provided which show the WAXS patterns for samples A
& C, respectively. Note that sample A has the higher “a”-axis orientation but both materials
display low orientation. Results for sample B (not shown) were intermediate between those
of samples A and C. Low “a”-axis orientation was also observed of samples E-G as well,
although the WAXS results are not shown here for brevity. In contrast, however, the two
Ziegler-Natta broader MWD resins (samples Z-1 and Z-2) display a much more pronounced
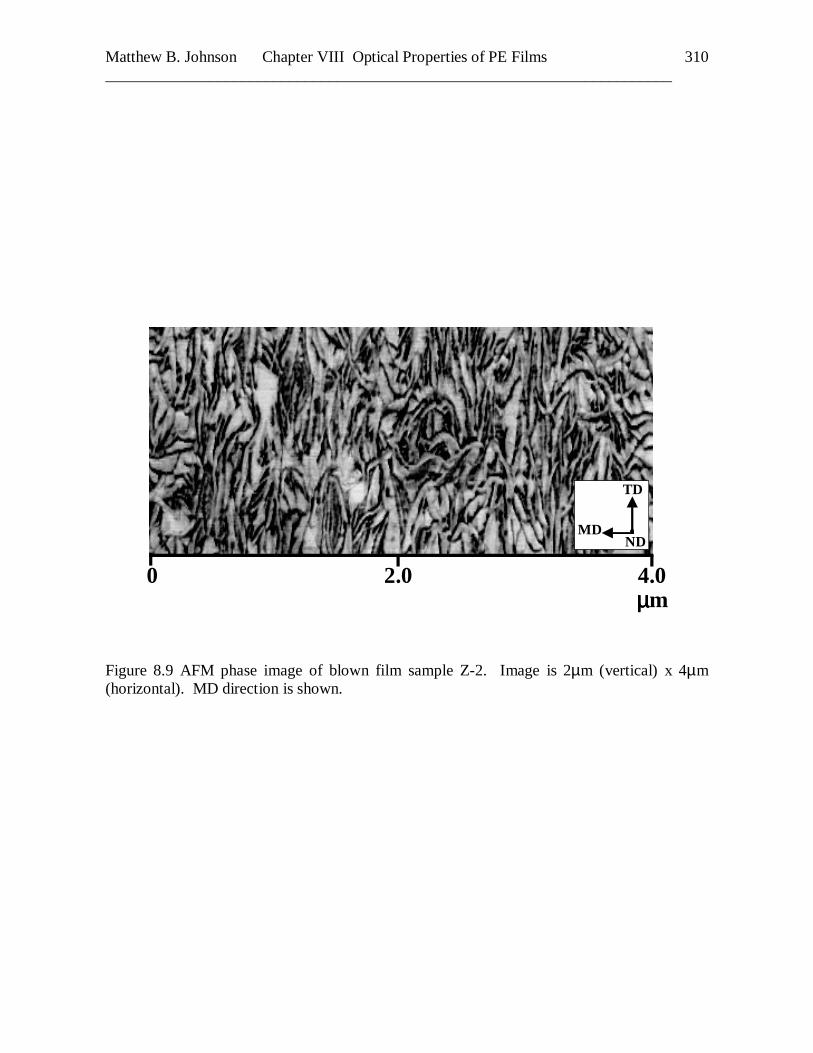
“a”-axis orientation as seen in Figs. 8.8c and 8.8d. AFM micrographs of the corresponding
films of Z-1 and Z-2 also display no signs of superstructure although a distinct lamella texture
is noted with some sign of these lamella being more preferentially perpendicular to the MD
direction than purely random – see Fig. 8.9 where the surface texture is shown for sample Z -2.
Matthew B. Johnson Chapter VIII Optical Properties of PE Films _______________________________________________________________________
309
a)
c)
b)
d)
MD
TD
Figure 8.8 WAXS photographs of blown films a) sample A, b) sample C, c) sample Z -1, and d) sample Z-2. MD direction is shown.
Matthew B. Johnson Chapter VIII Optical Properties of PE Films _______________________________________________________________________
310
0 2.0 4.0µµµµm
MD
TD
ND
Figure 8.9 AFM phase image of blown film sample Z-2. Image is 2µm (vertical) x 4µm (horizontal). MD direction is shown.
Matthew B. Johnson Chapter VIII Optical Properties of PE Films _______________________________________________________________________
311
When polyethylene resins of higher molecular weight and broader molecular weight
distribution are processed into blown or tubular films, a fibril nucleated row or shishkabob-
like texture has been reported by many researchers.38-40 Hence, the principal issue is what has
promoted the major occurrence of a more spherulitic-like superstructural element in the
present lower density metallocene materials which are not present in the two Ziegler-Natta
resins of nearly comparable MI when processed under essentially equal conditions? We
propose that the induced superstructure in these materials results from a more rapid relaxation
process (lower Deborah number) of the melt as the metallocene material proceeds from the
die in the blown film process. It is recognized that metallocene materials, in general, have
narrow molecular distributions and therefore lack the presence of high molecular weight
fractions common to the typical Ziegler-Natta resins or chromium oxide-based materials
(recall Table 8.1). This major difference in molecular weight distribution can strongly
influence elasticity and recovery or relaxation time accordingly. To indicate this difference in
the resins investigated, an estimation of the recoverable shear strain was undertaken.
Formally, the recoverable shear strain, γ∞, can be stated to be equal to
γ∞ τ2
1N= Eqn. 8.2
where N1 is the first normal stress difference and τ is the shear stress.41 At low frequencies,
the recoverable shear can be estimated to be equal to
γ∞ *ωη
G'~ Eqn. 8.3
where G′ represents the elastic part of the dynamic shear modulus while η* and ω represent
the corresponding complex viscosity (using the well known Cox-Merz rule) and frequency,
respectively.41 Applying this approximation in the low frequency range (ω = 0.03 s-1) the
values for recoverable shear strain of the respective eight resins are shown in Table 8.4.
Matthew B. Johnson Chapter VIII Optical Properties of PE Films _______________________________________________________________________
312
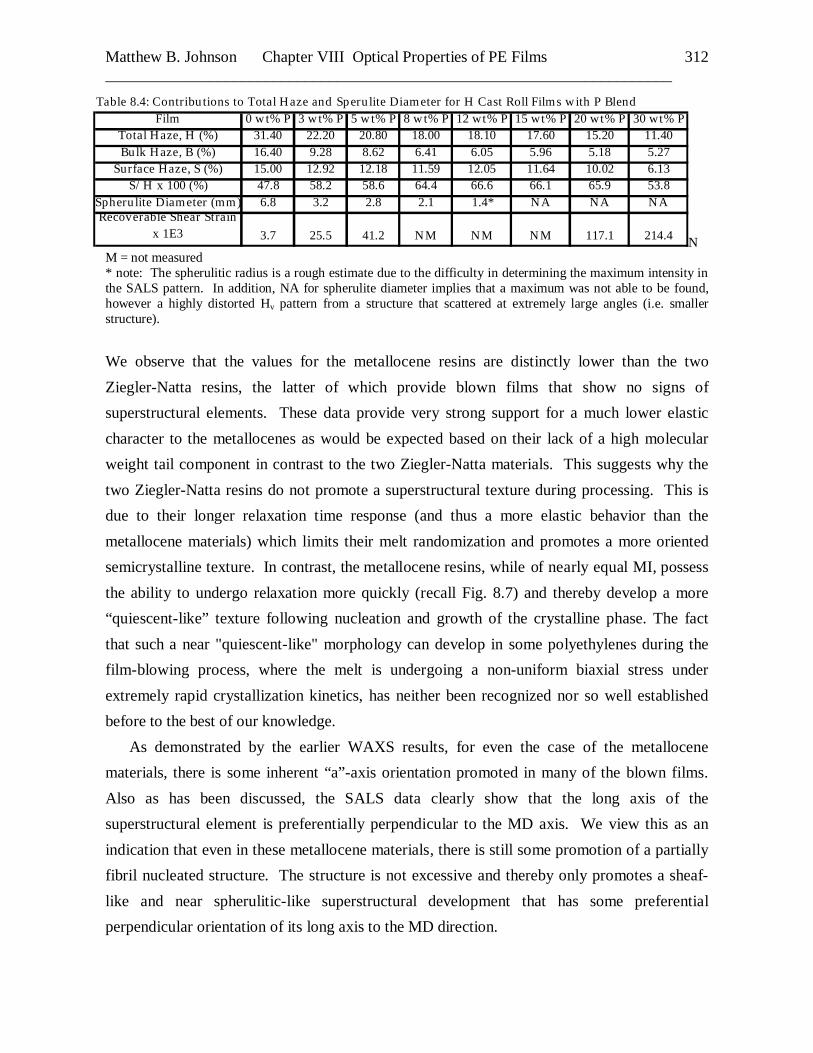
Table 8.4: Contributions to Total Haze and Sperulite Diameter for H Cast Roll Films with P BlendFilm 0 wt% P 3 wt% P 5 wt% P 8 wt% P 12 wt% P 15 wt% P 20 wt% P 30 wt% P
Total Haze, H (%) 31.40 22.20 20.80 18.00 18.10 17.60 15.20 11.40Bulk Haze, B (%) 16.40 9.28 8.62 6.41 6.05 5.96 5.18 5.27
Surface Haze, S (%) 15.00 12.92 12.18 11.59 12.05 11.64 10.02 6.13S/H x 100 (%) 47.8 58.2 58.6 64.4 66.6 66.1 65.9 53.8
Spherulite Diameter (mm) 6.8 3.2 2.8 2.1 1.4* NA NA NARecoverable Shear Strain
x 1E3 3.7 25.5 41.2 NM NM NM 117.1 214.4 NM = not measured * note: The spherulitic radius is a rough estimate due to the difficulty in determining the maximum intensity in the SALS pattern. In addition, NA for spherulite diameter implies that a maximum was not able to be found, however a highly distorted Hv pattern from a structure that scattered at extremely large angles (i.e. smaller structure).
We observe that the values for the metallocene resins are distinctly lower than the two
Ziegler-Natta resins, the latter of which provide blown films that show no signs of
superstructural elements. These data provide very strong support for a much lower elastic
character to the metallocenes as would be expected based on their lack of a high molecular
weight tail component in contrast to the two Ziegler-Natta materials. This suggests why the
two Ziegler-Natta resins do not promote a superstructural texture during processing. This is
due to their longer relaxation time response (and thus a more elastic behavior than the
metallocene materials) which limits their melt randomization and promotes a more oriented
semicrystalline texture. In contrast, the metallocene resins, while of nearly equal MI, possess
the ability to undergo relaxation more quickly (recall Fig. 8.7) and thereby develop a more
“quiescent-like” texture following nucleation and growth of the crystalline phase. The fact
that such a near "quiescent-like" morphology can develop in some polyethylenes during the
film-blowing process, where the melt is undergoing a non-uniform biaxial stress under
extremely rapid crystallization kinetics, has neither been recognized nor so well established
before to the best of our knowledge.
As demonstrated by the earlier WAXS results, for even the case of the metallocene
materials, there is some inherent “a”-axis orientation promoted in many of the blown films.
Also as has been discussed, the SALS data clearly show that the long axis of the
superstructural element is preferentially perpendicular to the MD axis. We view this as an
indication that even in these metallocene materials, there is still some promotion of a partially
fibril nucleated structure. The structure is not excessive and thereby only promotes a sheaf-
like and near spherulitic-like superstructural development that has some preferential
perpendicular orientation of its long axis to the MD direction.
Matthew B. Johnson Chapter VIII Optical Properties of PE Films _______________________________________________________________________
313
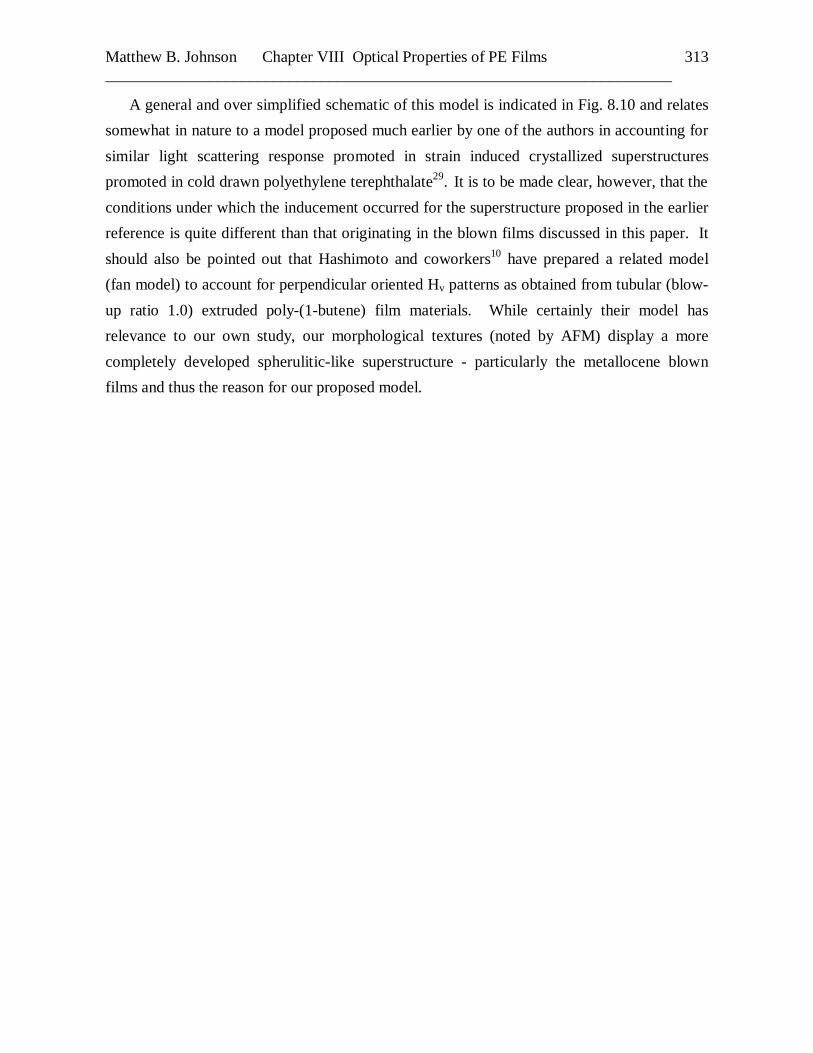
A general and over simplified schematic of this model is indicated in Fig. 8.10 and relates
somewhat in nature to a model proposed much earlier by one of the authors in accounting for
similar light scattering response promoted in strain induced crystallized superstructures
promoted in cold drawn polyethylene terephthalate29. It is to be made clear, however, that the
conditions under which the inducement occurred for the superstructure proposed in the earlier
reference is quite different than that originating in the blown films discussed in this paper. It
should also be pointed out that Hashimoto and coworkers10 have prepared a related model
(fan model) to account for perpendicular oriented Hv patterns as obtained from tubular (blow-
up ratio 1.0) extruded poly-(1-butene) film materials. While certainly their model has
relevance to our own study, our morphological textures (noted by AFM) display a more
completely developed spherulitic-like superstructure - particularly the metallocene blown
films and thus the reason for our proposed model.
Matthew B. Johnson Chapter VIII Optical Properties of PE Films _______________________________________________________________________
314
Figure 8.10 Model illustrating the nucleation of spherulitic morphologies on extended chain crystal nuclei. [The presence of the extended chain crystals has been assumed in this model without experimental proof.] (A) Outline of spherulitic-like region displaying anistropy; (B) Small fibril or extended chain crystal; (C) Folded chain lamellae nucleated on the extended chain crystal; (D) Regions of spherulitic impingement. The lack of “a”-axis orientation (i.e. lamellar twisting) is not depicted in this illustration but does occur within the LLDPE films.
C
B
A
D
D
Matthew B. Johnson Chapter VIII Optical Properties of PE Films _______________________________________________________________________
315
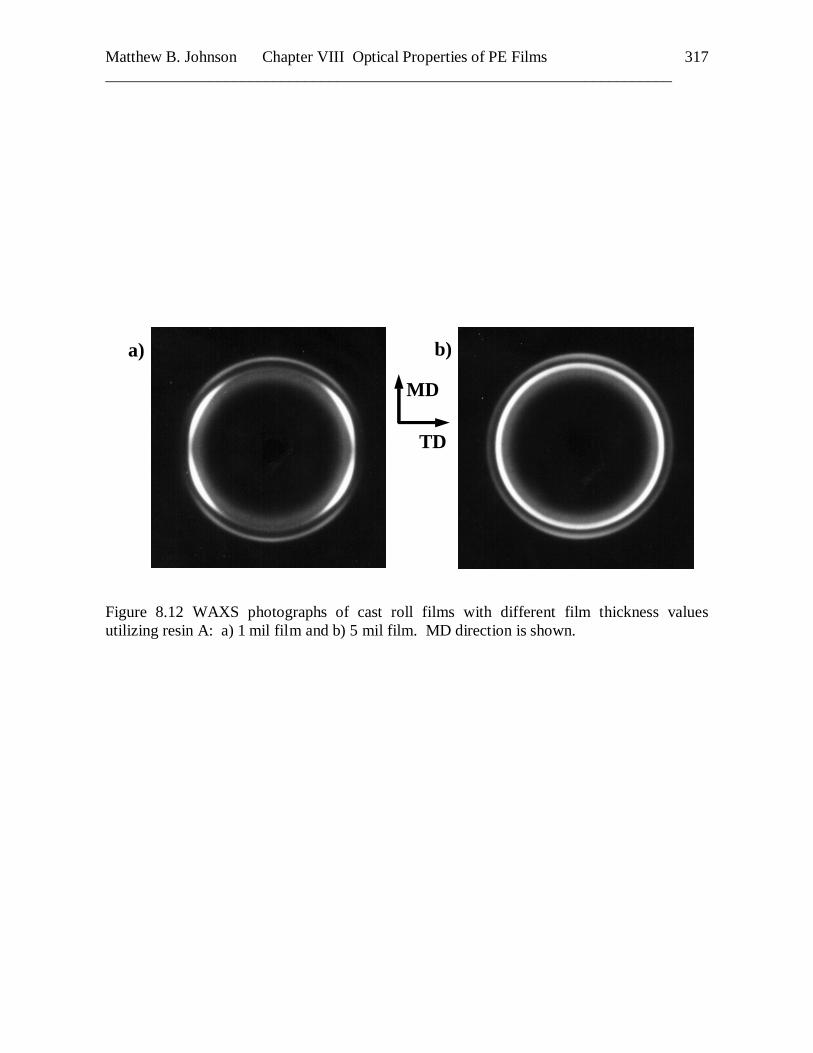
To further lend support to the proposed explanation of the observed morphology on the
blown 1 mil films, a related study with resin A was conducted using the melt cast process
discussed in the processing section. While a constant shear rate was maintained, the film
thickness, however was controlled to be either 1, 3 or 5 mils by adjusting the take-off speed.
These respective cast materials were then studied with respect to their haze characteristics,
crystal orientation as determined by WAXS, and their morphology as studied by both SALS
and AFM. The results obtained by SALS are displayed first in Fig. 11a-c, and show no
distinct sign of superstructure within the thinnest film. In the two thicker films, the
spherulitic-like superstructure obtained is also oriented somewhat perpendicular to the draw
direction – the reader should recall there is no blow-up ratio in this cast process yet the
perpendicular orientation is still noted! These results directly support the arguments provided
to this point for the cause of the same perpendicular oriented type of superstructure being
induced within the blown films. While not shown here, the AFM of the thinnest sample
distinctly showed signs of lamella being quite stacked and oriented perpendicular to the MD
direction strongly supporting why no signs of a distinct superstructure entity above the
lamellar level would have been observed by the SALS technique. Oriented stacked lamella,
however, were not observed in the thicker materials. The corresponding WAXS patterns of
the thinnest and thickest films are shown in Figs. 8.12a-b and indicate a systematic decrease
in uniaxial “a”-axis orientation as film thickness increases. The WAXS pattern for the
intermediate thickness sample showed the “a”-axis orientation to be intermediate from that of
the other two samples. This systematic decrease in “a”-axis orientation with thickness is
undoubtedly due to a longer allowed time for relaxation to occur prior to crystallization due to
differences in heat transfer characteristics of the different thickness films and the line speed
difference.

Matthew B. Johnson Chapter VIII Optical Properties of PE Films _______________________________________________________________________
316
a)
c)
b)
MD
TD
Figure 8.11 SALS Hv patterns of cast roll films with different film thickness values utilizing resin A: a) 1 mil film, b) 3 mil film, c) 5 mil film. The patterns were taken with sample to film distances of 10 cm. MD direction is shown.
Matthew B. Johnson Chapter VIII Optical Properties of PE Films _______________________________________________________________________
317
a) b)
MD
TD
Figure 8.12 WAXS photographs of cast roll films with different film thickness values utilizing resin A: a) 1 mil film and b) 5 mil film. MD direction is shown.
Matthew B. Johnson Chapter VIII Optical Properties of PE Films _______________________________________________________________________
318
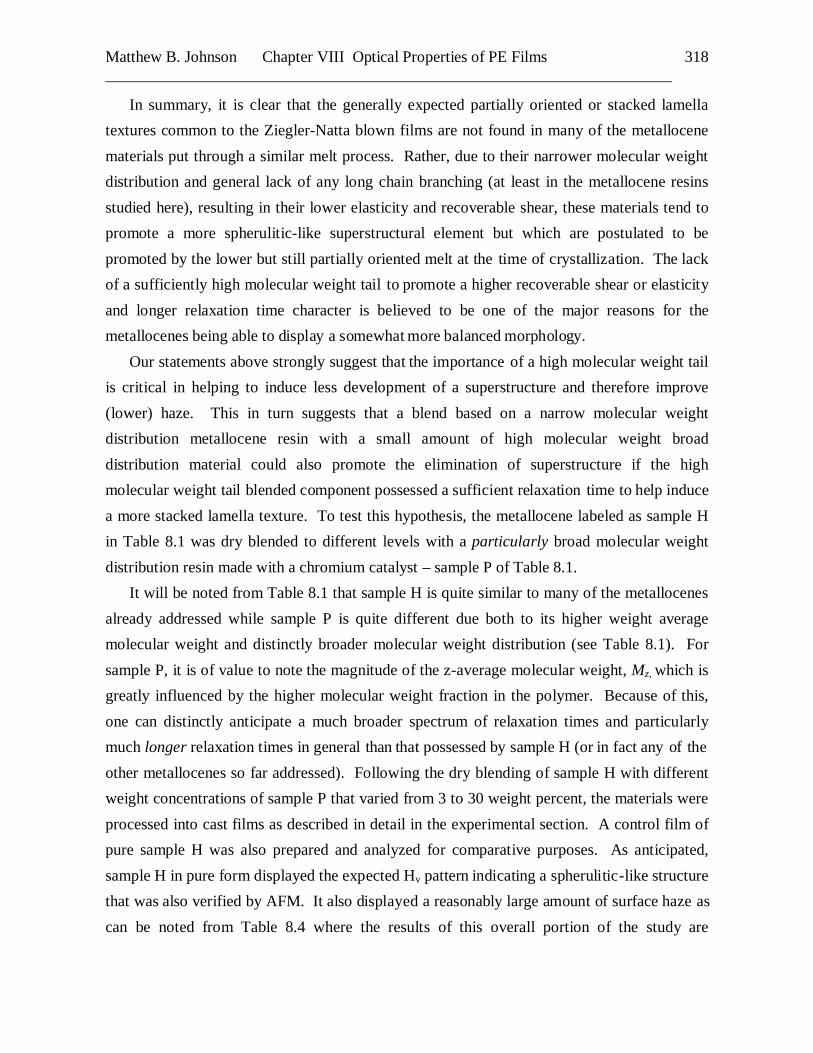
In summary, it is clear that the generally expected partially oriented or stacked lamella
textures common to the Ziegler-Natta blown films are not found in many of the metallocene
materials put through a similar melt process. Rather, due to their narrower molecular weight
distribution and general lack of any long chain branching (at least in the metallocene resins
studied here), resulting in their lower elasticity and recoverable shear, these materials tend to
promote a more spherulitic-like superstructural element but which are postulated to be
promoted by the lower but still partially oriented melt at the time of crystallization. The lack
of a sufficiently high molecular weight tail to promote a higher recoverable shear or elasticity
and longer relaxation time character is believed to be one of the major reasons for the
metallocenes being able to display a somewhat more balanced morphology.
Our statements above strongly suggest that the importance of a high molecular weight tail
is critical in helping to induce less development of a superstructure and therefore improve
(lower) haze. This in turn suggests that a blend based on a narrow molecular weight
distribution metallocene resin with a small amount of high molecular weight broad
distribution material could also promote the elimination of superstructure if the high
molecular weight tail blended component possessed a sufficient relaxation time to help induce
a more stacked lamella texture. To test this hypothesis, the metallocene labeled as sample H
in Table 8.1 was dry blended to different levels with a particularly broad molecular weight
distribution resin made with a chromium catalyst – sample P of Table 8.1.
It will be noted from Table 8.1 that sample H is quite similar to many of the metallocenes
already addressed while sample P is quite different due both to its higher weight average
molecular weight and distinctly broader molecular weight distribution (see Table 8.1). For
sample P, it is of value to note the magnitude of the z-average molecular weight, Mz, which is
greatly influenced by the higher molecular weight fraction in the polymer. Because of this,
one can distinctly anticipate a much broader spectrum of relaxation times and particularly
much longer relaxation times in general than that possessed by sample H (or in fact any of the
other metallocenes so far addressed). Following the dry blending of sample H with different
weight concentrations of sample P that varied from 3 to 30 weight percent, the materials were
processed into cast films as described in detail in the experimental section. A control film of
pure sample H was also prepared and analyzed for comparative purposes. As anticipated,
sample H in pure form displayed the expected Hv pattern indicating a spherulitic-like structure
that was also verified by AFM. It also displayed a reasonably large amount of surface haze as
can be noted from Table 8.4 where the results of this overall portion of the study are
Matthew B. Johnson Chapter VIII Optical Properties of PE Films _______________________________________________________________________
319
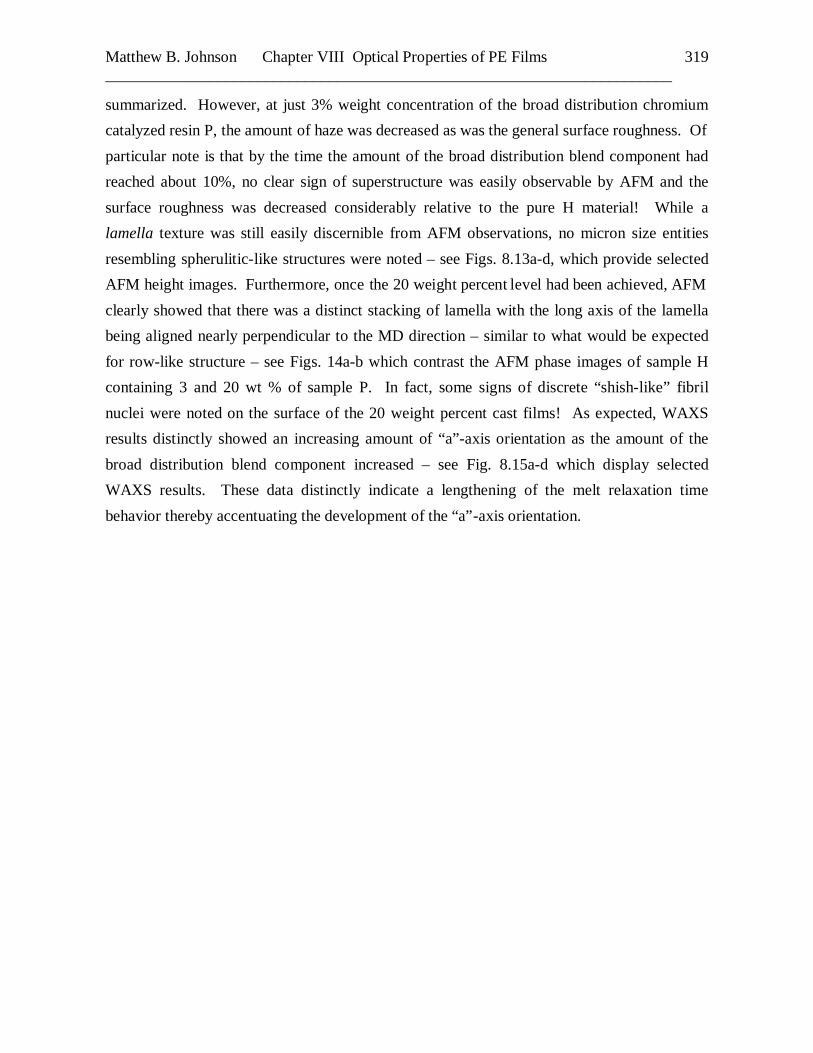
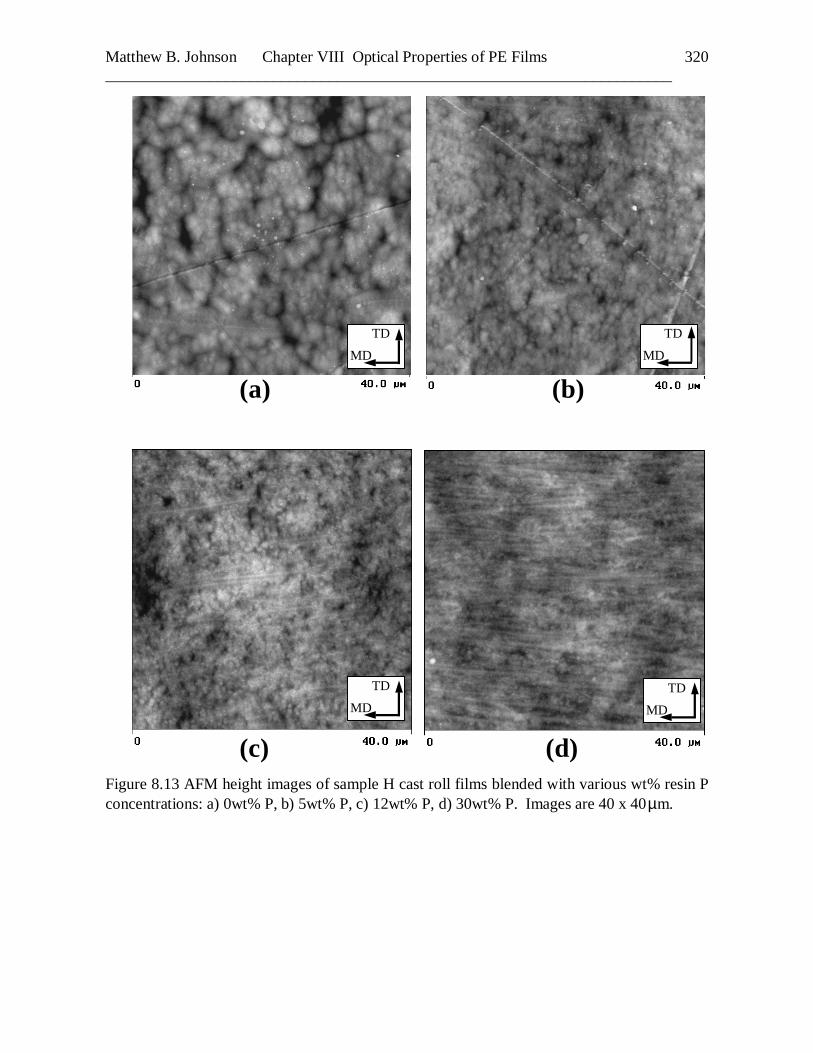
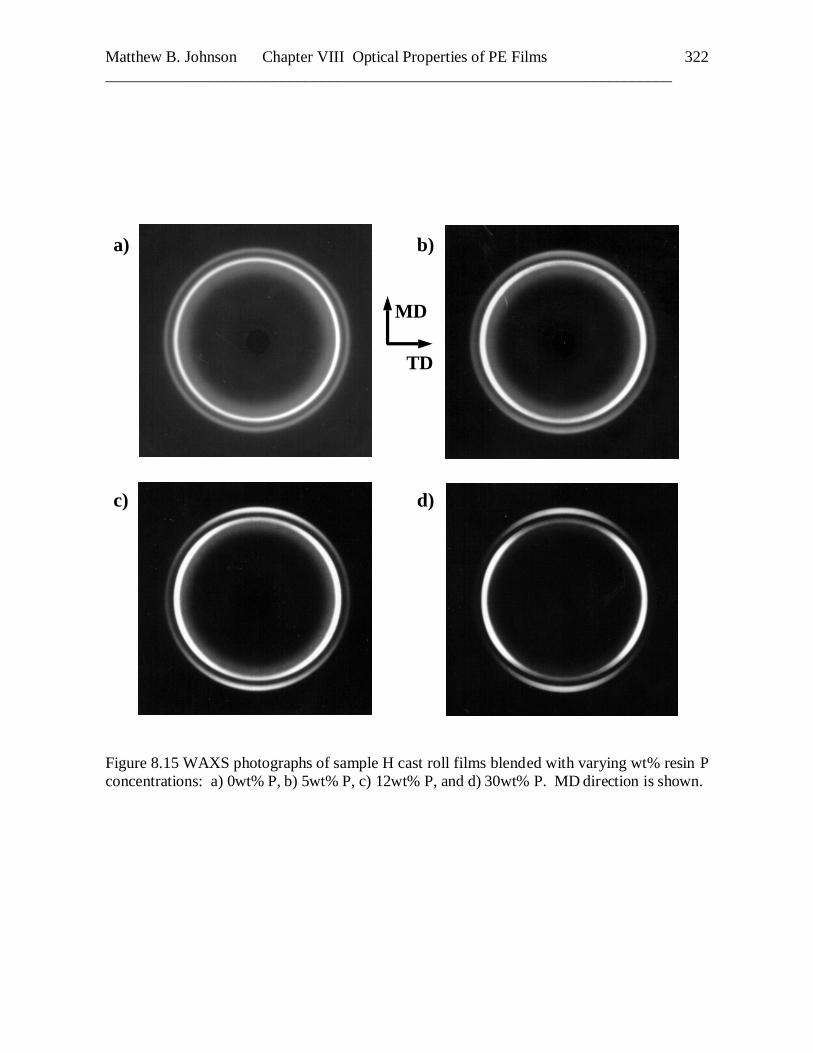
summarized. However, at just 3% weight concentration of the broad distribution chromium
catalyzed resin P, the amount of haze was decreased as was the general surface roughness. Of
particular note is that by the time the amount of the broad distribution blend component had
reached about 10%, no clear sign of superstructure was easily observable by AFM and the
surface roughness was decreased considerably relative to the pure H material! While a
lamella texture was still easily discernible from AFM observations, no micron size entities
resembling spherulitic-like structures were noted – see Figs. 8.13a-d, which provide selected
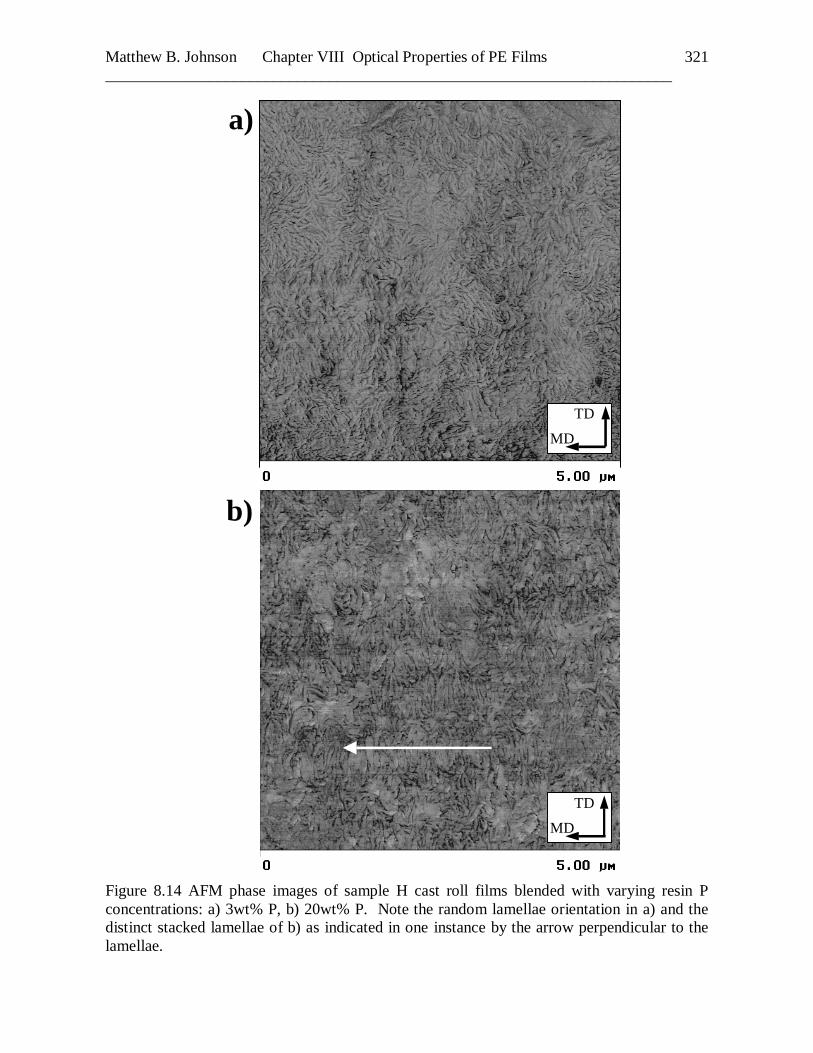
AFM height images. Furthermore, once the 20 weight percent level had been achieved, AFM
clearly showed that there was a distinct stacking of lamella with the long axis of the lamella
being aligned nearly perpendicular to the MD direction – similar to what would be expected
for row-like structure – see Figs. 14a-b which contrast the AFM phase images of sample H
containing 3 and 20 wt % of sample P. In fact, some signs of discrete “shish-like” fibril
nuclei were noted on the surface of the 20 weight percent cast films! As expected, WAXS
results distinctly showed an increasing amount of “a”-axis orientation as the amount of the
broad distribution blend component increased – see Fig. 8.15a-d which display selected
WAXS results. These data distinctly indicate a lengthening of the melt relaxation time
behavior thereby accentuating the development of the “a”-axis orientation.
Matthew B. Johnson Chapter VIII Optical Properties of PE Films _______________________________________________________________________
320
(a) (b)
(c) (d)
MD
TD
MD
TD
MD
TD
MD
TD
Figure 8.13 AFM height images of sample H cast roll films blended with various wt% resin P concentrations: a) 0wt% P, b) 5wt% P, c) 12wt% P, d) 30wt% P. Images are 40 x 40µm.
Matthew B. Johnson Chapter VIII Optical Properties of PE Films _______________________________________________________________________
321
MD
TD
a)
b)
MD
TD
Figure 8.14 AFM phase images of sample H cast roll films blended with varying resin P concentrations: a) 3wt% P, b) 20wt% P. Note the random lamellae orientation in a) and the distinct stacked lamellae of b) as indicated in one instance by the arrow perpendicular to the lamellae.
Matthew B. Johnson Chapter VIII Optical Properties of PE Films _______________________________________________________________________
322
a)
c)
b)
d)
MD
TD
Figure 8.15 WAXS photographs of sample H cast roll films blended with varying wt% resin P concentrations: a) 0wt% P, b) 5wt% P, c) 12wt% P, and d) 30wt% P. MD direction is shown.
Matthew B. Johnson Chapter VIII Optical Properties of PE Films _______________________________________________________________________
323
It is postulated that the higher molecular weight, broad molecular weight distribution
component promotes more rapid nucleation and fibril-like nuclei that, in turn, promote
additional secondary nucleation of the dominant metallocene H component leading to the
observed structure. It is also noteworthy to point out that the inducement of the systematic
changes in morphology with addition of sample P is clearly not due to a major change in
supercooling effect for as noted in Table 8.1, the Tm of sample P is not very different from
that of sample H.
Cooke and Tikuisis reported identical results in an earlier study.12 They too had found
that blending small levels of a high Mw, broad MWD resin to a LLDPE resin resulted in
improved optical properties viz., lower haze and higher gloss of the base LLDPE resin. While
not related to the optical properties of thin films, a very early study42 on the light scattering of
mixtures of linear polyethylene resins also showed that addition of even small amounts of a
high Mw fraction to a lower Mw fraction resulted in a deterioration of the spherulitic
morphology of the lower Mw fraction even in unoriented, isothermally crystallized samples.
Before concluding, it is important to state that at the very highest concentration level of
sample P (30 wt %), it was noted that the surface roughness becomes more enhanced and this
was easily discernible from the AFM micrographs. Specifically, the surface texture no longer
provided a direct observation of lamella texture but rather a more roughened morphology was
noted thereby providing hints of a localized melt fracturetype response. This in fact seems
logical and expected if there is a significant amount of fibril structure promoted through the
nucleation and growth of the broad distribution component, particularly since the shear rate is
highest at the wall. This can lead to “solid like” behavior and promote signs of surface
roughening of the remaining melt texture that has yet to solidify in the midst of the crystalline
network-like structure nucleated by the broad distribution species. To give further support to
our previous arguments concerning the alteration in surface texture through the increased
relaxation times and associated recovered shear strain, we also provide the associated γ∞ data
on this same series of blends. This data is also presented in Table 8.4 which shows how that
parameter systematically increases with the weight percent increase in sample P - the broad
distribution component content. We believe these results strongly support our conjecture that
fine tuning the molecular weight distribution can have an extremely strong impact on the type
of morphological texture induced which in turn influences surface roughness and associated
optical haze.
Matthew B. Johnson Chapter VIII Optical Properties of PE Films _______________________________________________________________________
324
8.4 CONCLUSIONS From the above information we can confidently state that the one property that is
dominated by the morphological entities discussed is haze, specifically surface haze due to the
development of the superstructural entities which roughen the surface. It has led us to the
conclusion that with increased nucleation, possibly promoted by residual orientation effects
(but where such orientation is insufficient to induce the conventional row-like structure), the
resulting superstructural elements are smaller which further results in a smoother film surface
and thereby minimizes surface haze. This lower degree of surface roughness and surface haze
yields a film with lower total haze or conversely higher optical clarity. Inherent differences in
any “in-situ” nucleators for a given resin could also influence superstructure size if such
nucleators are operable at the time of crystallization. For the Ziegler-Natta blown film
materials which in this report displayed relatively low total haze values, it was determined
that their lower surface haze resulted from a smoother surface texture which was attributed to
a lack of any distinct superstructure as was illustrated by AFM and SALS. Under certain
processing conditions (e.g., very high shear rates or stresses), however, such that the
polymer’s relaxation time scales distinctly exceed the process time scales (high Deborah
number), high surface haze may result even in the absence of any crystalline superstructure
formation. It should be recognized that this high surface haze is due to melt rheological
instabilities such as elasticity driven fine-scale surface roughness or even sharkskin melt
fracture. In fact we now have clear evidence, based on the study reported here as well as
related data obtained on other samples not discussed here, that the total haze when plotted
against the logarithm of the recoverable shear strain, γ∞, yields a somewhat parabolic concave
upward function. At low values of γ∞, the superstructure we have discussed in this report is
promoted which accents surface and hence total haze. As γ∞ increases, such superstructures
are no longer developed but rather give rise to a more oriented stacked lamella-like texture
thereby decreasing surface and hence total haze. However, at even higher γ∞ values
representing highly melt elastic behavior, fine-scale surface roughness due to high melt elastic
instabilities is induced, thereby again causing surface roughness to be greatly enhanced and
consequently increasing surface and total haze values. We expect to report more on this issue
in our subsequent studies.

Matthew B. Johnson Chapter VIII Optical Properties of PE Films _______________________________________________________________________
325
Acknowledgements It is noted that this work was done in conjunction with Ashish M. Sukhadia and David C.
Rohlfing of the Chevron Phillips Petroleum Company Corporate Technology, Polymers &
Materials Division at Bartlesville, OK. A. M. Sukhadia and D. C. Rohfling would like to
gratefully acknowledge the help of Prof. S. Z. D. Cheng from the University of Akron, OH for
his preliminary analysis of samples A, B and C and for pointing out the distinct presence of
superstructures in samples B and C. The authors also acknowledge Dr. Jay Janzen and Dr.
Rajendra K. Krishnaswamy for several useful discussions. Phillips Petroleum Company is
acknowledged for providing all the polyethylene samples used in this study, for partial
monetary support and for permission to publish this work.
Matthew B. Johnson Chapter VIII Optical Properties of PE Films _______________________________________________________________________
326
REFERENCES 1 P. L. Clegg and N. D. Huck, Plastics, 114, April (1961). 2 F. C. Stehling, C. S. Speed and L. Westerman, Macromol., 14, 698 (1981). 3 H. Ashizawa, J. Spruiell, J. L. White, Polym. Eng. Sci., 24(13), 1035 (1984). 4 J. L. White, Y. Matsukura, H. J. Kang and H. Yamane, Int. Polym. Proc., 1(2), 83 (1987). 5 R. S. Stein, M. B. Rhodes, J. Appl. Phys., 31, 1873 (1960). 6 R. J. Samuels, J. Polym. Sci. A2, 7, 1197 (1969). 7 R. J. Samuels, J. Polym. Sci. A2, 9, 2165 (1971). 8 R. S. Stein, “Structure and Properties of Polymer Films”; R. W. Lenz, R. S. Stein, Ed., Plenum Press, New York, (1973). 9 R. E. Prud’homme, R. S. Stein, J. Polym. Sci. A2, 8, 1955 (1970). 10 T. Hashimoto, A. Todo, Y. Murakami, J. Polym. Sci., Polym. Phys. Ed., 15, 501 (1977). 11 G. E. Wissler, B. Crist, J. Polym. Sci., Polym. Phys. Ed., 23, 2395 (1985). 12 D. L. Cooke and T. Tikuisis, SPE ANTEC Conf. Proc., 22 (1989). 13 A. Larena and G. Pinto, Polym. Eng. Sci., 33(12), 742 (1993). 14 C.A. Hieber and H.H. Chiang, Rheol. Acta, 28, 321 (1989). 15 C.A. Hieber and H.H. Chiang, Polym. Eng. Sci., 32, 931 (1992). 16 J. Janzen and R. H. Colby, J. Mol. Struct., 485-486, 569 (1999). 17 J. Janzen, D. C. Rohlfing and M. J. Hicks, J. Rheol., (to be published). 18 A. M. Sukhadia, J. Plast. Film and Sheeting, 10, 213-234 (1994). 19 G. L. Wilkes, R. S. Stein, “Structure and Properties of Oriented Polymers,” I. M. Ward, Ed., Chapman and Hill, New York, pg. 44 (1997). 20 G. Kanig, Kolliodzeitschrift, 251, 782 (1973). 21 G. Kanig, Prog. Colloid Polym. Sci., 57, 176 (1975). 22 A. Keller, M. Machin, J. Macromol. Sci., B1(1), 41 (1967). 23 K. Kobayashi, T. Nagasawa, J. Polym. Sci.: Part C, 15, 163 (1966). 24 W. F. Maddams, J. E. Preedy, J. Appl. Polym. Sci., 22, 2721 (1978). 25 K. Choi, J. E. Spruiell, J. L. White, J. Polym Sci., Polym. Phys. Ed., 20, 27 (1982). 26 R. Pazur, R. Prud’homme, Macromol., 29, 119 (1996). 27 R. S. Stein, M. B. Rhodes, J. Polym. Sci. A2, 7, 1539 (1969). 28 R. S. Stein, A. Misra, J. Polym. Sci. A2, 11, 109 (1970). 29 R. S. Stein, G. L. Wilkes, A. Misra, C. Chu, A. B. Desai, Polym. Lett. Ed., 13, 303 (1975). 30 G. L. Wilkes, L. Manzione, H. Jameel, Polym. Lett. Ed., 16, 237 (1978). 31 G. L. Wilkes, Y. Mohajer, B. Orler, B Orler, Polym. Eng. Sci., 24, 319 (1984). 32 R. J. Samuels, “Structured Polymer Properties”, Wiley Interscience, New York, pg. 82 (1974). 33 R. S. Stein, S. Clough, J. J. van Aartsen, J. Appl. Phys., 9, 295 (1971). 34 T. Hashimoto, K. Nagatoshi, H. Kawai, Polymer, 17, 1063 (1976); Polymer, 17, 1075 (1976). 35 R. L. Arnett and C.P. Thomas, J. Phys. Chem., 84, 649 (1980). 36 R. A. Mendelson, W. A. Bowles and F. L. Finger, J. Polym. Sci., Polym. Phys. Ed., 8, 105 (1970). 37 S. L. Aggarwal, G. P. Tilley, O. J. Sweeting, J. Appl. Polym. Sci., 1, 91 (1959).
Matthew B. Johnson Chapter VIII Optical Properties of PE Films _______________________________________________________________________
327
38 A. Prasad, R. Shroff, S. Rane, G. Beaucage, Proc. of SPE-RETEC Int. Symp. on Orientation of Polymers – Applications to Films & Fibers, Boucherville, Quebec, Canada , pg. 139, Sept. (1998). 39 T. H. Yu, G. L. Wilkes, Polymer, 37, 4675, (1996); Erattum, 38(6), 1503 (1997). 40 T. H. Yu, G. L. Wilkes, J. Rheology, 40(6), 1079 (1996). 41 J. M. Dealy, K. F. Wissbrun, “Melt Rheology and its Role in Plastics Processing: Theory and Applications”,Van Nostrand Reinhold, New York, (1990). 42 L. Mandelkern and S. Go, J. Appl. Polym. Sci.: Polym. Phys. Ed., 15, 1189 (1977).