characterics of high early strength conc_thesis
DESCRIPTION
noneTRANSCRIPT
EARLY AGE DEFORMATION CHARACTERISTICS OF
HIGH PERFORMANCE CONCRETE
SHEN LIN
(BSc., Tongji University)
A THESIS SUBMITTED
FOR THE DEGREE OF MASTER OF ENGINEERING
DEPARTMENT OF CIVIL ENGINEERING
NATIONAL UNIVERSITY OF SINGAPORE
2003
Acknowledgement
i
Acknowledgement
I would like to express my appreciation for the following individuals:
To Prof. Zhang Min-Hong, for her patience, encouragement and criticism. It is her
guidance and firm support that make this thesis possible.
To Prof. Ong Khim Chye, Gary, for his advice and counsel on this work.
To Mr. Sit, Mr. Ang, Mr. Choo, as well as other technical staff of the Structure
Laboratory, Department of Civil Engineering, National University of Singapore for
their assistance during the experiment portion of this work.
To Li Lian, Tan Bo, Liang Juxiang, Qian Xuekun, Qian Xudong, Jiang Rongrong,
for friendship, encouragement, and helpful discussions.
Finally, to my wife Zhou Runrun and my family in China. Their love, understanding,
and support have encouraged me throughout this work.
Table of Contents
ii
Table of Contents
Acknowledgement....................................................................................... i
Table of Contents....................................................................................... ii
Summary ...................................................................................................vi
Nomenclature ..........................................................................................viii
List of Figures ........................................................................................... ix
List of Tables ...........................................................................................xvi
Chapter 1 .................................................................................................... 1
INTRODUCTION ..................................................................................... 1
1.1 Background ......................................................................................................... 1
1.2 Objective and scope of present study ................................................................ 2
Chapter 2 .................................................................................................... 3
LITERATURE REVIEW......................................................................... 3
2.1 Autogenous shrinkage ........................................................................................ 3
2.1.1 Introduction.................................................................................................... 3
2.1.2 Mechanism of autogenous shrinkage............................................................. 4
2.1.2.1 Chemical shrinkage................................................................................. 4
2.1.2.2 Pore structure .......................................................................................... 5
2.1.2.3 Self desiccation ....................................................................................... 6
2.1.3 Measurement of autogenous shrinkage.......................................................... 8
2.1.4 Effect of mix proportion .............................................................................. 10
2.1.5 Effect of silica fume..................................................................................... 11

Table of Contents
iii
2.1.6 Effect of temperature ................................................................................... 12
2.1.7 Effect of aggregate....................................................................................... 13
2.2 Drying shrinkage............................................................................................... 13
2.2.1 Introduction.................................................................................................. 13
2.2.2 Definition ..................................................................................................... 14
2.2.3 Mechanism of drying shrinkage................................................................... 14
2.2.3.1 Capillary tension ................................................................................... 14
2.2.3.2 Surface tension...................................................................................... 15
2.2.4 Effect of mix proportion .............................................................................. 16
2.2.5 Effect of silica fume..................................................................................... 17
2.2.6 Effect of environment .................................................................................. 18
2.3 Relationship between autogenous and drying shrinkage .............................. 18
Chapter 3 .................................................................................................. 24
EXPERIMENTAL PROCEDURE ........................................................ 24
3.1 Introduction....................................................................................................... 24
3.2 Mix proportions ................................................................................................ 25
3.3 Materials ............................................................................................................ 25
3.3.1 Cement ......................................................................................................... 25
3.3.2 Water............................................................................................................ 26
3.3.3 Silica fume ................................................................................................... 26
3.3.4 Fine aggregate.............................................................................................. 26
3.3.5 Coarse aggregate.......................................................................................... 26
3.3.6 Superplasticizer............................................................................................ 27
3.4 Mixing procedures ............................................................................................ 27
3.5 Preparation of specimens ................................................................................. 28
Table of Contents
iv
3.6 Curing ................................................................................................................ 28
3.7 Test methods...................................................................................................... 29
3.7.1 Slump ........................................................................................................... 29
3.7.2 Setting time .................................................................................................. 29
3.7.3 Compressive strength................................................................................... 29
3.7.4 Static modulus of elasticity.......................................................................... 29
3.7.5 Dynamic modulus of elasticity .................................................................... 30
3.7.6 Autogenous shrinkage.................................................................................. 31
3.7.6.1 Autogenous shrinkage (First 24 hours)................................................. 31
3.7.6.2 Autogenous shrinkage (after 24 hours)................................................. 33
3.7.7 Drying shrinkage.......................................................................................... 34
3.7.8 Relative Humidity........................................................................................ 34
3.7.9 Pore Structure of Cement Paste ................................................................... 35
Chapter 4 .................................................................................................. 45
RESULTS AND DISCUSSION.............................................................. 45
4.1 Compressive strength ....................................................................................... 45
4.2 Dynamic and static Young’s modulus............................................................. 46
4.3 Pore structure.................................................................................................... 46
4.3.1 Effect of w/b ratio ........................................................................................ 47
4.3.2 Effect of silica fume..................................................................................... 48
4.3.3 Effect of temperature ................................................................................... 49
4.4 Relative humidity .............................................................................................. 49
4.4.1 Effect of water-to-binder ratio ..................................................................... 49
4.4.2 Effect of silica fume..................................................................................... 50
4.4.3 Effect of aggregate type ............................................................................... 50

Table of Contents
v
4.5 Autogenous shrinkage ...................................................................................... 51
4.5.1 Effect of water-to-binder ratio ..................................................................... 52
4.5.2 Effect of Silica Fume ................................................................................... 56
4.5.3 Effect of temperature ................................................................................... 60
4.5.4 Effect of aggregate....................................................................................... 61
4.5.5 Discussion on internal relative humidity, pore structure, and autogenous
shrinkage ............................................................................................................... 63
4.6 Drying and total shrinkage .............................................................................. 64
4.6.1 Effect of water-to-binder ratio ..................................................................... 65
4.6.2 Effect of silica fume..................................................................................... 66
4.6.3 Effect of temperature ................................................................................... 68
4.6.4 Effect of aggregate....................................................................................... 69
4.7 Relations between autogenous, drying, and total shrinkage......................... 70
4.8 Estimation of the risk of shrinkage cracking of restrained concrete ........... 73
Chapter 5 ................................................................................................ 143
CONCLUSIONS AND RECOMMENDATIONS .............................. 143
5.1 Conclusions...................................................................................................... 143
5.2 Recommendations ........................................................................................... 147
REFERENCES ...................................................................................... 149

Summary
vi
Summary
This thesis presents the results of an experimental study on the effects of water/binder
(cement + silica fume) ratio, silica fume, curing temperature, and coarse aggregate type
on the autogenous, drying, and total shrinkage of high performance concrete. The
autogenous shrinkage was also correlated to internal relative humidity and pore
structure of the concrete. Three water/binder ratios of 0.25, 0.35, and 0.45, four silica
fume replacement levels of 0, 5, 10, and 15% of the total binder, two curing
temperatures of 20 and 30 0C, two types of coarse aggregates (granite and expanded
clay lightweight aggregate), and two lightweight aggregate presoak times of 0.5 and 24
hours were investigated.
It was found that concrete with lower water/binder ratio or higher percentage of silica
fume showed higher autogenous shrinkages at earlier age and also showed higher
ratios of the autogenous shrinkage/total shrinkage ratio. During the first 24 hours, the
effect of silica fume on the autogenous shrinkage was more pronounced in concrete
with w/b ratios of 0.25 and 0.35 than in 0.45. At later age up to 240 day, the effect of
silica fume on autogenous shrinkage was more significant in concretes with
water/binder ratio of 0.35 than in 0.25 and 0.45. Close correlations were found
between the autogenous shrinkage, internal relative humidity, and pore structure of the
concrete specimen. For lower water/binder ratios and higher silica fume levels,
autogenous shrinkage increased due to decreased internal relative humidity and more
refined pore structure. For lightweight aggregate, autogenous shrinkage decreased due
principally to increased internal relative humidity.

Summary
vii
Concretes with lower water/binder ratios had lower drying shrinkage and slightly
higher total shrinkage. Concrete with higher silica fume replacement levels had lower
drying shrinkage. The total shrinkage did not seem to be affected by increasing silica
fume content except for the 0.35 water/binder ratio concrete, which showed reduced
total shrinkage. The relationship of autogenous and total shrinkage was significantly
affected by the water/binder ratio and silica fume replacement level. Lower
water/binder ratios, higher silica fume replacement levels, and less water curing
resulted in a higher risk of shrinkage crack in concrete.
The difference between a curing temperature of 20 and 30 0C did not significantly
affect autogenous, drying, and total shrinkage especially at later age. Lightweight
aggregate concrete had lower autogenous shrinkage but similar drying shrinkage
compared with that of the corresponding normal weight concrete. Increasing presoak
time of lightweight aggregates from 0.5 to 24 hours did not affect the autogenous, total
and drying shrinkage considerably.

Nomenclature
viii
Nomenclature
θ - Contact angle (0)
γ - Surface tension of mercury (N/m)
σcap = capillary pressure
total shrinkage of unsealed specimen ---- ع∆
autogeneous shrinkage of specimen---- ’ع∆
d---- drying shrinkage of specimenع∆
D - Density of the specimen (kg/m3)
Ed - Dynamic modulus of elasticity (MPa)
F - Frequency (Hz)
L - Length of the specimen (mm)
Ps = surface pressure
p - Pressure exerted (N/m2)
r - Pore radius (nm)
r = pore radius
R = universal gas constant (8.314J/mol.K)
RH = relative humidity (percentage)
S = specific surface area of the solid (m2/g)
T = absolute temperature (K)
Vm = molar volume of water
List of Figures
ix
List of Figures
Figure 2.1 Causes of autogenous shrinkage.................................................................. 20
Figure 2.2 Original VTT measuring method, with gauges imbedded from base (Holt
and Leivo 1999) .................................................................................................... 21
Figure 2.3Adaptation of VTT measuring method, with laser and position sensing
device (Holt and Leivo 1999) ............................................................................... 21
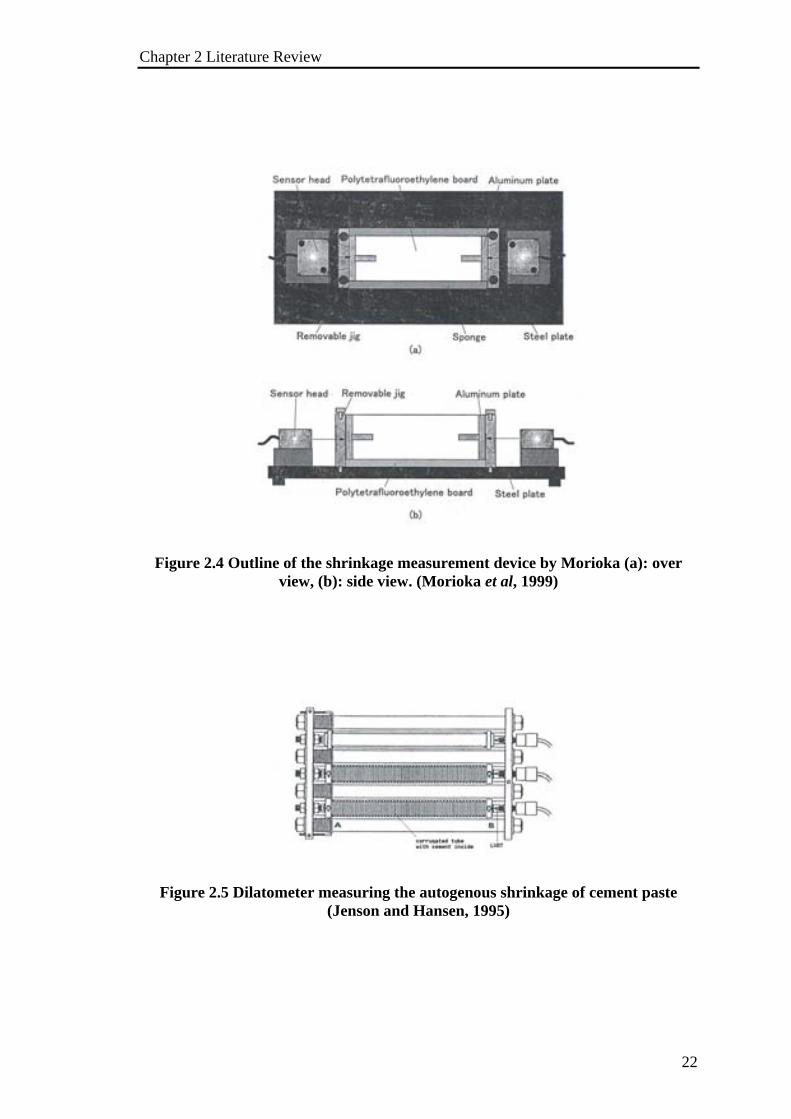
Figure 2.4 Outline of the shrinkage measurement device by Morioka (a): over view, (b):
side view. (Morioka et al, 1999)........................................................................... 22
Figure 2.5 Dilatometer measuring the autogenous shrinkage of cement paste (Jenson
and Hansen, 1995) ................................................................................................ 22
Figure 2.6 Schematic diagram of capillary tension mechanism (Mindess et al, 2003) 23
Figure 2.7 Schematic diagram of surface tension mechanism for causing drying
shrinkage of cement paste (Mindess et al, 2003).................................................. 23
Figure 3.1 Penetrometer for setting time determination ............................................... 40
Figure 3.2 Machine for modulus of Elasticity test........................................................ 40
Figure 3.3 Erudite Resonant Frequency Tester for dynamic Young’s modulus........... 41
Figure 3.4 Setup of the steel plate and mold for autogenous shrinkage measurement . 41
Figure 3.5 Aluminum plate cast at each end of the specimen as target surface ........... 42
Figure 3.6 Mechanical Demec gauge for later age autogenous and total shrinkage
measurements........................................................................................................ 42
Figure 3.7 Probe for internal relative humidity measurements..................................... 43
Figure 3.8 Device and concrete specimen for internal RH measurements ................... 43
Figure 3.9 Porosimeter 4000 for pore size distribution of the cement pastes............... 44
Figure 4.1 Effect of w/b on 1 day pore size distribution (SF=0%, 30 0C).................... 96
List of Figures
x
Figure 4.2 Effect of w/b on 1 day pore size distribution (SF=10%, 30 0C).................. 96
Figure 4.3 Effect of w/b on 28 days pore size distribution (SF=0%, 30 0C) ................ 97
Figure 4.4 Effect of w/b on 28 days pore size distribution (SF=10%, 30 0C) .............. 97
Figure 4.5 Effect of SF on 1 day relative pore size distribution (w/b=0.25, 30 0C) ..... 98
Figure 4.6 Effect of SF on 1 day cumulative pore size distribution ............................. 98
Figure 4.7 Effect of SF on 28 days relative pore size distribution (w/b=0.25, 30 0C).. 99
Figure 4.8 Effect of SF on 28 days cumulative pore size distribution.......................... 99
Figure 4.9 Effect of SF on 1 day relative pore size distribution (w/b=0.35, 30 0C) ... 100
Figure 4.10 Effect of SF on 1 day cumulative pore size distribution ......................... 100
Figure 4.11 Effect of SF on 28 days relative pore size distribution ........................... 101
Figure 4.12 Effect of SF on 28 days cumulative pore size distribution...................... 101
Figure 4.13 Effect of SF on 1 day relative pore size distribution (w/b=0.45, 30 0C) . 102
Figure 4.14 Effect of SF on 1 day cumulative pore size distribution ......................... 102
Figure 4.15 Effect of SF on 28 days relative pore size distribution ........................... 103
Figure 4.16 Effect of SF on 28 days cumulative pore size distribution...................... 103
Figure 4.17 Effect of temperature on 1 day relative pore size distribution (w/b=0.35,
SF=0%) ............................................................................................................... 104
Figure 4.18 Effect of temperature on 1 day cumulative pore size distribution (w/b=0.35,
SF=0%) ............................................................................................................... 104
Figure 4.19 Effect of temperature on 28 days relative pore size distribution (w/b=0.35,
SF=0%) ............................................................................................................... 105
Figure 4.20 Effect of temperature on 28 days cumulative pore size distribution
(w/b=0.35, SF=0%)............................................................................................. 105
Figure 4.21 Effect of temperature on 1 day relative pore size distribution (w/b=0.35,
SF=10%) ............................................................................................................. 106

List of Figures
xi
Figure 4.22 Effect of temperature on 1 day cumulative pore size distribution (w/b=0.35,
SF=10%) ............................................................................................................. 106
Figure 4.23 Effect of temperature on 28 days relative pore size distribution (w/b=0.35,
SF=10%) ............................................................................................................. 107
Figure 4.24 Effect of temperature on 28 days cumulative pore size distribution
(w/b=0.35, SF=10%)........................................................................................... 107
Figure 4.25 Effect of w/b on internal relative humidity of concrete (SF =0, 30 0C) .. 108
Figure 4.26 Effect of w/b on the internal relative humidity of concrete..................... 108
Figure 4.27 Effect of w/b on the internal relative humidity of concrete..................... 109
Figure 4.28 Effect of w/b on the internal relative humidity of concrete..................... 109
Figure 4.29 Effect of SF on the internal relative humidity of concrete ...................... 110
Figure 4.30 Effect of SF on the internal relative humidity of concrete ...................... 110
Figure 4.31 Effect of SF on the internal relative humidity of concrete ...................... 111
Figure 4.32 Effect of aggregate on the internal relative humidity of concrete ........... 111
Figure 4.33 Effect of aggregate on the internal relative humidity of concrete ........... 112
Figure 4.34 Effect of w/b ratio on the autogenous shrinkage of concrete within the first
24 hour (SF=0%, 30 0C)...................................................................................... 112
Figure 4.35 Effect of w/b ratio on the autogenous shrinkage of concrete within the first
24 hour (SF=5%, 30 0C )..................................................................................... 113
Figure 4.36 Effect of w/b ratio on the autogenous shrinkage of concrete within the first
24 hour (SF=10%, 30 0C).................................................................................... 113
Figure 4.37 Effect of w/b ratio on the autogenous shrinkage of concrete within the first
24 hour (SF=15%, 30 0C).................................................................................... 114
Figure 4.38 Effect of w/b on the autogenous shrinkage of concrete up to 240 days
(SF=0, 30 0C) ...................................................................................................... 114
List of Figures
xii
Figure 4.39 Effect of w/b on the autogenous shrinkage of concrete up to 240 days
(SF=5%, 30 0C)................................................................................................... 115
Figure 4.40 Effect of w/b on the autogenous shrinkage of concrete up to 240 days
(SF=10%, 30 0C)................................................................................................. 115
Figure 4.41 Effect of w/b on the autogenous shrinkage of concrete up to 240 days
(SF=15%, 30 0C)................................................................................................. 116
Figure 4.42 Effect of W/B and SF on the ratios of autogenous shrinkage at 28 days and
240 days (30 0C).................................................................................................. 116
Figure 4.43 Effect of SF content on the autogenous shrinkage of concrete within the
first 24 hour (w/b=0.25, 30 0C)........................................................................... 117
Figure 4.44 Effect of SF content on the autogenous shrinkage of concrete within the
first 24 hour (w/b=0.35, 30 0C)........................................................................... 117
Figure 4.45 Effect of SF content on the autogenous shrinkage of concrete within the
first 24 hour (w/b=0.45, 30 0C)........................................................................... 118
Figure 4.46 Effect of SF on the autogenous shrinkage of concrete up to 240 days
(w/b=0.25, 30 0C)................................................................................................ 118
Figure 4.47 Effect of SF on the autogenous shrinkage of concrete up to 240 days
(w/b=0.35, 30 0C)................................................................................................ 119
Figure 4.48 Effect of SF on the autogenous shrinkage of concrete up to 240 days
(w/b=0.45, 30 0C)................................................................................................ 119
Figure 4.49 Effect of temperature on the autogenous shrinkage of concrete within the
first 24 hour (w/b=0.35, SF=0) ........................................................................... 120
Figure 4.50 Effect of temperature on the autogenous shrinkage of concrete within the
first 24 hour (w/b=0.35, SF=10%)...................................................................... 120

List of Figures
xiii
Figure 4.51Effect of temperature on the autogenous shrinkage of concrete up to 240
days (w/b=0.35, SF=10%) .................................................................................. 121
Figure 4.52 Effect of aggregate on the autogenous shrinkage of concrete within the
first 24 hour (w/b=0.35, SF=10%, 30 0C)........................................................... 121
Figure 4.53 Effect of aggregate on the autogenous shrinkage of concrete within the
first 24 hour (w/b=0.35, SF=0, 30 0C) ................................................................ 122
Figure 4.54 Effect of aggregate on the autogenous shrinkage of concrete up to 240
days (w/b=0.35, SF=0)........................................................................................ 122
Figure 4.55 Effect of aggregate on the autogenous shrinkage of concrete up to 240
days (w/b=0.35, SF=10%) .................................................................................. 123
Figure 4.56 Effect of aggregate presoak time on the autogenous shrinkage of concrete
within the first 24 hour (w/b=0.35, SF=10%, 30 0C).......................................... 123
Figure 4.57 Effect of aggregate presoaked time on the autogenous shrinkage of
concrete up to 240 days (w/b=0.35, SF=10%).................................................... 124
Figure 4.58 Autogenous shrinkage vs. relative humidity (w/b=0.25, 30 0C) ............. 124
Figure 4.59 Autogenous shrinkage vs. relative humidity (w/b=0.35, 30 0C) ............. 125
Figure 4.60 Autogenous shrinkage vs. relative humidity (w/b=0.45, 30 0C) ............. 125
Figure 4.61 Aggregate type on AS- RH curve (w/b=0.35, SF=0) .............................. 126
Figure 4.62 Aggregate type on AS- RH curve (w/b=0.35, SF=10%)......................... 126
Figure 4.63 Effect of w/b on the drying shrinkage (SF=0, 30 0C).............................. 127
Figure 4.64 Effect of w/b on the drying shrinkage (SF=5%, 30 0C) .......................... 127
Figure 4.65 Effect of w/b on the drying shrinkage (SF=10%, 30 0C) ........................ 128
Figure 4.66 Effect of w/b on the drying shrinkage (SF=15%, 30 0C) ........................ 128
Figure 4.67 Effect of w/b on the total shrinkage (SF=0, 30 0C) ................................. 129
Figure 4.68 Effect of w/b on the total shrinkage (SF=5%, 30 0C).............................. 129

List of Figures
xiv
Figure 4.69 Effect of w/b on the total shrinkage (SF=10%, 30 0C)............................ 130
Figure 4.70 Effect of w/b on the total shrinkage (SF=15%, 30 0C)............................ 130
Figure 4.71 Effect of SF on the drying shrinkage (w/b =0.25, 30 0C)........................ 131
Figure 4.72 Effect of SF on the drying shrinkage (w/b =0.35, 30 0C)........................ 131
Figure 4.73 Effect of SF on the drying shrinkage (w/b =0.45, 30 0C)........................ 132
Figure 4.74 Effect of SF on the total shrinkage (w/b =0.25, 30 0C) ........................... 132
Figure 4.75 Effect of SF on the total shrinkage (W/B=0.35, 30 0C)........................... 133
Figure 4.76 Effect of SF on the total shrinkage (w/b=0.45, 30 0C) ............................ 133
Figure 4.77 Effect of temperature on the total shrinkage (w/b =0.35, SF=10%) ....... 134
Figure 4.78 Effect of temperature on the drying shrinkage (w/b =0.35, SF=10%) .... 134
Figure 4.79 Effect of LWA on the drying shrinkage (w/b =0.35, SF=0, 30 0C) ........ 135
Figure 4.80 Effect of LWA on the drying shrinkage (w/b =0.35, SF=10%, 30 0C) ... 135
Figure 4.81 Effect of LWA on the total shrinkage (w/b =0.35, SF=0, 30 0C)............ 136
Figure 4.82 Effect of LWA on the total shrinkage (W/B=0.35, SF=10%, 30 0C)...... 136
Figure 4.83 Effect of lightweight aggregate presoak time on the total shrinkage
(w/b=0.35, SF=10%, 30 0C)................................................................................ 137
Figure 4.84 Effect of lightweight aggregate presoak time on the drying shrinkage
(w/b=0.35, SF=10%, 30 0C)................................................................................ 137
Figure 4.85 Effect of W/B and SF on AS/TS ratio at 28 days.................................... 138
Figure 4.86 Effect of W/B and SF on AS/TS ratio at 240 days.................................. 138
Figure 4.87 Estimation of potential cracking of concrete (w/b =0.25, SF=0, 30 0C,
sealed) ................................................................................................................. 139
Figure 4.88 Estimation of potential cracking of concrete (w/b =0.25, SF=0, 30 0C, air
dry)...................................................................................................................... 139
List of Figures
xv
Figure 4.89 Estimation of potential cracking of concrete (w/b =0.25, SF=10%, 30 0C,
sealed) ................................................................................................................. 140
Figure 4.90 Estimation of potential cracking of concrete (w/b =0.25, SF=10%, 30 0C,
air dry)................................................................................................................. 140
Figure 4.91 Estimation of potential cracking of concrete (w/b =0.45, SF=0, 30 0C,
sealed) ................................................................................................................. 141
Figure 4.92 Estimation of potential cracking of concrete (w/b =0.45, SF=0, 30 0C, air
dry)...................................................................................................................... 141
Figure 4.93 Estimation of potential cracking of concrete (w/b =0.45, SF=10%, 30 0C,
sealed) ................................................................................................................. 142
Figure 4.94 Estimation of potential cracking of concrete (w/b =0.45, SF=10%, 30 0C,
air dry)................................................................................................................. 142
List of Tables
xvi
List of Tables
Table 3.1 Mix proportion of concrete ........................................................................... 37
Table 3.2 Characteristics of the cement and SF............................................................ 38
Table 3.3 Sieve analyses of coarse and fine aggregate ................................................. 38
Table 3.4 Curing conditions of specimen ..................................................................... 39
Table 4.1 Compressive Strength ................................................................................... 76
Table 4.2 Modulus of Elasticity of the Control Concrete Mixture with w/b ratio of 0.25
and granite (Mix N25) .......................................................................................... 77
Table 4.3 Modulus of Elasticity of the Concrete Mixture with w/b ratio of 0.25, 5% SF
and granite (Mix S25-5)........................................................................................ 78
Table 4.4 Modulus of Elasticity of the Concrete Mixture with w/b ratio of 0.25, 10%
SF and granite (Mix S25-10) ................................................................................ 79
Table 4.5 Modulus of Elasticity of the Concrete Mixture with w/b ratio of 0.25, 15%
SF and granite (Mix S25-15) ................................................................................ 80
Table 4.6 Modulus of Elasticity of the Control Concrete Mixture with w/b ratio of 0.35,
and granite (Mix N35) .......................................................................................... 81
Table 4.7 Modulus of Elasticity of the Concrete Mixture with w/b ratio of 0.35, 5% SF
and granite (Mix S35-5)........................................................................................ 82
Table 4.8 Modulus of Elasticity of the Concrete Mixture with w/b ratio of 0.35, 10%
SF and granite (Mix S35-10) ................................................................................ 83
Table 4.9 Modulus of Elasticity of the Concrete Mixture with w/b ratio of 0.35, 15%
SF and granite (Mix S35-15) ................................................................................ 84
Table 4.10 Modulus of Elasticity of the Control Concrete Mixture with w/b ratio of
0.45 and granite (Mix N45) .................................................................................. 85
List of Tables
xvii
Table 4.11 Modulus of Elasticity of the Concrete Mixture with w/b ratio of 0.45, 5%
SF and granite (Mix S45-5) .................................................................................. 86
Table 4.12 Modulus of Elasticity of the Concrete Mixture with w/b ratio of 0.45, 10%
SF and granite (Mix S45-10) ................................................................................ 87
Table 4.13 Modulus of Elasticity of the Concrete Mixture with w/b ratio of 0.45, 15%
SF and granite (Mix S45-15) ................................................................................ 88
Table 4.14 Modulus of Elasticity of the Control Concrete Mixture with w/b ratio of
0.35, Lightweight aggregate with 0.5 hour water sorption (Mix L35-0.5) ........... 89
Table 4.15 Modulus of Elasticity of the Control Concrete Mixture with w/b ratio of
0.35, Lightweight aggregate with 24 hour water sorption (Mix L35-24)............. 90
Table 4.16 Modulus of Elasticity of the Concrete Mixture with w/b ratio of 0.35, 10%
SF and Lightweight aggregate with 0.5 hour water sorption (Mix SL35-10-0.5) 91
Table 4.17 Modulus of Elasticity of the Concrete Mixture with w/b ratio of 0.35, 10%
SF and Lightweight aggregate with 0.5 hour water sorption (Mix SL35-10-24) . 92
Table 4.18 International Union of Pure and Applied Chemistry (IUPAC) pore size
classification (IUPAC, 1972)................................................................................ 93
Table 4.19 Pore Characteristics of 1 day pastes (30 0C)............................................... 93
Table 4.20 Pore Characteristics of 28 days pastes (30 0C) ........................................... 93
Table 4.21 Initial setting time and peak temperature rise of concretes......................... 94
Table 4.22 Autogenous, drying and total shrinkage of concrete at 28 days (unit:
microstrain) ........................................................................................................... 95
Table 4.23 Autogenous, drying and total shrinkage of concrete at 240 days (unit:
microstrain) ........................................................................................................... 95
Table 5.1 Summaries of Effects of Parameters on Concrete Properties ..................... 148

Chapter1 Introduction
1
Chapter 1
INTRODUCTION
1.1 Background
During the last few decades, concrete used in practice has undergone significant
changes. Interest in the use of high-performance concrete has been increasing
especially in the construction of high-rise buildings, long-span bridges, and structures
exposed to severe environment. High performance concrete generally has lower
water/binder (w/b) ratios and often includes admixtures such as superplasticizers and
silica fume (SF). Such concretes have improved properties. For example, the
incorporation of SF increases the compressive strength and decreases permeability of
the concrete. The use of superplasticizers greatly enhances the workability of concrete
and makes concrete with low w/b ratios workable. However, there appears to be an
increased tendency for such concrete to develop cracks during hardening. This
tendency is greatly dependent on the autogenous and drying shrinkage of the concretes.
With research, a lot of progress has been made in the understanding of the deformation
behavior of high-performance concrete. The causes and mechanisms of the autogenous
shrinkage have been proposed (Tazawa, 1998). Factors affecting the autogenous
shrinkage have been studied and some methods have been proposed to reduce it.

Chapter1 Introduction
2
However, there is limited information available on the impact of early age temperature
on autogenous shrinkage (Tazawa, 1998). The effect of the type and amount of mineral
admixtures on autogenous shrinkage are not clear yet. There is no standard test method
to measure the autogenous shrinkage and a variety of devices such as linear variable
differential transducers (LVDT), dial gages, embedment strain gages, and laser sensors
have been used in research. This makes an overall comparison of the results reported
very difficult. Moreover, very little information is available on the drying shrinkage of
high-performance concretes. Autogenous shrinkage and drying shrinkage occur
simultaneously in high performance concrete. Unfortunately, most results reported in
the literature were performed on specimens exposed to a dry environment without
sealed companions for comparisons. This makes the separation of the autogenous
shrinkage from drying shrinkage impossible.
1.2 Objective and scope of present study
The objectives of this research project are to study the effects of w/b ratio, SF content,
curing temperature, and type of coarse aggregate on the autogenous shrinkage and
drying shrinkage of high-performance concrete, and to establish a relationship between
the autogenous and total shrinkage of concrete exposed to dry environment. The effect
of the pore structure of the hydrated cement paste and relative humidity (RH) of the
concrete on the autogenous shrinkage of concrete was also investigated. Based on the
information on the shrinkage, strength, and elastic modulus, the risk of potential
shrinkage cracking is discussed.

Chapter 2 Literature Review
3
Chapter 2
LITERATURE REVIEW
2.1 Autogenous shrinkage
2.1.1 Introduction
Autogenous shrinkage is the change in volume produced by the continued hydration of
cement, exclusive of the effects of applied load and changes in either thermal condition
or moisture content. Davis and Lyman reported this phenomenon as early as 1930s
(Davis, 1940; Lyman, 1934).
Though the autogenous shrinkage of concrete has been known for more than 60
years,little attention has been paid to it compared with drying shrinkage of concrete.
This is because the strain arising from the autogenous shrinkage for conventional
concrete (w/b ratio>0.5) was considered small enough to be ignored.
However, with the wide application of high-performance concrete (HPC) in the last
few decades, autogenous shrinkage has drawn more attention than before. This is
because HPC generally has low water/binder (w/b) ratio and high binder volume, and
often incorporates supplementary cementitious materials such as ground granulated

Chapter 2 Literature Review
4
blast-furnace slag (GGBS) or silica fume (SF). Therefore, its autogenous shrinkage
may be considerably higher (above 400×10-6) than that of ordinary concrete (Tazawa,
1998).
The greater autogenous shrinkage values in low w/b ratio concrete may cause
problems during construction. For example, the concrete may crack at very early age
under conditions without moisture losses and stresses induced by the presence of a
thermal gradient. Flexural strength of sealed high-strength concrete decreases with an
increase in curing age (Brooks and Hynes, 1993). Persson (1996) investigated SF
content with low w/b ratio and suggested that autogenous shrinkage causes tensile
stresses in the cement paste but compression in the aggregates present in concrete.
When the autogenous shrinkage exceeds the tensile strain capacity of cement paste,
cracks will appear. Because of this, the strength of concrete containing SF with low
w/b ratios may be affected (Persson, 1998).
2.1.2 Mechanism of autogenous shrinkage
Autogenous shrinkage is caused by self-desiccation which is the consumption of water
by cement hydration and the formation of fine pores in the hardened cement. In order
to understand the mechanism of autogenous shrinkage, it is necessary to understand (1)
chemical shrinkage; (2) microstructure; and (3) self-desiccation.
2.1.2.1 Chemical shrinkage
Chemical shrinkage is a phenomenon that results in the absolute volume of hydration
products being less than the total volume of unhydrated cement and water before

Chapter 2 Literature Review
5
hydration. Cement produces various types of hydrates during the hydration process.
Tazawa and Miyazawa (1993) reported that the w/b ratio and types of cement and
admixture are the main factors which influence chemical shrinkage.
Chemical shrinkage is not autogenous shrinkage. Chemical shrinkage results in a
reduction in the absolute volume of reactants whereas autogenous shrinkage arises
from a reduction in the external volume occurring after initial setting as a result of self-
desiccation. However, autogenous shrinkage is generated as a result of chemical
shrinkage as the main cause.
As cement hydration progresses, pores are produced in the hardened cement paste due
to a reduction in volume caused by chemical shrinkage. Capillary pore water and the
gel water are consumed and menisci are produced in the capillary pores and fine pores
in the case when no external water is available. As a result, the hardened concrete
shows shrinkage due to negative pressure. The capillary tension theory may be useful
in explaining this mechanism as in the case of drying shrinkage.
2.1.2.2 Pore structure
After the initial setting of cement paste, a skeleton of the microstructure is formed. As
a result, hardened cement matrix cannot shrink as much as the volume reduction
caused by chemical shrinkage. Therefore, pores are formed as hydration progresses.
Autogenous shrinkage is dependent on the rigidity of the cement paste structure which
is determined by the morphology of the hydration products (Tazawa and Miyazawa,
1993).
Chapter 2 Literature Review
6
During the early stage of hydration, ettringite is formed both in the pore solution and
on the surface of cement particles. Ettringite, also called calcium sulfoaluminate
hydrate, comprises needle-like crystals. As a result, a large volume of fine pores is
formed in the hardened cement matrix.
In the long-term hydration process, calcium silicate phases continue to react slowly
and produce fine and irregular-shaped C-S-H which is filled with gel pores.
The formation of ettringite and C-S-H as well as the microstructure are strongly
affected by the chemical composition of cement and curing condition. For example,
mineral admixtures such as SF and blast furnace slag will largely increase the amount
of C-S-H.
2.1.2.3 Self desiccation
In hardened cement paste, the amount of free water decreases and micro-pores are
formed by the hydration reaction of cement minerals. This process has been studied by
many researchers (Tazawa et al, 1995; Jensen, et al 1996; Hua, et al 1995; Justnes, et
al 1996). In a porous material such as hardened cement paste matrix, equilibrium
between the pore water and the pore atmosphere is affected by the pore size and the
humidity within the pores. Under high humidity conditions, water can exist in the
larger pores. As the free water decreases and micropores are formed as hydration
reaction progresses, the water vapor pressure reduces and the relative humidity (RH)
within the fine pores decreases. This phenomenon is called self-desiccation because of
the decrease in RH within the hardened cement paste matrix with no mass being lost.
Self-desiccation has been experimentally proven by many researchers (e.g. Hooton et
Chapter 2 Literature Review
7
al, 1992). During the process of drying shrinkage of a hardened cement paste, water
starts to evaporate from the larger pores. During the process of self-desiccation, water
is thought to be consumed at the place of the hydration front which is suspected to
exist as fine pores in many cases. As a result, self-desiccation is considered to be
significant in cases where there are large amounts of fine pores with less water present
in the hardened cement paste. In other words, the degree of self-desiccation is strongly
related to the microstructure of the cement paste.
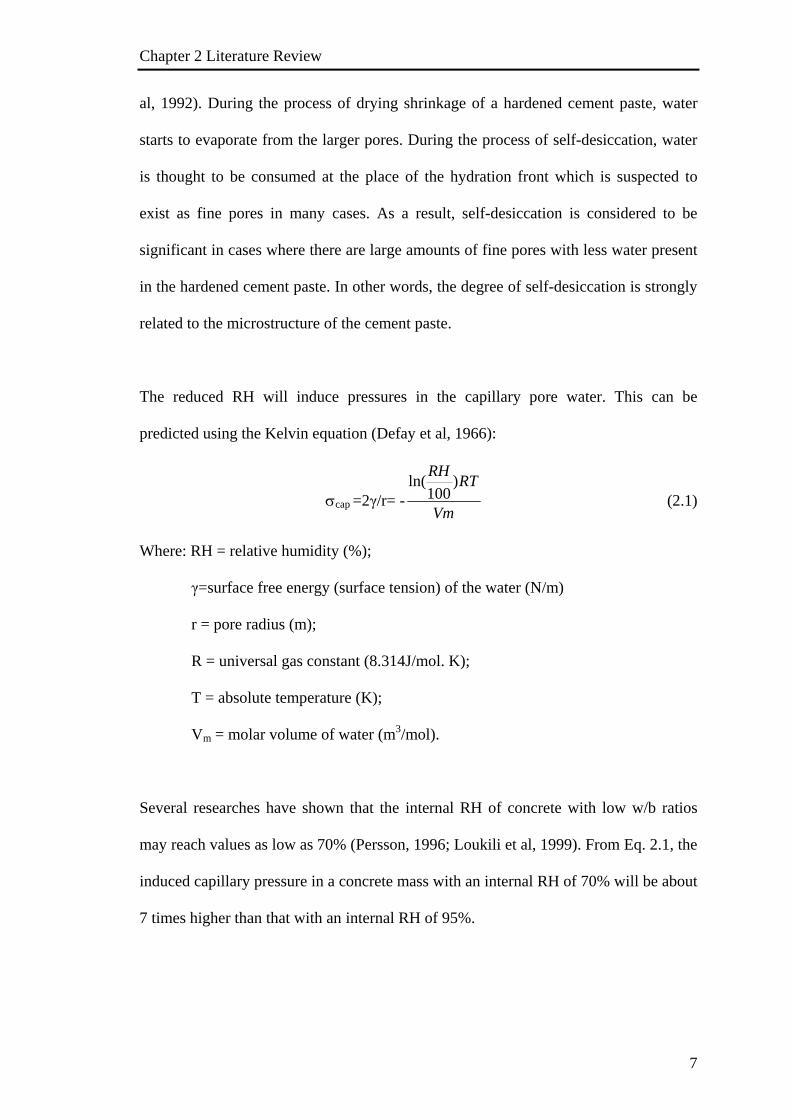
The reduced RH will induce pressures in the capillary pore water. This can be
predicted using the Kelvin equation (Defay et al, 1966):
σcap =2γ/r= -Vm
RTRH )100
ln( (2.1)
Where: RH = relative humidity (%);
γ=surface free energy (surface tension) of the water (N/m)
r = pore radius (m);
R = universal gas constant (8.314J/mol. K);
T = absolute temperature (K);
Vm = molar volume of water (m3/mol).
Several researches have shown that the internal RH of concrete with low w/b ratios
may reach values as low as 70% (Persson, 1996; Loukili et al, 1999). From Eq. 2.1, the
induced capillary pressure in a concrete mass with an internal RH of 70% will be about
7 times higher than that with an internal RH of 95%.

Chapter 2 Literature Review
8
The increased capillary tension of the pore water caused by self-desiccation is the main
cause of autogenous shrinkage as it is in drying shrinkage (Tazawa and Miyazawa,
1993). Self-desiccation is pronounced in low w/b ratio concrete because the small
amount of water in the concrete is rapidly consumed during the early stage of
hydration and the finer pore size distribution impedes the penetration of water from the
external environment for further cement hydration.
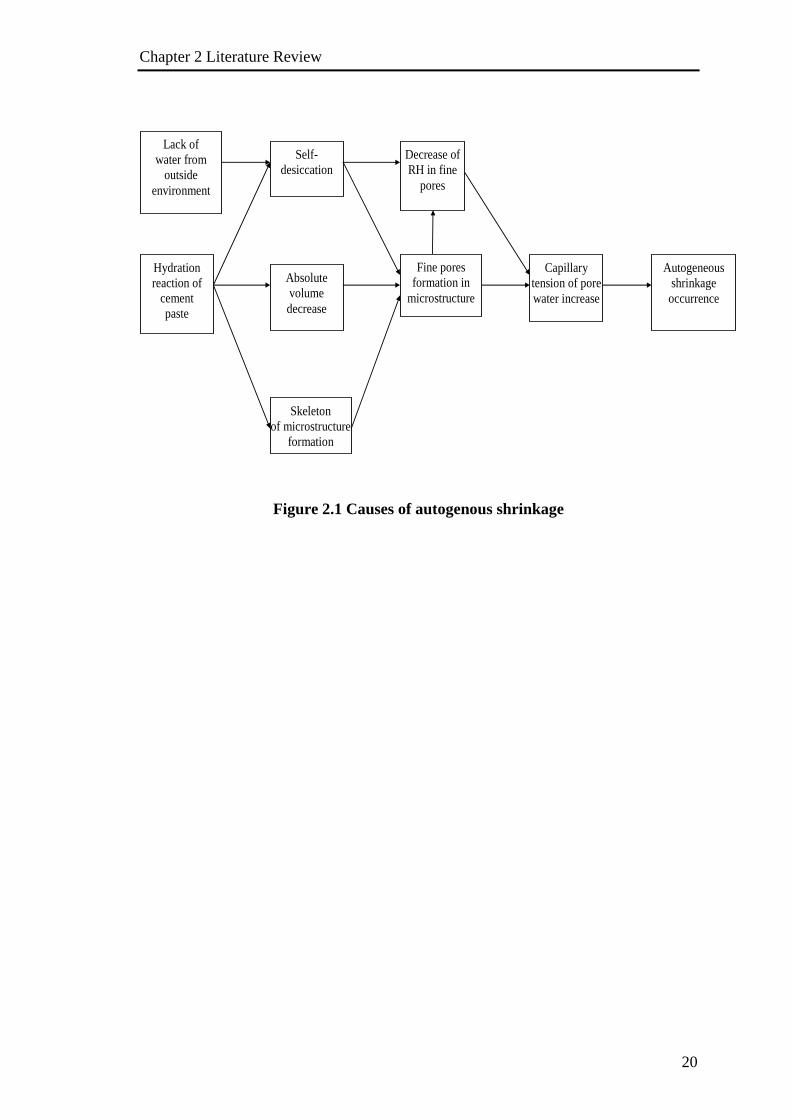
The schematic relationship between chemical shrinkage, pore structure, self-
desiccation, and autogenous shrinkage is illustrated in Fig. 2.1.
2.1.3 Measurement of autogenous shrinkage
Autogenous shrinkage starts at initial setting time when concrete is still in the mold.
During early stages, autogenous shrinkage develops very fast. This makes accurate
measurement of autogenous shrinkage very difficult. Because there is no standard test
method available to measure autogenous shrinkage, a variety of devices such as linear
variable differential transducers (LVDT), dial gages, embedment strain gages, and
laser sensors have been used in reported literature.
In trying to measure early age autogenous shrinkage, Holt and Leivo (1999) used
vertical metal supports positioned on the bottom of the mould to which LVDTs are
attached (Fig. 2.2). This method is also called VTT method. The problem with these
gauges is that they risk measuring movements resulted from the settling of fresh
concrete. As the concrete undergoes vertical deformation within the first hour after
casting, the dead weight of the concrete exerts a pressure on the vertical mould walls
and the supports. It is also impossible to identify the location at which the gauges are

Chapter 2 Literature Review
9
measuring and whether the shrinkage is representative of the average value or a value
close to the surface. Horizontal shrinkage gauges were also used in their research to
measure early age autogenous shrinkage. These gauges permit measurements similar
to the previous method (i.e. the original VTT measuring method shown in Fig. 2.2)
without the problems of restraint at the surface. However, uncertainties exist at the
mold wall and concrete surface where the gauges were attached. As the concrete settles,
it is possible that the gauges would experience forces exerted vertically on them. This
would render a perfectly horizontal alignment difficult if not impossible. Recent
adaptations of the VTT test arrangement have included replacing the horizontal
shrinkage devices by a more accurate method of placing lightweight sensors on the
concrete surface to detect movement by lasers (Fig. 2.3). This method seems to be the
most simple (without having forces imposed on the embedded gauges by settling) as
long as the sensor remains level on the top of the concrete.
Recently, a method of measuring the autogenous shrinkage of expansive mortar and
rapid hardening cement paste by using laser sensors equipped with a computer system
was proposed by Morioka et al (1999). This method provides excellent accuracy and
reproducibility and can be applied automatically and continuously. Two sensor heads
were installed for 1 mould (0.04m×0.04m×0.16m) fixed on a steel plate (Fig. 2.4). Due
to non-contact nature, repulsive force is not generated and friction resistance is very
small. Human errors in measurement are minimized, as measurement is automatically
carried out by calculation software of a personal computer. This method is very useful
as a method for carrying out quality control of cement concrete, by introducing the
measured results of autogenous shrinkage into cracking analysis.

Chapter 2 Literature Review
10
Jensen et al (1995) used a type of dilatometer to measure the autogenous shrinkage of
cement paste and concrete (Fig. 2.5). The fresh cement paste or concrete was cast into
a corrugated tube which functions as a mold. The corrugated tube permits the cement
paste or concrete to shrink freely in the longitudinal direction and at the same time
keeps the cross-sectional area constant. The temperature of specimens is controlled by
immersing the dilatometer in a thermostatic bath. The special features of this type of
dilatometers are: 1) small restraint on the cement paste or concrete; 2) measurements
can commence very early (even before initial setting); 3) accurate temperature control
of hardening cement paste or concrete; and 4) efficient sealing of the fresh cement
paste or concrete.
2.1.4 Effect of mix proportion
Autogenous shrinkage is influenced by the mix proportion. Autogenous shrinkage
increases with a decrease in w/b ratio or with an increase in the amount of cement
paste. In the case of concrete with very high w/b ratio (0.60 to 0.80), there is
practically no autogenous shrinkage because following the volumetric contraction of
the hydrated cement paste, the high porosity within the concrete drains water away
from the large capillary pores (Aitcin, 1999). The menisci originating from self-
desiccation have large diameters and result in very weak tensile stress. In such
concrete, autogenous shrinkage ranged from 20 to 110 microstrain which is
approximately 5 to 10 times smaller than the long-term drying shrinkage of such
concrete (Davis, 1940). However, what was observed with high w/b ratio concrete is
not true for high-performance concrete, which has a much lower w/b ratio. The lower
the w/b ratio, the greater the relative importance of autogenous shrinkage as compared
with drying shrinkage. Also, autogenous shrinkage is increased when the unit content
Chapter 2 Literature Review
11
of binder increases or when the volume concentration of aggregate decreases. The
influence of air content is reported to be the same as that of the volume of cement
paste, but the detailed effects of air content on autogenous shrinkage is not clear
(Tazawa, 1998).
2.1.5 Effect of silica fume
Silica fume is a by-product resulting from the reduction of quartz in an electric arc
furnace during the production of silicon metal and ferro-silicon alloys. Silica fume
consists of very fine smooth particles with surface areas ranging from 13,000 to 30,000
m2/kg determined by nitrogen adsorption.
Silica fume is often used as an ingredient in high-performance concrete. Incorporation
of SF in concrete alters the chemistry and morphology of the hydration products, pore
structure of cement paste and interface zone between cement paste and aggregate.
Combined with the use of superplasticizers, it is possible to achieve very dense
packing and very low w/b ratios, leading to high strength.
It has been reported by many researchers that SF modified cement paste and concrete
will undergo higher and earlier autogenous shrinkage. Tazawa reported that with a w/b
ratio of 0.17, autogenous shrinkage could be as high as 4,000 microstrain in SF
modified cement paste (Tazawa and Miyazawa, 1993). Igarashi observed that in
concrete with a w/b ratio of 0.33, specimen with 10% replacement of SF shrink earlier
than controlled ones (Igarashi et al, 1999).

Chapter 2 Literature Review
12
The higher and earlier autogenous shrinkage has been attributed to the pore refinement
process and high self-desiccation of SF modified concrete (Tazawa and Miyazawa,
1993). Silica fume is a highly active pozzolan which undergoes pozzolanic reaction
with calcium hydroxide (CH) generated from the cement hydration. Pozzolanic
reactions consume CH and form C-S-H. The reaction products and the filler effect of
SF particles dramatically refine the pore structure. On the other hand, high self-
desiccation is caused by the fine pore structure and accelerated hydration and
pozzolanic reaction. The refinement of pores and high self-desiccation increase the
capillary tension, suction potential and autogenous shrinkage.
2.1.6 Effect of temperature
During the early age after casting, heat of hydration usually results in temperature rise
of concrete. This temperature rise results in an increase in absolute volume concurrent
with the autogenous shrinkage of the concrete. It is often observed that, during the very
first few hours of hardening, concrete with a very low w/b ratio swell as long as this
thermal expansion is larger than autogenous shrinkage. However, autogenous
shrinkage usually overtakes the thermal expansion quite rapidly, so that low w/b ratio
concrete shrinks after this initial swelling phase.
At later age after demoulding, the curing temperature also affects autogenous
shrinkage development. At high temperatures, the initial autogenous shrinkage
increases whilst later autogenous shrinkage was reported to decrease (Tazawa, 1998).
For OPC, the influence of curing temperature on autogenous shrinkage can be
estimated using the maturity of curing condition. However, for concrete modified by
Chapter 2 Literature Review
13
mineral admixtures such as SF and slag, the maturity theory is reported to be not
applicable (Tazawa, 1998).
2.1.7 Effect of aggregate
Because aggregate does not shrink, concrete with higher volumes of aggregate undergo
lower autogenous shrinkage.
As the self-desiccation of concrete is a major cause of the autogenous shrinkage, a
logical way to mitigate or eliminate this type of shrinkage is to prevent the occurrence
of self-desiccation (Takada, 1998). In order to achieve this it has been proposed that
saturated lightweight aggregate be added to the mix. The saturated aggregate particles
will act as water reservoirs which release the water at the moment the RH within the
concrete drops. Takada (1998) studied the autogenous shrinkage of concrete mixes in
which normal weight aggregates were replaced partly or wholly by lightweight
aggregates. The replacement percentages used were 10%, 17.5%, 25% and 100%. The
results confirmed that the use of water containing lightweight aggregates affect the
early volume changes drastically.
2.2 Drying shrinkage
2.2.1 Introduction
Drying shrinkage occurs when the surface of concrete is exposed to an environment
with a low RH. Because of inequilibrium between the RH of the concrete and the
environment, the water within the pores of the concrete evaporates. As a result, the
Chapter 2 Literature Review
14
concrete shrinks. However, the change in the volume of the drying concrete is not
equal to the volume of water removed. This may be attributed to the fact that the loss
of free water, which takes place first, causes little or no shrinkage.
Drying shrinkage has a significant effect on crack development of restrained concrete
members and will cause problems such as loss of pre-stress. For normal strength
concrete, numerous studies have been conducted and code expressions are available to
predict the drying shrinkage. However, very little information is available concerning
the drying shrinkage of high strength concretes. As pointed out earlier, high strength
concrete is subject to self-desiccation, with autogenous shrinkage and drying shrinkage
occurring simultaneously. Unfortunately, most results reported in literature are
performed on drying specimens without sealed companions for comparison. This
makes the separation between the autogenous shrinkage and drying shrinkage
impossible.
2.2.2 Definition
Drying shrinkage of concrete is shrinkage that occurs when hardened concrete is
exposed to an environment which promotes the evaporation of moisture from the
concrete.
2.2.3 Mechanism of drying shrinkage
2.2.3.1 Capillary tension
Within the range of RH from 40 to 100%, capillary tension plays a dominant role in
the drying shrinkage of concrete.

Chapter 2 Literature Review
15
When concrete is subjected to drying, menisci are formed in the capillary pores of the
cement paste matrix which bring about tensile stresses in the capillary water. To
balance the tensile stresses, compressive stresses are generated in the surrounding solid.
As a result, the formation of a meniscus on drying subjects the cement paste matrix to
compressive stress which in turn causes a volume reduction in the cement paste (Lim,
2001). Fig. 2.6 illustrates the mechanism of capillary tension theory. It was considered
that the properties of pores such as pore size distribution and pore volume govern the
stress due to capillary tension in the concrete (Lim, 2001).
2.2.3.2 Surface tension
It has been suggested that the surface tension mechanism is only operative when the
RH is less than 40% (Wittmann, 1968).
It is well known that a drop of liquid is under hydrostatic pressure because of its
surface tension. Fig. 2.7 shows the formation of surface tension. As a result, a solid
particle is subjected to a mean pressure given by:
Ps =3
2rS (2.2)
Where: Ps = surface pressure (N/m2)
r = surface energy (J/m2)
S = specific surface area of the solid (m2/g)
For C-S-H particles, the specific surface is relatively large. Thus the solid particle is
subjected to a large surface pressure. Changes in the surface tension and induced

Chapter 2 Literature Review
16
stresses are brought about by the changes in the amount of water adsorbed on the
surface of material, i.e. on the surface of the gel particles. However, it should be
pointed out that the surface tension is affected only by physically adsorbed water. As a
result, this mechanism works only at low humidity where variation in water content of
the paste are mainly due to differences in the amount of physically adsorbed water. If
the humidity is higher (above 40%), some of the water in the cement paste such as
capillary water is outside the range of surface forces and a change in the amount of so-
called free water does not affect the surface tension (Lim, 2001).
2.2.4 Effect of mix proportion
As far as shrinkage of the hydrated cement paste is concerned, drying shrinkage is
higher with a higher w/b ratio. The w/b ratio determines the amount of evaporable
water in the cement paste and the rate at which water can move towards the surface of
the specimen. Brooks (1989) showed that the shrinkage of hydrated cement paste is
directly proportional to the w/b ratio in the range of about 0.2 and 0.6. At higher w/b
ratios, the additional water is removed upon drying without resulting in shrinkage
(Neville, 1995).
The aggregate content is also an important factor because aggregate does not shrink
and it restrains the shrinkage of cement paste. Drying shrinkage is also affected by the
elastic modulus of the aggregate which determines the degree of restraint. The size and
grading of aggregate, however, do not influence the magnitude of drying shrinkage.
The properties of cement have little influence on the drying shrinkage of concrete, and
Swayze (1960) showed that higher shrinkage of cement paste does not necessarily

Chapter 2 Literature Review
17
mean higher shrinkage of concrete made with the given cement. The entrained air was
found to have little effect on the drying shrinkage (Keene, 1960).
2.2.5 Effect of silica fume
According to Luther and Hansen (1989), the drying shrinkage of high strength
concrete with SF is either equal to or somewhat less than that of concrete without SF.
This is based on the results of five high strength concrete mixes which were monitored
for 400 days. Their study also indicated the importance of continued water curing for
pozzolanic reaction. However, Al-Sugair (1995) reported that SF increases the drying
shrinkage of both normal strength and high strength concrete.
Luther and Hansen (1989) attributed the lower drying shrinkage of SF modified
concrete to its pozzolanic property and filler effect. As mentioned before, SF will
refine the pore structure of concrete, increase the surface tension and result in higher
autogenous shrinkage. Refined pore structure also leads to a very low gas-permeability.
Thus, the drying kinetics is expected to be low. Silica fume will also consume capillary
water through pozzolanic reaction, thus making less water available for evaporation
through drying.
However, for the same amount of water loss, SF concrete undergoes higher drying
shrinkage compared with control concrete (Luther and Hansen, 1989). This is the same
as the autogenous shrinkage and can also be explained by the higher capillary tension
resulting from the finer pore structure in SF concrete.

Chapter 2 Literature Review
18
2.2.6 Effect of environment
Relative humidity greatly affects the magnitude of drying shrinkage; the rate of drying
shrinkage is lower at higher values of RH. Shrinkage tends to stabilize at low
temperature.
2.3 Relationship between autogenous and drying
shrinkage
The causes of autogenous shrinkage are the same as those of drying shrinkage because
both invoke the same physical phenomenon that develops within the concrete: the
creation of menisci within the capillary system and the resulting tensile stress induced
(Aitcin, 1999). The driving force for drying shrinkage, on the other hand, is the
evaporation of water from the capillary network in the concrete at the menisci which
are exposed to air with a RH lower than that within the capillary pores. Factors
influencing the magnitude of the loss of water are the porosity of the concrete, the size
and shape of the pores and their continuity, temperature, RH of the environment, age
of concrete when it is first exposed to a dry environment, and the size of the concrete
element.
Drying shrinkage starts to develop slowly at the surface when hardened concrete is
exposed to a drying environment (which is usually a matter of days rather than hours).
The development of autogenous shrinkage, however, is linked directly to cement
hydration, and starts to develop uniformly and isotropically in a matter of hours after
casting of concrete (almost always before 24 hours).

Chapter 2 Literature Review
19
When concrete is subjected to a drying condition after curing, drying shrinkage occurs
simultaneously with autogenous shrinkage (JCI, 1996). In a study carried out at the
Technical Research Center of Finland using 0.27m×0.27m×0.1m test specimens,
autogenous deformations were found to be a significant contributor to the total
concrete shrinkage measured during the early and later ages (Holt and Leivo, 1999).
Early shrinkage can cause the transition zone at the aggregate to paste interface to be
much weaker. This contributes to the later age drying shrinkage, with deformations in
the same direction as the very early age autogenous shrinkage. In an investigation to
measure drying shrinkage of a normal strength concrete (w/b ratio=0.57) and several
high strength concrete (w/b ratio=0.22, 0.25, and 0.28) containing 10% SF by weight
of cement, one year drying shrinkage of the normal strength concrete was about 50%
higher than that of the high strength concrete. De Larrad (1999) believes that the
drying shrinkage observed in high strength concrete is low due to the very low water
content which is responsible for an increase in the autogenous shrinkage and a
corresponding reduction in the drying shrinkage.
Chapter 2 Literature Review
20
Lack of
water from outside
environment
Self-desiccation
Hydration reaction of
cement paste
Absolute volume decrease
Skeleton of microstructure
formation
Capillary tension of pore water increase
Autogeneous shrinkage occurrence
Fine pores formation in
microstructure
Decrease of RH in fine
pores
Figure 2.1 Causes of autogenous shrinkage

Chapter 2 Literature Review
21
Figure 2.2 Original VTT measuring method, with gauges imbedded from base (Holt and Leivo 1999)
Figure 2.3Adaptation of VTT measuring method, with laser and position sensing device (Holt and Leivo 1999)
Chapter 2 Literature Review
22
Figure 2.4 Outline of the shrinkage measurement device by Morioka (a): over view, (b): side view. (Morioka et al, 1999)
Figure 2.5 Dilatometer measuring the autogenous shrinkage of cement paste (Jenson and Hansen, 1995)

Chapter 2 Literature Review
23
Figure 2.6 Schematic diagram of capillary tension mechanism (Mindess et al, 2003)
Figure 2.7 Schematic diagram of surface tension mechanism for causing drying
shrinkage of cement paste (Mindess et al, 2003)

Chapter 3 Experimental Procedure
24
Chapter 3
EXPERIMENTAL PROCEDURE
3.1 Introduction
The experimental work carried out in this study was summarized in this chapter. It
included mix proportions, materials, mixing procedures, specimen preparation, curing,
and test methods.
The purposes of the experiments were to study:
• Effect of w/b ratio, SF content, and type of coarse aggregate on the autogenous
and drying shrinkage of concrete;
• Effect of curing temperature on the autogenous and drying shrinkage
development;
• Relationship between the internal RH and the shrinkage of concrete; and
• Effect of pore structure of cement paste on the autogenous and drying
shrinkage of concrete.
Sixteen concrete mixes were prepared, and the following properties of concrete were
determined: setting time of fresh concrete, compressive strength, dynamic and static

Chapter 3 Experimental Procedure
25
modulus of elasticity, autogenous shrinkage, total shrinkage, internal RH of concrete
and pore structure of cement paste.
3.2 Mix proportions
Table 3.1 presents the mix proportions of normal weight and lightweight concrete used
in this study. To study the effect of w/b ratio on the autogenous and drying shrinkage
of concrete, the w/b ratio was set at 0.25, 0.35, and 0.45. Four SF replacement levels of
0, 5, 10, and 15% by mass of the total binder were used to study the effect of SF
content. The volume of the coarse aggregate was kept constant for all the concrete
mixtures to maintain a constant effect of restraint by the aggregate. Four concrete
mixtures were made with lightweight aggregate to compare with those with normal
weight aggregates. To study the effect of water absorption of the lightweight aggregate
on autogenous shrinkage, two pre-immersion times of 0.5 and 24 hours were used.
3.3 Materials
3.3.1 Cement
Ordinary Portland Cement (OPC) complying with the requirements of BS 12:1991 and
ASTM C 150 was used in this study. Blaine fineness of the cement was 3500 cm2/g
and specific gravity was 3.15 g /cm3. The chemical composition and physical
properties of the cement are given in Table 3.2.

Chapter 3 Experimental Procedure
26
3.3.2 Water
Tap water was used for all the concrete mixtures.
3.3.3 Silica fume
Undensified SF was used, and the amount retained on 45 µm sieve was 1.8 % with a
specific gravity of 2.28. The characteristics of the SF are given also in Table 3.2.
3.3.4 Fine aggregate
Fine aggregate used in this study was natural sand. Its specific gravity and fineness
modulus were 2.6 and 3.0, respectively. The grading of the fine aggregate is given in
Table 3.3.
3.3.5 Coarse aggregate
Normal weight aggregate The normal weight coarse aggregate used in this study was
crushed granite with a maximum nominal size of 10 mm and a specific gravity of 2.58.
The aggregates met the requirements of BS 882: 1992 and ASTM C 33. The results of
sieve analysis of the aggregates are given in Table 3.3.
Lightweight aggregate The lightweight aggregate used in the study was expand clay*.
Its average oven-dry particle density was 1.35 g/cm3. The aggregate size ranged from
4 to 8 mm. The initial moisture content of the aggregate was 11.1 %. When submerged
* Liapor F6.5, from Liapor company, Germany

Chapter 3 Experimental Procedure
27
in water, the water absorption values tested in the first 0.5 hour and 24 hours were
3.6% and 4.3%, respectively. The lightweight aggregate complied with the
requirements of BS 3797: 1990 and ASTM C 330.
3.3.6 Superplasticizer
A synthetic naphthalene based superplasticizer** was used for the purposes of
workability and dispersion of SF. Its specific gravity was 1.21 and the solid content
was 40 %. In this study, the superplasticizer was used with dosages of 1.1 to 2.6 % by
weight of cement to control the slump of concrete mixes in the range of 25 to 75 mm.
This superplasticizer complied with the requirements of BS 5075: Part 3: 1985 and
ASTM C494.
3.4 Mixing procedures
The ingredients of concrete were mixed in a pan mixer. Before mixing, the internal
surface and blades of the mixer were moistened to avoid the loss of mixing water.
Cement, SF, and sand were pre-mixed for 2 minutes. The crushed granite or wet
lightweight aggregates were then added and mixed for 1 to 2 minutes. Water and the
superplasticizer were added at last and mixed for another 3 to 4 minutes. Immediately
after the concrete mixing, slump and unit weight of the fresh concrete were determined.
After these tests, the fresh concrete was placed into the steel moulds in two layers and
compacted on a vibration table.
** Derex Super 20, from W.R.Grace

Chapter 3 Experimental Procedure
28
3.5 Preparation of specimens
Due to the volume limitation of the pan mixer, two batches of concrete were prepared
for each mixture. One batch was used to make specimens for determining the
compressive strength and modulus of elasticity. The other batch was used to make
specimens for the measurement of the autogenous shrinkage, total shrinkage, internal
RH, and 28 day compressive strength (to compare with the first batch) of the concrete.
Three cubes of 100x100x100 mm were used for the compressive strength test at each
age of 7, 28, and 91 days. Two prisms of 100 x 100 x 400 mm were used for
determining the dynamic modulus of elasticity, and two cylinders of Ø100 x 200 mm
were used for the static elastic modulus test. Prisms of 100 x 100 x 500 mm were used
for determining the autogenous shrinkage and total shrinkage (2 for each test). The
internal RH of the concrete was measured using the same prisms as those for the
autogenous and total shrinkage measurements.
3.6 Curing
The concrete specimens in the moulds were covered with wet burlap and plastic
sheeting for the first 24 hours. The specimens were then demoulded and placed under
different curing environments according to the experimental plan (Table 3.4). Curing
conditions for the specimens for conducting compressive strength, dynamic and static
modulus of elasticity tests were by sealing with aluminum tape, cured in water, and
stored in air (65% RH). The specimens for the autogenous shrinkage measurement
were sealed with aluminum tape and the specimens for total shrinkage measurement

Chapter 3 Experimental Procedure
29
were air dried (65% RH) after demoulding. The specimens subjected to each curing
condition were stored at two different temperatures, viz. 20 and 30 0C.
3.7 Test methods
3.7.1 Slump
Slump test is used to evaluate the workability of fresh concrete. In this study, the
slump of all the concrete mixtures was controlled between 25 and 75mm. The slump
test was carried out in accordance with BS1881: Part 102: 1983.
3.7.2 Setting time
Setting times of concrete were determined according to ASTM C403-95. The fresh
concrete was sieved with a 4.75-mm sieve to remove the coarse aggregates. The mortar
was then mixed thoroughly and placed into a 150-mm cube mould. A penetrometer
(Fig. 3.1) was used to measure the force required to penetrate a needle into the mortar.
3.7.3 Compressive strength
The compressive strength was determined at 7, 28, and 91 days in accordance with BS
1881: Part 116: 1983. Three cubes were used for the test at each age. The compressive
load was applied at a rate of 200 kN/min until the collapse of the specimen.
3.7.4 Static modulus of elasticity
The cylinder specimens of Ø100x200 mm were used for the static modulus of
elasticity tests in accordance with BS 1881: Part 121: 1983. Secant moduli with

Chapter 3 Experimental Procedure
30
minimum and maximum stress at 0.5 Mpa and 33% of the ultimate strength were
measured and calculated automatically by an Instron machine with a capacity of 500
kN (Fig. 3.2). The compressive load was measured by a 500 kN load cell, and the
deformation was measured by 4 linear variable differential transducers (LVDT)
parallel to the loading axis and centered at mid-height of the cylinder. The load was
applied at a constant rate of 1.25 mm/min.
3.7.5 Dynamic modulus of elasticity
Two prisms of 100x100x400 mm were used for the determination of the dynamic
modulus of elasticity in accordance with BS 1881: Part 209: 1990. It was used to
determine the progressive changes in mechanical properties of the concrete. In this
study, the Erudite Resonant Frequency Tester (Fig. 3.3) was used to measure the
frequency (F) by applying longitudinal vibrations on to the prisms. The dynamic
modulus of elasticity was then calculated as follows:
Ed = 4x10-12F2L2D (3.1)
Where:
Ed - Dynamic modulus of elasticity (MPa)
F - Frequency (Hz)
L - Length of the specimen (mm)
D - Density of the specimen (kg/m3)

Chapter 3 Experimental Procedure
31
3.7.6 Autogenous shrinkage
3.7.6.1 Autogenous shrinkage (First 24 hours)
In the first day after casting, the shrinkage of concrete was measured by a pair of laser
sensors* with the concrete specimen in a special mould. The laser sensors allow the
measurement of autogenous shrinkage of concrete at a very early age before
demoulding.
Fig. 3.4 shows the setup for the autogenous shrinkage measurement. The laser sensors
were fixed on a steel plate, and the distance between the two sensors was 600 mm. The
position of the sensors was approximately 50 mm from the targets. The measuring
range of the laser sensors was 50 ± 10 mm, and its resolution was about 5 µm. The
resolution of the shrinkage measurement was thus about 10 µm (two sensors), which
was approximately 0.002% of the length of the specimen.
The size of the steel mould was 100x100x500 mm. Each end plate had a 10-mm hole
in the center so that the laser beam can directly hit on the target surface. To reduce the
friction between the concrete and the walls of the mould, the internal surfaces of the
mould were lined with one-mm thick Teflon sheet except for the two end surfaces. A
3-mm thick aluminum plate (Fig. 3.5) was cast at each end of the specimen as target
surface.
* ANR 1150, Matsushita Electric Works, Japan

Chapter 3 Experimental Procedure
32
After the specimen was made, the top concrete surface was sealed with aluminum
sheeting to prevent moisture loss. The moulded specimen was then put on the steel
plate and adjusted until the laser beams landed on the target surface through the holes.
Temperature monitoring is very important in order to calculate the early age
autogenous shrinkage accurately. During the first day, both the autogenous shrinkage
strain and the thermal expansion strain due to the heat of cement hydration were
simultaneously generated. The thermal expansion strain should be subtracted from the
measured strain in order to obtain the autogenous shrinkage.
In this study, a thermal expansion coefficient of 10x10-6 /0C was used to calculate the
thermal expansion strain of the concrete (Tazawa, 1998). Temperature change of the
concrete specimen with time was monitored by a thermocouple embedded in the center
of the concrete specimen. The measuring range of the thermocouple was 20-100 0C.
The temperature of concrete measured with a thermometer right after concrete mixing
was used as a reference.
Signals from the laser sensors and thermocouple wires were recorded by a data logger
and processed, thus the autogenous shrinkage and the temperature change of each
concrete specimen can be determined at the same time.
Initial setting time was used as a starting point of the autogenous shrinkage.
Subsequent measurements were carried out at one-hour intervals up to 24 hours after
the initial setting time.

Chapter 3 Experimental Procedure
33
Calculation of the autogenous shrinkage strain, temperature change, and correction
arising from thermal expansion strain was carried out as follows:
∆T = measured temperature - reference temperature (3.2)
Thermal expansion strain = ∆T x thermal expansion coefficient (3.3)
Autogenous shrinkage = measured shrinkage – thermal expansion (3.4)
3.7.6.2 Autogenous shrinkage (after 24 hours)
The autogenous shrinkage of concrete after 24 hours was determined using Demec
gauges. After demoulding at 24 hours, two Demec pins, 200 mm apart, were glued
using epoxy along the center line, 150 mm from each end on each of the longitudinal
side mould face of the specimen. The specimens were sealed with aluminum tape in
order to prevent moisture loss. A mechanical Demec gauge* (Fig. 3.6) with a
resolution of 10 microstrains was used to measure the distance between the 2 pins. The
initial distance was used as a reference, and subsequent measurements were carried out
once a day during the first week, once a week between 7 and 90 days, and once a
month between 90 and 240 days. The autogenous shrinkage reported included the
shrinkage within the first 24 hours and that measured after 24 hours. The temperature
change and thermal strain after 24 hours were found to be negligible.
* Meyers Instruments, UK

Chapter 3 Experimental Procedure
34
3.7.7 Drying shrinkage
When an unsealed specimen is subjected to drying, the drying shrinkage occurs
simultaneously with the autogeneous shrinkage. The drying shrinkage of the concrete
can thus be calculated by subtracting the autogenous shrinkage from the total
shrinkage of the specimen (Eq. (3.5)).
(3.5) ’ع∆ - ع∆ = dع∆
Where
;total shrinkage of unsealed specimen ---- ع∆
.d---- drying shrinkage of specimenع∆
;autogeneous shrinkage of specimen---- ’ع∆
The total shrinkage was measured similar to the autogenous shrinkage after 24 hours.
After being demoulded at 24 hours, the specimens were stored in a humidity-controlled
room (RH=65%). The Demec gauge was used to measure the distance between the two
pins glued on the longitudinal side mould face of the specimen. The total shrinkages
were also measured once a day during the first week, once a week between 7 and 90
days, and once a month between 90 and 240 days.
3.7.8 Relative Humidity
The internal RH change of sealed concrete specimen (100x100x500 mm) was
measured using a RH probe (Fig. 3.7). Fig. 3.8 illustrates the measuring device and
concrete specimen for the measurement. The diameter of the RH probe is about 12 mm.

Chapter 3 Experimental Procedure
35
Sensitivity of humidity sensor is 0.1% and 2 sealed specimens were measured at 20
and 30 0C.
During casting, a plastic tube with a diameter slightly bigger than that of the humidity
probe was placed in the concrete. The opening of the plastic tube was sealed with
aluminum tape. The intersection of the plastic tube and concrete surface was carefully
sealed by silica gel to ensure a good seal. The RH was measured everyday during the
first week and once a week thereafter.
3.7.9 Pore Structure of Cement Paste
Pore structure of the cement paste was determined by mercury intrusion porosimetry
(MIP). Mercury was forced into the pore system of the sample by the application of
external pressure, and the relationship between the pore size and the pressure exerted is
expressed by the Washburn equation (Diamond, 1998):
p
r )cos(2 θγ−= (3.6)
Where: r - Pore radius (nm)
γ - Surface tension of mercury (N/m)
θ - Contact angle (0)
p - Pressure exerted (N/m2)

Chapter 3 Experimental Procedure
36
A porosimeter* (Fig. 3.9) was used to determine the pore size distribution of the
cement paste sample. In this study, a maximum pressure of 350 MPa was applied. A
contact angle of 141.30 and a surface tension of 0.48 N/m (Diamond, 1998) was used
for calculation. Pore structural parameters such as the pore size distribution, total
porosity, mean pore radius, and critical pore size can be obtained for analyses.
Cement paste was prepared using the same w/b ratio as that of the concrete. All pastes
were sealed and cured at 20 and 30 0C. To make paste homogenous, specimen were
carefully transferred to molds with minimized vibration and no obvious bleeding or
segregation were observed. After 1 and 28 days, samples were taken from the center of
the sealed cement pastes. The samples were immersed in acetone, and oven-dried at
100 0C to a constant weight. The samples were then kept in vacuum desiccators until
testing.
* Carlo Erba Porosimeter 4000, Italy
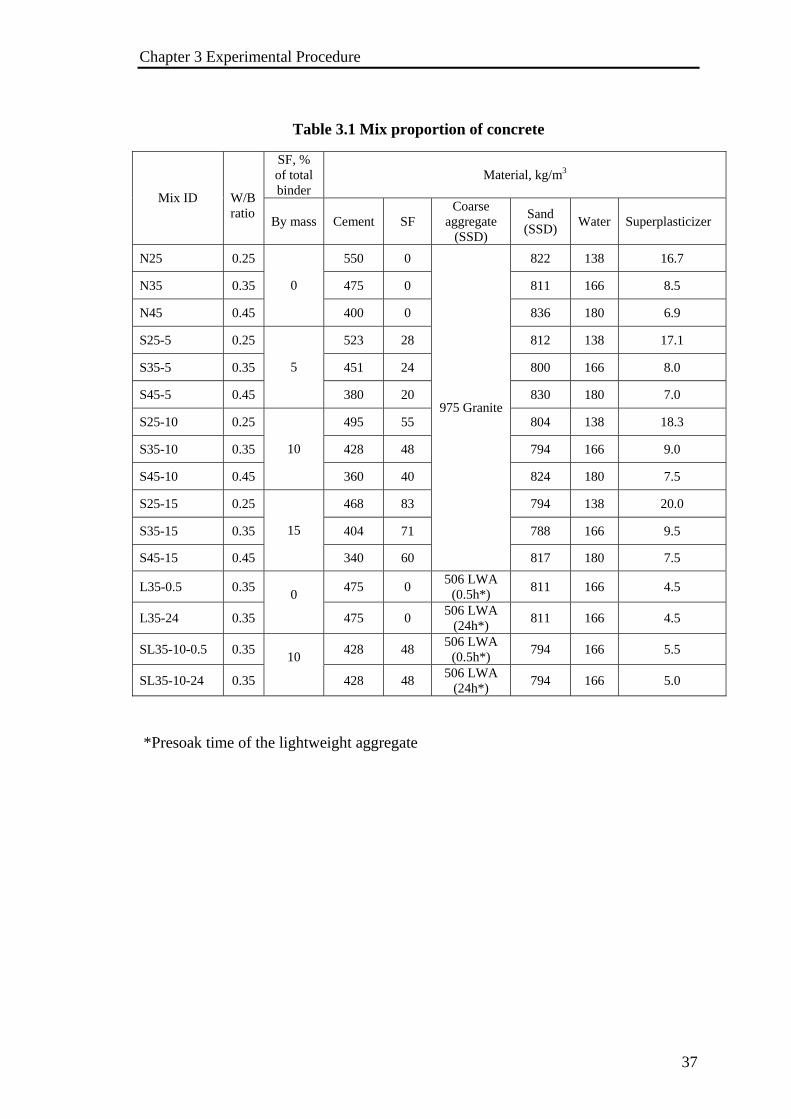
Chapter 3 Experimental Procedure
37
Table 3.1 Mix proportion of concrete
*Presoak time of the lightweight aggregate
SF, % of total binder
Material, kg/m3
Mix ID W/B ratio
By mass
Cement SF Coarse
aggregate (SSD)
Sand (SSD) Water Superplasticizer
N25 0.25 550 0 822 138 16.7
N35 0.35 475 0 811 166 8.5
N45 0.45
0
400 0 836 180 6.9
S25-5 0.25 523 28 812 138 17.1
S35-5 0.35 451 24 800 166 8.0
S45-5 0.45
5
380 20 830 180 7.0
S25-10 0.25 495 55 804 138 18.3
S35-10 0.35 428 48 794 166 9.0
S45-10 0.45
10
360 40 824 180 7.5
S25-15 0.25 468 83 794 138 20.0
S35-15 0.35 404 71 788 166 9.5
S45-15 0.45
15
340 60
975 Granite
817 180 7.5
L35-0.5 0.35 475 0 506 LWA (0.5h*) 811 166 4.5
L35-24 0.35
0 475 0 506 LWA
(24h*) 811 166 4.5
SL35-10-0.5 0.35 428 48 506 LWA (0.5h*) 794 166 5.5
SL35-10-24 0.35
10 428 48 506 LWA
(24h*) 794 166 5.0

Chapter 3 Experimental Procedure
38
Table 3.2 Characteristics of the cement and SF
Table 3.3 Sieve analyses of coarse and fine aggregate
Cement SF
CaO 64.0 0.9
SiO2 21.1 93.6
Al2O3 4.9 0.5
Fe2 O3 3.0 1.5
SO3 2.1 0.3
MgO 1.6 0.6
K2O 0.8 0.5
Na2O 0.2 <0.1
LOI 2.1 2.0
Chemical Composition, %
f-CaO 1.0 ---
C3S 57 ---
C2S 18 ---
C3A 8 --- Bogue calculation of
cement minerals
C4AF 9 ---
Blain Fineness, cm2/g 3500 --- Amount retained on 45 µm sieve, % --- 1.8
Specific gravity 3.15 2.28
Percent retained Sieve (mm)
Coarse aggregate Fine aggregate
9.50 1.0 0 4.75 91.0 2.0 2.36 97.8 12.0 1.18 98.2 35.0 0.60 - 65.0 0.30 - 91.0
0.15 - 99.0
Fineness modulus - 3.0

Chapter 3 Experimental Procedure
39
Table 3.4 Curing conditions of specimen
Compressive strength (100 mm cube) MPa
Ed (specimen 100×100×400 mm) GPa
Es (100×200 Cylinder) GPa
RH %
Total shrinkage (specimen 100×100×500 mm) microstrain
Autogenous shrinkage (specimen 100×100×500 mm) microstrain
Curing condition
7, 28, 91d 1 to 28 d 28d
0 to
240 d
0 to 240 d 0 to 240 d
30 ºC * * * * * *
Sealed 20 ºC * * * * * *
30 ºC * * * * * *
Air Drying(RH=65%) after 7 d curing
20 ºC * * * * * *
30 ºC * * * * NA NA Cured in
water 20
ºC * * * * NA NA

Chapter 3 Experimental Procedure
40
Figure 3.1 Penetrometer for setting time determination
Figure 3.2 Machine for modulus of Elasticity test

Chapter 3 Experimental Procedure
41
Figure 3.3 Erudite Resonant Frequency Tester for dynamic Young’s modulus
laser sensor
concretealuminum plate
Teflon
Figure 3.4 Setup of the steel plate and mold for autogenous shrinkage
measurement

Chapter 3 Experimental Procedure
42
Figure 3.5 Aluminum plate cast at each end of the specimen as target surface
Figure 3.6 Mechanical Demec gauge for later age autogenous and total shrinkage measurements
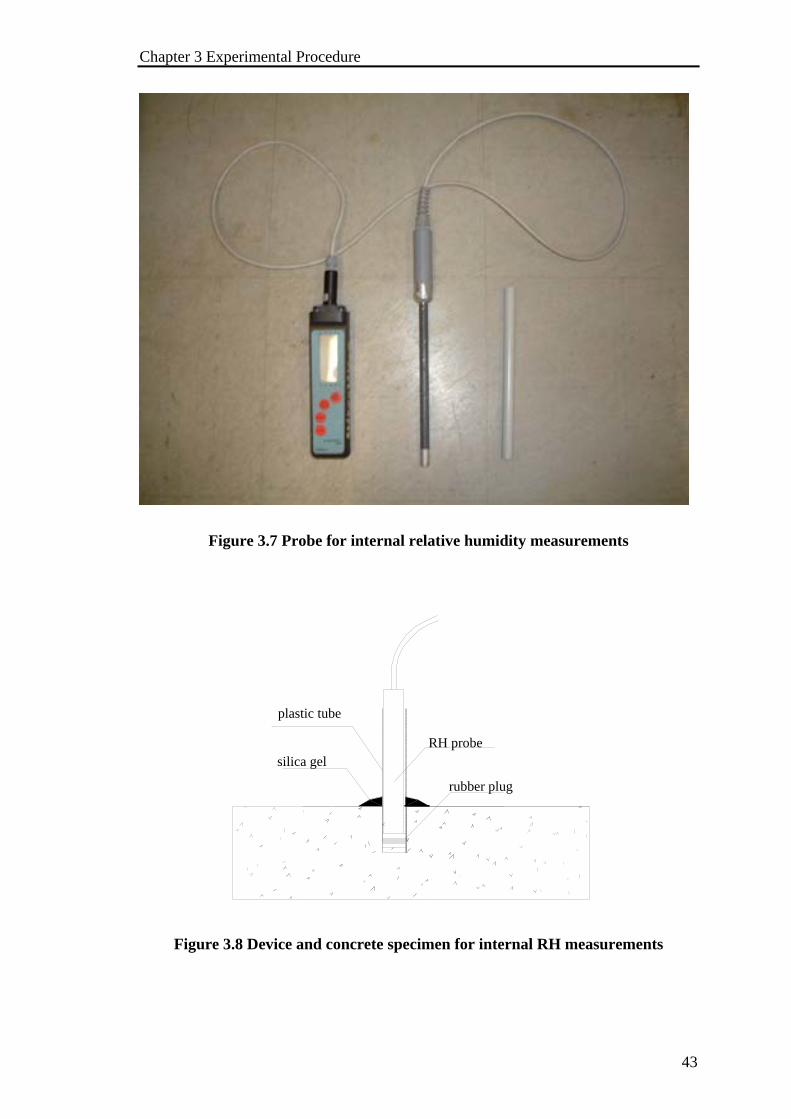
Chapter 3 Experimental Procedure
43
Figure 3.7 Probe for internal relative humidity measurements
RH probe
rubber plug
plastic tube
silica gel
Figure 3.8 Device and concrete specimen for internal RH measurements

Chapter 3 Experimental Procedure
44
Figure 3.9 Porosimeter 4000 for pore size distribution of the cement pastes
Chapter 4 Results and discussion
45
Chapter 4
RESULTS AND DISCUSSION
4.1 Compressive strength
Testing for compressive strength was carried out according to BS 1881: Part 116: 1983
and ASTM C39 as discussed in Section 3.7.3. Table 4.1 shows the results obtained for
all the concrete mixes.
The 7-day compressive strengths ranged from 43.9 to 111.5 MPa. The 28-day
compressive strengths ranged from 48.9 to 131.8 MPa. The 91-day compressive
strengths ranged from 50.5 to 131.8 MPa. The strength data is reasonable and within the
expected ranges. As can be expected, the compressive strengths were affected
significantly by w/c ratio, SF content, and aggregate type. Curing conditions including
temperature and humidity also affected the compressive strength, but not as significant
as w/c ratio, SF content, and aggregate type.

Chapter 4 Results and discussion
46
4.2 Dynamic and static Young’s modulus
The dynamic and static Young’s modulus of the concrete are listed from Tables 4.2 to
4.17. As can be predicted, the effects of various factors such as w/b ratio, SF content,
temperature, and aggregate type affected Young’s Modulus in the same way as the
compressive strength. Effects of other factors such as curing temperature and moisture
conditions were not significant. The measured dynamic moduli were as expected higher
than the static ones because dynamic moduli were measured by nondestructive method
and the values are roughly equal to the slope of the initial tangential line of the
respective stress-strain curve.
Because the focus of this study is on deformation characteristics, effects of various
factors on the mechanical properties will not be elaborated in great detail. However, in
section 4.8, estimation of the risk of shrinkage cracking of restrained concrete, strength
data and Young’s modulus will be discussed together with the shrinkage data obtained.
4.3 Pore structure
Details of the pore structure of the cement pastes such as porosity, average pore radius
and pore size distribution are presented in this section.
Theoretically, concrete samples should be used to conduct the MIP test since the
shrinkage measurements were taken on concrete specimen. However, the presence of
randomly located aggregate particles and the limitation placed on the sample size that
may be used on the MIP equipment is expected to seriously affect the results. Therefore

Chapter 4 Results and discussion
47
all the MIP tests were carried out on cement paste samples. The mix proportions of
cement pastes used in the MIP tests were the same as those of the corresponding
concrete mixes except for the absence of aggregates.
Pore size can be classified according to the system by International Union of Pure and
Applied Chemistry (IUPAC) described in Table 4.18 (IUPAC 1972). The capillary
pores comprise both the mesopores and macropores and constitute the unfilled space
between the original cement grains, whereas the micropores constitute part of the
calcium silicate hydrate gel component. Shrinkage under practical conditions depends
on the loss of water from the mesopores and also the size of the macropores, which
determines how easily water may be lost from the mesopores (Young, 1988). The
summary of the pores characteristics were obtained shown in Table 4.19 and 4.20.
4.3.1 Effect of w/b ratio
The effect of w/b ratio on the pore structure of the cement pastes at 1 day and 28 days
are shown in Figs. 4.1 to 4.4. There is a clear trend that a reduction in w/b ratio resulted
in reduced porosity and finer pore diameter regardless of SF content. From Fig. 4.1, it
may be seen that for pastes without SF, the reduction in w/c ratio from 0.35 to 0.25
resulted in reduced total porosity. However, the pores with radius more than 200 Å were
similar. Compared with the control paste, SF modified paste with lower w/b ratio
showed reduced pore volume for the whole range of pore sizes (Fig. 4.2).
The trend that lower w/b ratio pastes had lower total porosity remained the same from
the first 24 hours of hydration to 28 days. However, the effect of w/b ratio became less
pronounced after 28 days especially for the SF modified pastes.

Chapter 4 Results and discussion
48
4.3.2 Effect of silica fume
The effect of SF on the relative and cumulative pore volumes of the cement pastes with
different w/b ratios of 0.25, 0.35 and 0.45 at 1 and 28 days are shown in Figs. 4.5-4.16
as well as in Tables 4.19 and 4.20.
From the 1-day results it was found that for the cement paste with a w/b ratio of 0.25,
the incorporation of SF decreased both the peak diameter of pores (Figs. 4.5) and the
cumulative pore volume (Fig. 4.6). For the cement paste of a w/b ratio of 0.35, the
incorporation of SF decreased the cumulative pore volume (Fig. 4.10), but the peak
diameter did not change much (Fig. 4.9). For the cement paste with a w/b ratio of 0.45,
the incorporation of SF reduced the peak diameter of pores present in the paste from
400 Å to 100 Å (Fig. 4.13). However, the total pore volume of the SF paste was higher
than that of the control one (Fig. 4.14). This may due to some unexpected experimental
errors such as pore water in control samples did not fully escape before testing.
Considering that the increased porosity of the SF modified pastes is mainly due to an
increase in amount of fine pores (Fig. 4.14), another possible reason would be the
increase in C-S-H content which corresponds to a higher amount of gel pores.
At 28 days, the incorporation of SF reduced the total pore volume for all the cement
paste samples with different w/b ratios (Table 4.20). However, compared with the
results at 1 day, the effect of SF on the pore structure at 28 days was not significant.
Also, the peak pore diameter and magnitude of peaks (Figs. 4.7, 4.11, and 4.15) were
not affected substantially by the incorporation of SF, which is quite different from the
results at 1 day. This is because at a very early age the hydration process had just began

Chapter 4 Results and discussion
49
and higher porosity was expected. Thus the effect of SF was significant due to its finer
particle size and filler effect which will refine the pore structure and decrease pore
volume very quickly. At later ages, more and more hydration products produced by
continued cement hydration may be expected to fill the capillary pores and the effect of
SF becomes less significant than at 1 day.
4.3.3 Effect of temperature
Figures 4.17 - 4.24 illustrate the effect of temperature on the pore structure of the
cement pastes at a w/b ratio of 0.35 with or without SF at 1 and 28 days. No significant
difference in the pore structure was observed between the cement pastes cured at 20 and
30 0C, especially for the pastes cured for 28 days.
4.4 Relative humidity
As discussed in Section 3.7.8, the RH of the concrete specimens was measured using
the relative humidity probe (Fig. 3.7). Measurements were taken once a day during the
first week, once a week from 7-91 days, and once a month from 91 days to 240 days.
The main purpose of the RH measurements was to monitor the development of self-
desiccation and explore the relationship between RH and autogenous shrinkage.
4.4.1 Effect of water-to-binder ratio
The effects of w/b ratio on the RH of the concrete specimen with SF replacement levels
from 0 to 15% are illustrated in Figs. 4.25 to 4.28. Clear trend can be found which
indicate that the internal RH of lower w/b ratio concretes showed lower RH values.

Chapter 4 Results and discussion
50
A reduction in the RH occurred mostly during the first 1 or 2 months, and the RH
curves began to level off afterwards. For the concrete with various SF contents at 240
day, the 0.25 w/b ratio concretes showed internal RH values of between 72.3% to
75.4%, the 0.35 w/b ratio concretes showed internal RH values of between 74.3% to
78.8%, and the 0.45 w/b ratio concretes showed internal RH values of between 80.6 to
84.9%
4.4.2 Effect of silica fume
The effects of SF on the internal RH development of the concrete specimen with w/b
ratios of 0.25, 0.35 and 0.45 are shown in Figs. 4.29, 4.30, and 4.31, respectively. It can
be seen that for all the w/b ratios tested, the incorporation of SF reduced the internal RH
values at all ages.
It was also noticed that the effect of SF in reducing internal RH occurred mostly during
the first 3 months. After that, RH values change rather slowly for all SF replacement
levels tested.
4.4.3 Effect of aggregate type
Figures 4.32 and 4.33 show the effect of lightweight aggregate on the internal RH
values. For the same w/b ratio and SF replacement levels, significantly higher RH
values were observed in concrete with presoaked lightweight aggregates.
It is suggested by Takada (1988) that the internal drying of the concrete pores due to
cement hydration generates a driving force by which water is transported from the pores

Chapter 4 Results and discussion
51
of the lightweight aggregate into the partially dried pores of the cement paste matrix.
The mechanism of this transport process may be associated with capillary effect since
the pores in the paste matrix are considerably smaller than those in the lightweight
aggregate, and as a result, capillary suction may take place (Bentur et al, 2001). The
water released from the lightweight aggregate would impede a reduction in the internal
RH.
4.5 Autogenous shrinkage
As mentioned in Chapter 3, the autogenous shrinkage during the first 24 hours after
initial setting was measured by a pair of laser sensors and the shrinkage of hardened
concrete specimens after 24 hours was measured by a Demec gauge.
The autogenous shrinkage of the specimens during the first 24 hours was monitored
upon reaching the initial setting time of the concrete. The initial setting time of the
concrete ranged from 270 to 610 minutes after casting. Table 4.21 summarizes the
initial setting times of all the concrete mixtures. The higher initial setting time for lower
w/c ratio concretes may be due to the higher dosage of superplasticiser which may also
has set-retarding effect.
During the first few hours after casting, the temperature rise in the concrete specimens
due to the heat of cement hydration was recorded in order to separate autogenous
shrinkage from thermal expansion. A reference temperature was recorded after mixing
for all the mixtures, and an average thermal expansion coefficient of 10x10-6 / 0C
(Tazawa and Miyazawa, 1999) was used for the correction of strain values due to the

Chapter 4 Results and discussion
52
temperature rise. The peak temperature rises of the concrete mixtures ranged from 3.5 to
4.5 0C (Table 4.21). The actual temperature used for correcting thermal expansion used
to allow for the surface temperature being less than that measured at the center.
It should be noted that the thermal expansion coefficient used was only an average
value, and it may vary during the hydration process. Tazawa and Miyazawa (1999)
recommended that a test method be established to determine the coefficient of thermal
expansion for concrete at early ages in order to estimate the autogenous shrinkage
accurately. In addition, the temperature was monitored at the center of the specimen
which is probably the hottest part of the entire specimen. As a result, the actual
expansion caused by the temperature rise in the concrete may be less than the values
computed.
The autogenous shrinkage of the concretes after 24 hours was measured by Demec
gauge as described in Section 3.7.7, and the measurements were taken once a week. The
autogenous shrinkage during the first 24 hours is added to those measured by Demac
gauges to present the 240 day autogenous shrinkage data.
4.5.1 Effect of water-to-binder ratio
Figures 4.34-4.37 show the effect of w/b ratio on the autogenous shrinkage of the
concrete during the first 24 hours with SF replacement levels of 0, 5, 10, and 15%,
respectively. The zero point of the x-axis was the initial setting time of the concrete, and
the deformation of the specimens due to thermal effects was subtracted from the
deformation measured by the laser sensors.
Chapter 4 Results and discussion
53
As can be seen from the figures, the autogenous shrinkage during the first 24 hours
increased with a decrease in w/b ratio. This trend has also been observed by others
(Persson, 1997; Tazawa, 1995), and can be attributed to the lower amount of water
available and the finer pore structure of the cement paste.
The degree of self-desiccation in concrete is increased with a decrease in the w/b ratio
as the amount of water available for cement hydration is decreased. Moreover, lower
w/b ratio also makes cement paste denser and its pore structure finer. This was
confirmed by the MIP results. According to the pore size distribution at 1 day presented
in Figures 4.1 - 4.2, the cement paste with lower w/b ratio had a finer pore size structure
and a lower porosity. As discussed in Section 2.1.2.3, the capillary stress is inversely
proportional to the pore size (Eq. 2.1). The refinement of pores will drastically increase
the capillary tension, and suction potential and thus autogenous shrinkage.
The concrete with a w/b ratio of 0.45 showed a slight expansion (about 20 microstrains)
at all the SF replacement levels tested during the first 24 hours. Such expansion was
also reported by others (Davis, 1940; Aitcin, 1999b). The swelling might be attributed
to the formation of large crystals of calcium hydroxide and ettringite needles through
the hydration reactions in porous areas (Baroghel-Bouny and Kheirbek, 2000).
According to them, the growth of these crystals generated a crystallization pressure on
the pore walls, related to the supersaturation rate according to Riecke’s law. This
pressure induced the expansion of the cement paste. In concrete mixtures with high w/c
ratios, large crystals of calcium hydroxide and ettringite needles have enough time,
water, and space to grow in size before the strength of the cement paste matrix and the
self-desiccation process become strong enough to offset the crystallization pressure. On
Chapter 4 Results and discussion
54
the other hand, in cement pastes with low water/cement ratios cement particles are close
to one another, and only a low degree of hydration is necessary to bridge the gap
between the hydrating particles, thus providing sufficient strength and stiffness to
withstand the crystal pressure.
Another explanation for the expansion is the re-absorption of bleeding water in the
concrete with high w/b ratios. Davis (1940) also stated that the normal concrete is likely
to show expansion during the very early age (1 day) because more free water is
available in the pores. The bleeding water is re-absorbed into the concrete due to the
hydration process as water is needed. For concretes with a low w/b ratio, the lower
water content is rapidly used up by early age hydration process, thus no swelling occurs.
In this experimental program, shrinkage was measured of sealed specimens and
bleeding water at the top of the specimens with high a w/b ratio was not removed. This
might have contributed to the expansion of concrete.
Figures 4.38-4.41 show the autogenous shrinkage of concrete with different w/b ratios
for up to eight months. The SF replacement level was kept constant at 0, 5, 10 or 15%.
From the figures it can be clearly seen that the autogenous shrinkage increased with a
reduction in w/b ratio. This trend was the same for concretes with the various SF
contents tested.
As explained for the 1 day autogenous shrinkage, the higher 240 day autogenous
shrinkage of concrete with a lower w/b ratio may also be explained by the lower water
content and finer pore structure. As the w/b ratio of concrete decreases, the porosity and
average pore size of the cement paste matrix are also reduced. The pore structure of the

Chapter 4 Results and discussion
55
cement pastes without SF at 28 days was shown in Figs. 4.3 and 4.4. As expected, the
cement paste with a lower w/b ratio showed finer pore size distribution and lower
porosity. According to the Kelvin equation, for a given degree of self-desiccation, the
capillary tension generated in the cement paste matrix with a finer pore size is greater.
Furthermore, as the w/b ratio decreases, the self-desiccation is increased. The
development of the internal relative humidity (Figs. 4.25 to 4.28) is a good indicator of
the degree of self-desiccation. As discussed previously, the results show that the lower
the w/b ratio, the lower the internal relative humidity. From both theoretical analysis
and experimental data, it can be concluded that the autogenous shrinkage of concrete
with a lower w/b ratio is caused by an increased degree of self-desiccation and more
refined pore structure.
At lower w/b ratio, a higher proportion of the total autogenous shrinkage after 240 days
occurred during the first 28 days. The ratios of the 28-day to 240-day autogenous
shrinkage for concretes with different w/b ratios and SF contents were shown in Fig.
4.42. The 28-day autogenous shrinkage of the control concretes with w/b ratios of 0.45,
0.35, and 0.25 were 34, 52, and 68% of their respective 240-day autogenous shrinkage
values. This trend was similar for concrete with SF. This phenomenon may be
attributed to the hindered hydration process in low w/b ratio concrete due to a higher
degree of self-desiccation. It was reported that below a certain level of self-desiccation
(internal RH = 80%) the hydration process will theoretically stop (Baroghel-Bouny,
2000). This means that for lower w/b ratio concrete, hydration will be slowed down at
an earlier age. It can be seen from Fig. 4.29 that the internal relative humidity of all the
concrete with a w/b ratio of 0.25 reduced to below 80% after about one month of

Chapter 4 Results and discussion
56
hydration and began to level off thereafter. On the contrary, the internal relative
humidity of concrete with w/b ratios of 0.35 and 0.45 decreased more slowly and
continued for 2 to 3 months before levelling off (Figs 4.30 and 4.31).
4.5.2 Effect of Silica Fume
In Figs. 4.43-4.45, the effect of SF replacement level on autogenous shrinkage of
concrete with w/b ratios of 0.25, 0.35 and 0.45 within the first 24 hours were presented.
It shows that at a w/b ratio of 0.25 and 0.35, an increase in SF content increased the
autogenous shrinkage. Especially at a w/b ratio of 0.35, the incorporation of 5, 10, and
15% SF increased the 24-hr autogenous shrinkage by about 120, 300, and 500%,
respectively, compared to that of the control Portland cement concrete. A similar trend
was also observed by Jenson and Hansen (1996).
One reason for the higher autogenous shrinkages of SF concrete is the filler and
pozzolanic effect of SF which refined the pore structure of hardened cement paste as
discussed previously. The pozzolanic reaction refines the pore structure and consumes
free water. Calcium silicate hydrates formed due to the pozzolanic reaction has a much
smaller size than crystals of calcium hydroxide, and thus can fill fine capillary pores.
According to Eq. 2.1, this refinement of pore structure increased the capillary tension,
and suction potential and thus autogenous shrinkage.
Another reason may be because of the very large specific surface area of SF particles.
When materials with fine particles such as Portland cement and SF are mixed with
water, adsorption and dissolution effects will cause volume reduction. The adsorption
effect occurs when the surface of a solid particle gets wet, the water molecules in
Chapter 4 Results and discussion
57
contact with the particle surface become more densely packed resulting in particle
volume reduction. The dissolution effect happens when the solid particles are dissolved
in water. Particles in a dissolved form have smaller volume than in a solid form. Since
the adsorption and dissolution are surface phenomena, higher autogenous shrinkage will
occur in concrete with SF which has much higher specific surface area than those
without SF.
However, the effect of SF was not pronounced in concrete with w/b ratio of 0.45 (Fig.
4.45). In concrete with a w/b ratio of 0.45, the cement paste was more porous and the
amount of SF added did not significantly modify the pore structure to such an extent
that it would drastically affect the shrinkage strain. As shown in Figs. 4.13-4.14 and
Table 4.19 the incorporation of SF in the cement pastes with a w/b ratio of 0.45
decreased the peak pore diameter but not the total pore volume. Moreover, because
there is sufficient free water in the concrete with a w/b ratio of 0.45 at an early age, the
internal RH at 1-day was nearly 100%. According to the Kelvin equation (Eq. 2.1)
discussed above, no stress will be generated in the capillary pores to induce autogenous
shrinkage.
Besides higher autogenous shrinkage values, lower w/b ratio concrete with high SF
content also showed faster development of autogenous shrinkage. For example, the
autogenous shrinkage of specimen S25-15 (w/b ratio=0.25, SF=15%) at 8 hours was
approximately 100 microstrain, which was more than 90% of the value at 24 hours. This
was perhaps due to the earlier stiffening of the SF concrete (Pistilli et al, 1984). An
increase in the SF content not only increased the autogenous shrinkage values but also
initiated autogenous shrinkage earlier.
Chapter 4 Results and discussion
58
From Fig. 4.37, it can be seen that at a SF replacement level of 15%, the difference in
autogenous shrinkage values between concretes with w/b ratio of 0.25 and 0.35 was
very small. This was an interesting phenomenon and might be related to either relative
humidity, or the pore structure.
Firstly, RH is examined. It was found from Figs. 4.25-4.28 that the RH of concrete with
a w/b ratio of 0.25 and 0.35 at 1 day were similar (both at around 100%). The small
difference of autogenous shrinkage values of the 0.25 and 0.35 w/b ratio concretes with
15% SF replacement seems to be independent of the internal RH. The reason might be
that at a SF content of 15 %, the pores structure was not affected substantially as the
w/b ratio was increased from 0.25 to 0.35. Thus the difference in autogenous shrinkage
of the concrete with these w/b ratios was small. Since no data was available on the pore
structure of cement paste with 15% SF, it is recommended that the pore structure of
cement pastes with a SF replacement level of 15% be measured to confirm this.
Figures 4.46 to 4.48 present the effect of SF content on the 240 day autogenous
shrinkage of concrete with w/b ratios of 0.25, 0.35 and 0.45, respectively. It is obvious
that the autogenous shrinkage increased significantly with an increase in the SF content.
For example, at a w/b ratio of 0.35, the 240-day autogenous shrinkage strains were
about 230, 345, 395 and 480 microstrains for concretes with SF contents of 0, 5, 10 and
15%, respectively.
The reasons for the higher autogenous shrinkage of the SF concrete during the first 24
hours were discussed previously, attributed to the filler and pozzolanic effects of SF.
Chapter 4 Results and discussion
59
For the longer term, these two effects continue to refine the pore structure. Moreover,
reduced water content due to the pozzolanic reaction increased the self-desiccation and
therefore autogenous shrinkage. It is generally agreed upon that the pozzolanic reaction
also consumes water by adsorption as the calcium silicate hydrates have high specific
surface area and high porosity, thus reducing the free water available for cement
hydration (Cabrera and Lee, 1985). The internal relative humidity data (Figs 4.29 to
4.31) confirmed the effect of SF in increasing the degree of self-desiccation.
However, it seems that the effect of SF on the 240 day autogenous shrinkage was more
significant in concretes with a w/b ratio of 0.35 (Fig 4.46-4.48). One probable reason
for this was that SF was more effective in increasing self-desiccation at a w/b ratio of
0.35. For concrete with w/b ratio of 0.25, self-desiccation was already severe even
without SF because of its low water content. For concrete with a w/b ratio of 0.45, the
water content was relatively high so that no serious self-desiccation occurred even in the
concrete with a high SF content. This hypothesis can be confirmed, looking at the
internal relative humidity data (Figs 4.29 to 4.31). For concrete with a w/b ratio of 0.25,
the internal relative humidity dropped to below 80% within the first 1 or 2 months even
without any SF, whereas the internal relative humidity in the concrete with a w/b ratio
of 0.45 remained above 80% for all the SF replacement levels even at 240 days.
The incorporation of SF in concretes can also accelerate development of autogenous
shrinkage during the first 28 days. In other words, a higher percentage of the total 240-
day autogenous shrinkage was reached during the first 28 days in SF modified concrete
than in OPC. As presented in Fig. 4.42, the 28-day autogenous shrinkage of concrete
with a w/b ratio of 0.35 and SF contents of 0, 5, 10, and 15% were 52, 62, 66, and 73%

Chapter 4 Results and discussion
60
of their respective total 240-day autogenous shrinkage. Concretes with different w/b
ratios also exhibited the same trend. This phenomenon was perhaps due to the
consumption of free water by the pozzolanic reaction of SF. As mentioned above,
pozzolanic reaction is a water consuming reaction. The reduced water content in
concrete will reduce the rate of cement hydration. Hence, the cement hydration is
slowed down in SF concrete at a relatively earlier age. Jensen and Hansen (1996)
pointed out the central role of the pozzolanic reaction on the decrease in internal relative
humidity. At a later age, the development of the autogenous shrinkage may be attributed
to the pozzolanic reaction which was reported to be not as sensitive to self-desiccation
as compared to cement hydration (Cabrera and Lee, 1985). The internal relative
humidity of the SF concrete was clearly lower than that of the control mixes (Figs. 4.29
to 4.31).
4.5.3 Effect of temperature
The effect of curing temperature on the autogenous shrinkage of concrete with a w/b
ratio of 0.35 with and without SF during the first 24 hours is shown in Figs. 4.49 and
4.50. Increasing the curing temperature from 20 to 30 0C did not have significant effect
on concrete without SF (Fig. 4.49). On the other hand, it increased the autogenous
shrinkage of concrete with SF slightly (Fig. 4.50). The reason was probably due to the
accelerated hydration and pozzolanic reaction occurring at a higher curing temperature,
which increased chemical shrinkage and self-desiccation, thus autogenous shrinkage.
For the longer term, Fig. 4.51 presents the autogenous shrinkage of concrete with a w/b
ratio of 0.35 and 10% SF cured at different temperatures (20 and 30 0C). It showed that
the concrete cured at 20 0C developed autogenous shrinkage at a lower rate during the

Chapter 4 Results and discussion
61
first week. However, the value at 240 days was not affected significantly by the curing
temperature.
4.5.4 Effect of aggregate
Figures 4.52 and 4.53 present the effect of aggregates on the autogenous shrinkages of
concretes (w/b ratio=0.35) with and without SF during the first 24 hours, respectively. It
was found that the autogenous shrinkage of the lightweight aggregate concrete was
much smaller than that of the normal weight concrete. With 10% SF, the lightweight
concrete exhibited an expansion of ~25 microstrains, whereas the normal weight
concrete registered an autogenous shrinkage of 70 microstrains.
Figures 4.54 to 4.55 present the effect of aggregate on the autogenous shrinkage of
concrete (w/b ratio=0.35) with and without SF for up to 8 months, respectively. Similar
to the first 24 hours, the longer term autogenous shrinkage of the lightweight aggregate
concrete was much smaller than that of the normal weight concrete. At 10% SF the 240-
day autogeneous shrinkage of the concrete with lightweight aggregate pre-soaked for 24
hours was reduced to ~190 microstrains compared with 395 microstrains for the
corresponding concrete with normal weight aggregate.
As discussed previously in section, 4.4.3, the significant effect of lightweight aggregate
on reducing autogenous shrinkage was probably due to the internal curing effect of
water absorbed inside the aggregate which impedes the occurrence of self-desiccation
(Takada, 1998).
Chapter 4 Results and discussion
62
It is suggested by Takada (1988) that the internal drying of the concrete pores due to
cement hydration generates a driving force by which water is transported from the pores
of the lightweight aggregate into the partially dried pores of the cement paste matrix.
The mechanism of this transport process may be associated with capillary effect since
the pores in the paste matrix are considerably smaller than those in the lightweight
aggregate, and as a result, capillary suction may take place (Bentur et al, 2001). Similar
results were also reported by Takada (1998).
The water released from the lightweight aggregate would prevent or at least hinder the
occurrence of self-desiccation. The internal humidity of the normal weight and
lightweight concrete also showed this trend (Fig. 4.32 and 4.33), and it is clear that at
the same w/b ratio and SF content the internal relative humidity of the lightweight
concrete was much higher than that of the normal weight concrete. At the age of 240
days, the normal weight concrete had a RH of less than 80% compared with that of
lightweight concrete ~85%. This accounted for the higher autogeneous shrinkage of the
normal weight concrete.
The effect of the presoak time of the lightweight aggregate on autogenous shrinkage
during the first 24 hours is shown in Fig. 4.56. The effect of lightweight aggregate
presoak time on autogenous shrinkage data up to 240 day is shown in Fig. 4.57. No
significant difference was found between the concrete with the aggregates presoaked for
0.5 or 24 hours. The reason perhaps is because lightweight aggregate has high initial
moisture content which may cause no apparent effect of presoak time.

Chapter 4 Results and discussion
63
4.5.5 Discussion on internal relative humidity, pore structure,
and autogenous shrinkage
From the discussion above, it is clear that the w/b ratio, SF content, temperature, and
aggregate type affect both the amount of autogenous shrinkage and the rate of its
development. It can also be seen that all these factors affect autogenous shrinkage
through two fundamental parameters - internal RH and pore structure.
Internal RH is an indicator of self-desiccation. From the Kelvin equation (Eq. 2.1), it
can be seen that the internal RH and pore size are closely related to the capillary stress
which is the primary cause of shrinkage.
Figs. 4.58 - 4.60 show the relationship between the internal RH and autogenous
shrinkage of concrete with w/b ratios of 0.25, 0.35, and 0.45, respectively. It is
interesting to note that at the same w/b ratio and RH, concrete with SF had higher
autogenous shrinkage. As discussed earlier, the incorporation of SF in concrete refined
the pore structure. Kelvin equation indicates that at the same RH, finer pores result in
higher capillary stress. Therefore, shrinkage of the SF concrete was higher than that of
the control Portland cement concrete even though their RH were the same. From these
figures, it can also be seen that the slope of the curves becomes steeper at a later age
which indicates that the same degree of self-desiccation (RH drop) resulted in higher
autogeneous shrinkage values. This may be due to the increased hydration products
formed that reduced porosity and pore sizes at a later age. Thus, the same degree of
decrease in the RH may result in higher shrinkage at a later age.

Chapter 4 Results and discussion
64
Figures 4.61 and 4.62 showed the curves of the autogenous shrinkage vs. RH for
concrete with different aggregates. It can be seen that the shape and slope of the curves
are very similar. Because the w/b ratio and SF content were the same, the saturated
lightweight aggregate will mainly mitigate self-desiccation effects (increasing RH), and
not change the pore structure drastically. As a result, the same degree of self-desiccation
resulted in similar autogenous shrinkage values, and shape of curves.
4.6 Drying and total shrinkage
The total shrinkage of concretes was measured by Demec gauge as described in Section
3.7.7. Excluding the effects of thermal expansion, the total shrinkage is a combination
of autogenous and drying shrinkage. The drying shrinkage was calculated by
subtracting autogenous shrinkage from total shrinkage as shown in Equation 3.5.
Measurements of total shrinkage were taken daily during the first week, weekly from 7
to 90 days, and monthly afterwards until 240 days. The effects of different factors on
autogenous shrinkage have been discussed in Section 4.5. In this section, results of the
total and drying shrinkage are reported and discussed.
It should be noted here that the initial moisture curing has significant effects on the total
and drying shrinkage. The specimens for total shrinkage measurement were only cured
for 1 day in this study. The purpose of the short curing duration is to make it feasible to
calculate the drying shrinkage by subtracting autogenous shrinkage from total shrinkage
values as discussed in Section 3.7.7. In practice, seven day moist curing is often
specified. Typically, the longer the moisture curing, the lower the total shrinkage, when

Chapter 4 Results and discussion
65
specimens are exposed to a dry environment thereafter. Thus the total and drying
shrinkage data presented herein may be higher than what will be observed in practice.
4.6.1 Effect of water-to-binder ratio
The effects of w/b ratio on drying shrinkage were shown in Figs. 4.63–4.66. It should be
noted that drying shrinkage was not directly measured. Instead, it was calculated by
subtracting the shrinkage of sealed specimen from shrinkage values of air-dried
specimen. Because the results were calculated from different specimens, the curves are
not smooth and the results should be used only for semi-quantitative evaluation.
Figures 4.63–4.66 show that higher w/b ratio concretes had slightly higher drying
shrinkage and this trend was similar for the various SF replacement levels from 0 to
15%. The reason is because the higher w/b ratio concrete had more water to lose to the
outside environment, thus resulting in higher drying shrinkage. However, the effect of
w/b ratio on drying shrinkage is more obvious in concretes with SF than in OPC. The
reason may be due to the pore refinement effect of SF, and according to the Kelvin
equation the same amount of water loss will result in higher shrinkage in SF modified
concrete.
The effect of w/b ratio on the total shrinkage of concretes with various SF replacement
levels are shown in Figs. 4.67 – 4.70. It was observed that in general the total shrinkage
increased with decreasing w/b ratio. The effect of w/b ratio on the total shrinkage can be
attributed to two factors - drying shrinkage and autogenous shrinkage.

Chapter 4 Results and discussion
66
Firstly, due to the presence of higher water content and higher permeability, concrete
with higher w/b ratio will loss more water from its pore system to environment, which
induces higher drying shrinkage. Secondly, as discussed previously, concrete with
higher w/b ratio has more gel water, coarser micropore structure, and thus lower self-
desiccation and autogenous shrinkage. The first factor (drying shrinkage) was presented
by curves in Figs. 4.63-4.66 and the second factor (autogenous shrinkage) was
presented previously by curves in Figs. 4.38 – 4.41.
These two factors act simultaneously and the sum of their effects accounts for the
results of total shrinkage. From the results obtained, it appears that the second factor is
more dominant as the higher w/b ratio concrete showed lower total shrinkage. This
observation differs from results reported by Mehta (1985) and can be accounted for the
differences in curing condition and starting point of the measurement. In this research,
the specimens for the total shrinkage were subjected to drying immediately after
demoulding at 24 hours without water curing and the starting point of the measurement
is from the initial setting of the concrete. The specimens used for total shrinkage
measurement by Mehta were water cured for 7 days and the starting point of the
measurement is at 7 days. Because the autogenous shrinkage develops mostly during
first several weeks, later starting time of the measurement will result in the omission of
a significant portion of the total autogenous shrinkage strains.
4.6.2 Effect of silica fume
The effects of SF on drying shrinkage were illustrated in Figs. 4.71 – 4.73. The
incorporation of SF in concrete reduced the drying shrinkage for all the w/b ratios. As
discussed above, this is due to the reduced permeability of the SF concrete. For concrete

Chapter 4 Results and discussion
67
with w/b ratios of 0.25 and 0.35, increasing SF content from 0 to 5% decreased the
drying shrinkage substantially. However, further increasing the SF content did not
reduce the drying shrinkage very much. For the concrete with a w/b ratio of 0.45, the
drying shrinkage reduced with an increase in SF content from 0 to 15%.
The hypothesis here is that for concrete with low w/b ratios (0.25 and 0.35), 5% SF may
be sufficient to reduce the permeability. Further increasing in the SF content did not
help to decrease the water loss as there is not enough water available to facilitate the
pozzonalic reaction when higher SF contents are concerned. For concrete with higher
w/b ratio, a sufficient amount of water is available for pozzolanic reaction. Thus,
increasing the SF content beyond 5% will decrease the permeability further and hence
the drying shrinkage. It is recommended that standard permeability test be conducted to
verify this hypothesis.
The effects of SF on the total shrinkage of concrete with various w/b ratios are
illustrated in Figs. 4.74 – 4.76. For concrete with w/b ratios of 0.25 and 0.45, the total
shrinkage did not seem to be affected by the SF content (Figs. 4.74 and 4.76). For the
concrete with a w/b ratio of 0.35, the incorporation of SF reduced the total shrinkage
(Fig. 4.75).
The effect of SF on total shrinkage could be explained by two different mechanisms. It
is already known that SF decreases porosity and pore size, and reduces permeability.
The reduced permeability will impede the loss of moisture and hence reduce the rate of
drying and drying shrinkage. On the other hand, the refined pore structure will increase
the capillary stress and result in higher autogenous shrinkage.
Chapter 4 Results and discussion
68
Both mechanisms will affect the total shrinkage of the SF concrete. Al-Sugair (1995)
concluded that these two mechanisms occur simultaneously. The extent to which one
mechanism dominates the total shrinkage is primarily related to the curing and test
conditions. Al-sugair (1995) reported that the first mechanism (reduced permeability)
dominated his results. This means that SF decreases the moisture loss from the concrete.
Pozzolanic reaction of SF, which consumes the pore water and increases the C-S-H, is
also responsible for a lower water loss compared with the control concrete.
The first mechanism can be illustrated by the drying shrinkage values (Figs. 4.71-4.73)
and the second mechanism can be illustrated by the autogenous shrinkage values (Figs.
4.46 – 4.48). In this investigation, the effects of these two mechanisms on the total
shrinkage were almost equivalent. This can be seen from the total shrinkage values of
the SF concrete which did not show significant effect. This observation is contrary to
results reported by Al-Sugair’s (1995), and may be explained by the difference in curing
conditions. In the present study, the specimens for the total shrinkage were subjected to
drying after demoulding without water curing. As a result, the pozzolanic reaction of SF
may not proceed adequately and the water loss may not be hindered as effectively as in
specimens subjected to water curing.
4.6.3 Effect of temperature
The effect of temperature on the total shrinkage and drying shrinkage of concrete with a
w/b ratio of 0.35 and 10% SF is shown in Figs. 4.77 and 4.78, respectively. It seems that
a temperature change from 20 to 300C did not affect the total shrinkage and drying
shrinkage significantly.

Chapter 4 Results and discussion
69
4.6.4 Effect of aggregate
From Figs. 4.79 and 4.80, it can be seen that aggregate type did not affect drying
shrinkage to a great extent. This is easily understood considering the effect light-weight
aggregates have on the cement paste matrix. On one hand, the presoaked aggregates are
able to provide more free water for evaporation to the external environment. On the
other hand, the internal curing effect may produce more hydration products, reducing
permeability and thus drying shrinkage. These two effects may affect drying shrinkage
simultaneously but in opposite directions.
The effect of light-weight aggregate on the total shrinkage of concretes is shown in Figs.
4.81 and 4.82. The total shrinkages of light weight concrete were lower than that of
normal concretes. Comparing the data in Figs 4.81 and 4.82, it appears that the effect of
lightweight aggregate on the total shrinkage was more significant in SF concrete than in
the control concrete.
Since drying shrinkage was not affected significantly by the aggregate type, the lower
total shrinkage of the lightweight concrete is most likely due to the lower autogenous
shrinkage. As discussed in Section 4.5.4, the internal curing effects caused by
lightweight aggregate mitigates against self-desiccation and thus reduces the autogenous
shrinkage to a great extent. When the normal weight aggregate was replaced by the
presoaked lightweight aggregate, water in the porous lightweight aggregate was
released gradually to the surrounding paste matrix as the humidity levels decreased with
cement hydration and pozzolanic reaction. The water released from the lightweight
aggregate would hinder the occurrence of self-desiccation. The internal humidity curves

Chapter 4 Results and discussion
70
of the normal weight and lightweight concrete show this trend (Figs. 4.32 and 4.33)
clearly.
The effect of the presoak time of lightweight aggregate on the total and drying
shrinkage is shown in Figs. 4.83 and 4.84. As for autogenous shrinkage, increasing
presoak time from 0.5 to 24 hours did not affect the total and drying shrinkage
considerably. As for the autogenous shrinkage, the reason perhaps is because
lightweight aggregate has high initial moisture content which may cause no apparent
effect of presoak time.
4.7 Relations between autogenous, drying, and total
shrinkage
Tables 4.22 and 4.23 summarize the autogenous shrinkage, total shrinkage, and
calculated drying shrinkage of the concrete specimens at 28 and 240 days.
It can be seen from the tables that for the concrete with a w/b ratio of 0.45 without SF,
the autogenous shrinkage was much smaller than the total shrinkage. This indicated that
a significant part of the total shrinkage was due to the drying shrinkage. On the other
hand, for concrete with lower w/b ratios (0.35 and 0.25) and SF, the autogenous
shrinkage values are closer to the total shrinkage values and the drying shrinkage
becomes less significant. Figs. 4.85 and 4.86 show the percentage of the autogenous
shrinkage relative to the total shrinkage at the ages of 28 and 240 days. Clearly the trend
Chapter 4 Results and discussion
71
shows that there are higher autogenous shrinkage-to-total shrinkage ratios (AS/TS) for
concrete with lower w/b ratios.
This trend can be attributed to two factors. Firstly, as discussed in section 4.5.1,
concrete with lower w/b ratios has finer pore structure, less water, and thus higher self-
desiccation and greater autogenous shrinkage values. Secondly, because concrete with
lower w/b ratios has less free water and lower permeability, moisture loss from concrete
is more difficult and this results in lower drying shrinkage.
In addition, Tables 4.22 and 4.23 and Figs. 4.85 and 4.86 show that for a given w/b ratio,
concrete with higher SF content had higher autogenous shrinkage and lower drying
shrinkage. This means that a larger proportion of the total shrinkage was due to the
autogenous shrinkage as the SF content increases.
This observation might be attributed to two factors. Firstly, the pore structure becomes
finer when SF is incorporated in concrete, and less free water becomes available
because of pozzolanic reaction. This resulted in a higher degree of self-desiccation and
greater autogenous shrinkage. Secondly, the pozzolanic reaction consumed some of the
water so that there is less free water available to lose to external environment. Moreover,
lower permeability due to the finer pore structure also makes moisture loss more
difficult. These resulted in lower drying shrinkage.
By comparing Figs. 4.85 and 4.86, it can be observed that for the concrete with a w/b
ratio of 0.25, the AS/TS ratios at 240 days were unchanged or decreased compared with
those at 28 days. On the contrary, for concrete with w/b ratios of 0.35 and 0.45, the
Chapter 4 Results and discussion
72
AS/TS ratios at 240 days were higher than the AS/TS ratios at 28 days. This means that
for the concrete with a low w/b ratio of 0.25, the autogenous shrinkage comprises a
higher proportion of the total shrinkage during the first 28 days than for a duration of
240 days. In the concrete with higher w/b ratios of 0.35 and 0.45, the autogenous
shrinkage comprises a higher percentages of the total shrinkage after 240 day than after
28 day.
This difference may be explained by the hindered hydration process present in low w/b
ratio concrete due to a higher degree of self-desiccation. It was reported that below a
certain level of self-desiccation (internal RH = 80%) the hydration process will
theoretically stop (Baroghel-Bouny and Kheirbek, 2000). This means that for a lower
w/b ratio concrete, the hydration will be slowed down at an earlier age. This hindered
hydration process will decelerate the self-desiccation and thus autogenous shrinkage.
However, hindered hydration cannot stop the drying shrinkage, thus the AS/TS ratio
becomes lower after the hydration process stops or slows down considerably.
From Fig. 4.29, it can be seen that the internal RH of all the concrete with a w/b ratio of
0.25 dropped to below 80% after the first month of hydration and became to level off
thereafter. Thus autogenous shrinkage slowed down and the AS/TS ratio decreased. On
the contrary, the internal relative humidity of the concrete with w/b ratios of 0.35 and
0.45 decreased more slowly and continued for 2 to 3 months before levelling off (Figs
4.30 and 4.31). Thus autogenous shrinkage proceeded well beyond the first 28 days.
Chapter 4 Results and discussion
73
4.8 Estimation of the risk of shrinkage cracking of
restrained concrete
With the data on modulus of elasticity, strength, and shrinkage, the potential risk of
shrinkage cracking of restrained concrete prisms is estimated and discussed in this
section.
Only compressive strengths of the concrete were tested in this study, and the tensile
strength of concrete was estimated using the relationship used by ACI (Mindess et al,
2003) as follows:
fr’ = 0.438 fc
’ 0.67 MPa (4.1)
where fr’ = flexural strength of concrete MPa
fc’ = compressive strength
Since fc’ is the cylinder strength and compressive strength tested in this research is cube
strength, a conversion factor of 0.8 was used according to BS 1881: Part 120:1983 to
convert the cube strength to cylinder strength.
Dynamic modulli of elasticity were used to calculate the tensile stress incurred
continuously due to shrinkage. It is assumed that the modulus of elasticity in tension is
the same as that determined in compression. Since the dynamic modulus of elasticity is
close to the initial tangent modulus which is higher than the secant modulus of concrete,
the stresses tend to be an overestimate to certain extent.

Chapter 4 Results and discussion
74
The tensile stresses were estimated by multiplying the shrinkage strains due to the
restraint afforded by the prism by the dynamic modulus of elasticity. At any given age,
if the tensile stress is lower than the tensile strength, the crack risk is considered low. If
the tensile stress is greater than the tensile strength, the crack risk is considered high.
It should be noted that (i) concrete prism is assumed to be fully restrained, (ii) creep and
relaxation are not considered, (iii) the dynamic modulus of elasticity used probably
overestimated the actual modulus of elasticity, and (iv) the curing condition of the
specimen was sealed or air dried after 1-day of moist curing, whereas 3 to 7 day moist
curing is often specified at job sites. Factors (ii) to (iv) may result in an overestimation
of the crack risk when considering actual conditions on site.
Figures 4.87-4.94 show the tensile stress and tensile strength of the concretes with w/c
ratios of 0.25 and 0.45 and with 0 and 10% SF under sealed and air dried (after 1-day
moisture curing) conditions. Despite of the drawbacks discussed above, these figures
clearly show the effects of w/b ratio, SF content, and curing condition on concrete crack
risk. By comparing the concrete with a w/b ratio of 0.25 (Figs. 4.87- 4.90) and that with
a w/b ratio of 0.45 (Figs. 4.91-4.94), it can be seen that concrete with lower w/c ratio
had a higher risk of shrinkage crack.
For concrete with a w/b ratio of 0.25 in air dry condition, the tensile stress exceeded the
tensile strength during the first week. Whereas for the concrete with a w/b ratio of 0.45,
the tensile stress was lower than the tensile strength during the early ages and only
exceeded the tensile strength after several weeks. The reason is that although decreasing

Chapter 4 Results and discussion
75
w/b ratio will increase the tensile strength to some extent, lower w/b ratio had a more
significant effect on the increase in the shrinkage value and thus tensile stress.
The effect of curing condition on crack risk can be noticed by comparing figures such as
Figs. 4.87 and 4.88 or Fig. 4.91 and 4.92. Significant differences can be found between
sealed and air dried specimen. Sealed specimens had lower shrinkage values and thus
lower tensile stresses because only autogenous shrinkage occurred. Moreover, sealed
specimens generally had higher tensile strength than air dried specimens. As a result,
the crack risk of sealed concrete was less vis-a-vis concrete exposed to air dry condition.
The effect of SF on the crack risk can be found by comparing Figs. 4.87 and 4.89 or
Figs. 4.91 and Fig 4.93. It is obvious that increasing SF content increase the shrinkage
crack risk. The reason is simply because the effect of SF on the tensile strength is not as
significant as that on shrinkage values and tensile stresses. As a result, SF concrete may
have a higher risk of cracking. From Fig. 4.89, it can be seen that at a low w/c ratio of
0.25, concrete may experience cracking even when in a sealed condition.
From the discussion above, it can be concluded that the w/b ratio, SF content, and
curing condition have significant effects on crack risk of concrete. For a low w/b ratio
and high SF content, cracking may occur at a very early age (during the first week) even
under sealed condition. For a high w/b ratio with no SF, concrete may experience
cracking after being exposed to a dry environment after a couple of weeks if restrained.
Because of the potential risk of shrinkage cracking, efforts should be made in practice to
reduce the shrinkage value of such mixes.

Chapter 4 Results and discussion
76
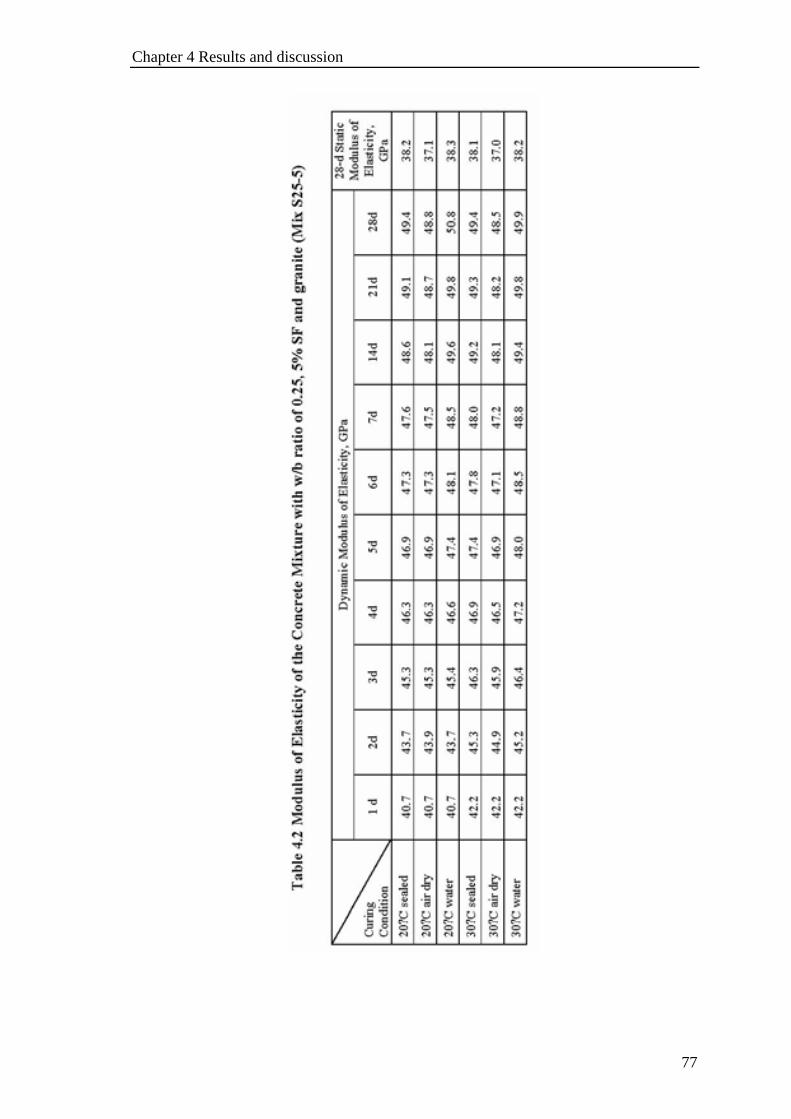
Chapter 4 Results and discussion
77

Chapter 4 Results and discussion
78

Chapter 4 Results and discussion
79

Chapter 4 Results and discussion
80

Chapter 4 Results and discussion
81

Chapter 4 Results and discussion
82

Chapter 4 Results and discussion
83

Chapter 4 Results and discussion
84

Chapter 4 Results and discussion
85

Chapter 4 Results and discussion
86
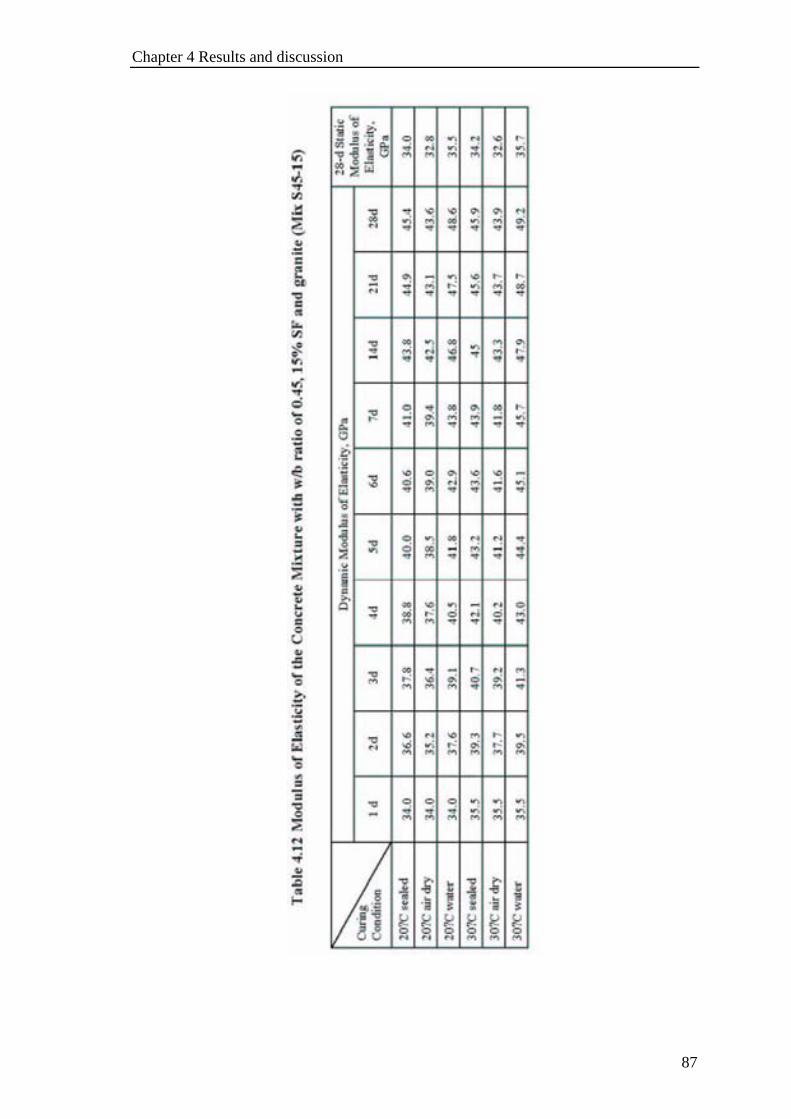
Chapter 4 Results and discussion
87

Chapter 4 Results and discussion
88
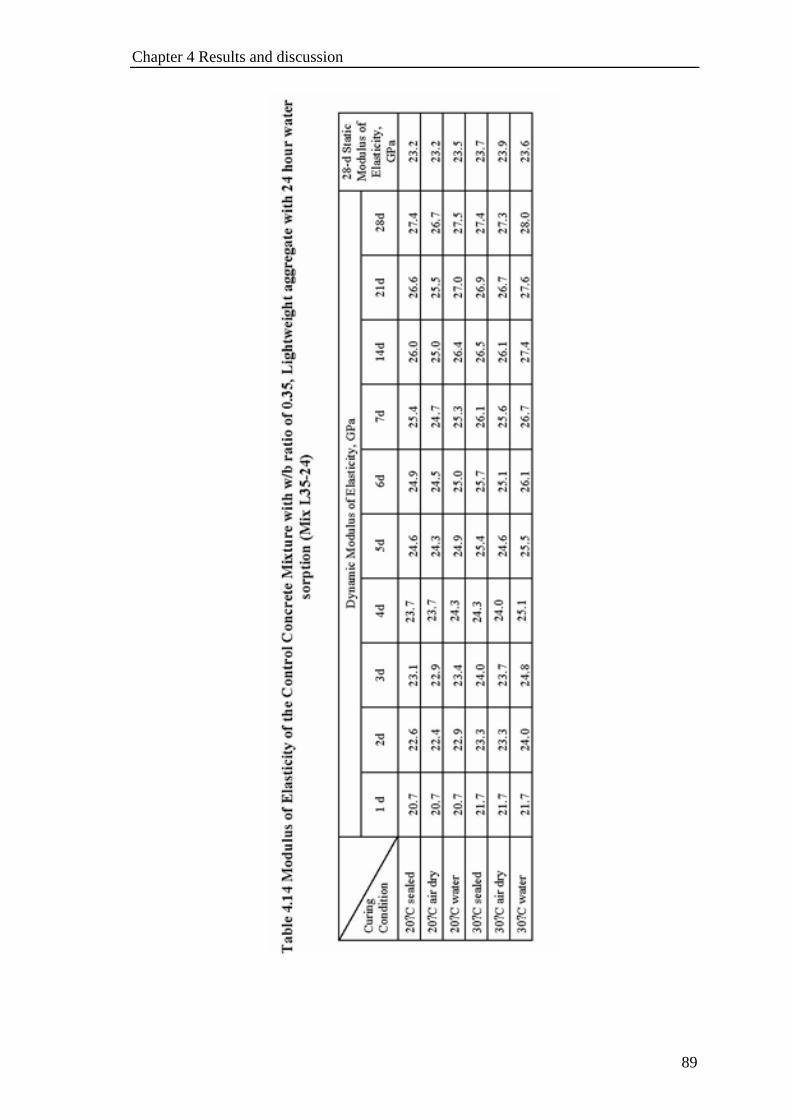
Chapter 4 Results and discussion
89

Chapter 4 Results and discussion
90
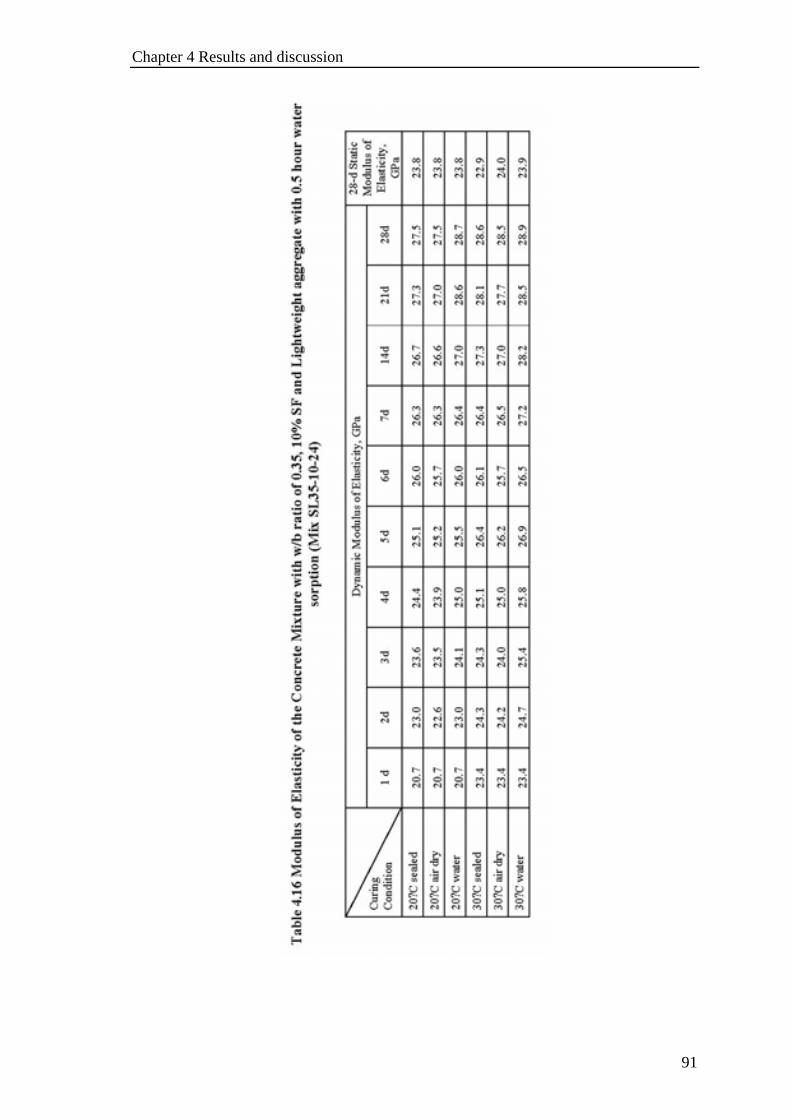
Chapter 4 Results and discussion
91

Chapter 4 Results and discussion
92

Chapter 4 Results and Discussion
93
Table 4.18 International Union of Pure and Applied Chemistry (IUPAC) pore size classification (IUPAC, 1972)
Pore description Radius(Å)
Micropores < 12.5
Mesopores 12.5-250
Macropores 250-50,000
Entrained air voids, entrapped voids, preexisting microcracks
>50,000
Table 4.19 Pore Characteristics of 1 day pastes (30 0C)
Mix ID Total cumulative vol.(mm3/g)
Pore radius average (A)
Total sample porosity (%)
N25 92.27 190 18.73 N35 123.64 130 22.62 N45 126.15 380 22.69
S25-10 35.15 20 6.99 S35-10 83.51 130 14.53 S45-10 176.59 190 26.04
Table 4.20 Pore Characteristics of 28 days pastes (30 0C)
Mix ID Total cumulative vol.(mm3/g)
Pore radius average (A)
Total sample porosity (%)
N25 29.57 30 6.35
N35 39.78 60 9.00
N45 76.9 70 13.47
S25-10 25.79 30 5.46
S35-10 37.63 50 7.37
S45-10 65.68 90 11.49
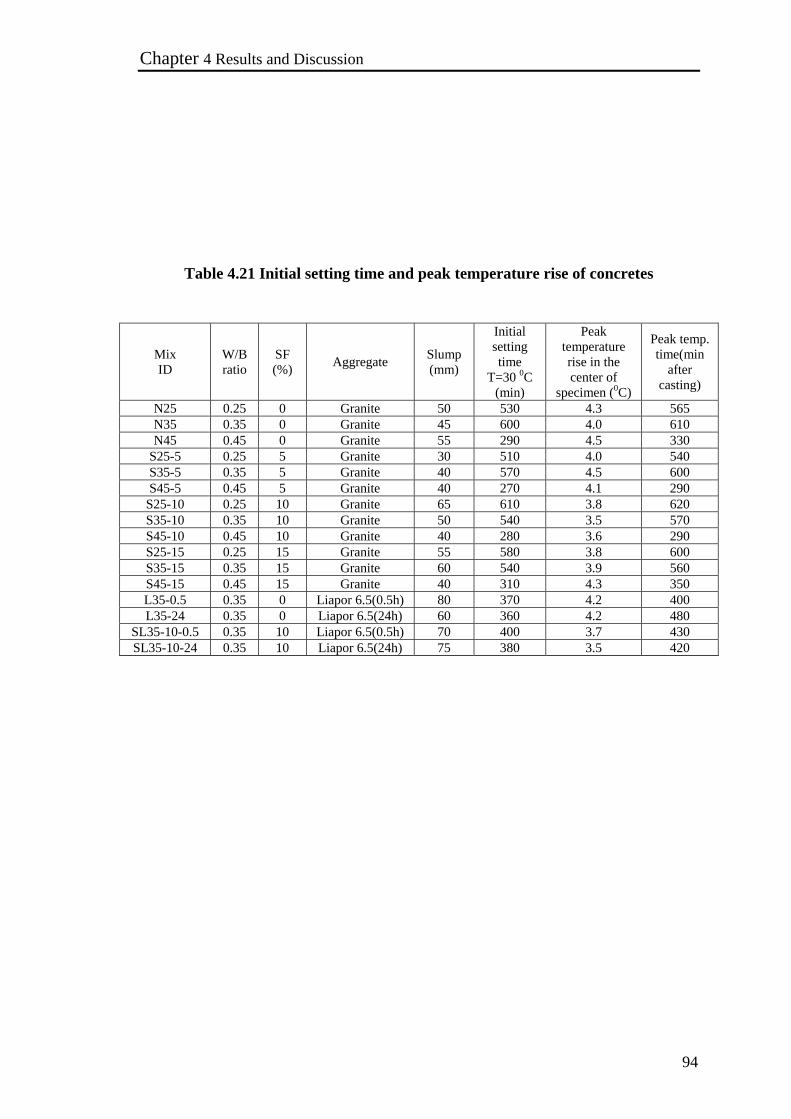
Chapter 4 Results and Discussion
94
Table 4.21 Initial setting time and peak temperature rise of concretes
Mix ID
W/B ratio
SF (%) Aggregate Slump
(mm)
Initial setting time
T=30 0C (min)
Peak temperature rise in the center of
specimen (0C)
Peak temp. time(min
after casting)
N25 0.25 0 Granite 50 530 4.3 565 N35 0.35 0 Granite 45 600 4.0 610 N45 0.45 0 Granite 55 290 4.5 330
S25-5 0.25 5 Granite 30 510 4.0 540 S35-5 0.35 5 Granite 40 570 4.5 600 S45-5 0.45 5 Granite 40 270 4.1 290
S25-10 0.25 10 Granite 65 610 3.8 620 S35-10 0.35 10 Granite 50 540 3.5 570 S45-10 0.45 10 Granite 40 280 3.6 290 S25-15 0.25 15 Granite 55 580 3.8 600 S35-15 0.35 15 Granite 60 540 3.9 560 S45-15 0.45 15 Granite 40 310 4.3 350 L35-0.5 0.35 0 Liapor 6.5(0.5h) 80 370 4.2 400 L35-24 0.35 0 Liapor 6.5(24h) 60 360 4.2 480
SL35-10-0.5 0.35 10 Liapor 6.5(0.5h) 70 400 3.7 430 SL35-10-24 0.35 10 Liapor 6.5(24h) 75 380 3.5 420

Chapter 4 Results and Discussion
95
Table 4.22 Autogenous, drying and total shrinkage of concrete at 28 days (unit: microstrain)
SF=0 SF=5% SF=10% SF=15% W/B
ratio AS DS TS AS DS TS AS DS TS AS DS TS
0.25 235 182 417 328 72 400 377 56 433 431 59 490
0.35 120 182 302 213 107 320 260 100 360 354 122 476
0.45 57 163 200 97 175 232 105 142 247 160 97 257
Table 4.23 Autogenous, drying and total shrinkage of concrete at 240 days (unit: microstrain)
SF=0 SF=5% SF=10% SF=15% W/B
ratio AS DS TS AS DS TS AS DS TS AS DS TS
0.25 345 258 603 453 140 593 486 113 599 497 113 610
0.35 233 299 532 345 152 497 395 144 539 483 139 622
0.45 167 363 480 257 226 483 265 235 500 315 175 485
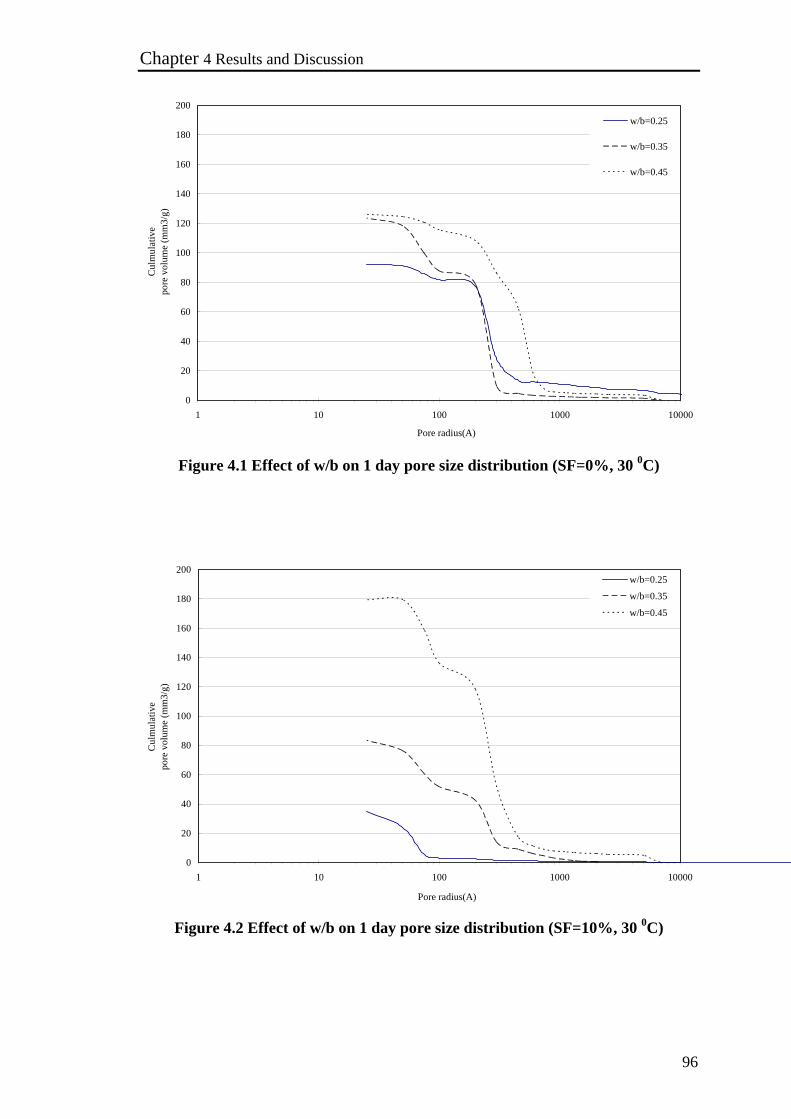
Chapter 4 Results and Discussion
96
0
20
40
60
80
100
120
140
160
180
200
1 10 100 1000 10000
Pore radius(A)
Cul
mul
ativ
epo
re v
olum
e (m
m3/
g)
w/b=0.25
w/b=0.35
w/b=0.45
Figure 4.1 Effect of w/b on 1 day pore size distribution (SF=0%, 30 0C)
0
20
40
60
80
100
120
140
160
180
200
1 10 100 1000 10000
Pore radius(A)
Cul
mul
ativ
epo
re v
olum
e (m
m3/
g)
w/b=0.25
w/b=0.35
w/b=0.45
Figure 4.2 Effect of w/b on 1 day pore size distribution (SF=10%, 30 0C)
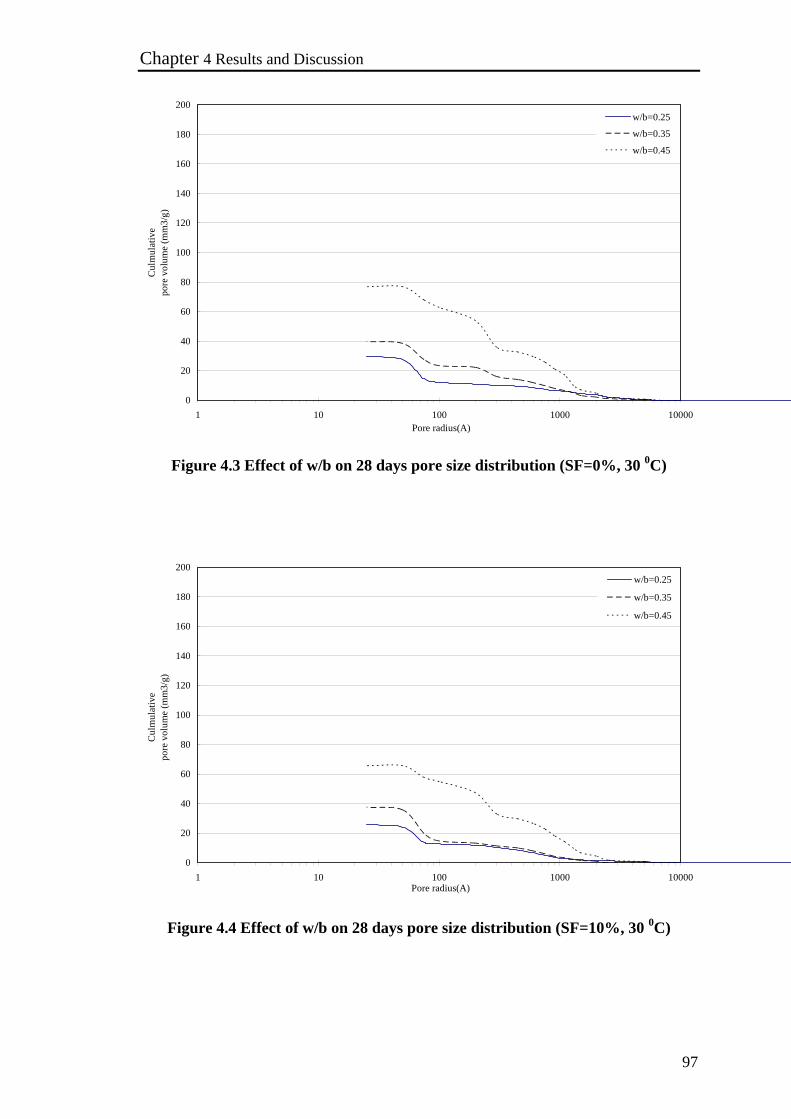
Chapter 4 Results and Discussion
97
0
20
40
60
80
100
120
140
160
180
200
1 10 100 1000 10000Pore radius(A)
Cul
mul
ativ
epo
re v
olum
e (m
m3/
g)
w/b=0.25
w/b=0.35
w/b=0.45
Figure 4.3 Effect of w/b on 28 days pore size distribution (SF=0%, 30 0C)
0
20
40
60
80
100
120
140
160
180
200
1 10 100 1000 10000Pore radius(A)
Cul
mul
ativ
epo
re v
olum
e (m
m3/
g)
w/b=0.25
w/b=0.35
w/b=0.45
Figure 4.4 Effect of w/b on 28 days pore size distribution (SF=10%, 30 0C)
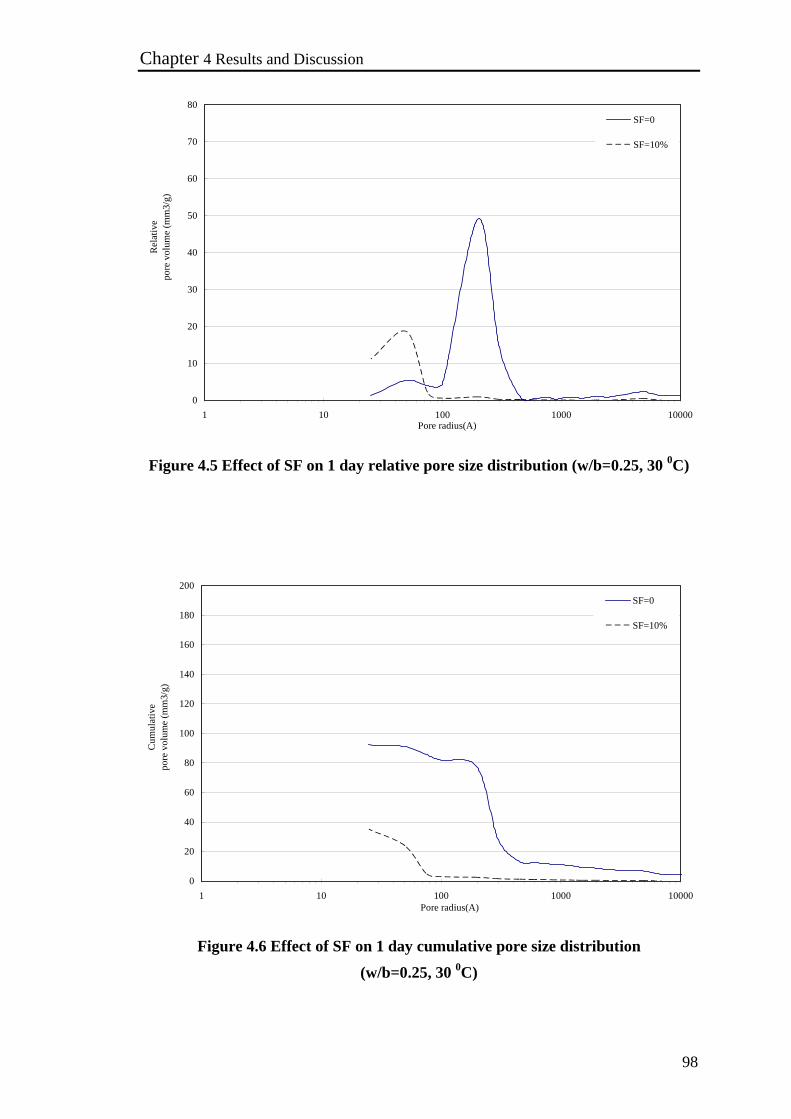
Chapter 4 Results and Discussion
98
0
10
20
30
40
50
60
70
80
1 10 100 1000 10000Pore radius(A)
Rel
ativ
epo
re v
olum
e (m
m3/
g)
SF=0
SF=10%
Figure 4.5 Effect of SF on 1 day relative pore size distribution (w/b=0.25, 30 0C)
0
20
40
60
80
100
120
140
160
180
200
1 10 100 1000 10000Pore radius(A)
Cum
ulat
ive
pore
vol
ume
(mm
3/g)
SF=0
SF=10%
Figure 4.6 Effect of SF on 1 day cumulative pore size distribution
(w/b=0.25, 30 0C)

Chapter 4 Results and Discussion
99
0
10
20
30
40
50
60
70
80
1 10 100 1000 10000Pore radius(A)
Rel
ativ
epo
re v
olum
e (m
m3/
g)
SF=0
SF=10%
Figure 4.7 Effect of SF on 28 days relative pore size distribution (w/b=0.25, 30 0C)
0
20
40
60
80
100
120
140
160
180
200
1 10 100 1000 10000Pore radius(A)
Cum
ulat
ive
pore
vol
ume
(mm
3/g)
SF=0
SF=10%
Figure 4.8 Effect of SF on 28 days cumulative pore size distribution
(w/b=0.25, 30 0C)

Chapter 4 Results and Discussion
100
0
10
20
30
40
50
60
70
80
1 10 100 1000 10000Pore radius(A)
Rel
ativ
epo
re v
olum
e (m
m3/
g)
SF=0
SF=10%
Figure 4.9 Effect of SF on 1 day relative pore size distribution (w/b=0.35, 30 0C)
0
20
40
60
80
100
120
140
160
180
200
1 10 100 1000 10000Pore radius(A)
Cum
ulat
ive
pore
vol
ume
(mm
3/g)
SF=0
SF=10%
Figure 4.10 Effect of SF on 1 day cumulative pore size distribution
(w/b=0.35, 30 0C )

Chapter 4 Results and Discussion
101
0
10
20
30
40
50
60
70
80
1 10 100 1000 10000Pore radius(A)
Rel
ativ
epo
re v
olum
e (m
m3/
g)
SF=0
SF=10%
Figure 4.11 Effect of SF on 28 days relative pore size distribution
(w/b=0.35, 30 0C)
0
20
40
60
80
100
120
140
160
180
200
1 10 100 1000 10000Pore radius(A)
Cum
ulat
ive
pore
vol
ume
(mm
3/g)
SF=0
SF=10%
Figure 4.12 Effect of SF on 28 days cumulative pore size distribution
(w/b=0.35, 300C)

Chapter 4 Results and Discussion
102
0
10
20
30
40
50
60
70
80
1 10 100 1000 10000Pore radius(A)
Rel
ativ
epo
re v
olum
e (m
m3/
g)
SF=0
SF=10%
Figure 4.13 Effect of SF on 1 day relative pore size distribution (w/b=0.45, 30 0C)
0
20
40
60
80
100
120
140
160
180
200
1 10 100 1000 10000Pore radius(A)
Cum
ulat
ive
pore
vol
ume
(mm
3/g)
SF=0
SF=10%
Figure 4.14 Effect of SF on 1 day cumulative pore size distribution
(w/b=0.45, 30 0C)

Chapter 4 Results and Discussion
103
0
10
20
30
40
50
60
70
80
1 10 100 1000 10000Pore radius(A)
Rel
ativ
epo
re v
olum
e (m
m3/
g)
SF=0
SF=10%
Figure 4.15 Effect of SF on 28 days relative pore size distribution
(w/b=0.45, 30 0C)
0
20
40
60
80
100
120
140
160
180
200
1 10 100 1000 10000Pore radius(A)
Cum
ulat
ive
pore
vol
ume
(mm
3/g)
SF=0
SF=10%
Figure 4.16 Effect of SF on 28 days cumulative pore size distribution
(w/b=0.45, 300C)
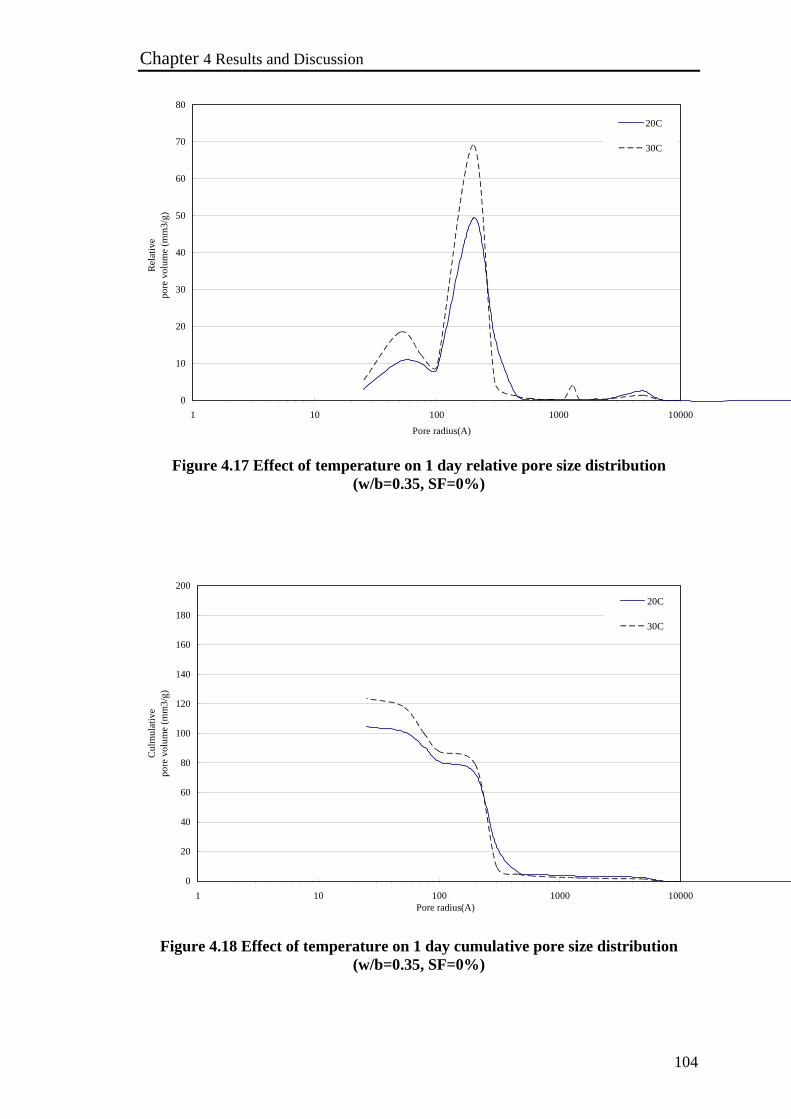
Chapter 4 Results and Discussion
104
0
10
20
30
40
50
60
70
80
1 10 100 1000 10000Pore radius(A)
Rel
ativ
epo
re v
olum
e (m
m3/
g)
20C
30C
Figure 4.17 Effect of temperature on 1 day relative pore size distribution
(w/b=0.35, SF=0%)
0
20
40
60
80
100
120
140
160
180
200
1 10 100 1000 10000Pore radius(A)
Cul
mul
ativ
epo
re v
olum
e (m
m3/
g)
20C
30C
Figure 4.18 Effect of temperature on 1 day cumulative pore size distribution
(w/b=0.35, SF=0%)
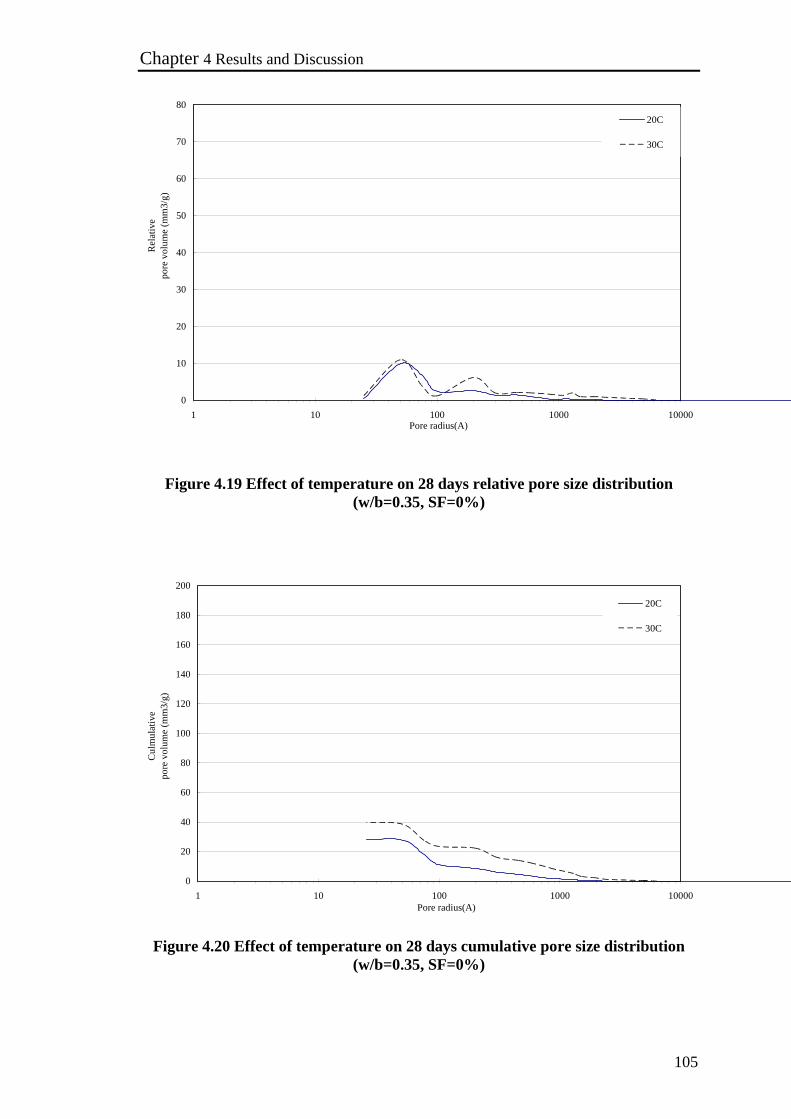
Chapter 4 Results and Discussion
105
0
10
20
30
40
50
60
70
80
1 10 100 1000 10000Pore radius(A)
Rel
ativ
epo
re v
olum
e (m
m3/
g)
20C
30C
Figure 4.19 Effect of temperature on 28 days relative pore size distribution (w/b=0.35, SF=0%)
0
20
40
60
80
100
120
140
160
180
200
1 10 100 1000 10000Pore radius(A)
Cul
mul
ativ
epo
re v
olum
e (m
m3/
g)
20C
30C
Figure 4.20 Effect of temperature on 28 days cumulative pore size distribution
(w/b=0.35, SF=0%)

Chapter 4 Results and Discussion
106
0
10
20
30
40
50
60
70
80
1 10 100 1000 10000
Pore radius(A)
Rel
ativ
epo
re v
olum
e (m
m3/
g)
20C
30C
Figure 4.21 Effect of temperature on 1 day relative pore size distribution
(w/b=0.35, SF=10%)
0
20
40
60
80
100
120
140
160
180
200
1 10 100 1000 10000
Pore radius(A)
Cum
ulat
ive
pore
vol
ume
(mm
3/g)
20C
30C
Figure 4.22 Effect of temperature on 1 day cumulative pore size distribution
(w/b=0.35, SF=10%)

Chapter 4 Results and Discussion
107
0
10
20
30
40
50
60
70
80
1 10 100 1000 10000Pore radius(A)
Rel
ativ
epo
re v
olum
e (m
m3/
g)
20C
30C
Figure 4.23 Effect of temperature on 28 days relative pore size distribution (w/b=0.35, SF=10%)
0
20
40
60
80
100
120
140
160
180
200
1 10 100 1000 10000Pore radius(A)
Cum
ulat
ive
pore
vol
ume
(mm
3/g)
20C
30C
Figure 4.24 Effect of temperature on 28 days cumulative pore size distribution
(w/b=0.35, SF=10%)

Chapter 4 Results and Discussion
108
70.0
80.0
90.0
100.0
0 30 60 90 120 150 180 210 240Age(day)
Rel
ativ
e H
umid
ity(%
)
0.250.350.45
Figure 4.25 Effect of w/b on internal relative humidity of concrete (SF =0, 30 0C)
70.0
80.0
90.0
100.0
0 30 60 90 120 150 180 210 240Age(day)
Rel
ativ
e H
umid
ity(%
)
0.250.350.45
Figure 4.26 Effect of w/b on the internal relative humidity of concrete
(SF =5%, 30 0C)

Chapter 4 Results and Discussion
109
70.0
80.0
90.0
100.0
0 30 60 90 120 150 180 210 240
Age(day)
Rel
ativ
e H
umid
ity(%
)
0.250.350.45
Figure 4.27 Effect of w/b on the internal relative humidity of concrete
(SF =10%, 30 0C)
70.0
80.0
90.0
100.0
0 30 60 90 120 150 180 210 240Age(day)
Rel
ativ
e H
umid
ity(%
)
0.250.350.45
Figure 4.28 Effect of w/b on the internal relative humidity of concrete
(SF =15%, 30 0C)

Chapter 4 Results and Discussion
110
70.0
80.0
90.0
100.0
0 30 60 90 120 150 180 210 240Age(day)
Rel
ativ
e H
umid
ity(%
)
SF=0SF=5%SF=10%SF=15%
Figure 4.29 Effect of SF on the internal relative humidity of concrete
(w/b= 0.25, 30 0C)
70.0
80.0
90.0
100.0
0 30 60 90 120 150 180 210 240Agee(day)
Rel
ativ
e H
umid
ity(%
)
SF=0SF=5%SF=10%SF=15%
Figure 4.30 Effect of SF on the internal relative humidity of concrete
(w/b= 0.35, 30 0C)

Chapter 4 Results and Discussion
111
70.0
80.0
90.0
100.0
0 30 60 90 120 150 180 210 240Age(day)
Rel
ativ
e H
umid
ity(%
)
SF=0SF=5%SF=10%SF=15%
Figure 4.31 Effect of SF on the internal relative humidity of concrete
(w/b= 0.45, 30 0C)
70.0
80.0
90.0
100.0
0 30 60 90 120 150 180 210 240Agee(day)
Rel
ativ
e H
umid
ity(%
)
N35L35
Figure 4.32 Effect of aggregate on the internal relative humidity of concrete
(w/b= 0.35, SF=0, 30 0C)

Chapter 4 Results and Discussion
112
70
80
90
100
0 30 60 90 120 150 180 210 240Agee(day)
Rel
ativ
e H
umid
ity(%
)
S35-10L35-10
Figure 4.33 Effect of aggregate on the internal relative humidity of concrete
(w/b= 0.35, SF=10%, 30 0C)
-120
-100
-80
-60
-40
-20
0
20
40
0 4 8 12 16 20 24
Age (hour)
Aut
ogen
ous s
hrin
kage
(mic
rost
rain
)
w/b=0.25w/b=0.35w/b=0.45
Figure 4.34 Effect of w/b ratio on the autogenous shrinkage of concrete within the
first 24 hour (SF=0%, 30 0C)
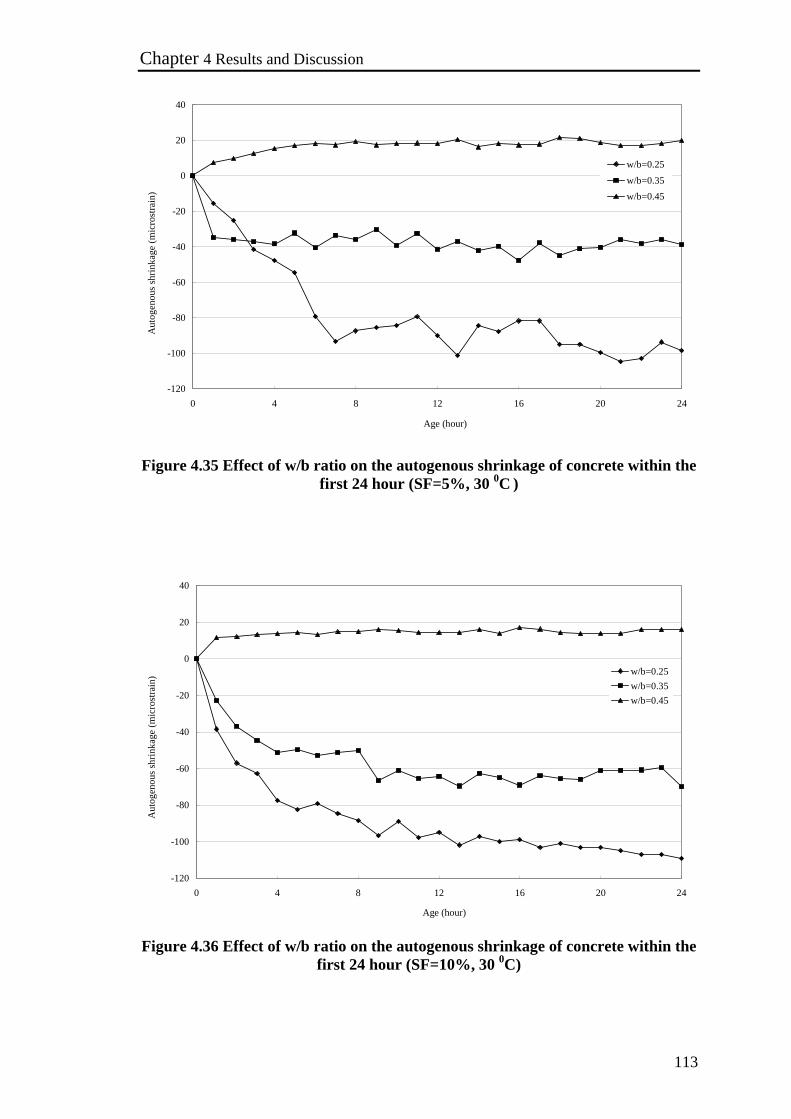
Chapter 4 Results and Discussion
113
-120
-100
-80
-60
-40
-20
0
20
40
0 4 8 12 16 20 24
Age (hour)
Aut
ogen
ous s
hrin
kage
(mic
rost
rain
)w/b=0.25
w/b=0.35w/b=0.45
Figure 4.35 Effect of w/b ratio on the autogenous shrinkage of concrete within the
first 24 hour (SF=5%, 30 0C )
-120
-100
-80
-60
-40
-20
0
20
40
0 4 8 12 16 20 24
Age (hour)
Aut
ogen
ous s
hrin
kage
(mic
rost
rain
) w/b=0.25w/b=0.35w/b=0.45
Figure 4.36 Effect of w/b ratio on the autogenous shrinkage of concrete within the
first 24 hour (SF=10%, 30 0C)

Chapter 4 Results and Discussion
114
-120
-100
-80
-60
-40
-20
0
20
40
0 4 8 12 16 20 24Age (hour)
Aut
ogen
ous s
hrin
kage
(mic
rost
rain
) w/b=0.25w/b=0.35w/b=0.45
Figure 4.37 Effect of w/b ratio on the autogenous shrinkage of concrete within the
first 24 hour (SF=15%, 30 0C)
-600
-500
-400
-300
-200
-100
0
100
0 30 60 90 120 150 180 210 240
Age (day)
Aut
ogen
ous s
hrin
kage
(mic
rost
rain
)
w/b=0.25w/b=0.35w/b=0.45
Figure 4.38 Effect of w/b on the autogenous shrinkage of concrete up to 240 days
(SF=0, 30 0C)

Chapter 4 Results and Discussion
115
-600
-500
-400
-300
-200
-100
0
100
0 30 60 90 120 150 180 210 240Age (day)
Aut
ogen
ous s
hrin
kage
(mic
rost
rain
)
w/b=0.25w/b=0.35w/b=0.45
Figure 4.39 Effect of w/b on the autogenous shrinkage of concrete up to 240 days
(SF=5%, 30 0C)
-600
-500
-400
-300
-200
-100
0
100
0 30 60 90 120 150 180 210 240Age (day)
Aut
ogen
ous s
hrin
kage
(mic
rost
rain
)
w/b=0.25w/b=0.35w/b=0.45
Figure 4.40 Effect of w/b on the autogenous shrinkage of concrete up to 240 days
(SF=10%, 30 0C)
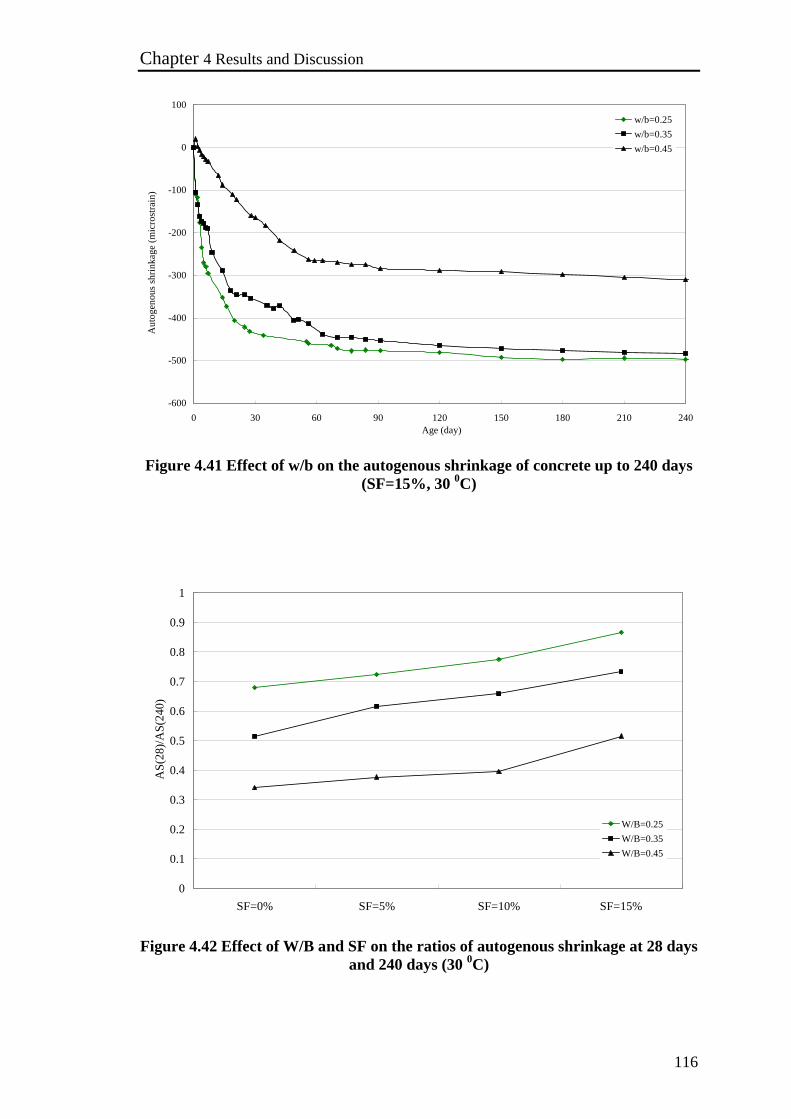
Chapter 4 Results and Discussion
116
-600
-500
-400
-300
-200
-100
0
100
0 30 60 90 120 150 180 210 240Age (day)
Aut
ogen
ous s
hrin
kage
(mic
rost
rain
)
w/b=0.25w/b=0.35w/b=0.45
Figure 4.41 Effect of w/b on the autogenous shrinkage of concrete up to 240 days
(SF=15%, 30 0C)
0
0.1
0.2
0.3
0.4
0.5
0.6
0.7
0.8
0.9
1
SF=0% SF=5% SF=10% SF=15%
AS(
28)/A
S(24
0)
W/B=0.25W/B=0.35W/B=0.45
Figure 4.42 Effect of W/B and SF on the ratios of autogenous shrinkage at 28 days
and 240 days (30 0C)

Chapter 4 Results and Discussion
117
-120
-100
-80
-60
-40
-20
0
20
40
0 4 8 12 16 20 24
Age (hour)
Aut
ogen
ous s
hrin
kage
(mic
rost
rain
)
SF=0SF=5%SF=10%SF=15%
Figure 4.43 Effect of SF content on the autogenous shrinkage of concrete within
the first 24 hour (w/b=0.25, 30 0C)
Figure 4.44 Effect of SF content on the autogenous shrinkage of concrete within the first 24 hour (w/b=0.35, 30 0C)
-120
-100
-80
-60
-40
-20
0
0 4 8 12 16 20 24Age(hour)
Aut
ogen
ous s
hrin
kage
(mic
rost
rain
)
SF=0SF=5%SF=10%SF=15%

Chapter 4 Results and Discussion
118
-120
-100
-80
-60
-40
-20
0
20
40
0 4 8 12 16 20 24Age (hour)
Aut
ogen
ous s
hrin
kage
(mic
rost
rain
)
SF=0SF=5%SF=10%SF=15%
Figure 4.45 Effect of SF content on the autogenous shrinkage of concrete within
the first 24 hour (w/b=0.45, 30 0C)
-600
-500
-400
-300
-200
-100
0
0 30 60 90 120 150 180 210 240Age (day)
Aut
ogen
ous s
hrin
kage
(mic
rost
rain
)
SF=0SF=5%SF=10%SF=15%
Figure 4.46 Effect of SF on the autogenous shrinkage of concrete up to 240 days
(w/b=0.25, 30 0C)

Chapter 4 Results and Discussion
119
-600
-500
-400
-300
-200
-100
0
100
0 30 60 90 120 150 180 210 240
Age(day)
Aut
ogen
ous s
hrin
kage
(mic
rost
rain
)
SF=0SF=5%SF=10%SF=15%
Figure 4.47 Effect of SF on the autogenous shrinkage of concrete up to 240 days
(w/b=0.35, 30 0C)
-600
-500
-400
-300
-200
-100
0
100
0 30 60 90 120 150 180 210 240
Age(day)
Aut
ogen
ous s
hrin
kage
(mic
rost
rain
)
SF=0SF=5%SF=10%SF=15%
Figure 4.48 Effect of SF on the autogenous shrinkage of concrete up to 240
days (w/b=0.45, 30 0C)

Chapter 4 Results and Discussion
120
-120
-90
-60
-30
00 4 8 12 16 20 24
Age (hour)
Aut
ogen
ous s
hrin
kage
(mic
rost
rain
)
30C
20C
Figure 4.49 Effect of temperature on the autogenous shrinkage of concrete within
the first 24 hour (w/b=0.35, SF=0)
-120
-100
-80
-60
-40
-20
00 4 8 12 16 20 24
Age (hour)
Aut
ogen
ous s
hrin
kage
(mic
rost
rain
)
30C
20C
Figure 4.50 Effect of temperature on the autogenous shrinkage of concrete within
the first 24 hour (w/b=0.35, SF=10%)
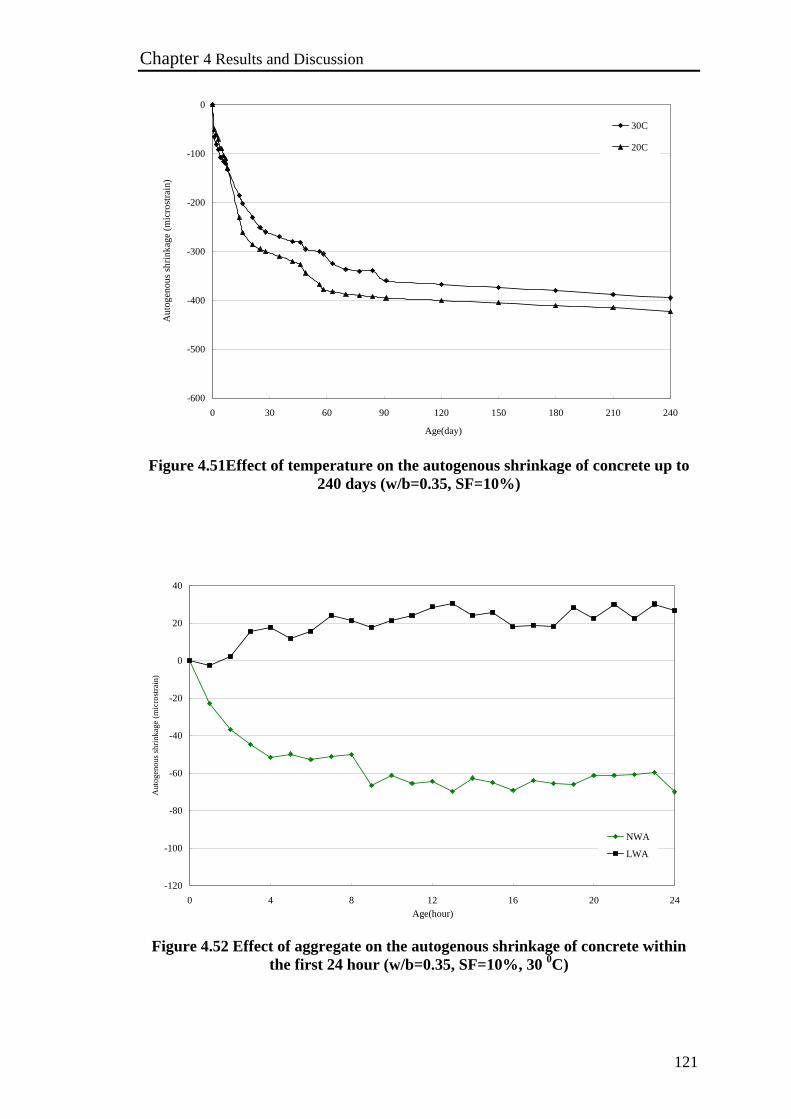
Chapter 4 Results and Discussion
121
-600
-500
-400
-300
-200
-100
0
0 30 60 90 120 150 180 210 240
Age(day)
Aut
ogen
ous s
hrin
kage
(mic
rost
rain
)
30C
20C
Figure 4.51Effect of temperature on the autogenous shrinkage of concrete up to
240 days (w/b=0.35, SF=10%)
-120
-100
-80
-60
-40
-20
0
20
40
0 4 8 12 16 20 24Age(hour)
Aut
ogen
ous s
hrin
kage
(mic
rost
rain
)
NWA
LWA
Figure 4.52 Effect of aggregate on the autogenous shrinkage of concrete within
the first 24 hour (w/b=0.35, SF=10%, 30 0C)

Chapter 4 Results and Discussion
122
-120
-90
-60
-30
0
30
0 4 8 12 16 20 24
Age(hour)
Aut
ogen
ous s
hrin
kage
(mic
rost
rain
)
NWA
LWA
Figure 4.53 Effect of aggregate on the autogenous shrinkage of concrete within
the first 24 hour (w/b=0.35, SF=0, 30 0C)
-600
-500
-400
-300
-200
-100
0
0 30 60 90 120 150 180 210 240
Age (day)
Aut
ogen
ous s
hrin
kage
(mic
rost
rain
)
LWA
NWA
Figure 4.54 Effect of aggregate on the autogenous shrinkage of concrete up to 240
days (w/b=0.35, SF=0)

Chapter 4 Results and Discussion
123
-600
-500
-400
-300
-200
-100
0
0 30 60 90 120 150 180 210 240Age (day)
Aut
ogen
ous s
hrin
kage
(mic
rost
rain
)
LWA
NWA
Figure 4.55 Effect of aggregate on the autogenous shrinkage of concrete up to 240
days (w/b=0.35, SF=10%)
-120
-100
-80
-60
-40
-20
0
20
40
0 4 8 12 16 20 24
Age(hour)
Aut
ogen
ous s
hrin
kage
(mic
rost
rain
)
0.5 h
24 h
Figure 4.56 Effect of aggregate presoak time on the autogenous shrinkage of
concrete within the first 24 hour (w/b=0.35, SF=10%, 30 0C)
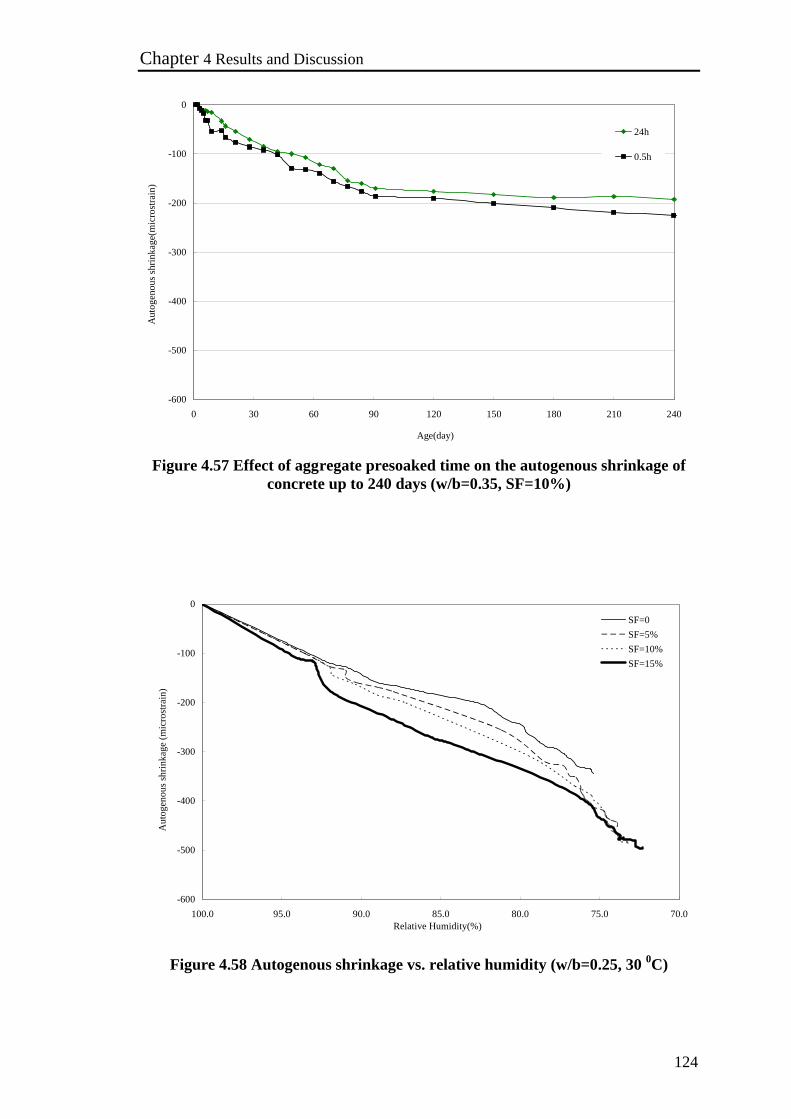
Chapter 4 Results and Discussion
124
-600
-500
-400
-300
-200
-100
0
0 30 60 90 120 150 180 210 240
Age(day)
Aut
ogen
ous s
hrin
kage
(mic
rost
rain
)
24h
0.5h
Figure 4.57 Effect of aggregate presoaked time on the autogenous shrinkage of
concrete up to 240 days (w/b=0.35, SF=10%)
-600
-500
-400
-300
-200
-100
0
70.075.080.085.090.095.0100.0Relative Humidity(%)
Aut
ogen
ous s
hrin
kage
(mic
rost
rain
)
SF=0SF=5%SF=10%SF=15%
Figure 4.58 Autogenous shrinkage vs. relative humidity (w/b=0.25, 30 0C)

Chapter 4 Results and Discussion
125
-500
-400
-300
-200
-100
0
70.075.080.085.090.095.0100.0
Relative Humidity(%)
Aut
ogen
ous s
hrin
kage
(mic
rost
rain
)
SF=0
SF=5%
SF=10%
SF=15%
Figure 4.59 Autogenous shrinkage vs. relative humidity (w/b=0.35, 30 0C)
-500
-400
-300
-200
-100
0
70.075.080.085.090.095.0100.0Relative Humidity(%)
Aut
ogen
ous s
hrin
kage
(mic
rost
rain
)
SF=0SF=5%SF=10%SF=15%
Figure 4.60 Autogenous shrinkage vs. relative humidity (w/b=0.45, 30 0C)

Chapter 4 Results and Discussion
126
-500
-400
-300
-200
-100
0
70.075.080.085.090.095.0100.0
Relative Humidity(%)
Aut
ogen
ous s
hrin
kage
(mic
rost
rain
)
N35
L35
Figure 4.61 Aggregate type on AS- RH curve (w/b=0.35, SF=0)
-500
-400
-300
-200
-100
0
707580859095100
Relative Humidity(%)
Aut
ogen
ous s
hrin
kage
(mic
rost
rain
)
S35-10
L35-10
Figure 4.62 Aggregate type on AS- RH curve (w/b=0.35, SF=10%)

Chapter 4 Results and Discussion
127
-700
-600
-500
-400
-300
-200
-100
0
100
0 30 60 90 120 150 180 210 240
Age (day)
Dry
ing
shrin
kage
(mic
rost
rain
)
w/b=0.25
w/b=0.35
w/b=0.45
Figure 4.63 Effect of w/b on the drying shrinkage (SF=0, 30 0C)
-700
-600
-500
-400
-300
-200
-100
0
100
0 30 60 90 120 150 180 210 240
Age (day)
Dry
ing
shrin
kage
(mic
rost
rain
)
w/b=0.25
w/b=0.35
w/b=0.45
Figure 4.64 Effect of w/b on the drying shrinkage (SF=5%, 30 0C)

Chapter 4 Results and Discussion
128
-700
-600
-500
-400
-300
-200
-100
0
100
0 30 60 90 120 150 180 210 240Age(day)
Dry
ing
shrin
kage
(mic
rost
rain
)
w/b=0.25
w/b=0.35
w/b=0.45
Figure 4.65 Effect of w/b on the drying shrinkage (SF=10%, 30 0C)
-700
-600
-500
-400
-300
-200
-100
0
100
0 30 60 90 120 150 180 210 240Age(day)
Dry
ing
shrin
kage
(mic
rost
rain
)
w/b=0.25
w/b=0.35
w/b=0.45
Figure 4.66 Effect of w/b on the drying shrinkage (SF=15%, 30 0C)
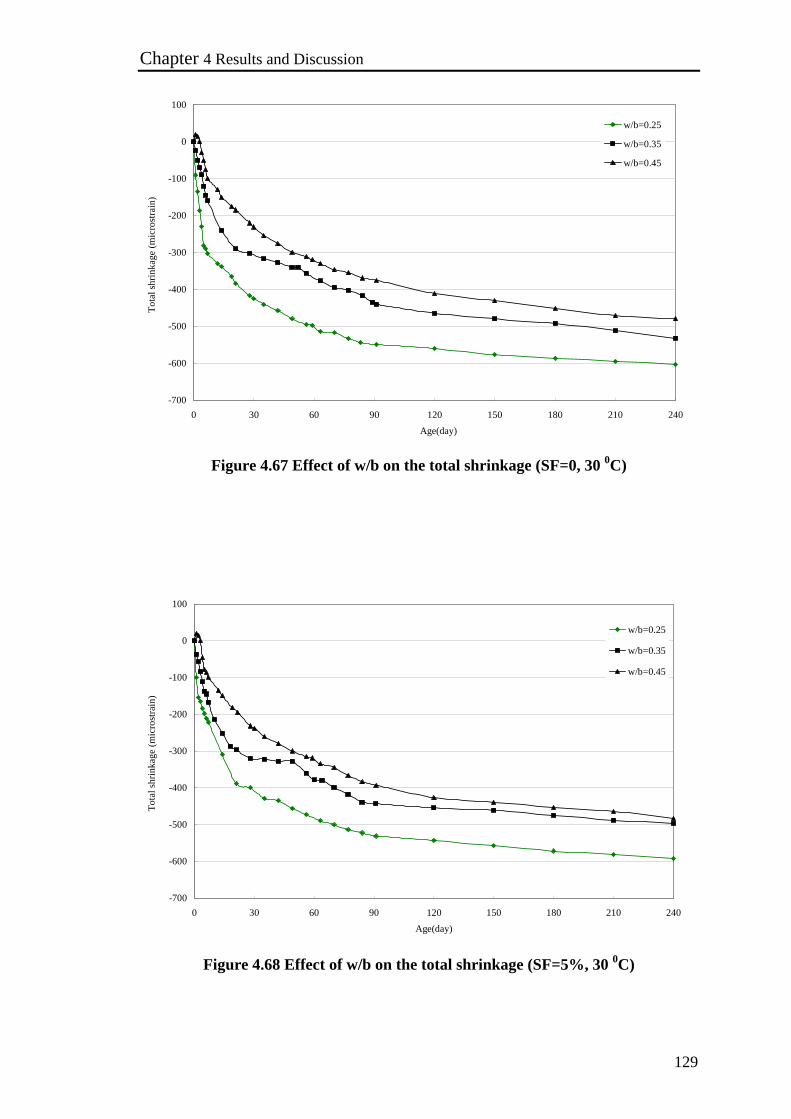
Chapter 4 Results and Discussion
129
-700
-600
-500
-400
-300
-200
-100
0
100
0 30 60 90 120 150 180 210 240Age(day)
Tota
l shr
inka
ge (m
icro
stra
in)
w/b=0.25
w/b=0.35
w/b=0.45
Figure 4.67 Effect of w/b on the total shrinkage (SF=0, 30 0C)
-700
-600
-500
-400
-300
-200
-100
0
100
0 30 60 90 120 150 180 210 240Age(day)
Tota
l shr
inka
ge (m
icro
stra
in)
w/b=0.25
w/b=0.35
w/b=0.45
Figure 4.68 Effect of w/b on the total shrinkage (SF=5%, 30 0C)

Chapter 4 Results and Discussion
130
-700
-600
-500
-400
-300
-200
-100
0
100
0 30 60 90 120 150 180 210 240
Age(day)
Tota
l shr
inka
ge (m
icro
stra
in)
w/b=0.25
w/b=0.35
w/b=0.45
Figure 4.69 Effect of w/b on the total shrinkage (SF=10%, 30 0C)
-700
-600
-500
-400
-300
-200
-100
0
100
0 30 60 90 120 150 180 210 240
Age(day)
Tota
l shr
inka
ge (m
icro
stra
in)
w/b=0.25
w/b=0.35
w/b=0.45
Figure 4.70 Effect of w/b on the total shrinkage (SF=15%, 30 0C)

Chapter 4 Results and Discussion
131
-600
-500
-400
-300
-200
-100
0
0 7 14 21 28 35 42 49 56 63 70 77 84 91Age(day)
Dry
ing
shrin
kage
(mic
rost
rain
)
SF=0SF=5%SF=10%SF=15%
Figure 4.71 Effect of SF on the drying shrinkage (w/b =0.25, 30 0C)
-600
-500
-400
-300
-200
-100
0
0 30 60 90 120 150 180 210 240
Age(day)
Dry
ing
shrin
kage
(mic
rost
rain
)
SF=0SF=5%SF=10%SF=15%
Figure 4.72 Effect of SF on the drying shrinkage (w/b =0.35, 30 0C)

Chapter 4 Results and Discussion
132
-600
-500
-400
-300
-200
-100
0
0 30 60 90 120 150 180 210 240Age(day)
Dry
ing
shrin
kage
(mic
rost
rain
)
SF=0SF=5%SF=10%SF=15%
Figure 4.73 Effect of SF on the drying shrinkage (w/b =0.45, 30 0C)
-700
-600
-500
-400
-300
-200
-100
0
0 30 60 90 120 150 180 210 240
Age (day)
Tota
l shr
inka
ge (m
icro
stra
in)
SF=0SF=5%SF=10%SF=15%
Figure 4.74 Effect of SF on the total shrinkage (w/b =0.25, 30 0C)

Chapter 4 Results and Discussion
133
-700
-600
-500
-400
-300
-200
-100
0
100
0 30 60 90 120 150 180 210 240
Age(day)
Tota
l shr
inka
ge (m
icro
stra
in)
SF=0SF=5%SF=10%SF=15%
Figure 4.75 Effect of SF on the total shrinkage (W/B=0.35, 30 0C)
-600
-500
-400
-300
-200
-100
0
100
0 30 60 90 120 150 180 210 240Age(day)
Tota
l shr
inka
ge (m
icro
stra
in)
SF=0SF=5%SF=10%SF=15%
Figure 4.76 Effect of SF on the total shrinkage (w/b=0.45, 30 0C)

Chapter 4 Results and Discussion
134
-600
-500
-400
-300
-200
-100
0
0 30 60 90 120 150 180 210 240
Age(day)
Tota
l shr
inka
ge (m
icro
stra
in)
20C
30C
Figure 4.77 Effect of temperature on the total shrinkage (w/b =0.35, SF=10%)
-300
-200
-100
0
100
0 30 60 90 120 150 180 210 240
Age(day)
Dry
ing
shrin
kage
(mic
rost
rain
)
20C
30C
Figure 4.78 Effect of temperature on the drying shrinkage (w/b =0.35, SF=10%)

Chapter 4 Results and Discussion
135
-600
-500
-400
-300
-200
-100
00 30 60 90 120 150 180 210 240
Age(day)
Dry
ing
shrin
kage
(mic
rost
rain
)LWA
NWA
Figure 4.79 Effect of LWA on the drying shrinkage (w/b =0.35, SF=0, 30 0C)
-600
-500
-400
-300
-200
-100
0
0 30 60 90 120 150 180 210 240Age(day)
Dry
ing
shrin
kage
(mic
rost
rain
)
LWA
NWA
Figure 4.80 Effect of LWA on the drying shrinkage (w/b =0.35, SF=10%, 30 0C)

Chapter 4 Results and Discussion
136
-600
-500
-400
-300
-200
-100
0
0 30 60 90 120 150 180 210 240
Age(day)
Tota
l shr
inka
ge (m
icro
stra
in)
LWA
NWA
Figure 4.81 Effect of LWA on the total shrinkage (w/b =0.35, SF=0, 30 0C)
-600
-500
-400
-300
-200
-100
0
0 30 60 90 120 150 180 210 240Age(day)
Tota
l shr
inka
ge (m
icro
stra
in)
LWA
NWA
Figure 4.82 Effect of LWA on the total shrinkage (W/B=0.35, SF=10%, 30 0C)
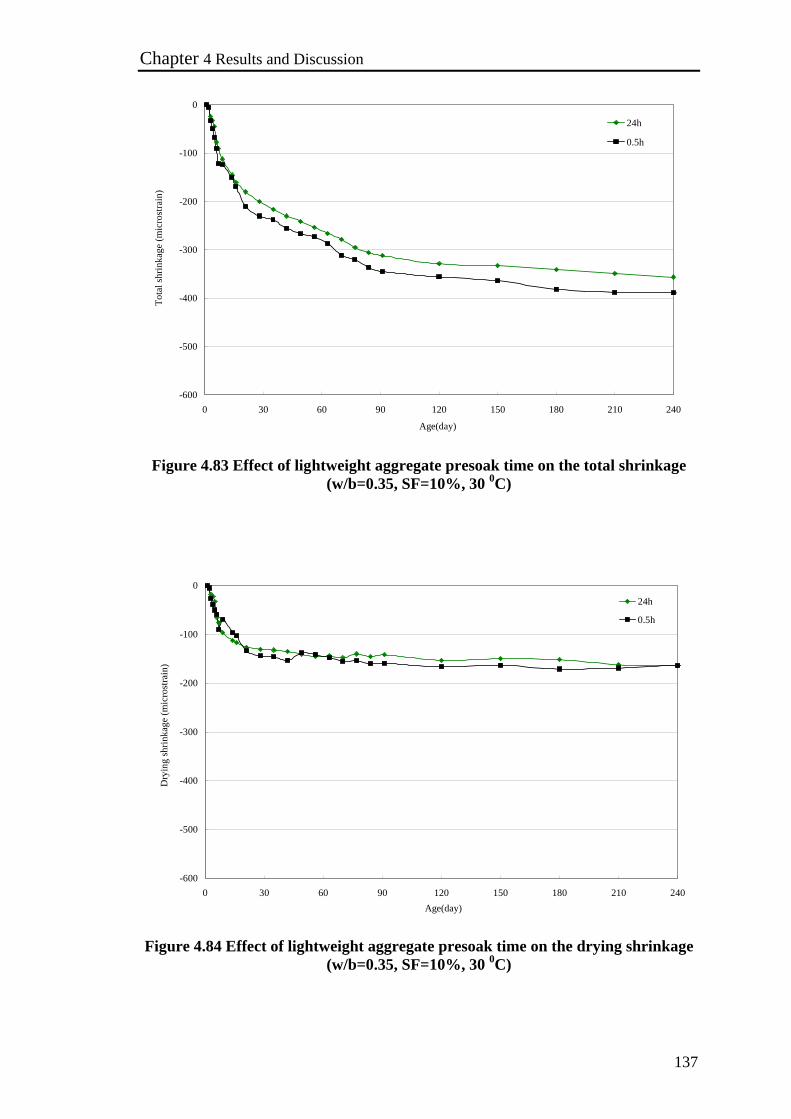
Chapter 4 Results and Discussion
137
-600
-500
-400
-300
-200
-100
0
0 30 60 90 120 150 180 210 240
Age(day)
Tota
l shr
inka
ge (m
icro
stra
in)
24h
0.5h
Figure 4.83 Effect of lightweight aggregate presoak time on the total shrinkage
(w/b=0.35, SF=10%, 30 0C)
-600
-500
-400
-300
-200
-100
0
0 30 60 90 120 150 180 210 240Age(day)
Dry
ing
shrin
kage
(mic
rost
rain
)
24h
0.5h
Figure 4.84 Effect of lightweight aggregate presoak time on the drying shrinkage
(w/b=0.35, SF=10%, 30 0C)
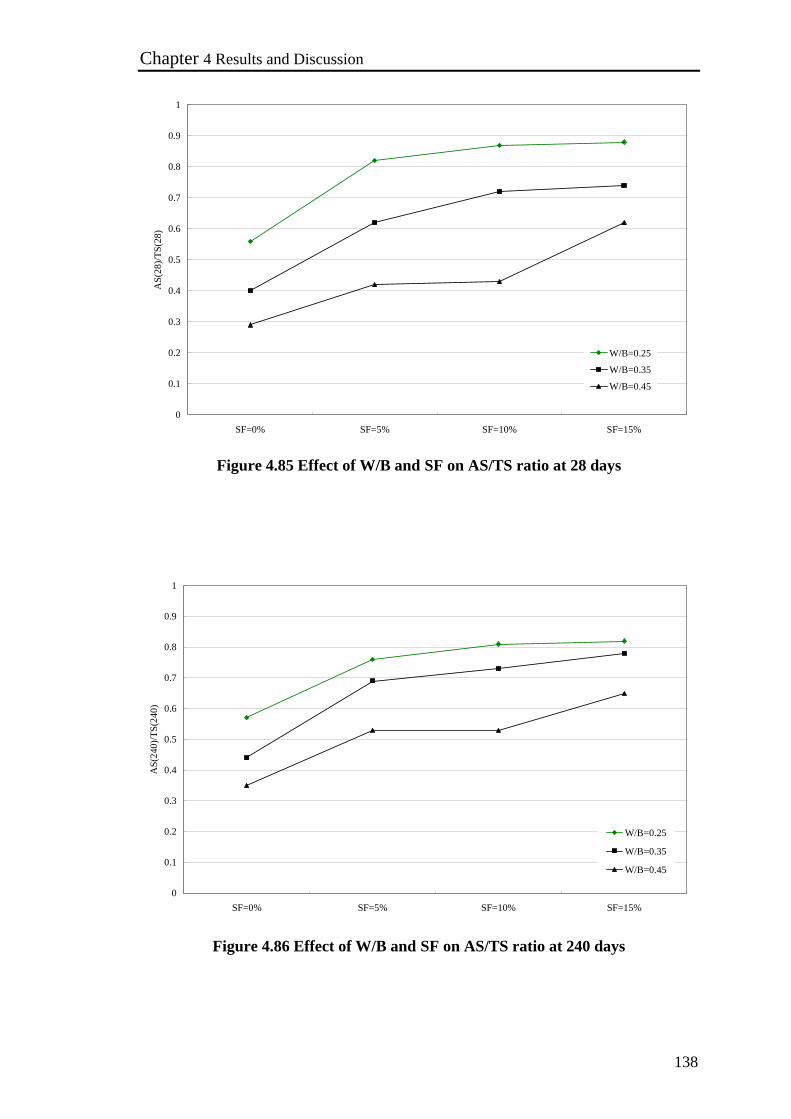
Chapter 4 Results and Discussion
138
0
0.1
0.2
0.3
0.4
0.5
0.6
0.7
0.8
0.9
1
SF=0% SF=5% SF=10% SF=15%
AS(
28)/T
S(28
)
W/B=0.25
W/B=0.35
W/B=0.45
Figure 4.85 Effect of W/B and SF on AS/TS ratio at 28 days
0
0.1
0.2
0.3
0.4
0.5
0.6
0.7
0.8
0.9
1
SF=0% SF=5% SF=10% SF=15%
AS(
240)
/TS(
240)
W/B=0.25
W/B=0.35
W/B=0.45
Figure 4.86 Effect of W/B and SF on AS/TS ratio at 240 days

Chapter 4 Results and Discussion
139
Figure 4.87 Estimation of potential cracking of concrete (w/b =0.25, SF=0, 30 0C, sealed)
Figure 4.88 Estimation of potential cracking of concrete (w/b =0.25, SF=0, 30 0C, air dry)
0
5
10
15
20
25
0 7 14 21 28 35 42 49 56 63 70 77 84 91
Age (day)
Stre
ss o
r Stre
ngth
(MPa
)
tensile strength
tensile stress
0
5
10
15
20
25
0 7 14 21 28 35 42 49 56 63 70 77 84 91
Age (day)
Stre
ss o
r Stre
ngth
(MPa
)
tensilestrengthtensile stress

Chapter 4 Results and Discussion
140
Figure 4.89 Estimation of potential cracking of concrete (w/b =0.25, SF=10%, 30 0C, sealed)
Figure 4.90 Estimation of potential cracking of concrete (w/b =0.25, SF=10%, 30 0C, air dry)
0
5
10
15
20
25
0 7 14 21 28 35 42 49 56 63 70 77 84 91
Age (day)
Stre
ss o
r Stre
ngth
(MPa
)
tencilestrengthtensile stress
0
5
10
15
20
25
0 7 14 21 28 35 42 49 56 63 70 77 84 91
Age (day)
Stre
ss o
r Stre
ngth
(MPa
)
tencile strength
tensile stress
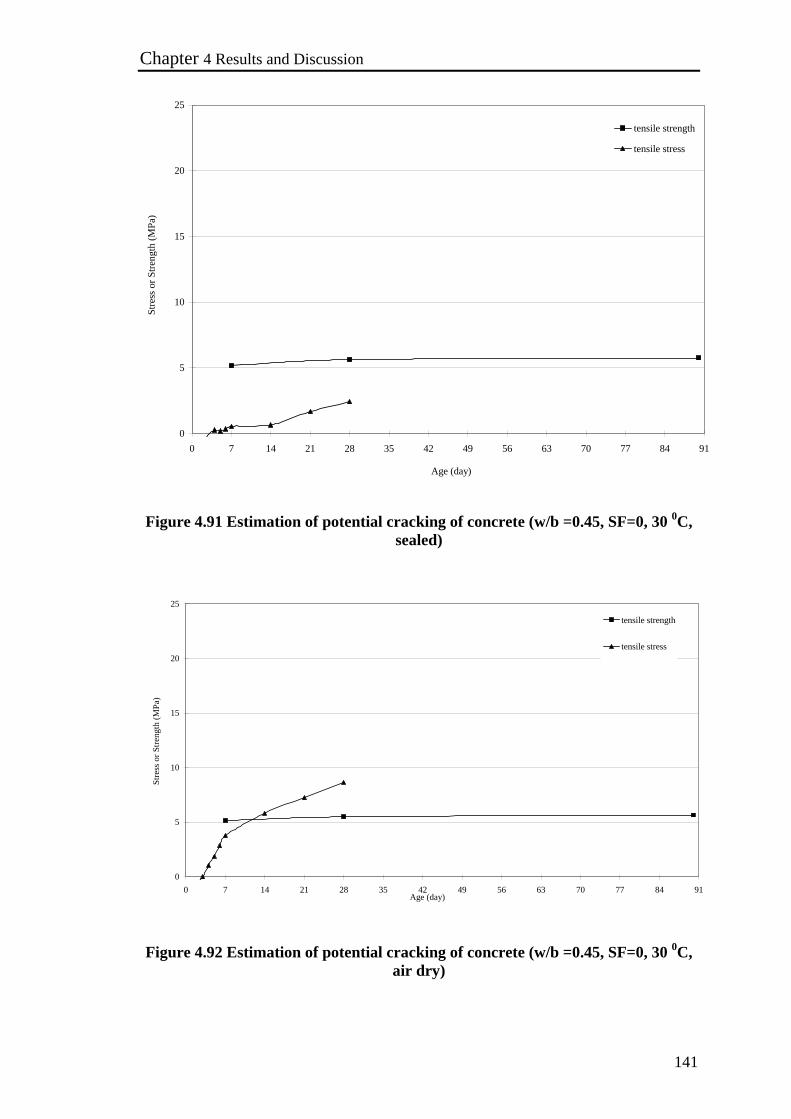
Chapter 4 Results and Discussion
141
Figure 4.91 Estimation of potential cracking of concrete (w/b =0.45, SF=0, 30 0C, sealed)
Figure 4.92 Estimation of potential cracking of concrete (w/b =0.45, SF=0, 30 0C, air dry)
0
5
10
15
20
25
0 7 14 21 28 35 42 49 56 63 70 77 84 91
Age (day)
Stre
ss o
r Stre
ngth
(MPa
)
tensile strength
tensile stress
0
5
10
15
20
25
0 7 14 21 28 35 42 49 56 63 70 77 84 91Age (day)
Stre
ss o
r Stre
ngth
(MPa
)
tensile strength
tensile stress
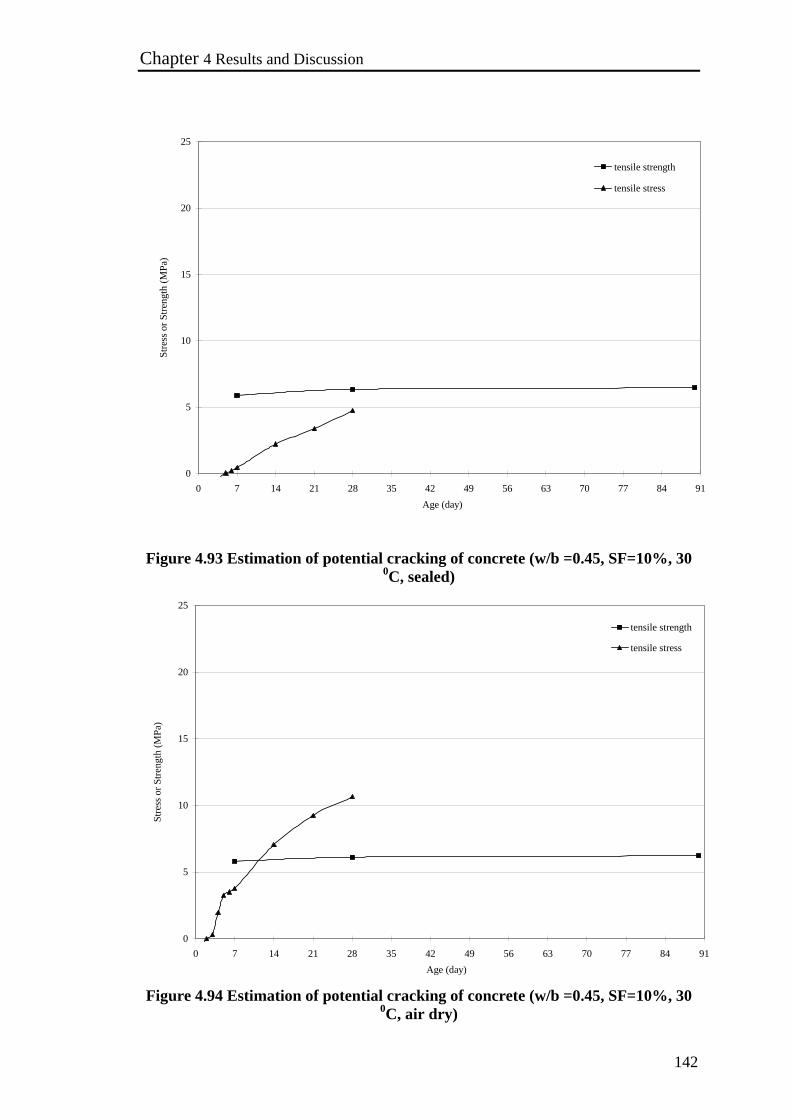
Chapter 4 Results and Discussion
142
Figure 4.93 Estimation of potential cracking of concrete (w/b =0.45, SF=10%, 30 0C, sealed)
Figure 4.94 Estimation of potential cracking of concrete (w/b =0.45, SF=10%, 30 0C, air dry)
0
5
10
15
20
25
0 7 14 21 28 35 42 49 56 63 70 77 84 91Age (day)
Stre
ss o
r Stre
ngth
(MPa
)tensile strength
tensile stress
0
5
10
15
20
25
0 7 14 21 28 35 42 49 56 63 70 77 84 91Age (day)
Stre
ss o
r Stre
ngth
(MPa
)
tensile strength
tensile stress
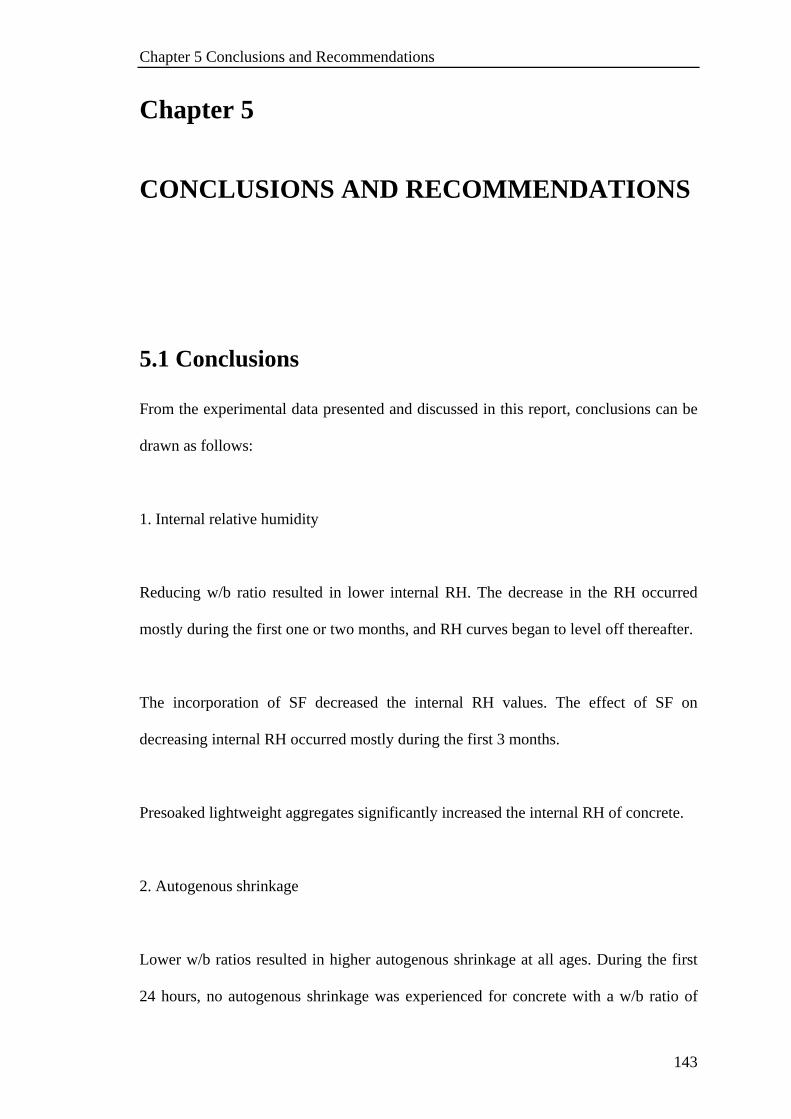
Chapter 5 Conclusions and Recommendations
143
Chapter 5
CONCLUSIONS AND RECOMMENDATIONS
5.1 Conclusions
From the experimental data presented and discussed in this report, conclusions can be
drawn as follows:
1. Internal relative humidity
Reducing w/b ratio resulted in lower internal RH. The decrease in the RH occurred
mostly during the first one or two months, and RH curves began to level off thereafter.
The incorporation of SF decreased the internal RH values. The effect of SF on
decreasing internal RH occurred mostly during the first 3 months.
Presoaked lightweight aggregates significantly increased the internal RH of concrete.
2. Autogenous shrinkage
Lower w/b ratios resulted in higher autogenous shrinkage at all ages. During the first
24 hours, no autogenous shrinkage was experienced for concrete with a w/b ratio of

Chapter 5 Conclusions and Recommendations
144
0.45. At lower w/b ratio, a higher proportion of the total autogenous shrinkage at 240
days occurred before 28 days.
At the age of 1-day, higher autogenous shrinkage values were obtained for concrete
with higher SF replacement levels. The effect of SF on 1 day autogenous shrinkage
was more pronounced in concrete with w/b ratios of 0.25 and 0.35 than in concrete
with a w/b ratio of 0.45.
Concrete with higher SF content showed earlier and faster development of autogenous
shrinkage. At the age of 240 day, higher SF content resulted in higher autogenous
shrinkage values. A higher proportion of the total 240 day autogenous shrinkage was
reached during the first 28 days in SF modified concrete than in OPC. The effect of SF
on the 240 day autogenous shrinkage was more significant in concretes with a w/b
ratio of 0.35 than of 0.25 or 0.45.
During the first 24 hours, increasing the curing temperature from 20 to 30 oC did not
have a significant effect on the autogenous shrinkage of concrete without SF, whereas
it increased the autogenous shrinkage of concrete with SF slightly. The higher
temperature (30 0C) resulted in higher 7 days autogenous shrinkage of concrete than in
the case of lower temperature (20 0C), but the differences at 240 day were not
noticeable.
Light-weight aggregate had significant effect of reducing the autogenous shrinkage of
concrete. The effect was more significant in SF modified lightweight concrete than in
control Portland cement concrete.

Chapter 5 Conclusions and Recommendations
145
The water-to-binder ratio, SF replacement level, and use of lightweight aggregates
affect the autogenous shrinkage through two fundamental parameters -- internal RH
(indicator of self-desiccation) and pore structure (by Kelvin equation). For concrete
with lower w/b ratio and higher SF level, autogenous shrinkage increased due to a
decrease in RH and a more refined pore structure. For lightweight aggregate concrete,
autogenous shrinkage decreased due primarily to an increase in internal RH.
3. Drying shrinkage and total shrinkage of concrete exposed to dry environment
Concretes with lower w/b ratios had lower drying shrinkage and slightly higher total
shrinkage. This effect is more obvious in SF concretes than in OPC concrete.
Concrete with higher SF content had lower drying shrinkage. For the concrete with
w/b ratios of 0.25 and 0.45, the total shrinkage seemed to be unaffected by the SF
content compared with control concrete. For concrete with a w/b ratio of 0.35, the
incorporation of SF reduced the total shrinkage.
Change of curing temperature from 20 to 300C did not significantly influence the total
and drying shrinkage.
Concretes with lightweight aggregate had lower total shrinkage than normal weight
concrete. But the drying shrinkage was similar.
Chapter 5 Conclusions and Recommendations
146
Increasing presoak time from 0.5 to 24 hours did not affect the autogenous, total and
drying shrinkage considerably. This may due to the lightweight aggregate has high
initial moisture content which may cause no significant effect of presoak time on
shrinkage data.
4. Relationship between autogenous, drying and total shrinkage
The relationship between autogenous and total shrinkage was significantly affected by
the w/b ratio and SF content. At a higher w/b ratio of 0.45, the autogenous shrinkage
was much smaller than the total shrinkage. However, at lower w/b ratios of 0.35 and
0.25, autogenous shrinkage values were closer to the total shrinkage values and the
drying shrinkage was smaller.
A larger part of the total shrinkage of dried specimens was attributed to the autogenous
shrinkage as the SF content was increased. For concrete with a w/b ratio of 0.25 and
15% SF, 82% of the total shrinkage at 240 days was due to the autogenous shrinkage,
whereas for concrete with a w/b ratio of 0.45 and without SF, only 32% of the total
shrinkage at 240 days was due to the autogenous shrinkage.
In concrete with a low w/b ratio of 0.25, autogenous shrinkage contribute a larger
proportion of the total shrinkage at 28 day compared with that at 240 days. However,
in the concrete with higher w/b ratios of 0.35 and 0.45, autogenous shrinkage
constitute a smaller proportion of the total shrinkage at 28 day than 240 day.
5. Risk of shrinkage cracking
Chapter 5 Conclusions and Recommendations
147
Concrete with lower w/b ratios and higher SF content may have a higher risk of
shrinkage cracking.
A summary of the effect of different parameters on concrete properties is shown in
Table 5.1.
5.2 Recommendations
To test the hypothesis that at a SF content of 15 %, the pores structure was
substantially unaffected as the w/b ratio was increased from 0.25 to 0.35, it is
recommended that the pore structure of the cement pastes with SF replacement level at
15%, be measured to confirm this.
Another hypothesis is that for concrete with low w/b ratios (0.25 and 0.35), 5% SF
may be sufficient to reduce permeability. Further increasing in the SF content did not
seem to help in decreasing the water loss as there is not enough water to facilitate
pozzonlanic reaction when higher SF contents are concerned. Standard permeability
test is suggested to confirm this.

Chapter 5 Conclusions and Recommendations
148
Table 5.1 Summaries of Effects of Parameters on Concrete Properties
Internal RH Autogenous
Shrinkage Drying
Shrinkage Total
Shrinkage
Risk of Shrinkage
Crack Increased Parameters
w/c ratio from 0.25 to 0.45 I D I5 D5 D
SF level from 0 to 15% D1 I2 D N4 I
Temperature from 20 to 30 0C N N3 N N N
Lightweight Aggregate (from NWA to LWA) I D5 N D D
Presoak Time of LWA 0.5 to 24 hours 6 N N N N N
I =Increase D = Decrease N = No apparent effect Notes: 1: RH decreased mostly in first 90 days. 2: Also showed earlier and faster autogenous shrinkage; more significant in 0.35 than in 0.25 and 45 w/b ratios. 3:Higher temperature increased earlier (7 day) age autogenous shrinkage. 4: For 0.35 w/b ratio concrete, total shrinkage decreased. 5: More obvious in SF modified concrete. 6: Lightweight aggregate has high initial moisture content which may cause no effect of presoak time.
Reference
149
REFERENCES
Aitcin, P. C., (1999), “Autogenous shrinkage measurement,” Proceedings of
International Workshop on Autogenous Shrinkage of Concrete, Japan Concrete
Institute, pp. 245-257.
Aitcin, P. C., (1999b), “ Does Concrete Shrink or Does it Swell?,” Concrete
International, pp. 77-80.
Al-Sugair, S. H., (1995), “Analysis of the time-dependent volume reduction of
concrete containing silica fume,” Magazine of Concrete Research, Vol. 47, No. 170,
pp.77-81.
Baroghel-Bouny, V., and Kheirbek, A., (2000), “Effect of mix-parameters on
autogenous deformations of cement pastes-microstructural interpretations,”
International RILEM Workshop on Shrinkage of Concrete, Paris, France, pp. 115-143.
Bentur, A., Igarashi., S., and Kovler. K. (2001) “Prevention of autogenous shrinkage in
high-strength concrete by internal curing using wet lightweight aggregates,” Cement
and Concrete Research, Vol. 31, pp. 1587-1591.
Brooks, J. J., (1989). “Influence of mix proportions, plasticizers and superplasticizer
on creep and drying shrinkage of concrete,” Magazine of Concrete Research, 41, No.
148, pp. 145-154.

Reference
150
Brooks, J. J., and Hynes, J. P.,(1993) “Creep and Shrinkage of Ultra High-Strength
Silica Fume Concrete”, The 5th International Symposium on Creep and Shrinkage of
Concrete, E&FN Spon, London, pp. 493-498.
Cabrera, J. G., and Lee., R. E., (1985), “A new method for the measurement of
workability of high pulverized fuel ash concrete,” Proceedings of the International Ash
Utilization Symposium, Vol. 1, pp. 347-360.
Davis, H. E., (1940), “Autogenous Volume Change of Concrete,” Proceeding of the
43rd Annual American Society for Testing Materials, Atlantic city, USA, pp. 1103-
1113.
Defay, R., Prigogine, I., Bellemans, A., Everett, D.H., (1966), “Surface Tension and
Adsorption”, John Wiley and Sons, Inc., NY.
De Larrard, F., (1999), “Concrete constituents: Relevant parameters,” Concrete
Mixture Proportioning, E&FN Spon, London, pp. 234-238.
Diamond. S. (1998), “Concrete Porosity Revisited”, Materials Science of Concrete –
The Sidney Diamond Symposium, The American Ceramic Society, pp. 3-23.
Holt, E. E., and Leivo, M. T. (1999), “Autogenous shrinkage at very early ages,”
Proceedings of International Workshop on Autogenous Shrinkage of Concrete, Japan
Concrete Institute, pp. 133-141.
Reference
151
Hooton, R. D., Sato, J. A., and Mukherjee, P. K., (1992), “A new method for assessing
frost damage in non-air entrained hydralic structure,” ACI-131 G M Idorn
International Symposium-Durability of Concrete, Vol.1, pp. 338-357.
Hua, C., Acker, P., and Erlacher, A., (1995), “Analyses and models of the autogenous
shrinkage of hardening cement paste: 1 modeling at macroscopic scale,” Cement and
Concrete Research, Vol.25, No.7, pp. 1457-1468.
Igarashi, S., Bentur, A., and Kovler, K., (1999), “Stresses and creep relaxation induced
in restrained autogenous shrinkage of high strength pastes and concretes,” Advances in
Cement Research, Vol. 11, No. 4, pp. 169-177.
IUPAC, (1972), “Manual of symbols and terminology,” appendix 2, part 1, Colloid
and Surface Chemistry, Journal of Pure Applied Chemistry, pp. 577- 578.
Japan Concrete Institute (1996), “Technical Committee Report on Autogenous
Shrinkage of Concrete,” pp. 121-122.
Jensen, O. M., and Hansen, P. F., (1995), “A dilatometer for measuring autogenous
deformation in hardening Portland cement paste,” Materials and Structures, pp. 406-
409.
Jensen, O. M., and Hansen, P. F., (1996), “ Autogenous deformation and change of the
relative humidity in silica fume modified cement paste, ACI Materials Journal, Vol. 93,
No.6, pp. 539-543.
Reference
152
Justnes, H., Van Gement, A., Verboven, F., and Sellevold, E. J., (1996), “Total and
external chemical shrinkage of low water/cement ratio cement pastes,” Advanced in
Cement Research, Vol. 8, No. 31, pp. 121-126.
Keene, P. W., (1960), “The effect of air-entrainment on the shrinkage of concrete
stored in laboratory air,” Cement and Concrete Association Technical Report TRA/331,
London.
Lim, S. N., (2001), “Shrinkage of High Performance Concrete,” Master Thesis, The
National University of Singapore. pp. 1-20.
Loukili, A., Khelidj, A., and Richard, P., (1999), “Hydration kinetics, change of
relative humidity, and autogenous shrinkage of ultra-high strength concrete,” Cement
and Concrete Research, Vol. 29, pp. 577-584.
Luther, M. D., and Hansen, W., (1989), “Comparison of creep and shrinkage of high-
strength silica fume concretes with fly ash concrete of similar strength,” Fly ash, silica
fume, slag and natural pozzolans in concrete, ACI, SP 114, Vol. 1, pp. 573-591.
Lyman, C. G., (1934), “Growth and Movement in Portland Cement Concrete,” Oxford
University Press, London, pp. 1-139.
Mindess. S, Yong. J. F., and Darwin. D., (2003), “Concrete,” Prentice Hall, Upper
Saddle River, NJ, pp. 318-319.
Reference
153
Morioka, M., Hori, A., Hagiwara, H., and Daimon, M., (1999), “Measurements of
Autogenous Length Changes by Laser Sensors Equipped with digital computer
system,” Proceedings of International Workshop on Autogenous Shrinkage of
Concrete, Japan Concrete Institute, pp. 193-201.
Neville, A. M., (1995), “Properties of Concrete,” Longman House, England, pp. 429.
Persson, B., (1996) “(Early) Basic Creep of High-Performance Concrete,” 4th
International Symposium on the Utilization of High-Performance Concrete, Paris, pp.
405-414.
Persson, B., (1996) “Hydration and strength of high performance concrete,” Advanced
Cement Based Materials, Vol. 3, pp. 107-123.
Persson, B., (1997) “Self-desiccation and its importance in concrete technology,”
Materials and Structures, Vol. 30, June 1997, pp. 293-305.
Persson, B., (1998) “ Pozzolanic Interaction between Portland Cement and Silica Fume
in Concrete,” Proceedings of the 6th CANMET/ACI International Conference on Fly
Ash, Silica Fume, Slag, and Natural Pozzolans in Concrete, Bangkok, Thailand, ACI
SP-178, Vol. 2, pp. 631-660.

Reference
154
Pistilli, M. F., Wintersteen, R., and Cechner, R., (1984) “The uniformity and influence
of silica fume on the properties of Portland cement concrete,” ASTM, Cement,
Concrete and Aggregates, Vol. 6, No.2, pp. 120-124.
Sellevold, E. J., (1988) “Condensed silica fume in concrete,” FIP state of art report,
Thomas Telford, London.
Swayze, M. A., (1960), “Discussion on: volume changes of concrete,” Proceedings of
4th international symposium on the chemistry of cement, Washington DC, pp. 700-702,
Takada, K, (1998), “Experimental evaluation of autogenous shrinkage of lightweight
aggregate concrete,” Proceedings of International Workshop on Autogenous Shrinkage
of Concrete, Japan Concrete Institute, pp. 221-230.
Tazawa, E., and Miyazawa, S., (1993), “Autogenous shrinkage of concrete and its
importance in concrete technology,” Proceedings of the 5th International RILEM
Symposium on Creep and Shrinkage of Concrete, Barcelona, Spain, pp. 159-168.
Tazawa, E., and Miyazawa, S., (1995), “Influence of cement and admixture on
autogenous shrinkage of cement paste,” Cement and Concrete Research, Vol. 25, No. 2,
pp. 288-292.

Reference
155
Tazawa, E., (1998), “Autogenous Shrinkage and Its Mechanism,” Proceedings of
International Workshop on Autogenous Shrinkage of Concrete, Japan Concrete
Institute, pp. 11-29.
Tazawa, E, and Miyazawa, S. (1999), “Effect of constituents and curing condition on
autogenous shrinkage of concrete,” Proceedings of International Workshop on
Autogenous Shrinkage of Concrete, Japan Concrete Institute, pp. 269-280.
Wittmann, F. H., (1968), “Surface tension shrinkage and strength of hardened cement
paste,” Materiaux et Constructions, Vol. 1, No. 6, pp. 547-552.
Young, J. F. (1988), “Physical mechanisms and their mathematical descriptions,”
Mathematical Modeling of Creep and Shrinkage of Concrete, Wiley, Chichester, pp.
63-98.