characterisation of coal and biomass mixture for co
TRANSCRIPT

CHARACTERISATION OF COAL AND BIOMASS
MIXTURE FOR CO-GASIFICATIONS
NUR FARAH BANIM BT RAIIMAT
Thesis submitted in partial fulfilment of the requirements for the award of the degree of
Bachelor of Chemical Engineering (Pure)
Faculty of Chemical & Natural Resources Engineering IJNIVERSITI MALAYSIA PAHANG
JULY 2014
©NUR FARAH HANIM BT RAHMAT (2014)

ABSTRACT
Biomass fuels can be produce by widely available raw materials which is come from
different sources and wide variety of forms. Co-gasification can reduce the cost of the
feedstock and reduce the problems that occur in plant-operation due to the production of
tar (Kumabe et al., 2006). For the pre-treatment of biomass, sample received were
relatively dry for 24h under sunlight having less than 10 wt% moisture and were in the
form of whole bunches. The EFB was manually chopped into small pieces. Then a
grinder was used to reduce the size. For first analysis, heating value of EFB was
determined by burning a weighed sample in an adiabatic oxygen-bomb calorimeter
(model Parr 1341, USA). The apparent density of the EFB samples was determined
using a gas pycnometer (model-. Micromeritics, AccuPyc II 1340) with helium as
purging gas. The percentages of carbon, hydrogen, nitrogen, sulfur and oxygen (by
difference) of the EFB sample were determined after complete combustion of the
sample using a CHNS/O Analyzer (model LECO TruSpec CUN, USA) following the
ASTM D-5291 method (Kezhong et al., 2009). The contents of moisture (dry basis),
volatile matter, fixed carbon and ash were determined using a thermogravimetric
analyzer (model Mettler Toledo, TGAISDTA85 1, USA).One of the main objectives of
this research is to----study- the-effect-on characteristic of mixture coal and biomass in co-
gasification and compare with coal gasification or biomass gasification itself. For higher
heating value, the average value is 24.5697 MJIkg. For apparent density of the mixture,
as percentage of biomass increase, the apparent density also increased but after 70%
biomass, the apparent--density starts-to reduced. For the proximate analysis, BO have 2
times greater weight loss compared to BlOO at the same temperature. For elemental
analysis, B100 contains 2 times greater oxygen compared to BO but have greater carbon
number compared to B100.Unlike coal, biomass with low ash and sulphur content, a
high volatile matter yield and- fixed carbon with high reactivity could potentially be
attractive from the economic, environmental and- -social points of view that poor coal.
Low density and low calorific value of biomass causes an increase in the cost of
transportation and storage, hence by co-gasification of biomass with coal is more
economical compared to biomass alone.
Keywords: Coal, Empty fruit bunch (EFB), co-gasification, B 100, BO
IIu

ABSTRAK
Bahan api biojisim boleh terhasil oleh bahan-bahan mentah yang boleh didapati secara
meluas yang dating dari pelbagai sumber dan bentuk yang berbeza. Ko-pengegasan
boleh mengurangkan kos bahan mentah dan mengurangkan masalah yang berlaku
dalam operasi kilang kerana pengeluaran tar (Kumabe et al., 2006). Pra-rawatan biomas,
sampel yang diterima perlu dikeringkan sehingga 24 jam di bawah cahaya matahari
sebingga mempunyai kurang daripada 10% berat kelembapan dan berada dalam bentuk
tandan keseluruhan. TBK secara manual dicincang kepada kepingan kecil.Kemudian
penggiling digunakan untuk mengurangkan saiz.Untuk analisis pertama, nilai
pemanasan TBK telah dihitung dengan pembakaran sampel ditimbang dalam adiabatik
kalorimeter -oksigen born (model Parr 1341, Arnerika Syarikat).Ketumpatan jelas
sampel TBK ditentukan-dengan menggunakan piknometer gas (model Microrneritics,
AccuPyc 111340) dengan helium sebagai penyingkiran gas. Peratusan karbon, hidrogen,
nitrogen, sulfur dan oksigen (oleh _perbezaan) sampel TBK ditentukan selepas
pembakaran lengkap sampel menggunakan CIINS / 0 Analyzer (model LECO TruSpec
CHN, Amerika Syarikat) berikut ASTM D-5291 kaedah ( Kezhong et al., 2009).
Kandungan kelembapan (kering), perkara yang tidak menentu, karbon tetap dan abu
ditentukan dengan penganalisis Termogravimetri (model Mettler Toledo,
TGA/SDTA85 1, Amerika Syarikat).Bagi nilai pemanasan yang lebih-tinggi, nilai purata
adalah 24.5697 MJ/kg.Kepadatan jelas campuran, sebagai peratusan peningkatan
biomass, ketumpatan ketara juga meningkat tetapi selepas 70% biojisim, ketumpatan
ketara mula dikurangkan. Untuk analisis proksimat, BO mempunyai 2 kaliLlebih besar
penurunan berat badan-berbanding B100 pada suhu yang sarna. Untuk analisis unsur,
B100 mengandungi 2 kali oksigen lebih besar berbanding dengan bilangan yang lebih
besar karbon BO tetapi mempunyai berbanding B 100. Tidak seperti arang batu, biornas
dengan abu yang rendah dan -kandungan sulfur, hasil perkara yang tidak menentu yang
tinggi dan karbontetap dengan kereaktifan tinggi berpotensi menjadi menarik dari mata
ekonomi, alam sekitar dan sosial berpendapat bahawa arang batu miskin. Ketumpatan
yang rendah dan nilai kalori yang rendah biomas menyebabkan peningkatan kos
pengangkutan dan penyimpanan. Oleh itu, pengegasan biomas bersama dengan arang
batu adalah lebih rnenjimatkan berbanding dengan biornas pengegasan sahaja.
Keywords: Arang, tandan buah kosong (TBK), ko-pengegasan, B 100, BO
ix

TABLES OF CONTENT
TABLES OF CONTENT
SUPERVISOR'S DECLARATIONS iv
STUDENT'S DECLARATIONS v
ACKNOWLEDGEMENT vii
ABSTRACT viii
ABSTRAK ix
TABLES OF CONTENT x
LIST OF FIGURES xii
LIST OF TABLES xiv
LIST OF ABBREVIATIONS xv
CHAPTER 1: INTRODUCTION 1
1.1 Background of study 1
1.2 Motivation and problem statement 6
1.3 Objective of the research 7
1.4 Scope of study 8
1.5 Chapter organisation 9
CHAPTER 2: LITERATURE REVIEW 10
2.1 Biomass collection 10
2.2 Biomass transportation 11
2.3 Pre-treatment of coal and biomass for co-gasification 11
2.3.1 Drying 12
2.3.2 Pelletisation 13
2.3.3 Torrefaction 15
2.4 Pyrolysis 16
2.5 Coal gasification 17
2.6 Biomass gasification 19
2.7 Co-gasification of coal & biomass 20
2.8 Gasifier type 21
2.8.1 Fluidized Bed Reactor 21
x

2.8.2 Fixed bed Reactor 22
2.9 Effect on biomass ratio and energy utilization efficiency 23
2.10 Carbon conversion 25
2.11 Effect of feedstock particle size on product yields 25
2.12 Gas cleaning 26
2.12.1 Physical gas cleaning method 27
2.13 Determination of fiber density by pycnometer method 28
3.0 METHODOLOGY 30
3.1 Materials and Feedstock preparation 30'
3.2 Proximate Analysis 37
3.3 Ultimate Analysis 39
3.4 Higher heating value 42
3.5 Apparent Density 45
4.0 RESULTS & DISCUSSION 48
4.1 Overview 48
4.2 Proximate Analysis 48
4.3 Ultimate Analysis ST
4.4 Apparent density 53
4.5 Higher heating value 54
5.0 CONCLUSIONS 56
5.1 Overview 56
5.2 Conclusion
REFERENCES 58
APPENDICES 67
A
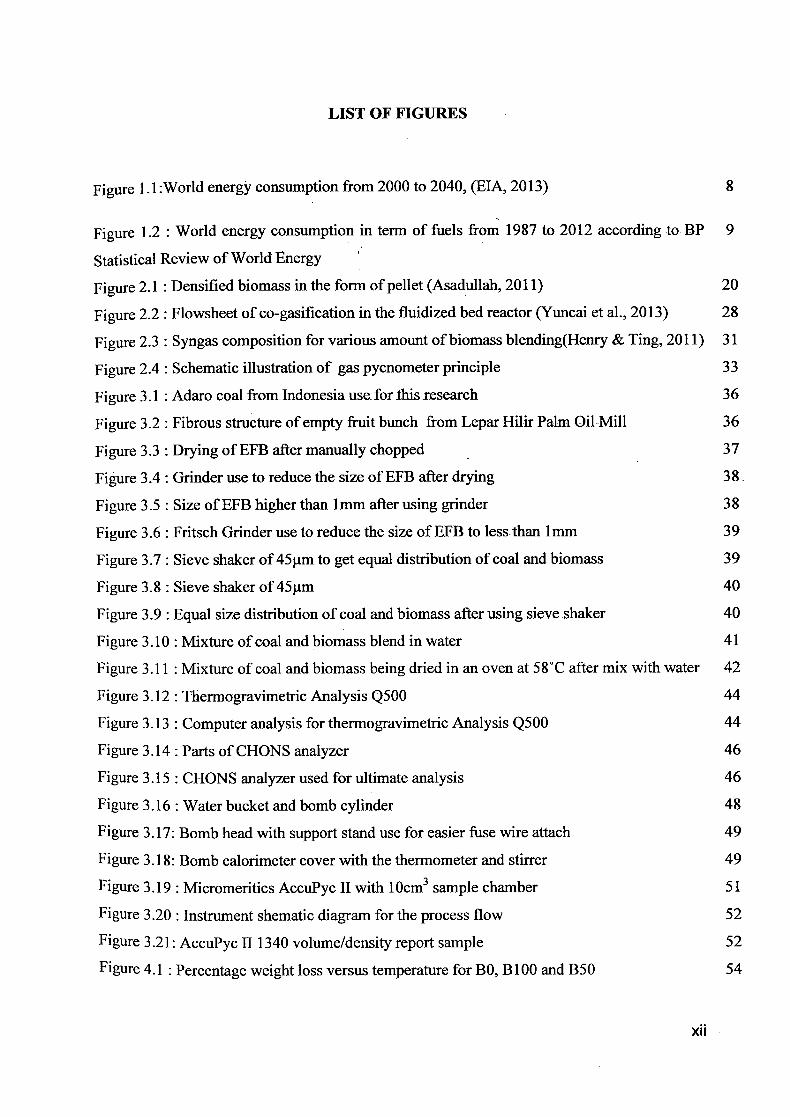
LIST OF FIGURES
Figure 1.1 :World energy consumption from 2000 to 2040, (ETA, 2013) 8
Figure 1.2 : World energy consumption in term of fuels from 1987 to 2012 according to BP 9
Statistical Review of World Energy
Figure 2.1 : Densified biomass in the form of pellet (Asadullah, 2011) 20
Figure 2.2 : Flowsheet of co-gasification in the fluidized bed reactor (Yuncai et al., 2013) 28
Figure 2.3 : Syngas composition for various amount of biomass blending(Henry & Ting, 2011) 31
Figure 2.4: Schematic illustration of gas pycnometer principle 33
Figure 3.1 : Adaro coal from Indonesia use for this research 36
Figure 3.2 : Fibrous structure of empty fruit bunch from Lepar Hilir Palm Oil -Mill 36
Figure 3.3 : Drying of EFB after manually chopped 37
Figure 3.4: Grinder use to reduce the size of EFB after drying 38
Figure 3.5 : Size of EFB higher than 1mm after using grinder 38
Figure 3.6 : Fritsch Grinder use to reduce the size of EFB to less than 1mm 39
Figure 3.7: Sieve shaker of 45p.m to get equal distribution of coal and biomass 39
Figure 3.8: Sieve shaker of 45tm 40
Figure 3.9 : Equal size distribution of coal and biomass after using sieve shaker 40
Figure 3.10 : Mixture of coal and biomass blend in water 41
Figure 3.11: Mixture of coal and biomass being dried in an oven at 58°C after mix with water 42
Figure 3.12: Thermogravinietr-ic Analysis Q500 44
Figure 3.13 : Computer analysis for thermogravimetric Analysis Q500 44
Figure 3.14: Parts of CHONS analyzer 46
Figure 3.15 : CHONS analyzer used for ultimate analysis 46
Figure 3.16: Water bucket and bomb cylinder 48
Figure 3.17: Bomb head with support stand use for easier fuse wire attach 49
Figure 3.18: Bomb calorimeter cover with the thermometer and stirrer 49
Figure 3.19: Micromeritics AccuPyc II with 10cm 3 sample chamber 51
Figure 3.20 : Instrument shematic diagram for the process flow 52
Figure 3.21: AccuPyc 111340 volume/density report sample 52
Figure 4.1 : Percentage weight loss versus temperature for BO, B100 and B50
XII
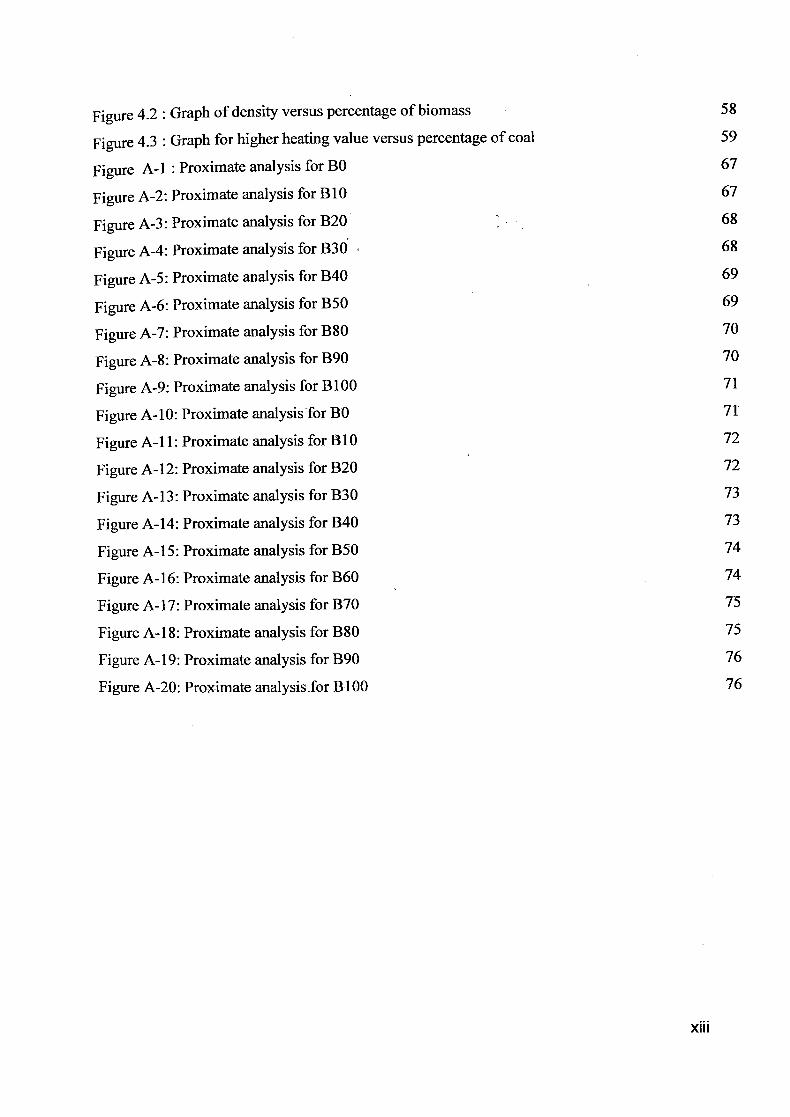
Figure 4.2: Graph of density versus percentage of biomass
58
Figure 4.3 : Graph for higher heating value versus percentage of coal 59
Figure A-i : Proximate analysis for BO 67
Figure A-2: Proximate analysis for B 1 67
Figure A-3: Proximate analysis for B20 68
Figure A-4: Proximate analysis for B30 68
Figure A-5: Proximate analysis for B40 69
Figure A-6: Proximate analysis for B50 69
Figure A-7: Proximate analysis for B80 70
Figure A-8: Proximate analysis for B90 70
Figure A-9: Proximate analysis for B 10 71
Figure A-iO: Proximate analysis for BO 71
Figure A- 11: Proximate analysis for B 10 72
Figure A-12: Proximate analysis for B20 72
Figure A-13: Proximate analysis for B30 73
Figure A-14: Proximate analysis for B40 73
Figure A- 15: Proximate analysis for B50 74
Figure A- 16: Proximate analysis for B60 74
Figure A-17: Proximate analysis for B70 _75
Figure A-18: Proximate analysis for B80 75
Figure A- 19: Proximate analysis for B90 76
Figure A-20: Proximate analysis-for ff100 76
XIII
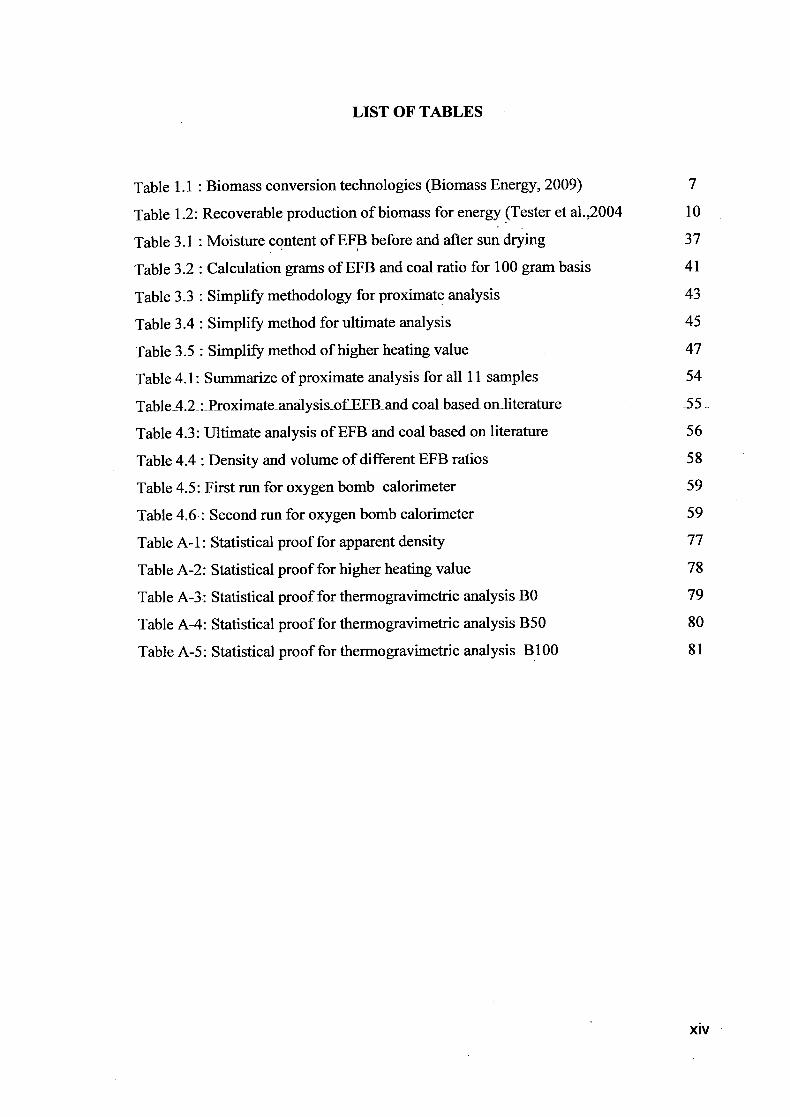
LIST OF TABLES
Table 1.1: Biomass conversion technologies (Biomass Energy, 2009) 7
Table 1.2: Recoverable production of biomass for energy (Tester et al.,2004 10
Table 3.1 : Moisture content of EFB before and after sun drying 37
Table 3.2 : Calculation grams of EFB and coal ratio for 100 gram basis 41
Table 3.3 : Simplify methodology for proximate analysis 43
Table 3.4: Simplify method for ultimate analysis 45
Table 3.5 : Simplify method of higher heating value 47
Table 4.1: Summarize of proximate analysis for all 11 samples 54
TableA.2Proximateana1ysisMfEFi3andCOa1 based on-literature 55
Table 4.3: Ultimate analysis of EFB and coal based on literature 56
Table 4.4: Density and volume of different EFB ratios 58
Table 4.5: First run for oxygen bomb calorimeter 59
Table 4.6: Second run for oxygen bomb calorimeter 59
Table A-i: Statistical proof for apparent density 77
Table A-2: Statistical proof for higher heating value 78
Table A-3: Statistical proof for thermogravimetric analysis BO 79
Table A-4: Statistical proof for thermogravimetric analysis B50 80
Table A-5: Statistical proof for thermogravimetric analysis B100 81
xiv

LIST OF ABBREVIATIONS
N Avogadro's constant
BEC Biomass Energy Centre
C Carbon
CO2 Carbon dioxide
CO Carbon Monoxide
C_EUE Carbon Energy Utilization Efficiency
EFB Empty Fruit Bunch
R Gas constant
HHV Higher Heating Value
H Hour
H2 Hydrogen gas
H_EUE Hydrogen Energy Utilization Efficiency
HIC Hydrogen to carbon ratio
IGCC Integrated Gasification Combined Cycle
Kg Kilogram
CH4 Methane
MILP Mixed Integer Linear Programming
MW Molecular Weight
N2 Nitrogen gas
O Oxygen
OEUE Oxygen Energy Utilization Efficiency
0/C Oxygen to carbon ratio
OECD Organization for Economic Cooperation
and Development
Ps Pressure sample
PSYS Pressure system
Pref Pressure reference
SMC Spent Mushroom Compost
S Sulphur
T Temperature
xv

TGA Thermogravimetric Analyser
USA United State of America
\Tf Unknown volume
V, Volume sample
Vs Versus
H20 Water
Wt Weight
WCI World Coal Institute
xvi

1.0 INTRODUCTION
1.1 Background of study
One of the major renewable energy which is sustainable, environmental—friendly energy
sources is biomass. Biomass is the top four among the primary energy sources such as
coal, oil and natural gas and currently caters for about 14% of the world's total energy
consumption (Alauddin ZABZ et al., 2010). The raw biomass can be treated thermo-
chemically, biologically, or by catalytic processes. Table 1.1 displays the various
biomass conversion technologies.
Table 1.1: Biomass conversion technologies (Biomass Energy, 2009)
Technology Type of Major biomass Energy or Fuel
Conversion process feedstock production
Direct combustion Thermo-chemical Wood, agricultural Heat, steam and
waste, municipal electricity
solid waste
Gasification Thermo-chemical Wood, agricultural
waste, municipal Producer gas
solid waste
Pyrolysis Thermo-chemical Wood, agricultural Synthethic fuel oil
waste, municipal (biocrude) and
solid waste charcoal
Ethanol Production Bio-chemical Sugar or starch Ethanol
(aerobic) crop, wood waste
1

•1 aa
•1
c.
aQ
The increase in the global energy consumption in recent years has led to an alarming
rise in emission of harmful compound into the environment that has a dominant
influence on the atmosphere. Carbon dioxide emission from fossil fuel consumption has
become a major problem resulting environmental pollution. According to the
International Energy Outlook, world energy-related CO2 emission will increase from
30.2 billion metric tons in 2008 to 43.2 billion metric tons in 2035 (Energy Outlook,
2011). Other than that, fossil fuel such as coal and oil also emit other compound such as
NOx and SO,. All of this compound will lead to environmental effect like acid rain,
ozone depletion, global warming and their after effects such as rising sea levels (Leila
Emami et al., 2003).
Biomass fuels can be produce by widely available raw materials which is come from
different sources and wide variety of forms. All of these forms can be used for fuel
production purposes, however not all energy conversion technologies are suitable for all
forms of biomass (Biomass Energy Centre, 2011). Based on figure 1.2, from year 2010
to 2040, the world energy consumption is expected to increase by 56% (ETA, 2013).
This is due to to the economic growth and increasing population especially in the
countries that is outside the Organization for Economic Cooperation and Development
(OECD) known as non-OECD (ETA, 2013). In addition, the energy used in the non-
OECD increase by 90% while in the OECD is about 17% only (ETA, 2013). Based on
statistics provided by BP Statistical Review of World Energy 2013, 33.1% accounted by
oil as world's leading fuel followed by natural gas, coal, hydroelectricity, nuclear
energy and renewable. Asia Pacific region accounted the most of the global energy
consumption 40% and 69.9% of global coal consumption.
-
Figure 1.1: World energy consumption from 2000 to 2040 (unit in quadrillion Btu) (EIA, 2013)
2

I_oai
I3020
LNuclear energyJ
Renewables
[iuiydroe1ectricitJ
i2030
mo
7020
FWnhiral Gas
0020
Io1 07 00 00 00 ON 02 02 04 95 W. 07 00 00 02 02 02 0O-I 00 00 (I7 00 03 10 11 12 0
Figure 1.2: World energy consumption in term of fuels from 1987 to 2012 according to
BP Statistical Review of World Energy.
They are several classes of biomass include wood and agricultural product, solid waste,
landfill gas and biogas and alcohol fuels. It has been extensively studied regarding co-
gasification of coal and biomass (Jhon F. et al., 2006). The use of coal could help to
provide stable gasification conditions and could prevent problems due to wastes
seasonal shortness (J.Fermoso, 2009). Biomass gasification itself is relatively high cost
and produces large amount of tar. Therefore, co-gasification can reduce the cost of the
feedstock and reduce the problems that occur in plant operation due to the production of
tar (Kumabe et al., 2006). Biomass and coal are considered as potential feedstock's
which supply syngas (CO and 1 1 2) for the synthesis of liquid fuels by gasification. This
is due to depletion of natural gas resources which increased the necessity for reducing
the consumption of natural gas (Droege P, 2002). A reduction of green-house emission
when coal and biomass are co-gasified becomes evident given the renewable character
of biomass. Additional environmental benefits of co-gasification include a reduction on
nitrogen oxides and sulphur emissions (Velez et al., 2008). Biomass in co-gasification
could contribute to the reduction of fossil fuel dependency (Long & Wang, 2011). Tar
yield from ligno-cellulosic biomass materials tend to be considerably higher than tar
yield from coals. This recognise problem arise mainly from the lower temperatures and
shorter residence times in gasifiers constructed for biomass processing compared to
those designed for coal gasification (Fraga et al., 1991).
3

Unlike coal, biomass with low ash and sulphur content, a high volatile matter yield and
fixed carbon with high reactivity could potentially be attractive from the economical,
environmental and social points of view that poor coal would be utilized for electrical
power generation (Pan et al., 1996). Increase of fluctuations in quality, availability and
composition by heterogeneity of biomass and wastes cause their processes to be more
complicated than of coal. In co-gasification, coal acts as buffer and a bed material to
improve the quality ofbiomass pafticle. Low density and low calorific value of biomass
causes an increase in the cost of transportation and storage, hence by co-gasification of
biomass with coal is more economical compared to biomass alone (Hernandezz et al.,
2010 & Seo et al., 2010). One of the largest producers of palm oil with a variety of
empty fruit bunches waste in the world today is Malaysia. In the year 2008, Malaysia
produced 1.7.7 million lonnes -of palm oil on 4.5 million hectares of land. (Malaysian
Palm Oil Industry Performance, 2009). Table 1 shows the-production rate of biomass
for energy.
Table 1.2: Recoverable production of biomass for energy (Tester et al.,2004) Region Forest (EJ/yr) Crop (EJ/yr) Dung (EJ/yr)
US and Canada 1.7 3.8 0.4
Europe 1.3 2.0 0.5
Japan 0.1 0.2 -
Africa 0.7 1.2 0.7
China 1.9 0.9 0.6
World Total 12.5 13.7 5.1
Coal has the largest reservoir in the world compared to the other energy sources like oil
and gas according to the BP statistics review of the world's energy (BP, 2011). Top five
producers of coal are China, US, India, Australia and South Africa (WCI, 2013). They
are highly dependent on coal resources for their energy needs. Japan and Korea are the
examples of country which need to import coal. Since industrial era in the 18th and 19'
coal has been used and have higher demand. Global coal consumption and production
grew by 2.5% and 2.0% in 2012 respectively (BP, 2013). Coal production has increase
fastest in Asia and the global coal production is expected to reach billion tonnes in 2030
where China accounting half of the production. Steam coal production is use in Asia for
electricity, coking coal for cement manufacturing and steel production. Due to the
4

common availability of coal and its cost feasibility, most of the developed countries use
coal as a fossil fuel for power generation. However if some countries have a deficit in
coal resources then they mainly import from the coal enriched countries. Although,
there is a large scientific knowledge on separate gasification of both coal and biomass,
the application of this technology to coal mixed with wastes is still under development
(Filomena et al., 2003).
Gasification is a clean technology that converts different carbonaceous feed stocks such
as natural gas, coal, petroleum, coke, biomass and municipal solid wastes in a limited
supply of air to gaseous products such as hydrogen and carbon monoxide (syngas),
carbon dioxide, water as well as gaseous hydrocarbons at high temperatures (Leila
Emami et al., 2012). It also-produces solids-such-as char, ash and condensable products
like tars and oils. Gaseous products can be used to produce electricity, hydrogen,
chemicals and liquid transportation fuels. Gasification process is one of the promising
technologies that has been widely studied to exploit energy using- several kind of
feedstock, as coal, biomass or mixtures (Maria P.Aznar, 2006). Sewage sludge and
municipal solid wastes have been also used in this process (Mohd Asadullah, 2013).
This process begin with pyrolysis which is endothermic process where small part of
carbon-based feedstock is burned to provide heat that is needed to remove moisture -and
volatiles in the absence or poor presence of oxygen. After pyrolysis, more heat is
needed to thermally crack the volatiles to break the long hydrocarbon chains into lighter
gases as well as to gasify the remaining carbon left in the feedstock into synthesis gases
(Henry et al., 2011).
5

1.2 Problem Statement & Motivation
The use of biomass as renewable energy is important to alleviate global warming
(McKendry, 2002). Greenhouse gas emissions by fossil fuels burning can be reduced by
renewable energy (Babu, 2006) Renewable energy resources like biomass have high
potential in produce zero net carbon dioxide emissions (Tijmensen et al.,2002). It can be
converted into gas or liquid fuels by processes called bio-chemical or thermochemical
(Darvell, 2006). Gasification of biomass is one of the few technologies that can
potentially produce carbon negative energy with pollution-free power and also change
the agricultural gas into energy (Li et al., 2004). Biomass contain excessive amount of
moisture content that must be remove preferably prior to entry in-the gasifier. This
excessive amount of moisture content will reduce the thermal efficiency of the
gasification system (Asadullah, 2013). Water content during first stage of combustion
system must be removed, requiring energy, and thus reducing overall system efficiency
and potentially reducing combustion temperature below the optimum. Temperature
below the optimum may cause incomplete combustion which will giving rise to
emission of tars. Other than that, moisture content in biomass can cause impact on
storage and transport (Biomass Energy Centre, 2011). There are several step to remove
moisture content in biomass such as sun drying at the origin where the biomass is
produced or drying using heat at the plant where it would be converted to energy. Sun
drying is time consuming and generally the cheapest drying to reach the equilibrium
moisture content (Asadullah, 2013).
Empty fruit bunch (EFB) is type of agricultural biomass that is not easy to feed in the
gasification unit. The heterogeneity and low bulk density of the biomass can be
overcome by densification process called pelletisation. EFB can be converted into a
value added fuel with homogenous properties, shapes and sizes. Pelietisation provides
advantages in terms of handling, storage, transportation and feeding properties.
Pelletisation of material is performed by applying pressure, shear or combination of
both (Changkook et al., 2007). Size, shape and structure of biomass the rate of
gasification For maximum rate of gasification and better controlling temperature, small
size of biomass is preferable (Leila Emami et al., 2013). The composition and
6

impurities of the syngas produced in the gasification depends on biomass feedstock,
gasifier design, gasifying agent and gasification condition (Asadullah, 2013). Besides
producing syngas, gasification process produced other contaminants that can be
removed by gas cleaning. They are two different type of gas cleaning which is cold and
hot cleaning system (Ruiz et al., 2012). Tar is unpleasant by-product of gasification.
Compared to coal gasification itself, tar is produced in greater quantity during pyrolysis
zone (Leila Emami et al., 2013): As the syngas cools downstream of the reactor,
vaporised tars will condense either onto cool surfaces or as aerosols or small liquid
droplets, which could lead to blockages in the downstream syngas pipe work. Hence tar
removal is critical in systems where the syngas is compressed prior to use, such as gas
turbines. Wet scrubbers have been used widely in the removal of tars from gas streams
in coal processing plants. Catalytic tar destruction techniques are also being developed,
which retain the energy value of the tar compounds in the syngas.
1.3 Objective of the research
The objective of the research is characterisation of coal and untapped biomass which is
palm empty fruit bunch (EFB) for co-gasification.
7

1.4 Scope of study
In order to fulfill the research objective, the following scopes of research has been
outlined:
i) To produce untapped biomass palm empty fruit bunch (EFB) with low moisture
content and high density for easier mixing with coal before gasification process
ii) To demonstrate the effectiveness of biomass and coal being gasified together;
so that co-gasification can be developed into a cost-effective and environmentally
friendly
iii) To study- the-factor-effecting-the co-gasification-process (type of-biomass,
proportion of biomass in coal-biomass mixture, ash content, air-steam flow rate, gasifier
temperature, catalyst, downstream processing, particulate matter removal or gas
cleaning, alkali removal, tar removal, environmental benefit).
iv) To study the effect on characteristic of mixture coal and biomass in co-
gasification and compare with coal gasification or biomass gasification itself. (moisture
content, fixed carbon content, element composition C,H2O,N,S).
v) Examine potential issues related to the chemistry during biomass and coal
gasification and their--impact to the- syngas.
8
1.5 Chapter Organisation
Chapter 2 provides a description of the problems, background, pre-treatment of coal and
biomass, coal gasification, biomass gasifications and co-gasification of coal and
biomass mixture. This chapter also provides a brief discussion effect co- gasification
process using different ratio of biomass and compare the coal gasification and biomass
gasification itself.
Chapter 3 gives a review on the procedures and detailed about the analysis of biomass
and coal mixture. Brief explanation regarding the description of process equipment that
will be used in this research also presented. Besides that, the full sequence about this
research also presented along with the step required to run the experiment.
Chapter 4 is about the results that have been obtained from the analysis of biomass by
using different ratios regarding this research along with brief discussion by comparing it
with previous study. Besides that, expected results for this research, also will be
discusses and briefly explain based on results that have been obtained.
Chapter 5 is about the conclusion regarding experiment. Besides that, in this chapter
also provides a brief recommendation that can be suggested to improve this research.
9

2.0 LITERATURE REVIEW
2.1 Biomass collection
Biomass is considered as a big challenge that negatively impact the profitability and
further development of biomass based energy due to collection and delivery of biomass
to the energy conversion plant that is cost intensive (AsaduHah, 2013). Difficulties of
biomass collection system are cause by the unstable market of biomass due to lack of
fully established biomass energy conversion technology (Ruiz et al., 2013). Cost related
to biomass feedstock can be reducing by optimized collection, storage and
transportationalong with appropriate selection of the power plant location. Over-the last
few years based on regional biomass, a comprehensive research both in modelling and
practical field has been conducted to estimate the available biomass and to establish a
suitable collection method (Leila Emami et -al., 2013); One -of-the cost effective ways to
collect distributed agricultural biomass is the satellite storage and delivery. Harvesting
and collection cost of biomass depends on the type of biomass and-economic status of
the country. Even the economic status for almost all Europe country is the same, but the
cost of biomass still varies across the Europe countries. The highest cost have been
found to be in Italy where $39.8 f' for agricultural and $88.8 t' for forest residue.
Different cost is depends on difficulties of ways of collection (Asadullah, 2013).
10

2.2 Biomass transportation
Transportation of biomass from the origin where it is available to the power generation
unit is one of the challenges of biomass based power generation. There are several
problems in effective transportation that can be solved (1) excessive moisture content
and (2) low bulk density (except wood log) (Kezhong et al., 2010). These two problems
increase the biomass transportation cost as well as increase the cost of bio energy as a
whole. To ensure the consistent supply of biomass to the power plant and reduce
transportation cost as well, the transportation network and medium of transportation as
part of logistic support can be optimized (Abdullah., 2011). A comprehensive research
in mathematical modelling has been proposed in developing an optimized logistic
system. For -cotton stalk transportation from the field to warehouses a-- linear
programming model was proposed. This linear programming initially developed for
designing a delivery for herbaceous biomass as well as for solving the day to day
tactical planning problems. A conceptual mixed integer programming (MILP) model
was used to identify the key cost component is biomass logistic, where transportation
was one of the major factors that give rises to the biomass price. To minimize the
delivery cost, a linear programming model is proposed for switch grass transportation
by scheduling shipments from the various on-farm storage locations to meet the demand
of feedstock supply (Asadullah, 2013).
2.3 Pre-treatment of coal -and-biomass for co—gaiflcation
Biomass is very difficult to be transport and use as feedstock. It is not easily to
Pulverized or slurries like coal, so continuous feeding tends to be an issue. Biomass has
a highly fibrous, sinewy structure, making it hard to tear up and easily to get stuck in
most machine usually between gears and in conveyor belt drives. To solve this issue, a
few step have been taken through several technologies. Due to easily pulverized or
slurries like coal continuous feeding of biomass can be a problem. Biomass physically
has a highly fibrous, sinewy structure making its hard to tear up and easily get stacked
in most machines, especially between gears and in conveyor belt drives. Flash pyrolysis
and torrefactjon are technologies which can reduced this problem. First phase of the
overall gasification process.
11 /

2.3.1 Drying
Before coal and biomass can be fed into gasifier, it must be reduction in moisture
content and size for easy co-gasification process. To achieve moisture content suitable
for this operations, drying is required. They are several benefits using dry biomass for
combustion such as increased boiler efficiency, lower fuel gas emissions and improved
boiler operations compared to fuels with- high moisture (Harming et al., 2012). They are
three types of drying biomass such as rotary dryers, flash dryers and superheated steam
dryers. The most common dryers use is rotary dryers because of its least sensitive to
material size and-greatest fire hazard (Wade, 1998). For freshly cut wood, the typical
ranges moisture content is from- 30%-to -60% and-may be exceed 90% in some types of
-biornass The most preferable moisture content for gasification process is 10% to 15%
(Ruiz et al, 2012).
High moisture content will cause temperature of the gasification process reduced thus
will result to incomplete combustion. Forest residues or wood has a fiber saturation
point at 30% to 31% moisture content. To -reduce the moisture content below saturation
point, compressive and shear strength should be increased. This will push the cell wall
closer to one -another and- -bind more tightly. In the gasification zone, a high level of
moisture usually fed in form of steam to favour -water-gas shift reaction- that will
increase hydrogen concentration in the resulting gas (Brar et al., 2011). Moisture will
generate steam which act-as gasifying-agent that react withvolatilesandchar to convert
them to product gas as well as taking part in water-gas shift reaction to increase
hydrogen gas production (Lv et al., 2007 & Yan et al., 2010). Moisture content which is
higher than 40% will reduces the thermal efficiency of the gasification system. This is
because the heat absorbed by the unreacted steam in three steps, including heating of
moisture content more than 100'C, latent heat of vaporization and heating of steam to
gasification temperature is totally lost from the system, and thus increase the thermal
cost. In additional, during gasification process, further addition of water is needed to
balance the hydrogen content in the product gas. This complete drying of biomass is
cost intensive. The moisture content in raw biomass usually above 50 wt% such as palm
empty fruit bunch (EFB) is the abundantly available agricultural biomass in Malaysia
and Indonesia (Ma & Basiron, 2005). The utilization of this kind of biomass for energy
12
production is a real challenge. There are several crucial factors severely affecting the
constant supply of this biomass and the most severe challenge is drying. There may be
two options to reduce the moisture content to a desired range whether by sun drying at
the origin where the biomass is produced or it may be drying using heat at the plant
where it would be converted to energy. Eventhough, the sun drying process is less
costly it takes longer, time to reach the equilibrium moisture content (Acharjee et al.,
2011). It also depends on the atmospheric humidity. The challenge in this slow drying
process is that the biomass gets molds and biologically degrades. On the other hand, the
drying at the processing plant is costly because of using costly drying equipment as well
as supplying heat for drying.
2.3.2 Pelletisation
Biomass such as forest slash and-construction-waste-usually irregular in-shape, low in
energy density, high moisture content and difficult to transport and store.
Lignocellulosic biomass which is biomass from plants usually have a relatively low
bulk density of 30 kg/m 3 and a moisture content between 10% to 70% (wb). Pelleting
increases specific density (gravity) of biomass to more than 1000 kglm3(Lehtikangas,
2001; Mani et al., 2004). Approximately about 10 to 15 percent of energy density of
biomass increase by densification thus more heat is produced per unit- of pellets burned
than raw biomass. Compared to raw biomass feedstock, biomass pellet are superior fuel.
Pellets are--not only more energy dense, they are also easy- to- ha dle--and_used in
automated feed systems Cylindrical shape of pellet having diameter 6 to 8 millimeters
and a length of not more than 38 millimetres . Diameter of pellets more than 25
millimetres is also manufactured but they are usually referred to as "briquettes" (Mani
et al., 2006). To improve density and material flow in the feeder areas, pelletization is
one the best method of densification process. Quality of the pellet is depends on several
factor which is in terms of moisture content, biomass type, particle size. Pelletiser type,
binding agent and operating conditions is factor to be considered for best quality
management of the manufacturing process (Gilbert et al., 2009). Binding agent or
Stabilizing agents are used to reduce the pellet springiness and to increase the pellet
density and durability. The most commonly binders use in pelletisation process of
animal feeds are calcium lignosulfonate, colloids, bentonite, starches, proteins and
13

calcium hydroxide (Host, 1964; Tabil and Sokhansanj, 1996). Spent mushroom
compost (SMC) and coal tailings are type of pellets that is suitable in chain grate
furnances, industrial gasifiers or conventional pulverised fuel-based power stations
where it also can be fed into the mills. Lime in SMC help to reduce sulphur emission
from coal combustion (Changkook et al., 2007). Research at the Swedish University of
Agricultural Sciences has tested 9 different sources of pellets (Lehtikangas et al., 2001).
The pellets from bark had the highest durability whereas the conventional sawdust
pellets had the least. Pellet density was found to have no effect on durability. In a
similar pilot study to the above, the same nine pellet samples were stored for five
months in plastic bags in an unheated barn to examine the changes in moisture content,
heating value and ash content (Lehtikangas et al., 2000). The research concluded that
storage of the pellets led to a negative effect on durability, especially on pellets made
from fresh materials. In general, the changes in pellet quality during storage in large
bags were not large, but notable. Even there is a lot of variation between pelletisers, the
common method for mass production is to use a die and a press roller (Alankangas et
al., 2009). Pelletisers are often more simplistic for laboratory-based small-scale work. It
is consist of modified hydraulic presses, where ease of pellet manufacture, time scale or
costs would not be an issue (Li et al., 2000).
Figure 2.1: Densified biomass in the form of pellet
14