characterisation of oil sludges from different sources
TRANSCRIPT
Characterisation of oil sludges from different sources before treatment: high-field nuclear magnetic resonance (NMR) in the determination of oil and water content
Article
Accepted Version
Ramirez, D., Kowalczyk, R. M. and Collins, C. D. (2019) Characterisation of oil sludges from different sources before treatment: high-field nuclear magnetic resonance (NMR) in the determination of oil and water content. Journal of Petroleum Science and Engineering, 174. pp. 729-737. ISSN 0920-4105 doi: https://doi.org/10.1016/j.petrol.2018.11.078 Available at http://centaur.reading.ac.uk/81029/
It is advisable to refer to the publisher’s version if you intend to cite from the work. See Guidance on citing .
To link to this article DOI: http://dx.doi.org/10.1016/j.petrol.2018.11.078
Publisher: Elsevier
All outputs in CentAUR are protected by Intellectual Property Rights law, including copyright law. Copyright and IPR is retained by the creators or other copyright holders. Terms and conditions for use of this material are defined in the End User Agreement .
www.reading.ac.uk/centaur
CentAUR
Central Archive at the University of Reading
Reading’s research outputs online
1
Characterisation of oil sludges from different sources before 1
treatment: High-field nuclear magnetic resonance (NMR) in the 2
determination of oil and water content 3
4
Diego Ramirez a,*, Radoslaw M. Kowalczyk b, Chris D. Collins a 5
6
a Soil Research Centre, School of Archaeology, Geography and Environmental Science, 7
University of Reading, Whiteknights Campus, Reading RG6 6DW, United Kingdom 8
b Chemical Analysis Facility, School of Chemistry, Food and Pharmacy, University of 9
Reading, P.O. Box 224, Whiteknights Campus, Reading RG6 6AD, United Kingdom 10
11
* Corresponding author: D. Ramirez 12
E-mail addresses: [email protected] (D. Ramirez). 13
[email protected] (R. M. Kowalczyk). [email protected] (C. D. Collins). 14
Declarations of interest: none. 15
16
Abbreviations: CPMG, Carr-Purcell-Meiboom-Gill; EPH, extractable petroleum 17
hydrocarbons; FID, free induction decay; FTIR, Fourier-transform infrared spectroscopy; GC-18
FID, gas chromatography-flame ionisation detection; ICP-OES, inductively coupled plasma 19
optical emission spectrometry; NMR, nuclear magnetic resonance; NSC, oil refinery sludge; 20
2
ODS, oil drilling sludge; PTEs, potentially toxic elements; SPE, solid-phase extraction; STS, 21
waste engine oil sludge from gravitational settling; RS, waste engine oil sludge from 22
centrifugation; TGA, thermogravimetric analysis; UCM, unresolved complex mixture; WSS, 23
oil-water separator sludge. 24
25
1. Introduction 26
27
Approximately 60 million tons of oil sludge are accumulated by the petroleum industry 28
each year worldwide (Hu et al., 2013); these sludges are considered to be the most substantial 29
waste generated in this industry (Egazar’yants et al., 2015, Shen et al., 2016). In fact, it was 30
estimated that more than one billion tons of the sludges have been stored around the world 31
(Mirghaffari, 2017), which considerably affects the operation of the petroleum industry and 32
have environmental impacts. The Review of the European List of Waste has classified the oil 33
sludges as “wastes from petroleum refining, natural gas purification and pyrolytic treatment of 34
coal” and “oil wastes and wastes of liquid fuels” (Okopol, 2008). Oil sludges are a mixture of 35
oil hydrocarbons, water, and sediments, and are water-in-oil type (W/O) emulsions (da Silva 36
et al., 2012, Hu et al., 2013). The sediment content of the sludges are formed from inorganic 37
minerals in drilling fluids, storage tanks, discharges during testing and repairs of wells, 38
accidental spills, and pipelines of the oil industry (Giles, 2010, Egazar’yants et al., 2015). 39
Moreover, oil sludges can have metals, polyethers, and other chemicals obtained in the 40
petroleum refining (Hu et al., 2013). Some metals found in oil sludges are chromium (Cr), 41
copper (Cu), nickel (Ni), lead (Pb), vanadium (V), and zinc (Zn). In general, oil sludges have 42
a higher oil hydrocarbon content compared to the metal content (Hu et al., 2013). These 43
3
potentially toxic elements (PTEs) are believed to come from oil additives (de Souza et al., 44
2014). 45
da Silva et al. (2012) reported that the composition of oil sludge is about 30 to 90% water, 46
4 to 7% sediments, and 5 to 60% oil. However, Saikia et al. (2003) stated that the typical 47
composition of oil sludge is 30-50% water, 10-12% sediments and solids, 30-50% oil. Yang et 48
al. (2005), Zhang et al. (2012), and Long et al. (2013) have agreed that oil sludge is usually 49
composed of 30-70% water, 2 to 15% sediments and solids, and 30-90% oil. Moreover, 50
Egazar’yants et al. (2015) mentioned that oil sludges can have approximately 10 to 56 wt.% 51
organic materials, 30 to 85 wt.% water and 1 to 46 wt.% solids or sediments. This shows that 52
there is no uniform agreement among authors on the detailed oil sludge composition. This is 53
not surprising since each oil sludge composition is unique, and depends on the origin of the oil 54
sludge (Viana et al., 2015). Consequently, the physicochemical characteristics vary according 55
to the nature of the oil (Oliveira et al., 2015) and the formation process and storage of the oil 56
sludge (Kadiev et al., 2015). Generally, the sediment content is less than the oil and water 57
contents. The oil usually had higher aliphatic hydrocarbon percentages (40-60%) than the 58
aromatic hydrocarbon percentages (25-40%) (Shie et al., 2004, Speight, 2006). This wide 59
variation in the composition of oil sludges has significant implications on the characterisation 60
of oil sludges because different procedures and methods have been applied to study different 61
types of sludges (Heidarzadeh et al., 2010, Wang et al., 2010, Zhang et al., 2011, Jasmine and 62
Mukherji, 2015). In turn, this is extremely relevant for quick decision-making purposes 63
regarding the appropriate treatment of this waste. Currently, the treatment of oil sludges is 64
aimed to either reduce the contaminants in the sludge or to recover the oil. The former includes 65
some methods such as encapsulation (Johnson et al., 2015), bioremediation (Wang et al., 2016, 66
Roy et al., 2018), and incineration (Gong et al., 2017) whereas the latter, the oil recovery 67
methods, include freeze/thawing (Hu et al., 2015), solvent extraction (Hu et al., 2017, 68
4
Nezhdbahadori et al., 2018), centrifugation (Wang et al., 2018), microwave irradiation 69
(Tsodikov et al., 2016), and surfactant enhanced oil recovery (Duan et al., 2018, Liu et al., 70
2018). The implications of using an oil recovery technique is that the recovered oil can be 71
reused as feedstock for fuel production (Giles, 2010, Liu et al., 2011, Hu et al., 2015, Zhao et 72
al., 2017). Indeed recently, most of the sludge treatment has been focused on recycling methods 73
to recover the oil (Gumerov et al., 2017, Nezhdbahadori et al., 2018). For example, if the oil 74
sludge has a high oil content, it could be extracted and re-used as fuel (Hu et al., 2013). 75
Oil sludges are accumulated during the extraction, refining, storage, and transportation of 76
oil (Wang et al., 2010, Zhang et al., 2011). The common sources of oil sludges are the bottom 77
of crude oil tanks, oil-water separators, desalinators, and oil wastewater treatment plants (Hu 78
et al., 2013, Egazar’yants et al., 2015). In addition, oil sludge can be formed from waste engine 79
oils from vehicles and machines (Lam et al., 2012). 80
Oil sludges accumulated at the bottom of the storage tanks are the most frequently analysed 81
(Hu et al., 2013, Mansur et al., 2016), and only a limited number of studies have studied in 82
detail oil sludges from different sources. For instance, Jin et al. (2014) assessed the water 83
content in oil sludges from oil storage tanks, dissolved air flotation units, biological sludge 84
produced during wastewater treatments, and petroleum product storage tanks in the oil refinery. 85
Another study used oil refinery tank bottom sludges and oil tank cleaning water sludges to 86
analyse the emulsified water in these samples (Huang et al., 2014). Therefore, it is increasingly 87
important to perform more studies with oil sludges from different sources to determine 88
differences to standardise procedures for their rapid characterisation and subsequent treatment. 89
Nuclear magnetic resonance (NMR) has been widely used in the determination of organic 90
components of oil (e.g. aromatics, paraffins, olefins) in sludges (Mazlova and Meshcheryakov, 91
1999, Pánek et al., 2014, Kadiev et al., 2015, Cheng et al., 2016, Shen et al., 2016, Uçar et al., 92
5
2016, Ma et al., 2018). NMR requires only a relatively small sample amount, and it is non-93
sample destructive (Zheng et al., 2013). It has an acceptable 1H sensitivity, and it is easy to 94
measure (Silva et al., 2012). However, other methods used to determine the oil hydrocarbon 95
content such as azeotropic distillation need a high amount of reactants (e.g. approximately 200 96
ml of toluene) (Jin et al., 2014). Recently, low-field NMR (below 100 MHz) has been used 97
effectively for a rapid assessment of oil and water contents in the sludges (Jin et al., 2013, 98
Zheng et al., 2013, Jin et al., 2014) and in crude oil-water emulsions (LaTorraca et al., 1998, 99
Silva et al., 2012). High-field NMR is a well-established and widely available analytical 100
method that has the potential to distinguish between aliphatic and aromatic components as well 101
as to access the water-to-oil ratio in one experiment. However, to our knowledge, there are no 102
high-field NMR studies which aim to elucidate aliphatic and aromatic contributions and 103
compare water-to-oil ratios for contrasting characteristic sludges originating from different 104
sources.. 105
The aim of this study was to analyse different types of oil sludges, but with the high-field 106
NMR (500 MHz), to prove that high-field NMR could also be a rapid method to analyse the 107
oil and water content in various sludges. Also, the oil hydrocarbon fractions, trace elements, 108
sediment content, and PTEs were analysed. Therefore, we proposed a scheme to characterise 109
the oil sludges in this study. Such information is crucial to make decisions regarding the most 110
suitable treatment for these wastes. For instance, if the composition of the oil hydrocarbons in 111
the sludge is known, the possibility to recover the oil for future fuel production could be 112
assessed in a high degree of certainty minimising the recovery costs. 113
114
2. Materials and Methods 115
116
6
2.1. Oil sludges 117
118
Five oil sludges were used: An oil drilling sludge (ODS), an oil refinery sludge (NSC), 119
an oil-water separator sludge (WSS), and two waste engine oil sludges (STS and RS). Oil 120
sludge samples were stored in amber glass containers at 4°C to avoid photodegradation and 121
volatilisation. 122
123
2.2. Total dry matter and water contents 124
125
Dry matter and water contents were assessed according to the European Committee for 126
Standardisation (CEN) protocol (EN12880, 2003). The total dry matter content comprised the 127
dried solid and organic material contents. Briefly, the oil sludge (5 g) was added to a crucible 128
previously dried at 105°C for 30 minutes. The crucible was then dried at 105°C for 24 hours. 129
The weight was continually registered until a constant mass was reached. 130
The solid content was obtained by further heating the 105°C-dried samples at 550°C for 131
30 minutes (Taiwo and Otolorin, 2009). The organic material content was the mass lost in the 132
heating at this high temperature (Zubaidy and Abouelnasr, 2010). 133
134
2.3. Metal elements analysis 135
136
The elements were extracted by aqua regia digestion. Oil sludge (1.5 g) was dried in a 137
fume cupboard during seven days (Chen et al., 2015), and it was then added to a 100-ml 138
7
Kjeldahl digestion tube. In addition, four glass balls (1.5 mm-2mm), 10.5 ml of concentrated 139
hydrochloric acid, and 3.5 ml of concentrated nitric acid (both AnalaR grade supplied by 140
Sigma-Aldrich) were added. The tube was left overnight in a fume cupboard. After, it was 141
heated at 50ºC in a digestion block.. The temperature was then increased at 5ºC·min-1 to 140ºC. 142
The sample was left at this temperature for two and half hours and filtered into a 100-ml 143
volumetric flask using a Whatman Grade 540 filter paper (Sigma-Aldrich). The final volume 144
(100 ml) was reached with 0.5 M nitric acid and then diluted 10-fold with ultrapure water (18.2 145
MΩ·cm). An inductively coupled plasma optical emission spectrometer (ICP-OES) (Optima 146
7300 DV) was used to analyse the sample and the multi-element and arsenic standards. The 147
data had no total metal values because this type of digestion did not dissolve any silicates, 148
therefore, analysed metals were only aqua regia soluble. 149
150
2.4. High field NMR 151
152
A Bruker Avance III 500 MHz NMR spectrometer (Bruker Biospin, Germany) 153
operating at a Larmor frequency of 500.13 MHz (11.75 T) was used in conjunction with a 154
Bruker broadband observe (BBO) high-resolution solution probe. Standard 5 mm diameter 155
NMR tubes (Norell S 5-400-7) were used. A sample volume of 200 µl guaranteed that the entire 156
sample was inside the active space of the radiofrequency coils from the BBO probe. Used 157
motor oil (ca. 0.5 mL) diluted in 0.5 µL of deuterated benzene (Sigma-Aldrich) was the shim 158
and lock standard. This was necessary to ensure a maximum possible homogeneity of the 159
magnetic field and optimal and reproducible conditions for recording the NMR signal which 160
cannot be reached using the sludges due to the numerous impurities. After the shims were 161
calibrated with this standard, no shimming and locking was executed in the samples. 162
8
The standard 1D NMR proton spectra (oil-water calibration standards only) and the T2 163
decay data were reported (all samples) at room temperature. The 90° pulse lasted 10 μs at 17 164
W. In total, eight signal transients were averaged in a free induction decay, FID (39,990 data 165
points, dwell time = 3.33 μs). The spectral resolution was 3.75 Hz corresponding to a wide 166
spectral width of 150 kHz. A full relaxation of the spins was guaranteed with a relaxation delay 167
between 20 and 15 s. 168
The T2 decay data were recorded using a Carr-Purcell-Meiboom-Gill (CPMG) pulse 169
sequence. In total 128 echo cycles were used in one experiment. Each cycle consisted of an 170
even number of echo loops with a fixed echo time of 0.26 ms (milliseconds). The number of 171
echo loops increased non-monotonically in each consecutive cycle from 2 to 8192 to correctly 172
cover the fast decay of oil and slow decay of water signals (e.g. frequent at short and sparse at 173
long times). The FID signal (half of the spin echo) was registered after each cycle and was 174
decomposed as a function of time using Fourier transformations. A 1D NMR spectrum slice 175
was then obtained, and each slice was phase and baseline corrected prior to the integration of 176
the full spectral range. The final T2 decay curve for each sample comprised the series of 177
integrals as a function of the echo time for each cycle. These data were obtained with TopSpin 178
v. 3.5 pl 5 (Bruker Biospin, Germany). 179
The T2 decay data were fitted with a decay function made from the two exponential 180
components which corresponded to the oil and water present in the samples and a background 181
constant using Microsoft® Excel® 2016. The T2 decay times for oil and water, as well as 182
corresponding signal amplitudes, were obtained from the fitting. The percentage of the 183
amplitudes of the fit components were used to calculate the oil and water contents. This 184
calculation was possible due to the large difference in the decay time of oil (ca. 1 ms) and water 185
(ca. 1000 ms) signals. 186
9
This high field NMR method was validated with the relative experimental errors and 187
R2 values found between the NMR data and the expected percentage values of the oil and water 188
standards. In addition, the percentage differences between the T2 decay and 1D proton data of 189
the oil-water calibration standards were gathered to confirm the consistency of the NMR 190
method in calculating the oil and water contents in the oil sludges. The aliphatic to aromatic 191
ratio in the oil sludges was calculated with the integrated intensities of the peaks in the 1H NMR 192
spectrum at the specified regions (aliphatic or aromatic). 193
194
2.5. Extraction of extractable petroleum hydrocarbons (EPH) 195
from the oil sludges 196
197
Oil sludge (1 g) and a 10 ml acetone:hexane solution (1:1, v/v) were added to a 22 ml 198
glass vial. Sand (50-70 mesh particle size) in ultrapure water (18.2 MΩ·cm) was used as a 199
blank. The sample was sonicated (frequency = 38 kHz) during 15 minutes allowing the 200
separation of soil particles and release of the EPH compounds. The sample was then agitated 201
using a Stuart roller mixer SRT9D (Bibby Scientific Ltd.) for 60 min at 60 rpm to ensure that 202
the sample matrix was thoroughly mixed. Deionised water (4 ml) was then added to isolate the 203
hexane layer. The sample was frozen at -25°C to further separate water remnants from the 204
hexane. The hexane was then separated and evaporated to 1 ml using a gentle nitrogen stream 205
at 40°C on a sample concentrator (Bibby Scientific Ltd.). The sample was finally diluted in 206
hexane (1:10). 207
208
10
2.5.1. Sample clean-up and separation of the aliphatic and 209
aromatic EPH fractions with solid-phase extraction (SPE) 210
211
The silica gel (60 Å; 63 – 200 µm, GC grade) and anhydrous sodium sulphate (Fisher 212
Scientific) were activated by ultrasonication with hexane for 30 minutes, and then heated at 213
130°C for 16 hours before the SPE clean-up process. Silica gel was finally deactivated with 214
3% (w/v) of deionised water. Sand (50-70 mesh particle size) (Sigma-Aldrich) was activated 215
at 400°C during 8 hours. Silica gel (1 g), anhydrous sodium sulphate (0.5 g) and sand (1 g) 216
were added as sorbents into a SPE cartridge (Supelco). The SPE cartridge was placed in a 217
VisiprepTM vacuum manifold (Supelco) at a pressure of 250 mm Hg. Sample (0.5 ml) was then 218
transferred to the SPE cartridge, and both the aliphatic and aromatic fractions were eluted with 219
3.5 ml of hexane and 9 ml of 3% of isopropanol diluted in hexane, respectively. The eluents 220
were finally evaporated to 1 ml (40°C) with a gentle nitrogen stream. 221
222
2.5.2. Analysis of the EPH fractions by gas chromatography-223
flame ionisation detection (GC-FID) 224
225
Samples were analysed by GC-FID (Agilent 6890) using a SPB-5 GC column (5% diphenyl 226
and 95% siloxane,30 m, 0.32 mm, and 0.25 μm) supplied by Sigma-Aldrich. The injection 227
volume was 1 μl in splitless mode. The make-up gas was nitrogen (25 ml·min-1), and the carrier 228
gas was helium (3 ml·min-1). The hydrogen and air flowed at 30 and 400 ml·min-1, respectively. 229
The inlet and detector temperatures were held at 285 and 320°C, respectively. The oven 230
temperature was held at 60°C for one minute, then ramped at 8°C·min-1 to 290°C, and held for 231
11
6.75 minutes. The total programme time was 36.5 min. The calibration standards were EPH 232
aliphatic hydrocarbons and polynuclear aromatic hydrocarbons mixtures (Sigma-Aldrich). The 233
OpenLab CDS Chemstation Edition software Version C.01.07 (Agilent Technologies) was 234
used to extract and analyse the chromatograms. The EPH fractions analysed were the C10-C18 235
and C19-C36 aliphatic fractions, and the C11-C22 aromatic fraction. The total EPH concentration 236
was the sum of the three fractions mentioned above. 237
238
3. Results and Discussion 239
240
3.1. Oil sludges 241
242
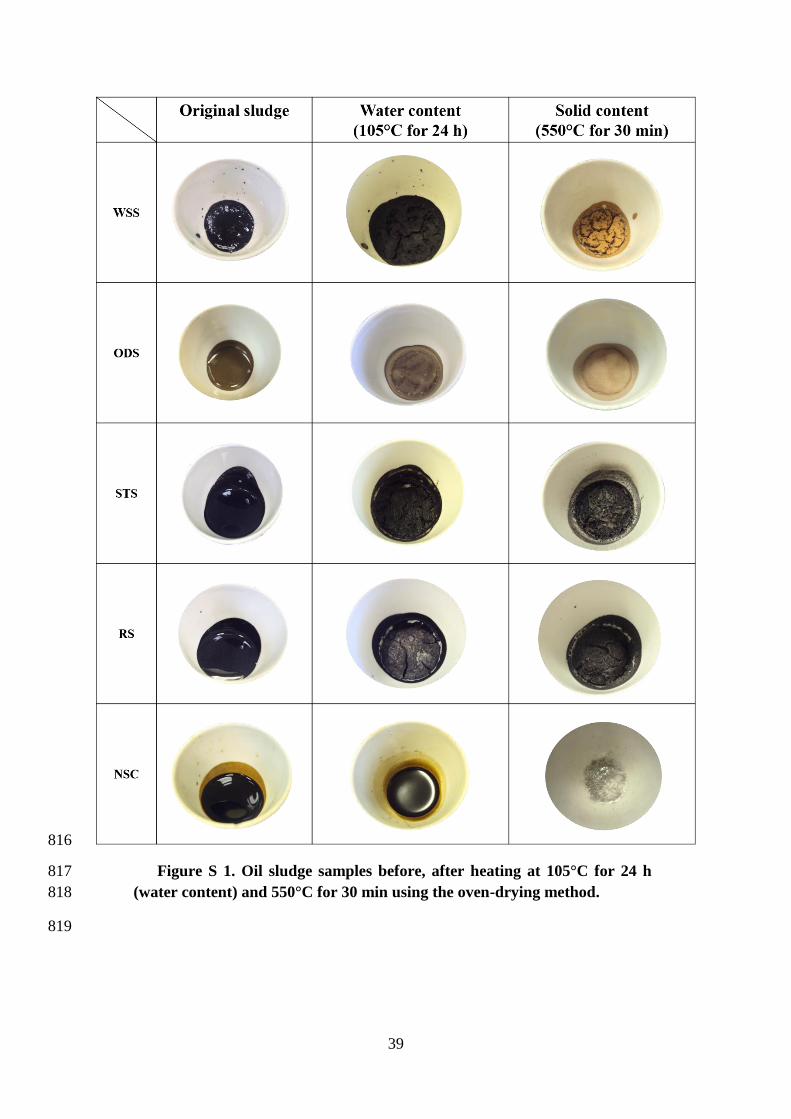
The oil sludges were obtained in the UK. The sludges presented a semi-solid condition 243
at room temperature (Figure S 1). The WSS sludge was from an oil-water separator used in an 244
oil refinery facility. The appearance of this sludge was black and viscous. The ODS sample 245
was a sludge from an oil drilling process with a brown and viscous appearance. The STS and 246
RS samples were obtained from two metal removal procedures (i.e. gravitational settling for 247
STS and centrifugation for RS) applied to waste engine oils mixed with oil additives. RS 248
seemed more viscous than STS. The NSC sample was viscous and black and was obtained 249
from an oil refinery process. The datasets used in this study are publicly available on the 250
Mendeley data repository linked to this work. 251
252
3.2. Characteristics of oil sludges 253
254
12
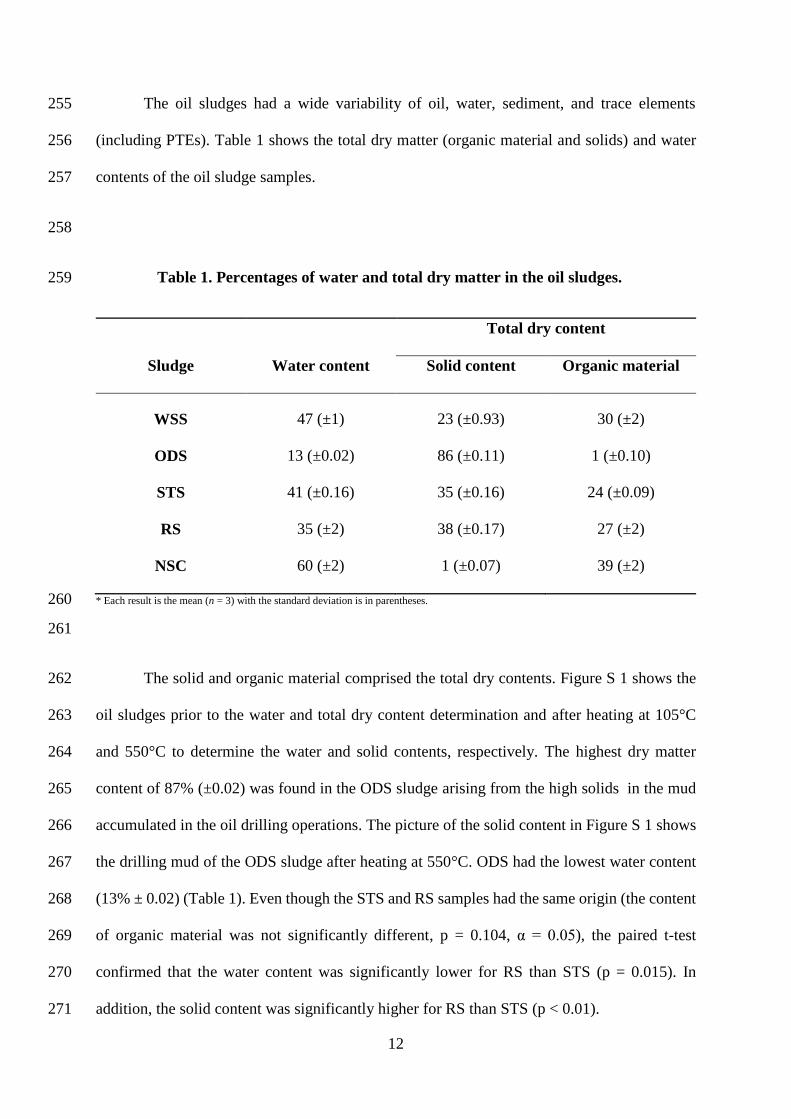
The oil sludges had a wide variability of oil, water, sediment, and trace elements 255
(including PTEs). Table 1 shows the total dry matter (organic material and solids) and water 256
contents of the oil sludge samples. 257
258
Table 1. Percentages of water and total dry matter in the oil sludges. 259
Total dry content
Sludge Water content Solid content Organic material
WSS 47 (±1) 23 (±0.93) 30 (±2)
ODS 13 (±0.02) 86 (±0.11) 1 (±0.10)
STS 41 (±0.16) 35 (±0.16) 24 (±0.09)
RS 35 (±2) 38 (±0.17) 27 (±2)
NSC 60 (±2) 1 (±0.07) 39 (±2)
* Each result is the mean (n = 3) with the standard deviation is in parentheses. 260
261
The solid and organic material comprised the total dry contents. Figure S 1 shows the 262
oil sludges prior to the water and total dry content determination and after heating at 105°C 263
and 550°C to determine the water and solid contents, respectively. The highest dry matter 264
content of 87% (±0.02) was found in the ODS sludge arising from the high solids in the mud 265
accumulated in the oil drilling operations. The picture of the solid content in Figure S 1 shows 266
the drilling mud of the ODS sludge after heating at 550°C. ODS had the lowest water content 267
(13% ± 0.02) (Table 1). Even though the STS and RS samples had the same origin (the content 268
of organic material was not significantly different, p = 0.104, α = 0.05), the paired t-test 269
confirmed that the water content was significantly lower for RS than STS (p = 0.015). In 270
addition, the solid content was significantly higher for RS than STS (p < 0.01). 271
13
According to the oven-drying method performed in this study, NSC had the lowest solid 272
content (1% ± 0.07) due to the highest dried organic material present in this sludge (39% ± 2). 273
In fact, the picture of the solid content of this sludge shows the residual ash after burning at 274
550°C (Figure S 1). The high organic material content in NSC could be partially related with 275
heavy oil hydrocarbon fractions due to the heating at 550°C. In fact, Zubaidy and Abouelnasr 276
(2010) mentioned that the oil mass fraction is an estimated value of the organic material content 277
in the sludge. Therefore, this information is important because it shows that the oil sludge has 278
the potential to be treated by an oil recovery method. In addition, NSC had the highest water 279
content (60% ± 2). However, it was expected that NSC had the lowest water content because 280
this sample was an oil-refined sludge with mostly crude oil, which was evidenced after drying 281
at 105°C (Figure S 1). This low water content can be due not only to water loss but also to the 282
volatilisation of light hydrocarbons after heating at 105°C. Therefore, the method used in this 283
study overestimated the water content value in the sludge. Jin et al. (2014) also found that the 284
oven-drying method for the assessment of water content was overestimating its content value 285
due to volatilisation of oil hydrocarbons. Even though this method was overestimating the 286
contents of water in the present study, it is suitable to determine the sediment or dry content in 287
oil sludges. If other methods such as thermogravimetric analysis (TGA) method were used to 288
determine the dry content of the oil sludge coupled with Fourier-transform infrared 289
spectroscopy (FTIR), this could distinguish water from light hydrocarbons. 290
291
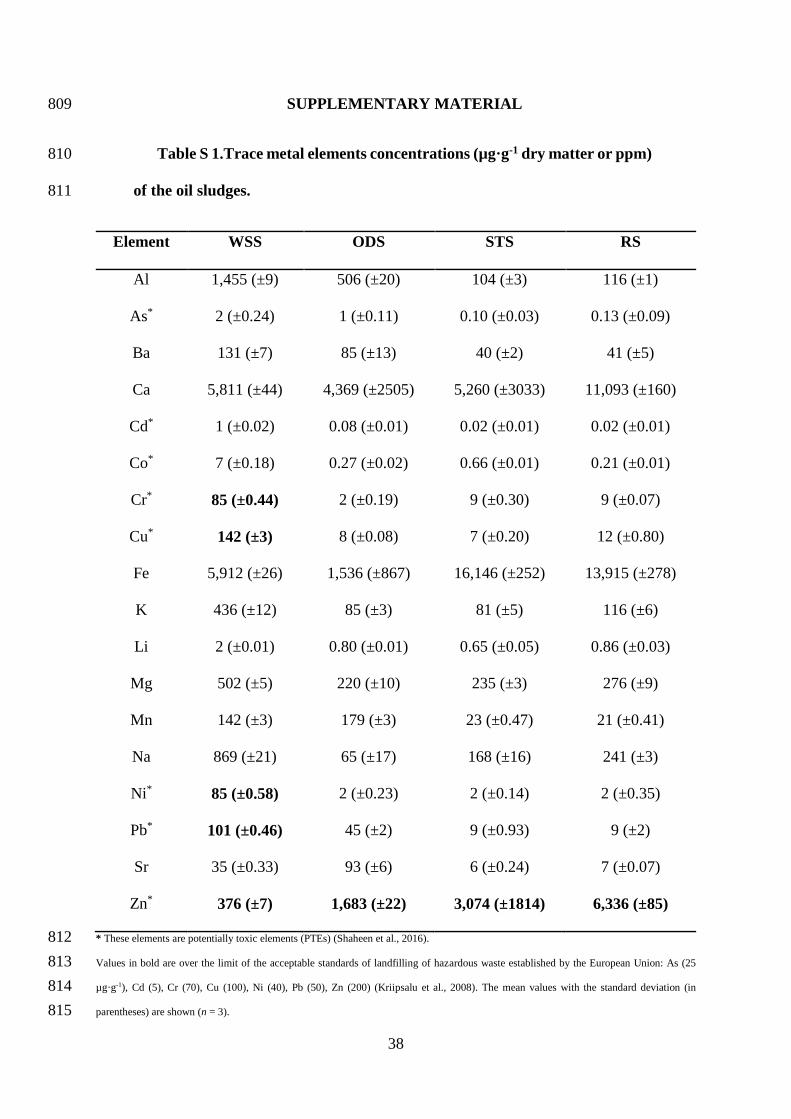
The metal concentrations in the oil sludges are shown in Table S 1. The WSS sludge 292
had higher concentrations in most of the metals than the other samples. The oil sludges were 293
under the limit of acceptable concentrations in metals for landfilling purposes fixed by the 294
European Union (Kriipsalu et al., 2008). The WSS sample had higher PTE levels than other 295
samples with Cr (85 ± 0.44), Cu (142 ± 3), Zn (376 ± 7) and (Ni 85 ± 0.58) ppm. The 296
14
concentrations were also higher than the limit in the other sludges. The higher levels of Zn in 297
all sludges were expected since this metal can be found in the porphyrin compounds from 298
petroleum (Jasmine and Mukherji, 2015). Ca and Fe were the elements with the highest 299
concentrations in all sludges (> 1,000 µg·g-1). For example, Fe concentrations were higher in 300
STS (16,146 ± 252 ppm) and RS sludge (13,915 ± 278) than the other samples. This result 301
agreed with previous analysis of a tank bottom oil sludge (Jasmine and Mukherji, 2015) who 302
proposed that the high concentrations of Ca and Fe can be due to calcite minerals and the 303
material of the tank walls, respectively. Moreover, Schirmacher et al. (1993) reported that 304
usually high concentrations of Zn, Ca, and Fe are obtained from oil sludges. Also, da Rocha et 305
al. (2010) found high Fe levels (34,500 ppm) in an oil refinery tank bottom sludge, and 306
Karamalidis et al. (2008) reported a Fe concentration of 92,179 ppm in an oil refinery sludge. 307
Other trace elements analysed included Ba, K, Li, Mg, Mn, Na, and Sr, and these levels were 308
higher for WSS than the other samples. There were no results for NSC due to the limitation on 309
the amount of the sample. These results showed the importance to consider the analysis of the 310
trace elements in the oil sludges, so this should be also considered in the decision-making of 311
the treatment of these wastes. Hu et al. (2013) mentioned the importance of the characterisation 312
of heavy metals in oil sludges. For instance, if the oil is recovered to be reused as fuel, the 313
metals can interfere with the catalysts used in thermal cracking of heavy to light oil 314
hydrocarbon fractions (Elektorowicz and Muslat, 2008, Khan et al., 2019). Also, it has been 315
reported that Ni and V in interaction with Na in the recovered oil from the oil sludge can 316
originate corrosion issues in the petroleum facilities (Abbas et al., 2010). The WSS sludge had 317
the highest concentrations of most of the PTEs, so its treatment can include a strategy to contain 318
these elements. For instance, if pyrolysis is applied to treat this sludge, the PTEs can be 319
concentrated in the char, the final solid product of the process (Shen and Zhang, 2003). 320
321
15
3.3. High-field NMR (oil and water contents) 322
323
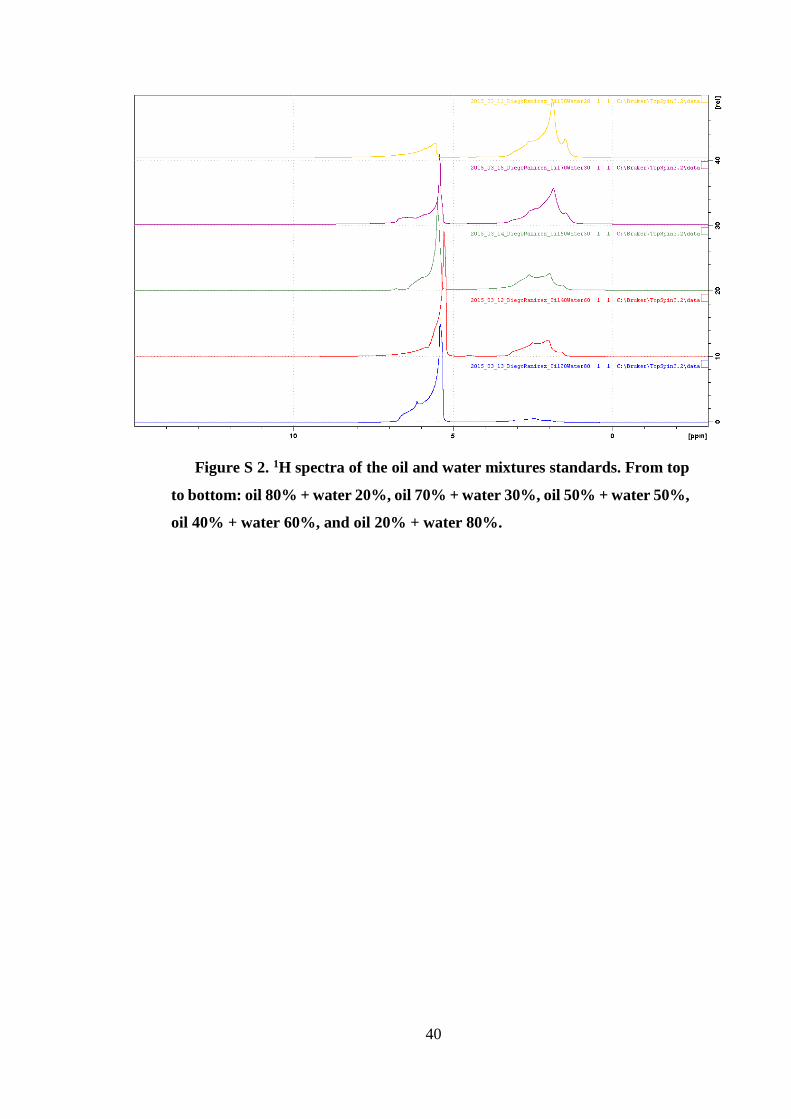
Firstly, different oil and water mixtures standards were evaluated to validate the NMR 324
procedure. Figure S 2 shows the 1H spectra of these standards. All spectra showed two broad 325
resonances attributed to oil (centred at ca. 2.4ppm) and water (centred at ca. 5.4 ppm) which 326
are consequent with the expected oil and water contents in the standards. For instance, the 1H 327
spectrum of the oil 80% + water 20% standard at the top of Figure S 2 shows the high content 328
of oil in the high intensity peak at c.a. 2.4 ppm whereas the oil 20% + water 80% (i.e. the 329
spectrum at the bottom of Figure S 2) shows a high intensity peak at c.a. 5.4 ppm attributed to 330
water. A fair resolution of the spectra allowed direct integration of the signals attributed to oil 331
and water. The peaks found in the 1H spectra corresponded to the aliphatic carbon fraction from 332
0.5 to 4 ppm and the aromatic carbon fraction from the 6 to 9 ppm region. In the case of the 333
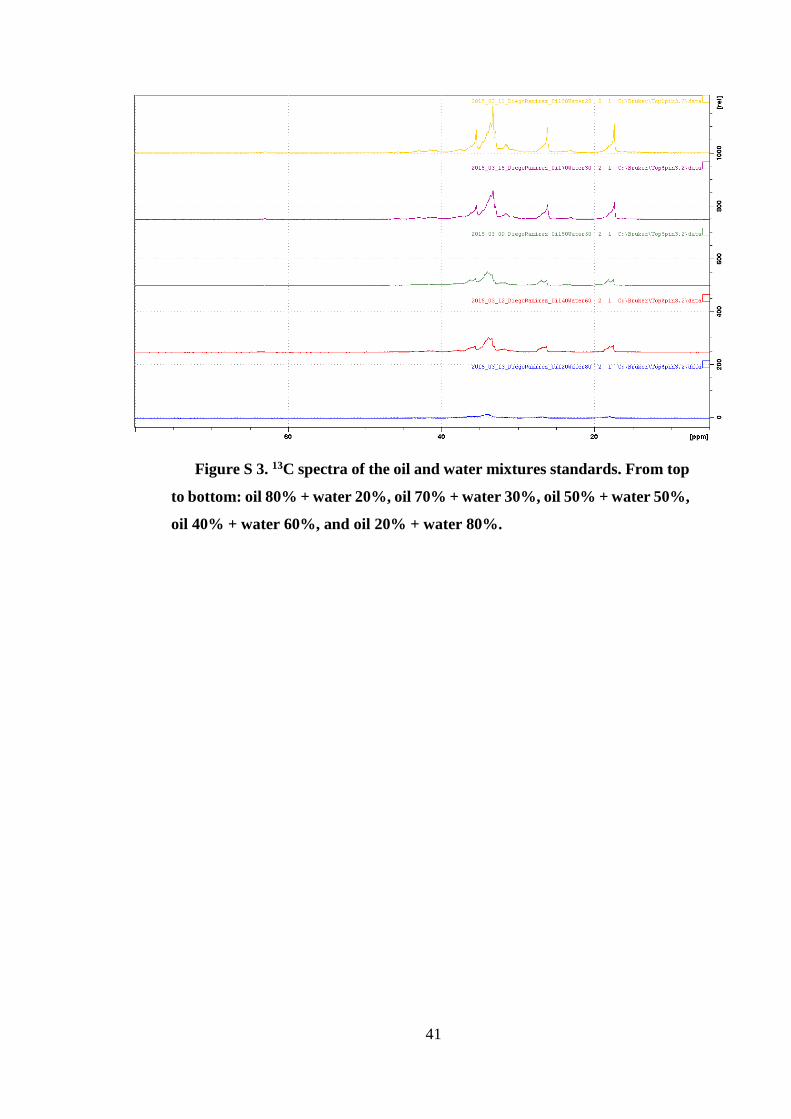
13C spectra (Figure S 3), the 10-60 ppm and 110-160 ppm regions corresponded to the aliphatic 334
and aromatic carbon fractions, respectively (Ancheyta et al., 2002, Trejo et al., 2005, Nakada 335
et al., 2016). Figure S 3 shows that the oil from the standards had a presence of the aliphatic 336
fraction because there are some peaks after c.a. 15 ppm to 40 ppm, and there were no signals 337
characteristic of aromatic carbons. The intensities of the peaks between 15 and 40 ppm were 338
consistent with the proportion of oil in the standard. Therefore, the standard with the highest 339
oil content (i.e. oil 80% + water 20% standard; top of Figure S 3) showed peaks with high 340
intensity. Conversely, the standards with low oil content showed peaks with low intensity. 341
These results showed the potential use of high field NMR to differentiate between aliphatic 342
and aromatic components in the 13C spectra. 343
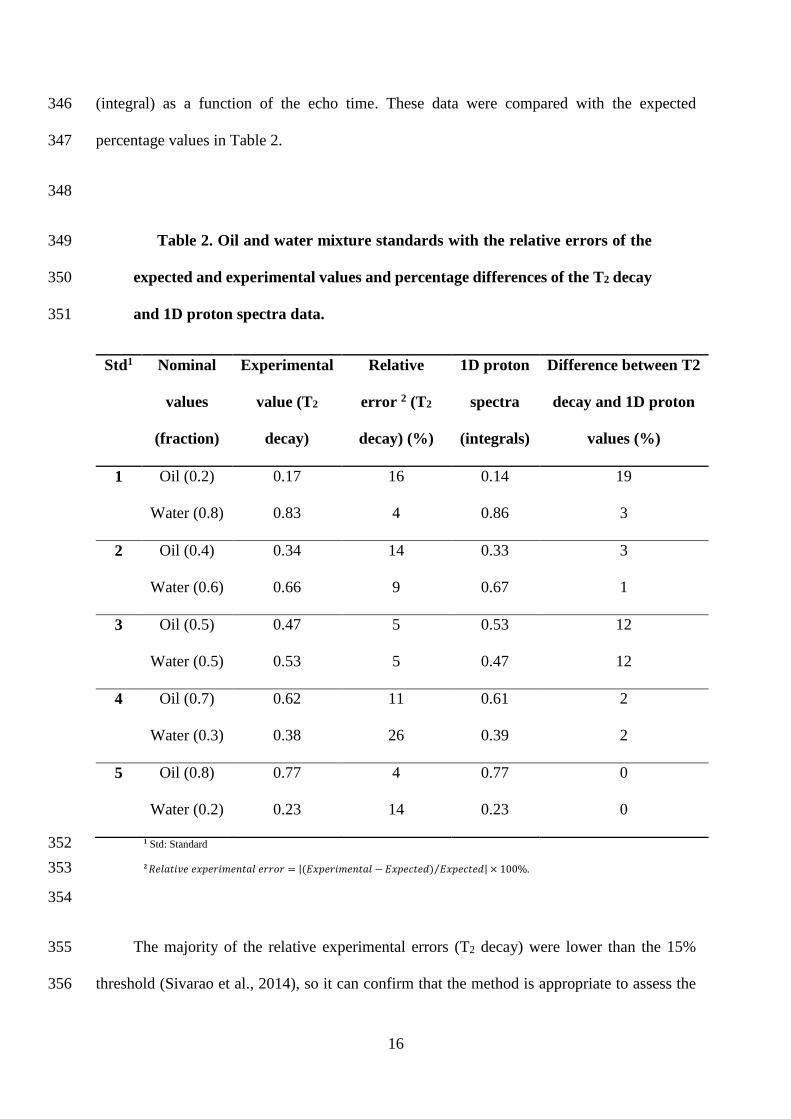
The ratio of oil and water for each standard was estimated from the 1H spectrum directly 344
(integrals of the two resonances) and the T2 decay which shows the decay of the signal intensity 345
16
(integral) as a function of the echo time. These data were compared with the expected 346
percentage values in Table 2. 347
348
Table 2. Oil and water mixture standards with the relative errors of the 349
expected and experimental values and percentage differences of the T2 decay 350
and 1D proton spectra data. 351
Std1 Nominal
values
(fraction)
Experimental
value (T2
decay)
Relative
error 2 (T2
decay) (%)
1D proton
spectra
(integrals)
Difference between T2
decay and 1D proton
values (%)
1 Oil (0.2) 0.17 16 0.14 19
Water (0.8) 0.83 4 0.86 3
2 Oil (0.4) 0.34 14 0.33 3
Water (0.6) 0.66 9 0.67 1
3 Oil (0.5) 0.47 5 0.53 12
Water (0.5) 0.53 5 0.47 12
4 Oil (0.7) 0.62 11 0.61 2
Water (0.3) 0.38 26 0.39 2
5 Oil (0.8) 0.77 4 0.77 0
Water (0.2) 0.23 14 0.23 0
1 Std: Standard 352
2 𝑅𝑒𝑙𝑎𝑡𝑖𝑣𝑒 𝑒𝑥𝑝𝑒𝑟𝑖𝑚𝑒𝑛𝑡𝑎𝑙 𝑒𝑟𝑟𝑜𝑟 = |(𝐸𝑥𝑝𝑒𝑟𝑖𝑚𝑒𝑛𝑡𝑎𝑙 − 𝐸𝑥𝑝𝑒𝑐𝑡𝑒𝑑) 𝐸𝑥𝑝𝑒𝑐𝑡𝑒𝑑⁄ | × 100%. 353
354
The majority of the relative experimental errors (T2 decay) were lower than the 15% 355
threshold (Sivarao et al., 2014), so it can confirm that the method is appropriate to assess the 356
17
oil and water contents (Table 2). Two experimental errors were higher than this threshold, the 357
oil content in standard 1 (16%) and the water content in standard 4 (26%). 358
The percentage differences between the CPMG T2 decay data and 1D proton spectra were 359
lower than 5% (except for standard 3 and the oil fraction in standard 1), which indicated a good 360
agreement between both and supported the consistency of the results (Table 2). 361
The differences obtained between the expected and experimental values of the standards 362
can be due to the difficulties in preparing the exact oil and water ratios. The NMR tubes were 363
very narrow (5 mm), and it was necessary to load the sample with a long-tip Pasteur pipette to 364
reach the bottom of the tube. It is possible that some small volume of the viscous liquid of the 365
sample has remained in the pipette after the loading, so the exact nominal ratio was not 366
obtained. 367
The linear regression of the NMR-calculated oil and water content as a function of the 368
nominal values showed an acceptable linear correlation in both oil and water contents, and the 369
R2 coefficient was 0.990 which confirms that the discrepancy between nominal and 370
experimental values were due to problems with loading the standard samples into the NMR 371
tube. This simple analysis allowed to estimate the maximum error related to preparation and 372
manipulation of the samples to be no larger than 20%. This value was considered for the 373
calculation of the oil/water content experimental error in the sludges in the next step. 374
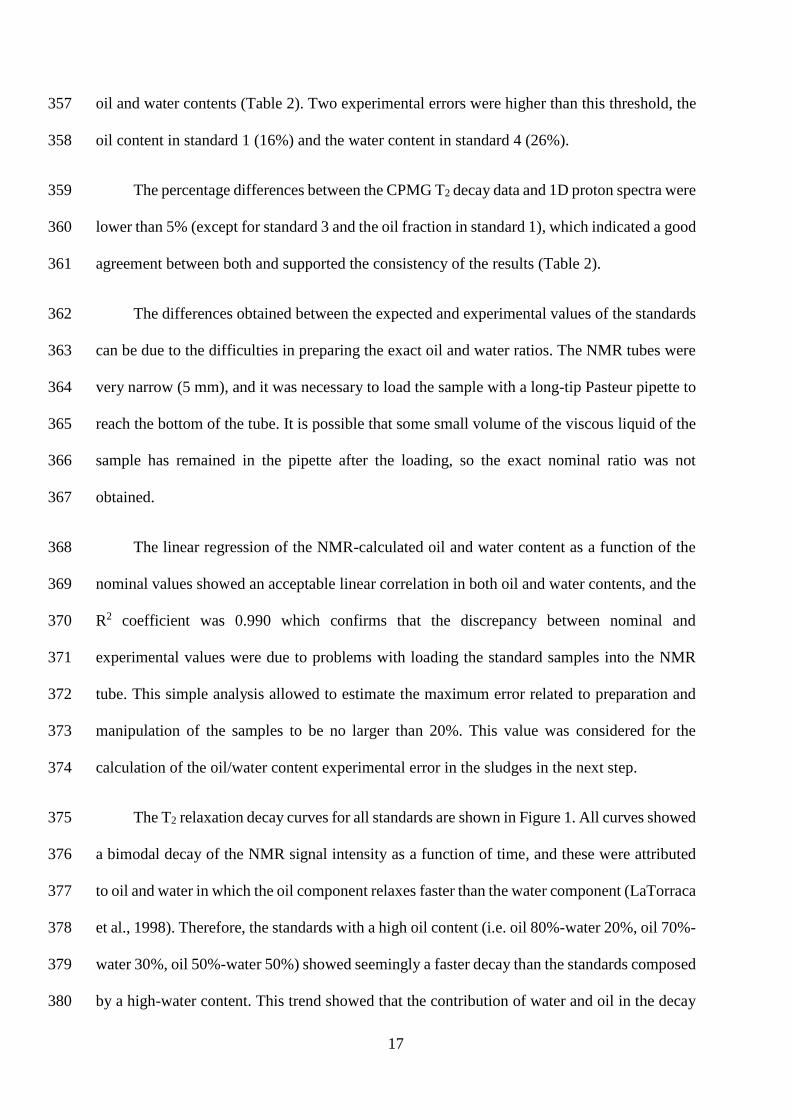
The T2 relaxation decay curves for all standards are shown in Figure 1. All curves showed 375
a bimodal decay of the NMR signal intensity as a function of time, and these were attributed 376
to oil and water in which the oil component relaxes faster than the water component (LaTorraca 377
et al., 1998). Therefore, the standards with a high oil content (i.e. oil 80%-water 20%, oil 70%-378
water 30%, oil 50%-water 50%) showed seemingly a faster decay than the standards composed 379
by a high-water content. This trend showed that the contribution of water and oil in the decay 380
18
curve can be obtained by extracting the amplitudes of both components. The fraction content 381
of oil and water in each standard sample can be then calculated and results were presented as 382
showed in Table 2. 383
384
Time (ms)
0 1000 2000 3000 4000 5000
Inte
nsity (
a.u
.)
0
5e+7
1e+8
2e+8
2e+8
3e+8
3e+8 Oil 20%-Water 80%
Oil 40%-Water 60%
Oil 50%-Water 50%
Oil 70%-Water 30%
Oil 80%-Water 20%
385
386
Figure 1. Carr-Purcell-Meiboom-Gill (CPMG) T2 relaxation decay 387
curves of the oil and water mixtures standards (%). T2 decay shows the decay 388
of the signal intensity (integral) as a function of the echo time. 389
(THIS IS A 2-COLUMN FITTING IMAGE) 390
391
19
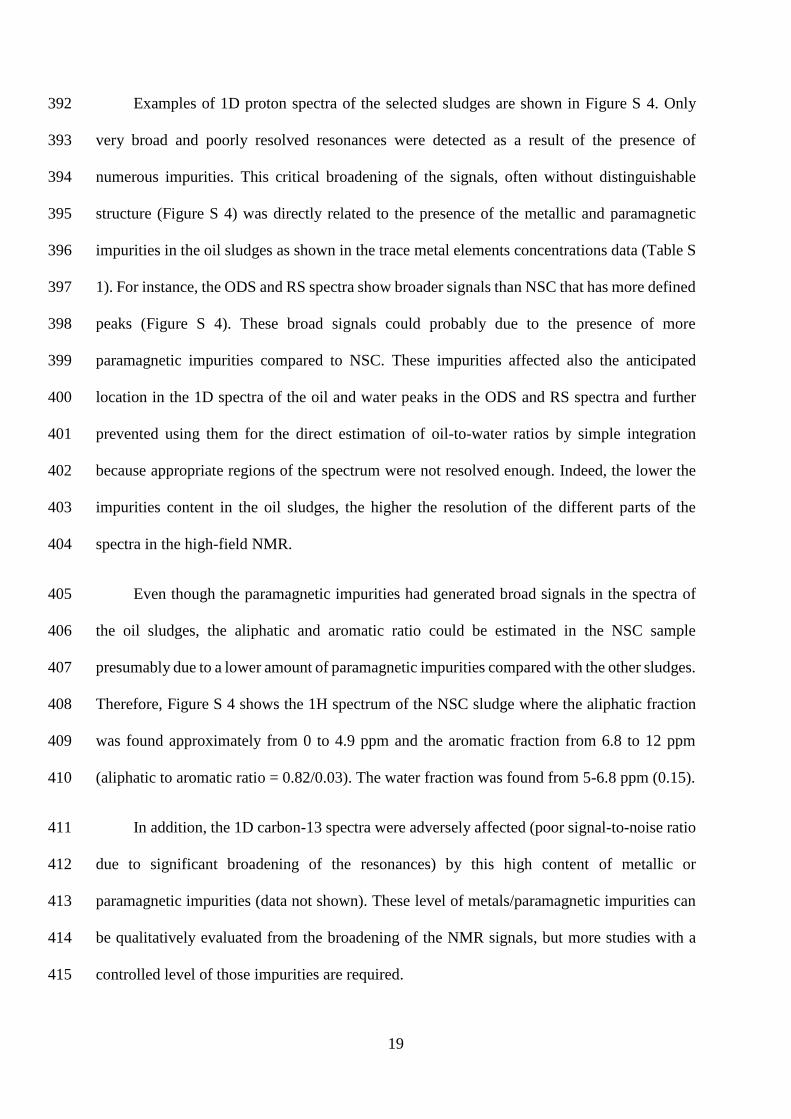
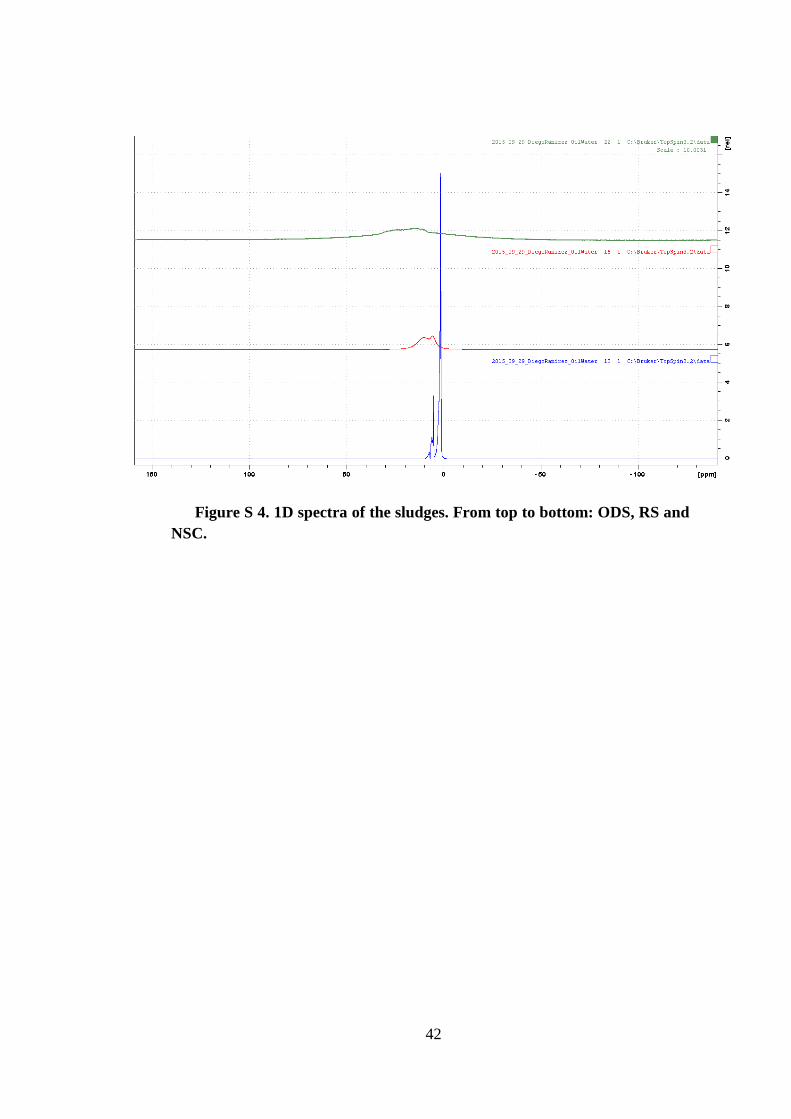
Examples of 1D proton spectra of the selected sludges are shown in Figure S 4. Only 392
very broad and poorly resolved resonances were detected as a result of the presence of 393
numerous impurities. This critical broadening of the signals, often without distinguishable 394
structure (Figure S 4) was directly related to the presence of the metallic and paramagnetic 395
impurities in the oil sludges as shown in the trace metal elements concentrations data (Table S 396
1). For instance, the ODS and RS spectra show broader signals than NSC that has more defined 397
peaks (Figure S 4). These broad signals could probably due to the presence of more 398
paramagnetic impurities compared to NSC. These impurities affected also the anticipated 399
location in the 1D spectra of the oil and water peaks in the ODS and RS spectra and further 400
prevented using them for the direct estimation of oil-to-water ratios by simple integration 401
because appropriate regions of the spectrum were not resolved enough. Indeed, the lower the 402
impurities content in the oil sludges, the higher the resolution of the different parts of the 403
spectra in the high-field NMR. 404
Even though the paramagnetic impurities had generated broad signals in the spectra of 405
the oil sludges, the aliphatic and aromatic ratio could be estimated in the NSC sample 406
presumably due to a lower amount of paramagnetic impurities compared with the other sludges. 407
Therefore, Figure S 4 shows the 1H spectrum of the NSC sludge where the aliphatic fraction 408
was found approximately from 0 to 4.9 ppm and the aromatic fraction from 6.8 to 12 ppm 409
(aliphatic to aromatic ratio = 0.82/0.03). The water fraction was found from 5-6.8 ppm (0.15). 410
In addition, the 1D carbon-13 spectra were adversely affected (poor signal-to-noise ratio 411
due to significant broadening of the resonances) by this high content of metallic or 412
paramagnetic impurities (data not shown). These level of metals/paramagnetic impurities can 413
be qualitatively evaluated from the broadening of the NMR signals, but more studies with a 414
controlled level of those impurities are required. 415
20
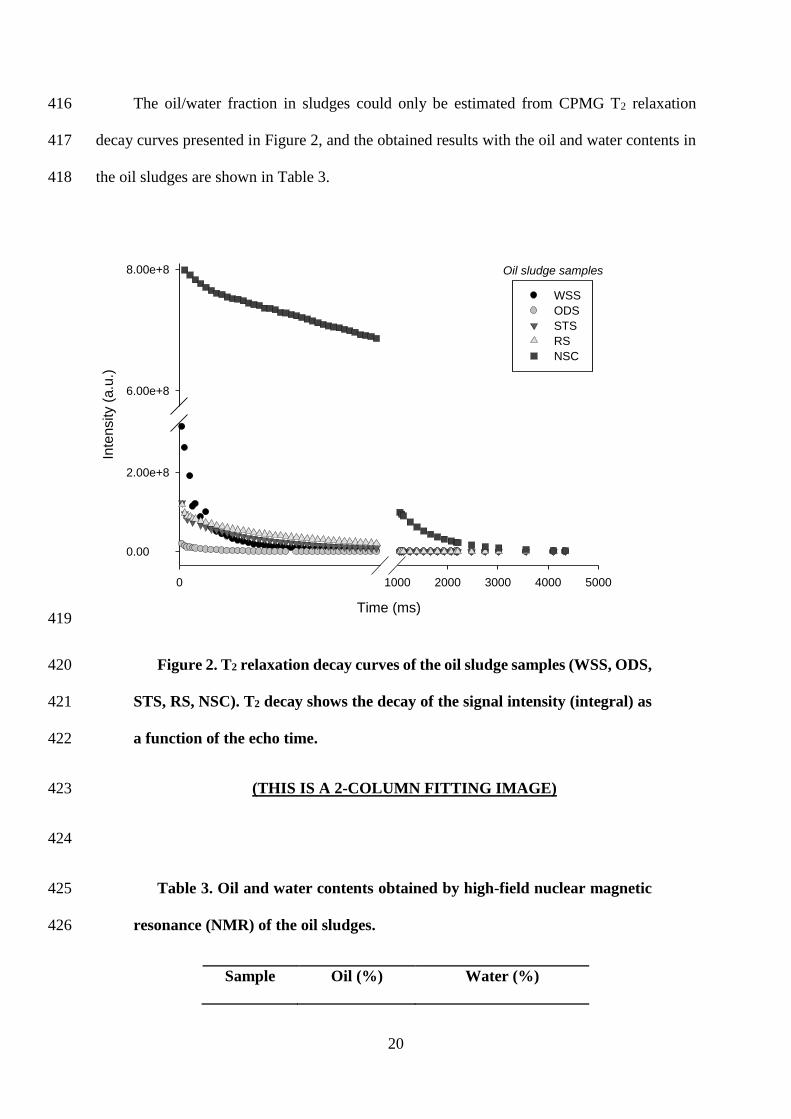
The oil/water fraction in sludges could only be estimated from CPMG T2 relaxation 416
decay curves presented in Figure 2, and the obtained results with the oil and water contents in 417
the oil sludges are shown in Table 3. 418
Time (ms)
0 1000 2000 3000 4000 5000
Inte
nsity (
a.u
.)
0.00
2.00e+8
6.00e+8
8.00e+8
WSS
ODS
STS
RS
NSC
Oil sludge samples
419
Figure 2. T2 relaxation decay curves of the oil sludge samples (WSS, ODS, 420
STS, RS, NSC). T2 decay shows the decay of the signal intensity (integral) as 421
a function of the echo time. 422
(THIS IS A 2-COLUMN FITTING IMAGE) 423
424
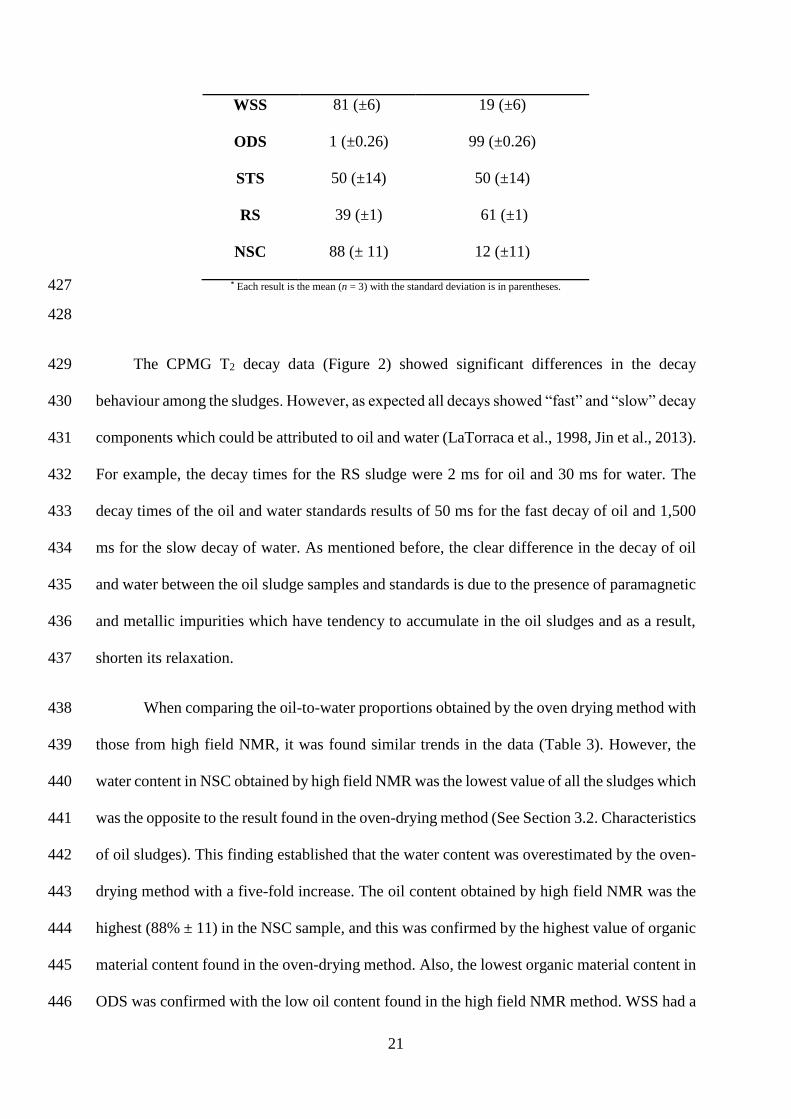
Table 3. Oil and water contents obtained by high-field nuclear magnetic 425
resonance (NMR) of the oil sludges. 426
Sample Oil (%) Water (%)
21
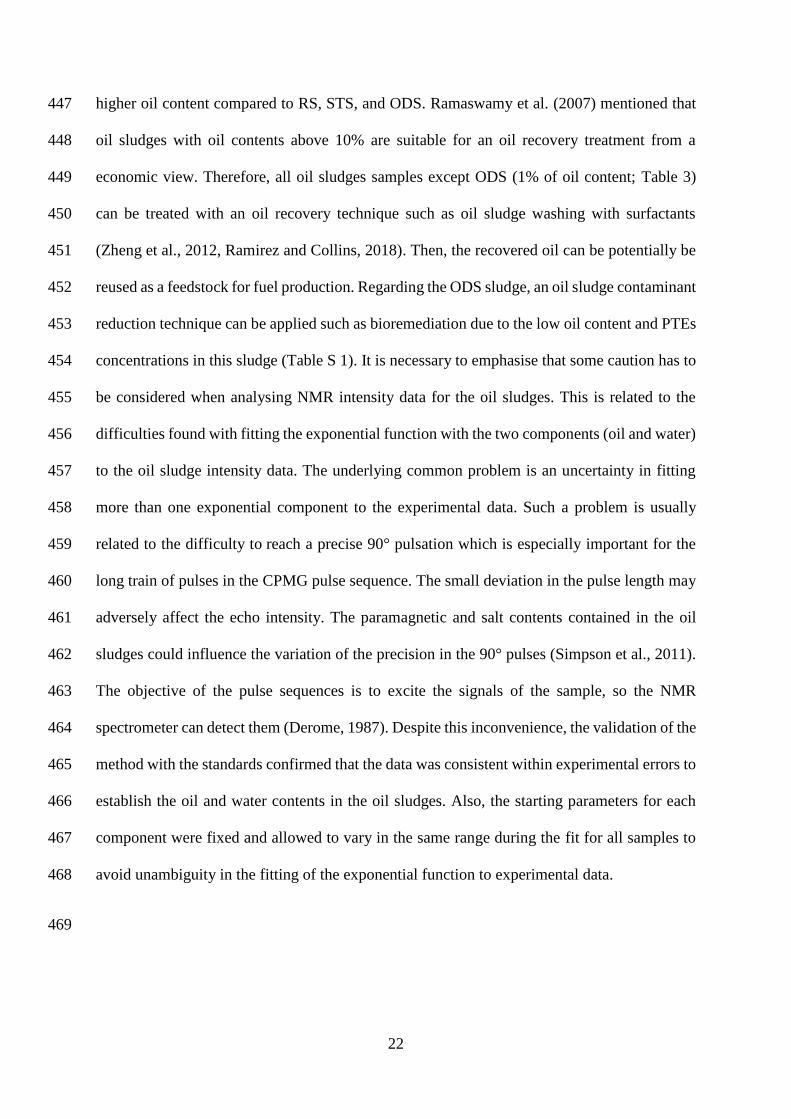
WSS 81 (±6) 19 (±6)
ODS 1 (±0.26) 99 (±0.26)
STS 50 (±14) 50 (±14)
RS 39 (±1) 61 (±1)
NSC 88 (± 11) 12 (±11)
* Each result is the mean (n = 3) with the standard deviation is in parentheses. 427
428
The CPMG T2 decay data (Figure 2) showed significant differences in the decay 429
behaviour among the sludges. However, as expected all decays showed “fast” and “slow” decay 430
components which could be attributed to oil and water (LaTorraca et al., 1998, Jin et al., 2013). 431
For example, the decay times for the RS sludge were 2 ms for oil and 30 ms for water. The 432
decay times of the oil and water standards results of 50 ms for the fast decay of oil and 1,500 433
ms for the slow decay of water. As mentioned before, the clear difference in the decay of oil 434
and water between the oil sludge samples and standards is due to the presence of paramagnetic 435
and metallic impurities which have tendency to accumulate in the oil sludges and as a result, 436
shorten its relaxation. 437
When comparing the oil-to-water proportions obtained by the oven drying method with 438
those from high field NMR, it was found similar trends in the data (Table 3). However, the 439
water content in NSC obtained by high field NMR was the lowest value of all the sludges which 440
was the opposite to the result found in the oven-drying method (See Section 3.2. Characteristics 441
of oil sludges). This finding established that the water content was overestimated by the oven-442
drying method with a five-fold increase. The oil content obtained by high field NMR was the 443
highest (88% ± 11) in the NSC sample, and this was confirmed by the highest value of organic 444
material content found in the oven-drying method. Also, the lowest organic material content in 445
ODS was confirmed with the low oil content found in the high field NMR method. WSS had a 446
22
higher oil content compared to RS, STS, and ODS. Ramaswamy et al. (2007) mentioned that 447
oil sludges with oil contents above 10% are suitable for an oil recovery treatment from a 448
economic view. Therefore, all oil sludges samples except ODS (1% of oil content; Table 3) 449
can be treated with an oil recovery technique such as oil sludge washing with surfactants 450
(Zheng et al., 2012, Ramirez and Collins, 2018). Then, the recovered oil can be potentially be 451
reused as a feedstock for fuel production. Regarding the ODS sludge, an oil sludge contaminant 452
reduction technique can be applied such as bioremediation due to the low oil content and PTEs 453
concentrations in this sludge (Table S 1). It is necessary to emphasise that some caution has to 454
be considered when analysing NMR intensity data for the oil sludges. This is related to the 455
difficulties found with fitting the exponential function with the two components (oil and water) 456
to the oil sludge intensity data. The underlying common problem is an uncertainty in fitting 457
more than one exponential component to the experimental data. Such a problem is usually 458
related to the difficulty to reach a precise 90° pulsation which is especially important for the 459
long train of pulses in the CPMG pulse sequence. The small deviation in the pulse length may 460
adversely affect the echo intensity. The paramagnetic and salt contents contained in the oil 461
sludges could influence the variation of the precision in the 90° pulses (Simpson et al., 2011). 462
The objective of the pulse sequences is to excite the signals of the sample, so the NMR 463
spectrometer can detect them (Derome, 1987). Despite this inconvenience, the validation of the 464
method with the standards confirmed that the data was consistent within experimental errors to 465
establish the oil and water contents in the oil sludges. Also, the starting parameters for each 466
component were fixed and allowed to vary in the same range during the fit for all samples to 467
avoid unambiguity in the fitting of the exponential function to experimental data. 468
469
23
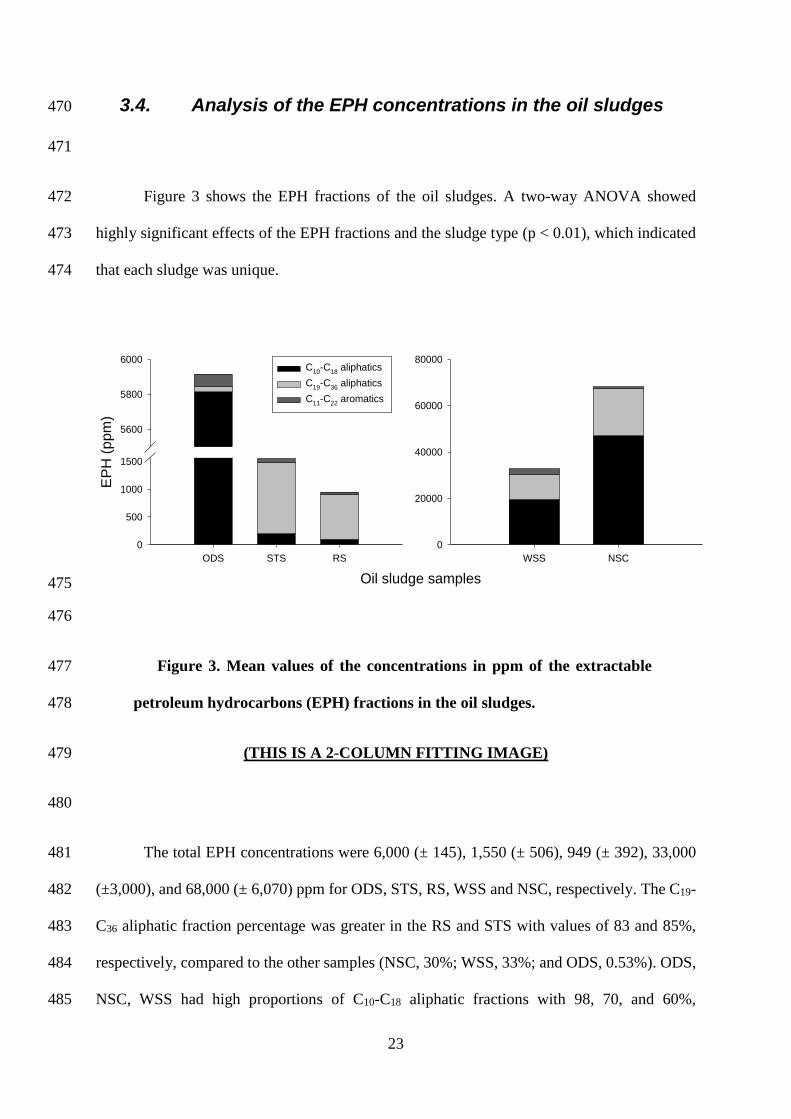
3.4. Analysis of the EPH concentrations in the oil sludges 470
471
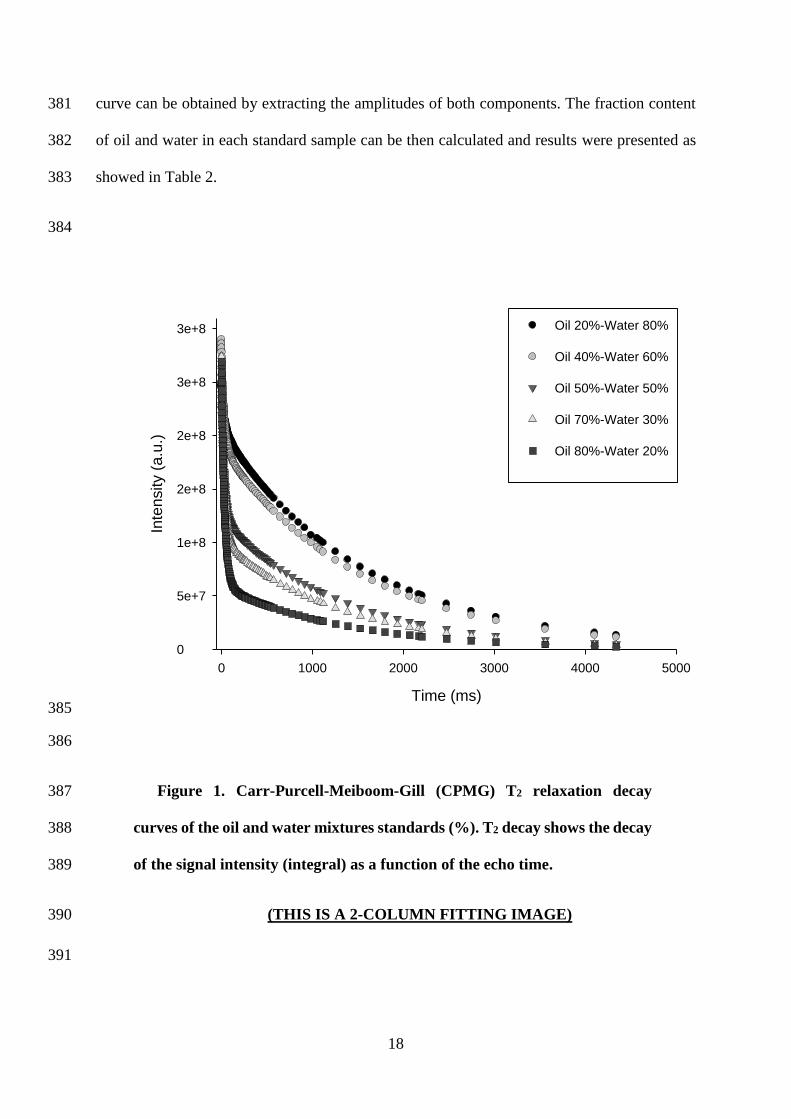
Figure 3 shows the EPH fractions of the oil sludges. A two-way ANOVA showed 472
highly significant effects of the EPH fractions and the sludge type (p < 0.01), which indicated 473
that each sludge was unique. 474
Oil sludge samples
WSS NSC
0
20000
40000
60000
80000
ODS STS RS
EP
H (
ppm
)
0
500
1000
1500
5600
5800
6000C
10-C
18 aliphatics
C19
-C36
aliphatics
C11
-C22
aromatics
475
476
Figure 3. Mean values of the concentrations in ppm of the extractable 477
petroleum hydrocarbons (EPH) fractions in the oil sludges. 478
(THIS IS A 2-COLUMN FITTING IMAGE) 479
480
The total EPH concentrations were 6,000 (± 145), 1,550 (± 506), 949 (± 392), 33,000 481
(±3,000), and 68,000 (± 6,070) ppm for ODS, STS, RS, WSS and NSC, respectively. The C19-482
C36 aliphatic fraction percentage was greater in the RS and STS with values of 83 and 85%, 483
respectively, compared to the other samples (NSC, 30%; WSS, 33%; and ODS, 0.53%). ODS, 484
NSC, WSS had high proportions of C10-C18 aliphatic fractions with 98, 70, and 60%, 485
24
respectively, whereas STS had 13% and RS had 10%. All sludges showed low C11-C22 aromatic 486
fraction concentrations, 1% - 8% (Figure 3). In fact, the aliphatic fraction concentrations in oil 487
sludges are usually higher than the aromatic fractions (Ward et al., 2003, Jasmine and 488
Mukherji, 2015, Kadiev et al., 2015, Shahidi Rizi et al., 2017). 489
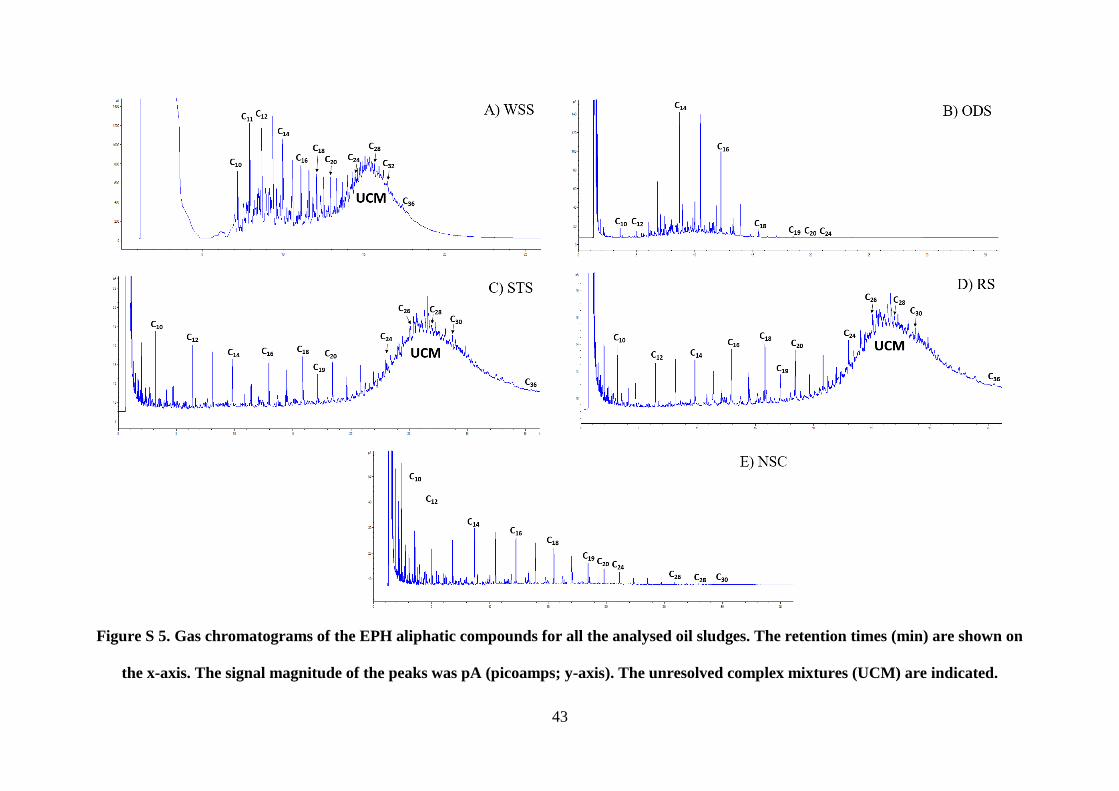
Figure S 5 showed the chromatograms of the aliphatic fractions. The WSS, STS, and 490
RS chromatograms had unresolved complex mixtures (UCM) after C20. The UCMs are 491
considered to be a group of overlapped compounds which cannot be determined by GC-FID 492
(Frysinger et al., 2003), and these are usually found in crude oils at different stages of 493
degradation (Peters et al., 2005). For instance, some biodegradation processes could occur in 494
the storage tanks (where oil sludges can be found) due to the action of the native and crude oil-495
resistant microbiota (Giles, 2010), and the water and sediments from the sludge could promote 496
this biodegradation. 497
The UCMs were related with the high C19-C36 aliphatic fraction concentrations found 498
in STS and RS (Figure 3, Figure S 5C and D). This presence of UCMs in RS and STS could 499
be related with the fact that these sludges had waste engine oil with oil additives which is 500
related with the lubrication feature of the oil. In fact, Gough and Rowland (1990) mentioned 501
that UCMs are characteristic of lubricating oils and other refined oil fractions. 502
The information retrieved from EPH analyses can be an initial step to anticipate the 503
probable reuse of the oil contained in the sludge. Therefore, the recovered oil can be reused as 504
diesel fuel if a high light aliphatic fraction concentration is present (Zhao et al., 2017). For 505
example, NSC and WSS with their high content of C10-C18 aliphatic hydrocarbon compounds 506
can be treated with an oil recovery method to extract the oil and be reused. In fact, the GC 507
profile of NSC (Figure S 5E) was similar to the GC profile of the common crude oil, which 508
indicates that this oil is an ideal candidate for reusing purposes due to its potential quality 509
25
similar to pure crude oil. For instance, Villalanti et al. (2006) mentioned that GC can be used 510
as a rapid method for the analysis of the oil hydrocarbons fractions and gives information on 511
the potential reuse of crude oils. In addition, Hu et al. (2015) stated that the quality of the oil 512
can be evaluated by checking the EPH concentrations in the GC profiles. On the contrary, Giles 513
(2010) mentioned that the quality of the oil cannot be measured directly with GC profiles, and 514
that the oil must be fractionated by distillation methods to confirm its quality. Therefore, the 515
use in this study of the GC profiles was not contemplated as a complete validation of the oil 516
quality, but it was considered as an initial point to establish the potential reuse of the oil in the 517
fuel production. Other tests can be used to evaluate directly the quality such as the API gravity, 518
sulphur content, heat of combustion, and the pour and flash point (Zubaidy and Abouelnasr, 519
2010, Hu et al., 2015). 520
Regarding the ODS, STS, RS oil sludges, the total EPH concentrations were lower than 521
the suggested clean-up level of 10,000 ppm in soils in industrial areas (Shelley et al., 1997), so 522
bioremediation techniques such as landfarming and phytoremediation of these oil sludges can 523
be used to treat these sludges by its amending to a designated soil area (Ramirez and Dussan, 524
2014). In addition, the PTEs concentrations of these sludges (except for Zn) were lower than 525
the 2,500-ppm threshold (Table S 1). Higher concentrations than this threshold have been 526
reported to be toxic for most microbiota (USEPA, 2004). 527
Since NSC and WSS had total EPH concentrations higher than 10,000 ppm, this 528
bioremediation technique cannot be appropriate because these high concentrations can be toxic 529
for the microbiota and plants. In fact, it has been reported that EPH concentrations higher than 530
50,000 ppm are generally toxic for most of the microbiota (USEPA, 2004). Therefore, NSC 531
(68,000 ± 6,070 ppm) must be pre-treated first with an oil recovery technique, and then a 532
bioremediation technique can be selected to treat the residual sludge. 533
26
534
4. Conclusions 535
536
The oil sludges used in this study came from different sources and presented a broad range 537
of organic and inorganic co-contamination consistent with the high complexity present in this 538
type of samples. It is very important to characterise in detail such complex samples because 539
their treatment strongly depends on their composition. What is more, if the characterisation 540
prior to treatment can be standardised for sludges from different sources, that would have a 541
positive economic impact and more of such waste could be treated and recycled. 542
This study reported a use of different techniques to analyse different types of oil sludge 543
samples, but uniquely in a uniform and standardised way, which gave complementary 544
information about the water-to-oil ratio, aliphatic and aromatic components, sediment content, 545
and trace elements and PTEs. Our comprehensive results showed that an oil recovery method 546
(e.g. oil sludge washing with surfactants) can be applied in oil sludges with a high content of 547
oil such as the NSC and WSS sludges. Also, STS and RS are suitable to be treated with an oil 548
recovery technique because the oil contents were higher than the 10% threshold which is 549
economically acceptable. 550
The high PTEs concentrations in the WSS sample suggest that pyrolysis should be 551
considered to contain these elements in the char, which is a solid product of this treatment. Our 552
results also showed that the ODS sludge is only suitable to be treated by an oil sludge 553
contaminant reduction technique (e.g. bioremediation) due to its low oil content (1%) and PTEs 554
concentrations. Low PTE concentrations are not toxic for most of the microbiota used in 555
bioremediation processes. 556
27
This study showed that high-field NMR can be an alternative tool for waste researchers and 557
petroleum engineers to rapidly calculate the water and oil contents, qualitatively access the 558
concentration of the paramagnetic and metallic impurities, and in case of their absence or low 559
concentration find the aliphatic and aromatic content of the sludges. The unquestionable 560
advantage of this widely available analytical tool is that all that information could be potentially 561
elucidated from a single 1H NMR spectrum. However, more calibration studies are required to 562
extend these procedures beyond the qualitative assessment. 563
The oven-drying method can determine the sediment content in the sludges. The assessment 564
of oil hydrocarbons fractions by both GC-FID and high-field NMR can evaluate the possible 565
reuse of the oil as fuel. Moreover, the gas chromatogram profiles provide evidence of a 566
weathering condition and a possible degradation of the oil from the sludge by the presence of 567
UCMs, as shown in the STS and RS samples. Due to the high concentration of some of the 568
PTEs and their potentially hazardous effects, future studies should consider the analysis of 569
these elements. 570
571
572
5. Acknowledgements 573
574
Diego Ramirez would like to thank the Colombian Administrative Department of Science, 575
Technology and Innovation, Colciencias, for the financial support from the Call 529 (2011) 576
during his PhD studies. The funding source did not have any involvement in design, 577
development and production of this study. 578
579
28
6. References 580
581
Abbas, S., Maqsood, Z. T. and Ali, M. F. (2010) 'The Demetallization of Residual Fuel Oil and 582
Petroleum Residue', Petroleum Science and Technology, 28(17), pp. 1770-1777. 583
Ancheyta, J., Centeno, G., Trejo, F., Marroquín, G., García, J. A., Tenorio, E. and Torres, A. 584
(2002) 'Extraction and Characterization of Asphaltenes from Different Crude Oils and 585
Solvents', Energy & Fuels, 16(5), pp. 1121-1127. 586
Chen, J. Y., Luong, H. V. T. and Liu, J. C. (2015) 'Fractionation and release behaviors of 587
metals (In, Mo, Sr) from industrial sludge', Water Research, 82, pp. 86-93. 588
Cheng, S., Wang, Y., Gao, N., Takahashi, F., Li, A. and Yoshikawa, K. (2016) 'Pyrolysis of 589
oil sludge with oil sludge ash additive employing a stirred tank reactor', Journal of 590
Analytical and Applied Pyrolysis, 120(Supplement C), pp. 511-520. 591
da Rocha, O. R. S., Dantas, R. F., Duarte, M. M. M. B., Duarte, M. M. L. and da Silva, V. L. 592
(2010) 'Oil sludge treatment by photocatalysis applying black and white light', 593
Chemical Engineering Journal, 157(1), pp. 80-85. 594
da Silva, L. J., Alves, F. C. and de França, F. P. (2012) 'A review of the technological solutions 595
for the treatment of oily sludges from petroleum refineries', Waste Management & 596
Research, 30(10), pp. 1016-1030. 597
de Souza, E. S., Fernandes, A. R., de Souza Braz, A. M., Sabino, L. L. L. and Alleoni, L. R. F. 598
(2014) 'Potentially toxic elements (PTEs) in soils from the surroundings of the Trans-599
Amazonian Highway, Brazil', Environmental Monitoring and Assessment, 187(1), pp. 600
1-20. 601
Derome, A. E. (1987) Modern NMR Techniques for Chemistry Research. Great Britain: 602
Pergamon Press Ltd. 603
29
Duan, M., Wang, X., Fang, S., Zhao, B., Li, C. and Xiong, Y. (2018) 'Treatment of Daqing oily 604
sludge by thermochemical cleaning method', Colloids and Surfaces A: 605
Physicochemical and Engineering Aspects, 554, pp. 272-278. 606
Egazar’yants, S. V., Vinokurov, V. A., Vutolkina, A. V., Talanova, M. Y., Frolov, V. I. and 607
Karakhanov, E. A. (2015) 'Oil Sludge Treatment Processes', Chemistry and Technology 608
of Fuels and Oils, 51(5), pp. 506-515. 609
Elektorowicz, M. and Muslat, Z. (2008) 'Removal of heavy metals from oil sludge using ion 610
exchange textiles', Environmental Technology, 29(4), pp. 393-399. 611
EN12880 2003. Chemical Analyses-Determination of dry matter and water content on a mass 612
basis in sediment, sludge, soil, and waste-Gravimetric method. European Committee of 613
Standardization (CEN). 614
Frysinger, G. S., Gaines, R. B., Xu, L. and Reddy, C. M. (2003) 'Resolving the Unresolved 615
Complex Mixture in Petroleum-Contaminated Sediments', Environmental Science & 616
Technology, 37(8), pp. 1653-1662. 617
Giles, H. (2010) 'Crude Oils', in Rand, S. (ed.) Significance of Tests for Petroleum Products. 618
Eight ed. West Conshohocken, PA, USA: ASTM International. 619
Gong, Z., Du, A., Wang, Z., Fang, P. and Li, X. (2017) 'Experimental Study on Pyrolysis 620
Characteristics of Oil Sludge with a Tube Furnace Reactor', Energy & Fuels, 31(8), pp. 621
8102-8108. 622
Gough, M. A. and Rowland, S. J. (1990) 'Characterization of unresolved complex mixtures of 623
hydrocarbons in petroleum', Nature, 344(6267), pp. 648-650. 624
Gumerov, F. M., Khairutdinov, V. F., Akhmetzyanov, T. R., Gabitov, F. R., Zaripov, Z. I., 625
Farakhov, M. I. and Mukhutdinov, A. V. (2017) 'Supercritical Fluid Propane-Butane 626
Extraction Treatment of Oil Sludge', Russian Journal of Physical Chemistry B, 11(7), 627
pp. 1103-1108. 628
30
Heidarzadeh, N., Gitipour, S. and Abdoli, M. A. (2010) 'Characterization of oily sludge from 629
a Tehran oil refinery', Waste Management & Research, 28(10), pp. 921-927. 630
Hu, G., Li, J. and Hou, H. (2015) 'A combination of solvent extraction and freeze thaw for oil 631
recovery from petroleum refinery wastewater treatment pond sludge', Journal of 632
Hazardous Materials, 283, pp. 832-840. 633
Hu, G., Li, J. and Zeng, G. (2013) 'Recent Development in the Treatment of Oily Sludge from 634
Petroleum Industry – A Review', Journal of Hazardous Materials, 261, pp. 470-490. 635
Hu, J., Gan, J., Li, J., Luo, Y., Wang, G., Wu, L. and Gong, Y. (2017) 'Extraction of crude oil 636
from petrochemical sludge: Characterization of products using thermogravimetric 637
analysis', Fuel, 188, pp. 166-172. 638
Huang, Q., Mao, F., Han, X., Yan, J. and Chi, Y. (2014) 'Characterization of emulsified water 639
in petroleum sludge', Fuel, 118, pp. 214-219. 640
Jasmine, J. and Mukherji, S. (2015) 'Characterization of oily sludge from a refinery and 641
biodegradability assessment using various hydrocarbon degrading strains and 642
reconstituted consortia', Journal of Environmental Management, 149, pp. 118-125. 643
Jin, Y., Zheng, X., Chi, Y. and Ni, M. (2013) 'Rapid, Accurate Measurement of the Oil and 644
Water Contents of Oil Sludge Using Low-Field NMR', Industrial & Engineering 645
Chemistry Research, 52(6), pp. 2228-2233. 646
Jin, Y., Zheng, X., Chi, Y. and Ni, M. (2014) 'Experimental Study and Assessment of Different 647
Measurement Methods of Water in Oil Sludge', Drying Technology, 32(3), pp. 251-648
257. 649
Johnson, O. A., Madzlan, N. and Kamaruddin, I. (2015) 'Encapsulation of petroleum sludge in 650
building blocks', Construction and Building Materials, 78, pp. 281-288. 651
31
Kadiev, K. M., Gyulmaliev, A. M., Batov, A. E., Kadieva, M. K., Oknina, N. V. and Dandaev, 652
A. U. (2015) 'Structural characteristics of petroleum sludge', Coke and Chemistry, 653
58(11), pp. 448-450. 654
Karamalidis, A. K., Psycharis, V., Nicolis, I., Pavlidou, E., Bénazeth, S. and Voudrias, E. A. 655
(2008) 'Characterization of stabilized/solidified refinery oily sludge and incinerated 656
refinery sludge with cement using XRD, SEM and EXAFS', Journal of Environmental 657
Science and Health, Part A, 43(10), pp. 1144-1156. 658
Khan, M. K., Cahyadi, H. S., Kim, S.-M. and Kim, J. (2019) 'Efficient oil recovery from highly 659
stable toxic oily sludge using supercritical water', Fuel, 235, pp. 460-472. 660
Kriipsalu, M., Marques, M. and Maastik, A. (2008) 'Characterization of oily sludge from a 661
wastewater treatment plant flocculation-flotation unit in a petroleum refinery and its 662
treatment implications', Journal of Material Cycles and Waste Management, 10(1), pp. 663
79-86. 664
Lam, S. S., Russell, A. D., Lee, C. L. and Chase, H. A. (2012) 'Microwave-heated pyrolysis of 665
waste automotive engine oil: Influence of operation parameters on the yield, 666
composition, and fuel properties of pyrolysis oil', Fuel, 92(1), pp. 327-339. 667
LaTorraca, G. A., Dunn, K. J., Webber, P. R. and Carlson, R. M. (1998) 'Low-field NMR 668
determinations of the properties of heavy oils and water-in-oil emulsions', Magnetic 669
Resonance Imaging, 16(5–6), pp. 659-662. 670
Liu, C., Zhang, Y., Sun, S., Huang, L., Yu, L., Liu, X., Lai, R., Luo, Y., Zhang, Z. and Zhang, 671
Z. (2018) 'Oil recovery from tank bottom sludge using rhamnolipids', Journal of 672
Petroleum Science and Engineering, 170, pp. 14-20. 673
Liu, J., Jiang, X. and Han, X. (2011) 'Devolatilization of oil sludge in a lab-scale bubbling 674
fluidized bed', Journal of Hazardous Materials, 185(2–3), pp. 1205-1213. 675
32
Long, X., Zhang, G., Shen, C., Sun, G., Wang, R., Yin, L. and Meng, Q. (2013) 'Application 676
of rhamnolipid as a novel biodemulsifier for destabilizing waste crude oil', Bioresource 677
Technology, 131, pp. 1-5. 678
Ma, Z., Xie, J., Gao, N. and Quan, C. (2018) 'Pyrolysis behaviors of oilfield sludge based on 679
Py-GC/MS and DAEM kinetics analysis', Journal of the Energy Institute. 680
Mansur, A. A., Taha, M., Shahsavari, E., Haleyur, N., Adetutu, E. M. and Ball, A. S. (2016) 681
'An effective soil slurry bioremediation protocol for the treatment of Libyan soil 682
contaminated with crude oil tank bottom sludge', International Biodeterioration & 683
Biodegradation, 115, pp. 179-185. 684
Mazlova, E. A. and Meshcheryakov, S. V. (1999) 'Ecological characteristics of oil sludges', 685
Chemistry and Technology of Fuels and Oils, 35(1), pp. 49-53. 686
Mirghaffari, N. 'Treatment and recycling of oily sludges produced in the petroleum industry'. 687
2017 International Conference on Environmental Impacts of the Oil and Gas 688
Industries: Kurdistan Region of Iraq as a Case Study (EIOGI), 17-19 April 2017, 1-2. 689
Nakada, R., Waseda, A., Okumura, F. and Takahashi, Y. (2016) 'Impact of the decarboxylation 690
reaction on rare earth elements binding to organic matter: From humic substances to 691
crude oil', Chemical Geology, 420, pp. 231-239. 692
Nezhdbahadori, F., Abdoli, M. A., Baghdadi, M. and Ghazban, F. (2018) 'A comparative study 693
on the efficiency of polar and non-polar solvents in oil sludge recovery using solvent 694
extraction', Environmental Monitoring and Assessment, 190(7), pp. 389. 695
Okopol 2008. Review of the European List of Waste. Germany: Ökopol GmbH in cooperation 696
with ARGUS GmbH. 697
Oliveira, A., Gonçalves, M., Nobre, C., Mendes, B., Vilarinho, M. and Castro, F. (2015) 698
'Fractionation of oily sludges produced in the treatment of hydrocarbon wastes', in 699
Vilarinho, C., Castro, F. & Russo, M. (eds.) Wastes: Solutions, Treatments and 700
33
Opportunities. Selected papers from the 3rd Edition of the International Conference on 701
Wastes: Solutions, Treatments and Opportunities, Viana Do Castelo, Portugal, 14-16 702
September 2015. London, UK: CRC Press, pp. 189. 703
Peters, K. E., Walters, C. C. and Moldowan, J. M. (2005) The Biomarker Guide. Volume 1: 704
Biomarkers and Isotopes in the Environment and Human History. Second edn. (2 vols). 705
Cambridge, Untied Kingdom: Cambridge University Press. 706
Pánek, P., Kostura, B., Čepeláková, I., Koutník, I. and Tomšej, T. (2014) 'Pyrolysis of oil 707
sludge with calcium-containing additive', Journal of Analytical and Applied Pyrolysis, 708
108, pp. 274-283. 709
Ramaswamy, B., Kar, D. D. and De, S. (2007) 'A study on recovery of oil from sludge 710
containing oil using froth flotation', Journal of Environmental Management, 85(1), pp. 711
150-154. 712
Ramirez, D. and Collins, C. D. (2018) 'Maximisation of oil recovery from an oil-water 713
separator sludge: Influence of type, concentration, and application ratio of surfactants', 714
Waste Management, 82, pp. 100-110. 715
Ramirez, D. and Dussan, J. (2014) 'Landfarmed oil sludge as a carbon source for Canavalia 716
ensiformis during phytoremediation', International Journal of Environmental Science 717
and Technology, 11(5), pp. 1197-1206. 718
Roy, A., Dutta, A., Pal, S., Gupta, A., Sarkar, J., Chatterjee, A., Saha, A., Sarkar, P., Sar, P. 719
and Kazy, S. K. (2018) 'Biostimulation and bioaugmentation of native microbial 720
community accelerated bioremediation of oil refinery sludge', Bioresource Technology, 721
253, pp. 22-32. 722
Saikia, M. S. B., Bora, M. M. and Dutta, N. N. 2003. Oil recovery from refinery sludge—a 723
case study (Abstract number-CHM 027). CHEMCON-2003 (International Conference 724
of Chemical Control Legislation and Trade Aspects). Singapore. 725
34
Schirmacher, M., Freimann, P., Schmidt, D. and Dahlmann, G. (1993) 'Trace metal 726
determination by total-reflection X-ray fluorescence (TXRF) for the differentiation 727
between pure fuel oil (bunker oil) and waste oil (sludge) in maritime shipping legal 728
cases', Spectrochimica Acta Part B: Atomic Spectroscopy, 48(2), pp. 199-205. 729
Shaheen, S. M., Tsadilas, C. D., Ok, Y. S. and Rinklebe, J. (2016) 'Potential Mobility, 730
Bioavailability, and Plant Uptake of Toxic Elements in Temporary Flooded Soils', in 731
Rinklebe, J., Knox, A.S. & Paller, M. (eds.) Trace Elements in Waterlogged Soils and 732
Sediments. Boca Raton, FL, USA: CRC Press: Taylor & Francis Group. 733
Shahidi Rizi, M. S., Emtiazi, G., Sepahi, A. A., Beheshti Maal, K. and Hosseini, F. (2017) 734
'Synergistic effect of nanoparticles and Thalassospira sp. isolated from Bahregan area 735
in biodegradation of oil sludge', Petroleum Science and Technology, 35(9), pp. 831-736
838. 737
Shelley, S., Stokman, S. K. and Sogorka, B. J. (1997) 'Soil contamination: Dealing with 738
petroleum spills', Chemical Engineering, 104(1), pp. 113. 739
Shen, L. and Zhang, D.-K. (2003) 'An experimental study of oil recovery from sewage sludge 740
by low-temperature pyrolysis in a fluidised-bed', Fuel, 82(4), pp. 465-472. 741
Shen, Y., Chen, X., Wang, J., Ge, X. and Chen, M. (2016) 'Oil sludge recycling by ash-742
catalyzed pyrolysis-reforming processes', Fuel, 182, pp. 871-878. 743
Shie, J.-L., Lin, J.-P., Chang, C.-Y., Wu, C.-H., Lee, D.-J., Chang, C.-F. and Chen, Y.-H. 744
(2004) 'Oxidative Thermal Treatment of Oil Sludge at Low Heating Rates', Energy & 745
Fuels, 18(5), pp. 1272-1281. 746
Silva, R. C., Carneiro, G. F., Barbosa, L. L., Lacerda, V., Freitas, J. C. C. and de Castro, E. V. 747
R. (2012) 'Studies on crude oil-water biphasic mixtures by low-field NMR', Magnetic 748
Resonance in Chemistry, 50(2), pp. 85-88. 749
35
Simpson, A. J., McNally, D. J. and Simpson, M. J. (2011) 'NMR spectroscopy in environmental 750
research: From molecular interactions to global processes', Progress in Nuclear 751
Magnetic Resonance Spectroscopy, 58(3–4), pp. 97-175. 752
Sivarao, S., Milkey, K. R., Samsudin, A. R., Dubey, A. K. and Kidd, P. (2014) 'Comparison 753
between Taguchi Method and Response Surface Methodology (RSM) in Modelling 754
CO2 Laser Machining', Jordan Journal of Mechanical & Industrial Engineering, 8(1), 755
pp. 35-42. 756
Speight, J. G. (2006) The Chemistry and Technology of Petroleum. Chemical Industries Fourth 757
edn. Laramie, Wyoming, USA: Taylor & Francis. 758
Taiwo, E. A. and Otolorin, J. A. (2009) 'Oil Recovery from Petroleum Sludge by Solvent 759
Extraction', Petroleum Science and Technology, 27(8), pp. 836-844. 760
Trejo, F., Ancheyta, J., Centeno, G. and Marroquín, G. (2005) 'Effect of hydrotreating 761
conditions on Maya asphaltenes composition and structural parameters', Catalysis 762
Today, 109(1), pp. 178-184. 763
Tsodikov, M. V., Konstantinov, G. I., Chistyakov, A. V., Arapova, O. V. and Perederii, M. A. 764
(2016) 'Utilization of petroleum residues under microwave irradiation', Chemical 765
Engineering Journal, 292, pp. 315-320. 766
USEPA 2004. How to Evaluate Alternative Cleanup Technologies for Underground Storage 767
Tank Sites: A Guide for Corrective Action Plan Reviewers (EPA 510-R-04-002). US 768
Environmental Protection Agency. Washington, DC, USA. 769
Uçar, S., Özkan, A. R. and Karagöz, S. (2016) 'Co-pyrolysis of waste polyolefins with waste 770
motor oil', Journal of Analytical and Applied Pyrolysis, 119, pp. 233-241. 771
Viana, F. F., de Castro Dantas, T. N., Rossi, C. G. F. T., Dantas Neto, A. A. and Silva, M. S. 772
(2015) 'Aged oil sludge solubilization using new microemulsion systems: Design of 773
experiments', Journal of Molecular Liquids, 210, Part A, pp. 44-50. 774

36
Villalanti, D. C., Raia, J. C. and Maynard, J. B. (2006) 'High-temperature Simulated 775
Distillation Applications in Petroleum Characterization', in Meyers, R.A. (ed.) 776
Encyclopedia of Analytical Chemistry. Hoboken, NJ, USA: John Wiley and Sons, Ltd. 777
Wang, J., Han, X., Huang, Q., Ma, Z., Chi, Y. and Yan, J. (2018) 'Characterization and 778
migration of oil and solids in oily sludge during centrifugation', Environmental 779
Technology, 39(10), pp. 1350-1358. 780
Wang, J., Yin, J., Ge, L., Shao, J. and Zheng, J. (2010) 'Characterization of Oil Sludges from 781
Two Oil Fields in China', Energy and Fuels, 24(2), pp. 973-978. 782
Wang, S., Wang, X., Zhang, C., Li, F. and Guo, G. (2016) 'Bioremediation of oil sludge 783
contaminated soil by landfarming with added cotton stalks', International 784
Biodeterioration & Biodegradation, 106, pp. 150-156. 785
Ward, O., Singh, A. and Van Hamme, J. (2003) 'Accelerated biodegradation of petroleum 786
hydrocarbon waste', Journal of Industrial Microbiology and Biotechnology, 30(5), pp. 787
260-270. 788
Yang, L., Nakhla, G. and Bassi, A. (2005) 'Electro-kinetic dewatering of oily sludges', Journal 789
of Hazardous Materials, 125(1–3), pp. 130-140. 790
Zhang, J., Li, J., Thring, R. W., Hu, X. and Song, X. (2012) 'Oil recovery from refinery oily 791
sludge via ultrasound and freeze/thaw', Journal of Hazardous Materials, 203–204, pp. 792
195-203. 793
Zhang, Y., Zhao, H., Shi, Q., Chung, K. H., Zhao, S. and Xu, C. (2011) 'Molecular Investigation 794
of Crude Oil Sludge from an Electric Dehydrator', Energy & Fuels, 25(7), pp. 3116-795
3124. 796
Zhao, S., Zhou, X., Wang, C. and Jia, H. (2017) 'Dewatering and low-temperature pyrolysis of 797
oily sludge in the presence of various agricultural biomasses', Environmental 798
Technology, pp. 1-9. 799
37
Zheng, C., Wang, M., Wang, Y. and Huang, Z. (2012) 'Optimization of biosurfactant-mediated 800
oil extraction from oil sludge', Bioresource Technology, 110, pp. 338-342. 801
Zheng, X., Jin, Y., Chi, Y. and Ni, M. (2013) 'Simultaneous Determination of Water and Oil 802
in Oil Sludge by Low-Field 1H NMR Relaxometry and Chemometrics', Energy & 803
Fuels, 27(10), pp. 5787-5792. 804
Zubaidy, E. A. H. and Abouelnasr, D. M. (2010) 'Fuel recovery from waste oily sludge using 805
solvent extraction', Process Safety and Environmental Protection, 88(5), pp. 318-326. 806
807
808
38
SUPPLEMENTARY MATERIAL 809
Table S 1.Trace metal elements concentrations (µg·g-1 dry matter or ppm) 810
of the oil sludges. 811
Element WSS ODS STS RS
Al 1,455 (±9) 506 (±20) 104 (±3) 116 (±1)
As* 2 (±0.24) 1 (±0.11) 0.10 (±0.03) 0.13 (±0.09)
Ba 131 (±7) 85 (±13) 40 (±2) 41 (±5)
Ca 5,811 (±44) 4,369 (±2505) 5,260 (±3033) 11,093 (±160)
Cd* 1 (±0.02) 0.08 (±0.01) 0.02 (±0.01) 0.02 (±0.01)
Co* 7 (±0.18) 0.27 (±0.02) 0.66 (±0.01) 0.21 (±0.01)
Cr* 85 (±0.44) 2 (±0.19) 9 (±0.30) 9 (±0.07)
Cu* 142 (±3) 8 (±0.08) 7 (±0.20) 12 (±0.80)
Fe 5,912 (±26) 1,536 (±867) 16,146 (±252) 13,915 (±278)
K 436 (±12) 85 (±3) 81 (±5) 116 (±6)
Li 2 (±0.01) 0.80 (±0.01) 0.65 (±0.05) 0.86 (±0.03)
Mg 502 (±5) 220 (±10) 235 (±3) 276 (±9)
Mn 142 (±3) 179 (±3) 23 (±0.47) 21 (±0.41)
Na 869 (±21) 65 (±17) 168 (±16) 241 (±3)
Ni* 85 (±0.58) 2 (±0.23) 2 (±0.14) 2 (±0.35)
Pb* 101 (±0.46) 45 (±2) 9 (±0.93) 9 (±2)
Sr 35 (±0.33) 93 (±6) 6 (±0.24) 7 (±0.07)
Zn* 376 (±7) 1,683 (±22) 3,074 (±1814) 6,336 (±85)
* These elements are potentially toxic elements (PTEs) (Shaheen et al., 2016). 812
Values in bold are over the limit of the acceptable standards of landfilling of hazardous waste established by the European Union: As (25 813
µg·g-1), Cd (5), Cr (70), Cu (100), Ni (40), Pb (50), Zn (200) (Kriipsalu et al., 2008). The mean values with the standard deviation (in 814
parentheses) are shown (n = 3). 815
39
816
Figure S 1. Oil sludge samples before, after heating at 105°C for 24 h 817
(water content) and 550°C for 30 min using the oven-drying method. 818
819
40
Figure S 2. 1H spectra of the oil and water mixtures standards. From top
to bottom: oil 80% + water 20%, oil 70% + water 30%, oil 50% + water 50%,
oil 40% + water 60%, and oil 20% + water 80%.
41
Figure S 3. 13C spectra of the oil and water mixtures standards. From top
to bottom: oil 80% + water 20%, oil 70% + water 30%, oil 50% + water 50%,
oil 40% + water 60%, and oil 20% + water 80%.
42
Figure S 4. 1D spectra of the sludges. From top to bottom: ODS, RS and
NSC.
43
Figure S 5. Gas chromatograms of the EPH aliphatic compounds for all the analysed oil sludges. The retention times (min) are shown on
the x-axis. The signal magnitude of the peaks was pA (picoamps; y-axis). The unresolved complex mixtures (UCM) are indicated.

44