characterising potential water abstraction licence markets
TRANSCRIPT

Characterising Potential Water Abstraction Licence Markets: Phase 2 - Catchments for Trading Promotion
R&D Technical Report WT0945/TR
Produced: August 2011
www.defra.gov.uk


Defra‟s Water Availability and Quality R&D Programme
Characterising Potential Water Abstraction Licence Markets: Phase 2 - Catchments for Trading Promotion
R&D Technical Report WT0945/TR
Produced: August 2011 Author(s): Meg Postle and Sophie Upson of Risk & Policy Analysts Ltd
Statement of use This report presents the results of Characterising Potential Water Abstraction Licence Markets: Phase 2 - Catchments for Trading Promotion. A study which aims to analyse and characterise potential markets in abstraction licences, which could potentially be utilised with market based instruments to promote greater economic value from water and/or address environmental damage arising from unsustainable abstraction. The study has been undertaken by Risk & Policy Analysts Ltd. Dissemination status Internal: Released Internally External: Released to Public Domain Keywords: Water abstractions, water rights trading, reverse auctions, negotiated agreements, abstraction licences, catchment characteristics Research contractor: Risk & Policy Analysts Ltd Defra project officer: Henry Leveson-Gower Publishing organisation Department for Environment, Food and Rural Affairs Water Availability and Quality, Ergon House, Horseferry Road London SW1P 2AL Tel: 020 7238 3000 Fax: 020 7238 6187 www.defra.gov.uk/environ/quality/water
© Crown copyright (Defra);2010 Copyright in the typographical arrangement and design rests with the Crown. This publication (excluding the logo) may be reproduced free of charge in any format or medium provided that it is reproduced accurately and not used in a misleading context. The material must be acknowledged as Crown copyright with the title and source of the publication specified. The views expressed in this document are not necessarily those of Defra. Its officers, servants or agents accept no liability whatsoever for any loss or damage arising from the interpretation or use of the information, or reliance on views contained herein.

iii
Executive Summary
This study is a follow-up to previous work aimed at “Characterising Potential Water Abstraction Licence Markets” (RPA, 2011), and which developed a series of hypotheses as to the factors which may affect the potential for abstraction licence trading in catchments across England and Wales. The hypotheses developed in the previous study covered trading in both used and unused licensed volumes of abstraction supplies and related to factors such as the level of unmet demand, resource stress within a catchment (and hence the availability of new abstraction licences) and the diversity of abstractors within a catchment. The focus in this second study has been on trading in unused licensed volumes as a means of freeing-up water within catchments where new licences are not being granted. The aim has been to identify possible opportunities for the active promotion of abstractions trading within England and Wales, based on the factors identified in the previous study and additional data provided by the Environment Agency on actual trades. The first stage in our analysis was to test the hypotheses outlined in the previous study. This involved a further analysis of the National Abstractions Licensing Database (NALD) together with CAMS status data and a comparison of these data against information on the catchments where actual trades have taken place since 2000. From our analysis of the NALD and based on our original hypotheses, three different sets of catchments were identified as presenting possible trading opportunities. Out of these three sets, our analysis identified 14 out of the 19 catchments where trading is known to have taken place. In two of the five catchments not identified, this was due to the high percentage of water bodies at CAMS status of over-licensed or over-abstracted (which suggests trading in unused licensed volumes may be restricted), while in the others trading may have occurred due to highly localised pressures and the high numbers of agricultural abstractors. The second stage of the analysis was to identify catchments which present the best opportunities for trading. From the three sets of catchments identified as providing possible opportunities for trading, a sub-set of 10 was selected for more detailed consideration. Discussions were held with Environment Agency Regional and/or Area staff to collect the additional information needed to clarify the potential for trading and the feasibility and value of greater promotion of it in the selected catchments. From these discussions and a review of other data on the catchments, in particular the number and diversity of licence holders, it appears that the most promising catchments are the ones where there is an unmet agricultural demand:
Broadland Rivers CAMS, which is dominated by agricultural licence holders by number but Public Water Supply (PWS) by volume of abstractions. Trading already takes place, but the Agency receives queries about trading on a regular basis.

Cam & Ely Ouse CAMS, which is dominated by PWS abstractions but has high numbers of agricultural licence holders and other abstractors who have been active in trading in the past. There is likely to be an unmet demand, particularly for short term trades.
Witham CAMS, which has a large number of spray irrigation licence holders (although again PWS dominates by volume). There is an unmet demand within the catchment and the potential for greater trading, but a lack of clarity for abstractors as to what is possible.
Steepings, Great Eau & Long Eau, which has far fewer licence holders than the others but also experiences some unmet demand within the catchment. This is increasingly being met through the construction of reservoirs or obtaining licences with stringent conditions. There would also appear to be a lack of understanding as to what might be possible through trading within this CAMs.
All four of these catchments lie within the Environment Agency‟s Anglian Region. In all cases, the Area staff would be interested in greater promotion of trading, particularly if this included facilitating the development of farmer water abstractor groups, as they see the lack of these as a barrier to further trading. The Area staff would also be interested in the promotion of temporary or short-term trading (e.g. for a season), which they believe is hindered by the current system, as it is too administratively time consuming to enable rapid decisions on proposed trades. Another catchment where there may be interest in trading is the Roding, Beam and Ingrebourne CAMS, although generating trading here would require more than just promotion activities. The current abstractions licensing system is highly complex due to the atypical nature of the catchment, with water only licensed for winter abstractions and new licences being restricted to very high flow conditions. Revisiting both the current licensing regime with the aim of freeing-up water and promoting trading might help better meet current seasonal demands within the catchment; however, this would need to be preceded by research to develop a better understanding of the implications of any changes in the system for both the environment and existing licence holders. The Dorset Stour CAMS also provides what may best be described as weak possibilities for increased efficiency in water use through trading. There is likely to be a small level of unmet demand, but the staff would be willing to participate in a promotion exercise if this would help free up water being held for its asset value and increase the efficiency of water use. More generally, this exercise has highlighted that although the hypotheses put forward in the previous study could be viewed as setting out some necessary conditions for trading to take place, they are not sufficient. In other words, identification of trading opportunities requires more than just analysis of the data available from the NALD on licences and CAMS status data. A range of other factors must also be taken into account, including the significance of systemic problems as a barrier to trading (e.g. the extent to which trading is actively promoted, pace of the trading process, abstractor groups for identifying trading partners, etc.).
v
Contents
1. Introduction 1
1.1 Background 1
1.2 Objectives 1
2. Factors Affecting Trading Activity 2
2.1 Overview 2
3. Analysis of Environment Agency Trade Data 6
3.1 Overview of trades 6
3.2 Sector/Purpose of use and licence restrictions 8
3.3 Permanent versus temporary trades 9
3.4 Quantity traded 9
3.5 Reduction of volumes as part of trades 11
3.6 CAMS Status of water bodies 13
3.7 CAMS Status of downstream water bodies 16
3.8 Actual vs licensed 16
4. Further Analysis of Catchment Data 18
4.1 Approach to the Analysis 18
4.2 Identification of Catchments with Trading Opportunities 19
4.3 Proposed short-list of catchments for further analysis 30
5. Evaluation of Selected Catchments 31
5.1 Approach 31
5.2 Conclusions by Catchment 31
6. Conclusions 41

vi

1
1. Introduction
1.1 Background
RPA recently completed work on “Characterising Potential Water Abstraction Licence Markets” (RPA, 2011a), which draws on national abstraction licensing data and other statistics to characterise catchments with respect to the feasibility of establishing functioning abstraction licence trading markets.
This work concluded that there were certain characteristics of catchments that would make it more likely for trading to take place. These include the number of abstraction licence holders within a catchment, the diversity of abstractors (although the latter may not be a key factor), the extent of any unmet demand within a catchment due to previous over-licensing and the degree to which a catchment is over-licensed as opposed to being over-abstracted.
At the time that the work was carried out, data were unavailable on the number and location of trades that have actually taken place to date under the existing regime. Since the work has been completed, new data have been made available by the Environment Agency on past trades.
1.2 Objectives
The aim of this project has been to combine the new trade data with the catchment level data used in the previous work to identify a small set of possible catchments for active promotion of abstractions trading by both Defra and the Environment Agency. In particular, the intention is to focus on the potential for trading of unused licensed volumes in those catchments which are currently over-licensed (CAMS status of yellow and orange) but which are not over-abstracted (CAMS status of red or purple).
Task Summary
Task 1 Review the Environment Agency trade data and cross-link this with the broader NALD licensing data and CAMS status data to identify those catchments that have had active trading and the extent to which they are over-licensed and over-abstracted.
Task 2 Assess the degree to which the catchments with active trading have characteristics that are consistent with those identified by the main study, and essentially carry out a mapping of this across catchments, focusing on those which are over-licensed but not over-abstracted.
Task 3 From the mapping exercise, identify the six catchments that appear to best meet the criteria for currently being over-licensed but not over-abstracted, which may have significant levels of unused licensed volumes and where trading has taken place in the past. Consideration would also be given at this stage to other factors identified in the main study, and some of the findings stemming from the work carried out by RPA for the Environment Agency on unmet demand (e.g. those sectors most likely to have an unmet demand) and from other relevant studies.
Task 4 Carry out consultation with Environment Agency staff on each of the six catchments to validate the conclusions drawn from the mapping exercise and broader assessment.
Task 5 Develop recommendations as to the top three catchments to act as the basis for the active promotion of licence trading.

2
2. Factors Affecting Trading Activity
2.1 Overview
Previous work by RPA (2011a)1 concluded that there were certain characteristics of catchments that would make it more likely for trading to take place. These key characteristics are summarised below.
2.1.1 Resource stress
There needs to be a degree of resource stress within a catchment and as well as some degree of unmet demand, which may be seasonal, cyclical or temporary with this being particularly the case for the agriculture sector. Only weak incentives to trade would be expected to exist in catchments where water is readily available and where the Environment Agency is still granting new abstraction licences (see also the discussion below in Sections 3.5 and 3.6 on the existence of trading in such situations).
A recent study by RPA (2011b)2 has investigated latent (or unmet) demand for abstraction licences in catchments across England and Wales. This study concluded that a small number of sectors currently face problems with unmet demand and expect the problem to worsen in the future due to expansion of production activities. They are primarily those using irrigation for agriculture, golf course watering and horticulture, plus process water for food and drink production. Hydro-electric power generation was found to be the sector with the highest number of refused licence applications.
There also needs to be a sufficient number of current licence holders within a water resource management unit / groundwater management unit for an active trading market to develop (although only two parties need to exist for a trade to take place).
In catchments where there are isolated pockets of water stress (i.e. where there are isolated clusters of licences at CAMS status orange or red), it may be possible for localised trading to take place when new licences are not available from the Environment Agency.
The greatest opportunity for environmental and efficiency gains is likely to be in those catchments where significant percentages of licences are associated with water bodies that are classed as having no water available, being over-licensed or being over-abstracted (CAMS status of yellow, orange, red or purple) and where the proportion of „no water available‟ or „over-licensed‟ water bodies (CAMS status of yellow or orange) is relatively high compared
1 RPA (2011a): Characterising Potential Water Abstraction Licence Markets, Report
prepared for Defra, UK.
2 RPA (2011b): Understanding Latent Demand for Water Abstraction Licences, Final Report prepared for the Environment Agency, UK.
3
with those which are classed as „over-abstracted‟ (CAMS status of red or purple).
CAMS Status
Some hypothetical rules on the nature of trading and, in particular, on the potential to trade both used and unused quantities are set out below:
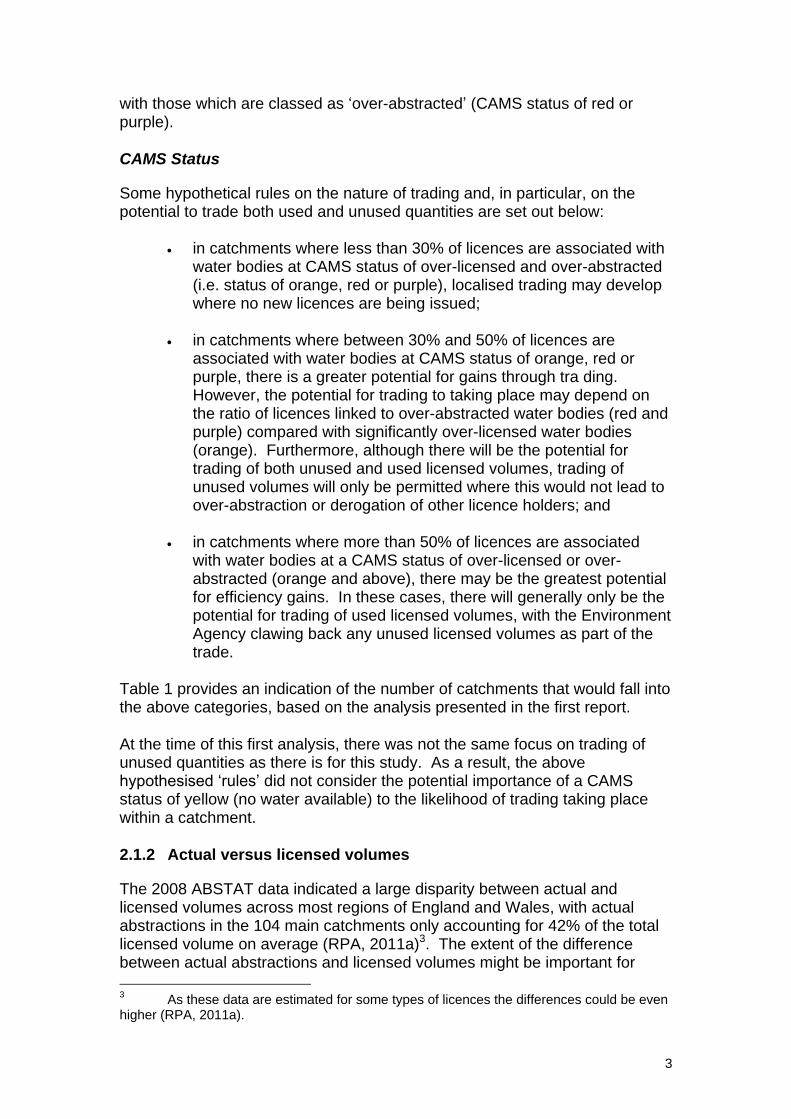
in catchments where less than 30% of licences are associated with
water bodies at CAMS status of over-licensed and over-abstracted (i.e. status of orange, red or purple), localised trading may develop where no new licences are being issued;
in catchments where between 30% and 50% of licences are
associated with water bodies at CAMS status of orange, red or purple, there is a greater potential for gains through tra ding. However, the potential for trading to taking place may depend on the ratio of licences linked to over-abstracted water bodies (red and purple) compared with significantly over-licensed water bodies (orange). Furthermore, although there will be the potential for trading of both unused and used licensed volumes, trading of unused volumes will only be permitted where this would not lead to over-abstraction or derogation of other licence holders; and
in catchments where more than 50% of licences are associated
with water bodies at a CAMS status of over-licensed or over-abstracted (orange and above), there may be the greatest potential for efficiency gains. In these cases, there will generally only be the potential for trading of used licensed volumes, with the Environment Agency clawing back any unused licensed volumes as part of the trade.
Table 1 provides an indication of the number of catchments that would fall into the above categories, based on the analysis presented in the first report.
At the time of this first analysis, there was not the same focus on trading of unused quantities as there is for this study. As a result, the above hypothesised „rules‟ did not consider the potential importance of a CAMS status of yellow (no water available) to the likelihood of trading taking place within a catchment.
2.1.2 Actual versus licensed volumes
The 2008 ABSTAT data indicated a large disparity between actual and licensed volumes across most regions of England and Wales, with actual abstractions in the 104 main catchments only accounting for 42% of the total licensed volume on average (RPA, 2011a)3. The extent of the difference between actual abstractions and licensed volumes might be important for
3 As these data are estimated for some types of licences the differences could be even
higher (RPA, 2011a).

4
abstractions trading. This is for two reasons: a) where actual abstractions are much lower than licensed volumes yet a catchment is considered to have „no water available‟ or to be „over-licensed‟ (i.e. at mainly yellow or orange status), it may be possible for licence holders to trade some portion of their unused licence volumes as well as their used volumes; and b) where actual abstractions are below licensed volumes but the catchment is already over-abstracted (red or purple CAMS status), then it is unlikely that it will be possible to trade unused licence volumes as well as used volumes. 2.1.3 Other characteristic factors
In our view, other factors such as dominance by one particular type of abstractor, differences in the consumptiveness of abstractions, existence of hands off flow constraints, etc. could act as weaker constraints on the degree to which markets develop. The key exception to the above relates to dominance by one particular abstractor type. Experience suggests that such farmers are the most likely to participate in trading and that this is also one of the sectors with the highest current and anticipated unmet demand.

5
Table 1: Hypotheses of trading opportunities by CAMS status of catchment and of downstream water bodies
Type of water body
CAMS status Nature of trading No. of catchments
with % licences directly linked
to CAMS status**
No of catchments linked to downstream catchments at CAMS status
Further trading implications of
downstream status >30% and <50% >50%
New licences generally available
<30% of water bodies are significantly over- licensed or unsustainably abstracted (orange, red or purple status)
Opportunities for trading both used and unused licensed volumes exist but little incentive for trading to take place
50 of 104 linked to % licences at CAMS status
7 out of the 50 catchments linked to downstream catchments with >30% and <50% licensed at status orange or higher
17 out of the 50 catchments linked to downstream catchments with >50% licensed at status orange or higher
The status of these downstream catchments may place some restrictions on trading opportunities for unused licensed volumes.
Over-licensed but not generally affected by unsustainable abstraction
>30% and <50% of water bodies are significantly over-licensed or over-abstracted (orange, red or purple status)
Potential for reasonable levels of trading of used and unused licensed volumes; but trading of unused volumes only where would not lead to over-abstraction/ cause deterioration or derogation of other users. Unused volumes may be clawed back.
29 of 104 linked to % licences CAMS status
6 out of the 29 catchments linked to downstream catchments with >30% and <50% licensed at status orange or higher
23 out the 29 catchments linked to downstream catchments with >50% licences at status orange or higher
The fact that most of these significantly over- licensed catchments are linked to downstream catchments which are also over-licensed or over-abstracted may further reduce potential for trading of unused volumes
Over-licensed and generally affected by unsustainable abstraction
>50% of water bodies are significantly over- licensed or over-abstracted (orange, red or purple status)
Generally only potential for trading used licensed volumes and EA will claw back unused licensed volumes
25 out of 104 linked to % licences at CAMS status
None 25 out of the 25 catchments are linked to downstream catchments with >50% of licences at status orange or higher
These statistics highlight the importance of the EA clawing back unused licensed volumes as part of any trading
* CAMS status orange and higher includes rivers at a CAMS status of red and purple reflecting over-abstracted in addition to over-licensed ** Note that the Abstat data on which this analysis is based provides data on 104 catchments. More recently, some catchments have been merged with there now being 97.

6
3. Analysis of Environment Agency Trade Data
3.1 Overview of trades
Annex 1 and Figure 1 provide EA data on trades that have actually taken place. We have matched trade information on the donor and recipient licence numbers against the NALD to identify the catchments within and then the water bodies for which these trades have taken place. As some of the licence details were missing from the NALD, the EA have matched donor licences against the WRGIS dataset. Due to the fact that many of the donor licences were revoked when the trade went ahead, however, the EA have been unable to trace the exact water body for some of the traded licences (due to the WRGIS having only current licences in the dataset). Where this is the case, the EA have used information for an existing licence closest to the point of abstraction of the licence that was revoked. There is a small risk that the data is not exact due to this. Through matching data on traded licences to the NALD and WRGIS data, we have been able to identify the CAMS status for the water bodies and hence to assess these against the criteria proposed as determinants of the feasibility of trading. However, we were not able to do this for all of the trades, with the donor catchment for one of the 51 trades unknown and the recipient catchment for one of the 51 trades unknown (Table 2). Table 2: Year of trades where CAMS status of donor, recipient or both donor and recipient unknown
Donor CAMS Recipient CAMS Year Number of
trades
? Colne 2007 1
Aire and Calder CAMS ? ? 1
Broadland Rivers CAMS Broadland Rivers CAMS 2010 1
Cam & Ely Ouse including South Level
CAMS
Cam & Ely Ouse including South Level
CAMS 2008 3
Dee Dee 2009 1
Lower Trent and Erewash
Lower Trent and Erewash
2010 1
Old Bedford including Middle Level CAMS
Old Bedford including Middle Level CAMS
2006 1
Old Bedford including Middle Level CAMS
Old Bedford including Middle Level CAMS
2008 2
Warwickshire Avon Warwickshire Avon 2010 1
Wey Thames Corridor 2005 1
Total number of trades where CAMS status of the water body associated with the abstraction point of donor, recipient or both donor and recipient is unknown:
2
The timing of the trades ranges from 2003 to 2010, with the highest numbers in the period from 2006 to 2008. Table 2 provides a summary of data on trades where the CAMS status of the donor, recipient or both donor and

7
recipient is unknown, indicating the number of trades by catchment and the timing of those trades.
Figure 1: Overview of Trading CAMS. Source: EA 2011. For list of CAMS names and numbers refer to Annex 6.

8
Overall, it is interesting to note that seven of the 19 catchments are in Anglian Region, four are in Thames Region (Wey, Thames Corridor, Mole and the Colne), three are Midlands Region (Shropshire Middle Severn, Warwickshire Avon and Lower Trent and Erewash), two are in the South West (Dorset Stour CAMS, Hampshire Avon CAMS), while there is only one in Southern Region (Test & Itchen), the North East (Aire & Calder CAMS) and Wales (Dee). Previous work by RPA (2011b) that looked at unmet demand for abstractions found that some agricultural abstractors in the Broadland Rivers, East Suffolk and Old Bedford and Middle Level CAMS catchments are facing abstraction constraints due to the Review of Consents and Restoring Sustainable Abstraction programmes currently being implemented in these catchments. The current pressures on resources and the lack of available new water in these catchments is likely to be one impetus behind the trading taking place in these catchments. It is also clear that the removal of some barriers to trading, due to the transfer of licences becoming easier under the Water Act 2003, also led to an increase in such activity. It is worth noting that in 13 out of the 51 trades recorded in the EA Trade Database, the CAMS status for the water body of the donor licence abstraction point, the recipient licence abstraction point or of both parties‟ licensed abstraction point has not been recorded in the NALD.
3.2 Sector/Purpose of use and licence restrictions
Table 3 sets out summary data on the donors and recipients of trades by numbers. As might be expected, trading activity has been dominated by the agricultural sector in terms of the purpose of use although it is also interesting to note that private water undertakers have been recipients of licences while PWS have acted as donors in trades.
Table 3: Sectoral Distribution of Trade Donors and Recipients
Sector/Purpose of use Recipient Sector Donor Sector
? 3 1
Agriculture 41 44
Industry 5 4
Private water undertaker 2 0
PWS 0 2
Various 1 0
Total 51 51
From the limited data that are available, it would appear that as part of most trades, HOF conditions are transferred from the donor licence to the recipient‟s licence. However, we did identify two cases where new HoF conditions were introduced and three cases where HoF conditions were removed.

9
In terms of the timing of when an abstraction can be taken, in seven of the trades the period of time over which water can be abstracted has been extended, while in eight cases it has been reduced (and in the majority of cases there are no data on when an abstraction can start and when it must end in the trading data sets provided by the EA).
3.3 Permanent versus temporary trades
Within our resource constraints, it is only possible to analyse information on permanent versus temporary trades at a high level, on a sectoral basis, without any information on the catchments involved. The results of this analysis are reported in Table 4. As can be seen from the table, most identifiable trades have been temporary in nature (with any difference in numbers due to there being more donors than recipients or vice versa). From discussions with EA staff, it would appear that some of the temporary trades will relate to, for example, gravel operations and their short-term need for water. Table 4: Permanent and temporary trades by sector
Donor
Agriculture Industry Private water undertaker PWS Various ?
Permanent 14 2 0 1 0 0
Temporary 25 0 0 0 0 0
? 5 2 0 1 0 1
Recipient
Agriculture Industry Private water undertaker PWS Various ?
Permanent 13 0 2 0 1 0
Temporary 21 5 0 0 0 0
? 7 0 0 0 0 2
3.4 Quantity traded
Figure 2 gives an overview of traded quantities. The vast majority of trades have been for quantities less than 70,000 m3/yr. The largest trade (by volume) took place in the Colne, where approximately 350,000 m3/yr was traded between two industrial abstractors (both donor and recipient licences were for mineral washing). This was a temporary trade. Figure 2 also shows the percentage of the seller‟s licensed quantity that was traded. In most cases, the donor‟s full licensed quantity has not been traded. In the Broadland Rivers CAMS there have been two trades where the records suggest that 167% of the donor‟s licensed quantity was traded, and it is assumed that the recipient actually received water from two donors rather than just the one4.
4 Based on personal communication with the Environment Agency.

10
Figure 2: Overview of traded quantities.
Table 5 provides an overview of the quantity traded by sector, with these data summarised in Figures 3 and 4. In Figures 3 and 4, the mean value is indicated on each bar, with each bar depicting the overall distribution of the size of trades.
Table 5: Quantity traded by sector (m3/yr)
Min
(m3/yr) Max
(m3/yr) Mean
(m3/yr) Total Number of
Trades
Recipient Agriculture 1000 90900 28029 41
Industry 22000 350496 120624 5
Private water undertaker
1000 72500 36750 2
Various 73000 73000 73000 1
Donor Agriculture 1000 90900 28575 44
Industry 30380 350496 122194 4
PWS 73000 73000 73000 2
0
20
40
60
80
100
120
140
160
180
0 50000 100000 150000 200000 250000 300000 350000 400000
% S
elle
rs L
ice
nce
Qu
anti
ty
Quantity Traded (M3/yr)
Quantity Traded

11
Figure 3: Distribution plot for volume gained through a trade by sector
Figure 4: Distribution plot for volume released through a trade by sector
3.5 Reduction of volumes as part of trades
In only two cases do the trade data provide details of the quantities of the licensed volume that the EA clawed back as part of a condition of trading. These are:
1) Thames traded to the Mole. Both catchments are significantly over
abstracted. Indeed, the NALD data indicate that the CAMS status associated with the recipient licence in this trade has an orange (over-licensed) CAMS waterbody status and purple downstream status; and
2) Upper Ouse and Bedford Ouse CAMS to Upper Ouse and Bedford
Ouse CAMS. This catchment is over abstracted in parts but most of
0
50000
100000
150000
200000
250000
300000
350000
400000
Agriculture Industry Private water undertaker
Various
Qu
anti
ty (
m3
/yr)
Quantity traded by sector (recipient)
0
50000
100000
150000
200000
250000
300000
350000
400000
Agriculture Industry PWS
Qu
anti
ty (
m3
/yr)
Quantity traded by sector (donor)

12
the catchment has water available. The NALD data indicate that the recipient licence in this trade has a grey (water available) CAMS waterbody status and green (water available) downstream status. The suggested reason for this trade is that it was less bureaucratic than going through the full licence approval system.
Table 6 presents an overview of the two trades where part of the licensed volume was clawed back. It is of note that the EA believe that there have been more than two cases where part of the licensed volume was clawed back as part of a trade. We understand from further discussions with the EA that claw back has occurred in 6 instances in total. The total amount clawed back over these trades is estimated at 4ml/d (28% of the total licensed volume before trade). Almost all claw back occurred because neither the original licence holder nor the recipient required the additional water.
Table 6: Overview of the two trades with details of claw back
Donor Catchment Thames Corridor Upper Ouse & Bedfordshire
Ouse CAMS
Recipient Catchment Mole Upper Ouse & Bedfordshire
Ouse CAMS
Original quantity on donor’s licence (m3/yr)
72736 1663836
Quantity Traded (m3/yr) 32991 72500
%age of seller’s full licence
45% 4%
Donor Licence Purpose Spray Irrigation – Direct
(Agriculture) Process Water (Industry)
Recipient Licence Purpose
Spray Irrigation – Direct (Agriculture)
Potable Water Supply (Private Water Undertaker)
Quantity of clawback (m3/yr)
39745
1591336
Unfortunately, it is not possible from the EA trade data to determine whether any of the trades involved unused licensed volumes, although one could speculate that this has been the case. For example, analysis of the trade data supplied by the EA indicates that over 80% of the seller‟s licensed volume was traded to the recipient in 13 of the cases where the seller‟s and the buyer‟s volumes are recorded. In 10 of these cases, the transfer was 100% of the donor‟s volume. One could speculate that these trades included both used and unused licensed volumes. At the other end of the spectrum, in 16 of the trades where volumes were recorded, less than 40% of licensed volume was traded by the donor; in 11 of these cases less than 25% of the seller‟s licensed volume was traded. These data are summarised in Figure 5, with this covering 50 of the trades. In 12 out of 50 cases, the traded licensed volume is unrecorded within the spreadsheet provided. In 13 cases, more than 80% of the licensed volume was traded, in 9 cases between 40% and 80% was traded and in 16 cases less than 40% was traded.

13
Figure 5: Distribution of trades by % licence volume
3.6 CAMS Status of water bodies
As noted above, the first study (RPA 2011a) hypothesised that the potential for abstractions trading is likely to be greatest where there is a degree of resource stress within a catchment and where no new licences are being granted (i.e. in catchments with a CAMS status of yellow/orange and above). In seven5 of the nineteen catchments where trading has taken place (see Annex 2 for details), the percentage of water bodies linked to a CAMS status of orange or above was greater than 50%, with this figure rising to ten out of nineteen at 30% or more water bodies at a status of orange or higher. In ten6 of the nineteen catchments where trading has taken place, >50% of licences are at a CAMS status of yellow or higher with this rising to sixteen out of the nineteen catchments with >30% of licences at a status of yellow or above. These findings support the hypothesis put forward in the first study. Also in our earlier assessment (RPA 2011a), we suggested that the potential for trading may depend on the ratio of licences linked to over-abstracted water bodies (red and purple) compared with significantly over-licensed water bodies (orange). Interestingly, in six7 of the nineteen catchments, the
5 Broadland Rivers Cams, Cam & Ely Ouse including South Level Cams, Colne, Essex Cams,
Mole, Shropshire Middle Severn, Witham Cams. 6 Broadland Rivers CAMS, Cam & Ely Ouse (including South Level) CAMS, Colne, East Suffolk CAMS, Essex CAMS, Hampshire Avon CAMS, Mole, Shropshire Middle Severn, Wey and Witham CAMS. 7 Cam & Ely Ouse including South Level Cams, East Suffolk CAMS, Colne, Essex Cams, Mole,
Shropshire Middle Severn.

14
percentage of water bodies at red or purple is roughly 30% or higher; but in all but two of these catchments, there is a significant difference in the percentages at orange and above compared with red and above8 (i.e. there is a high ratio of orange licences to red and purple licences). Again these findings support the hypothesis put forward in the first study.
With regard to the number of trades taking place, it is interesting to note that the two catchments with the highest numbers are the Broadland Rivers CAMS with seven trades and the Cam & Ely Ouse (including South Level) CAMS which has been the donor and recipient for 13 trades. The Broadland Rivers CAMS has just over 75% of licences at a CAMS status of orange or above, while the Cam & Ely Ouse (including South Level) CAMS has just over 60% of licences at a CAMS status of orange or higher (refer to Annex 2). These are also catchments with high numbers of agricultural abstractors so it is not surprising that, in the Broadland Rivers CAMS, four of the six trades were between agricultural abstractors9 and, in the Cam & Ely Ouse (including South Level) CAMS, 12 out of the 13 trades were between agricultural abstractors10. Of significance though is the fact that multiple trades have also taken place in catchments which are indicated as having relatively low percentages of water bodies where water (i.e. new licences) would not be available. This includes the Upper Ouse & Bedford Ouse CAMS, which is again in the Anglian Region (where active promotion of trading is known to have taken place) and will be associated with high levels of agricultural abstractions (a factor believed to be potentially important for abstractions trading and which reflects the fact that farmers have participated in trading when they become aware of licences coming available). The catchment which stands out in this latter set is the Test & Itchen, which has had four trades take place but which the old NALD data indicates has only around 30% of water bodies at yellow or higher (although this is historically an area identified as having low flow problems). Discussions with the EA indicate that as part of the revision to the CAMS data, the status of many water bodies such as those in the Test & Itchen is changing. Where possible, the NALD and WRGIS data has been used to trace the CAMS status associated with traded licences in the EA trade data (Table 7). Unfortunately, for 13 out of the 51 trades, the water body or downstream CAMS status for the donor, recipient or both donor and recipient is unknown. The Table shows that the majority of trades have taken place between licences at a CAMS status of orange or above.
8 For example, more than 15% additional water bodies in the orange and above grouping. 9 Of the remaining two trades, one trade is from industry (mineral washing) to agriculture and
one trade is from agriculture to industry (mineral washing). 10
The remaining trade is from „various‟ to PWS.

15
Table 7: Summary of CAMS status for traded licences
CAMS Status
Donor Recipient
WB Downstream WB Downstream
? 10 9 8 8
Grey 5 0 3 0
Green 11 4 6 1
Yellow 2 2 1 3
Orange 4 5 8 5
Red 6 8 17 14
Purple 13 23 8 20
Total 51 51 53 53
Data source: NALD and WRGIS. Note: For two trades, the recipient licence has two abstraction points spanning two separate water bodies at different CAMS statuses. In these two cases, the „worse‟ CAMS status has been taken as being representative of the trade.
Table 8: Catchments where trades have taken place with recipient water body CAMS status of Grey or Green (water available)
CAMS
Donor Recipient
WB Downstream WB Downstream
Broadland Rivers CAMS Green Orange Green Orange
Hampshire Avon CAMS Catchment
Green Red
Green Red
Shropshire Middle Severn Green Red Grey Red
Test and Itchen Green Purple Green Purple
Test and Itchen Green Purple Green Purple
Test and Itchen Green Purple Green Purple
Upper Ouse and Bedford Ouse CAMS
Grey Green Grey Green
Warwickshire Avon Green Yellow Grey Yellow
Witham CAMS Orange Orange Green Yellow
Table 8 above shows the location of those trades that have taken place and which are linked to a water body at CAMS status of grey or green. As indicated in the table, three of the four trades in the Test and Itchen are associated with a recipient licence at a water body CAMS status of green. In all three cases, however, the downstream CAMS status of the recipient licence was purple (meaning that water would not have been available) and this provides an incentive for the trade. The CAMS status of the downstream water bodies will affect the willingness of the EA to issue new licences. In the Warwickshire Avon, Witham, Upper Ouse & Bedfordshire Ouse, Shropshire Middle Severn, Hampshire Avon CAMS catchment and Broadland Rivers CAMS there has been one trade where the recipient had a water body CAMS status of grey or green. In all but the Upper Ouse & Bedfordshire Ouse, however, the downstream CAMS status associated with the trade was yellow or above (i.e. no water available, over-licensed or over-abstracted).

16
Taken together, the above findings indicate that although our original hypotheses as to when trading may be most likely to take place remain valid, one needs to also consider a range of additional factors relating to catchment characteristics, extent of current unmet demand and expected future demand at the very specific water body level, abstractor interactions, etc. Thus, our hypotheses could be considered to set out necessary but not sufficient conditions for the creation of active trading markets.
3.7 CAMS Status of downstream water bodies
As the above analysis indicates, the CAMS status information for downstream water bodies is important to determining the potential for abstractions trading. Examination of these downstream data indicate that only four catchments (the Aire and Calder, the Old Bedford including Middle Level CAMS, the Upper Ouse & Bedford Ouse CAMS and the Warwickshire Avon CAMS) have fewer than 57% of downstream water bodies at orange or higher (and indeed in ten of these catchments more than 40% of water bodies are at a status of red or purple) (See Annex 3). This suggests that downstream status may be affecting not only the ability to gain new licences but may also affect the willingness of the Agency to approve trades involving high consumptive uses (e.g. spray irrigation). Of note though is the fact that in three of these four catchments, water would appear generally to be available in the catchment itself; the main exception to this is trading in the Warwickshire Avon catchment, where this is linked to over 92% of water bodies at a status of yellow or higher (i.e. no water available to over-licensed and over abstracted).
3.8 Actual vs licensed
Levels of actual abstractions compared with licensed volumes vary significantly across the catchments where trading has taken place, ranging from around 16% to 78%. In seven of the catchments, actual abstractions are calculated as being less than 30% of total licensed volumes; while at the other end, actuals exceed 60% of licensed volumes in two of the catchments (and over 50% in six catchments). As indicated in Section 2, these differences may be important. Where actual abstractions are much lower than licensed volumes, yet a catchment is considered to have „no water available‟ or to be „over-licensed‟ (i.e. at mainly yellow or orange status), it may be possible for licence holders to trade some portion of their unused licence volumes as well as their used volumes. However, given that several of the catchments have relatively high levels of agricultural abstractions, it is not surprising that on average actuals are less than total licensed volumes. Spray irrigators will typically use less than their full licensed volume, as they will hold a contingency for dry years which are only called upon during such periods and on a limited basis.
17
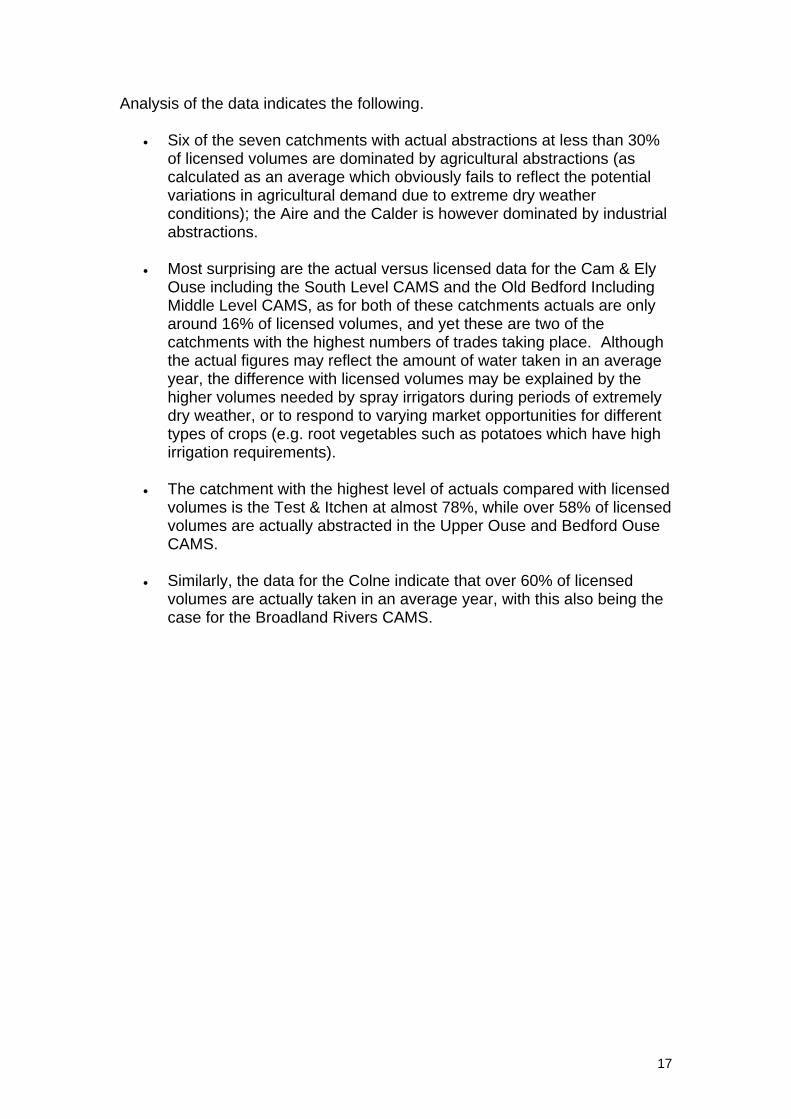
Analysis of the data indicates the following.
Six of the seven catchments with actual abstractions at less than 30% of licensed volumes are dominated by agricultural abstractions (as calculated as an average which obviously fails to reflect the potential variations in agricultural demand due to extreme dry weather conditions); the Aire and the Calder is however dominated by industrial abstractions.
Most surprising are the actual versus licensed data for the Cam & Ely Ouse including the South Level CAMS and the Old Bedford Including Middle Level CAMS, as for both of these catchments actuals are only around 16% of licensed volumes, and yet these are two of the catchments with the highest numbers of trades taking place. Although the actual figures may reflect the amount of water taken in an average year, the difference with licensed volumes may be explained by the higher volumes needed by spray irrigators during periods of extremely dry weather, or to respond to varying market opportunities for different types of crops (e.g. root vegetables such as potatoes which have high irrigation requirements).
The catchment with the highest level of actuals compared with licensed
volumes is the Test & Itchen at almost 78%, while over 58% of licensed volumes are actually abstracted in the Upper Ouse and Bedford Ouse CAMS.
Similarly, the data for the Colne indicate that over 60% of licensed volumes are actually taken in an average year, with this also being the case for the Broadland Rivers CAMS.

18
4. Further Analysis of Catchment Data
4.1 Approach to the Analysis
Table 1 provided the starting point for our approach to further analysing the potential for creating trading markets in catchments in England and Wales and for comparing this against the actual trade data reported above. For the purposes of this work, we made one modification to the trading opportunity hypotheses set out in Table 1. We included water bodies at CAMS status of yellow into the analysis, as these are water bodies where „no water is available‟ for new licences and which may, therefore, also be a focus for trading. Based on this modified set of rules, the following analysis was carried out across all 104 catchments. 1) The percentage of licences (excluding tidal) at CAMS status of yellow and
above (no water available to over-abstracted) was derived, together with the percentages at red and above (over-licensed and over-abstracted).
2) All catchments having more than 30% and more than 50% of licences linked to water bodies at yellow and above were then identified. Note that these percentages are arbitrary in that there is no evidence base for their selection. However, it was felt that they reflected a „weak‟ case in terms of a lack of licensing opportunities and a stronger case of few to no new licences being available. As a result, they reflected different levels of pressure underlying the potential demand for trading.
3) For all of these catchments, we then determined whether the percentage
of licences linked to water bodies at red and above exceeded 30% or 50%.
4) All catchments having more than 30% or 50% of licences linked to water bodies at yellow or higher were then screened these to identify three sets likely to be the most promising with regard to the potential for trading opportunities (comprising a total of 44 catchments):
a. Catchments with >30% but <50% of licences linked to water bodies
at yellow and above and < 30% at red or purple (25 in total);
b. Catchments with >50% of licences linked to water bodies at yellow and above and <30% at red or purple (5 in total);
c. Catchments with >50% of licences linked to water bodies at yellow
and above and > 30% but less than <50% at red or purple (8 in total).
5) These three sets of catchments were analysed to determine the likely
importance of the CAMS downstream status to Environment Agency licensing decisions (e.g. the % of licences linked to a CAMS downstream status of red or purple). From this we identified „candidates within each of the three sets of catchments‟.
19
6) The candidate catchments were then mapped against those catchments where trading has actually taken place to identify the extent of any overlaps and to also determine what additional factors may be important to the development of trading markets.
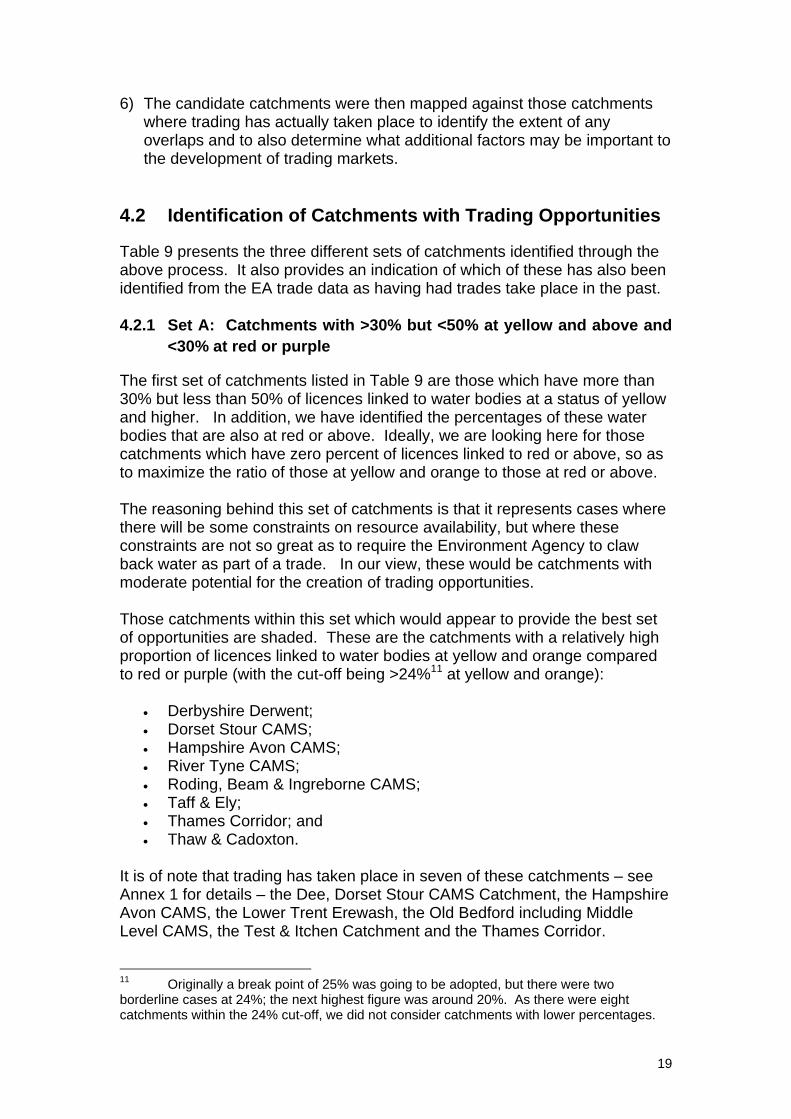
4.2 Identification of Catchments with Trading Opportunities
Table 9 presents the three different sets of catchments identified through the above process. It also provides an indication of which of these has also been identified from the EA trade data as having had trades take place in the past. 4.2.1 Set A: Catchments with >30% but <50% at yellow and above and
<30% at red or purple
The first set of catchments listed in Table 9 are those which have more than 30% but less than 50% of licences linked to water bodies at a status of yellow and higher. In addition, we have identified the percentages of these water bodies that are also at red or above. Ideally, we are looking here for those catchments which have zero percent of licences linked to red or above, so as to maximize the ratio of those at yellow and orange to those at red or above. The reasoning behind this set of catchments is that it represents cases where there will be some constraints on resource availability, but where these constraints are not so great as to require the Environment Agency to claw back water as part of a trade. In our view, these would be catchments with moderate potential for the creation of trading opportunities. Those catchments within this set which would appear to provide the best set of opportunities are shaded. These are the catchments with a relatively high proportion of licences linked to water bodies at yellow and orange compared to red or purple (with the cut-off being >24%11 at yellow and orange):
Derbyshire Derwent; Dorset Stour CAMS; Hampshire Avon CAMS; River Tyne CAMS; Roding, Beam & Ingreborne CAMS; Taff & Ely; Thames Corridor; and Thaw & Cadoxton.
It is of note that trading has taken place in seven of these catchments – see Annex 1 for details – the Dee, Dorset Stour CAMS Catchment, the Hampshire Avon CAMS, the Lower Trent Erewash, the Old Bedford including Middle Level CAMS, the Test & Itchen Catchment and the Thames Corridor.
11
Originally a break point of 25% was going to be adopted, but there were two borderline cases at 24%; the next highest figure was around 20%. As there were eight catchments within the 24% cut-off, we did not consider catchments with lower percentages.

20
A potential constraint on the trading of unused licensed volumes in these catchments is the downstream CAMS status. This would appear to only be a significant issue, however, for three catchments, i.e. the Derbyshire Derwent, Hampshire Avon CAMS Catchment and the Thames Corridor. For all three of these catchments, the percentage of licences linked to water bodies at red and above exceeds 50%; all of the other catchments identified as potentially presenting good trading opportunities have higher percentages of downstream water bodies at yellow and orange (or below) than at red or above. This suggests that five out of the eight catchments may be more relevant for the purposes of this study. 4.2.2 Set B: Catchments with >50% at yellow and above and <30% at
red or purple
This second set of catchments is essentially a more stringent application of the rule that trading opportunities are most likely to be associated with catchments having a high proportion of licences linked to yellow and orange than to red or purple. Thus, one might expect there to be a greater potential for trading within these catchments. As can be seen from Table 9, only nine catchments meet these more stringent requirements:
Broadland Rivers CAMS; Cam & Ely Ouse including South Level CAMS; Ebbw & Lwyd; Kennet & Vale of White Horse; Mole; Ribble, Douglas & Crossens; Steepings, Great Eau & Long Eau; Wey; and Witham CAMS.
For all nine of these catchments over 50% of licences are linked to water bodies at a status of yellow or above, with the highest percentage being in the Kennet & Vale of White Horse catchment. Notice that in both the Ebbw & Lwyd and the Steepings, Great Eau & Long Eau catchments more than 50% of water bodies are classed as being at yellow or orange, while less than 14% are classed as being at red or purple (i.e. the ratio of yellow and orange to red and purple is relatively high). However, for four of these nine catchments, trading of unused licensed volumes may be restricted due to the fact that downstream water bodies are both over licensed and over-abstracted. For the Broadland River CAMS, Kennet & Vale of White Horse, the Mole and the Wey catchments, over 50% of downstream water bodies are classed as being at CAMS status red or above (although this is only marginal for the Broadland River CAMS).

21
Interestingly, trading has taken place in five of these nine catchments, with the Ebbw & Lwyd, the Kennet & Vale of White Horse, the Ribble, Douglas & Crossens and the Steepings, Great Eau & Long Eau CAMS being the only catchments where this has not been the case (see final columns in Table 9). The fact that no trading has occurred in the Ribble, Douglas and Crossens catchment is not surprising given the findings of the case study analysis carried out for this catchment as part of the main study12. Of note though is the fact that the Broadland Rivers CAMS and the Cam & Ely Ouse (including South Level CAMS) are the two catchments which have seen the highest level of trading under the current regime. Given the above analysis, we have identified five of these catchments as providing the greatest opportunities for trading in unused licensed volumes:
Broadland Rivers CAMS; Cam & Ely Ouse (including South Level CAMS); Ebbw & Lywd CAMS; Steepings, Great Eau & Long Eau CAMS; and Witham CAMS (see also the Witham case study).
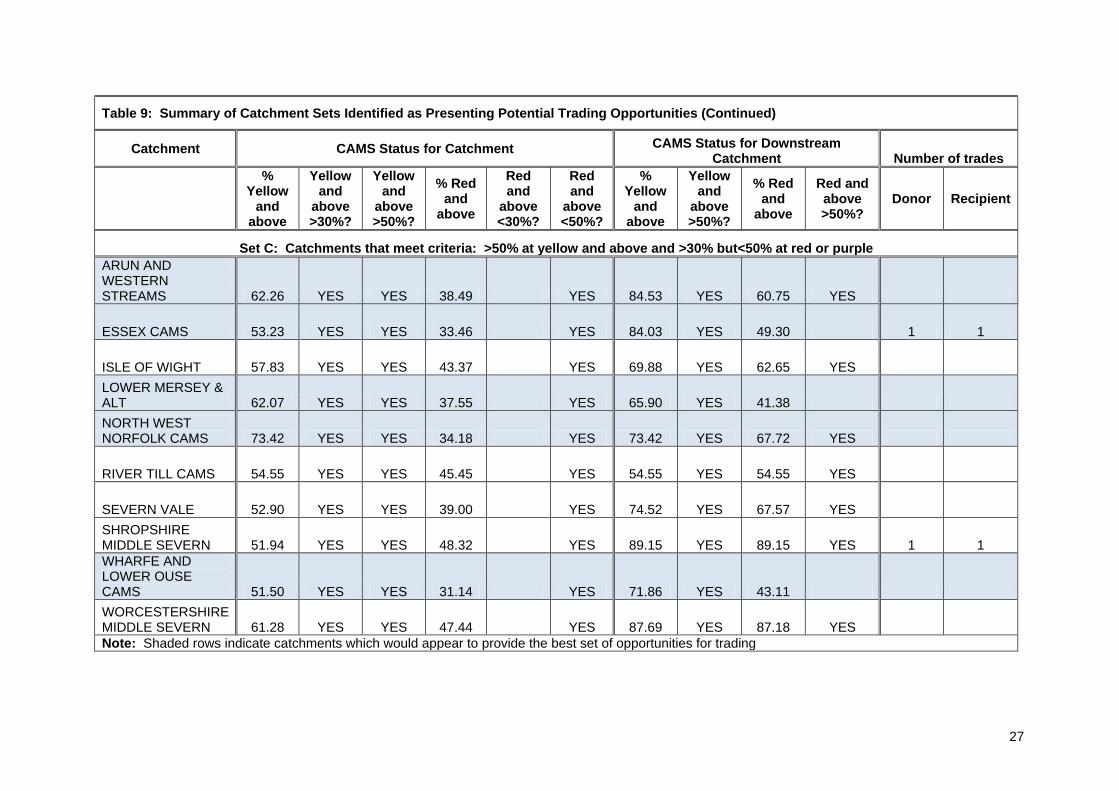
4.2.3 Set C: Catchments with >50% at yellow and above and <50% at
red or purple
This third set of catchments is similar to Set B, although it allows consideration of those cases where there is a greater degree of over-abstraction compared to just over-licensing. One would, therefore, expect there to be some trading opportunities in this catchment, even if the potential to trade in unused licensed volumes is more limited than in Set B. Within this set of 10 catchments (see Table 9), those with the greatest ratio of licences linked to yellow and orange compared to red or purple CAMS status water bodies are:
Arun & Western Streams; and the Essex CAMS.
Of these two catchments, the Arun & Western Streams has the greatest ratio of yellow/orange to red/purple, with around 24% of licences linked to water bodies at yellow/orange and 38% linked to water bodies at red/purple. The Arun & Western Streams, however, has around 61% of downstream licences linked to water bodies at red and above and this is likely to act as a limiting factor for the potential to trade in this catchment. Around 49% of licences in the Essex CAMS are linked to a downstream CAMS status of red/purple. This factor may also limit the potential to trade unused licensed volumes in the
12 In particular, it was found that industrial decline has left a surplus of water available, particularly in the Calder area where unused licences are being voluntarily given up. It was concluded that a trading system would, therefore, be unlikely to work here as there is no real demand for abstraction licences and it would be relatively easy to obtain a new abstraction licence from the Environment Agency. Note that this is one of the catchments where the CAMS data will be revised as part of the up-date.

22
Essex CAMS. It is of note, however, that trading has already taken place under the current regime in the Essex CAMS.
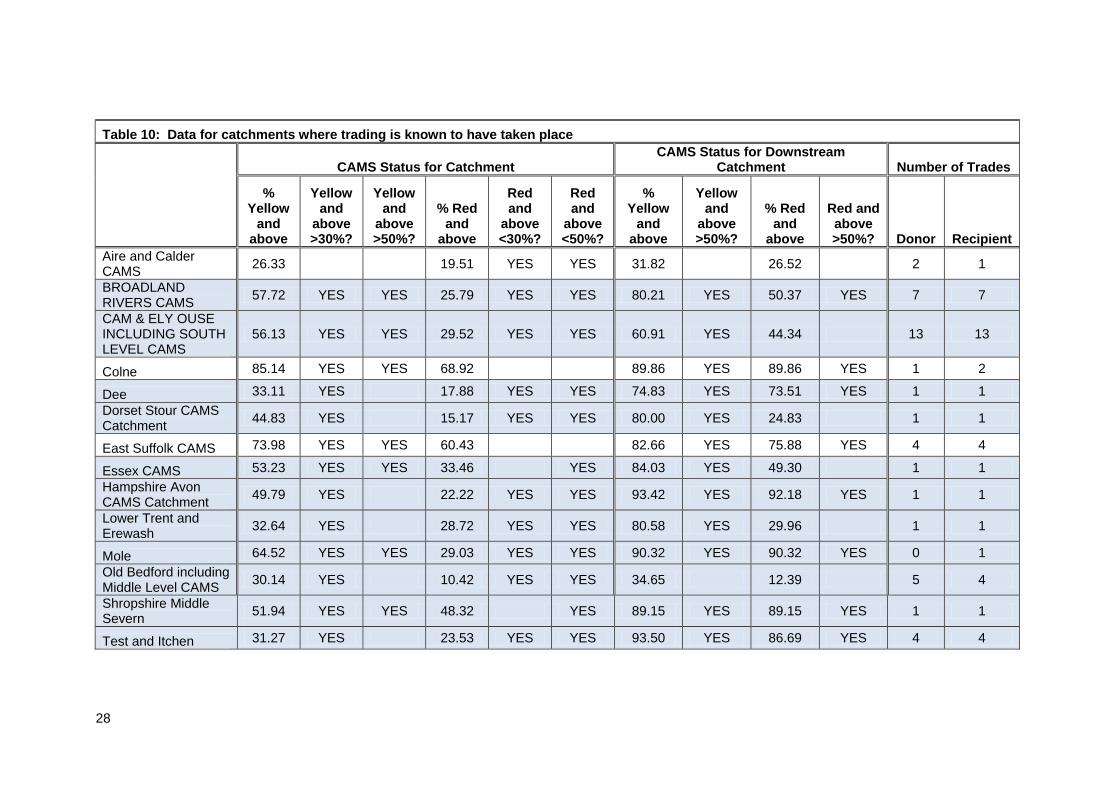
4.2.4 Comparative analysis where trading has taken place
In total, the above analysis has identified fourteen out of the nineteen catchments where trading is known to have taken place. These catchments are highlighted in Table 10, which also presents data on the CAMS status for the catchment and the downstream catchment. Examination of the data presented in Table 10 indicates that the existence of some of the trading activities appears counter-intuitive. For example, trading has taken place in three catchments13 even though the percentage of licences linked to water bodies at yellow and above is relatively low (i.e. below 30%) and the percentage of downstream water bodies at a status of yellow and above is below 50%. The NALD has been used to examine more closely these trades which appear to be counter-intuitive. In the Aire & Calder CAMS, trading took place on between agricultural users in water bodies that were at stress. The trade was temporary (one season) and moved from a water body at CAMS status of red to a water body at CAMS status purple. The downstream CAMS status for this trade was red (donor) and purple (recipient). Note that as the trade was short-term in nature, it is unlikely that it raised significant issues with regard to environmental impacts and may actually have produced some benefits given that the trade was to a more stressed water body. Although trading in the Dee, Dorset Stour CAMS, the Hampshire Avon CAMS, Lower Trent and Erewash, the Test & Itchen, the Thames Corridor and the Warwickshire Avon catchments may at first sight appear to be somewhat counter-intuitive, closer inspection of the downstream CAMS status for these catchments indicates high levels of over-licensing and over-abstraction. Perhaps less surprising is the fact that trading has taken place in the Colne catchment, given that it is a highly stressed catchment itself, as are downstream water bodies (see also the Colne case study). In this case, trading in used quantities may be the only means of obtaining access to abstraction supplies.
13 Aire and Calder CAMS, Old Bedford including Middle Level CAMS, Upper Ouse & Bedford Ouse CAMS.

23
Table 9: Summary of Catchment Sets Identified as Presenting Potential Trading Opportunities
Catchment
CAMS Status for Catchment CAMS Status for Downstream
Catchment Number of trades
% Yellow
and above
Yellow and
above >30%?
Yellow and
above >50%?
% Red and
above
Red and
above <30%?
Red and
above <50%?
% Yellow
and above
Yellow and
above >50%?
% Red and
above
Red and above >50%?
Donor Recipient
Set A: Catchments that meet criteria: >30% but < 50% at yellow and above and less than 30% at red or purple
BRISTOL AVON, LITTLE AVON, AXE AND NORTH SOMERSET STREAMS CAMS CATCHMENT 34.70 YES 17.54 YES YES 47.39 28.36
DEE 33.11 YES 17.88 YES YES 74.83 YES 73.51 YES 1 1
DERBYSHIRE DERWENT 38.94 YES 11.50 YES YES 87.61 YES 70.80 YES
DORSET STOUR CAMS CATCHMENT 44.83 YES 15.17 YES YES 80.00 YES 24.83 1 1
DOVE 42.68 YES 25.61 YES YES 98.78 YES 98.78 YES
ESK CAMS 42.11 YES 26.32 YES YES 73.68 YES 57.89 YES
FROME, PIDDLE AND PURBECK CAMS CATCHMENT 48.97 YES 28.87 YES YES 71.13 YES 30.93
HAMPSHIRE AVON CAMS CATCHMENT 49.79 YES 22.22 YES YES 93.42 YES 92.18 YES 1 1
HULL AND EAST RIDING CAMS 36.93 YES 20.91 YES YES 63.07 YES 24.39

24
Table 9: Summary of Catchment Sets Identified as Presenting Potential Trading Opportunities
Catchment
CAMS Status for Catchment CAMS Status for Downstream
Catchment Number of trades
% Yellow
and above
Yellow and
above >30%?
Yellow and
above >50%?
% Red and
above
Red and
above <30%?
Red and
above <50%?
% Yellow
and above
Yellow and
above >50%?
% Red and
above
Red and above >50%?
Donor Recipient
Set A: Catchments that meet criteria: >30% but < 50% at yellow and above and less than 30% at red or purple (con’t)
LONDON 37.10 YES 16.61 YES YES 62.19 YES 38.16
LOWER TRENT AND EREWASH 32.64 YES 28.72 YES YES 80.58 YES 29.96 1 1
MEDWAY 30.45 YES 18.69 YES YES 84.78 YES 19.72
NORTH NORFOLK CAMS 35.14 YES 27.93 YES YES 63.96 YES 57.66 YES
OLD BEDFORD INCLUDING MIDDLE LEVEL CAMS 30.14 YES 10.42 YES YES 34.65 12.39 5 4
RIVER TYNE CAMS 30.16 YES 3.17 YES YES 77.78 YES 3.17
RODING BEAM & INGREBOURNE 30.53 YES 6.32 YES YES 32.63 10.53
SOUTH CUMBRIA 31.07 YES 28.16 YES YES 52.43 YES 49.51
STAFFORDSHIRE TRENT VALLEY 38.46 YES 29.86 YES YES 95.02 YES 36.20
SWALE URE NIDD AND UPPER OUSE CAMS 33.65 YES 15.96 YES YES 42.69 17.12

25
Table 9: Summary of Catchment Sets Identified as Presenting Potential Trading Opportunities
Catchment
CAMS Status for Catchment CAMS Status for Downstream
Catchment Number of trades
% Yellow
and above
Yellow and
above >30%?
Yellow and
above >50%?
% Red and
above
Red and
above <30%?
Red and
above <50%?
% Yellow
and above
Yellow and
above >50%?
% Red and
above
Red and above >50%?
Donor Recipient
Set A: Catchments that meet criteria: >30% but < 50% at yellow and above and less than 30% at red or purple (con’t)
TAFF AND ELY 35.19 YES 1.85 YES YES 81.48 YES 1.85
TEST AND ITCHEN 31.27 YES 23.53 YES YES 93.50 YES 86.69 YES 4 4
THAMES CORRIDOR 45.33 YES 19.00 YES YES 83.33 YES 81.67 YES 1 1
THAW AND CADOXTON 47.06 YES 17.65 YES YES 52.94 YES 17.65
TORRIDGE AND HARTLAND STREAMS CAMS CATCHMENT 40.74 YES 18.52 YES YES 51.85 YES 18.52
WEAVER / DANE 33.33 YES 22.67 YES YES 56.00 YES 46.67
Note: Shaded rows indicate catchments which would appear to provide the best set of opportunities for trading

26
Table 9: Summary of Catchment Sets Identified as Presenting Potential Trading Opportunities (Continued)
Catchment CAMS Status for Catchment CAMS Status for Downstream Catchment Number of trades
% Yellow
and above
Yellow and above >30%?
Yellow and
above >50%?
% Red and
above
Red and
above <30%?
Red and
above <50%?
% Yellow
and above
Yellow and
above >50%?
% Red and
above
Red and
above >50%?
Donor Recipient
Set B: Catchments that meet criteria >50% at yellow and above and less than 30% at red or purple
BROADLAND RIVERS CAMS 57.72 YES YES 25.79 YES YES 80.21 YES 50.37 YES 7 7
CAM & ELY OUSE incl SOUTH LEVEL CAMS 56.13 YES YES 29.52 YES YES 60.91 YES 44.34 13 13
EBBW AND LWYD 54.84 YES YES 0.00 YES YES 64.52 YES 0.00
KENNET & VALE OF WHITE HORSE 66.98 YES YES 22.79 YES YES 89.30 YES 89.30 YES
MOLE 64.52 YES YES 29.03 YES YES 90.32 YES 90.32 YES 0 1
RIBBLE, DOUGLAS & CROSSENS 65.08 YES YES 26.68 YES YES 80.69 YES 43.60
STEEPINGS, GREAT EAU & LONG EAU CAMS 65.85 YES YES 13.41 YES YES 73.17 YES 29.27
WEY 53.33 YES YES 27.27 YES YES 83.64 YES 83.64 YES 2 1
WITHAM CAMS 53.42 YES YES 15.11 YES YES 63.49 YES 16.01 1 1
27
Table 9: Summary of Catchment Sets Identified as Presenting Potential Trading Opportunities (Continued)
Catchment CAMS Status for Catchment CAMS Status for Downstream Catchment Number of trades
% Yellow
and above
Yellow and
above >30%?
Yellow and
above >50%?
% Red and
above
Red and
above <30%?
Red and
above <50%?
% Yellow
and above
Yellow and
above >50%?
% Red and
above
Red and above >50%?
Donor Recipient
Set C: Catchments that meet criteria: >50% at yellow and above and >30% but<50% at red or purple
ARUN AND WESTERN STREAMS 62.26 YES YES 38.49 YES 84.53 YES 60.75 YES
ESSEX CAMS 53.23 YES YES 33.46 YES 84.03 YES 49.30 1 1
ISLE OF WIGHT 57.83 YES YES 43.37 YES 69.88 YES 62.65 YES
LOWER MERSEY & ALT 62.07 YES YES 37.55 YES 65.90 YES 41.38
NORTH WEST NORFOLK CAMS 73.42 YES YES 34.18 YES 73.42 YES 67.72 YES
RIVER TILL CAMS 54.55 YES YES 45.45 YES 54.55 YES 54.55 YES
SEVERN VALE 52.90 YES YES 39.00 YES 74.52 YES 67.57 YES
SHROPSHIRE MIDDLE SEVERN 51.94 YES YES 48.32 YES 89.15 YES 89.15 YES 1 1
WHARFE AND LOWER OUSE CAMS 51.50 YES YES 31.14 YES 71.86 YES 43.11
WORCESTERSHIRE MIDDLE SEVERN 61.28 YES YES 47.44 YES 87.69 YES 87.18 YES
Note: Shaded rows indicate catchments which would appear to provide the best set of opportunities for trading
28
Table 10: Data for catchments where trading is known to have taken place
CAMS Status for Catchment CAMS Status for Downstream
Catchment Number of Trades
% Yellow
and above
Yellow and
above >30%?
Yellow and
above >50%?
% Red and
above
Red and
above <30%?
Red and
above <50%?
% Yellow
and above
Yellow and
above >50%?
% Red and
above
Red and above >50%? Donor Recipient
Aire and Calder CAMS
26.33 19.51 YES YES 31.82 26.52 2 1
BROADLAND RIVERS CAMS
57.72 YES YES 25.79 YES YES 80.21 YES 50.37 YES 7 7
CAM & ELY OUSE INCLUDING SOUTH LEVEL CAMS
56.13 YES YES 29.52 YES YES 60.91 YES 44.34 13 13
Colne 85.14 YES YES 68.92 89.86 YES 89.86 YES 1 2
Dee 33.11 YES 17.88 YES YES 74.83 YES 73.51 YES 1 1
Dorset Stour CAMS Catchment
44.83 YES 15.17 YES YES 80.00 YES 24.83 1 1
East Suffolk CAMS 73.98 YES YES 60.43 82.66 YES 75.88 YES 4 4
Essex CAMS 53.23 YES YES 33.46 YES 84.03 YES 49.30 1 1
Hampshire Avon CAMS Catchment
49.79 YES 22.22 YES YES 93.42 YES 92.18 YES 1 1
Lower Trent and Erewash
32.64 YES 28.72 YES YES 80.58 YES 29.96 1 1
Mole 64.52 YES YES 29.03 YES YES 90.32 YES 90.32 YES 0 1
Old Bedford including Middle Level CAMS
30.14 YES 10.42 YES YES 34.65 12.39 5 4
Shropshire Middle Severn
51.94 YES YES 48.32 YES 89.15 YES 89.15 YES 1 1
Test and Itchen 31.27 YES 23.53 YES YES 93.50 YES 86.69 YES 4 4

29
Table 10: Data for catchments where trading is known to have taken place
CAMS Status for Catchment CAMS Status for Downstream
Catchment Number of Trades
% Yellow
and above
Yellow and
above >30%?
Yellow and
above >50%?
% Red and
above
Red and
above <30%?
Red and
above <50%?
% Yellow
and above
Yellow and
above >50%?
% Red and
above
Red and above >50%? Donor Recipient
Thames Corridor 45.33 YES 19.00 YES YES 83.33 YES 81.67 YES 1 1
Upper Ouse & Bedfordshire Ouse CAMS
21.79 12.84 YES YES 23.28 12.84 2 3
Warwickshire Avon 19.88 7.55 YES YES 92.60 YES 8.63 2 2
Wey 53.33 YES YES 27.27 YES YES 83.64 YES 83.64 YES 2 1
Witham 53.42 YES YES 15.11 YES YES 63.49 YES 16.01 1 1
Note: Shaded rows indicate catchments where trading has taken place and which were identified as providing the best set of opportunities for trading

30
4.3 Proposed short-list of catchments for further analysis
Based on the analysis carried out to date, we have identified eight potentially stronger and two weaker candidate catchments to act as the focus for possible active promotion of trading. As with the above analysis, the focus here has been on identifying those catchments where there may be the possibility of trading both used and unused licensed quantities. Our suggested catchments for further discussion with Defra and the EA are listed below. Note that we have tried in all cases to identify those catchments with the highest ratios of yellow and orange to red and purple in the catchment itself and high ratios of yellow and orange to red and purple in downstream water bodies. This has meant that we have not suggested some of the other catchments included in Table 9.
Strong candidates: o Dorset Stour CAMS Catchment (Set A) o River Tyne CAMS (Set A) o Roding Beam & Ingreborne (Set A) o Taff and Ely (Set A) o Thaw and Cadoxton (Set A) o Ebb and Lwyd (Set B) o Steepings, Great Eau & Long Eau (Set B) o Witham CAMS (Set B)
Weaker candidates due to the level of trading that has already taken
place: o Broadland Rivers CAMS (Set B) o Cam & Ely Ouse including South Level CAMS (Set B)
Out of the above, the River Tyne and the Roding Beam & Ingreborne would appear to be the weakest of the „strong‟ candidates and are probably on a par with the two Set B candidates that are identified as being the weakest within this set only because they already have high levels of trading and thus may not be in as great a need for active promotion of further trading (i.e. the Broadland Rivers CAMS and the Cam and Ely Ouse including South Level CAMS).

31
5. Evaluation of Selected Catchments
5.1 Approach
Following agreement of the catchments in Section 4.3, a series of questions (refer to Annex 5) regarding the likely interest in trading and the feasibility of allowing it from a water resources perspective were developed and sent out to Regional/Area staff of the EA. Information was also provided on the findings of the first study and on the analysis carried out as part of this work, to provide a background and context for discussions on each catchment.
5.2 Conclusions by Catchment
5.2.1 Overview
Table 11 gives an overview of key conclusions for the case study catchments while following discussion looks at these conclusions in greater detail.
Table 11: Overview of key conclusions for case study catchments
Catchment Key Conclusions
Dorset Stour CAMS
One trade has taken place in the catchment but the EA do not think there is much demand for trading. There is not a significant demand for new licences in the catchment and those who have sought an abstraction licence have generally managed to obtain one fairly easily.
River Tyne CAMS
No licence trading has occurred in the River Tyne CAMS. Due to the fact that water is readily available, the EA do not think there is any demand for licence trading. The EA noted, however, that the Kielder Reservoir could potentially act as a donor to other catchments via inter-catchment licence trading.
Roding Beam & Ingreborne
There is an unmet demand for abstractions within the catchment, but the hydraulic regime and hence licensing are extremely complex resulting in only winter abstractions being approved. As a result, farmers have been building winter storage reservoirs for the past 15 years. The need to have a reservoir in order to abstract water means that there will be no short term trading and there is the potential that it may not be possible to recoup expenditure on a new reservoir if the licence is time limited and there is not an adequate guarantee of access to water. It might be possible though to overcome some of the system constraints if farmers could work together and take water within a rota system although the organisational structure required for such cooperative working is missing.
Taff and Ely The EA believe that given the lack of demand for water in the Taff and Ely catchment, there would be no demand for abstraction licence trading. There is some demand for abstraction licences for hydropower but, as this is non-consumptive, it is not a significant concern.
Thaw and Cadoxton
The EA believe there is little in the way of demand for abstraction licences within the catchment. Although there is a fair amount of water taken for industrial purposes, industrial demand is not growing. In most cases, new licences would be issued within the catchment (including at CAMS status yellow) subject to some restrictions.
Ebb and Lwyd There may be opportunities to trade in the Lwyd or to claw back unused volumes but, given that there is little demand for water, it would not really be a suitable case for any form of trial to promote trading.
Steepings, Great Eau & Long Eau and Witham
The EA sees key barriers to trading within the catchment as being: the lack of a farmers‟ cooperative or abstractors‟ group which could act as the focus for discussions on trading; the speed of the current system that

32
Table 11: Overview of key conclusions for case study catchments
Catchment Key Conclusions
CAMS prevents temporary, seasonal trading; and a lack of clarity for licence holders as to what may be possible with respect to trading. They would be interested in a promotion exercise that started with an effort to create a farmers‟ abstractor group, ideally with this covering not only the potential for trading but also water efficiency issues.
Broadland Rivers CAMS
Although there are 7 trades recorded in the EA Trade data, the EA have suggested that the number of trades may actually be higher. They receive a lot of requests for both permanent and temporary trades within the catchment. The EA would be interested in running a pilot to provide better information on what the possibilities, when to contact the EA, the potential need for claw back in some areas, and the potential for trading unused quantities in others. The EA also indicated that a faster approvals system may help to encourage short-term trades as it would give farmers greater flexibility on an annual basis.
Cam & Ely Ouse CAMS
As there have already been 13 trades in the Cam & Ely Ouse CAMS, the EA indicated that the most valuable form of promotion exercise would be one targeted at creating short-term temporary trades. They believe that this could have some real value in the Fenland levels areas where it would be possible for farmers to trade quantities for a season. Again, the view was expressed that a faster approvals system may help to encourage short-term trades.
5.2.2 Dorset Stour CAMS
Three catchments in South West Region were identified as possible Set A candidates: the Dorset Stour, Hampshire Avon, and the Frome & Piddle. However, as indicated above both the Hampshire Avon and the Frome & Piddle were discounted due to the high level of downstream water bodies at red and purple. When discussing issues surrounding the potential for trading in the Dorset Stour we confirmed this decision with the EA Area staff. They noted the potential issues that would arise with promotion of trading in these other catchments due to the „low flow‟ history of the Frome & Piddle catchment and the presence of an SAC in the Hampshire Avon which is leading to the need to claw back water from abstractors. With respect to the Dorset Stour catchment, it is of note that there are only a relatively small number of licences in the catchment (around 170) and that most water is taken for PWS (excluding non-consumptive hydropower, fisheries and aquaculture). There are a few agricultural licences for relatively small quantities but there is not really any industry in the catchment. They confirm that one trade has taken place within the catchment but more generally the do not believe there is much demand for trading. Most people who have sought an abstraction licence have managed to obtain one fairly easily, with there being little incentive to trade. One or two people have applied for a new licence through a trade in the past, but have dropped out of the process because it is too complicated. Generally though there is not a significant demand for new licences in the catchment. Those who wish to obtain a licence would prefer to apply for a new licence because the process is more straight-forward than for trading. If approached, the EA would provide

33
those interested in a trade with a list of licence holders with unused licence volumes to contact to negotiate a possible trade. The general view is that the amount of water that could be freed up through trading may be small with respect to any particular donor. As each licence will have different conditions attached to it, it may be very complicated if a potential abstractor wished to obtain a large licensed volume by obtaining licences from lots of smaller abstractors. The costs of trading may therefore act as a barrier. In addition, farmers have constructed winter storage reservoirs within the catchment, with this further reducing demand for new licences. The Area also feels that as there are not many farmers in the catchment there is unlikely to be much potential for temporary trading, given the dominance of the catchment by PWS abstractions (which are they felt were unlikely to be available for trading on a temporary basis given pressures more generally on PWS supplies in the area). Those who hold an abstraction licence for spray irrigation do not generally use their licence – but instead are holding them for their asset value. Although the EA have considered revoking unused licensed volumes the gains would be small.
5.2.3 River Tyne CAMS
The River Tyne is regulated by the Kielder Reservoir, so there are no real resource availability issues in the catchment. Water is readily available and the Area staff have confirmed that there is no history of licence trading in the catchment and that, in their view, there is no need for it.
Although there are some water bodies that are currently recorded as being at an orange, red or purple status. These are all adjoining/near to reservoirs, where the amount of water has been apportioned incorrectly, so this is a data inaccuracy issue rather than due to problems with water availability.
The Area staff noted though that the Kielder Reservoir was built to supply development at Teeside which never materialized. The reservoir could potentially supply the whole of the Tyne, Tees and Weir (these rivers are all interconnected). Thus, although there is no demand for abstractions trading within the catchment, the Reservoir could potentially act as a donor to other catchments via inter-catchment licence trading.
5.2.4 Roding, Beam & Ingrebourne
Only the Upper Roding & Cripsey Brook WRMU within this catchment is facing constraints on abstractions, with these applying to both ground and surface water supplies. Groundwater is no longer available due to the fact that it is part of a confined aquifer system and is considered over-abstracted in another connecting – hydraulically downstream - WRMU. The real issue for this study then is surface water availability, for which no new consumptive licences are being issued. There is no hydrologic linkage between the groundwater and surface water systems.

34
There are no surface water abstractions for public water supply within the CAMS area. Surface water abstractions are almost all for agricultural purposes, with the water used mainly for production of potatoes and other root vegetables. The current licensing system in the catchment is extremely complex and is not typical of the way in which other catchments have been managed. As the geology of the catchment is largely clay and has very little summer flow, abstraction has historically been licensed for the winter months only14. Unusually, because the EA has not historically licensed for summer abstractions, under the current CAMS assessment regime there is water available for the summer but not for the winter. However, it could be “legally” difficult to now let newcomers have water in the summer given that all other historic abstractors have had to take water in the winter (and essentially construct reservoirs in order to have the water). Because water has only been licensed during the winter, the system is now very complex with regard to when new abstractors are able to take it. Essentially, water is currently only available at very high Q values (Q11 or Q17) with farmers taking water off during peak flow periods in November to January. The EA cannot license water without considering these constraints due to the need to ensure that they do not derogate any existing rights (at least not without the agreement of the existing licence holder). Any individual licence holder is likely to have more than one constraint applying to his licence: one will apply to the pumping rate for normal flows with the second being a higher pumping rate applying to flood flows. There is an unmet demand for abstractions within the CAMS with on average four queries being made in any given year. There used to be a greater number of queries but farmers have been building winter storage reservoirs for the past 15 years and there is generally a better understanding of the complexity of the system. Because the catchment is underlain with clay, constructing reservoirs is less costly than in other locations (i.e. 3 to 4 times cheaper). Farmers also currently rent land from one another with this including access to water stored in a reservoir (a form of informal trading). By way of example, there is currently a farmer who wants to trade his existing summer licence for a winter storage licence. He wants to take more than he can take on his summer licence and wants to move the location of the abstraction upstream. He is looking for trade partners but given the more general investment in winter storage reservoirs he may be unlikely to find someone willing to make the trade. Thus, there are two key constraints to trading:
1) In order to have a licence, farmers essentially have to have constructed a winter storage reservoir in order to take and store the water for
14 Note that winter flow in the catchment is very peaky.

35
summer use. But, a farmer would not incur the expenditure required to build a reservoir unless he has guaranteed access to water. Thus, there would be no short term trading of water and only long term trading if someone is leaving the industry.
2) It might be possible to overcome some of the system constraints if
farmers worked together better in cooperation and took water within a rota system. However, a farmers' group is missing within this catchment so the organisational structure required for such cooperative working is missing.
It is also clear that farmers do hold licensed volumes which are not used in an average year. However, years such as this one highlight why they are unlikely to let go of some of their typically unused portion. It also highlights why it is hard for the EA to determine what „reasonable need‟ is for farmers. The Area staff find it hard to assess „reasonable need‟ in a farming context and how they should value water needs from a farmer‟s perspective given that their contracts vary on an annual basis and the lack of a licence may prohibit them from growing certain crops (e.g. potatoes and other root vegetables). The Area would welcome research into assessing and valuing „reasonable needs‟ within the context of farming; it was noted that farming is much harder in this respect due to variations in annual contracts and hence demand for water than say golf courses where demand is pretty constant and one can look at climatic conditions and come to an estimate. Thames North East would be interested in supporting research to look at the current constraints and how they operate, so as to move the system to one which is based on a CAMS banding approach. This might make it easier to operate and might open up some water availability and/or facilitate trading. In addition, the creation of a farmers‟ cooperative group might also improve the situation and enable licensing of a greater amount of water and possibly temporary trading. It was also suggested that if trading were to be promoted in the catchment, the system would have to be developed so that any approvals system would work more rapidly. In their view, this would mean that for temporary licence trades the approvals would need to be dealt with within a month from the request. The need to remove the requirement to advertise the potential trade would be removed and licensing staff would reach a decision within a month of receipt. It was noted though that this would probably require a change to the current system.
5.2.5 Taff & Ely
Although historically there has been a lot of mining within the catchment, many industrial abstraction licences have been revoked over the last ten years. There is now limited demand for abstractions for industrial purposes within the catchment (although the EA noted that there is still one significant industrial abstraction licence in the Ely catchment). By volume, most

36
abstraction within the catchment is for PWS, with this amounting to around 83% of the total licensed volume. There is very little agricultural abstraction. The CAMS status for the Taff & Ely has recently been updated. While the main strand of the Taff used to have resource availability issues (CAMS status orange), this is no longer the case and more water is now available for abstraction. However, resource availability issues do remain in some of the Taff & Ely tributaries. However, given the lack of demand for water in general, there is believed to be no demand for trading within the Taff & Ely catchment. There is some demand for abstraction licences for hydropower but, as this is non-consumptive, it is not a significant concern.
5.2.6 Thaw & Cadoxton
Most abstraction within the catchment is for PWS and industrial use – with around 50% of water taken for PWS and around 47% taken for industrial purposes. Industrial operations within the catchment include chemical manufacture, cement manufacture and power generation. Resource availability within the catchment is generally good but there are a few hotspots with availability issues. The chemical plant within the catchment is causing some issues but these mainly relate to chemical modification (i.e. resource quality rather than availability). There is little in the way of demand for abstraction licences within the catchment. Although there is a fair amount of water taken within the catchment for industrial purposes, the industrial sector is not growing. In most cases, new licences would be issued within the catchment subject to some restrictions. Licences would still be issued at CAMS status yellow.
5.2.7 Ebb and Lwyd
The Ebbw and Lwyd has recently been merged into the South East Valleys CAMS but it still has individual assessment points so it is possible to comment on these separately. Historically, demand in these catchments has been low. There is little industrial usage now that the South Wales coalfields are largely defunct (and their licences have been revoked). The main lengths of the Ebbw and Sirhowy mostly have good availability. The Lwyd has large but mostly unused public water supply licences. There is very little recent interest in licences in the Lwyd catchment. There may be opportunities to trade in the Lwyd or to claw get back unused volumes but given that there is little demand for water, it would not really be a suitable case for any form of trial to promote trading.

37
5.2.8 Steepings, Great Eau & Long Eau and the Witham
Within the Steepings, Great Eau & Long Eau catchment, fish and plant aquaculture is the sector accounting for the greatest level of abstractions, followed by PWS and then spray irrigation. By number, the catchment is dominated by spray irrigation and other agricultural licences; however, there are only 78 licences in total. Within the Steepings, Great Eau & Long Eau CAMS, water is available in some parts and where an application is made to take water from such rivers then they will generally be issued a new licence so there is little incentive for trading to take place in these cases. In other parts of the catchment, water is not currently available. As a result, there is an unmet demand within the catchment but increasingly farmers are meeting this through the construction of winter storage reservoirs and/or by obtaining new licences with significant restrictions. Where water is not available then trading can take place but restrictions will be placed on the trade (e.g. water clawed back). Anyone holding a licence with an unused portion is being encouraged to reduce their licence voluntarily and there are some licences which have not been fully used in the past 6 years. Reduction of these is being explored to a degree but this year‟s dry period has not really helped as farmers are drawing on licensed volumes that they have not used since 1996. The EA sees key barriers to trading within the catchment as being:
1) Lack of a farmers‟ cooperative or abstractors‟ group which could act as the focus for discussions on trading. The EA view is that farmers are not going to want to give up water, although they may be interested in temporary trades. However, this would also need a more rapid system than the existing one.
2) Lack of clarity for licence holders as to what may be possible with respect to trading.
They would be interested in a promotion exercise that started with an effort to create a farmers‟ abstractor group, ideally with this covering not only the potential for trading but also water efficiency issues.
Similarly, the big issue for the Witham is that there is a lack of clarity amongst licence holders on what the possibilities, constraints, etc. are; this is in part due to the fact that there is no strong farmers‟ association (only the small one described in the case study). As a result, it would also be a possible catchment for greater promotion of trading.

38
5.2.9 Broadland Rivers CAMS
Abstractions within the catchment are mostly from groundwater with the ratio of groundwater to surface water actual volumes being around 4 to 1. PWS is the dominant abstractor, followed by agriculture and industrial, commercial and other abstractions. Although there are a lot of agricultural abstractors, the volume they take is small compared to that taken by PWS. (See also Annex 4 for further details on the composition of abstractors within this and the other catchments, as well as an indication of the dominant abstractor type.) The EA is currently undertaking reviews of the PWS consents and are seeking reductions in licensed volumes in some cases. They are also currently applying Section 57 restrictions to farmers due to the extreme weather conditions. There are some sleeper licences in the catchments but these are only small and they are actively trying to revoke or reduce these, e.g. by 25% to 50%. But given the size of these licences, revocation will only free up very small amounts of total licensed demand (i.e. about 0.4%). The EA confirmed that trading has taken place within the catchment and it was suggested that this may actually be higher than the seven reported above as some of the temporary trades (e.g. for gravel washing) may have been classed as licence variations. Trading has taken place in waters that are at red or purple status, but this will have been restricted to used licence volumes and the EA would generally have tried to claw back some water for the environment in these cases. In waters at yellow or orange status, the EA might allow some trading of unused portions of licences, as long as there would be no deterioration in the status of the water body. Although there has been significant construction of winter storage reservoirs in the catchment, the Area receives a lot of requests for trading on an annual basis. Some of these are for permanent trades and some are for temporary trades (e.g. there are a lot of temporary trades for gravel washing purposes). They have a list of licences that are not fully used and when they receive a request for water or a trade they provide applicants with a report on licence holders nearby the proposed point of abstraction who may be willing to trade part of their licence (no details are provided of PWS abstractions and no other confidential/ sensitive data are released). It is then up to the applicant to approach the licence holders and to negotiate a trade. The Area would be interested in running a pilot but they are not sure that the potential for trading would free up sufficient quantities to make trading actually worthwhile. The amounts of unused water that are on offer are generally quite small and it may not be worth the costs of following up on trade possibilities for a trade to actually take place. However, the Area staff can see a real advantage to having a pilot which provided better information on what the possibilities are, when to contact the EA, the potential need for claw back in some areas, and the potential for trading unused quantities in others.

39
The Area staff also indicated that a faster approvals system may be very helpful in encouraging more short-term trades. This may be of more value than encouraging more permanent trades, as it would give farmers additional flexibility on an annual basis. There is an organised farmers group within the catchment - the Broadland Agricultural Water Abstractor group (BAWAG) - who are the Area‟s main stakeholder group in Norfolk. The BAWAG represents abstractors‟ interests in the North Norfolk CAMS and the Broadland Rivers CAMS. The group includes breweries, glasshouses, and processors amongst its 180 members. They work together to ensure they are using their supplies as efficiently as possible, share knowledge and resources, and sub-groups have been set up within BAWAG to target particular locations or issues. Of note is the fact that five shared reservoirs are in development.
5.2.10 Cam & Ely Ouse CAMS
The Area staff agree with the figure quoted above of 13 trades within the catchment area over the last few years. They confirmed that these were trades between agricultural abstractors (predominantly root crops), with this group making up the majority of licence holders, even though the total volume that agriculture accounts for is small (PWS is the dominant abstractor, with this catchment covering Bury St Edmunds and Cambridge and having a lot of pressure from the increased growth around Cambridge). The CAMS is currently now at a „no water available‟ status except at high river flows; indeed some parts of the catchment have been put under such stress due to population growth etc, that they have recently been up-graded to a status of over-abstracted. As a result, there is a lot of pressure to find unused water. There have been no new summer licences for several years now and conditions on licences are at about the Q30 to Q20 levels for some water bodies. There are a few sleeper licences which they know have not been fully used over the last few years but they are not sure how much water they would gain from reducing these. They would expect the gains to be a very small percentage of total licensed volume for the catchment. There is a general interest in trading with the catchment and there have been cases where trades have been stopped due to local issues (e.g. a groundwater abstraction too close to a designated site or to WFD investigation site, or someone wants to take groundwater close to a river and which would place it under stress). In the view of the Area staff, farmers in the catchment are always interested in gaining a bit more water where there is some that is unused. The alternative is to build a winter storage reservoir, which is increasingly taking place; indeed some farmers are either expanding existing reservoirs or building new reservoirs with a capacity to meet demand in the event of two dry seasons in a row. This is despite the high set up costs (although they also note that the

40
help which the government is providing in the form of grants is really important in this regard). Note that this is one of the catchments where there has been trading by a PWS on a temporary basis (e.g. a 5 year period). In one case this was because they could not easily get water to a large leisure development, so trading on a groundwater abstraction licence was easier. In the other case, the trade was between the PWS and a brewery. Because there is already trading taking place, the EA indicated that the most valuable form of promotion exercise would be one targeted at creating short-term temporary trades. They believe that this could have some real value in the Fenland levels areas where it would be possible for farmers to trade quantities for a season. There is a farmers‟ abstractors group along the Lark system and some trades between members of the group have taken place, This is not the focus of the group, however, which meets roughly once a year in the spring with the aim of discussing prospects for the forthcoming season. The Area staff agreed with the suggestion that the current timescale to gain approvals for a trade can put people off (e.g. typically 4-5 months). If a more flexible system could be put in place to enable short term trading then this might improve the efficiency of water use. Essentially, their view is that this would require changes to the current licensing system: environmental impact assessments would still need to be prepared but once these are complete it should be possible to deal with the administrative side more quickly than currently for short term trades where these relate to surface water. It was stressed though that it may take longer for groundwater trades due to the need for borehole tests, etc.
41
6. Conclusions
The work carried out for this study has built upon the findings of the previous study “Characterising Potential Water Abstraction Licence Markets” (RPA, 2011a). It has examined the hypotheses put forward in the previous study as to the factors which may affect the potential for abstractions trading. However, the focus here has been on trading in unused licensed volumes, so only limited conclusions can be drawn with respect to the importance of the different factors on trading overall. This study has identified three different sets of catchments as providing possible opportunities for the active promotion of abstractions trading, based on the factors identified in the previous study and additional data provided by the Environment Agency on actual trades. 25 out of the 53 trades known to have taken place were from catchments falling into these three sets; furthermore, the analysis identified 14 out of the 19 catchments where trading is known to have taken place. In two of the five catchments not identified, this trading may have taken place due to the high % of water bodies at CAMS status red or purple, while in the others trading may have occurred due to the high numbers of agricultural abstractors. In our view, as the focus of this study has been on trading in unused quantities rather than used quantities (alone or plus unused), the analysis conclusions do support the original hypotheses; adoption of different criteria focused more on trading in used quantities would have impacted on the catchments included in the three sets.
More generally, it is important to note that the identification of potential catchments relied on data available from the NALD database on CAMS status and ABSTAT statistics, with these acting as a proxy for demand for abstraction supplies. As a result, some of the factors which are clearly important to the potential for trading could not be identified without further discussions with the EA. For example, interviews with the EA highlighted the significance of systemic problems as a barrier to trading (e.g. the extent to which trading is actively promoted, pace of the trading process, abstractor groups for identifying trading partners, etc.). Thus, although the findings indicate that our original hypotheses as to when trading may be most likely to take place remain valid, the hypotheses should be considered to set out necessary but not sufficient conditions for the creation of active trading markets. From the three sets of catchments identified as providing possible opportunities for trading, a sub-set of 10 was selected for more detailed consideration. Discussions were held with Environment Agency Regional and/or Area staff to collect the additional information needed to clarify the potential for trading and the feasibility and value of greater promotion of it in the selected catchments. From these discussions and a review of other data on the catchments, in particular the number and diversity of licence holders, it would appear that the most promising catchments are ones where there is considered to be an unmet agricultural demand:

42
Broadland Rivers CAMS: there are around 730 licence holders in this
catchment which is dominated by agricultural licence holders by number but PWS by volume of abstractions. Trading already takes place, but the Environment Agency receives queries over trading on an annual basis.
Cam & Ely Ouse CAMS: there are 934 licence holders in this catchment which is also dominated by PWS abstractions but has high numbers of agricultural licence holders and other abstractors who have been active in trading in the past. The CAMS status is at no water available and there is likely to be an unmet demand, particularly for short term trades.
Witham CAMS: there are around 560 licence holders within the catchment with most of these being for spray irrigation (although again PWS dominates by volume). Although there is a farmers‟ group within this catchment this includes only a small number of abstractors. More generally, there is an unmet demand within the catchment and potential for greater trading. However, there appears to be a lack of clarity for abstractors as to what is possible.
Steepings, Great Eau & Long Eau: there are only around 80 licence holders within the catchment. There is some unmet demand within the catchment which farmers are increasingly meeting through the construction of reservoirs or obtaining licences with stringent conditions. In this case, there would appear to be a lack of understanding as to what might be possible but also the lack of an organised water abstractors group.
All four of the above catchments are in the Environment Agency‟s Anglian Region. In all cases, the Anglian Region Area staff would be interested in greater promotion of trading, particularly if this included facilitating the development of farmer water abstractor groups, as they see the lack of these as a barrier to further trading. In two cases, Anglian Region Area staff believed there to be a lack of clarity for abstractors regarding the opportunities and constraints for trading. The Area staff would also be particularly interested in the promotion of temporary or short-term trading (e.g. for a season), which they believe is hindered by the current system, which is too administratively time consuming to enable rapid decisions on abstraction licence trades. It is also of note that these teams are some of the most hard pressed right now in terms of pressure from farmers to allow them to take their full licensed volumes, in many cases for the first time in several years. EA staff would also be interested in increasing the flexibility of the licensing regime that currently applies in the Roding, Beam and Ingrebourne CAMS, although this may require more than promotion of trading. The abstractions licensing system is highly complex due to the atypical nature of the catchment. Essentially, water has only been licensed for winter abstractions and any new licences are currently restricted to very high flow conditions. There may be the potential though to revisit the current licensing regime and to both free-up water and promote trading so as to meet unmet seasonal demands. The EA believes however that this would require further research

43
first to develop a better understanding of the implications of any changes in the system for the environment and the rights of the 90+ existing licence holders. Finally, the Dorset Stour CAMS provides what may best be described as weak opportunities for increased efficiency in water use through trading in part of the catchment. There are over 170 licence holders in the catchment, which is dominated by PWS abstractions when it comes to „consumptive‟ use. There may be a low level of unmet demand, but generally new licences have been available for small quantities of water. In addition, there are not many farmers in the area so the need for temporary trading is limited. However, the staff would be willing to participate in a promotion exercise if this would help free up water being held for its asset value and increase the efficiency of water use.

44
Annexes

45
ANNEX 1 Table A1: Overview of trades
Trade number
Donor CAMS Recipient
CAMS Donor Sector
Recipient Sector
% of full sellers licence
Any clawback
?
1 Thames Corridor MOLE Agriculture Agriculture 45% Yes
2 Wey THAMES CORRIDOR Agriculture Agriculture 52% No
3 Colne COLNE Industry Industry 100% No
4 Test and Itchen Test and Itchen Agriculture Industry 48% No
5 Test and Itchen Test and Itchen Agriculture
Private water
undertaker 9% No
6 Test and Itchen Test and Itchen Agriculture Industry 55% No
7 Warwickshire Avon
Warwickshire Avon Agriculture Agriculture ? No
8 Aire and Calder CAMS ? ? ? ? ?
9 Aire and Calder CAMS
AIRE AND CALDER CAMS Agriculture Agriculture 15% No
10 Witham WITHAM CAMS Agriculture Agriculture 100% No
11
Upper Ouse & Bedfordshire Ouse CAMS
UPPER OUSE & BEDFORD OUSE CAMS Industry
Private water
undertaker 4% Yes
12
Cam & Ely Ouse including South Level CAMS
CAM & ELY OUSE INCLUDING SOUTH LEVEL CAMS Agriculture Agriculture 100% No
13
Cam & Ely Ouse including South Level CAMS
CAM & ELY OUSE INCLUDING SOUTH LEVEL CAMS Agriculture Agriculture 99.8% No
14
Cam & Ely Ouse including South Level CAMS
CAM & ELY OUSE INCLUDING SOUTH LEVEL CAMS Agriculture Agriculture ? No
15
Cam & Ely Ouse including South Level CAMS
CAM & ELY OUSE INCLUDING SOUTH LEVEL CAMS Agriculture Agriculture 28% No
16
Old Bedford including Middle Level CAMS
OLD BEDFORD INCLUDING MIDDLE LEVEL CAMS Agriculture Agriculture 100% No
17
Cam & Ely Ouse including South Level CAMS
CAM & ELY OUSE INCLUDING SOUTH LEVEL CAMS Agriculture Agriculture 67% No

46
Table A1: Overview of trades
Trade number
Donor CAMS Recipient
CAMS Donor Sector
Recipient Sector
% of full sellers licence
Any clawback
?
18 Broadland Rivers CAMS
BROADLAND RIVERS CAMS Agriculture Industry 21% No
19 Broadland Rivers CAMS
BROADLAND RIVERS CAMS Agriculture Agriculture 167% No
20 Broadland Rivers CAMS
BROADLAND RIVERS CAMS Agriculture Agriculture 167% No
21 East Suffolk CAMS
East Suffolk CAMS Agriculture Agriculture
? ?
22 East Suffolk CAMS
East Suffolk CAMS Agriculture Agriculture
? ?
23 East Suffolk CAMS
East Suffolk CAMS
Agriculture Agriculture ? ?
24 East Suffolk CAMS
East Suffolk CAMS
Agriculture Agriculture ? ?
25 Essex CAMS Essex CAMS Agriculture Agriculture
63%
No
26
Dorset Stour CAMS Catchment
Dorset Stour CAMS Catchment Agriculture Agriculture 100% No
27
Hampshire Avon CAMS Catchment
Hampshire Avon CAMS Catchment
Agriculture Agriculture
No
28 Wey WEY Agriculture Agriculture No
29
Old Bedford including Middle Level CAMS
Upper Ouse & Bedfordshire Ouse CAMS Agriculture Agriculture 20% No
30
Cam & Ely Ouse including South Level CAMS
Cam & Ely Ouse including South Level CAMS Agriculture Agriculture 38% No
31
CAM & ELY OUSE INCLUDING SOUTH LEVEL CAMS
CAM & ELY OUSE INCLUDING SOUTH LEVEL CAMS
Water Company Various
No
32
CAM & ELY OUSE INCLUDING SOUTH LEVEL CAMS
CAM & ELY OUSE INCLUDING SOUTH LEVEL CAMS
Agriculture Agriculture 7%
No
33
CAM & ELY OUSE INCLUDING SOUTH LEVEL CAMS
CAM & ELY OUSE INCLUDING SOUTH LEVEL CAMS
Agriculture Agriculture 14%
No
34
OLD BEDFORD INCLUDING MIDDLE LEVEL CAMS
OLD BEDFORD INCLUDING MIDDLE LEVEL CAMS Agriculture Agriculture 18% No
35
Old Bedford including Middle Level
OLD BEDFORD INCLUDING Agriculture Agriculture 100% No

47
Table A1: Overview of trades
Trade number
Donor CAMS Recipient
CAMS Donor Sector
Recipient Sector
% of full sellers licence
Any clawback
?
CAMS MIDDLE LEVEL CAMS
36
Cam & Ely Ouse including South Level CAMS
CAM & ELY OUSE INCLUDING SOUTH LEVEL CAMS Agriculture Agriculture ? No
37 Broadland Rivers CAMS
BROADLAND RIVERS CAMS Agriculture Agriculture 93% No
38 Broadland Rivers CAMS
BROADLAND RIVERS CAMS Agriculture Agriculture 13% No
39
Old Bedford including Middle Level CAMS
OLD BEDFORD INCLUDING MIDDLE LEVEL CAMS Agriculture Agriculture 100% No
40 Shropshire Middle Severn
Shropshire Middle Severn Industry Agriculture 3% No
41
Upper Ouse & Bedfordshire Ouse CAMS
Upper Ouse & Bedfordshire Ouse CAMS Agriculture Agriculture 60% ?
42
Cam & Ely Ouse including South Level CAMS
Cam & Ely Ouse including South Level CAMS Agriculture Agriculture 100% No
43
Cam & Ely Ouse including South Level CAMS
Cam & Ely Ouse including South Level CAMS Agriculture Agriculture 100% No
44 ? Colne
Public water
Supply ? n/a ?
45 Dee Dee Agriculture Agriculture 19% ?
46 BROADLAND RIVERS CAMS
BROADLAND RIVERS CAMS Industry Agriculture 100% No
47 Lower Trent and Erewash
Lower Trent and Erewash Agriculture Agriculture 37% ?
48 Test and Itchen Test and Itchen Agriculture Agriculture 60% ?
49
CAM & ELY OUSE INCLUDING SOUTH LEVEL CAMS
CAM & ELY OUSE INCLUDING SOUTH LEVEL CAMS Agriculture Agriculture 50% ?
50 BROADLAND RIVERS CAMS
BROADLAND RIVERS CAMS Agriculture Industry 27% ?
51 Warwickshire Avon
Warwickshire Avon Agriculture ? 39% ?

48
Annex 2 Table A2: CAMS Status data for catchments where trading has taken place
Catchment % Licences (excluding tidal) at CAMS status
Number of Trades
0 1 2 3 4 5 6 ? % yellow
and above % red and
purple Donor Recipient
AIRE AND CALDER CAMS
0.00 41.10 14.58 2.46 4.36 9.85 9.66 17.99 26.33 19.51 2 1
BROADLAND RIVERS CAMS
0.00 3.60 19.64 3.90 28.04 12.44 13.34 19.04 57.72 25.79 7 7
CAM & ELY OUSE INCLUDING SOUTH LEVEL CAMS
0.00 3.15 2.10 3.62 22.99 16.10 13.42 38.62 56.13 29.52 13 13
COLNE 0.00 0.00 4.73 8.11 8.11 14.19 54.73 10.14 85.14 68.92 1 2
DEE 0.00 10.60 35.76 5.96 9.27 4.64 13.25 20.53 33.11 17.88 1 1
DORSET STOUR CAMS CATCHMENT
0.00 6.90 37.24 19.31 10.34 4.14 11.03 11.03 44.83 15.17 1 1
EAST SUFFOLK CAMS
0.00 2.44 15.99 4.34 9.21 30.35 30.08 7.59 73.98 60.43 4 4
ESSEX CAMS 0.00 17.24 20.15 3.30 16.48 18.76 14.70 9.38 53.23 33.46 1 1
HAMPSHIRE AVON CAMS CATCHMENT
0.00 2.88 42.39 25.51 2.06 19.34 2.88 4.94 49.79 22.22 1 1
LOWER TRENT AND EREWASH
0.00 14.88 34.50 3.93 0.00 10.33 18.39 17.98 32.64 28.72 1 0
MOLE 0.00 12.90 12.90 0.00 35.48 16.13 12.90 9.68 64.52 29.03 0 1
OLD BEDFORD INCLUDING MIDDLE LEVEL
0.00 3.66 13.24 9.01 10.70 7.61 2.82 52.96 30.14 10.42 5 4

49
Table A2: CAMS Status data for catchments where trading has taken place
Catchment % Licences (excluding tidal) at CAMS status
Number of Trades
0 1 2 3 4 5 6 ? % yellow
and above % red and
purple Donor Recipient
CAMS
SHROPSHIRE MIDDLE SEVERN
0.00 13.44 23.77 0.26 3.36 30.75 17.57 10.85 51.94 48.32 1 1
TEST AND ITCHEN
0.00 2.17 60.68 7.12 0.62 21.98 1.55 5.88 31.27 23.53 4 4
THAMES CORRIDOR
0.00 12.33 26.33 15.33 11.00 4.33 14.67 16.00 45.33 19.00 1 1
UPPER OUSE & BEDFORD OUSE CAMS
0.00 50.15 10.75 2.99 5.97 1.49 11.34 17.31 21.79 12.84 2 3
WARWICKSHIRE AVON
0.00 57.16 15.56 3.54 8.78 2.77 4.78 7.40 19.88 7.55 2 1
WEY 0.00 20.00 10.30 15.15 10.91 14.55 12.73 16.36 53.33 27.27 2 1
WITHAM CAMS 0.00 23.20 16.19 3.06 35.25 2.34 12.77 7.19 53.42 15.11 1 1

50
Annex 3 Table A3: Downstream CAMS Status
Catchment
% Licences (excluding tidal) at Downstream CAMS status
Number of Trades
0 1 2 3 4 5 6 ? % orange and above
% red and purple
Donor Recipient
AIRE AND CALDER CAMS
0.00 0.00 50.19 2.08 3.22 15.72 10.80 17.99 29.73 26.52 2 1
BROADLAND RIVERS CAMS
0.00 0.00 0.75 4.95 24.89 36.13 14.24 19.04 75.26 50.37 7 7
CAM & ELY OUSE INCLUDING SOUTH LEVEL CAMS
0.00 0.00 0.47 0.12 16.45 27.65 16.69 38.62 60.79 44.34 13 13
COLNE 0.00 0.00 0.00 0.00 0.00 0.00 89.86 10.14 89.86 89.86 1 2
DEE 0.00 0.00 4.64 0.00 1.32 0.00 73.51 20.53 74.83 73.51 1 1
DORSET STOUR CAMS CATCHMENT
0.00 0.00 8.97 13.10 42.07 8.28 16.55 11.03 66.90 24.83 1 1
EAST SUFFOLK CAMS
0.00 1.36 8.40 0.27 6.50 37.67 38.21 7.59 82.38 75.88 4 4
ESSEX CAMS 0.00 3.80 2.79 1.52 33.21 34.09 15.21 9.38 82.51 49.30 1 1
HAMPSHIRE AVON CAMS CATCHMENT
0.00 0.00 1.65 0.00 1.23 89.30 2.88 4.94 93.42 92.18 1 1
LOWER TRENT AND EREWASH
0.00 0.21 1.24 0.00 50.62 8.88 21.07 17.98 80.58 29.96 1 0
MOLE 0.00 0.00 0.00 0.00 0.00 0.00 90.32 9.68 90.32 90.32 0 1
OLD BEDFORD INCLUDING MIDDLE LEVEL
0.00 0.00 12.39 11.55 10.70 9.58 2.82 52.96 23.10 12.39 5 4

51
Table A3: Downstream CAMS Status
Catchment
% Licences (excluding tidal) at Downstream CAMS status
Number of Trades
0 1 2 3 4 5 6 ? % orange and above
% red and purple
Donor Recipient
CAMS
SHROPSHIRE MIDDLE SEVERN
0.00 0.00 0.00 0.00 0.00 63.82 25.32 10.85 89.15 89.15 1 1
TEST AND ITCHEN
0.00 0.00 0.62 6.19 0.62 26.93 59.75 5.88 87.31 86.69 4 4
THAMES CORRIDOR
0.00 0.33 0.33 0.00 1.67 0.00 81.67 16.00 83.33 81.67 1 1
UPPER OUSE & BEDFORD OUSE CAMS
0.00 0.00 59.40 4.18 6.27 1.49 11.34 17.31 19.10 12.84 2 3
WARWICKSHIRE AVON
0.00 0.00 0.00 75.19 8.78 3.85 4.78 7.40 17.41 8.63 2 1
WEY 0.00 0.00 0.00 0.00 0.00 0.00 83.64 16.36 83.64 83.64 2 1
WITHAM CAMS 0.00 17.81 11.51 6.47 41.01 2.88 13.13 7.19 57.01 16.01 1 1

52
Annex 4
Table A4-1: Composition of abstractors in selected case study catchments by % licences
% of licences (excluding tidal)
Agriculture/ aquaculture Amenity
Environ-mental
Ind, Comm & Public services
Production of energy
Water supply
Broadland Rivers CAMS
80.06 0.75 0.60 10.64 0.30 7.65
Cam & Ely Ouse (including South Levels) CAMS
79.93 0.35 1.98 7.70 0.23 9.80
Dorset Stour CAMS Catchment
64.83 6.21 0.69 13.10 4.14 11.03
Ebbw and Lwyd 0.00 12.90 3.23 38.71 6.45 38.71
River Tyne CAMS 15.87 0.00 6.35 23.81 6.35 47.62
Roding, Beam & Ingrebourne
66.32 1.05 2.11 22.11 0.00 8.42
Taff & Ely 12.96 0.00 1.85 50.00 3.70 31.48
Thaw & Cadoxton 52.94 0.00 0.00 29.41 0.00 17.65
Steepings, Great Eau & Long Eau CAMS
64.63 6.10 0.00 9.76 0.00 19.51
Witham CAMS 87.77 1.44 0.72 6.29 0.00 3.78
Table A4-2: Composition of abstractors in selected case study catchments by % volume
% of volume (excluding tidal)
Agriculture/ aquaculture Amenity
Environ-mental
Ind., Comm & Public services
Production of energy
Water supply
Broadland Rivers CAMS
10.48 0.14 3.18 6.84 23.26 56.10
Cam & Ely Ouse (including South Levels) CAMS
9.03 0.04 59.07 2.86 6.89 22.12
Dorset Stour CAMS Catchment
27.18 1.21 0.35 1.04 29.69 40.53
Ebbw and Lwyd 0.00 3.83 9.21 4.04 11.73 71.19
River Tyne CAMS 2.06 0.00 0.00 0.99 1.82 95.13
Roding, Beam & Ingrebourne
11.40 0.04 1.13 18.84 0.00 68.59
Taff & Ely 9.99 0.00 0.00 4.23 2.61 83.17
Thaw & Cadoxton 1.80 0.00 0.00 47.40 0.00 50.80
Steepings, Great Eau & Long Eau CAMS
54.38 0.16 0.00 6.42 0.00 39.05
Witham CAMS 15.19 0.54 41.84 6.57 0.00 35.86

53
Annex 5
Questions to EA in case study catchments
1. Do you think there is currently an appetite for trading in the CAMS?
2. Have any formal water rights trades taken place in the catchment that you know of? If formal water rights trading has taken place, what was the main incentive for the parties to trade (e.g. was an unused volume traded due to fear of volume being revoked without compensation)? Or, was trading considered to be an easier route to gaining a licensed volume than making a new application?
3. What do you view as the most significant barriers to water rights
trading in the catchment? Conversely, are there any characteristics of the catchment that might help to facilitate trading (e.g. farming co-operatives, recent investment in winter storage reservoirs, new development of water requiring facilities, closure of water using factories, etc.)
4. Is there unmet demand for water in the catchment? Have any recent
applications been refused? If so, are there data on the volume of water requested? Is there any information on the types of abstractors who have the greatest unmet demand within the catchment?
5. Are there any significant sleeper licences which are known to the
Environment Agency? Are there any partially used licences? Have any of these licences been revoked? Or are the opportunities to do so still being explored? What volumes have been/could be recovered by revoking these licences? Would the volumes be sufficient to affect the status and/or meet the CAMS status?
6. Have licence holders with permissions in excess of their calculated
actual water need been contacted? What action has been taken, or is proposed to be taken? What volumes would/could this release back into the environment? Would these volumes be sufficient to affect CAMS status?
7. To what extent is there an interdependency between surface and
groundwater sources within the catchment? Does surface flow largely depend on baseflow from groundwater source? (This will indicate whether trades can occur between surface water and groundwater.)
8. Are we correct in assuming that the catchment is at a CAMS status of
no water available or of being over licensed/over abstracted? Are licences at a CAMS status of orange/red/purple concentrated in a small number of locations (e.g. a particular GW body, or stretch of river), or is the problem more general?

54
Annex 6
A6.1: CAMS name and corresponding number
1 Adur and Ouse 49 New Forest 2 Aire and Calder 50 Teifi and North Ceredigion 3 Arun and Western Streams 51 North Cornwall
4 Bristol Avon, Axe and North Somerset Streams 52 Combined Essex
5 Broadland Rivers 53 North Kent 6 Cam and Ely Ouse (including South Level) 54 North Norfolk 7 Carmarthen Bay Rivers 55 North West Norfolk 8 Cherwell, Thame and Wye 56 Northern Manchester 9 Cleddau and Pembrokeshire Coastal Rivers 57 Northumberland Rivers
10 Clwyd 58 Old Bedford including the Middle Level
11 Colne 59 Otter, Sid, Axe and Lim 12 Conwy 60 Ribble, Douglas and Crossens 13 Cuckmere and Pevensey Levels 61 Roding, Beam and Ingrebourne 14 Darent 62 Rother 15 Dee 63 Seaton, Looe and Fowey 16 Derbyshire Derwent 64 Severn Corridor 17 Derwent 65 Severn Vale 18 Derwent and West Cumbria 66 Shropshire Middle Severn 19 Don and Rother 67 Soar 20 Dorset Stour 68 Staffordshire Trent Valley
21 Dove 69 Witham, Steeping Great Eau and Long Eau
22 East Hampshire 70 Stour 23 East Suffolk 71 Swale, Ure, Nidd and Upper Ouse 24 South East Valleys 72 Swansea Bay Rivers 25 Eden and Esk 73 Tamar 26 Esk 74 Tame Anker and Mease 27 Exe 75 Taw and North Devon Streams 28 Fal and St. Austell Streams 76 Tees 29 Frome, Piddle and West Dorset 77 Teign Torbay and South Hams 30 Hampshire Avon 78 Teme 31 Hull and East Riding 79 Test and Itchen 32 Idle and Torne 80 Thames Corridor 33 Isle of Wight 81 Thaw and Cadoxton 34 Kennet and Vale of White Horse 82 Till 35 South Cumbria 83 Torridge and Hartland Streams 36 Upper Lee 84 Tyne 37 Llyn and Eryri 85 Upper and Bedford Ouse 38 Loddon 86 Usk 39 London 87 Warwickshire Avon 40 Louth Grimsby and Ancholme 88 Wear 41 Lower Mersey 89 Weaver and Dane 42 Lower Trent and Erewash 90 Welland and Nene 43 Wye 91 West Cornwall
44 Lune and Wyre 92 Parrett, Brue and West Somerset Streams
45 Medway 93 Wey 46 Meirionydd 94 Wharfe and Lower Ouse 47 Upper Mersey 95 Worcestershire Middle Severn 48 Mole 96 Ynys Mon (Anglesey)
97 Cotswolds


Ergon HouseHorseferry RoadLondon SW1P 2AL
www.defra.gov.uk
PB11207-CVR.qxd 1/9/05 11:42 AM Page 2