characterising the quality journey of total quality
TRANSCRIPT
March 2018
Characterising the Quality Journey of Total Quality Management in Relation to the Financial Performance of SMEs under crisis conditions: the case for Greece. Submitted to the University of Hertfordshire in
partial fulfilment of the requirements of the
degree of Ph.D.
Georgios SAINIS (B.Sc., M.A)

Georgios Sainis Ph.D. Thesis
i
Table of Contents
Table of Contents i
Relevant Publications v
Abstract vi
Acknowledgements vii
Abbreviations viii
List of Tables ix
List of Figures x
Chapter 1. Introduction 1
1.1. Introduction to the thesis 1
1.2. Scope of the thesis 2
1.3. The thesis Aims, Objectives and its Research Questions 4
1.3.1. Aims: 4
1.3.2. Objectives: 4
1.3.3. The research questions and sub-questions: 6
1.4. The SME and the Quality Level. 6
1.5. The Role of Quality in an SME’s Financial Performance 10
1.6. The Scope and Methodology of the thesis. 13
1.7. Thesis Structure 16
Chapter 2. Quality and TQM 20
2.1. Introduction to Chapter 2 20
2.2. Quality and TQM 21
2.3. The Value of TQM 29
2.4. Quality and TQM in different economic sectors 31
2.5. Cost of Quality 35
2.6. Concluding Remarks 37

Georgios Sainis Ph.D. Thesis
ii
Chapter 3. From ISO to TQM –The Transition Process 38
3.1. Introduction to Chapter 3 38
3.2. The Transition from ISO to TQM: 38
3.3. The TQM Philosophy and the TQM Implementation Models 47
3.3.1. The characteristics of the S-P Model 58
3.3.2. The implementation of the S-P model in SME. 61
3.4. The TQM implementation in SME 63
3.5. Critical success factors for TQM implementation in SME 74
3.6 Concluding Remarks 82
Chapter 4. SME & Financial Performance – The Greek Crisis 83
4.1. Introduction to Chapter 4 83
4.2. The SME in the European and Greek Economy 84
4.3. Crisis Conditions for SME. 94
4.4. TQM implementation level and financial performance 98
4.5. Measuring Financial Performance with Ratio Analysis 107
4.6. Concluding Remarks 113
Chapter 5. Research Methodology 115
5.1. Introduction to Chapter 5 115
5.2. Research approaches 117
5.3. The Quality variables 126
5.4. Phase One: The Qualitative Data Analysis: Methodology 127
5.5. Phase Two: The Quantitative Data Analysis: Methodology 136
5.5.1. Sample size selection and use in the survey 137
5.5.2. The statistical analysis adopted 139
5.5.3. The questionnaire design and the Pilot Study 140
5.6 Phase Three - Financial Data Analysis: Methodology 150
5.7 Concluding Remarks 154

Georgios Sainis Ph.D. Thesis
iii
Chapter- 6 Data Analysis and Results 156
6.1 Introduction to Chapter 6 156
6.2 Qualitative Survey Analysis –Results 157
6.2.1. Interview Analysis and Results 158
6.2.2. Qualitative surveys Coding and Results (All) 168
6.3 Quantitative Survey Analysis – Results 170
6.4 SME - Group Analysis & Results 174
6.5 SME – The Financial Ratio Analysis 176
6.5.1. Financial Ratio Analysis – Descriptive Statistics 177
6.5.2. Ratio Analysis (Trend analysis- Sample’s population SME) 181
6.5.3. Ratio Analysis (Trend analysis- Sample SME) 188
6.6 TQM and Financial Performance 194
6.6.1. TQM SME Results 195
6.6.2. ISO+ SME Results 201
6.6.3. ISO SME - Results 209
6.7 MANOVA: Differences in Financial ratios between years 218
6.7.1. Variance Analysis – Population Sample of SME 219
6.7.2. Variance Analysis –Survey’s sample of SME 222
6.8 TQM and Financial Performance-Comparative Results 225
6.9 SME Quality Group Transfers 229
6.10 Concluding Remarks 231
Chapter 7: Discussion, Conclusions, Recommendations. 233
7.1 Introduction to Chapter 7 233
7.2 Discussion 234
7.2.1. The qualitative Survey 236
7.2.2. The Quantitative Survey 237
7.2.3. The Greek SME and their Financial Performance 240
7.2.4. The Greek SME-Financial Performance & TQM implementation (Trend Analysis) 248

Georgios Sainis Ph.D. Thesis
iv
7.3 Conclusions 254
7.3.1 Findings 254
7.3.2 Quality elements applied to SME 256
7.3.3 Quality elements applied to different in size SME 257
7.3.4 The financial performance of SME (trend analysis) under crisis conditions 259
7.3.5 The financial performance of SME (MANOVA) under crisis conditions 262
7.3.6 The effect of quality elements on SME financial performance 263
7.4 Recommendations 266
7.5. Implications 267
7.6. Limitations 268
7.7 Thesis Concluding Remarks 270
References: 273
Appendices 292
Appendix A Quantitative Survey - Questionnaire A1-A19
Appendix B Qualitative Survey -Questionnaire B1
Appendix C Qualitative Survey - Results C1-C9
Appendix D Quantitative survey-DATA D1-D77
Appendix E Quantitative Survey - Descriptive statistics - Scoring Results E1-E11
Appendix F Ratio Analysis - Descriptive & Equality F1-F11
Appendix Ga Ratio Analysis per size Group - Trend Analysis Ga1-Ga4
Appendix Gb Ratio Analysis per Quality Group - Trend Analysis Gb1-Gb5
Appendix H Financial Ratios / Post-Hoc Tables H1-H22
Appendix I Financial Ratios - MANOVA statistics I1-I6
Appendix J Comparative Analysis - SME Transitions J0-J6
Appendix K Timetable of Financial and Political Events K1

Georgios Sainis Ph.D. Thesis
v
Relevant Publications
Sainis, G., Haritos, G., Kriemadis, A., Papasolomou, I., (2018). TQM for Greek SME. An
alternative in facing crisis conditions. (In the peer review process)
Sainis, G., Haritos, G., Kriemadis, A., & Fowler, M. (2017). The Quality Journey for Greek
SME and their Financial Performance. Production and Manufacturing Research, Vol.5(I.1),
pp.306–327. http://doi.org/10.1080/21693277.2017.1374891
Sainis, G., Haritos, G., Kriemadis, T., & Fowler, M. (2016). The quality journey of Greek
SME. In Y. M. Goh & K. Case (Eds.), International Conference on Manufacturing
Research: Advances in Transdisciplinary Engineering (Vol. 3, pp. 508–513).
Loughborough: IOS Press. http://doi.org/10.3233/978-1-61499-668-2-508
Sainis, G., Haritos, G., Kriemadis, A., & Fowler, M. (2016). TQM practices adopted from
Greek SME under an economic crisis environment. In EMCSR 2016 (pp. 122–122).
http://doi.org/ISSN: 2227-7803
Sainis, G., Haritos, G., Kriemadis, A., & Fowler, M. (2016). The willingness of ISO certified
Greek SME to continue their quality journey to TQM under crisis conditions : a systemic
approach. Int. J. Applied Systemic Studies, Vol.6(I.4), pp.327–348.

Georgios Sainis Ph.D. Thesis
vi
Abstract
During the last few years Greece is coping with severe economic and financial crisis
conditions. Since the Greek SME are the largest productive and economic sector in
the Greek economy, they bear the brunt of consequences for these adverse conditions.
This thesis investigates the role of the total quality elements in improving or otherwise
the financial performance of those SME.
Ratio analysis is used as a mean of measuring the SME financial performance and
specifically the level of their liquidity, profitability, efficiency and solvency.
Furthermore the thesis tries to identify the role that each quality element and quality
as a whole, have on different size SME and their financial performance.
A data-triangulation methodology was developed to examine the influence of the
above factors (use of a questionnaire and a set of semi-structured interviews) and the
results and the conclusions derived have shown that:-
All the Greek SME have the intention to continue their quality journey to TQM.
Small SME give more emphasis in implementing the TQM elements, followed by
the micro and the medium size SME respectively. However each group of SME
prioritises differently the various quality elements.
The ratio analysis revealed that the group with the mostly improved financial
performance was the micro SME followed by the small and the medium SME.
The worst financial performance of all the SME occurred between 2008 and 2010.
Amongst the SME that have managed to continue to operate, the ones
characterised as TQM SME have shown an improved financial performance.
Measuring the SME financial performance, efficiency and solvency were revealed
as the most significant variables. The smaller in size the SME were, they pay a
greater attention to efficiency while the larger SME pay more attention to solvency.
Utilising the Z-score rate as a criterion, the largest number of transitions among
different levels of financial sustainability was revealed from the micro SME. Lower
variability was identified from the TQM SME group in comparison with the other
two groups of SME (ISO+ and ISO) that have also shown a very similar behaviour.
In conclusion SME’s that have followed the ISO to TQM journey during the harsh
financial conditions they were facing, they have managed to harbour themselves better
in conditions of financial crisis.

Georgios Sainis Ph.D. Thesis
vii
Acknowledgements
It is my privilege to acknowledge the contribution of all the people who supported me
in the completion of this thesis. Firstly my principal supervisor Dr George Haritos who
was the one to whom I owe the belief that this research project will come to a
successful fruition. His knowledge and experience were the most valuable companions
in all the difficulties I faced in this journey.
I would also like to acknowledge the contribution of my second supervisor, Ms. Moyra
Fowler, whose knowledge and expertise in the field added value to my thesis.
Special thanks are given to Dr Kriemadis Thanos (my overseas based supervisor), to
my brother Thanos and to Veronica Andrianatou for their devoted support and their
interest and attention they have shown throughout my work.
I am also grateful to my wife, Fotini for being there for me, during the low and high
times in all the stages of this journey.
I would also like to acknowledge the contribution of Michalis Karatzas of Bureau Veritas
who inspired me to work on this subject and helped me during this study.
I also express my appreciation and gratitude to the American College of Greece (Deree
College) and to the Business School in particular for, among others, it financially
supported me.
Finally I want to give special thanks to my two sons, Vasilis and Tasos for their
encouragement and for their confidence that their father could accomplish this goal.

Georgios Sainis Ph.D. Thesis
viii
Abbreviations
A/R Accounts Receivable
AQA Australian Quality Award
ASE Athens Stock Exchange
BEP Basic earnings power
CN Understanding of customer needs.
CSFs Critical Success Factors
EADP European Association of Database & Directories Publishers
EDCC Economic design control chart
EFQM European Foundation for Quality Management
ELOT Greek Organization for Standardization
EQA European Quality Award
ESOMAR World Association of Opinion & Marketing Research Professionals
EU European Union
FI Focus on internal customers
FP Financial Performance
GESEVE Hellenic Confederation of Professionals, Craftsmen & Merchants
HA Housing Authority
IP Interview Participant
ISO International Organization for Standardization
LSD Least significance difference
MBNQA Malcolm Baldrige National Quality Award
O Organization and its systems
OAEE Social Insurance Organisation of Freelance Professionals
OC Organizational Culture
OLC Organizational Learning Capabilities
OME Owner-Manager entrepreneur
OP Understanding of the organizational process.
P People
PA Performance Appraisal
PAF Prevention-Appraisal-Failure
PDCA Plan-Do-Check-Act
PMM Project Management Model
QC Quality Culture
QP Quality Processes
QTT Quality Tools and Techniques
ROA Return on Assets
ROE Return on Equity
SBA Small Business Administration
SEV Federation of Greek Industries
SME Small Medium Enterprise
SP Supplier partnership.
T Technologies and tools
TEAIEK Ancillary Insurance Fund for Retail Store Employees
TI Understanding of the techniques of improvements
TP Use of team process
TQM Total Quality Management
TSAY Medical Profession Pension and Insurance Fund
TSMEDE Engineers' and Public Contractors' Pension Fund
UD Emphasis on the use of data.
UQ Common understanding of quality.
VAT Value Added Tax

Georgios Sainis Ph.D. Thesis
ix
List of Tables
Table 1: Classification of Businesses by number of Employees, Turnover & Total Assets 6
Table 2: Total Quality Management (TQM) Matrix (De Knop et al., 2004) 34
Table 3: Deming’s 14 Points (Gitlow.et al., 1989) 39
Table 4:ISO standards vs TQM elements (Biazzo, 2005) 41
Table 5: Measures for assessing TQM components used by the S-P Model 62
Table 6: TQM concepts for SME 68
Table 7: The ten Salient Steps for TQM implementation 69
Table 8: Studies used to identify the maturity level of a company. 76
Table 9: Critical Success Factors for TQM implementation 77
Table 10: TQM Variables (Hunt, 1993). 79
Table 11: Critical Factors and Sub factors 81
Table 12: Greek VS European SME 84
Table 13: SME in Greece - Basic figures (2014) 84
Table 14: SME in Greece – Basic figures (2015) 84
Table 15: The Greek SME Sector (% changes) 85
Table 16: Thematic Axis and Areas. (Hellenic Chamber of Commerce, 2014) 90
Table 17: Empirical Studies on TQM and Financial Performance 102
Table 18: Financial Ratios (Delen et al., 2013) 110
Table 19: Methodological Approaches 118
Table 20: Contrasting assumptions of positivist and Phenomenological paradigm 120
Table 21: Research Strategy selection variables 123
Table 22: Survey Approaches (Philips and Pugh, 2000) 124
Table 23: Our 5-linkert Scale 145
Table 24: Cumulative Interview Results (All Data) 169
Table 25: Cumulative TQM Results Per Group 169
Table 26: Frequency Results 170
Table 27: Quality Elements - Correlations 173
Table 28: TQM Scoring per Group 174
Table 29: Extra Variable - Results (Population) 222
Table 30: Extra Variable - Results (Survey’s Sample) 224
Table 31: SME Quality Groups and their Financial Performance (Ranking A) 226
Table 32: SME Quality Groups and their Financial Performance (Ranking B) 227
Table 33: Financial Performance Scoring 228
Table 34: Ratio contribution to the Financial Performance (FP) determination-Whole Population 244
Table 35: Ratio contribution to the Financial Performance (FP) determination-Survey's sample 245

Georgios Sainis Ph.D. Thesis
x
List of Figures
Figure 1: The Structure of the Thesis 19
Figure 2: The soft and hard elements of TQM -The TQM plan (Price & Chen, 1993) 23
Figure 3: The Quality Elements supporting the TQM Implementation (Hafeez et al., 2006). 27
Figure 4:Pyramid of organizational development (Meegan, 1997). 43
Figure 5: Model of Quality Transition. (Meegan, 1997). 44
Figure 6: Meegan’s Four stage Model 45
Figure 7: TQM implementation steps (cited by Kufidu & Vouzas 1998). 47
Figure 8: TQM Implementation (Huarng & Chen, 2002). 48
Figure 9: Quality attributes & Principles (Lewis et al., 2006). 50
Figure 10: The Deming Chain Reaction 54
Figure 11: The AQA criteria 54
Figure 12: The Pincer model 55
Figure 13: S-P MODEL (Saunders & Preston, 2006). 58
Figure 14: The S-P model and its environment 60
Figure 15: SBA - Performance of Greece (Period: 2008-2015). 86
Figure 16: EU (27). Average and respective data of Greece concerning the SME 2010-2013 88
Figure 17: Data Analysis Methods & Techniques 116
Figure 18: The Flow of Interviews 132
Figure 19: Ratios for Measuring Financial Performance 151
Figure 20: Ratios for measuring an SME’s Financial Performance 152
Figure 21: Quality elements -Frequencies 172
Figure 22: Acid Test Ratio Mean & St. Deviation 178
Figure 23: Asset Turnover-Mean & St. Deviation 178
Figure 24: Inventory Turnover-Mean & St. Deviation 179
Figure 25: Receivable Turnover-Mean & St. Deviation 179
Figure 26: Return on Assets (ROA)-Mean & St. Deviation 180
Figure 27: Return on Equity (ROE)-Mean & St. Deviation 180
Figure 28: Debt to Equity-Mean & St. Deviation 181
Figure 29: Altman's Z' Score-Mean & St. Deviation 181
Figure 30: Acid Test Ratio-All SME Trend 182
Figure 31: Asset Turnover-All SME trend 183
Figure 32: Inventory Turnover-All SME Trend 183
Figure 33: Receivable Turnover-All SME Trend 184
Figure 34: Return on Equity-All SME Trend 185
Figure 35: Return on Assets-All SME Trend 186
Figure 36: Debt to Equity-All SME Trend 187
Figure 37: Z-Score-All SME Trend 188
Figure 38: Acid Test Ratio-SME Sample Trend 189
Georgios Sainis Ph.D. Thesis
xi
Figure 39: Asset Turnover-SME Sample Trend 189
Figure 40: Inventory Turnover-SME Sample Trend 190
Figure 41: Receivable Turnover-SME Sample Trend 191
Figure 42: Return on Equity (ROE)-SME Sample Trend 191
Figure 43: Return on Assets (ROA)-SME Sample Trend 192
Figure 44: Debt to Equity-SME Sample Trend 193
Figure 45: Altman's Z-Score-SME Sample Trend 193
Figure 46: SME Categorization (Size & Quality Level) 194
Figure 47: TQM SME - Acid Test Ratio 195
Figure 48: TQM SME - Debt to Equity 196
Figure 49: TQM SME-Altman's Z-Score 197
Figure 50: TQM SME-Asset Turnover 198
Figure 51: TQM SME - Inventory Turnover 199
Figure 52: TQM SME - Receivable Turnover 200
Figure 53: TQM SME - ROA & ROE 201
Figure 54: ISO+ SME - Acid Test 202
Figure 55: ISO+ SME - Debt to Equity 203
Figure 56: ISO+ SME - Altman's Z-Score 204
Figure 57: ISO+ SME – Asset Turnover 205
Figure 58: ISO+ SME - Inventory Turnover 206
Figure 59: ISO+ SME - Acc. Receivable Turnover 207
Figure 60: ISO+ SME - ROA & ROE 209
Figure 61: ISO SME - Acid Test 210
Figure 62: ISO SME - Debt to Equity & Altman's Z-Score 212
Figure 63: ISO SME - Asset Turnover 213
Figure 64: ISO SME - Inventory Turnover 214
Figure 65: ISO SME - Acc. Receivable Turnover 215
Figure 66: ISO SME - ROA & ROE 217
Figure 67: Financial Performance (FP)-Statistical significance 222
Figure 68: Financial Performance (FP) - Results (SME Sample) 225
Figure 69: Comparative Rates based on Size level 228
Figure 70: SME Transitions per Size 230
Figure 71: SME Transitions per Quality Leveli 231
Figure 72: Discussion of the Results Derived 234
Figure 73: Indicative Political & Financial Events (2009-2015) 235
Figure 74: SME Financial Behaviour over the examined period (2008-2014) 263

Chapter 1: Introduction
Page 1 of 292
Georgios Sainis Ph.D. Thesis
Chapter 1. Introduction
1.1. Introduction to the thesis
SME in Greece represent approximately 99.9% of the Greek economy in market share
(SBA, 2014b). Due to the current economic crisis conditions for the last eight years
Greek SME have suffered and have reduced in their numbers. They have also
experienced a decline their value. The austerity measures imposed by the Greek
Government and by Troika (European Central Bank, International Monetary Fund,
European Council) together with the weakening of the Banking sector (liquidity
shortage), made the Greek SME even more vulnerable and uncertain of their future
(Hellenic Chamber of Commerce, 2014).
The level of implementation of quality in different type and company sizes, varies a lot.
This observation is particularly true for all SME irrespective of whether they implement
a quality procedure or not. However the decision to implement or not to implement
quality has financial consequences for SME (Almansour, 2012)
SME face many difficulties when attempting to implement quality
procedures/elements. This is due to their limited resources which are mostly related to
their size, the type, nature and number of personnel in their HR departments, their
funding needs, their know-how and expertise. These limitations could cause an
increase in their operational costs and hence reduce their value (Desai, 2008).
People, continuous improvement, processes and customers are the main elements/
factors used in order to establish a Total quality Management (TQM) system and a
quality environment (Price and Chen, 1993a). These elements should be supported
from top management with an unswerving commitment to the quality standards
procedures. These include methods used for measuring quality performance, process
management improvements, product design based on quality standards, training and
empowerment of personnel for the achievement of the quality goals (Kumar et al.,,
2008). The supplier’s quality management control procedures also play an important
role in achieving quality goals (Sinha, et al., 2016) . Those are the elements that would
eventually lead the company to achieve its quality goals, and customers’ satisfaction
and involvement in the purchase process. They would contribute and support the
successful implementation of TQM in an SME (Motwani, 2001).
It is argued that the utilization of people involved in quality, the technological
innovations being developed and appropriate structure of organization and
management of a company’s operating systems would contribute to the successful
implementation of a TQM system (Hafeez et al., 2006). Top management, employees
and suppliers support are the means, and the vehicles, through which the quality tools
Chapter 1: Introduction
Page 2 of 292
Georgios Sainis Ph.D. Thesis
and techniques would lead an SME to the successful implementation of TQM
(Fotopoulos and Psomas, 2009; Moccia, 2016).
When compared to their European counterparts, Greek SME are specialized in goods
rather than services (with the exemption of education). The Greek SME mostly focus
on high technology manufacturing products and education.
Since 2000 the European commission has supported the development and expansion
of SME through the “Lisbon” strategy, the “Europe 2000” strategy and the SBA (Small
Business Act) policy (Hellenic Chamber of Commerce, 2014). Those strategies and
policies were designed so that the Greek SME developed the capabilities to survive
under the economic crisis conditions they were facing.
Literature review, revealed the gap in knowing the elements of quality and their role in
financially sustaining the SME that are experiencing economic, as well as social and
cultural crisis conditions (Bourletidis and Triantafyllopoulos, 2014; Commission, 2013).
This was also revealed from a number of key members’ surveys representing quality
auditing firms in Greece, like Bureau Veritas Hellas and TUV Hellas, who openly
accepted and supported the aims of this survey, when the researchers disclosed their
research intentions.
1.2. Scope of the thesis
This thesis investigates the role that quality plays in improving an SME’s financial
performance. It further investigates how a more comprehensive TQM implementation
contributes to their financial sustainability and survival given in different crisis
conditions.
The scope of this thesis, it to identify the quality elements that have enabled Greek
ISO Certified SME, the SME that have awarded a quality certificate i.e. ISO-9000,
ISO-33000 or ISO-14000, to attain financial sustainability in an unstable economic
environment, and at which level these same quality elements have been implemented
to contribute to this effect. As SME is considered the enterprise that its full time labour
force is between 1 and 250 employees.
A proven financial correlation between quality elements and performance, will improve
the Greek SME entrepreneurs’ perception regarding quality and TQM implementation
overall; and more specifically would enhance their perception of quality and TQM
implementation as a means of coping more effectively with the financial crisis
conditions they experience.
It is vital for a country like Greece, where the majority of the active entrepreneurships
are SME, to identify the contribution of quality as a means of dealing with the financial,

Chapter 1: Introduction
Page 3 of 292
Georgios Sainis Ph.D. Thesis
social and cultural difficulties, they have been facing, since 2008 and are still
combating today.
The thesis examines the degree of confidence Greek SME have, regarding the
contribution of quality in their overall value. This is understood by investigating the
extent to which SME continue their quality journey and is measured by the level of
each quality element’s implementation in their operations. Literature mentions, a
number of quality elements that could lead a company to the TQM implementation.
Among those elements most applicable to SME are the “Quality tools and techniques”,
the “Quality processes”, the “Quality culture” and the “Performance appraisal”
elements (Gupta et al., 2014; Hunt, 1993; Psomas et al., 2014; Sashkin and
Rosenbach, 1996; Sousa and Aspinwall, 2010)
In an effort to understand the quality journey of a Greek SME, a survey was
undertaken. The thesis and the supporting survey identifies and measures the level of
the quality elements and practices adopted by the Greek ISO certified SME and their
willingness to continue that journey leading to the TQM level.
The contribution to knowledge of this thesis, is the establishment of a set of
measurable quality elements and financial criteria applicable on different sized groups
of SME. This enables the determination of the impact that quality elements adopted by
the Greek SME, have on their financial performance in a period afflicted with severe
economic crisis conditions.
Different quality elements have been examined by different researchers in order to
establish the level of quality implementation by Greek SME (Fotopoulos and Psomas,
2010; Kampouridis et al., 2015). What characterises the uniqueness of this thesis is
the use of quality elements denoted by different authors such as Sashkin and Kiser
(1993), Hunt (1993), Sousa & Aspinwall (2010) and Sashkin & Rosenbach (1996
/2013), with emphasis on the “Quality tools and techniques” and “Quality processes
elements” and on the “Quality culture” and “Performance appraisal” elements, to
evaluate financial performance. In addition, the use of a set of selected financial ratios
entailing not only the core financial performance criteria (Profitability, Efficiency,
Liquidity and solvency) but also the risk (probability to default) criterion makes the
thesis and its conclusions a valuable contribution to knowledge.
The thesis identifies the benefits or otherwise on the SME financial performance and
specifically on their profitability, efficiency, liquidity and solvency rates, which have
resulted from the implementation of quality improvements.

Chapter 1: Introduction
Page 4 of 292
Georgios Sainis Ph.D. Thesis
1.3. The thesis Aims, Objectives and its Research Questions
Considering the financial, social and cultural difficulties that Greece is experiencing in
recent years, the aim of the thesis is to support the knowledge and understanding
regarding the decision the ISO certified Greek SME entrepreneurs need to take, that
is to continue their journey to quality. This decision is related to the enrichment and
enlargement of the quality elements they need to introduce in their operational and
cultural environment, in order to accomplish the TQM level that would add value to
their SME. Continuous improvement and customers’ satisfaction, the aims of TQM; are
what will enable them to confront the consequences of the financial crisis.
The thesis’s objective is to identify and understand the role of quality and its elements,
those that mostly contribute to how the SME cope financially under the economic,
social and cultural changes incurred due to the crisis conditions.
An added objective of this thesis is to make Greek SME entrepreneurs understand the
contribution of quality and TQM implementation in improving their financial
performance as a means of supporting their financial sustainability and survival.
The aims and objectives of the thesis,, its conceptual framework, its sampling strategy,
the data collection process and the analysis and evaluation of the results derived were
the main components of the research design (Robson, 2011).
1.3.1. Aims:
The aims of the thesis are:
To establish the quality elements and assess their adoption level in the Greek ISO
certified SME and in each group (formed based on size) during a period of
economic crisis conditions.
To establish the financial criteria and assess the financial performance of the
Greek ISO certified SME and each group (based on size), also valuing them in
relation to their identified quality level attributes.
1.3.2. Objectives:
The scope of the thesis is to add value and knowledge to a research area that
quantifies the contribution of quality and TQM specifically regarding the financial
performance of SME when those operate in an unstable economic environment.
The objectives that support the first aim of the thesis are:
Chapter 1: Introduction
Page 5 of 292
Georgios Sainis Ph.D. Thesis
To undertake a thorough literature review that would reveal the type, kind and the
role of quality elements in the transition process from ISO to TQM implementation
for companies and for SME in particular.
To review literature regarding the type, kind and the role of financial ratios as a
methodology used to measure a company’s financial performance and SME in
particular.
To identify and analyse the role of SME in the Greek economy (as a member of
the European Union) in a period of financial crisis conditions.
To conduct a pilot study that examines the applicability of the methodology
designed in a wider context i.e. the collection and analysis of 180 questionnaires
completed from Greek ISO certified SME.
To collect primary data (using a structured questionnaire and a semi-structured set
of interviews following the triangulation approach) regarding the Greek ISO
certified SME. Data is needed in order to identify the quality level that all SME and
each group of SME are implementing, as well as data related to selected financial
ratios.
The objectives that support the second aim of the thesis are:
To collect secondary financial data (using i-Mentor Hellastat database) for all SME
registered in the database that the survey’s questionnaire was distributed to. To
relate the sampled SME and the whole database’s population financial
performance, further verifying the derived results.
To develop a methodology in which the established set of quality elements and
financial ratios could be plotted and to recognize any added value to the Greek ISO
certified SME.
To identify and construct different mathematical and statistical equations that will
derive the added value related to the SME level of quality implemented and the
equivalent level of their financial performance.
To handle a comparative study among the different groups of SME (in terms of
their size) in relation to the level of quality implemented and their equivalent
financial performance.
To show the applicability and transferability of the analysis conducted to other
economies within Europe whose SME face similar financial problems to the SME
in Greece.

Chapter 1: Introduction
Page 6 of 292
Georgios Sainis Ph.D. Thesis
1.3.3. The research questions and sub-questions:
The research questions are:
A. “Have ISO certified Greek SME continue the adoption and implementation of
total quality management practices, in times of an economic crisis?”
B. “Have ISO certified Greek SME improved their financial performance in
proportion to the level of Quality they have implemented in times of an
economic crisis?”
The sub-questions that support the research questions are the following:
For the research question A’ its sub-questions are:
1 Do Greek ISO certified SME, further implement the quality tools and techniques?
2 Do Greek ISO certified SME, further implement the quality culture practices?
3 Do Greek ISO certified SME, further implement the quality processes?
4 Do Greek ISO certified SME, further implement the quality performance appraisal
techniques?
For the research question B’ the sub-questions are:
1. Have Greek, ISO certified SME, improved their Profitability level?
2. Have Greek ISO certified SME, improved their Efficiency level?
3. Have Greek ISO certified SME, improved their Liquidity level?
4. Have Greek ISO certified SME, improved their Solvency level?
1.4. The SME and the Quality Level.
In Table 1 that follows, the criteria for classifying SME in different industry sectors are
shown. The table shows the classification of the criteria that companies take into the
account including the number of employees employed and the industry in which they
operate.
Table 1: Classification of Businesses by number of Employees, Turnover & Total Assets (Lukacs, 2005)
Size
Turnover Total Assets
No. of Employees
Industry (Number of Employees) (Selected)
Commerce (Number of Employees)
Sector Service (Number of Employees)
SME
Micro business
<2 m. <2 m. 0-10 0-10 0-10
Small business
<10 m. <10 m. 11-50 11-30 11-50
Medium-sized business
<50 m. <43 m. 51-250 31-100 51-100
Large company 250 or
more 101 or more 101 or more

Chapter 1: Introduction
Page 7 of 292
Georgios Sainis Ph.D. Thesis
The criteria broadly used for the SME classification are based on an objective set of
measurements regarding the company’s characteristics (i.e., number of employees,
level of sales, total assets) as well as a set of different SME characteristics related to
their development (i.e., growth, value, expertise) (López-Ortega et al., 2016). Though
the ones that were mostly used for their classification were the measurable and
quantifiable characteristics i.e. the number of their employees and/or their total assets.
This classification is also adopted by the European Union. The European Commission
with the act 2003/361/EC that was published in the European gazette EE L 124 of
20/5/2003, approved the new and replaced the old definition and classification of SME
as this was defined from the 96/280/EC act.
The classification specified in industry, as this is shown below is the one applied for
the Greek SME (Grammelis and Pedioti, 2014; Kumar et al., 2009) and the one
adopted by the author of this thesis. SME are specifically classified as:
Medium SME: The companies that employ fewer than 250 employees,
Small SME: The companies that have fewer than 50 employees but more than
10,
Micro SME: The companies that have at most 10 employees.
Considering that SME function mostly as subcontractors and suppliers to the large size
companies, both at local and international levels, the role of SME in the Greek
economy becomes crucial and vital. Their strategic role demands for them to follow
and support the decisions taken by the larger sized companies. For the large
companies that have more resources to use, their decision to continue their “journey”
for TQM implementation is considered a given (Duh et al., 2012; Youssef et al., 2002).
Structural differences between large companies and SME, together with their inability
to see quality as a continuing improvement process and the inability they face to utilize
formal evaluating techniques, creates the need for the development of a simpler model.
This model would manage to self-assess the actions taken and not just score them,
that would give directions on what should be done simultaneously offering support of
what is needed for their implementation (Sturkenboom, et al., 2001).
Since the limited number of resources is the main characteristic of SME’s, there is a
belief that Quality and TQM in particular, could not be easily implemented. However
literature extensive research has shown that the key TQM elements could be
successfully implemented in an SME at affordable cost in terms of time and in terms
of the resources used (Carlos Pinho, 2008; Ghobadian et al., 1996; Sinha, Garg and
Dhall, 2016; Temtime et al., 2002) Amongst quality gurus like Ishikawa (1962), Juran

Chapter 1: Introduction
Page 8 of 292
Georgios Sainis Ph.D. Thesis
(1941) and Crosby (1967), Deming (1950) was the one who opened the road for
researching quality from a different perspective. All identified the need for a system
that could establish and appraise a company’s quality (TQM) level and performance.
This has led to the development of different quality awards like the Deming Prize in
Japan (1996) the European Quality award in EU (1994), the Malcolm Baldrige Award
in USA (1999). The common aim of all those awards that constitute the concept of
TQM is:
a. to improve the awareness of quality that would improve a company’s
competitiveness,
b. to support the self-assessment process that would encourage their market
awareness,
c. spread information that would support the development and implementation of
quality strategies,
d. make the quality characteristics needed for the quality excellence understandable
and
e. support the on-going improvement process (Gitlow et al., 1989; Zhang, 1963).
The first step for the implementation of a quality system to a company is to become an
ISO certified company. ISO certification confirms that a quality system is capable of
satisfying the organizational standards being installed. The following step should be to
implement a Total Quality Management System. From the implementation of such a
system a company can further improve its quality strategy and its strategic plan. The
company would accomplish this through a higher level of customer satisfaction (Goh,
2000), by improving product/ service quality, cost, distribution and flexibility (Lambert
and Ouedraogo, 2008; Terziovski and Guerrero-Cusumano, 2009).
ISO certification managed to positively change the perception SME had for TQM
practices and organizational performance. The ISO certification for SME has
contributed positively in facilitating the TQM implementation process. This was
achieved through the use of an action tailor-made evaluation instrument for all the
quality practices established. That tailor-made TQM framework should be cost
effective and focused on the needs and the critical success factors of an SME.
Examples could be the employees’ training and job description and the way they could
deal with different quality problems, the relationships between the company’s
functional groups or the suppliers’ relationship and involvement (Hansson, 2003). The
quality elements considered were the quality evaluation, the customer’s focus, the
participation and teamwork as well as the continuous improvement element. For an
SME to have the ability to determine the quality level implemented and realize its

Chapter 1: Introduction
Page 9 of 292
Georgios Sainis Ph.D. Thesis
maturity status, the measurement and appraisal of the improvements accomplished
over time is needed (Sohail and Hoong, 2003; Sturkenboom et al., 2001).
Enriching the existing operational processes with the appropriate quality
improvements, has become an even more unstable task, given the environmental and
economic instability SME are recently facing. The need to impose higher control over
the operational processes and quality improvements implemented, as well as
improvements of relationships among the participants (suppliers, customers) is
considered vital. Psychology supports that imposing control on these relationships,
would make the participants become motivators of that behaviour and through that
manage to change the overall cultural environment of the company (Philip & McKeown,
2004; Regan, 2000; van der Wiele, et al., 2011).
In the process of implementing quality, the more technical elements, i.e. the Quality
tools and techniques and the Quality processes, are and will continue to be of great
importance. It is their contribution in measuring and controlling the company’s
operations through identifying and reducing any abnormal variations that make them
so valuable (Sashkin and Kiser, 1993).
For implementing a quality management system (TQM) in a company, the need to
consider and if necessary adjust its organizational culture is crucial. The development
of a quality cultural environment would guarantee the successful implementation of
TQM elements, imposing any required quality improvements efficiently (Corbett, et al.,
2005). The “Quality culture” element, supporting an SME’s strategic and quality plan
is also important given that the cultural style adopted would be focused on the human
resources and on the continuous improvement orientation (Pun and Jaggernath-
Furlonge, 2012; Regan, 2000; Sinha, Garg, Dhingra, et al., 2016). The “quality culture”
element refers to a company’s management style, its achievement style and its self-
actualization and affiliated style. However, the willingness of a company’s leadership
to accept such structural changes in its cultural environment would constitute the
beginning of the establishment of a quality environment suitable for TQM
implementation.
Being mutually complementary TQM and the learning organizations in their attempt to
renew their processes and their environment (Chang and Sun, 2007), innovative
leadership is what could bring to an SME all those learning capabilities that would
support the development of a quality cultural environment. Having established these
capabilities in its environment, a company has the chance to be transformed from a
traditional vocational education unit, focusing on tools, techniques and processes to a
learning unit that can search for organizational excellence and TQM (Pool, 2000).
Chapter 1: Introduction
Page 10 of 292
Georgios Sainis Ph.D. Thesis
In addition, the successful design and implementation of the quality tools and
processes elements and the establishment of a quality cultural environment should be
supported and from the adoption of an organizational performance appraisal system.
This would assess the reliable and accurate implementation of all the needed
adjustments and/or corrections made in order to lead an SME to a higher level of
quality.
Considering that a measurement control system is needed in order to keep track of the
quality progress and ensure that all the necessary quality improvements have been
effectively implemented, the development of a Performance Measurement
Management (PMM) system could accomplish this. That is a set of management
processes and tools used from a company’s management in order to establish its
strategy, make it operational and examine and improve its effectiveness (Kaplan and
Norton, 2008).
It is agreed that the use of just the six sigma or the Balance Scored Card (BSC) or any
other Project Management Model (PMM) tool as a means of enriching the quality of
specific operations and functions on their own are not adequate. The lack of a
formalized and complete strategy, together with the lack of an entrepreneurial
behaviour, the limited management capabilities, the lack of operational focus and the
limited available resources (human and monetary) is what makes the implementation
of a quality system in an SME a difficult task (Garengo and Biazzo, 2013).
The main goal for the successfully implementation of a TQM system is to develop a
differentiation strategy which would enable an SME to attain an improved
organizational performance. In turn having an improved organizational performance
supported from a set of innovative ideas and actions and from utilizing the improved
quality level as a facilitator, would lead a company and an SME in particular to get what
it really needs; “a competitive advantage” (Prajogo and Sohal, 2006).
1.5. The Role of Quality in an SME’s Financial Performance
Extensive research has been conducted regarding the use and the benefits that
different sized companies derive from implementing TQM. Companies from sectors,
like construction, merchandising, servicing have recognised different types and kinds
of benefits from implementing TQM. Those benefits refer to the fields of higher product
quality, increased efficiency and improved business performance. Companies who
managed to show a remarkable performance and were awarded the US Malcolm
Baldrige National Quality Award, or other kind of excellence awards, were questioned

Chapter 1: Introduction
Page 11 of 292
Georgios Sainis Ph.D. Thesis
if they also performed better in other areas like their profitability, market share,
productivity, efficiency and solvency, as well as their quality costs and employees
relations. What they supported is that those “Descriptive models” cannot be used
extensively, because of their inability to clarify the benefits they get from implementing
TQM, as well as who will grant those benefits (Saunders & Preston, 2006).
TQM and its contribution to operational and financial performance is accepted from the
market and the entrepreneurs as a means of adding value to a company. However its
relationship with a company’s overall improved financial performance has not yet been
verified. Researchers have worked on this issue using different variables and different
models. Their attempt was to identify possible deficiencies in the way financial and
quality data were statistically processed and correlated. They have also tried to identify
the consequences from TQM implementation to a company’s overall financial
performance (Wayhan & Balderson, 2007). From their analysis it was initially found
that the market’s tendency is to find ways to improve their quality. The companies that
operate in those markets see these improvements as a means of adding value to them.
This is mainly achieved through improving their financial performance (Hendricks &
Singhal, 2000).
In a study conducted by Herzallah et al., (2014) the indirect relationship among the
TQM practices and the SME’s financial performance was established. The factor that
mainly influences this relationship was the competitive/differentiation strategies
adopted by the SME. Those were the strategies that have shown a direct and
significantly positive relationship with the technical (hard) elements of TQM, like flow
charts, relations diagrams, Pareto analysis, control charts, balanced scorecards,
quality function deployment (QFD) (Fotopoulos and Psomas, 2009). They were
positively related to an SME’s cost leadership strategy and because of this to its
financial performance. On the other hand indirect was the relationship between the soft
(i.e. continues improvement, management by objectives (MBO) and teamwork) and
the hard TQM elements. This was the reason why the significance shown in the
relationship between the SME differentiation strategy and their financial performance
was shown as weak. That means that differentiating only on an SME’s cultural
environment does not mean that its financial performance will be improved, for the
moment the hard or technical elements were not equivalently improved and vice-versa
(Herzallah et al., 2014; Hendricks & Singhal, 2001; Douglas & Judge, 2001). The
characteristics of the SME that were examined in this survey were similar to the
characteristics of the Greek SME. That is, they were family-owned companies that
were focusing more on profits and not as much on customer’s satisfaction.

Chapter 1: Introduction
Page 12 of 292
Georgios Sainis Ph.D. Thesis
Eighty percent (80%) of the surveys conducted focusing on the linkage between TQM
and financial performance, are subjective. Most of them were focused on the
implementation process and the outcomes derived. They tried to compare the quality
initiatives undertaken from different companies, creating nonetheless doubts on the
accuracy and reliability of the outcomes derived. Those doubts were usually caused
by the inability of the research design and methodology used, to provide definite proof
of an existing relationship between TQM and financial performance (Wayhan and
Balderson, 2007)
What really matters, is to understand that TQM is adopted not just because of the
company’s internal needs (cost minimization and quality improvement) but because of
its external tensions. As external tensions are considered the strong level of
competition and the higher level of the performance evaluation criteria used like the
profit, turnover, and productivity rates. A “self-assessment” technique used by the
researcher that could lead a survey and its conclusions to non-biased and subjective
results is needed, given the availability of the required financial information (Watson et
al., 2003). However, financial information is not easily accessible especially from the
non-listed companies.
The most traditional, quick and reliable method used in measuring a company’s
financial performance is the ratio analysis. In almost all articles studied and among the
ways different researchers have attempted to measure a company’s operational and
financial performance, financial ratios were the criteria they used. Measuring and
analysing the financial ratios gives stakeholders and analysts the opportunity to
evaluate the operating and financial performance of a company (Hirt et al. 2013).
Ratio analysis offers a company the opportunity to obtain a clear and unbiased
representation of the environmental conditions it has to deal with. It also supports
management in the decision making process. It is used as a tool to identify possible
abnormalities in a company’s behaviour and predict future corrective actions
(Voulgaris et al., 2000).
The ratios mostly used in ratio analysis, are return on assets, return on equity and
profit margin ratio. In another set of surveys, researchers have also incorporated into
their models a number of qualitative variables, such as the customer’s satisfaction and
the company’s competitiveness (Klingenberg et al., 2013).
Altman’s z-score is a unique ratio that identifies the level of a company’s financial
distress. It has been accepted and used in the market for many years, but the

Chapter 1: Introduction
Page 13 of 292
Georgios Sainis Ph.D. Thesis
recognition of its role in influencing a company’s strategic plan has not yet been
established (Calandro, 2007).
The Z-Score ratio values could determine the financial distress of a company at
different zones.
If Z-score > 2.60, the company is not at risk (safe zone).
If Z-score < 1.10 the company is most likely to go bankrupt (distress zone) and
If Z-score is in between these two values (>1.10 or <2.60) the company is at a risk of
financial distress and bankruptcy (grey zone) (Calandro, 2007).
Different examiners have proposed different financial ratios, but the ratios mostly used
are the ROA (Return on Assets) and ROE (Return on Equity) ratios, the current ratio,
a set of turnover ratios (i.e. Inventory turnover, account receivable turnover, sales
turnover) and the Debt to Equity ratio. In a number of surveys the Altman Z-score ratio
is used. The contribution of Altman Z-score, used in this survey, has been statistically
tested and its contribution in measuring a company’s financial performance has been
proved, although it has attracted criticism.
1.6. The Scope and Methodology of the thesis.
Given the economic and social crisis Greece has been facing for the last eight years,
uncertainty characterises the environment of all the Greek companies, especially that
of the SME. The need to incorporate corrective actions into their strategic plan could
be seen as a chance to search for new opportunities. What Greek SME really need, is
to be proactive, have good leadership, quality culture, clear situation awareness and
immediate decision making. Vargo and Seville (2011) support that SME need to have
an available and efficient strategic plan that should incorporate a quality plan in an
attempt to face the uncertainty and the continuously changing environmental
conditions.
This thesis in addition to contributing to the recognition of the role of quality and TQM
to Greek SME, also offers guidance to Greek entrepreneurs and managers to identify
and recognise the quality elements they need to support in order to become a quality
structured company. The thesis contributes in recognizing the role of each quality
element i.e. the Quality Tools and Techniques, Quality Culture, Quality Processes and
Performance Appraisal Techniques in the TQM implementation process. It gives
guidance to SME entrepreneurs, of all different sizes (micro, small, and medium) to
effectively implement the TQM elements and recognize the existence of any possible
inter-relationships. The opportunity to relate the level of the quality elements
implemented to their equivalent financial performance over the years of a financial

Chapter 1: Introduction
Page 14 of 292
Georgios Sainis Ph.D. Thesis
crisis, is what would motivate the SME entrepreneurs to compose an operational “unit”
(Division, Department or office) that would take them and their companies to a higher
level(s) of quality (TQM).
A preliminary (pilot) study was conducted by the authors, using the first hundred and
eighty (180) questionnaires collected. Its purpose was to verify the reliability and
validity of the questionnaire distributed. The 180 questionnaires represent
approximately 40% of the expected size of the survey’s sample size as per (Hannee,
2011; Hertzog, 2008). No major problems were found in the process and analysis of
the data collected. This led to the upload of a slightly modified questionnaire (financial
data section) to the e-teacher platform and to re-sending the invitation e-mail to the
SME registered in the i-Mentor Hellastat database. From the analysis of the data
collected, the conclusions derived support the belief that Greek SME continue their
quality journey giving greater emphasis on the TQM’s cultural dimensions. Instead less
emphasis is given to the Quality tools and techniques and Quality processes elements.
The costs that the Greek ISO certified SME are asked to bare in supporting the
“continuous improvement” idea, needed for implementing TQM, is what causes this
behaviour (Sainis et al., 2016).
The next step is to identify the financial performance of all the SME that participated in
the survey and identify the quality level they have decided to implement. Ratio analysis
was used and selected ratios from the four groups of ratios that examine an SME’s
financial performance, namely the liquidity, the profitability, the efficiency and the
solvency ratios, were examined.
The ratios used in evaluating the SME financial performance were, the Acid Test, the
Asset turnover, the Inventory turnover, the Accounts receivable turnover, the Return
on Assets, the Return on Equity, the debt to equity and the Altman Z-score ratios. All
those ratios exist in finance literature and some of them are selectively used in different
surveys conducted. But, in the literature review conducted no one has used all those
ratios in evaluating the SME efficiency, profitability, liquidity and specifically solvency
level, incorporating into them the Altman Z-Score function.
In order to investigate the quality implementation process in depth, the data collected
was sorted into groups based on the number of employees each SME employed. This
criterion for categorizing the SME into the “Micro”, the “Small” and the “medium” sized
groups was used, similarly to the criterion used by the European commission for
categorizing the European SME.

Chapter 1: Introduction
Page 15 of 292
Georgios Sainis Ph.D. Thesis
The consequences of further implementing or not implementing the TQM elements
would reveal the SME capability of coping financially and in terms of their liquidity,
profitability, efficiency and solvency, in light of the uncertainty that characterises the
Greek market and the globe-economic environment in recent years.
The findings and responses on the quantitative survey and the questionnaires that
were fully completed and returned were used in developing an analysis based on the
scoring method in research (Robson, 2011). The scores assigned to each question
were used in order to identify the level by which each TQM element and TQM in total,
was implemented from the SME. The quality elements that characterise the TQM
implementation level and are identified in literature, are the Quality tools, the Quality
processes, the Quality culture and the Performance appraisal elements. Equal weight
was assigned to each quality element for determining the total TQM score. The SME
would be characterised as “TQM SME” if the score was above average, “ISO+ SME”
if it was close to average and as “ISO SME” if it was below average.
The analysis followed on the qualitative survey was based on the qualitative
phenomenological approach. This is an approach the objective of which is to describe
the perception that SME quality managers have regarding TQM implementation and
the actions they follow or want and can follow in order to achieve it. For each element,
different themes were identified supported from a set of questions each one having a
distinct code. For example for the quality element “quality processes”, one theme
associated is the job analysis. The codes and the questions related to that theme were
(a) use of surveys to identify needed improvements and (b) use of periodic reports
from established team members.
Ten interviews were conducted and the scores from each question, group of questions
and the total score derived valued the implementation level of each quality element
and TQM.
Following the triangulation approach, a technique that tries to cross examine the
results derived from two different research approaches, namely the Qualitative and the
Quantitative approach, their scores were compared. Similarities and differences on the
quality level implemented from all and from each group of SME were identified.
Continuing the analysis on the SME financial performance, a preliminary statistical
analysis was conducted testing the normality, the equality of means and the
homogeneity among all groups of SME and for all the financial ratios. All the statistical
tests applied, confirmed the reliability of the data used and consequently the results
derived. The commonly used statistical tests (i.e. Jarque-Bera test, F-test, Levene’s

Chapter 1: Introduction
Page 16 of 292
Georgios Sainis Ph.D. Thesis
test) were carried out and the EViews and the SPSS software packages were used as
being the only ones adopted by almost all the surveys examined (Bryman, 2004)
From both sets of financial data collected and tested, the sample population SME
(1,245) and the sample SME (392), a trend analysis in all financial ratios was
conducted for the years 2008 till 2014. Its purpose was to show how each ratio
behaved over the years for all SME and for each group of SME. Their behaviour in a
period of severe economic conditions, would show the degree to which the Greek ISO
certified SME managed to sustain, improve or worsen the level of the different group
of ratios. It would act as an indication that the Greek SME and each group separately
managed to improve, sustain or worsen their liquidity, profitability, efficiency and their
solvency level over the years that the analysis was conducted.
Given the level of quality implemented by the Greek SME, derived from the quantitative
analysis already conducted, their financial performance could be related, focusing on
their liquidity, profitability, efficiency and solvency level.
From the SME financial ratio trend analysis and the quantitative analysis on the quality
elements implemented, a comparative analysis contributed in ranking the Greek ISO
certified SME based on their size, their quality level implemented and their attained
financial performance during the period examined.
To support the results derived from the comparative analysis conducted, a multivariate
analysis, a MANOVA analysis was also conducted. The analysis examined the
significance in the correlation among the four quality elements and the financial ratios
as well as the correlation/relationship existing among the financial ratios.
The conclusions derived were also supported from the development of a Canonical
variate that was developed with the MANOVA syntax function. From that function, a
coefficient was assigned to each ratio variance, indicating the importance of each one
for each year, of the period examined, for the total number of SME examined and for
each different sized group of SME.
1.7. Thesis Structure
The thesis is composed of seven chapters.
Chapter one introduces the thesis, its contribution to knowledge, the motivation, the
aims and its objectives. A set of research questions were defined as a means of
bridging the gap identified in literature regarding the quality elements used in
measuring the TQM implementation level to ISO certified Greek SME. Two research

Chapter 1: Introduction
Page 17 of 292
Georgios Sainis Ph.D. Thesis
questions were also identified in order to identify the quality elements contribution in
improving or not improving SME financial performance, under an economic and
financial crisis environmental conditions.
Chapter two, refers to the literature review conducted. Each section defines and
elaborates on the environment and the elements that characterise quality. The quality
certification and the total quality management implemented in companies and SME in
particular is extensively researched. It refers to the description of quality and the TQM
philosophy and its dimensions. It continues with researching the contribution of quality
in a company’s value and how it influences its costs. The chapter ends with a summary
of the findings.
In Chapter three, the results of the survey conducted in literature regarding the
transition process of a company, from the ISO certification to the TQM implementation
are presented. In this chapter, all the elements that characterise the implementation of
TQM in an SME are explicitly investigated. Different approaches and models that have
been developed for the efficient and effective implementation of quality and TQM in
relation to SME are presented. Special attention is given to the characteristics of the
S-P model, a quality model specifically designed for implementing TQM in an SME.
In Chapter four, the role of SME in the European and Greek economy is shown. The
special characteristics that surround the European SME and the position which Greek
SME have among the European ones, is presented. How the SME behave when trying
to cope with economic crisis conditions is also investigated and presented. The role
that quality plays in companies’ and more specifically in SME’ financial performance
was examined. The factors that determine an SME’s financial performance and the
role of the financial ratio analysis in determining the level of their financial performance,
was explicitly investigated.
In chapter five the methodology used for collecting, processing and analysing the
necessary data,, in order to come to reliable and realistic conclusions is presented.
The research approach, the research methods (qualitative and quantitative) used and
the respective procedures followed in order to collect and analyse the data are
described.
In chapter six, all the necessary steps followed in order to generate the results from
both the qualitative and the quantitative survey and to analyse those results under the
triangulation approach, are presented. A description of all the preliminary statistical
tests conducted in order to organize the data collected and render it process able,
generating reliable and valid results, are described. All the different type of analysis
conducted, like a financial ratio analysis, a descriptive analysis, an ANOVA analysis

Chapter 1: Introduction
Page 18 of 292
Georgios Sainis Ph.D. Thesis
and the development of the extra variable, as well as the analysis conducted in order
to analyse the relationship between the level of quality implemented in different sized
SME and their financial performance for the period examined, are included in this
chapter.
In chapter Seven, the survey’s findings are presented. This chapter tries to relate these
findings to what has been shown in literature up to now as well as showing and
evaluating their contribution to knowledge. In this chapter, a summary of what has been
completed and what conclusions have been derived from this survey are illustrated. It
presents the implications and the limitations of the study and the opening of new doors
for further research. It additionally shows possible ways and approaches on how the
survey can be transferred to other countries or markets that are also facing crisis
conditions, composing new comparative or non-comparative research surveys.
In Figure 1, the structural representation of the chapters and their sections is shown.

Chapter 1: Introduction
Page 19 of 292
Georgios Sainis Ph.D. Thesis
Figure 1: The Structure of the Thesis
Chapter 1Introduction
Chapter 2Quality and TQM
Chapter 5Research Methodology
Chapter 6Data Analysis & Results
Chapter 7Discussion-Conclusions
Chapter 3From ISO to TQM
Chapter 4SMEs and Financial
Performance – The Greek Crisis

Georgios Sainis PhD. thesis
Chapter 2: Quality and TQM
Page 20 of 292
Georgios Sainis PhD. thesis
Chapter 2. Quality and TQM
2.1. Introduction to Chapter 2
This chapter, refers to the literature review conducted. Each section defines and
elaborates on the environment and the elements that characterise quality. It refers to
the description of quality and the TQM philosophy and its dimensions. The chapter
ends with a summary of the findings.
To provide a standard definition for quality, having an intuitive understanding of the
idea and its role within a company, has been proven to be quite complex. "Quality" is
often used as an adjective, and has become synonymous with the words “elegance”
and “luxury” as Crosby (1979) has stated (Ree, 2009). A more accurate use of the term
“quality” refers to a comparative degree of excellence with which products and services
can be compared or judged (Allen and Kilmann, 2001).
Quality for our survey is defined as the optimum and ultimate combination of all four
quality elements that are implemented to a company and to an SME in particular, trying
to accomplish customers’ satisfaction. As quality elements we refer to the quality
culture, the quality tools and techniques, the quality processes and the performance
appraisal.
Max Hand and Plowman (1992) tried to define quality, using the phrase: “delighting a
customer by consistently meeting and continuously improving his requirements”
Gitlow.G et al., (1989) defined the term as the “never-ending improvement of a firm’s
extended process”.
Whereas Quality Management is considered as an eclectic mix of management ideas
(Ehrenberg & Stupak, 1994), quality can be explained from a collective intellectual
output derived from numerous contributors/gurus including Shewhart (1933) the
Grandfather of TQM, Deming (1950), Juran (1941), Ishikawa (1962), Crosby (1967),
and many others
Total Quality Management (TQM) is seen as a business management approach that
received great popularity from the US private sector in the early 1980s. It is defined as
a system approach that has as an aim to add value to a company’s customers by
continuously improving its systems and processes.
Initially, Cohen and Eimicke (1994) gave a specific and particular meaning to every
word shown in the acronym of TQM:
Chapter 2: Quality and TQM
Page 21 of 292
Georgios Sainis PhD. thesis
“Total means applying to every aspect of work, from identifying customer needs to
aggressively evaluating whether the customer is satisfied.
Quality means meeting and exceeding customer’s expectations.
Management means developing and maintaining the organizational capacity to
constantly improve quality”.
Over the last few years, Quality and TQM in particular have been considered a way of
sustaining competitive advantage and maintaining or further improving the profitability
level , for all company sizes including the ISO certified SME, (Corredor and Goñi,
2010).
In this chapter a brief definition and description of the elements/dimensions of quality
and TQM is given. Quality and TQM as being the primary source for improving
business productivity (Morrison and Rahim, 1993; Schroeder et al., 2005) explains the
analysis of the levels of quality and the TQM as a philosophy in the business
environment. TQM is characterised from its elements that have been identified and
surveyed in literature (Section 2.2). From section 2.3 all possible ways with which the
value of quality and TQM in particular can be measured and added to a company’s
overall value are discussed. Section 2.4 presents the role of quality and TQM in
different economic sectors of an economy, the approaches used for its implementation
and the problems that occurred. In section 2.5 an attempt is made to clarify how the
cost of quality is determined and how it influences the decision to introduce quality into
a company’s strategic plan. Finally in section 2.6, a summary of what has been
discussed in this chapter regarding the Quality, the TQM and their elements and
dimensions is shown.
2.2. Quality and TQM
“Quality is a Habit, not an ACT” was stated by Aristotle in 322 BC (Aized, 2012).
Management of quality has been developed in line with the definitions of quality. Early
methods to quality improvements, have focused on improving a product’s quality
through the process of inspection (identification of non-conformance post-production)
and quality control (attempts to prevent non-conformance).
Quality is introduced to a company through a quality assurance program. The program
involves the organization’s recognition, on a third party’s (Quality Auditors) approval,
for the setup of a quality system. Management experts advocated the importance of
total quality management (TQM), marking the beginning of a movement away from

Chapter 2: Quality and TQM
Page 22 of 292
Georgios Sainis PhD. thesis
original notions of “quality” and towards its conceptualization as a philosophy in the
field of management (Rallabandi et al., 2010).
Quality is applied equally to services and products. Initial research indicates that quality
was firstly introduced in service industries, and subsequently in the manufacturing
industry. In both industries, it was used as a means of achieving competitive advantage
regarding technological and cost issues. In recent years this has become harder to
sustain. Applying Quality to product-based approaches differs from applying it in
service based approaches as in the latter case it is not possible to pre-specify all
aspects of the service. In the interactive collaboration required among the customers
and the organization in a service based approach, quality and TQM can offer
innovativeness in the product’s technological and communication issues. (Chong et
al., 2010)
Measuring quality in services, was achieved through focusing on the gap that exists
between what consumers’ feel a company should offer, versus what they actually
provide (Allen and Kilmann, 2001).
During the past decade, TQM has gained importance as an organizational trend in the
context of management changes, and has been focused more on the public sector
(Stringham, 2005).
The aim of TQM, is to contribute to a company’s overall effectiveness in achieving a
higher than what individual outputs can derive from each of its sub-systems, namely:
design, planning, production, distribution, customer focus strategy, quality tools and
employees’ involvement. Customer’s satisfaction and continuous improvement remain
the essential “elements” in supporting the TQM philosophy.
According to Stringham (2005), modern TQM, emerged as a management approach
based on a set of fundamental quality principles. It was outfitted with a toolbox of
different techniques and procedures, aimed at providing appropriate and differentiated
guidance and structure to a company’s practical set of procedures, so it could achieve
higher efficiency in its operations.
TQM is currently seen as an organization-wide management philosophy that
emphasizes the need to meet customer needs and get things "right first time". It is
considered a management system, the partial implementation of which does not
generate any benefits (Kolesar, 1995). According to Price and Chen (1993) a company
can fully benefit from TQM, only if it manages to change the attitudes and the priorities
of its day-to-day operations. But to manage these changes, a company needs to wholly
Chapter 2: Quality and TQM
Page 23 of 292
Georgios Sainis PhD. thesis
adopt TQM and all its employees need to make a long term commitment to its
implementation. The ability to improve the quality delivered to external customers,
depends on the quality of all the company’s operations in the chain, including the
internal customers and definitely all its employees. So, companies that have the option
of implementing TQM may want to consider assigning it to every organizational unit
and member within it, instead of delegating its implementation to a specialist
department.
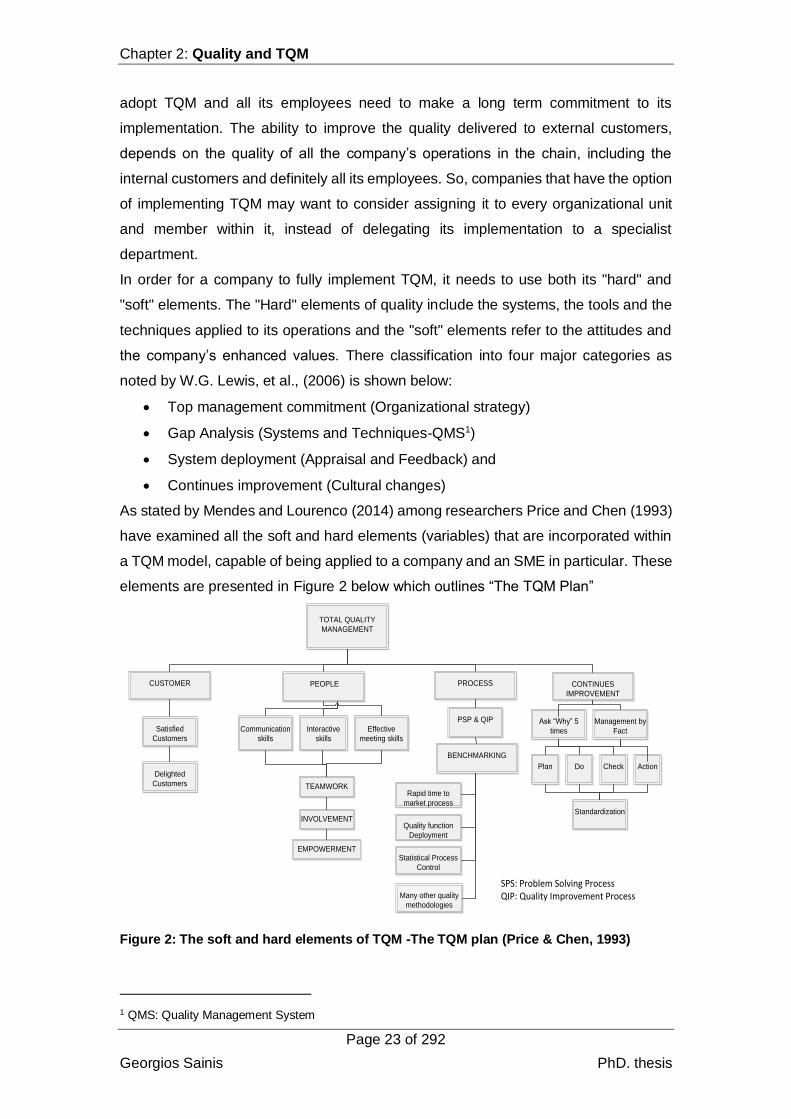
In order for a company to fully implement TQM, it needs to use both its "hard" and
"soft" elements. The "Hard" elements of quality include the systems, the tools and the
techniques applied to its operations and the "soft" elements refer to the attitudes and
the company’s enhanced values. There classification into four major categories as
noted by W.G. Lewis, et al., (2006) is shown below:
Top management commitment (Organizational strategy)
Gap Analysis (Systems and Techniques-QMS1)
System deployment (Appraisal and Feedback) and
Continues improvement (Cultural changes)
As stated by Mendes and Lourenco (2014) among researchers Price and Chen (1993)
have examined all the soft and hard elements (variables) that are incorporated within
a TQM model, capable of being applied to a company and an SME in particular. These
elements are presented in Figure 2 below which outlines “The TQM Plan”
TOTAL QUALITY
MANAGEMENT
CUSTOMER
PEOPLE
PROCESS
CONTINUES
IMPROVEMENT
Satisfied
Customers
Delighted
Customers
Communication
skills
Interactive
skills
Effective
meeting skills
TEAMWORK
INVOLVEMENT
EMPOWERMENT
PSP & QIP
BENCHMARKING
Quality function
Deployment
Statistical Process
Control
Rapid time to
market process
Many other quality
methodologies
Ask “Why” 5
times
Management by
Fact
Plan
Do
Check
Action
Standardization
SPS: Problem Solving ProcessQIP: Quality Improvement Process
Figure 2: The soft and hard elements of TQM -The TQM plan (Price & Chen, 1993)
1 QMS: Quality Management System

Chapter 2: Quality and TQM
Page 24 of 292
Georgios Sainis PhD. thesis
The four key elements that form the foundation of TQM, as stated by Price and Chen
(1993) are the People, the Continuous improvement, the Process and the Customer.
The implementation of a TQM plan, should begin from the centre of the cycle and
expand to the outer layers. In order to be implemented adequately, each of the TQM
elements additionally need to be supported from their supportive components.
Training employees’ communication, interactive and meeting skills would enable the
goals of being empowered, involved and work as a team. That goal achievement would
improve the company’s business effectiveness and productivity. Identifying problems
and their cause need innovative and intelligent decisions in order to be solved.
Successful decisions followed by Deming’s cycle (Plan, Do, Check and Act - 1991) will
bring the “continues improvement” and no-ending excellence in quality. Naming those
practices “standard” the documentation and training is what would make them be
standardized. The problem solving and quality improvement processes, would
contribute in making the customers’ requirements a specification to a work process.
Benchmarking and the use of “best practices” in the process development explains the
strategic role of quality. The TQM looks for customers’ satisfaction that is to meet
customers’ expectations. When these expectations are satisfied the customers are
satisfied. Delighted customers is what a company should look for if it wants to be
diversified.
In order for a company to develop and establish a TQM plan, literature indicates two
distinct paths which can lead to the necessary changes that would affect its level of
efficiency. The first path, deals with the continuous improvement processes and their
reliability and efficiency. The second path supports the company’s continuous learning
process that would maintain its flexibility and the use of a flexible management system
(Sutcliffe, et al., 2000).
Black and Porter (1996) argued that the research conducted on TQM until then, hadn’t
managed to develop a practical model, that would recognize the areas in need of
improvement and allow companies to develop their own quality system and quality
methods. This led in identifying the quality criteria that the quality assessment and the
quality improvement techniques could measure. The quality criteria identified, became
the main criteria for supporting the development of different quality awards. These
awards were developed and used in different countries, like the Deming Prize in Japan,
the Malcolm Baldrige National Quality award in USA; and the European quality award
in Europe. Using the same criteria, different areas of improvement were also achieved.
The areas of improvement focused mainly on the company’s set of operations but also

Chapter 2: Quality and TQM
Page 25 of 292
Georgios Sainis PhD. thesis
on employee relations, customer satisfaction, lowering costs, market share increase
and overall profitability. Additionally, a company’s improved financial performance due
to the quality improvements clarified, was also identified and was included as a
criterion to almost all performance evaluation models (Wisner and Eakings, 1994).
The selection of appropriate criteria for measuring different quality improvements
revealed the need for the development of a quality model. Back and Porter (1996)
pointed out that only a limited number of quality researchers, have tried to develop a
model capable of identifying the level of TQM implementation, accompanied by a
method capable of assessing it. One of the first to develop such a model, was Bossink
et al., (1992) who tried to investigate the level of implementation of quality in a
company, by interviewing the company’s managers and employees. As the process
proved time consuming, they administered a questionnaire that revealed only the
company’s specific characteristics. Saraph, Benson and Schroeder (2003) identified
and proposed an eight critical factor model, for identifying TQM’s implementation level,
which included 8 variables namely;
management’s leadership
quality policy
the role of the quality department
training
product/ service design
suppliers quality
process management
quality data and reporting as well as
Employee’s relations.
However the model ignored the perception of the people coming from the industry, as
a way of verifying its accuracy and its reliability. As a result, Black and Porter (1996)
proposed to additionally examine the reliability level in measuring TQM; and to
synthesize/combine the selected eight criteria with the perception of the people who
participated in the survey.
Totality in quality was firstly introduced by Hafeez, Malak and Abdelmeguid (2006),
who defined TQM as the means with which a company could achieve a higher level of
quality in terms of all its functions. TQM should include all the levels of interactions
between the elements of the organisation as well as the elements themselves.
Literature indicates, that the quality principles supporting the operations for the

Chapter 2: Quality and TQM
Page 26 of 292
Georgios Sainis PhD. thesis
successful implementation of TQM in a company, should be related with seven
different elements. These elements include:
the commitment of top management,
the measurement of quality,
the process management,
the product design,
the training and empowerment of personnel,
the supplier’s quality management and
the customer’s satisfaction and involvement.
Those quality elements should also be supported and from a set of measures, capable
of giving feedback on the degree of the quality achievement from each one of them.
Such kind of measures that could be used are:
the defects proportion,
the percentage of reworks,
the cost of quality and
the defect rates
in relation to the equivalent values of its competitors (Motwani, 2001).
Hafeez et al.,(2006) conducted a comparative study on the work of ten2 notable authors
in the field. Through careful content analysis, a set of 18 elements were identified and
categorized in a well-established set of operations management dimensions. Three
groups were formed: the technologies and tools (T), the organization and its systems
(O), and the people (P). The elements included in each of those groups constituted the
enablers, the facilitators for the efficient implementation of TQM that a company should
focus on.
As it is depicted in Figure 3, the efficient implementation of TQM is based on a set of
two different performance measurement groups: the financial and the non-financial
ones.
2 (Deming, Juran, Zairi, Crosby, Kanji, Feigenbaum, Ishikawa, Taguchi, Oakland and Shingo).

Chapter 2: Quality and TQM
Page 27 of 292
Georgios Sainis PhD. thesis
Figure 3: The Quality Elements supporting the TQM Implementation (Hafeez et al.,
2006).
For the purpose of the survey conducted by Hafeez et al., (2006), a questionnaire was
designed capable of reviewing the level of quality applied in different European
organisations. The questionnaire was distributed to both manufacturing and service
organizations functioning in the public sector. A sample of 100 organisations were
approached over the phone and/or through email. Only 40 out of those 100
organizations, showed interest in participating in the survey, and from those forty
questionnaires only twelve were completed (30% response rate). The results clearly
indicated that the financial performance measures outweighed the non-financial ones.
Technologies and Tools (T) Organization and System
(O) En
able
rs
People (P)
Single loop
Learning
Problem solving
Benchmarking
Action learning
Continues
improvement
Learning cycle
Culture
Organizational
structure
Communication
Shared vision
Performance
management
Leadership
Management
Responsibility
Empowerment
Rewards/
recognition
Team learning
Training &
education
Non-financial Performance Financial Performance
Res
ult
s
Customer satisfaction
Delivery reliability
Order cycle time (time from receipt
of order to delivery)
Innovation (new products)
Workflow improvement
Data collection processing
capability
Data storing, capability
Skills development
Inventory Turnover
Productivity
Employee productivity
Market share/ profit
Defect rates/ quality cost

Chapter 2: Quality and TQM
Page 28 of 292
Georgios Sainis PhD. thesis
More specifically, the analysis revealed that, the following enablers, being mostly
related to the “people-(P)” and the “soft-(0)” elements (dimensions) of quality, were
those that presented high values in supporting the relationship between the financial
and the non-financial performance measures:
Empowerment, management responsibility and leadership (25%).-(P)
Team learning and rewards and recognition (27%).-(P)
Performance management (22.83%).-(O)
Training and education (29.16%).-(P)
Culture and learning cycle (25%).-(O)
Benchmarking (28.33%).-(T)
Problem solving (20.83%).-(T)
Communication (26.6%).-(O)
Though, it was also realized that there was no tangible form that could prove this
relationship.
The results indicated that “people” (around 28%) were the most important factor for a
TQM organisation, followed by “technologies and tools” (25%), leaving “organisation
and systems” (23%) last. Consequently, we can confidently state that TQM contributes
successfully in the placement of correct organisational structure and assists
employees with achieving higher levels of quality (Hafeez et al., 2006).
Fotopoulos and Psomas (2008) developed a study that focused on the relationship
between the soft and the hard TQM elements. They have followed the quantitative
survey method to collect empirical data. The results derived from the analysis of 370
Greek companies, revealed that both the “soft” and the “hard” elements, play a
significant role in the effective implementation of a quality management system. That
was realized from the inside and the outside environment of the participating
companies. However, it became evident that the “soft” TQM elements play a more
critical role, than the “hard” elements. The adoption and use of “soft” and “hard” TQM
elements, can lay the foundation for improving the way a company operates and
supports the implementation of total quality (Fotopoulos and Psomas, 2008). The
authors added that, “the quality tools” are just the “vehicle” to quality improvements
and do not connote that a company satisfies all the quality elements, such as the
continuous process improvement, or customer’s satisfaction; nor do they predict an
improved market position. For that, all the TQM elements, the hard and the soft are
required. To attain market sustainability, a company would have to implement both
“hard” and “soft” elements, including focusing on customers and properly measuring

Chapter 2: Quality and TQM
Page 29 of 292
Georgios Sainis PhD. thesis
their satisfaction levels, proper guidance from top management as well as employee
and supplier support.
A company’s market sustainability is also heavily dependent on its organizational
strategy and consequently on its performance. Prajogo and Sohal (2006) tried to
examine the way TQM elements fit into and mediate the relationship between
organization strategy and performance. Their study examined TQM in relation to a
company’s organization strategy and facilitated the understanding of TQM in a broader
context. The results derived, showed that both diversification and TQM were positively
and significantly related to the three organizational performance measures: product
quality, product innovation and process innovation. They showed that TQM (as a
philosophy) could be adopted from a company as a means of implementing a
differentiation strategy and through that, achieve and improve its organizational
performance. They clearly stated, that both innovation and quality are the appropriate
targets for an organization in order to differentiate itself from its competitors. They also
demonstrated that for creating a competitive advantage through differentiation, a
company needs to introduce innovative products, with unique characteristics that are
comparable to its competitors’ products, not just introduce innovation to its processes
(Prajogo and Sohal, 2006).
Conversely, the analysis of the costs incurred from the development of a differentiation
strategy, didn’t indicate any significant correlation with any of the performance
measures they used. This leads to the conclusion that, companies should prefer to
focus on product innovation and not only on product quality; and that the cost-benefit
analysis conducted should recognize the added value of the strategy implemented. In
conclusion, the authors proposed that TQM has the strongest relationship with a
company’s quality performance and not only with its differentiation strategy. This
constituted the basis for the development of the TQM’s philosophical framework
(Prajogo and Sohal, 2006).
2.3. The Value of TQM
A strong criticism against a number of surveys conducted, states that TQM has no
value for a company, when it is based on the perception and the opinion of its
managers and its employees (Hendricks and Singhal, 2000). For that reason, new
ways and new methods were used as a means of introducing quality to a company,
like six sigma and lean management approach which were initially considered to be
reciprocals to TQM. Now, these new methods have acquired their own substance and

Chapter 2: Quality and TQM
Page 30 of 292
Georgios Sainis PhD. thesis
are considered components that add value to a company’s operational and financial
performance (Hendricks & Singhal, 2000).
One of the core requirements for implementing TQM is to have accurate data in order
to make accurate decisions that would add value to a company. A study by Hendricks
and Singhal (2000) aimed at defining an accurate methodology, that would validate
the quality of the derived results, and determine the added value of TQM for a
company. The researchers selected companies which had effectively implemented
TQM and set benchmarks with which they compared their operational and financial
performance. They conducted their analysis for a specific time period, which they split
into two parts, the “Implementation period” and the “Post-Implementation” period.
The results derived, showed that TQM is considered a long term investment (Singh,
2011). Thus operational and financial performance results are evident in the long run
and not in the short run. The increase in the companies’ value was due to the increase
in their profitability, supported from the increase in the sales level and the number of
their employees (size). The companies also experienced an improvement in their
efficiency. Reviewing the characteristics of the participating companies’ it was evident
that their higher efficiency and the overall benefits derived from the TQM
implementation, were related to their capital intensity (low vs. high capital intensity).
Capital intensity is derived from the ratio of net property over the number of employees.
Their size (net property) was measured from the amount of their total assets, the
degree of their market diversification and the degree of knowledge transferability
among their units measured at low cost. All were influenced from the level of TQM
implementation. In addition, the benefits achieved were also related to the degree of
utilization of the economies of scale concept and the learning synergies among
different units within the company. This is what would eventually result in adding more
value to the companies (Hendricks & Singhal, 2000).
The authors concluded that TQM considered as a philosophy, forms the foundation
needed in order to develop a management system. The added value from the TQM
implementation, is derived from the development of a management system that may
improve the decision making process and/or may improve a company’s financial and
operational performance. Management needs to “invest” in patience and be ready to
accept and adopt major changes in the company’s organizational structure, changes
in its culture and changes in the way employee’s think and perceive the quality of a
newly implemented management system.
Chapter 2: Quality and TQM
Page 31 of 292
Georgios Sainis PhD. thesis
2.4. Quality and TQM in different economic sectors
The attempt to implement TQM in companies functioning in different economic sectors,
emphasized the need to place greater attention on the human factor, which is
influenced from changes caused in different cultural issues. Cultural issues differ
among different sectors like the Health, the Public, the Service, the Sports and the
Education/training sectors. The analysis of those cultural issues would enable a better
understanding of the role that the TQM values and the quality practices have- or should
have -in coping with possible changes that appear in the cultural environment and in
the behaviour of the people involved.
Examining the professional training sector, Lam, Poon and Chin (2008) managed to
establish the relationship that exists between Organizational Learning Capabilities
(OLC) and the TQM Culture (TC). They tried to develop an organizational learning
transformation model for vocational education in the context of TQM Culture. Their
findings revealed a strong positive correlation between OLC and TC variables. They
also identified that the shared vision, the long-term focus, and the teacher’s/trainer’s
involvement were the key TC variables.
They pointed out that the orientation rules prohibit the creation of TQM culture, while
the innovative leadership style contributes to its formation. They developed an
empirical TQM cultural environment that was based on the OLC transformation model
that focused on vocational education. After being tested through an implementation
case analysis, the model revealed that it could efficiently facilitate the transition from a
traditionally vocational education institution, into a learning organization, achieving
organizational excellence.
Pool (2000) developed another model in an attempt to measure the quality elements
of a learning organization. Following a descriptive study Pool tried to investigate the
relationship of TQM, with a company’s organizational culture, as well as its impact on
the learning organization. The study, examined the attributes of the learning
organization and the way it influences employee’s motivation. The survey showed that
many executives pursued professional development programs on TQM principles
and/or on Senge's (1990) organizational learning principles3 (Chang and Sun, 2007).
The collected and analysed questionnaires measured the executive’s perception
regarding the principles applied to a learning organization, in relation to the TQM
attributes, and to the adopted organizational culture. The results showed that the
3 1. Systems thinking, 2. Personal mastery, 3. Mental models, 4. Building shared vision, 5. Team learning
Chapter 2: Quality and TQM
Page 32 of 292
Georgios Sainis PhD. thesis
implemented TQM principles had a positive and significant relationship with the
organizational learning process. They also revealed a positive and significant
relationship between the learning organization and its executive’s motivational level.
Ali M. Rad (2006) investigated the impact of cultural values on the success or failure
of TQM implementation in the Isfahan University Hospitals (IUHs-Iran). His focus group
consisted of the hospital managers and the employees. The conclusion derived from
the analysis of the data, was that TQM’s implementation was fairly successful in IUH.
However the implementation level of TQM was low (58.3%) in all Hospitals examined.
Greater attention was given to process management, customer focus and leadership
quality elements; and less attention was given to suppliers focus, performance results,
strategic planning and material resources quality elements. The failure to fully
implement TQM, was mainly due to the problems faced in Human resource
management, performance appraisal and strategic planning implementation elements.
The successful implementation of TQM elements in hospitals with organic
organizational structure and medium organizational culture, were found to be higher,
than in those with mechanistic and bureaucratic structure characterised by a weak
organizational culture level. This comes in congruence with the results of an empirical
study conducted to eight south African air force bases, the even though their objectives
differ, the approach they both follow to achieve excellence in their operations are not
different. To those the result derived supported the valuable role of strategic planning
to the implementation of TQM and to the improvement of their products and services
(Oschman, 2017).
Considering that ISO-9000 certification, is the starting point for implementing TQM,
Sharma and Hoque (2002) using the case study approach, tried to examine issues
relating to the rational of implementing TQM in a Fijian’s public sector organization-the
Housing Authority (HA). They used a semi-structured set of interviews, with nineteen
(19) employees selected from different hierarchical levels and a systematic study on
documentary material related to TQM issues. The results derived, showed that HA
faced no difficulty in adopting TQM elements. It assisted the organization to be more
customer’s focused, self-sustained and profitable over time (it facilitated HA to reduce
its losses and move towards more profitable levels over time). It also found that the
implementation of TQM made the organization’s operations more effective and
efficient.
The difficulty to provide higher quality in sport services (service sector), was reduced
when the sport service providers understood customers’ perception of a high quality

Chapter 2: Quality and TQM
Page 33 of 292
Georgios Sainis PhD. thesis
service and what elements they considered important in quality. Customers’ perception
revealed that the assessment of quality has a multidimensional structure (Tsitskari et
al., 2006; Lam et al., 2005; Ko & Pastore, 2004).
Despite the fact that not all quality elements (dimensions) in the sport service sector
have not been defined; Ferrand, et.al, (2010), found that elements (dimensions) such
as the physical environment, personal interactions, the core service design and
customers’ perception of the outcome, would impact the levels of customer
satisfaction. Additionally, behaviour of staff and other non-tangible elements
(dimensions) like the image, the reliability and the responsiveness, could also influence
customers’ satisfaction. They could all influence the customers’ behavioural intention.
In spectator sports, a weak relationship between service quality and spectators’
repurchase intention was identified, considering that the most important element that
influences attendance is the team identification.
Other studies have focused on quality improvements in the field of sports and have
concentrated on two main dimensions. The first was the structure and the programs
offered by the sports organizations (Robinson, 2006), while the second was the service
quality and the ability for an extensive investigation from the consumer’s perspective.
(Moon et al., 2011; Robinson, 2006).
De Knop et.al.,(2004) focused on quality on sport clubs. They defined two different
approaches for implementing TQM, (a).the technical approach: referring to the
statistical methods for control, development of strategies and design of procedures,
and (b) the social dynamic approach: emphasizing the human side of the organization,
embracing the human resource management and the organizational culture. They
have also approached TQM from its (a).Operational level: including all the primary
procedures that contribute to the expected service experience, and (b) Strategic level:
including all the additional elements and supporting processes that could optimize the
creation of added value, the setting of higher goals that need to be pursued by the club
and its members (Table 2).

Chapter 2: Quality and TQM
Page 34 of 292
Georgios Sainis PhD. thesis
Though a large percentage (56.6%) of the athletic departments have shown as being
incapable of incorporating into their management system, a strategic plan (Kriemadis,
1997).
For the higher education sector the implementation of TQM is considered as a process-
oriented approach. Categorizing quality costs into internal and external failure costs
that tend to be immediately evident and to the appraisal and prevention costs the
increase in productivity, decrease in costs and improvement in the quality of the
services performed was attempted (Trevor, 2007).
TQM philosophies in education are introduced and have been used for three decades
now compared to that of the industry sector. There has been much criticism, among
researchers about the belief that TQM ideas have been borrowed from the industry, in
order to be used in the education sector. At the same time, many researchers have
identified great similarities between TQM implementation in the education sector and
in the industry sector; and have drawn conclusions towards favourable implications of
it being used in the higher education sector. However, not all TQM implications were
favourable and this was due to the manager’s perception that for TQM implementation
the institution should adopt a more corporate oriented character. Standardization and
uniformity would replace the distinctiveness, the inspiration, the freedom and diversity
that mainly characterise an academic institution.
Even though numerous institutions in higher education have sponsored "quality''
initiatives, nearly all of them have focused on non-academic activities. For example,
higher education institutions have introduced TQM concentrating on processes such
as registration, physical plant, bill paying, and purchasing; ignoring the most critical
functions performed by an academy such as faculty tenure, curriculum, tuition and fee
levels vis-a -vis scholarship assistance (Sirvanci, 2004).
Table 2: Total Quality Management (TQM) Matrix (De Knop et al., 2004)
Level/ Approach System-Technical approach Social-dynamic approach
Operational level Inspection
Statistical techniques
Procedures and instructions
Problem-Solving techniques
Coordination
Information
Teamwork
Interpersonal skills
Strategic level Goal formulation
Strategic planning
Policy deployment
Organizational Structure
Leadership
Corporate culture
People management
Communication

Chapter 2: Quality and TQM
Page 35 of 292
Georgios Sainis PhD. thesis
But for an academic institution to change and adopt the TQM culture, they need to
move from product focus to market focus. The customer identification step in these
institutions, seems to face more difficulties than those encountered in business
organizations. There is not much agreement on who the customers are (Students,
parents, alumni, employers, society, faculty, local community, academic disciplines,
and staff) and without a well-defined customer and a customer focused plan, quality
efforts may easily be diffused (Meirovich & Romar, 2006).
Koch (2003) believes that the faculty members of a University, view quality with
suspicion since educational services are different from business services. The
measurement of quality in education, through measuring quality in the faculty’s’
teaching, research and service, is more difficult than in any other business field where
the output is more tangible.
Different countries have established different ways to tackle the issue of evaluating
quality in a higher education institution. The governments of different countries like
Australia, South Africa, New Zealand, United Kingdom, Namibia and Malaysia, have
established a system where an audit body evaluates and grants a quality assurance
certificate to a higher education institution. Thus the development of the quality
assurance standards (QAA) in education that are managed and controlled from an
independent authority, manage to slowly but steadily overcome the problem of
evaluating quality in higher education (Doherty, 2008).
2.5. Cost of Quality
Quality is one of the most valuable issues that a company (25-35% of a process cost)
can consider, with the aim of increasing its competitiveness in the market. It is also
believed from Crosby (1979) that quality is free and from Williams et.al., (1999) that
quality cost is approximately the 5% to 25% of sales revenue (cited by: Plewa, Kaiser,
& Hartmann, 2016). The need to incorporate a company’s cost analysis, the cost of
quality is inevitable. The need of a quality manager to identify and measure the size of
the quality cost is vital given that quality cost determines a company’s production and
control costs that are directly related to it (Son & Lie-Fern, 1991). Their analysis
revealed that quality and cost are inversely related. That is because an increase in the
prevention cost due to a stricter quality control process has managed to reduce the out
of control period and the probability of producing defect products. Thus, the overall
failure cost has been reduced dramatically given the increase in the prevention cost.
The authors specifically stated that “one ounce of prevention is worth a pound of cure”.
Having developed the EDCC (economic design control chart) they managed to identify
Chapter 2: Quality and TQM
Page 36 of 292
Georgios Sainis PhD. thesis
all the costs related to sampling, testing, investigating and correcting the wrongly
assignable costs, as well as the cost of producing defective items. In addition to the
above, they also highlighted the importance of incorporating the failure cost and the
inspection cost (double dipping) into their model.
Quality cost is separated into four different categories: the prevention cost, the
appraisal cost, the internal failure cost and the external failure cost. (Son & Lie-Fern,
1991). Various articles (Cánovas et al., 2009; Desai, 2008; Son and Lie-Fern, 1991)
indicate that these four different costs are sometimes combined or merged into two or
three different categories for simplicity. This is because quality costs are not easily
recognized within an accounting system and if used must be measured objectively. To
do so, they must be considered as being easily recognizable and reliable.
Determining the cost of quality, is important in all kinds and types of companies
irrespective of the sector they operate in. This is especially significant considering that
the cost of quality can significantly influence a company’s overall processing cost or
even its response time to customers. Being flexible and adaptable to any market price
or demand changes, may lead a company to higher levels of quality supported from a
higher level of competitiveness. When a company is struggling to survive, then it needs
further support which can be derived from a better control of its quality costs. This is
obvious because under economic and financial deficiencies, a number of quality costs
that up to that point might have been hidden or intangible, could lead a company into
more severe and unrecoverable crisis conditions. This implies that when a company
faces crisis conditions, it needs to change and/or adjust a number of quality elements
that would influence their cost leadership strategy aims as for example the reduction
of their wastes and flaws (Herzallah, et al. 2014). This reduction would contribute in
reducing further their operational and production costs (overhead costs, distribution
costs) enabling them to better measure and control them. The use of a cost model, like
the PAF (Prevention-Appraisal-Failure) model, in order to identify and analyse the
quality cost elements as a mean of reducing the cost of quality offering higher quality
at a better price is needed (Holota, et.al., 2016). Focusing on the prevention cost that
approximately entails the 45% of the quality costs the efficient and effective
implementation of a quality management system would manage to reduce it or even
totally remove it.
For SME the cost of quality is also considered an important component in its strategic
plan. (Desai, 2008). Its importance is related to its difficulty in being measured. Though,
as Crandal and Julien (2010) noted, for manufacturing companies, the quality cost

Chapter 2: Quality and TQM
Page 37 of 292
Georgios Sainis PhD. thesis
represents approximately 15% of their dollar sales and for servicing companies 30%
of their dollar sales. That is an amount that cannot be ignored and its coverage needs
to come from the returns and benefits derived from the TQM implementation in a
monetary and/or non-monetary form.
2.6. Concluding Remarks
Introducing quality into a company’s operations, begins with the introduction of a
quality assurance system. The concept of continuously improving its customers’
requirements is what would bring total quality management standards and the TQM
philosophy in its operations.
The TQM plan as it has been perceived and described by various quality gurus, its
“soft” and “hard” elements, as well as the significance of its implementation have all
been explicitly presented in sections 2.2 and 2.5.
Implementing quality and TQM in companies operating in different economic sectors
like the Health, Public, Service, Sports and Education/training sectors has been
discussed. There are sectors that give greater attention to the human factor. The role
of the quality culture element and the performance appraisal element were examined
in all those different industry sectors, as a means of improving the implemented quality
level.
The different categories in quality costs were mentioned and the difficulties in
objectively measuring them were identified. The need to find ways of identifying,
measuring and evaluating quality cost was also identified.
The starting point for TQM implementation is the ISO certification. That is a certificate
granted from an authorized organization to a company proving the accurate and
reliable establishment of a management and operational system based on the quality
standards specified by different quality models i.e. ISO-9000, ISO-33000, ISO-14000
or others. The next chapter describes the ISO characteristics and the transition from
an ISO certified company to a TQM company.

Georgios Sainis Ph.D. Thesis
Chapter 3: From ISO to TQM –The Transition Process
Page 38 of 292
Georgios Sainis Ph.D. Thesis
Chapter 3. From ISO to TQM –The Transition Process
3.1. Introduction to Chapter 3
A company needs to establish a quality system first, if it wants to implement quality in
its operations. An ISO certification, is the proof that such a system has been effectively
implemented and can act as the first of many steps that can lead to implementing TQM.
The present chapter, examines the stages and processes that are required for an SME
to progress from the ISO certification stage, to the TQM implementation stage.
More specifically, the chapter is separated into seven sections including the
introduction (Section 3.1). In Section 3.2, the stages involved in the process of
implementing ISO to TQM are described based on the work of various important
researches in the field. In Section 3.3, the philosophy of TQM is described as a means
of implementing and evaluating a TQM system for companies and SME. Section 3.4,
examines the critical success factors in the TQM implementation process, while in
Section 3.5, the process of implementing TQM in an SME is described. In Section 3.6,
the S-P model, developed specifically for implementing TQM in SME, is analysed and
evaluated. Finally, section 3.7 summarises the information presented throughout the
chapter.
3.2. The Transition from ISO to TQM:
It is widely accepted that total quality management (TQM) and ISO 9000, can
complement each other (Vloeberghs, 1996) and that ISO 9000 is a good starting point
for the TQM journey (Corrigan, 1994 ).
Based on ISO regulations, quality is defined as “the summary of the characteristics and
features of products or services that determines their ability to satisfy established or
anticipated needs or requirements”.
Among the scholars (Quality gurus) who developed the quality theory, W.E. Deming
tried to organize a number of companies under the philosophy of increasing their profits
by increasing their productivity. (Gitlow et al., 1989). Deming’s cycle defined by Plan-
Do-Check-Act (PDCA) denotes that in a process, when there is a difference between a
customer’s perception for a need; and the process that tries to satisfy that need, a
problem occurs that constitutes an opportunity for improvement. When there is a “big”
difference, the opportunity is great; and when it is ‘small’, the opportunity is
proportionally smaller. Considering quality as a big or a small opportunity for
investment, means considering the amount by which this difference (gap) is going to

Chapter 3: From ISO to TQM –The Transition Process
Page 39 of 292
Georgios Sainis Ph.D. Thesis
be reduced, or going to be supported from its contribution to earnings. The methods
that Deming used, encouraged the use of statistical tools and behavioural techniques
that altered the corporate environment of that time. He specifically introduced a set of
fourteen points depicted in the Table 3 below, as a way of improving a company’s quality
level.
Table 3: Deming’s 14 Points (Gitlow.et al., 1989)
i. Create constancy of purpose
ii. Adopt new philosophy of quality
iii. Cease dependence on final inspection
iv. Consider total cost, not just initial price
v. Find problems, improve constantly
vi. Institute on-the-job training
vii. Institute leadership across the organization
viii. Drive out fear
ix. Break down communication barriers between
units
x. Eliminate slogans, targets, exhortations for
workers
xi. Eliminate numerical goals
xii. Encourage education & self-improvement
xiii. Take actions needed to make transformations
xiv. Encourage pride of workmanship
Deming’s quality points enabled the community of scholars, to investigate “quality” from
a different perspective, the operational perspective, using different methods and
techniques. The Baldrige award and the ISO management system, were the first quality
models introduced to the market, the standards of which were related to the
examination of a company’s quality level and the appraisal of its performance. The
revised versions of the models placed special emphasis on the human factor and on
the quality of the products and services offered to customers.
Verifying that a quality system is in place before forming a company’s quality strategy
is required. ISO ensures that a quality management system is in place, ready to meet
the company’s organizational standards. The next step is to try to implement a total
quality management system (Han et al., 2007). Dale et al. (1990) considered that ISO
is just the beginning of a quality strategy and only if a company manages to implement

Chapter 3: From ISO to TQM –The Transition Process
Page 40 of 292
Georgios Sainis Ph.D. Thesis
the TQM’s elements, will it manage to bring its quality strategy to a higher level (Goh,
2000).
The ISO system, guides a company when implementing the quality assurance
standards and the total quality management elements, whilst making the quality
concepts understandable to all the stakeholders of an organization (Humans and
others) (Tsekouras et al., 2002).
As noted by Dale (1994) and Bradley (1994), the ISO system, develops the “road map”
for TQM implementation. If this road map is not followed, the chances for failing to
implement TQM are significantly greater (Abraham et al., 1999; Brown, et al., 1994).
Many authors including Terziovski & Guerrero-Cusumano (2009); Lambert &
Ouedraogo (2008); support that implementing the ISO standards first and the TQM
elements second, enhance a company’s organizational performance and
competitiveness. This way, a company, will enhance a customer’s satisfaction, offering
better terms in quality, costs, distribution, and flexibility (Al-Dhaafri and Al-Swidi, 2016;
Han and Chen., 2007).
Throughout the years, new standards and new versions of the ISO system have been
developed (ISO-9000:2000, ISO-9000:2005, ISO-9000-2008) in an attempt to reduce
the gap existing between the ISO certification and TQM. The ISO standards have been
improved in terms of measuring not only the conformities of the functions and the
processes implemented, but also in their ability to evaluate effectiveness through
measuring the customers’ satisfaction level. However Biazzo (2005) criticised the ISO
standards by naming them “ceremonial conformity”. He tried to point out that
differences existed between the ways, the processes and the procedures are
documented in relation to the level of quality implemented. Meyer & Rowan (1977)
explained that the reason those differences exist, is that companies are protective of
the criteria they use to evaluate their effectiveness and efficiency. So, companies with
a high level of quality place greater attention and importance on the effectiveness of
the actions taken and the results derived from the certification system implemented and
less on its pure documentation (Biazzo, 2005). This problem became more evident,
when the quality system was applied to SME with limited resources.
The ISO system for an SME, is a process focusing and contributing to the continuous
improvement concept, but is also a process of implementing and evaluating
management practices by increasing its “formal and accessible” know-how (Biazzo,
2005). Given the SME lack of technical and specialist know-how, the external forces

Chapter 3: From ISO to TQM –The Transition Process
Page 41 of 292
Georgios Sainis Ph.D. Thesis
that would give them guidance to the implementation of new processes are extremely
crucial.
Table 4:ISO standards vs TQM elements (Biazzo, 2005)
MBNQA Model (2001). EFQM Model (1999). ISO 9000 (2000).
Visionary leadership Principle developed in the same
way
Principle developed in the same
way
Customer-driven excellence Principle developed in the same
way
Principle developed in the same
way
Organisational and personal
learning
Principle developed in the same
way
Principle developed partially in
the same way (focus on
continuous improvement of
company performance).
Valuing employees and partners Principle developed in the same
way
Principle developed partially in
the same way (focus on both
personnel and supplier
involvement).
Agility Principle not developed Principle not developed
Focus on the future Principle not developed Principle not developed
Managing for innovation Principle given less emphasis Principle not developed
Management by facts Principle developed in a similar
way, but with more emphasis on
processes
Principle developed in a similar
way, but with more emphasis on
processes and on their
interconnections
Public responsibility and
citizenship
Principle developed in the same
way
Principle not developed
Focus on results and creating
value
Principle developed in the same
way
Principle developed in the same
way
Table 4 comparatively examines the quality criteria used from the ISO model and other
quality excellence models. Great similarities exist between the ISO and the other
models which are mainly used in supporting and evaluating the implementation of TQM.
As stated by Biazzo (2005), the areas of convergence between ISO and TQM are: (a)
their reference to customers satisfaction, (b) the monitoring processes used in order to
improve their performance, (c) the recognition and focus on the basic processes, (e)
the setting of quality objectives in different levels and in every function performed, (f)
the evaluation of human resources and its capabilities and (g) the simplicity and
efficiency of the documentation process. These are defined as the “management
norms” used by the new ISO terminology.

Chapter 3: From ISO to TQM –The Transition Process
Page 42 of 292
Georgios Sainis Ph.D. Thesis
Changes and improvements made to the ISO model, clearly resulted in the similarities
to the TQM principles. This supports the belief that the auditing models used in
measuring and evaluating quality under the ISO standards, would also manage to
measure and evaluate performance under the TQM standards.
The ISO-9000 series and the Baldrige award were first introduced as part of the TQM
implementation process used as a means of facing the Japanese competition (Miles,
1989). Specifically the Baldrige award, as stated by Reimann and Hertz (1994) aimed
at evaluating a company’s competitiveness in relation to the level of competitiveness
achieved after applying the ISO-9000 model. Of course revisions of the model
narrowed down the differences between the two systems with further revisions being
expected in the future (Reimann and H.S.Hertz, 1994). The low cost of implementing
the ISO standards, paved the way for more companies to introduce quality in their
operations and commit to it (Angell, 2001). New ISO standards have been developed
that focused on safety, environmental and cultural issues, leading a company closer to
the elements of the TQM philosophy.
A company should consider various factors that influence its progression from the ISO
certification stage to the TQM implementation stage. The degree to which these factors
will influence the process, will depend on the company’s ability to accept and adapt
various changes, as for example to start with a Unified culture, or respond quicker or
understand customers’ needs better (Dandekar et al., 2012). Much research has been
devoted to investigate the transition period from Quality Assurance to TQM and the
effects of using different models with varying factors. Despite the variation of models
and factors however, research indicates that all influence TQM and the level of its
implementation to some degree. All models at first, try to identify the current stage of a
company’s quality assurance system. Then based on the system identified, they
attempt to determine what future actions should be taken and which factors should be
chosen, so that the optimum level of TQM implementation is achieved. Therefore, the
SME entrepreneurs decisions should be related with what a company should do in
order to continue its quality journey (Meegan, 1997). Different models suitable for TQM
implementation, with distinct organizational functioning, were applied to different
companies, during their transition from ISO to TQM. The two most commonly used
models were (a) the organizational effectiveness model (the pyramid of organizational
development) and (b) the organizational life-cycle model.

Chapter 3: From ISO to TQM –The Transition Process
Page 43 of 292
Georgios Sainis Ph.D. Thesis
At the time these studies were conducted, the organizational effectiveness model
(Figure 1) was considered the most efficacious It included six areas of development
and competition. From those six areas, only the four (Markets, Products and services,
Resource management and Operational systems) were the ones that the company
needed in order to be more effective and competitive, provided that anyone is free to
enter and exit the market. For the organizational life cycle model, a company, needs to
have a clear understanding of its organizational infrastructure, before making changes
to its operations. As Flamholtz (1990) clarifies, the organizational infrastructure is
composed from the operational infrastructure (day to day resources and systems) and
the management infrastructure (management systems and corporate culture). If a
company has already received a quality assurance (QA) certificate, it can safely be
Figure 4:Pyramid of organizational development (Meegan, 1997).
Markets Define Market Segments
and Niche
Products and Services Develop Products (Services)
Resource Management
Financial resources,
Technological & Physical
resources, Human resources
Operational Systems
Accounting, Production,
Marketing, Personnel
Management Systems
Planning, Organization,
Management Development,
Control
,
CORPORATE CULTURE
Values, Beliefs, Norms

Chapter 3: From ISO to TQM –The Transition Process
Page 44 of 292
Georgios Sainis Ph.D. Thesis
deduced that some degree of guidance regarding the needs of the operational
infrastructural, exists. In other words, the available management resources and the
operational systems required for further developing and improving its quality level, are
present. But to proceed to the TQM level, companies need to direct their attention to
the management infrastructure, meaning the established management systems, which
are also tied to the company’s corporate culture.
While focusing on the transition from the ISO to TQM and on the model’s organizational
effectiveness, companies where faced with a number of problems, related primarily to
the degree by which the required for the accreditation operational infrastructure, was
Products and Services
Develop Products (Services)
Markets
Define Market Segments
and Niche
Resource Management
Financial resources,
Technological & Physical
resources, Human resources
Operational Systems
Accounting, Production,
Marketing, Personnel
Understanding
ISO TQM
Motivation
Figure 5: Model of Quality Transition. (Meegan, 1997).
Management Systems
Planning, Organization,
Management Development,
Control
,
CORPORATE CULTURE
Values, Beliefs, Norms

Chapter 3: From ISO to TQM –The Transition Process
Page 45 of 292
Georgios Sainis Ph.D. Thesis
accepted. In a number of cases, this was not as evident. As shown in Figure 2, the
need to introduce a new level, the transition level was realized.. This new level, was
aimed at helping the organization make the quality elements understandable and the
rational of the transition period clear to everyone. Meegan (1997) clearly outlines what
the transition period incorporates and the benefits derived from its implementation. He
argued that the understanding and the motivation driving implementation, are the two
critical factors that determine the successfulness of the transition and ensure a
successful journey towards applying TQM. He additionally referred to the needs and
the actions of the transition level, namely: (a) the strategic plan that will support the
corporate strategy, (b) the communication infrastructure, that will reinforce the
employees’ involvement, (c) the self-development plan and (d) the implementation of a
reward and recognition system, that will be supported from a quality related
measurement system, comprised of a self-assessment and an involvement plan
(Meegan, 1997).
Meegan (1997) supported that the way management handles the transition period, will
determine its success or its failure. The cultural factors however, will be the ones that
will eventually bring a company to the TQM level. All other factors will simply support
the implementation of quality and make the transition stage more understandable. But
the transition outcome will only come from the effective utilization of that company’s
corporate culture.
Meegan (1997) refers to a four stage model for companies that have already been
accredited with the ISO certificate. As depicted in Figure 3. These stages are: (a) no
plans for TQM – current state, (b) considering/ planning TQM – Transition state, (c) still
participating TQM – Desired state and (d) tried TQM, gave up – original state.
Through its cultural characteristics and empirical experiences, a company, will manage
to determine the type and the degree of changes needed in all the four stages, in order
to successfully complete the transition to the TQM level.
Figure 6: Meegan’s Four stage Model
Current State
(No plan for
TQM)
Transition Stage
(Considering/
Planning TQM)
Desired Stage
(Participating
TQM)
Original Stage
(Tried and gave-
up TQM)

Chapter 3: From ISO to TQM –The Transition Process
Page 46 of 292
Georgios Sainis Ph.D. Thesis
Meegan (1997) also supported that the companies which adopted the ISO standards
can be considered as “traditional”, because they follow Taylor’s scientific management
concepts. Therefore, in order to achieve the TQM level, they would need to adopt a
more cultural perspective. His belief, was that there is a way that companies can
develop an ISO based framework, in which cultural dimensions needed for the TQM
implementation, would be incorporated. This ISO based framework, should be enriched
with (a) focus on customers, (b) focus on continuous improvement and (c) processes
that would attempt to predict and not react. This ISO based framework was the basis
with which led to the revision of the ISO-9000:2000 edition to the ISO-9000:2005 and
ISO 9000:2008 editions.
Schroeder et al., (2005), pointed out that little research exists to show the connection
of Quality management with leadership, Strategic planning, Customer and Market
focus, as well as their relationship to measurement analysis and knowledge
management. The few management scholars like (Croson and Donohue, 2003; Schultz
et al., 1999; Schultz and Juran, 1998) who tried to identify possible relationships with
quality management, found that a relationship existed between strategic planning,
configuration and the contingency theory. Other studies, (Neil, 1996; Sousa, 2003)
have shown that the content of a quality strategy by itself is such, that it is contingent
to the environment and to other factors, like the size of the company, the environmental
uncertainty and management’s enthusiasm and dynamism All these factors, could
affect the content of the implementation process and the quality strategy developed.
Considering that the contingencies of a quality strategy are related to the quality
practices and the elements adopted from it, these factors should also be considered as
vital for a company’s growth and total value. The contingencies realized from the
smaller sized companies (SME), requires them to be flexible and possess, a
competitive advantage at all times, in order to survive. Thus, the quality strategy they
develop should be a valuable resource that is not easily copied or imitated (Schroeder
et al., 2005).
A company’s decision to enhance its quality level by introducing the TQM philosophy,
requires it to re-organize its operations, motivate its team members to collectively
embrace the effort, satisfy its customers’ needs through offering them high quality
products; and reduce its overall costs through quality improvements (Miles, 1989).
These changes and improvements, will in turn bring changes to the company’s culture.
Davies (1990) claimed that these changes will further support the modifications a

Chapter 3: From ISO to TQM –The Transition Process
Page 47 of 292
Georgios Sainis Ph.D. Thesis
company is required to make to its operating system and procedures. Specifically, the
changes will result in making the company’s actions innovative; increase customers’
satisfaction, further improve new technologies, better satisfy market demand and
protect its environment thus making it even more competitive (Goh, 2000).
A quality strategy that gives a company a competitive advantage (Barney, 1991), in a
continuously changing environment is valuable for all companies types, especially for
SME. A number of empirical studies (Haksever, 1996; Regan, 2000; Williams et al.,
2006), have examined the adaptation and use of flexible systems from SME. Flexibility
refers to the ability of a company to route, schedule, dispatch, and match and sequence
its operations. When developing their quality strategy and quality plan SME, could
benefit from a step by step management approach. This would assist an SME to form
a basic management system with aggregate flexibility and agility, which could easily be
controlled and maintained, irrespective of the resources availability (Azizan, 2007;
Sinha, Garg and Dhall, 2016) .
For the development of a quality strategy, suitable for an SME, new methods were
developed such as the balance score card and the process dashboards, which were
both related to the newly developed six sigma model. Debusk, Brown and Killough
(2003) stated, that the process dashboard and the six sigma model, could give useful
information about a company’s operational activities that are dependent on internal and
external conditions In addition, this analysis could be supported further from a set of
financial measures, like the profit and the return on investment rates.
3.3. The TQM Philosophy and the TQM Implementation Models
Extensive research (Dandekar et al., 2012; Demirbag, Koh, Tatoglu and Zaim, 2006;
Kalpande et al., 2013) has shown the relationship between the efficiency of the
techniques used in implementing TQM and the analogous philosophy that supports the
TQM implementation.
(Garvin, 2000, 1987) gave the chronological and contextual order of the steps needed
in order to implement quality (TQM). These steps are depicted below (Figure 7):
Figure 7: TQM implementation steps (cited by Kufidu & Vouzas 1998).
InspectionStatistical Quality
ControlQuality
Assurance
Strategic Quality
Management

Chapter 3: From ISO to TQM –The Transition Process
Page 48 of 292
Georgios Sainis Ph.D. Thesis
From the “14 points” of Deming, the “ten steps” of Juran and the “14 steps” of Crosby,
it was found, that TQM implementation could be achieved through the use of equivalent
TQM tools, as these, are related to the philosophical issues that support the TQM
philosophy. This analogy is illustrated below in Figure 8.
Figure 8: TQM Implementation (Huarng & Chen, 2002).
Research indicates that from all the obstacles which can materialize during an attempt
to implement TQM the inability to “modify” top management’s behaviour, to a style that
adopts and fulfils the TQM requirements, is the most crucial. Different researchers,
identified different ways of overcoming this problem. Among those Yusof and Aspinwall
(2000) pointed out, that the factors for successfully implementing TQM include:
leadership, the ability to measure results, employees’ training and the adoption of a
quality assurance model. To that, Harris and Purdy (1998) with their survey, supported
that “participative management” is what will pave the way for TQM implementation.
Others like Krumwiede et al. (1998) and Krumwiede with Lavelle (2000) stated, that the
“top management’s personality”, after being identified, constitutes a more psychological
approach for implementing TQM.
Others believe that culture, employee’s empowerment and executive commitment are
the driving forces behind the implementation of quality in a company and there is no
need to fully implement the TQM tools and techniques in order for a company (large or
small) to implement quality standards (Huarng & Chen, 2002). Though in order to
implement TQM successfully, all of its components/ elements need to be implemented.
Only then can a company achieve improved performance and customer satisfaction.
TQM philosophy
Top management support
Employees fear elimination
Vision sharing
Empowerment
Employees involvement
Customer’s focus
Open culture
TQM Tools
Quality Training
Process improvement
Benchmark management
Measurement
SPC (Statistical process control).
QCC (Quality Cost Circle).
Quality information computerization

Chapter 3: From ISO to TQM –The Transition Process
Page 49 of 292
Georgios Sainis Ph.D. Thesis
Whilst focusing on the small and medium sized companies (SME), a question arose,
regarding the Sme’s ability to fully implement all the TQM elements. According to
Huarng and Chen (2002), two factors influence the TQM philosophy and four factors
influence the TQM's tools and techniques, but all lead to improvements in an SME’s
overall performance. Those factors include: employee’s empowerment, employee’s
quality perception, executive support, training and use of statistical methods,
benchmarking on cost and supplier’s support. The TQM philosophy, techniques and
performance measurements may vary in different countries and economies, in terms of
the manner and the time by which they are implemented.
Thus to achieve, improved performance, the combination of the soft (TQM philosophy)
and the hard quality factors (TQM techniques) is needed. The combination of the two,
is what will manage to bring a reduction in a company’s operational costs, a higher level
of employee’s empowerment and training, as well as improved cooperation among its
employees, suppliers and top executives.
The criteria that characterise and determine the successful TQM implementation are
identified in a number of surveys including those by Powell (1995), Whitney and Pavett
(1998), Lewis et al., (2005), Chobadian and Gallear (1997), Quazi and Padibjo (1998)
and Antony et al., (2002). Conclusively and collectively they have proved that top
management leadership, continuous improvement, satisfying customer’s needs,
reducing waste, long range thinking, increasing employee involvement, teamwork,
process redesign, competitive benchmarking, team based problem solving, constant
measurement of results as well as a closer relationship with suppliers, are vital for
successfully implementing TQM All scholars also recognized the need to include the
geographic region among those variables, as this valuable factor will most likely
influence the allocation of resources, especially when they are scarce. Sila and
Ebrahimpour (2002) found that in order to implement TQM in an SME, variables like
the Country (Culture) and the Firm (size and type) should also be considered. As shown
in Figure 6, Lewis, Pun and Lalla (2006) stated that these two variables (Country &
Firm), together with fifteen quality characteristics (attributes) selected from a pool of
different studies spanning the globe, could present the following relationships:
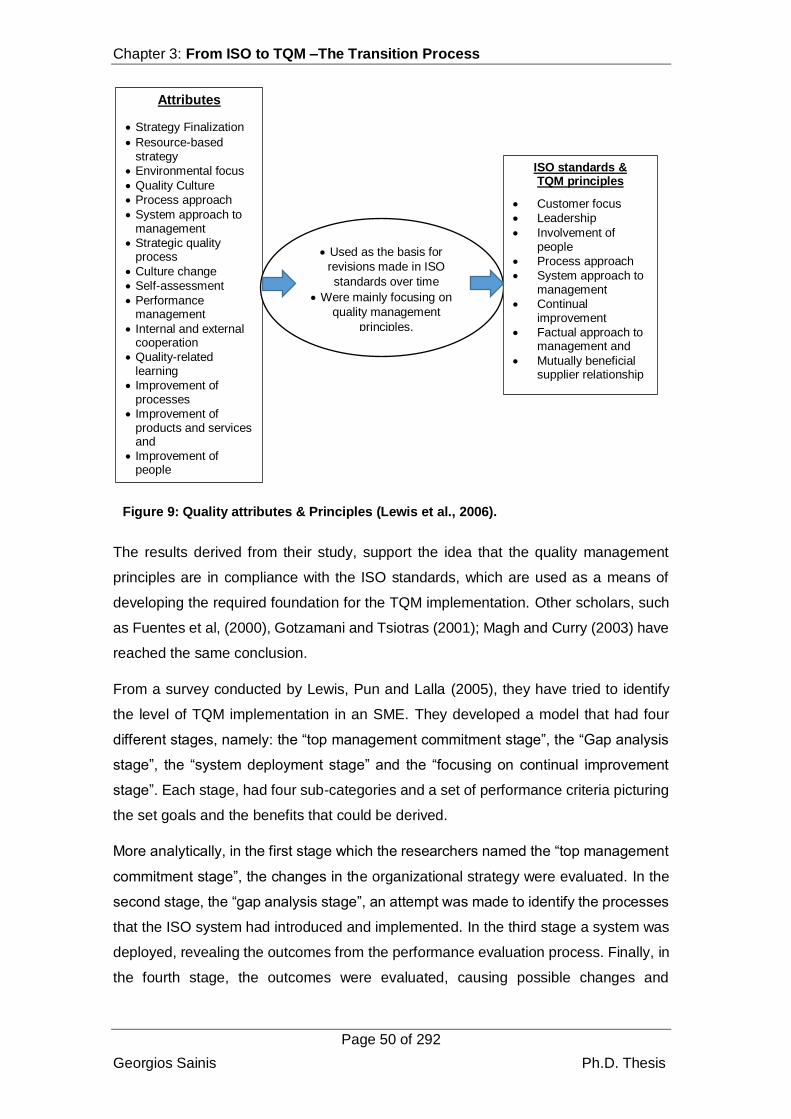
Chapter 3: From ISO to TQM –The Transition Process
Page 50 of 292
Georgios Sainis Ph.D. Thesis
Figure 9: Quality attributes & Principles (Lewis et al., 2006).
The results derived from their study, support the idea that the quality management
principles are in compliance with the ISO standards, which are used as a means of
developing the required foundation for the TQM implementation. Other scholars, such
as Fuentes et al, (2000), Gotzamani and Tsiotras (2001); Magh and Curry (2003) have
reached the same conclusion.
From a survey conducted by Lewis, Pun and Lalla (2005), they have tried to identify
the level of TQM implementation in an SME. They developed a model that had four
different stages, namely: the “top management commitment stage”, the “Gap analysis
stage”, the “system deployment stage” and the “focusing on continual improvement
stage”. Each stage, had four sub-categories and a set of performance criteria picturing
the set goals and the benefits that could be derived.
More analytically, in the first stage which the researchers named the “top management
commitment stage”, the changes in the organizational strategy were evaluated. In the
second stage, the “gap analysis stage”, an attempt was made to identify the processes
that the ISO system had introduced and implemented. In the third stage a system was
deployed, revealing the outcomes from the performance evaluation process. Finally, in
the fourth stage, the outcomes were evaluated, causing possible changes and
Attributes
Strategy Finalization
Resource-based strategy
Environmental focus
Quality Culture
Process approach
System approach to management
Strategic quality process
Culture change
Self-assessment
Performance management
Internal and external cooperation
Quality-related learning
Improvement of processes
Improvement of products and services and
Improvement of people
Used as the basis for
revisions made in ISO
standards over time
Were mainly focusing on
quality management
principles.
ISO standards & TQM principles
Customer focus
Leadership
Involvement of people
Process approach
System approach to management
Continual improvement
Factual approach to management and
Mutually beneficial supplier relationship

Chapter 3: From ISO to TQM –The Transition Process
Page 51 of 292
Georgios Sainis Ph.D. Thesis
improvements in the company’s culture and consequently in its performance (Lewis et
al., 2005).
Lewis et al. stressed the inter-functional combination and merge of the SME’s
economics within their strategic plans. They specifically noted, that at the first stage the
attempt was to identify “where to go” based on the criteria: (a) the strategy finalization;
(b) the resource based strategy; (c) the environmental focus and (d) the quality culture.
In the second stage, they developed a gap analysis attempting to respond to the
question “how to get there”. The variables they examined were: (a) the process
approach; (b) the management system approach, (c) the strategic quality process and
(d) the cultural changes. They also tried to identify the degree to which these changes
were met and how they were implemented. In the third stage, a crucial question was
asked, “have we reached our goal? The influence of the external environment was also
examined. The evaluation of the selected criteria, was aimed at supporting the answers
to the questions set in the first stage and was accomplished through: (a) the Self-
assessment approach; (b) the performance management approach; (c) the internal and
external cooperation approach and (d) the quality related learning approach. The
authors also observed, that all the quality objectives and all the procedures used,
should be developed and implemented in every part of the organization. In the fourth
and last stage, the level of improvement of the processes, the products/services and
the people involved, were evaluated based on the level of customers’ satisfaction
achieved. It should be noted, that the model gives value to the continuous improvement
criterion and its actualization, through both the review and improvement of the existing
processes; or from the adoption and implementation of new ones. To these new
processes, cross functional teams and the development of a set of cumulative activities
that will lead to further improvements within the existing processes, should be
established (Lewis et al., 2005). The appraisal methods used, the feedback received
regarding customer’s satisfaction as well as the contribution of all parts of the
organization to the development of the procedures and to the continues improvement
process gives value to this model.
The methodology that Lewis et al., (2005) used in their survey, was the AHP (Analytical
Hierarchical process). This methodology, tries to decompose a complex problem into a
multi-level model, using different characteristics and criteria for each of its different
levels, leaving the level were possible alternatives can be generated for last. These
alternatives, according to Crowe et al. (1998) and Saaty (1980, 2000), will be compared
Chapter 3: From ISO to TQM –The Transition Process
Page 52 of 292
Georgios Sainis Ph.D. Thesis
and the model itself will then manage to determine the ones that best fit the objectives
of the problem (Lewis et al., 2005). The steps taken under AHP were: a) to establish
the goals for TQM implementation, b) to identify the TQM stages and the equivalent
criteria; c) to construct a hierarchical framework for analysis; d) to collect empirical
information and data; e) to set the priorities and the importance of the criteria, f) to set
the sub criteria; in evaluating the impact of TQM criteria and sub criteria to an SME and
finally g) to incorporate all findings, in order to improve the TQM implementation level.
The analysis of the data proved that the performance criteria with the least contribution
to TQM implementation, where the TMC (Top management commitment) and the GA
(Gap analysis). However, the limitations of the study were considered to be the small
sample used and that the focus on only one industry. The two leading performance
criteria identified, were the SD (System deployment) and CI (Continuous improvement).
The results indicated, that the SME need to have more formalized quality, business and
corporate objectives. Finally, factors such as the internal and external cooperation,
process and products/services improvement, self-assessment, performance
management and the quality learning process, received the highest ratings. Instead,
the factors of quality culture, strategic quality process and cultural changes received
the lowest ratings. Based on these findings, the authors’ recommended that SME's
should have better compliance to its quality management system and quality culture.
They also recommended that SME develop strategic processes so as to handle the
proposed or expected changes needed for better implementing the TQM practices
(Lewis et al., 2006).
Another researcher, Holmegaard (1990) also developed a model in an attempt to
identify the level of TQM implementation. He proposed three different profile systems,
a) the “low degree of TQM”, b) the “some degree of TQM” and c) the “high degree of
TQM”. He classified the efforts made to implement quality improvements into four
different groups. In the first group, the firm developed a strong quality control
department in which product inspection was the only quality practice. In the second
group, quality cycles and short term quality programs were introduced, so as to evolve
quality initiatives. In the third group, a quality assurance system was introduced to
implement quality techniques and methods, supported by an educational/training
program at the low level management. In the fourth and last group, attempts were made
to integrate all previous groups and make quality the dominant organizational culture
(Kufidu & Vouzas, 1998).
Chapter 3: From ISO to TQM –The Transition Process
Page 53 of 292
Georgios Sainis Ph.D. Thesis
Marchington et al (1993) criticized, that when quality management comes from a quality
assurance and quality control system, the focus is mostly on the processes and not on
the human factor, which is the basis for the TQM implementation.
Therefore, SME’s top management should emphasise and upgrade the role of
personnel and reinforce its participation in the design of a quality system (Wilkinson et
al.,1991). Making personnel involved in changing the practices related to it, will in return
influence the company’s overall quality culture (Tuttle, 1991; Blackburn & Rosen, 1993;
Bowen & Lawler, 1992) thus lead to the development of a quality orientation that will
be “revealed from itself” (Bowen & Lawler, 1992; Easton, 1993; Fowler,et al. 1992).
Another approach for implementing TQM, was proposed by Dale et al. (2001), who
categorized quality into six different levels. The researchers gave different names for
each level, namely: a) the uncommitted, b) the drifters, c) the tool –pushers, d) the
improvers, e) the award-winners and f) the World class.
A number of studies showcase, that quality assurance and the accreditation of the ISO
certificate, are considered as being the first step in introducing quality to a company
and to an SME in particular. The accreditation, lays testament to the improvements of
a company’s operational performance, but not necessarily improvements in its financial
performance. Saunders and Preston (2006) emphasized this and stated that the
studies conducted didn’t take into consideration the external economic factors, but only
took into account the company’s overall performance through sole examination of the
company’s sales turnover or its return on investment. Other studies like the ones
conducted by Eisen et al. (1992) and Frost and Oakland (1992), focused only on an
executive’s perception per company, offering no-global perspective on TQM’s
contribution to improvement. The aforementioned research, in conjunction to what has
been presented thus far regarding TQM and the ISO dimensions for SME, imply that a
research model needed to be developed, capable of assessing the level of TQM applied
in an SME. That identified model would then be applied to the companies already on
their journey towards quality, and more specifically, to those with a quality assurance
certificate that wished to measure the extent to which TQM practices were implemented
in their environment and operations. That model would also need to be applicable in
different industries, different cultures and in different economic environments.
Eventually, that model was developed by Saunders and Preston(2006) and is called
the S-P model. It attempted to identify and describe all those activities that are
necessary from different types of organizations, in order to identify the continuous

Chapter 3: From ISO to TQM –The Transition Process
Page 54 of 292
Georgios Sainis Ph.D. Thesis
improvement and the overall benefits derived from implementing TQM. The variables
used in the S-P model, were considered the best indicators of the degree of TQM
implementation in an SME ever used in a model. The model’s reliability and validity
guarantee the quality of the results derived from its use (Saunders & Preston, 2006).
In order to successfully implement TQM, a model needs to be capable of identifying the
TQM components and able to depict how these are connected to each other.
As Saunders and Preston (2006) pointed out, a series of models have been developed
capable of examining the level of TQM implementation; but all were descriptive,
meaning that they did not prove the existence of any logical relationship between each
different component used in the models. Joiner’s model (the triangle-1995) and Juran’s
model (the trilogy-1989) are some of the models that were developed. The first
incorporating variables related to (a) customer’s focus, (b) teamwork and (c) scientific
method and the second incorporating the variables: (a) quality planning, (b) quality
control, and (c) quality improvement. More descriptive TQM models, with closely
related criteria were introduced to the market, like the ones presented by Lewis (2007),
Dale (1994) and Holmegaad
(1990) which were even more standardized, and constituted the basis for national
quality awards, like the Malcolm Baldrige National Quality Award (MBNQA), the
Figure 11: The AQA criteria
Figure 10: The Deming Chain Reaction
Improve
Quality
Reduce
Costs
Improve
Productivity
Decrease
Prices
Increase
Market
Stay in
Business Jobs and
More Jobs
Return on
Investment
5. Customer Focus
1. Leadership
2. Policy and Planning
3. Information & Analysis
4. People
6. Quality of Process
& Service
7. Organizational
Performance

Chapter 3: From ISO to TQM –The Transition Process
Page 55 of 292
Georgios Sainis Ph.D. Thesis
Australian Quality Award (AQA) and the European Quality Award (EQA). These models
were criticised by a number of researchers like Saunders and Preston (2006), Deming
(1992) and Garvin (1992), who recognized that there is no need for the development
of a model that sets and examines a list of TQM characteristics, but for a model that
supports a logical chain of arguments related to the TQM characteristics. Pincer model
shown in Figure 12 was also developed in an attempt to relate quality with the impact it
has on enlarging a company’s market share and achieving possible cost reductions
(Karafet et al., 2001).
The S-P model constitutes an elaboration of what Deming used as his main argument,
referring to the use of statistical tools as being the only source that will bring quality to
a company. Specifically, it uses a set of components that show the activities and the
attributes of a company that has successfully implemented TQM. All these components
are directly connected or connected through the formation of logical sequences. The
components used are classified into four major groups. The first group, consists of the
basic characteristics of TQM, that are also shown in Joiner’s triangle; the second group,
consists of the results derived from the use of TQM’s basic characteristics the objective
of which is to reinforce improvement. The third group, consists of the control procedures
that are focused on the improvement of processes, products and services; and the
fourth and last one offers the outcome which is also related to company’s ability to
further improve. This group incorporates what Pincer (Figure 12) included in his model
regarding the reduction of its costs and the increase in its customer’s satisfaction
(Saunders & Preston, 2006).
At this point it is important to note the benefits derived from the use of the S-P model.
These benefits in fact apply to all of the company’s stakeholders, including the
Figure 12: The Pincer model
Quality
Improvemen
t
Greater
Customer
Satisfaction
Increase
Market Share
Revenues
up
Costs
Down
Greater Return
on Investment
Reasonable
Pricing
Reduce
Costs
Increased
Productivity

Chapter 3: From ISO to TQM –The Transition Process
Page 56 of 292
Georgios Sainis Ph.D. Thesis
suppliers, employees, shareholders and to the community as a whole, not just to the
company’s customers (Saunders & Preston, 2006).
Specifically the benefits are:
To the suppliers:
Improving operational performance and reducing waste, will mean that the suppliers
can pursue better prices.
Supporting and improving their processes suppliers will bring new partnerships with
mutual benefits.
To employees:
Team work, a common understanding and recognizing the importance of quality
brings more trust and increases morale
Better performance brings job security and higher compensation
To shareholders:
Improved organizational performance, improves the company’s value and leads to
higher profits
Better understanding of procedures brings greater accountability
To customers:
Waste reduction leads to reasonable prices
Customer’s satisfaction leads to more trust and a feeling of partnership
Customer’s satisfaction brings greater satisfaction with products and services
Society/ Community:
Waste reduction lessens the sum of total global waste
Improving trust among companies brings trust as a core value
Better operational performance of TQM companies bring an increase in the
standard of living of the society as a whole.
What is important is that, not all the benefits derived from TQM implementation will be
applied but only those that are appropriate. This depends on whether all the model’s
components will be needed in order to achieve all the expected results from it. So, it is
evident that the model has embedded within it the values of TQM, with trust being the
most important element for TQM implementation. This is also supported from the use
of teamwork. For the development of the model, a tool, is required, that will impose
control over the way the company’s processes and its products will be improved. With
this tool working properly, customer’s satisfaction, higher productivity and the
company’s value, could be used as a way of measuring its stakeholder’s interests, the

Chapter 3: From ISO to TQM –The Transition Process
Page 57 of 292
Georgios Sainis Ph.D. Thesis
degree to which the company’s competitiveness has increased and the degree to which
the needs have been satisfied. So, TQM will contribute to a company’s value, only if it
can manage to achieve and use the control tools, as a way of realizing the benefits
derived from its implementation (Saunders & Preston, 2006).
The methodology followed by Saunders and Preston (2006) used four layers. The first
was named “the basics of TQM”; the second “the prerequisites for improvement”; the
third “the ability to improve” and the fourth “the outcomes of improvement”.
In the first layer, a justification is made, considering teamwork as (a) a need for team
management and activity improvement and (b) a need to make a company operate as
a single team, which is also considered as an internal customer focus. TQM should
focus:
On the use of team activities and processes
On the attention to internal customers (Stakeholders, employees, shareholders).
On agreeing by anyone on what quality is and the need to satisfy external
customers and
On the knowledge of the data use, and on the reasoning of any differences in the
decision making process.
In the second layer, the required improvements are identified. To accomplish this the
company needs:
to define and clearly understand its customers’ needs, so it can pinpoint the
required changes.
to understand all its internal processes including those related to its suppliers
(external), in order to identify what needs to be changed.
to define the processes and techniques used for improvement in order to know how
to implement them effectively.
In the third layer, the greatest emphasis is placed on the presence and justification of
the TQM prerequisites. With the term, TQM “justification”, we refer to the environmental
factors that will support the TQM implementation. Only then the TQM model introduced,
will offer the company an improvement in its processes.
In the fourth and last layer the benefits will be realized. Possible benefits included the
customers’ satisfaction, the reduction in waste and the improved reliability. All resulted
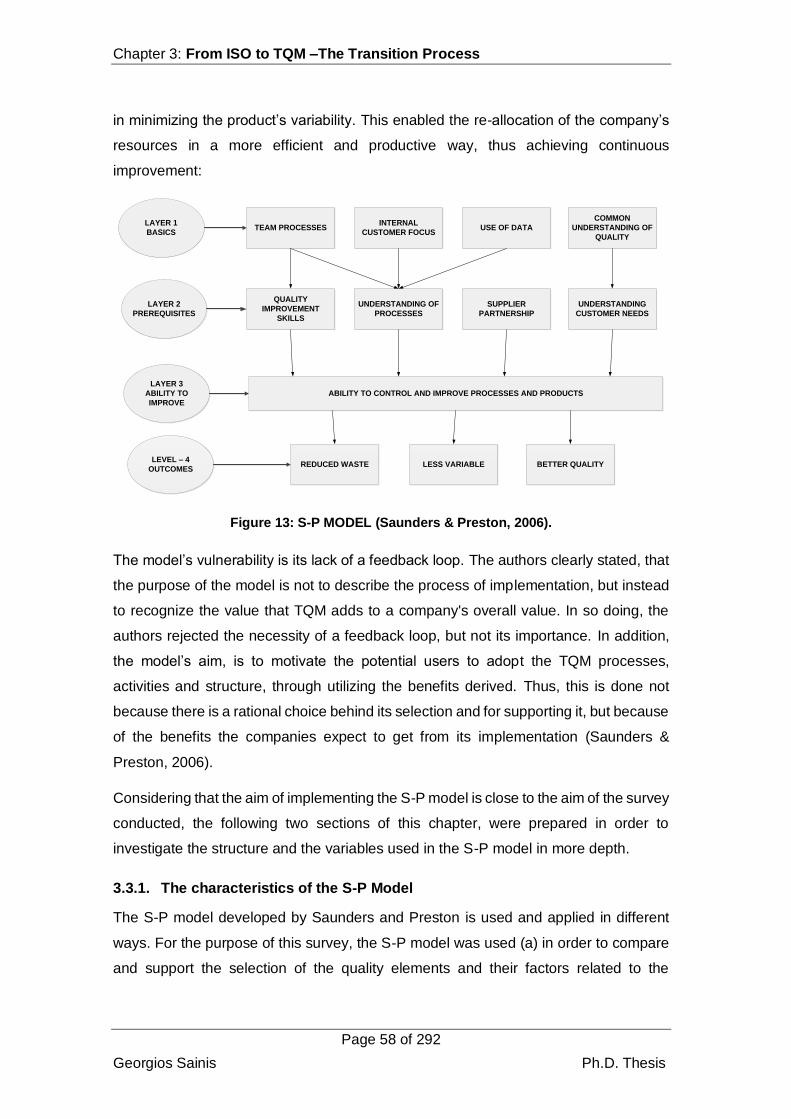
Chapter 3: From ISO to TQM –The Transition Process
Page 58 of 292
Georgios Sainis Ph.D. Thesis
in minimizing the product’s variability. This enabled the re-allocation of the company’s
resources in a more efficient and productive way, thus achieving continuous
improvement:
TEAM PROCESSESINTERNAL
CUSTOMER FOCUSUSE OF DATA
COMMON
UNDERSTANDING OF
QUALITY
ABILITY TO CONTROL AND IMPROVE PROCESSES AND PRODUCTS
QUALITY
IMPROVEMENT
SKILLS
UNDERSTANDING OF
PROCESSES
SUPPLIER
PARTNERSHIP
UNDERSTANDING
CUSTOMER NEEDS
LAYER 1
BASICS
LAYER 2
PREREQUISITES
LAYER 3
ABILITY TO
IMPROVE
LEVEL – 4
OUTCOMESREDUCED WASTE LESS VARIABLE BETTER QUALITY
Figure 13: S-P MODEL (Saunders & Preston, 2006).
The model’s vulnerability is its lack of a feedback loop. The authors clearly stated, that
the purpose of the model is not to describe the process of implementation, but instead
to recognize the value that TQM adds to a company's overall value. In so doing, the
authors rejected the necessity of a feedback loop, but not its importance. In addition,
the model’s aim, is to motivate the potential users to adopt the TQM processes,
activities and structure, through utilizing the benefits derived. Thus, this is done not
because there is a rational choice behind its selection and for supporting it, but because
of the benefits the companies expect to get from its implementation (Saunders &
Preston, 2006).
Considering that the aim of implementing the S-P model is close to the aim of the survey
conducted, the following two sections of this chapter, were prepared in order to
investigate the structure and the variables used in the S-P model in more depth.
3.3.1. The characteristics of the S-P Model
The S-P model developed by Saunders and Preston is used and applied in different
ways. For the purpose of this survey, the S-P model was used (a) in order to compare
and support the selection of the quality elements and their factors related to the

Chapter 3: From ISO to TQM –The Transition Process
Page 59 of 292
Georgios Sainis Ph.D. Thesis
successful implementation of TQM and (b) compare and support the methodology used
in measuring the implementation level of TQM in an SME.
The S-P model was firstly applied to large manufacturing companies, despite the
developers’ belief that the model’s theoretical basis could also be applied to other
industries and to SME in particular. They considered that the model could be used as
an approach to connect the Quality assurance and the TQM.
The S-P model was used in this survey given that the TQM implementation approached
follows a logical sequence in achieving quality assurance for an SME and Saunders
and Preston’s (2006) S-P model, that is not based on a logical dependence approach,
was used as a means of identifying the reasons why implementing TQM does not
always follow the quality assurance accreditation that, as this is mentioned above,
follows a logical sequence.
This observation comes in congruence with the thesis aims and objectives that is to
identify at which stage the Greek ISO certified SME are in regard to the implementation
of TQM. In the case of SME, it is easier for an analyst to recognize and identify the
needs of its external and internal customers, but difficult to assess the availability of the
(financial and non-financial) resources needed for an efficient and effective
implementation of TQM. So, what really matters is that SME managers/owners realize
the importance and the benefits derived from the implementation of TQM. A one-off
investment for granting the quality assurance, would bring in the long run the ongoing
benefits that will also bring financial returns (Saunders & Preston, 2006). The decision
to invest in TQM will be left to the owner(s) of a company and to those who support that
decision and to the SME’s internal and external environment that can support or offer
to it.
The role of the environment in the successful implementation of the S-P model is shown
by Saunders and Preston (2006) in Figure 14. Both the external and the internal
environments that surround the model elements may influence their relationship and
the way they will behave and function.

Chapter 3: From ISO to TQM –The Transition Process
Page 60 of 292
Georgios Sainis Ph.D. Thesis
TEAM PROCESSESINTERNAL
CUSTOMER FOCUSUSE OF DATA
COMMON
UNDERSTANDING OF
QUALITY
ABILITY TO CONTROL AND IMPROVE PROCESSES AND PRODUCTS
QUALITY
IMPROVEMENT
SKILLS
UNDERSTANDING OF
PROCESSES
SUPPLIER
PARTNERSHIPUNDERSTANDING
CUSTOMER NEEDS
REDUCED WASTE LESS VARIABLE BETTER QUALITY
Leadership
Communication Planning
Feedback
National and
International
Economy
Government
RegulationGovernment
Support
Competition
Internal Environment
External Environment
Figure 14: The S-P model and its environment
The elements of the internal environment namely, the type of leadership, the
communication skills, the design of the planning processes and the feedback
developed, should operate efficiently in supporting the implementation of TQM.
Even though the S-P model is designed to identify the logical dependence of each
component to all other components, it does not place much significance on it. For
example, the model implies that different leadership styles may be appropriate for each
different activity. For activities related to the establishment of TQM, a more determined
leadership style should be used, compared to the style required with activities related
to establishing changes in the production. A more authoritarian type of leadership is
needed in the establishment of TQM stage; and more teamwork and participative style
of leadership should be introduced in the subsequent stages. Research has yet to
define the appropriate leadership style needed for each different component (Saunders
& Preston, 2006).
Communication between all the participants operating in the internal and the external
environment is also of paramount importance for the effective implementation of the
model.

Chapter 3: From ISO to TQM –The Transition Process
Page 61 of 292
Georgios Sainis Ph.D. Thesis
The feedback element is what relates the components in the internal environment.
Saunders and Preston (2006) initially insisted that the model was developed not
because they wanted to introduce a logical sequence, but a logical dependence of its
components, so the model did not support looping. In fact, looping is necessary given
that its results could be the growth in the company’s value. This growth and its
equivalent value added, should be explained from the model’s benefits and evident
from its feedback.
Strategic and operational planning that will combine and coordinate each individual
component, is also needed. This will further support the links in the model and make it
function efficiently producing the expected TQM benefits (Saunders & Preston, 2006).
Additionally, the external environment will also contribute to an SME’s ability and desire
to continue with the implementation of TQM. Saunders and Preston (2006) believe that
the external environment is what will influence an SME’s financial and quality
achievements. Specifically, the economic and competitive environment, the cultural
trends and the valid government regulations, will influence the way TQM is adopted
and implemented. For the Greek SME, that are undergoing continuous internal and
external environmental changes, these factors will constitute both an opportunity and a
threat when trying to achieve their quality goals. Assessing and controlling the
components that support the implementation of quality practices, is what will improve
their quality level and what will assist them to reach the TQM level.
3.3.2. The implementation of the S-P model in SME.
In Europe and in Greece, SME are fully supported financially from the state in order to
get the quality assurance certification (ISO Standards). Attaining the quality assurance
cerftication might be the first step towards quality, but what really matters is that it is
not the last.
As Saunders and Preston (2006) stated that quality assurance offers the basic structure
for TQM implementation., but if it is the only approach to quality, the excess
documentation will lead the SME to failure. The need for team processes and common
understanding of quality, is what will enhance quality improvements.
The S-P model’s contribution to that is as the authors’ stated, the “Evaluation of the
success of the efforts of organizations who have attempted to introduce quality
assurance without taking on the full TQM approach would provide evidence for the
validity of these suggestions”.

Chapter 3: From ISO to TQM –The Transition Process
Page 62 of 292
Georgios Sainis Ph.D. Thesis
Using the S-P model as a logical foundation for the TQM implementation in the Greek
SME, the aspects being researched refer to:
Assess the elements that SME implement, if any, as part of the TQM
implementation schedule and
Recognize, the financial benefits derived from this implementation.
Saunders and Preston found that in a number of studies conducted, the researchers
who have tried to identify the level of TQM implementation into ISO certified companies,
encountered difficulties in assessing the degree of the existing quality level. Table 5,
presents a pool of measures, which the authors proposed could be used in order to
overcome difficulties in the assessment process.
Table 5: Measures for assessing TQM components used by the S-P Model
COMPONENT MEASURES
Use of team processes 3.3.1. Number of team activities
3.3.2. Perceived effectiveness of team processes
3.3.3. Outcomes of team activities
Focus on internal customers Awareness of internal customers among staff
Perception of internal customers of quality service received
Common understanding of quality as
satisfying the needs of external
customers
Awareness of concept
Ability to express customer needs
Emphasis on the use of data and
understanding of variation in decision-
making
Extent of training in use of data
Extent of application of data and analysis
Understanding of the impact of variation on decision-making
Evidence of impact of variation on decisions made
Understanding of customer needs Ability to express customer needs in terms of internal activities
and measurements
Understanding of the organization's
processes
Documentation of processes
Awareness and understanding of documentation
Knowledge of undocumented features of processes
Understanding of techniques of
improvement
Training in techniques of improvement
Application of techniques
Ability to improve Understanding of how techniques can be applied to major
processes, with the aim of improvement in customer satisfaction
Evidence of improvements
Ability to meet the needs of the customer Improvements in customer satisfaction measures

Chapter 3: From ISO to TQM –The Transition Process
Page 63 of 292
Georgios Sainis Ph.D. Thesis
COMPONENT MEASURES
Ability to reduce the variability of its
products and services to provide greater
reliability
Evidence of reduced variation and increased reliability
Ability to reduce waste Evidence of reductions in waste
Regarding the financial benefits and their relationships with the model’s components,
the authors expect a longitudinal study to be used and not just a correlation between
them which may not present any causal relationships (Saunders & Preston, 2006).
The characteristics and conclusions derived from the S-P model partially formed the
basis used for selecting the critical factors and the structure of the research conducted
on the Greek, ISO certified SME. It will also contribute in identifying the spread of TQM
applicability, showing the applicability of different TQM factors and functions in an SME.
Finally, it will support the determination of the environmental factors that may influence
and determine the successful implementation of TQM.
3.4. The TQM implementation in SME
The aim of the current study is to elaborate on TQM’s implementation level on SME
which have already introduced quality in their operations by being ISO certified SME.
Ghobadian and Gallear (1997) stated that the intrinsic characteristics and the basic
elements of TQM are more easily and effectively implemented in SME’s rather than in
large organizations. Among those elements are the type of strategy(ies) adopted, the
nature and essence of management leadership, the communication methods, the
content and the extent of training programs, as well as the nature and the extent of
organizational changes adopted. However, it has been found that the unmodified
adoption of the TQM elements from an SME, often produces adverse results.
The sequence with which SME adopted the TQM practices, presented a significant
impact on quality performance and outcomes. Firms that have implemented TQM
programs prior to seeking the ISO certification, demonstrated a higher commitment to
the broader concepts of quality, than the quality certification per se. The way and the
sequence with which the SME approached TQM, also had an impact on the
management practices adopted and the outcomes derived from its implementation.
However this positive impact on the practices and on performance cannot be
undermined, because of the lack of a statistically significant ISO certification. Therefore
it would not be conflicting for a quality company to search for an ISO certification if it is
needed to do so.
Chapter 3: From ISO to TQM –The Transition Process
Page 64 of 292
Georgios Sainis Ph.D. Thesis
Considering that an ISO certification is the starting point for introducing quality to a
company, Quazi and Padibjo (1998) studied the potential that ISO standards have on
SME in Singapore and how these contributed to the continuation of their quality journey.
The main argument was that TQM practices have been designed for application in large
organizations and their application in SME has difficulties. The survey was expected to
help SME identify the degree to which they need consultancy and training support
regarding the TQM implementation. Their main concern was, that the SME have limited
resources. They examined if and under what conditions TQM could be applied as a
philosophy in an SME and whether the method of application would enable it to secure
a competitive advantage. It was concluded, that creating or changing an SME’s
corporate culture to a more quality oriented cultural environment, is more important
than just achieving full commitment to TQM principles. It was also established that
SME, compared to larger companies, need a simple and clear set of directions on what
needs to be done, instead of a general directive for TQM implementation (Sturkenboom
et al., 2001).
Another research conducted by Sohail & Hoong (2003), examined the impact of ISO
certification on an SME’s organizational performance and their perception regarding
TQM practices. ISO certified SME in Malaysia compared with the non-ISO certified
SME, were found to have a clearly different perception regarding the way TQM
implementation is related to the organizational performance. The variable “time” of their
operations was found to have a positive impact on the performance appraisal of the
quality practices implemented. This was also confirmed from the survey conducted by
Prajogo & Brown (2011) who focused on the type of quality management practices
adopted and performance appraisal methods used from SME in Australia.
Leadership’s readiness, is another key element and a prerequisite in developing the
appropriate quality culture for introducing and implementing TQM. To recognize the
need for a change in a SME’s cultural environment, is mostly management’s
responsibility. But if that change is recognized initially from the top management, then
is going to be recognized and understood even easier from all its employees. So, for
an SME, management’s visibility is considered as an opportunity for possible cultural
changes, due to their close interrelationship with all the blue and the white colour
workers. Consequently employees’ resistance to change could be minimized,
considering that managers would inspire their vision for TQM implementation to the

Chapter 3: From ISO to TQM –The Transition Process
Page 65 of 292
Georgios Sainis Ph.D. Thesis
whole organization, setting the appropriate and realistic quality performance goals and
objectives (Ghobadian et al., 1996).
Sousa et all., (2005) ascertained the lack of knowledge on performance measures
when they investigated the level of quality implemented in Portuguese SME. The
misalignment between the strategy followed and the criteria used in measuring and
evaluating their performance, revealed that lack of knowledge. This was also supported
from the recognized need for management and employee teams-training regarding
measurement tools. This shortage of knowledge explains why for SME individualized
solutions should be used instead of implemented TQM practices.
One of the objectives of an SME’s management team is to achieve customer’s
satisfaction. To accomplish this, there is need to develop a long term strategic plan.
The length of time required for the adoption of a TQM program, significantly enhances
the strength of the relationship between quality management elements and quality
performance evaluation that supports the customer’s satisfaction. This supports the
notion that TQM implementation requires a long term vision and investment, in order to
be accomplished and why it should not simply be considered as a “quick fix” tool
(Ghobadian and Gallear 1994).
The SME that have already implemented the ISO standards and are willing to continue
their journey towards quality, need to choose between a “tailor made” approach and /
or a “do it yourself” approach. Their choice though, would have a direct effect on its
implementation cost. Newall, Dale (1991) and Oakland (1993) proved in their survey
that this incremental cost would be related to the cost of the resources used.
Temtime et. al (2002) conducted a survey on the Ethiopian SME, with the aim of
examining the relationship between TQM perception and TQM Planning, based on the
following ten variables related to SME planning behaviour:
Formal mission statements
Market research
Industry analysis
Long term goal setting
Environmental scanning
Planning manuals
Forecasting
Short term goals
Operational efficiency
Functional budgets
Chapter 3: From ISO to TQM –The Transition Process
Page 66 of 292
Georgios Sainis Ph.D. Thesis
Eight out of the ten variables selected, were considered as more influential in the
implementation of TQM. Yosuf & Aspinwall (2000) identified equivalent factors in their
study, the most important of which were:
Managerial leadership and commitment
Customer Satisfaction
Continuous Improvement
Employee Empowerment and Involvement
Supplier Partnership
Quality Culture and Philosophy
Resources and working environment
Measurement and feedback
Temtime (2003) investigated the relationship between the TQM implementation
practices as being part of an SME’s strategic planning process. The dimensions of a
strategic planning model examined were: the Planning environment, the Planning
process and formality, the Planning content and the horizon of planning; as well as the
Planning resources and support. The analysis of the data showed that SME placed
greater emphasis on the operational plans and not as much on the strategic ones. They
also paid greater attention to the informal and intuitional planning activities, making the
process of implementing TQM a challenging task. With the development of a cultural
environment that will support the development of a business plan, SME have the
opportunity to implement TQM effectively and gain a competitive advantage.
Having considered that every economic system has its own cultural rules, Sousa et al.
(2005) examined the relationship between an SME’s corporate culture and the TQM
implementation level The study focused on the cultural environment existing in
Portuguese SME and examined the companies readiness and resource availability
while executing the necessary actions for implementing a quality system.
In addition, the level of knowledge and understanding of the performance measures
and performance measurement tools, were examined in relation to the degree of quality
adoption by an SME. The results of the research indicated, that since quality tools,
when they are effectively applied, provide some degree of integration between the
external requirements and the internal activities performed, they offer an SME the
chance to gain the necessary knowledge and understanding of all the performance
measures needed for measuring the quality and in particular the level of TQM
implementation (Gregory, 1993).
Chapter 3: From ISO to TQM –The Transition Process
Page 67 of 292
Georgios Sainis Ph.D. Thesis
Since, differences in the approach and in the quality criteria used, determine the
success or failure of implementing TQM, PrajogoI & Brown (2006) tried to identify the
possible differences that occur from using different approaches and pinpoint the impact
they have when introducing the TQM philosophy to a company’s organizational
performance.
It is true that the level of commitment to an objective is what makes the difference. The
possibility of realizing organizational differences between a highly committed to quality
SME and a less committed SME was studied by Abdullah (2010). His research
examined those TQM elements that significantly contributed to the business
effectiveness of the Malaysian SME and highlighted the relevant benefits derived
through TQM implementation, in the context of the Malaysian Economy. Quality control
and quality assurance processes, together with the full integration of the TQM elements
in all its operating systems and strategic plan, will enable an SME to improve its
effectiveness and efficiency, resulting in improvements in customer’s satisfaction,
applied operating processes and cultural environment.
As mentioned above, a company’s size plays a role for TQM implementation.
Ghobadian and Gallear (1997) in their effort to explore the structural differences
between large organizations and SME, used secondary data to analyse the relationship
between the inherent characteristics of TQM and the size of an organization. They
conducted four different case studies, aimed at the development of a special model for
the implementation of TQM, suitable for SME. Among other things, their study
identified, that the reasons for introducing TQM were related to the internal and external
sources for collecting TQM data; the Perceived TQM concepts; and the way TQM was
related to the company’s strategy. The data were collected from 47 international
organizations renowned and recognized for their attention to quality issues. Factor and
cluster analysis was used and a multivariate (ANOVA) analysis of the data collected,
showed that there were no significant differences between SME and large
organizations with respect to all the selected factors. The relevance of the research
questions developed, was also explored, with another survey using secondary resource
data. A case study approach was also used, given that it allows the researcher to
conduct a full and detailed contextual analysis of the issue examined. Four exploratory
case studies were conducted; two in large organizations and another two in SME. No
categorization in service and manufacturing sector companies was made, as the
researchers claimed that the spread of cases in such different companies offered a

Chapter 3: From ISO to TQM –The Transition Process
Page 68 of 292
Georgios Sainis Ph.D. Thesis
reasonable balance. The development of TQM in each company, the impact of its
implementation on the resulting structural changes, and the difficulties encountered in
its implementation and operation, were used as measurement criteria to examine the
returned responses. Differences relating to the SME structural, procedural and
behavioural level, as well as the process, human resources management and type of
business contact level were identified. The advantages and disadvantages of large
organizations and SME were also acknowledged.
From the analysis of the results, it was found that the management style, the
achievement style, the self-actualization and the affiliated style; were considered to be
the most important factors, as these were related to the management approach and to
the culture of the organization.
The results also indicated, that the characteristics of TQM implemented in an SME’s
internal environment, can at the same time act as a major obstacle. Such an obstacle
could be the leadership’s readiness to deal with the needed behavioural modifications
and the fine tuning in their management style. This key concept in setting the
appropriate business culture for TQM advancement, together with the shortage of
resources in an SME is of crucial importance during the process of adopting the
behaviour and practices needed from the TQM philosophy. The valuable conclusion
derived from their survey was that certain basic concepts of TQM can be applicable to
SME. These are presented in table 3.: (Ghobadian & Gallear, 1997).
Table 6: TQM concepts for SME
The type of strategies adopted.
The nature and substance of management leadership.
The communication methods.
The content and the extent of training programs.
The nature and the extent of the organizational changes.
The need to diffuse the TQM philosophy within an SME supports the TQM
implementation. The key factors for that diffusion were the “recognition” of the ten
“salient” steps that were necessary for the successful implementation of TQM. The ten
salient steps were identified from the Ghobadian’s and Gallear’s (1996) and are
depicted in the following table (Table 4):

Chapter 3: From ISO to TQM –The Transition Process
Page 69 of 292
Georgios Sainis Ph.D. Thesis
Table 7: The ten Salient Steps for TQM implementation
1. Recognition of the need for the introduction of TQM
2. Developing understanding among management and supervisors
3. Establishing goals and objectives of the quality improvement
process
4. Plan the TQM implementation
5. Educate and train all employees
6. Create a systematic procedure (i.e. implement BS5750).
7. Align organization
8. Implement the TQM concepts
9. Monitor the implementation of TQM concepts
10. Engage in continuous improvement by going back to step 3
Due to an SME’s limited resources, “Time” was considered among the factors that may
impede the first step, called the “recognition step”, thus inhibiting the progress of the
TQM concept. This step is usually carried out through a formal and recognized scheme
of leaders as the TQM philosophy guru’s state. But formality from SME can be
bypassed from the moment all the initiatives for TQM implementation and the efforts
made can be easily seen and interpreted by almost everyone within the company. This
initiative will be instantly brought out from isolation, motivating and empowering
employees’ and give higher credibility to the quality model implemented.
On the contrary, the “Management visibility” factor, was not considered a problem for
TQM implementation in an SME. It was considered as being easier to attain due to the
characteristics of an SME’s operational environment. Another factor the “Resistance to
change by employees”, was found more prominent in large organizations than in SME,
in which it did little to effect the progress of the TQM implementation process. The level
of communicating the company’s aims and objectives appeared to be crucial for TQM
acceptance. For large organizations this was a significantly more complex process than
it was for the SME. Also, setting unrealistic goals and objectives in a TQM program
could demotivate the employees and cause delays in the process or even prevent it
from starting. The education and training of employees is also considered vital, as it
augments the level of commitment to TQM principles. Such occasions could easily arise
within an SME’s environment, because of its workforces’ closeness (Ghobadian &
Gallear, 1997).
To identify the type and the kind of quality management practices applied in an SME,
Quazi and Padibjo (1998) conducted a pilot study on Singaporean SME. Open-ended

Chapter 3: From ISO to TQM –The Transition Process
Page 70 of 292
Georgios Sainis Ph.D. Thesis
questions were given to the interviewees regarding the quality management practices
implemented in their SME.
The questions were grouped into different themes relating to:
Management’s view on TQM
Benefits and barriers of ISO certification
Role of Singapore Government in promoting quality management practices
From the seven randomly selected companies examined, the authors identified the
barriers from the ISO certification which held back the correct implementation of TQM.
These barriers were the lack of full commitment and participation of top management,
the lack of financial and human resources, the limited time available for TQM
implementation, the perceived employee resistance, the non-perceived advantage of
certification in the service industry; and the proper training and education of employees.
Similar results were also derived from other studies, like those conducted by R. Calingo
Luis (1995) on Singaporean companies and from Henricks (1992) and Haksever (1953)
on US companies. The researchers also identified a number of benefits derived from
the ISO certification from the same sample. These included increase in customers’
preferences, improved company quality image and improved competitiveness in the
market. Other benefits realized were, compliance to customers’ requirements, the
modernization of procedures and documentation, the increased consciousness for
preventive and corrective actions, and the provision of a foundation in searching for
TQM. R. Calingo Luis’s (1995) survey significantly contributed to the above findings, as
it identified similar benefits to the Singaporean companies. However, in his survey the
encouragement of teamwork was also added as an extra benefit.
Studies such as those by Simons and Kerr (1993) and Ghobadian and Gallear.
(1997).have identified that the compliance to the requirements stipulated by large
customers (i.e. multinational corporations) is the main reason for getting an ISO
certification. Other researchers such as Quazi & Padibjo (1998) have supported that
the establishment of the ISO certification is an act, solely applied and used as a
marketing tool that has the role of a stepping stone towards TQM implementation .
Government plays a supportive role in initiating total quality in the economic and social
environment. Progression from ISO certification to TQM, requires not only full
commitment from the company’s management, but also an external environment
capable and willing to support and reinforce the quality acceptance and adaptation. To
achieve that, government can only externally offer guidance in developing or at least
Chapter 3: From ISO to TQM –The Transition Process
Page 71 of 292
Georgios Sainis Ph.D. Thesis
motivating the outsourced development of an entity, that will bring progress beyond the
ISO certification (Kluse, 2009).
Sturkenboom & Brown (2001) recognized that there are significant structural
differences between SME and large organizations. These differences are likely to
influence the relevance, the planning and the implementation of the TQM concepts.
They have argued however, that despite those differences the TQM concept could be
used and successfully applied by SME with considerable success. Their work was
based on the observation they made that SME have an inherent inability to utilize formal
techniques in evaluating their quality management system. Appealing to literature they
suggested, that the majority of SME tend to adopt an externally imposed approach to
TQM. In other words, an approach that is not internally driven and does not
continuously improve. Their proposal was to construct a self-assessment instrument
suitable for SME. The instrument which would be used as a practical evaluation device
would have the following characteristics:
not be too complex
give direction for what has to be done
focus on action instead of scoring
support the company in implementing the key elements of the quality
management concept
Having selected four small-medium-sized enterprises, operating in the Netherlands the
authors examined the acceptability and the usefulness of the two dimensional
instruments (questionnaires) they developed. They also considered it important to test
the understanding of the terminology used and its practical application on the SME
owners.
During the interviews conducted with quality and general managers, the following
dimensions were evaluated:
The level of maturity (Levels: 1.capacity- 2.activity- 3.process- 4.system-
5.organization), and
The key elements of quality (which were kept to three, so as to maintain the
simplicity of the instrument for SME). The elements selected were: 1.customer
focus- 2.participation and teamwork- 3.continuous improvement (Wilkes, 1998).
The combination of the three key elements with the five maturity levels, gave a matrix
of 15 cells.

Chapter 3: From ISO to TQM –The Transition Process
Page 72 of 292
Georgios Sainis Ph.D. Thesis
However, it should be specified that the three key elements of quality management
were developed into three matrices.
1. One for customer focus
2. One for participation and teamwork and
3. One for continuous improvement.
The content of the three matrices, described what should be done and which activities
the company should focus on, in order to continue its quality journey.
The matrices proposed could also be used in detecting which elements already exist in
the company and to identify the equally important subsequent actions for implementing
TQM. This way, the journey towards quality would progress with a balanced
development of the issues and activities included in all three matrices.
Conditions or issues that may potentially arise during the implementation of quality and
their causes, would require immediate attention. Caution should also be given to the
relationship among the issues and the activities involved in case they would form a
holistic (Total) quality management philosophy.
Temtime et al., (2002) conducted a study on 57 SME in Addis Ababa, Ethiopia, with the
objective of analyzing the perception of SME regarding the TQM elements and
practices established. From their survey it was found that the planning behaviour of
SME in Ethiopia had a strong relationship with TQM practices. The sample consisted
of companies representing the manufacturing, merchandising and service industries.
They were divided into 39 small and 18 medium sized companies based on the number
of their employees. A further categorization into strategic planners and operational
planners was also developed, based on their response to ten selected strategic
indicators. These indicators, were the formal Mission statements, the Market research,
the Industry analysis, the Long term goal setting, the Environmental scanning, the
Planning manuals, the Forecasting, the Short term goals, the Operational efficiency,
and the Functional budgets.
Yusof and Aspinwall (2000) considered all indicators as “critical” in their survey. Given
their results, they advised the SME in the developing countries and economies to
implement TQM practices only after having developed a formal Strategic plan, so as to
avoid making the mistake that their counterparts in the western economies made. They
proposed that TQM implementation activities be case specific, aligned with the
company’s strategic objectives and able to be intergraded into them and not

Chapter 3: From ISO to TQM –The Transition Process
Page 73 of 292
Georgios Sainis Ph.D. Thesis
fragmented. TQM should be viewed as a journey requiring a long term commitment and
continuous search for improving an SME’s products, services and processes (Shari
Mohd. Yusof & Aspinwall, 2001).
A similar survey was conducted on micro and small sized enterprises in the Republic
of Botswana (Temtime and Pansiri, 2006). That survey revealed that the strategic
planners were much more benefited from quality than the operational planners. From
incorporating the quality elements into their strategic plan, they managed to support the
TQM practices following a systematic thinking and approach. Their results also
indicated, that an appropriate cultural environment is needed to support the TQM
implementation in an SME. Quazi & Padibjo (1998) arrived to the same conclusion from
the results of their research.
As a quality award winner, a company can lay claim to having successfully implemented
business excellence and TQM. Abdullah’s (2010) qualitative survey, explored how the
TQM perception and practices differ between quality award winners and non-quality
award winners among SME that are functioning in Malaysia. His research, revealed
that quality award winners differ from non-quality award winners. The first consider that
senior management has an important role in strategy formation and are more active in
quality practices implementation. This confirms the important role that top management
has in conceptualizing the need for change in quality and, the significance of leadership
in the diffusion of the TQM culture within an SME (Ghobadian and Gallear, 1994). Many
researchers have identified leadership, corporate planning, human resource
development, customer focus, supplier focus, information management, process
management and quality assurance; as being the key areas of intervention within an
organization and part of a TQM program implemented in an SME.
While researching the critical factors needed for implementing TQM, and identifying the
ones which characterise an SME, Lewis, et al., (2006) managed to identify a set of
critical success factors, which in congruence with the quality management principles,
could determine the success of TQM as a quality management system applied in SME.
They categorized those factors into “soft” and “hard”. The “soft” factors also considered
as long-term factors, included leadership, human resource management, suppliers’
relations and customer focus. These factors were of a particular interest to SME, since
they were established to sustain a company’s continuous growth. The soft factors are
also dependent on the characteristics of the entrepreneur(s) and the cultural behaviour
of the employees (Dennehy, 1995). They “hard” factors were defined as the tools and
Chapter 3: From ISO to TQM –The Transition Process
Page 74 of 292
Georgios Sainis Ph.D. Thesis
the systems that support the implementation of the “soft” factors. The value of the
survey mainly came from the consolidation of all the recent views regarding the criteria
used in determining the success or the failure of implementing TQM in an SME, and
connecting those to the “soft” and the “hard” factors of TQM. A number of links between
quality management principles and compliance requirements of the most commonly
used quality assurance standards (i.e. the ISO 9000 series) were also revealed (Black
and Porter, 1996; Oakland and Beardmore, 1995; Quazi and Padibjo, 1998). In the
following section a more in depth analysis of the TQM critical success factors used in
different quality models is presented.
3.5. Critical success factors for TQM implementation in SME
Adopting and fully implementing a quality model such as the NBNQA and EFQM is the
best way to achieve total quality. But the shortcomings of these models indicate that
they are developed in order to serve large companies and not SME’s. The shortcomings
are mainly related to their implementation cost and the fact that they don’t focus on the
specific financial and operational needs of an SME. A quality model suitable for an SME
should be simple, systematic, easily understood, outlined and able to provide a tool for
planning TQM’s implementation (Dandekar et al., 2012).
To develop such a model, an SME would have to identify and measure the critical
success factors (financial and Non-financial) influencing the successful implementation
of TQM, so as to determine its current quality level or its current maturity level. It will
also have to identify and assess the basic quality elements needed, the barriers that
impede TQM implementation and the areas that can been trusted in an SME. From the
comparison of various quality models, an SME will manage to select and adopt the
model which best fits its specific needs and requirements (Dandekar et al., 2012).
The term “critical factor” was also used from Motwani (2001). As Critical success factors
are defined the areas that an organization should attain in order to achieve its goals
and objective. Those factors should be categorized and tested in terms of their impact
on the aims and objectives achievement (Salaheldin, 2009). Motwani, considered as
“critical” the processes being composed from a set of fundamental capabilities. He
considered that excellence in quality should be based on the manufacturing processes.
These should be placed in priority order and organized in such a way so they can be
easily and reliably implemented. He also stated that all critical factors should account
for the size of the company.

Chapter 3: From ISO to TQM –The Transition Process
Page 75 of 292
Georgios Sainis Ph.D. Thesis
In Table 8 and Table 9, a set of selected and applicable critical success factors used in
different surveys from different researchers are illustrated. All of them were used in
determining the maturity level of TQM in different sized companies and SME in
particular..
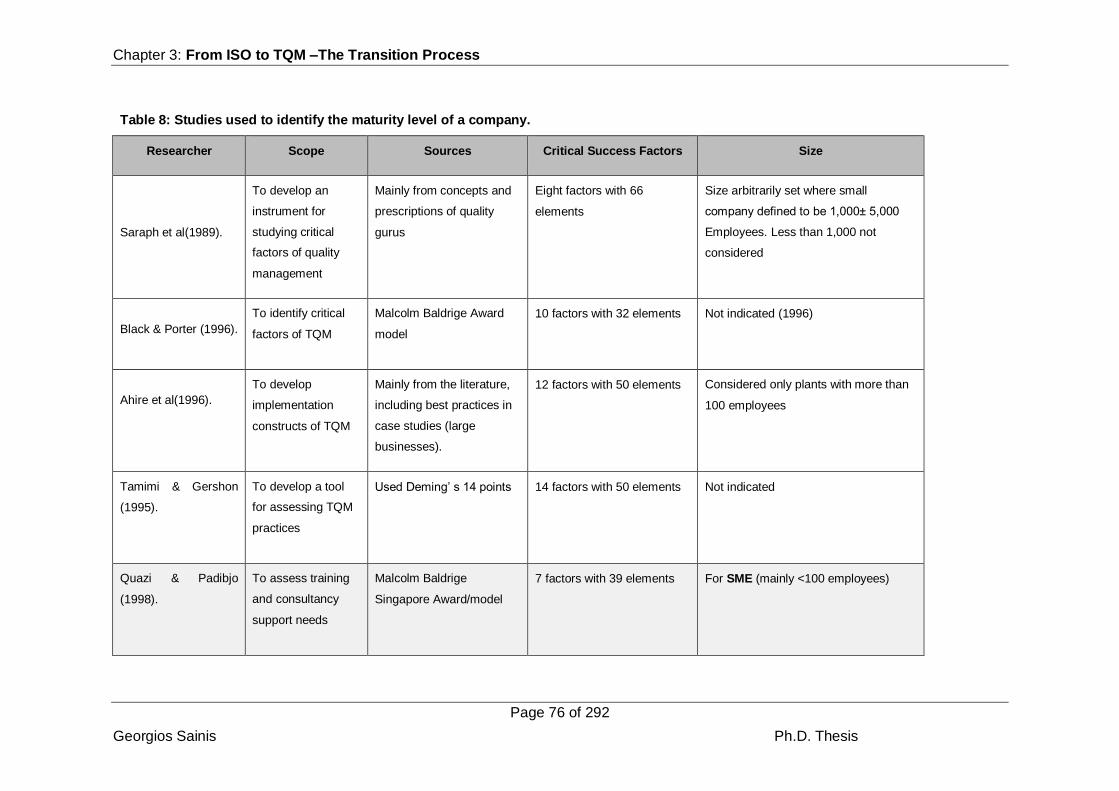
Chapter 3: From ISO to TQM –The Transition Process
Page 76 of 292
Georgios Sainis Ph.D. Thesis
Table 8: Studies used to identify the maturity level of a company.
Researcher Scope Sources Critical Success Factors Size
Saraph et al(1989).
To develop an
instrument for
studying critical
factors of quality
management
Mainly from concepts and
prescriptions of quality
gurus
Eight factors with 66
elements
Size arbitrarily set where small
company defined to be 1,000± 5,000
Employees. Less than 1,000 not
considered
Black & Porter (1996).
To identify critical
factors of TQM
Malcolm Baldrige Award
model
10 factors with 32 elements
Not indicated (1996)
Ahire et al(1996).
To develop
implementation
constructs of TQM
Mainly from the literature,
including best practices in
case studies (large
businesses).
12 factors with 50 elements
Considered only plants with more than
100 employees
Tamimi & Gershon
(1995).
To develop a tool
for assessing TQM
practices
Used Deming’ s 14 points
14 factors with 50 elements Not indicated
Quazi & Padibjo
(1998).
To assess training
and consultancy
support needs
Malcolm Baldrige
Singapore Award/model
7 factors with 39 elements
For SME (mainly <100 employees)

Chapter 3: From ISO to TQM –The Transition Process
Page 77 of 292
Georgios Sainis Ph.D. Thesis
Table 9: Critical Success Factors for TQM implementation
Generic Critical Factors
Saraph et al ( 1989) Ahire et al(1996) Black and Porter (1996) Yusof & Aspinwall (1999)
Management leadership
Role of divisional Top management and quality policy
Top management commitment Corporate quality culture Strategic quality management
Management Leadership
Organization Role of quality department
Teamwork structure Continues improvement system
Education and training
Training Employee training Education and Training
Quality and design Product/ service design Design quality management External interface management
Quality and suppliers
Supplier quality management
Supplier quality management Supplier partnership Supplier quality management
Quality in process Process management/ operating procedures
Operational quality planning Systems and processes
Fact-based management
Quality data and reporting
Internal quality information usage
Quality improvement measurement systems Communication of improvement information
Measurement and feedback
Human resource management
Employee relations Employee involvement Employee empowerment
People and customer management
Human resource management
Customer focus Customer focus Customer satisfaction orientation
Tools and techniques
Benchmarking
SPC USAGE
Product quality (output construct)
Supplier performance (output construct)
Improvement tools and techniques
Resources
Work environment and culture
8 factors with 66 elements
12 factors with 50 elements 10 factors with 32 elements
10 factors with 58 elements

Chapter 3: From ISO to TQM –The Transition Process
Page 78 of 292
Georgios Sainis Ph.D. Thesis
In an attempt to focus more on the critical success factors that have been specifically
identified and assigned to SME, Dandekar (2012) proposed the following set as being
the most suitable for TQM implementation:
..to realize customers’ needs
..to satisfy customers’ needs
..to clearly understand quality
..to adopt team processes
..to recognize and understand the processes adopted
..to concentrate on internal customers
..to give attention and importance to data use
..to conceptualize the techniques used for improvement
..to develop methods and techniques in reducing variability
..to enlarge the company’s ability to perform
..to enlarge and enrich supplier relationships
..to reduce waste
Dandekar (2012) noted that in order to successfully measure and control these CSF’s a
company should have a “continuous improvement” environment. However a “continuous
improvement” environment exists only if the company has developed the appropriate
cultural climate that will allow this concept to flourish. He proposed that a company
should start with the planning process, follow with the education and the training and
finish with a trial run of the process that will also determine its effectiveness. Adopting
revisions and subsequent improvements, standardizing the crucial ones, should also be
part of an SME’s quality practices and in the sequence of actions, in the TQM
implementation process.
Hunt (1993) proposed a set of variables to be used in identifying the level of quality
implementation in an SME. Table 10 presents all four variables he identified and the
corresponding critical success factors.

Chapter 3: From ISO to TQM –The Transition Process
Page 79 of 292
Georgios Sainis Ph.D. Thesis
Table 10: TQM Variables (Hunt, 1993).
Variables Critical Success Factors Variables Critical Success Factors
Quality culture Strategic focus Quality
processes(Cont.)
People-oriented Input
Awareness of strategic challenge Track Progress
Vision for the future Measurement
Innovation Feedback
Quality Policy/Philosophy Evaluation
Value systems/ ethics Results
Leadership &
Management
Top Management Involvement Awards
Visible Commitment to Goals Personnel Evaluation
Role in Quality Improvement
process
Quality tools and
Techniques
Assessments
Concern for improvement Definition of Tools
Systems/ Structure for Quality
Improvement
Measurement / Process
Analysis
Work Force Awareness of Productivity/ Quality
issues
Awareness / Communication
Attitudes/ Morale Organizational Development
Cooperation Performance Appraisal Work Flow/ Delays
Involvement Waste
Perceptions of work environment Tools/ Equipment
Social Interactions Staffing
Task Characteristics Facilities
Consequential constraints Training
Customer Orientation Supplies/ Parts
Communication Organization/ Group
Structure
Quality processes Job Analysis Customer Quality Survey
Higher Authority Quantity
Quality Emphasis Reliability
Top Management Leadership
Customer/ Service Activities
Define Improvements
Unit Goals
Organizational Goals
Quality Planning
Planning Strategy
Organizational Streamlining
Investment/ Appropriate
Technology
Methods/ Process Improvement
New Ideas
Chapter 3: From ISO to TQM –The Transition Process
Page 80 of 292
Georgios Sainis Ph.D. Thesis
Assigning different instead of equal weights to each critical factor in the TQM evaluation
process, will make an SME use a multi criteria decision analysis (MCDA) model. This
model is supported from the analytical hierarchy process (AHP) tool developed by T.
Saaty in the year 1971 (Huang et al., 2009). The AHP process technique, try’s to
measure the practical implications that the critical success factors (tangible and
intangible) have on the TQM implementation process.
According to Yusof and Aspinwall (1999) in the TQM implementation process you should
not blindly select quality criteria as Critical Success Factors (CSFs) because not all
quality criteria are critical factors. The selection of the critical factors should be made in
accordance with the circumstances and/ or practices that each SME has adopted. CSF’s
are sensitive to their behaviour and critical in the success of the TQM implementation.
Sensitive, for an SME means that it needs more attention. Sensitive areas for an SME
are the ones that realize lack in their resources (financial, human, and technical). So,
they all need attention on the factors that are or may influence them. Other sensitive
(critical) factors are, the management of leadership, employee’s commitment and
support; suppliers’ quality management; employee’s relations, and training and
education. The preceding factors, together with the working and cultural environment
which for an SME incorporates factors like the values, the attitudes, the behaviour, the
teamwork and the involvement of all its stakeholders (Yusof & Aspinwall, 1999).;are also
important and critical resources for the successful implementation of TQM.
Recent surveys conducted from various researchers have identified and used different
critical factors in measuring the TQM implementation in an SME. Kaplande et al., (2013)
added more critical factors in their proposed model. They grouped them into three
different sub-factors, presented in Table 11.
From those, only three, namely the understanding of customer’s needs, the common
understanding of quality and the use of team processing, were considered crucial. The
need to conceptually understand them first and then implement them supports the idea
that TQM acts as a philosophy within an SME. Is not treated as simply being a technique
that can or may improve its performance (Kalpande et al., 2013).

Chapter 3: From ISO to TQM –The Transition Process
Page 81 of 292
Georgios Sainis Ph.D. Thesis
Table 11: Critical Factors and Sub factors
Factor Use of
Team
Process
(TP)
Focus on
Internal
customer
s
(FI)
Emphasi
s on the
Use of
Data.
(UD)
Common
Understan
ding of
Quality.
(UQ)
Underst
anding
of
Custom
er
Needs.
(CN)
Supplier
Partnershi
p.
(SP)
Understa
nding of
the
Organiza
tional
Process.
(OP)
Understandin
g of the
Techniques
of
Improvement
s
(TI)
Sub
factor
Number
of team
activities
(NT).
Staff
aware of
the
concept
of
Internal
customer
(CI).
Employe
es
trained in
use of
data
(ED).
Staff,
aware of
the
concept of
Quality
(CQ).
Ability to
express
custome
r Needs
(EC).
Help
renders to
Suppliers
(HS).
Processe
s
documen
ted (PD).
Application of
various
Techniques
(AT).
Effectiven
ess of
team
process
(ET).
Quality
service
received
from
internal
supplier
(QI).
Applicati
on of data
(AD).
Understan
d and
express
customers’
needs
(UC).
Budget
spent on
identifyin
g
custome
r needs
(BC).
Suppliers
continued
(SC).
Awarene
ss about
the
organizat
ional
process
and
documen
tation
(AP).
Training in
use of
various
techniques
(TT).
Outcome
s of team
activities
(OT).
Awarene
ss
programs
conducte
d for
internal
customer
(AI).
Evidence
of impact
of
variation
on
decision
made
(ID).
Training
programs
conducted
for
understand
ing of
quality
(TQ).
Training
program
s
conduct
ed to
understa
nding of
custome
r needs
(TC).
Seminar
organized
(SO).
Undocu
mented
features
of the
processe
s (UF).
Staff trained
for new
techniques
(ST).
Source: (Kalpande et al., 2013).
Given that the SME environment has become even more complex in recent years, the
need to increase the number of critical factors that influence their performance, has
become imperative. From the aforementioned, the “AHP method” proposed by Saaty
(cited by Yurdakul, 2002) is a method for ranking a set of criteria according to how critical
they are to a decision.. Such a decision could be the successful implementation of TQM

Chapter 3: From ISO to TQM –The Transition Process
Page 82 of 292
Georgios Sainis Ph.D. Thesis
to an SME. The AHP method, is also the basis for the development of the S-P model. ,
The S-P model which was extensively discussed in section 3.3, was used to identify the
attitudes and activities that were critical for the successful implementation of TQM in an
SME. The model’s special characteristic, is its ability to identify the degree of applicability
of the TQM elements in an SME and the fact that it pays special attention to the
environmental issues that may influence the successful implementation of TQM.
3.6 Concluding Remarks
Considering that ISO is the first step in introducing a quality system to a company and to
an SME in particular, the next steps include successfully implementing TQM. A thorough
review of the literature regarding all the different models which have been developed for
facilitating this transition process were thoroughly presented. The TQM philosophy was
examined as a way of implementing it to an SME. The TQM implementation process
suitable for SME was analysed in more detail and all the requirements and difficulties
that arise due to their size and their limited resources were presented. Different models
using different critical success factors for implementing quality and TQM to SME were
also examined. Particular emphasis was placed explicit on the analysis of the S-P model,
which indicates the most effective and efficient variables used for the successful
implementation of TQM in an SME. All the factors that could determine the success or
failure as well as the components and the measures used for the successful
implementation of TQM in an SME were also presented. The factors proposed from all
the referred authors that come in congruence with the factors used in the S-P model can
determine with reliability and accuracy the transition of the Greek ISO certified SME to
the TQM level. The following Chapter, presents how an SME’s financial performance is
influenced through the introduction of quality and TQM. Additionally, the role of the Greek
SME in the Greek and European Economy will be analysed, and their financial and
quality status will be presented.

Georgios Sainis Ph.D. Thesis
Chapter 4: SME & Financial Performance – The Greek Crisis
Page 83 of 292
Georgios Sainis Ph.D. Thesis
Chapter 4. SME & Financial Performance – The Greek
Crisis
4.1. Introduction to Chapter 4
Considering that ISO is the first step in introducing a quality system to a company and
to an SME in particular, the next steps include successfully implementing TQM. A
thorough review of the literature regarding all the different models which have been
developed for facilitating this transition process were thoroughly presented. The TQM
philosophy was examined as a way of implementing it in an SME. The TQM
implementation process suitable for SME was analysed in more detail and all the
requirements and difficulties that arise due to their size and their limited resources
were presented. Different models using different critical success factors for
implementing quality and TQM to SME were also examined. Particular emphasis was
placed on the analysis of the S-P model, which indicates the most effective and
efficient variables used for the successful implementation of TQM in an SME. All the
factors that could determine the success or failure as well as the components and the
measures used for the successful implementation of TQM in an SME were also
presented. In this chapter, how an SME’s financial performance is influenced through
the introduction of quality and TQM is shown. Additionally, the role of the Greek SME
in the Greek and European Economy will be analysed, and their financial and quality
status will be presented.
Quality is considered a means of achieving higher long term profitability and an
increase in a company’s market share (Shahin 2011). Chapter 4 examines whether
implementing quality could be used by SME in less than optimum conditions and more
specifically by SME operating within the Greek economy, during the economic crisis.
To illustrate this, the present chapter, has been separated into six different sections
including the introduction (Section 4.1). Section 4.2, depicts the role of Greek SME in
the European and Greek economy, while section 4.3, presents how SME can respond
to threats and capitalize on opportunities. Section 4.4 illustrates how implementing
TQM can be used by SME as a means of coping with crisis conditions. Research
regarding the effects of quality on SME financial performance is also presented.
Section 4.5 further elaborates on the latter concept with the introduction of the ratio
analysis and the presentation of different methodological approaches (models) which
attempt to separate SME into groups based on financial criteria. Special emphasis is

Chapter 4: SME & Financial Performance – The Greek Crisis
Page 84 of 292
Georgios Sainis Ph.D. Thesis
placed on Altman’s Z-score and the calculation of financial distress levels. Section 4.6
acts as a summary of the information presented throughout this chapter
4.2. The SME in the European and Greek Economy
Greek SME, in the year 2011 have produced the largest added value from all other
SME in the European Union. Though, their numerical reduction and the on average
significantly lower productivity rate was recognized compared to their counterparts in
all other European countries (SBA, 2012).
From Table 12, it is evident that Greek SME focus mostly on trade and on
manufacturing. They also possess a much lower market share compared to that of the
European SME.
Table 12: Greek VS European SME
EUROPEAN UNION GREECE
Trade Sector 30% 38%
Services Sector 45% 40%
Construction 13% 7%
Manufacturing 21% 22%
Market Share 33% 18% (SBA, 2013).
Table 13 and Table 14, demonstrate the number of SME operating in Greece, the
number of their employees and their added value in the Greek economy, for the
years 2014 and 2015.
Table 13: SME in Greece - Basic figures (2014)
Number of enterprises Number of persons employed Value added
Greece EU-28 Greece EU-28 Greece EU-28
Number Share Share Number Share Share Billion€ Share Share
Micro 629 811 96.2 % 92.4 % 1 130 794 55.2 % 29.1 % 16 33.1 % 21.6 %
Small 21 669 3.3 % 6.4 % 398 503 19.5 % 20.6 % 11 22.5 % 18.2 %
Medium 2 464 0.4 % 1.0 % 227 832 11.1 % 17.2 % 8 16.5 % 18.3%
SME 653 944 99.9 % 99.8 % 1 757 129 85.8 % 66.9 % 34 72.1 % 58.1 %
Large 423 0.1 % 0.2 % 290 547 14.2 % 33.1 % 13 27.9 % 41.9 %
Total 654 367 100.0 % 100.0 % 2 047 676 100.0 % 100.0 % 48 100.0 % 100.0 %
(SBA, 2015).
Table 14: SME in Greece – Basic figures (2015)
Number of enterprises Number of persons employed Value added
Greece EU-28 Greece EU-28 Greece EU-28
Number Share Share Number Share Share Billion
€
Share Share
Micro 669 773 96.7 % 92.7 % 1 225 566 58.7 % 29.2 % 18 37.4 % 21.1 %
Small 20 058 2.9 % 6.1 % 361 207 17.3 % 20.4 % 10 20.9 % 18.2 %
Medium 2 455 0.4 % 1.0 % 228 692 10.9 % 17.3 % 8 16.6 % 18.5 %
SME 692 286 99.9 % 99.8 % 1 815 465 86.9 % 66.9 % 37 74.8 % 57.8 %

Chapter 4: SME & Financial Performance – The Greek Crisis
Page 85 of 292
Georgios Sainis Ph.D. Thesis
Large 400 0.1 % 0.2 % 273 587 13.1 % 33.1 % 12 25.2 % 42.2 %
Total 692 686 100.0% 100.0 % 2 089 052 100.0 % 100.0 % 49 100.0 % 100.0 %
(SBA, 2015).
From the tables above, it is apparent that the Greek SME experienced continuous
increase in their number and in their added value. In 2015, their value added (74.8%)
is significantly larger than the average European added value (57.8%).
Table 15, which depicts the Greek SME sector ,shows that after the tremendous
decrease in their number (-27.04%) in the period 2012-13, a tremendous increase
(23.14%) occurred in the period 2013-14, followed by a smaller increase (5.86%) in
the period 2014-15.
Their employment rates and added value, experienced similar fluctuations. Greece as
a member of the European Union is obligated to follow the rules and the regulations
imposed by the European commission. The role that SME have in the European Union
impacts the development of the SME in Greece. Since 2000 the European commission
imposed a number of measures that have tried to support the SME both financially and
non-financially. Indicative tools used for that purpose include the Lisbon strategy, the
Europe 2020 strategy; the European initiative for SME in Europe (SBA) and many
others. The most important, is the SBA (Small Business Act) program which is
comprised of a set of policies and measures, suitable aimed at assisting each member
State and its SME to develop those strategies that will support their development
(Hellenic Chamber of Commerce, 2014).
The SBA’s basic achievement was to improve the financial position of SME within the
European economy, through politically supporting them and streamlining the policies
No of Enterprises Employment Value Added
SMEs -27.04% -28.60% -27.66%
Large -5.26% -26.22% -25.00%
No of Enterprises Employment Value Added
SMEs 23.14% 23.15% 0.00%
Large 11.90% 13.76% -13.33%
No of Enterprises Employment Value Added
SMEs 5.86% 3.32% 8.82%
Large -5.44% -5.84% -7.69%
2012-2013
2013-2014
2014-2015
Table 15: The Greek SME Sector (% changes)

Chapter 4: SME & Financial Performance – The Greek Crisis
Page 86 of 292
Georgios Sainis Ph.D. Thesis
for all members. The problem with this program was that not all its principles supported
the needs of SME efficiently. Figure 15 delineates the results of this deficiency which
in turn reduced or stunted SME performance and progress averages in different
management fields (entrepreneurship, Responsive administration).
The SBA program consists of many policies, including the “think small first” policy
which requires that all legislations, administrative rules and procedures be simple and
suitable for SME right from the beginning. The “entrepreneurial activity” principle, refers
to the opportunities individuals have to start their own business. It is believed, that the
shortage of available opportunities for new entrepreneurs, is the reason why this
activity (becoming an entrepreneur) is regarded as valuable for all members in the
European Union. The “second chance” principle, refers to the opportunity offered to
individuals who didn’t manage to maintain their business under the crisis conditions.
3.0
-12%
-3.0Performance
Variation from the EU average (in standard deviations: EU Average=0)
Pro
gre
ss
ov
er
tim
e(C
om
po
un
d A
nn
ua
l G
row
th r
ate
20
08-2
01
5)
Low PerformanceDeterioration
High PerformanceDeterioration
Low PerformanceProgress
High PerformanceProgress
12%
1. Enterpreneurship
2. Second Chance
3. Responsive
Administration
4. State aid & Public
procurement
5. Access to finance
6. Single market
7. Skills and innovation
8. Environment
9.Internalisation 1
2
3
4
5
6
7
8
9
Figure 15: SBA - Performance of Greece (Period: 2008-2015).
The “responsive administration” addresses the inability of the Greek public
administration to support SME operations. The bureaucracy and the lack of
coordination between different public administration authorities, inhibit the
development of new and innovative entrepreneurial activities. The continuously
changing legislation worsens the problem. The survey “Aid and Public Procurement”,
refers to SME performance in relation to other European SME. More than 50% of
Greek SME are in agreements with the public sector, which delays payments (up to
four times more than average) which in turn reduces the level of liquidity for the majority

Chapter 4: SME & Financial Performance – The Greek Crisis
Page 87 of 292
Georgios Sainis Ph.D. Thesis
of SME. Access to financial aid is very difficult for Greek companies and for SME in
particular as all sources of new funds like loans, venture capital and cash flow funds,
have been restricted, The “single market” policy refers to the ability of the Greek
companies and Greece as a whole, to share goods, services and policies with all other
European companies or members of the EU. Greece has been improved by this policy,
considering that it adopts single market legislations from all other members, and
passes them as Greek national laws. However trade rates are still very low. For the
“skills and innovation” and the “environmental” policies, the country’s response was
promising and in line with all other European members. Though, improvements still
need to be made. A number of programs like the “Green Business 2010”, the “Green
Infrastructure” and the “Green Tourism” launched in 2010, improved the environmental
culture in all SME. The last and most important policy is the “internationalization policy”.
The inability of Greek SME to export, is due to the extended periods of time required
to complete the process. In fact, it takes an additional one third more time than it takes
any other member in the EU, placing Greece behind all other countries. A set of laws
introduced in 2011 improved the situation slightly, but more actions need to be initiated
(SBA, 2015).
To support the European SME, the European Commission developed the SBA policy
and its sub-policies, divided into three axes. The first axis, deals with issues related to
the business environment, and the second with the structure and the support of the
entrepreneurships as a means of developing a sustainable business environment. The
third axis, as the most important for the SME development deals with the division of its
policies and regulations into sub groups. Each group is related to insurance,
infrastructure and fund raising access issues. Each group is independent and does not
affect or influence the others.
The EU’s annual report in 2013 clearly shows that all SME experience lower liquidity
levels and higher unemployment rates. The only exception is the high technology
sector which has managed better under crisis conditions. As a result, SME have
slightly increased the adding value to the Greek economy (72.1%, 74.8%, 75.1% in
the years 2014, 2015 and 2016). The ability of a country to implement the SBA’s
measures and policies more efficiently depends on how it will manage to support the
continuation of the operations performed by its SME. This is something that Greek
Government and the official authorities still haven’t managed to achieve completely
(Hellenic Chamber of Commerce, 2014).

Chapter 4: SME & Financial Performance – The Greek Crisis
Page 88 of 292
Georgios Sainis Ph.D. Thesis
For almost eight years Greece has battled the consequences of the economic crisis.
Its SME are trying to endure the austerity measures imposed from the Central
European Bank and the IMF (International Monetary Fund) (i.e. Tax increase, wage
and pension decreases) but are facing problems related to the nature of the business
environment they operate in. The problems they face are mostly related to the market’s
low liquidity and the high credit risk (Inability to offer loans). This lead to them attaining
a negative deviation from what the other members of the European Union show, in
areas such as the SBA’s fund adaptation, the areas of entrepreneurship, the public
administration, the financing, the skills and innovation, and the internationalization
(Hellenic Chamber of Commerce, 2014).
SME performance in Europe during the period 2008-2015 was considered “adequate”,
compared to the large sized companies which have been influenced the most from the
economic crisis. The decline for SME begun in 2012, and was accompanied by a loss
of 610,000 jobs, and a decrease of 1.3% in GDP. Greece is currently one of the most
vulnerable European member states. Greek SME have reduced in number, and have
incurred changes in their value and the number of people they employ at a higher rate
than almost any other member state. In the year 2012, two years before the crisis
consequences begin, the large companies lost almost 8.6 billion of their value,
compared to SME that lost specifically, from the medium SME a total of 17 billion, from
the micro SME 14 billion and from the micro SME the 13.2 billion Euros in value
(Hellenic Chamber of Commerce, 2014).
(Hellenic Chamber of Commerce, 2014).
Figure 16: EU (27). Average and respective data of Greece concerning the SME 2010-2013
The changes in added value and the number of employees working in Greek SME for
the period 2010-2013 are shown in . All values indicate a larger decline compared to
the equivalent changes in the values of the remaining EU states
Chapter 4: SME & Financial Performance – The Greek Crisis
Page 89 of 292
Georgios Sainis Ph.D. Thesis
The economic crisis, has been influenced mainly by the European domestic demand,
a key element for SME growth. The large companies benefited from that increase and
their performance improved especially in the exports market. Signs of recovery for the
SME were also evident.. Specifically in the high tech and manufacturing sectors,
growth rates indicate the creation of 0.5 million new net jobs for the period 2008-2012
(Hellenic Chamber of Commerce, 2014).
Greek SME, make up 85% of private employment in the Greek economy, 50% of which
mainly comes from the micro SME. In the construction sector, SME suffered the
biggest decline in employment rates during the period 2010-2013. Their value added
also declined due to the reduction of public contracts, which were handled in their
majority by the larger companies. Up to that time, a large number of public contracts
were assigned to SME. The majority of public projects are now focused on
environmental, energy, waste and recycling processing and characterised as large
investment projects which demand large contractors. This leaves no room for SME
which can only focus on the private sector which started to decline in the year 2009 as
this was also mentioned in the Hellenic Chamber of Commerce report (2014).
The austerity measures imposed on the Greek economy by the IMF, resulted in tax
increases and reductions in the level of wages and pensions, which directly affected
all economic sectors, but mostly the sectors of construction and manufacturing. The
consumers’ purchasing power was directly influenced, increasing the financial burden
and the SME obligations towards third parties. In addition, the inability of the banking
sector to support the SME’s funding needs, influenced the trade sector. Starting in the
year 2008, heavy losses were incurred, when approximately 130,000 SME declared
bankruptcy, because of their inability to meet their immediate obligations. (Hellenic
Chamber of Commerce, 2014).
The European commission proposed the development of a National policy that would
support the development of SME in Greece. That policy would intervene in three main
areas for SME: the strategic policy-planning, the long term infrastructure planning, the
enforcement and monitoring of policies and the development of specific measures per
thematic area. Regarding strategic policy planning, the proposal from the European
commission, was to implement a long term policy that would support SME operation
in a healthy, competitive and friendly environment. The second area of intervention,
would be implemented due to the complete lack of principles and measures capable
of supporting the implementation of a strategic objective. Thus, the proposal referred

Chapter 4: SME & Financial Performance – The Greek Crisis
Page 90 of 292
Georgios Sainis Ph.D. Thesis
to all the components that would develop a long term SME policy infrastructure. This
policy would support (a) the enforcement of SBA and (b) the strengthening of the SME
envoy institution, tasked with promoting SME interests, and acting as a key
intermediary between the commission and the national representatives that contribute
to the SBA’s assessments and report development. It would also support the (c)
implementation of an SME test, comprised of four stages that measures the impact of
any new legislation. The first stage of that test, called the consultation stage, would
include the SME bodies. Following is the SME evaluation stage that would examine all
possible influences from new legislation and the measurement stage which would
measure the impact on SME. Finally, the use of these measures would be appropriate
as a means of mitigating the legislation impact on SME (Hellenic Chamber of
Commerce, 2014).
The policy measures were also categorized per thematic area. Three were the
thematic axes developed and eleven the thematic areas assigned to each axis, as is
shown in Table 16. All were then integrated into the SBA program.
Table 16: Thematic Axis and Areas. (Hellenic Chamber of Commerce, 2014)
Axis A: Business
Environment Issues
Axis B: Business Development
and support issues
Axis C: Other SME Policy
Issues
Taxation Advisory Structures Insurance
Competition Innovation structures Infrastructure
Bureaucracy Clustering structures Access to Finance
Education / Training
Structures supporting
internationalization
A European commission study (2014), presents possible problems related to the
thematic axes that would influence the Greek economy.
Regarding Axis A’, Greece is the member with the highest VAT rates than any other
European Union member. It is also the country that over the past years has
implemented approximately eleven changes in its VAT rates. This constitutes one of
the most serious problems related to the increase in the country’s operational and
production costs. In addition, self-employed workers and SME employers are excluded
from the right to be tax exempted. From the 1/1/2015 and under a new tax law, which
will definitely influence all the investments undertaken by businesses. Regarding
competition, it is known that in Greece, the black market, significantly reduces the

Chapter 4: SME & Financial Performance – The Greek Crisis
Page 91 of 292
Georgios Sainis Ph.D. Thesis
public revenues as it influences commercial business and tradesmen. This
phenomenon is also supported by the lack of control in pricing, specifically in intra-
group transactions and in the triangular trade. Both frequently lead to the development
of oligopolistic markets. Though, the commercial rentals were not reduced in
proportion to the reduction in the wages and the pensions. This further increased the
costs for an SME, making the recession in Greece even more severe and extensive.
From a survey conducted by the Hellenic Confederation of Professionals, Craftsmen
& Merchants (GSEVEE-2014), it was found that wholesaling has the highest
concentration of SME competition and retailing has the lowest. That tendency
developed the expectation, that over time, SME would increase in size and reduce in
number. The ones that manage to survive will be able to face the strong competition.
Bureaucracy is another nuisance for the Greek economy that greatly impacts the SBA
structure and development. Bureaucracy causes a number of problems for SME that
are trying to recover from the crisis, like the time-consuming licensing procedures, the
lack of information, the uncertainty of the land use and value across the country,
Axe B’, is related to the structure that supports entrepreneurship. The key feature of
an entrepreneurship in a developed economy, is “the development of an innovative
entrepreneurial activity that emphasizes the high value added element” (Hellenic
Chamber of Commerce, 2014). Innovation, clusters and highly qualified personnel, is
what will produce high quality products and services capable of appealing to European
and international markets. But for SME given their size, their available resources
features and skills, this cannot be easily obtained. Thus, the need to support their
existing structure, is what will help them develop a revised set of key features and
business activities.
In the area of innovation and value added decisions, Greece displays the worst image.
Businesses, especially young entrepreneurships operating under crisis conditions, are
not in a position to invest in any counselling. The restructuring of their operational
planning could result in irrational decisions that would have direct consequences on
their future. The development of clusters that “contribute to the creation of a better
business environment by enhancing collaboration and networking” can contribute to
the development of innovative products and services that would support their survival.
Though, clusters are against the Greek entrepreneurial culture, though they could
support their operations with a counselling configuration that may be the only available

Chapter 4: SME & Financial Performance – The Greek Crisis
Page 92 of 292
Georgios Sainis Ph.D. Thesis
option they have as this was also pointed out and in the Hellenic Chamber of
Commerce report (2014).
One of the major goals of the SBA program in to introduce innovativeness. Efficiency
and sustainability are the two key features that will enable an SME to be innovative.
Research and development is what will bring innovativeness to an SME. It can take
place either within business operations and/ or through the Educational processing
that will transfer innovativeness into the business operations. Greece in Europe is
ranked third out of four, regarding innovativeness and holds the lowest rank in the
Global competitiveness list. The reason for that is that SME, and more specifically
micro SME, are not capable of developing strategic tools that will contribute to the
development of new and improved products. This inability results in the loss of a
number of opportunities. Opportunities that in order to be utilized they need from the
SME to be strategically structured in order to emerge any innovative ideas into their
production process. Consequently those innovative ideas could open new
opportunities for the development of new innovative financing tools. Tools that would
help SME find the necessary funds they need for research and development. This
would help them keep their innovative character longer (Hellenic Chamber of
Commerce, 2014).
Employing and maintaining highly skilled personnel, is of paramount importance in all
companies and for SME in particular. One of the reasons contributing to Greece’s’
failing economy and the poor economic performance of Greek SME compared to their
counterparts in the rest of Europe, is their failure to realize how ongoing professional
training can reduce unemployment rates (SBA fact sheet, 2013). From the
entrepreneurs’ perspective it should be viewed as a productive investment and from
the individual/ employee perspective as a personal development plan. Instead,
entrepreneurs don’t offer their employees any incentives, such as job protection or/and
enhancement or even a remuneration increase in order to motivate them (SBA, 2014).
Recognition however of the institutionally acknowledged benefits from both sides,
would inspire the necessary motivation for learning and training which is otherwise
totally absent (SBA, 2014).
One of the goals of the SBA is to strengthen and support the close collaboration
between small and large enterprises. This collaboration would internationalize the
SME and increase their opportunities for growth and expansion. It also tries to promote
and support homogenization and standardization in the inner market (EU) giving

Chapter 4: SME & Financial Performance – The Greek Crisis
Page 93 of 292
Georgios Sainis Ph.D. Thesis
emphasis to patents and trademarks. The most serious problem Greece is currently
facing, is its trade deficit (imports are by far larger than exports). The European
commission motivates and requires that all member states develop their markets inside
and outside Europe. However, the incentives for developing cooperation with
International and other European markets for trading Greek products, do not seem to
exist. The result of the general elections that took place in 2015 and the reduced
support from the European Enterprise networks, is worrisome and the risks associated
with the survival of Greek companies have increased.
The insurance sector which is not included in the SBA policy, is another sector with a
deteriorated financial position. A large number of businesses have closed down and
the entrepreneurships that are still operating, face serious difficulties in fulfilling their
insurance obligations. The social insurance organizations, i.e. the Social Insurance
Organisation of Freelance Professionals (OAEE), the Engineers' and Public
Contractors' Pension Fund (TSMEDE), the Medical Profession Pension and Insurance
Fund (TSAY) and the Ancillary Insurance Fund for Retail Store Employees (TEAIEK),
and the insurance system as a whole, lost a tremendous number of funds leading it to
its collapse.
The infrastructure, meaning Greece’s Technology, Communication and Transport
sectors are crucial. . Even though the SBA policy does not refer to them, they are still
important for the sustainability and growth of all SME. In Greece, internet is still a cheap
resource and the use of e-invoicing services still remain relatively low cost. So, their
use could improve the efficiency of the Greek SME in trading. Tourism, supported from
a number of SME, remains a valuable sector in the Greek economy, making the
transport infrastructure requirements and needs even more important and valuable for
its growth (SBA, 2014).
The SBA’s proposal to the EU member states, is to allow SME access to new funds
through risk capital, micro-credit and mezzanine financing. It also proposes the
development of a legal and business environment that will facilitate the timely
occurrence of all commercial transactions (Greek SME need to wait 104 days until
customers pay them, compared to all other European SME which wait 52 days).
The main source for financing for Greek SME’s is Bank financing. The total number
and value of the bank loans offered to corporations was reduced by 5.3% from March
2013 to March 2014. Their cost has been increased by 2% and the cost of bankruptcy
(financial distress) remained at high levels.

Chapter 4: SME & Financial Performance – The Greek Crisis
Page 94 of 292
Georgios Sainis Ph.D. Thesis
According to the SBA report of 2013, 34% of the Greek SME that submitted an
application for a loan, were rejected in comparison to the 27% average rejection rate
for EU SME. Given that banks usually request real estate as collateral from loan
applicants (L/T borrowing) and that since 2008 the Greek real estate sector has lost
about 35% of its value, borrowing costs have increased. Also, the non-performing
loans (named: RED-Loans) offered to the Greek SME in 2013, exceeded the 35% of
the total amount of loans offered. This rate was increased in 2014 and 2015. Though,
and for the performing loans better and long term payments have been assigned..
Consequently the lending Banks had to bear the risk of a loan default, which lead to
denying many SME additional financing. It is important to note that since April 2014,
Greece has borrowed an additional amount of 62 billion Euros and simultaneously
incurred a decrease of 76.5 billion in bank deposits (from 2009 till 2014).
Ultimately, the main and only source of funding for the Greek SME was the EU
structural funds or the European funds, which the Government will invest in energy,
innovation, commercial and Industrial cooperation projects. This fact significantly
reduces the available opportunities for the Greek SME (Hellenic Chamber of
Commerce, 2014).
4.3. Crisis Conditions for SME.
Seeger et al., (1998) stated that three components characterise a crisis: the threat the
surprise and the limited decision time that management has in order to respond to the
situation. Given that a strategic plan, deals with a company’s short term future, it deals
with its short term threats, opportunities, weaknesses and strengths, which are
characterised from economic, financial and social crisis components. What relates a
strategic plan with the crisis management is that the first, deals with opportunities,
while the second deals with threats. But threats can potentially become opportunities
(Vargo & Seville, 2011).
SME focus mainly on the development of a short term strategic plan, as the crisis
conditions make their long term projections more risky. Developing a strategic plan
with a long term horizon is necessary, albeit it is not easy and may not be correct and
valid from the beginning. To cope with the continuously changing conditions, SME
leaders should inspire. They need to develop a supportive organizational culture
capable of reinforcing innovation and the development of a disciplinary plan. This plan
should incorporate a structured decision process and an adequate set of feedback
loops. In addition to that, the use of teamwork and the existence of individuals capable

Chapter 4: SME & Financial Performance – The Greek Crisis
Page 95 of 292
Georgios Sainis Ph.D. Thesis
of relating information and identifying patterns are needed. All of the above, will make
SME capable of projecting possible changes and incorporating them into their strategic
and quality plan.
SME operate in an economic environment where organizations and new technologies
need to be closely related. Their inability to incorporate new technologies into their
operations, could create a domino effect that could negatively influence other factors
in the economy, such as social and/or cultural factors. (Vargo & Seville, 2011).
Introducing new technologies supported from high quality into their operations, will not
only give them higher protection, but will also give incentives to sustain their growth.
SME that face strong economic, social and cultural uncertainties due to their
continuously changing environment, can respond by either trying to survive or become
more flexible. Flexibility as stated by Seville (2009) is the ability of a company to thrive
under difficult and continuous changing conditions. “Thrive” actions should be
incorporated into a company’s strategic plan and not simply be part of the crisis
management actions (Vargo & Seville, 2011).
Seeger et al., (1998) noted that corporations and SME in particular, are susceptible to
threats, unexpected events and have limited time to deal with changes. To face these
conditions, companies should utilize crisis management which attempts to utilize the
available resources and reform a company’s organizational structure, by responding
to the new conditions in an effective way. Under crisis conditions any new opportunities
that will appear should be evaluated. The strategic planning in the crisis management
discipline should include all the concepts that will identify and analyse those
opportunities and decide on the actions taken (Vargo & Seville, 2011).
The analysis of Strengths, Weaknesses, Opportunities and Threats (S.W.O.T) is the
part of a strategic plan that will guide the decisions and subsequent future actions
towards the development of process plans, the restructuring of required resources and
the eradication of arising weaknesses and threats. Proactive seeking, leadership,
culture, decision making and situation awareness, are the key elements that literature
designates according to Vargo (2011), for assessing the effectiveness of a strategic
plan The aim of introducing a quality plan into a strategic plan, is to support the
optimum development of all the required process plans. With those process plans, the
company will manage to achieve the most reliable restructuring of its resources and
will support any proactive actions needed. Those new process plans will help develop

Chapter 4: SME & Financial Performance – The Greek Crisis
Page 96 of 292
Georgios Sainis Ph.D. Thesis
a new leadership style that will enable the development of a cultural environment
geared towards “excellence”.
Some scholars maintain that strategic planning and crisis management are similar,
because they both examine the environmental conditions, the stakeholders position,
the top management’s involvement and effectiveness (Preble, 1997). They also both
identify the key risk factors that determine the level of the plan’s implementation. What
makes them differ is that the first (strategic planning) focuses on opportunities and how
to thrive, while crisis management focuses on threats and how to survive. Being able
to thrive, depends on a company’s ability to develop a plan that incorporates actions
related to crisis (short term) and non-crisis (long term) decisions. Having that is, a plan
to impose control over the processes under both occasions (S/T and L/T) and take
actions depending on the seriousness and importance of the threat, which if left
unresolved may prevent a company from formulating and implementing its strategic
plan. Quality and TQM, may be the key element for protecting a company from such
an occasion. Introducing crisis elements into a company’s strategic plan can
substantially increase the availability of new opportunities if and when crisis conditions
emerge (Vargo & Seville, 2011).
Mitroff (1988), Smith (1990), Alesch et al., (2001) and Berman et al., (1997) have
recognized that in order to survive under crisis conditions an SME, needs to develop
a reliable and accurate plan. that would take into account its growth rate and revenue.
The more decentralized the companies are, the more they will allow the use of a more
structured decision making processes. The more structures the processes has the
more opportunities will be to cope with unstable and unpredictable environmental crisis
conditions. The use of working teams will allow a swift response to the fast changing
conditions. This will be achieved from integrating the strategic decisions with the
tactical plans as Bourgeous and Eisenhardt (1988) have noted. They also found that
being fast, is related with the amount of information processed and the number of the
alternatives examined. These will eventually lead the company’s manager (s) to make
correct and accurate decisions. The contribution of TQM to the fastness of the data
processing and alternative evaluation supports the accuracy and the efficiency of the
results derived.
Mitroff (1988) suggested that in order for SME to face unexpected environmental
changes they need to be prepared beforehand. Being prepared means being in
coordination and sharing information with the team members responsible for dealing

Chapter 4: SME & Financial Performance – The Greek Crisis
Page 97 of 292
Georgios Sainis Ph.D. Thesis
with crisis conditions. Introducing a quality plan that supports the TQM elements and
practises will further support the coordination and sharing of those team members..
This will offer homogeneity and a unique pattern to the SME’s behaviour.
Crisis conditions can have a direct effect on the implementation of the originally
designed strategic plan. Burnett (1998) notes that integrating crisis management
techniques into a strategic plan, is important for a company that wants to overcome
those crisis conditions. The effectiveness of the applied techniques however, depends
on the time it took to implement them. When faced with a threat, there is need for
immediate action but time is required in order to organise and implement that action. .
In addition, the control processes related to a crisis condition, may overlap due to the
threat’s magnitude and severity.
Burnett (1998) noted that a company operating in a crisis, may face seven different
types of opportunities. These could be: (a) the development of heroes (b) the changes
being accelerated (c) the concealed problems that may appear (d) the people’s
behaviour that may change (e) the new strategies that may be developed (f) the
warning systems that need to be developed and (g) the competitive threats that may
appear. Having incorporated all the possible opportunities mentioned above into the
company’s strategic plan, and developing the appropriate strategies to support them,
the SME can obtain an advantage and potentially turn a crisis condition into an
opportunity.
But, strategic decisions taken under crisis conditions sometimes create
inconsistencies. For example, decisions taken in such a condition are made quickly
and not after careful consideration, thus may be made without all the necessary
information and without considering the level of riskiness of each alternative. Another
inconsistency could be to have a very strong team with a strong decision maker as a
leader. This strong team and leader should also pose a clear understanding of the
mission and company goals, familiarisation with the processes of operation and
capability of exchanging all the available information. From those operational
processes, new opportunities could be revealed and determine the way they should
be handled. Another inconsistency considered is to be exposed to risky decisions that
need to be carefully implemented (Bourgeouis & Eisenhardt, 1988; Vargo & Seville,
2011; Regan, 2000).
Leadership is important when faced with a crisis condition. Cammock (2001).,
proposed that a leader needs to envision, to engage and to enact in order to handle

Chapter 4: SME & Financial Performance – The Greek Crisis
Page 98 of 292
Georgios Sainis Ph.D. Thesis
crisis conditions. For that, an organization’s culture included in a company’s strategic
plan, should be adjusted in order to face the crisis conditions. That is to change the
company’s attitudes, values and behaviour in order to face crisis conditions. Heifetz
(1994) identified that what is actually needed is the willingness of employees to see an
SME’s problem(s) as they would their own. This is not so difficult to achieve, given that
the small number of people employed in SME fosters the development of close
relationships and camaraderie with owner(s) and manager(s).
Alesch et al., (2001) have stated that the accuracy of an SME’s strategic plan, is related
to the actions it undertakes under crisis conditions and how these determine the
possibility of its survival. That was also supported from Berman’s study (Berman et al.,
1997) who identified that the planning process is positively related to an SME’s income
growth.
SME are far more exposed to risky conditions than large companies. This is because
of their limited resources that influence their interconnectivity with their cooperation’s
and technology exchanges. Contrarily SME’s competitive advantage is their ability to
adapt in a continuously changing environment characterised from, crisis conditions
that differ in their significance. (Regan, 2000). All quality elements implemented to an
SME is what would support the adoption of information technology that in turn would
improve further its operational and consequently its financial performance
(Widyaningrum, et.al., 2017).
4.4. TQM implementation level and financial performance
Extensive research has been conducted regarding the use and the benefits of
implementing TQM in all sized companies. The willingness of the Greek ISO SME to
continue their quality journey and the readiness of the large organizations to set quality
as their primary corporate objective, proves that companies operating in all sectors,
from construction, merchandising, servicing to public sectors, have achieved various
benefits from implementing quality and TQM in particular, including higher product
quality, increased efficiency and improved business performance.
Companies who managed to show a remarkable performance were also awarded
excellence awards such as the US Malcolm Baldrige National Quality Award and
others. Those companies were also questioned if they have performed better and in
the areas of profitability, market share, productivity, efficiency, solvency, as well as in
quality costs and in employee relations (Saunders & Preston, 2006).

Chapter 4: SME & Financial Performance – The Greek Crisis
Page 99 of 292
Georgios Sainis Ph.D. Thesis
TQM and its contribution to operational and financial performance are accepted from
both the industry and entrepreneurs as a means of adding value to a company.
However, TQM’s relationship with a company’s overall improved financial performance
has not been verified yet. Researchers have tried to prove this relationship, using
different financial performance measures (i.e. ROA, ROE, profit margin). They
attempted to identify possible deficiencies in the way that financial and quality data
were statistically processed and correlated and pinpoint the consequences from TQM
implementation in a company’s overall financial performance (Wayhan & Balderson,
2007). Their analysis indicated that the market tends to find ways to improve its quality.
Companies operating in this market view these improvements as a means of adding
value through improving their financial performance (Hendricks & Singhal, 2000).
As SME’s consider ISO as an investment, they implement it initially as a means of
improving, their operational performance. The required new funds for such an
investment, should be compared with the expected returns and the evaluation of the
company’s overall rate of growth and its profitability. The expected rate of return of that
investment would further support management’s decision to accept and further
implement quality in the SME’s operations (Tsekouras et al., 2002).
Using the return on assets ratio, that is the EBITA (Earnings before Interest Taxes and
Amortization) over rate as a criterion on an ISO certified SME’s total Assets, to
measure its financial performance and after comparing it with an non ISO certified SME
, Aba et al., (2016) in their study revealed that the first performed better than the
second. A possible explanation for that was the ability of the first to establish a more
thorough management system that managed to better utilize the SME limited
resources (Pantouvakis & Dimas, 2010).
The survey by Santos et al., (2011) showed that the SME manufacturing companies
managed to recover their investment in ISO certification, in a much shorter period than
the servicing companies. The reason for that was it took the servicing companies, an
extended period of time to implement the ISO standards in order to receive their
certification. This seems to indicate that companies for which the ISO certification is a
prerequisite to remain in business, like in the manufacturing sector, an immediate and
more effective implementation of the quality standards is achieved. However it was
also found that after the companies were granted the ISO certification, the level of their
financial performance remained either constant or in many cases deteriorated. This
Chapter 4: SME & Financial Performance – The Greek Crisis
Page 100 of 292
Georgios Sainis Ph.D. Thesis
was due to the fact that the costs incurred to keep the system functional, were larger
that the financial benefits derived from its use (Aba et al., 2016).
Hendricks and Singhal (1996) were among the first to examine TQM implementation
in relation to a company’s financial performance. Using a conceptual level of analysis
and not a dimensional, they empirically tested the relationship between a company’s
level of TQM implementation, with its financial performance. To examine the level of
TQM implementation, they focused on companies that were quality award winners. In
order to determine the rate of their financial performance, they used their market value
determined from their equivalent stock prices. The evaluation process took place
before and after the date the award was granted. The results, showed that the smaller
sized companies and the companies that had received the award from an independent
organization (i.e. Baldrige Award) performed better. This result was an indication that
for SME there was a higher possibility of achieving better financial results through the
implementation of quality and TQM.
Another study, conducted by the same researchers, using the same parameters but
different sample size, produced the same results but at a higher level (Hendricks and
Singhal, 1997). From their analysis, it was clear that the different data bases can
produce ‘dramatic’ differences in the sample size, something which they hadn’t
addressed (Wayhan and Balderson, 2007). The methodology they used was an event
study and the data used was annual, not daily as in their initial study. Specifically, the
data collected, came for a ten year period and the financial variables included income,
sales and cost based measures. The results derived showed that the effective
implementation of TQM has a strong impact on a company’s operating-based
measures, a modest impact on the revenue-based measures and a weak impact on
the cost-based measures. The results derived emphasized the operational character
of TQM even more. However this trend was altered in recent years, when cultural
issues were also found to affect TQM implementation.
The TQM elements influencing a company’s financial performance were also
examined in a survey conducted by Easton and Jarrell (1998). The researchers used
a methodology based on an interview-research approach and fourteen financial
performance measures in their analysis, which were related to the Industry, the market
size and the leverage (debt to equity) rate. It was concluded that the performance
improvements achieved due to the implementation of TQM, were more long-term.
However it was also found that the more mature the level of TQM implementation was,

Chapter 4: SME & Financial Performance – The Greek Crisis
Page 101 of 292
Georgios Sainis Ph.D. Thesis
the better were the financial results derived for both the short and the long term periods
examined (Easton and Jarrell, 1999).
A study conducted by Herzallah et al., (2014) proved the indirect relationship between
the TQM practices and the SME’s financial performance. The main factor influencing
that relationship, was the competitive/ differentiation strategies developed by the SME.
Those strategies were shown to have a direct and significantly positive relationship
with the hard elements of TQM, more specifically an SME’s cost leadership strategy
and because of that to its financial performance. However, an indirect relationship was
found to exist between the soft and hard TQM elements. This explains why the
relationship between the SME differentiation strategy and their financial performance
was found to be weak. (Herzallah et al., 2014; Hendricks & Singhal, 2001; Douglas &
Judge, 2001). The characteristics of the SME that were examined in this survey, were
close to the characteristics of the Greek SME. They were mostly family-owned
companies which focused more on profits and less on customer’s satisfaction.
As York (2004) states, companies that have adopted the TQM practices are the ones
that have also received awards (i.e. Baldrige or state awards). For them in order to get
the award they should present, among others, and an improved financial performance.
This implies that these companies have already improved their financial performance.
His research recognized the successful implementation of TQM (award), but did not
examine the cause(s) that lead to their improved financial performance. For that
purpose, the research’s conclusion supports the controversy that is the relationship
between the two variables; the TQM and the financial performance. York’s survey, also
clearly established that the TQM companies show a long-term pattern of improved
financial performance in an array of financial performance measurements.
Table 17, presents the information and the variables used from a number of empirical
studies and researchers, in order to compare TQM implementation and financial
performance.

Chapter 4: SME & Financial Performance – The Greek Crisis
Page 102 of 292
Georgios Sainis Ph.D. Thesis
Table 17: Empirical Studies on TQM and Financial Performance (York & Miree, 2004).
Dimension Hendricks & Singhal (1997).
Easton and Jarrel (1998).
Hendricks and Singhal (2001a).
Sample size 394 108 435
Data source, data used
Compustat Annual Industrial File, Parent Firm
Compustat Annual Industrial File, Parent Firm
Compustat Annual Industrial File, Parent Firm
Time frame 10 years (6 yrs. before and 3 yrs. after the award grand
5 years after the award grand
4-5 years after the award grad
Types of quality awards included
Not explicitly stated Not explicitly stated Not explicitly stated
Categories of performance measures
1. Operating Income 2. Annual percentage
change in sales 3. Percent change in total
cost per dollar of sales
a. Net Income b. Operating Income c. Sales d. Continuously
compounded stock returns
a. Operating income b. Annual percent change
in sales c. Percent change in cost
per dollar of sales
Key findings Firms winning quality awards outperform the control firms on operating income-based measures and sales growth, and are more successful at controlling costs
Long-term performance of TQM firms is improved, as measured by median cumulative positive abnormal return at the end of 5 years.
Overall, TQM firms experience better financial performance than control firms; smaller firms do better than larger firms; less capital intensive firms do better than more capital intensive; less diversifies firms outperform more diversified firms; no significant differences between early and later adopters of TQM.
Thorough examination of these empirical surveys indicated a number of limitations,
including: (a) the randomness of the sample selected for the TQM and the non-TQM
adopters; (b) the sample that included only company-wide quality award winners,
ignoring the majority of the companies operating within a market; (c) overlooking the
changes incurred in the criteria, the standards and the level of competition for each
different award and (d) disregard of the process management techniques, used for the
evaluation of a company’s performance (York and Miree, 2004). These limitations,
deteriorate the reliability of the outcome derived from all those surveys, rendering them
unreliable.

Chapter 4: SME & Financial Performance – The Greek Crisis
Page 103 of 292
Georgios Sainis Ph.D. Thesis
But the benefits derived from the implementation of TQM shouldn’t be occasional. This
randomness caused due to a company’s organizational slack, or its long standing
patent or its unique production process, that lead to improved performance should be
identified and isolated before it is evaluated (Porter, 1996., Garvin, 1991). Though,
possible differences in a company’s organizational structure and in its leadership style
could be considered as an opportunity and have a positive effect on the level of its
operational performance. For example, the company’s ability to enter into new markets
utilizing all those environmental changes could be such an opportunity (Jennings and
Seaman, 1994, Bourgeois and Eisenhardt, 1988).
Hendricks and Singhal (2001) proved the existence of a relationship between TQM
and financial performance. This relationship was derived and determined from the
characteristics of each different firm. They specifically argued that SME performed
better financially compared to the larger firms due to their Capital-intensity. They also
realized that the level and the point in time that quality was introduced into their
operations, was what defined its maturity level, but failed to directly relate this to the
level of the SME financial performance.
In measuring an SME’s financial performance, Agus and Hassan, (2000), used the
variables that were related to its quality level and its industry characteristics as financial
indicators. He determined the financial performance of an SME, in relation to its
competitor’s performance within the same industry. He examined the rate by which the
financial performance of a quality company exceeded the financial performance of its
non-quality competitors. The variables he used in measuring their financial
performance were their profitability and their revenue growth. Agus (2005) continued
with another survey where he used (a) top management commitment, (b) customers
focus, (c) supplier’s relationships, (d) the level of training and (e) employees focus, as
quality management variables. The criteria he used in measuring their performance
were related to a number of competitive advantage factors (barriers to entry and
rivalry/competition) and a number of differentiation factors (product differentiation,
personnel differentiation, and price/cost differentiation). To the above criteria, he
added a number of financial performance indicators, like the total assets, the net profit
and the turnover per employee.
From the different studies conducted, on the relationship between TQM and financial
performance, different results were produced. One set of them were supporting the
contribution of quality to a company’s financial performance i.e. Fleming et.al (2005);

Chapter 4: SME & Financial Performance – The Greek Crisis
Page 104 of 292
Georgios Sainis Ph.D. Thesis
Germanos (2011), and another set showed mixed or no evidence of the relationship
i.e. Kaynak (2003); Watson et.al., (2003) . For this reason, a research standard was
developed, so as to identify a more standardized way of assessing the relationship
between the two variables (Wayhan and Balderson, 2007a). This standard was based
on the answers collected from a set of questions that are shown below. With the
available answers, a comparative study of all the results derived from different surveys
could be compared and contrasted.
The questions used were the following:
a) Has TQM been fully implemented?
b) Has the implementation of TQM impacted organizational processes?
c) Have the longitudinal data analysis assumptions been met? If not, have the raw
data been orthonormalized and / or an appropriate data analytic technique
utilized?
d) Have three or more post-event measurement periods been incorporated into the
research design to allow the exact nature of the longitudinal effect to be
specified?
e) Have multiple pre-event measurement periods been incorporated into the
research design to determine whether comparison groups are equivalent?
f) Has the theorized impact of the intervention been tested simultaneously on
multiple dependent variables in the analytic model?
g) Has the theorized impact of the intervention been tested through an omnibus test
of main effects with sufficient controls in place?
h) Has TQM impacted financial performance across time?
i) Has the effect size and statistical power to determine an effect of this size been
determined on a post hoc basis?
Up to now however no one has managed to address all nine items leaving the linkage
between TQM and financial performance a pending research question.
From the surveys that tried to examine the link between TQM and financial
performance, it was found that the 80% of them were subjective (Wayhan and
Balderson, 2007b). As most surveys focused on the implementation process and the
outcomes derived, they mainly compared the quality initiatives undertaken from
different companies (Flynn et al., 1995, Hackman and Wageman, 1995) a fact that
created doubts pertaining to the accuracy and reliability of the outcomes.

Chapter 4: SME & Financial Performance – The Greek Crisis
Page 105 of 292
Georgios Sainis Ph.D. Thesis
Other studies conducted were based on practitioners work, but the validity of the
results were questionable, because they were derived from self-response type surveys
and relied on the perception of the company’s executives (Hiam, 1993).
Scholars have also tried to relate the variables used in measuring SME financial
performance. The results of these studies, have been used and/ or presented in
different conferences and studies like in the conference Board (a NY business
research group-149 large manufacturing and service business), in the International
Quality study (584 automotive, computer, banking and health care firms in Canada,
Europe, Japan and USA), in the American Society for Quality Control (ASQC) study
(Assess the perception of 604 senior executives or directors) and in the Sirota and
Alper study (1992-Research company that surveyed a cross-section of employees
from 30 companies and not just one interviewee from each company). From all those
studies presented only three included numeric results regarding the impact of TQM on
a company’s financial performance. The first study, which was conducted by the
General Accounting Office (1991) used the market share, the sales per employee, the
return on sales and the return on assets as financial performance criteria. The second
study, by Fitzerland and Erdmann (1992) examined the supplier’s financial
characteristics and the third by IBM (1993) used criteria such as customer service,
employee morale, product and service quality, as well as the companies’ financial
results and market share.
It should be noted that the studies that demonstrated the existence of a positive
relationship between financial performance and TQM, depend mostly on individual
perceptions, and the limitations due to the statistical methods used for data analysis,
rendered their results unreliable (Wayhan and Balderson, 2007).
In addition to the empirical surveys conducted, Powel (1995) was the first who worked
on an single TQM dimension examined in relation to its financial performance. He used
five perpetual measures and concluded that TQM implementation depends more on
intangible rather than tangible factors. The need to change a company’s corporate
culture is what would affect the TQM elements behaviour and consequently the
company’s financial performance. So, the reason why companies didn’t manage to
accomplish the TQM level, was their unwillingness and inability to implement all those
intangible factors that would change their corporate culture (Kolesar, 1995).
In the studies conducted by Curkovic et al., (2000) and by Douglas and Judge (2001)
a positive relationship was also shown between TQM and financial performance.
Chapter 4: SME & Financial Performance – The Greek Crisis
Page 106 of 292
Georgios Sainis Ph.D. Thesis
However, the results derived by the studies were contradictory. The first, assessed the
level of implementation of TQM dimensions in relation to a company’s operational
performance and then compared these results with their competitors’ performance
(Use of 8 variables). Six different financial and market related variables were used as
financial performance criteria. The second study, assessed the consequences
imposed on a company’s organizational structure from the relationship existing among
the TQM elements and the company’s financial performance. The main conclusion
derived was that only some of the TQM elements affect a company’s financial
performance. Those were the ones that have mainly determined the TQM’s maturity
level, as for example the quality culture and/ or the appraisal techniques.
Onuwa (2008) tried to examine the relationship between the quality management
elements and the financial and non-financial performance measures. The study
revealed that the client’s focus, the human resource capabilities, the internal culture
and the organizational alignment, were the quality elements that mostly influenced a
company’s financial performance. Leadership and commitment were the quality
elements mostly affecting the non-financial criteria, like for example the employees
and customers satisfaction, the organizational learning and the process efficiency.
Douglas and Judge (2001) also showed a strong positive relationship with all the seven
quality dimensions4 they used. However the significance of that survey, was the high
correlation identified between all the TQM elements and all the financial performance
measures they used. It revealed the strong relationships between the successful
implementation of TQM elements and the change in a company’s philosophy, with the
control procedures applied and the maturity level of quality recognized.
The use of the TQM elements from an SME, in the process of implementing TQM,
requires considerable energy from all its stakeholders and particularly from its
employees. This could result in their being distracted from their main tasks, which in
turn would negatively influence a company’s overall financial performance, ultimately
leading to a reduction in the company’s return on investment (ROI) ratio. . Given that
certain financial goals would be missed, potentially the whole system may fail (Price
and Chen, 1993).
What really matters is to understand that TQM is adopted not just because of the
company’s internal needs (cost minimization and quality improvement), but because
4 1. Top management support, 2.Quality information, 3. Process Management, 4. Product design, 5. Workforce management, 6, Supplier involvement, 7. Customer involvement
Chapter 4: SME & Financial Performance – The Greek Crisis
Page 107 of 292
Georgios Sainis Ph.D. Thesis
of external tensions realized. Tensions that arise due to their strong level of competition
and the higher level of their performance evaluation criteria. In addition to the above
and given that the availability of the needed financial information, are not easily
accessible -especially from the non-listed companies- the use of a ‘self-assessment’
technique could be used from the researchers. This technique could eliminate bias and
subjectiveness from the survey and its conclusions (Watson et al., 2003).
4.5. Measuring Financial Performance with Ratio Analysis
The most traditional, quick and reliable method used in measuring a company’s
financial performance is the ratio analysis. In almost all articles that have been studied,
related to searching for the ways different researchers have attempted to measure a
company’s operational and financial performance, ratios were among the criteria they
have used. Measuring and analysing the financial ratios gives the opportunity to
stakeholders and analysts’ to evaluate the operating and financial performance of a
company (Hirt et al.. 2013).
Financial ratios acquired from a company’s financial statement data are capable of
offering valuable information regarding its overall performance. The use of the financial
statement’s historic data, can support management’s forecasting process and the
valuation of its financial performance, as well as its financial and competitive position
within the market (Ross et al., 2007).
Ratio analysis, offers a company the opportunity to have a clear and unbiased
representation of the environmental conditions it operate in. It also supports
management in all types of decisions it has to make and it can be used as a tool to
identify possible abnormalities in a company’s behaviour and detect future corrective
actions (Voulgaris et al., 2000).
The questions that may arise in the evaluation process of a company’s financial
performance, are related to the selection and use of the appropriate parameters which
originate from its micro and/ or its macro-economic environment.
Various studies, have used different ratios or groups of ratios in order to identify a
company’s operational and financial performance. In their study, Hall and Weiss (1967,
cited by Erdoğan et al., 2015) supported a positive relationship among a company’s
profitability and its size. They also identified the impact of policy changes on financial
performance, highlighting major consequences such as the reduction of employees,

Chapter 4: SME & Financial Performance – The Greek Crisis
Page 108 of 292
Georgios Sainis Ph.D. Thesis
the narrowing of operational activities and the decrease of operational costs. Icerli and
Akkaya (2006 cited by Erdoğan et al., 2015) also established that liquidity ratios, can
significantly be used to evaluate a company’s business performance.
The ratios most commonly used in ratio analysis, include among others, the return on
assets, the return on equity and the profit margin ratio. Researchers have additionally
incorporated a number of qualitative variables, such as customer’s satisfaction and the
company’s competitiveness into their models. (Klingenberg et al., 2013).
Models that were developed in measuring an SME’s operational and financial
performance have used the organizational performance measurement (OPM) system.
The OPM was developed by Channell et al., in 2000, integrating performance
measurement techniques suitable for small enterprises (IPMS) that were developed
by Laitinen in 1998 (Munir Ahmad & Alaskari, 2014). Laitinen tried to identify the
financial performance of SME using selected financial ratios in measuring a company’s
profitability, liquidity and solvency competences. In his research Laitinen, selected two
dimensions the internal and the external dimension, with their equivalent criteria. The
external dimension, was used in measuring a company’s financial performance and
competitiveness and the internal dimension, was used in realizing and measuring the
level of their costs, their activities, their products, their revenues and the determinant
factors of their production processes.
Klingenberg et al., (2013) conducted a similar study, in which the aim was to identify
any relationship between a company’s operational innovation and its financial
performance. Innovation was accomplished through introducing lean management and
JIT production techniques. Using profitability ratios like the return on assets (ROA), the
return on equity (ROE) and the Basic earnings power (BEP) ratios; inventory
management ratios, like the inventory turnover ratio; it was found that no relationship
existed amongst the variables.. This could be explained from the fact that that the
company’s profitability was influenced heavily from its exposure to an increased debt
financing and reduced operational performance.
Various studies, have measured a company’s financial and operational performance,
with a myriad of different ratios. In their research, Gombola and Ketz (1983), used 58
ratios. Ho and Wu (2006), used 59 ratios, and Uyar and Okumus (2010) used only 15
ratios. Among all the studies that have tried to measure a company’s financial and
operational performance, a number of ratios (twenty to thirty) were common and were
considered crucial for that measurement (Delen et al., 2013) and those are presented
Chapter 4: SME & Financial Performance – The Greek Crisis
Page 109 of 292
Georgios Sainis Ph.D. Thesis
in Table 18 that follows. From all the ratios shown in each different category, specific
ratios were the ones chosen and used in this survey as being the stricter in evaluating
a company’s (SME) financial performance.

Chapter 4: SME & Financial Performance – The Greek Crisis
Page 110 of 292
Georgios Sainis Ph.D. Thesis
Table 18: Financial Ratios (Delen et al., 2013)
Liquidity Ratios
Quick Ratio (Current Assets – Inventory). / Current Liabilities
Liquidity Ratio Current Assets / Current Liabilities
Cash Ratio Cash and Cash Equivalents / Current Liabilities
Asset Utilization or Turnover Ratios
Receivable Turnover Rate Sales / Accounts Receivable
Inventory Turnover Rate Cost of Goods Sold / Inventory
Net Working Capital Turnover Rate
Sales / (Current Assets – Current Liabilities).
Asset Turnover Rate Sales / Total Assets
Equity Turnover Rate Sales / Owners’ Equity
Fixed Asset Turnover Rate Sales / Fixed Assets
Long-term Assets Turnover Rate
Sales / Long-term Assets
Current Assets Turnover Rate
Sales / Current Assets
Profitability Ratios
Gross Profit Margin Gross Profit / Sales
EBITDA Margin Earnings Before Interest, Tax, Depreciation, and Amortization / Sales
Net Profit Margin Net Income / Sales
Earnings Before Tax-to-Equity Ratio
Earnings Before Tax / Owners’ Equity
Return on Equity Net Income / Owners’ Equity
Return on Assets Net Income / Total Assets
Operating Expense-to-Net Sales Ratio
Operating Expense / Net Sales
Growth Ratios
Assets Growth Rate (Total Assets – Total Assetst-1). / Total Assetst-1
Net Profit Growth Rate (Net Income – Net Incomet-1). / Net Incomet-1
Sales Growth Rate (Sales – Salest-1). / Salest-15
Asset Structure Ratios
Current Assets-to-Total Assets Ratio
Current Assets / Total Assets
Inventory-to-Current Assets Ratio
Inventory / Current Assets
Cash and Cash Equivalents-to-Current Assets Ratio
Cash and Cash Equivalents / Current Assets
Long-term Assets-to-Total Assets Ratio
Long-term Assets / Total Assets
Solvency Ratios
Short Term Financial Debt-to-Total Debt
Short Term Financial Debt / Total Liabilities
Short Term Debt-to-Total Debt
Current Liabilities / Total Liabilities
Interest Coverage Ratio Earnings Before Interest and Tax / Interest
Solvency Ratios (Continue.)
Debt Ratio Total Liabilities / Owners’ Equity
Leverage Ratio Total Liabilities / Total Assets
Total Financial Debt-to-Total Debt
Total Financial Debt / Total Liabilities
5T-1: refers to one period before.
Chapter 4: SME & Financial Performance – The Greek Crisis
Page 111 of 292
Georgios Sainis Ph.D. Thesis
Following the principal component analysis and the factor analysis, Delen et al., (2013)
managed to identify the group of ratios that mostly influence the two basic performance
measurement ratios, the ROA and the ROE. They identified that 70.4% of the total
variance was explained from those two profitability factors. The remaining 11.5% was
explained from the liquidity group of ratios, the 9.6% from the asset structure group
and the 9.1% from the asset and equity turnover group. The specific ratios identified
were the Gross profit margin factor, the debt ratio factor, the current asset factor, the
leverage factor, the Net profit factor, the net working capital turnover factor and the
sales, the profit growth factor and the asset growth factor. From the analysis
conducted, it was evident that the Debt ratio, the earnings before taxes to equity ratio,
the leverage and debt ratio as well as the asset turnover and sales growth ratios were
considered the most determinant for the ROA and ROE ratios.
In an attempt to examine the impact of quality and process management on the
financial performance of Greek SME operating in the construction sector, Kampouridis
et al., (2015) used ratio analysis. The researchers specifically selected the cash ratio,
the current ratio, the inventory and receivable turnover ratio, the gross and net profit
margin ratio, the return on capital and equity ratios and the debt to equity ratio. From
the analysis conducted, they concluded that SME’s didn’t manage to prevent the
decline in their financial performance despite having introduced quality in their
operations .due to the severity of the crisis conditions they operated in. The
incompetence of the ISO 9001:2008 model and the level of implementation of the TQM
elements, were not capable of supporting the sustainability of the SME under crisis
conditions.
Shahin (2011) examined and compared the financial performance of a single company
that had adopted TQM with another three that hadn’t. For the analysis, the current and
quick ratios, the return on assets ratio, the return on equity, the debt to total assets and
the asset turnover ratio were used. Positive correlation between TQM with almost all
financial ratios was identified, except with the debt to total assets ratio. It was obvious
that the overall financial performance of that single (TQM adopter) company improved
more in relation to all other three companies (non TQM adopters).
Considering the severe economic decline that Europe and more specifically Greece
are facing in recent years, financial ratios were extensively used in measuring the
companies’ financial distress rate (showing their probability for bankruptcy) and
projecting their financial position in the market in relation to their capital structure policy

Chapter 4: SME & Financial Performance – The Greek Crisis
Page 112 of 292
Georgios Sainis Ph.D. Thesis
that is the relationship between their debt and equity financing level. The use of
financial ratios like the debt to turnover ratio and its comparison with the SME’s
investment strategy and its employment policy were presented in a survey conducted
by Lawless et al. (2015).
Over the last years, more and more SME were in a debt overhang condition meaning
that their debt was so immense that it was difficult for them to increase it further. So,
in order to continue investing in profitable investments they would convince their
potential lenders (mainly Banks), to supply them with additional financing, exceeding
their allowable limits. Companies incurring a high level of leverage, have also realized
a negative trend on their investment opportunities. Having some debt can be
considered productive, because it gives a company the possibility to continue its
investment strategy. But when it exceeds its debt limits, then the results are reversed.
A company with an increased financial distress level would also reduce its productivity
(Costanzo et al., 2013). This inverse relationship is stronger when the company has
fewer investment opportunities, as this was proved by Tobin’s Q Ratio (Q’ Ratio)
(Lawless et al., 2015).
Altman’s z-score is a ratio that tries to identify the level of a company’s financial
distress. It is accepted and has been used by the market for many years, but its role
in influencing a company’s strategic plan has not yet been recognized (Calandro,
2007). The Z-score, is composed of a set of four ratios, that examine the level of
efficiency, profitability, liquidity and solvency of a public (no-public) held company. The
Z-score ratios include the working capital over total assets ratio, the retained earnings
over total assets, the EBIT (Earnings before interest and taxes) over total assets and
the company’s net worth over total liabilities. Each ratio is accompanied by a coefficient
that increases or decreases its importance to the function and to the company’s
distress condition. Specifically,the coefficient assigned to the first ratio is 1.2, to the
second ratio is 1.4, for the third is 3.3, for the fourth 0.6 and for the fifth ratio is 0.99.
Using the Z-Score ratio a company’s financial distress condition is measured. If the
ratio is greater than 2.60 the company is in risk (safe zone),if it is lower than 1.10, then
the company is most likely going to go bankrupt (distress zone) and when the ratio is
in between 2.69 and 1.10 then the company is at risk of financial distress and
bankruptcy (grey zone). (Calandro, 2007).
The critical value of the z-score ratio for all companies tested is a score of 2.675 (Pan,
2009). The applicability of the model in measuring a company’s management

Chapter 4: SME & Financial Performance – The Greek Crisis
Page 113 of 292
Georgios Sainis Ph.D. Thesis
performance including risk management, has been statistically tested from a number
of scholars, like the Carton and Hofer (Calandro, 2007).
Different methodological models suitable for evaluating an SME’s performance have
been developed like the discriminant analysis (DA), the logit and probit analysis (LA,
PA) and the UTATIS analysis. All three, are sustainable econometric multivariate
techniques that attempt to find ways of allocating different values or scores to different
formed groups.
Voulgaris et al., (2000) stated that the UTATIS models should be considered as the
one that presented the highest classification accuracy. However the PA (Probit
Analysis) model was the model that showed the best results in classifying SME into
three different groups, namely the “dynamic”, the “medium” and the “weak” group. The
“weak” group was the one containing the most companies faced with financial distress
and the possibilities of business failure. Data collected referred to the period of 1988-
1996 and twelve financial ratios were used.6 The analysis revealed the increase in the
number of the dynamic SME in relation to the other two groups, due to the changes
and improvements which took place in the economic and the social environment in
Greece during that period, which increasingly supported dynamic and risk taking
companies.
Among all the ratios used in the UTATIS model, a number of ratios showed higher
significance than others. The ratios with the higher significance were the inventory
turnover, the fixed asset turnover, the solvency ratio, the working capital ratio and a
number of profitability ratios like the operating profit margin, the net profit margin, the
ROA (Return on Assets) and the ROE (Return on Equity). From their behaviour, it
became clear that the Greek SME operating in a booming market, would have
managed to efficiently and effectively employ all the needed inventory management
policies and the working capital management policies to improve their ability of utilizing
their productive assets (fixed assets) (Voulgaris et al., 2000).
4.6. Concluding Remarks
Given their significant role in the Greek economy, SME need to be adequately
equipped to face the financial distress conditions brought on by the crisis.
6 The current ratio, the quick ratio, the debt to assets ratio, the long term debt to assets, the long term
debt and Equity to total fixed assets, the new worth to capital, the current liabilities to total assets, the inventory turnover, the fixed asset turnover, the profit margin, the profits to Equity and the net profit to total assets.
Chapter 4: SME & Financial Performance – The Greek Crisis
Page 114 of 292
Georgios Sainis Ph.D. Thesis
However the inefficient public sector, the inability to receive external finance, the high
taxation levels and the high unemployment rates, have led to the dissolution of almost
one third of the Greek SME.
Those companies which have managed to survive, experience growth at a rate lower
than that of the remaining European Union members, due to the austerity measures
imposed on the Greek economy from its creditors. Possible causes for that is the Greek
legislation that tremendously reduced their productivity, their innovativeness and their
ability to raise new funds. Somewhat encouraging is the fact that the SME operating
in tourism and high technology sectors, have experienced growth. Based on crisis
management theory and on the research by Seeger et al. (1998) who proposed that
SME should reform their organizational structure, incorporating into their quality plan
a strategic plan, with the aim of establishing a cultural environment geared towards
“excellence”. It is agreed that a strategic plan should positively contribute in further
implementing the quality elements and support the SME financial performance. Quality
contributes to a company’s and in particular an SME’s financial performance but the
limited set of variables used and their subjective character due to the individual
perceptions used reduces their results value. So, the relationship existing between
TQM and financial performance is a pending research question which will be further
examined in the current survey.
To measure operational performance and the level of an SME financial distress,
financial ratio analysis was adopted. Different surveys have proposed different
financial ratios, but the ratios more commonly used were the ROA and ROE ratios, the
current ratio, a set of turnover ratios and the Debt to Equity ratio. The Altman Z-score,
despite criticism has been used, has been statistically tested and proved its
contribution in measuring a company’s financial performance and because of this it will
be one of the ratios used in the current survey

Georgios Sainis Ph.D. Thesis
Chapter 5: Research Methodology
Page 115 of 292
Georgios Sainis Ph.D. Thesis
Chapter 5. Research Methodology
5.1. Introduction to Chapter 5
The theoretical perspective, the research design and methodology approach used in
collecting, processing and interpreting the primary and secondary data, are presented
in this chapter. The aim of the survey is to address the research objectives and manage
to obtain comprehensible results that are, relevant to the research question, and
contributable to the academic and professional knowledge.
This chapter has seven sections and a number of subsections including the
introduction. Section 5.2 examines possible alternative research approaches and
analyses the approach selected and used in the current survey. Section 5.3 defines
and examines the possible quality variables and the ones selected for determining the
quality level applied in a company and an SME. Section 5.4 explicitly describes the
methodology followed for the qualitative survey conducted, while section 5.5 and its
subsections depict the methodology used in the quantitative survey. It also includes
how the decision for the sample size was taken, how the design and development of
the questionnaire was made as well as which statistical methods were used in the data
and financial analysis. Section 5.6 shows the methodology followed for the collection
and analysis of the financial data (secondary data) used in examining the SME
financial performance. Section 5.7 acts as a summary of what has been delineated in
this chapter, and includes a short introduction of what will follow in the subsequent
chapter.
The flow of the above referred methods and techniques is presented in the next page.in
Figure 17 supported by the ACG7 e-project software and the Hellastat i-mentor
database.
7 ACG: American College of Greece (Deree College)

Chapter 5: Research Methodology
Page 116 of 292
Georgios Sainis Ph.D. Thesis
TQM Analysis
Financial Analysis
Begin part A’
Collect TQM Primary Data (398)
(ACG e-Teacher or ACG e-Project survey system)
Check Reliability
(Gronbach a)
Check Validity(Pilot Study
Experts)
Methodological approach (Value Scoring )
Conclusions Derived
Begin part B’
The coding process
Collect Financial Primary Data
(Questionnaire) (398)
Collect Financial Secondary Data
(Hellastat i- Mentor)
Statistical Tests Pearson Correlation ANOVA MANOVA Regression
Conclusions Derived
Results comparison
RATIO ANALYSIS Acid Test Ratio Asset Turnover Inventory Turnover A/R Turnover Debt/ Equity Ratio Z-Score Ratio ROA ROE
Conclusions Derived
Figure 17: Data Analysis Methods & Techniques
Chapter 5: Research Methodology
Page 117 of 292
Georgios Sainis Ph.D. Thesis
5.2. Research approaches
When developing a survey and adopting a research methodology a researcher has
many strategies to choose from. Understanding of the weaknesses and the strengths
of each strategy and methodology approach, can assist the researcher in making the
appropriate choice. Within this context, different philosophies, strategies, techniques
and methods used in collecting data are presented. These are supported from the
appropriate quantitative methods available in analysing the data collected and
contributing to the results and conclusions derived (Rudestam and Newton, 1992).
A researcher’s objective is to search for possible answers on different research
questions. This should be achieved using scientifically approved methods and
procedures in collecting and processing the available data. In literature, a number of
different methods and procedures exist. They all aim at assisting the researcher in
collecting the needed information, in order to give reliable and unbiased answers to
the selected research question(s) (Rudestam and Newton, 1992). Understandably the
researcher has to prepare to be flexible if he/she wants to obtain answers, given that
there is no right way of doing things in a research process. There will always be
alternatives and decisions to be made for selecting the correct avenue. That is why the
researcher needs to develop the strategy design. The decision taken, whether it is the
right one or not, will be based on the researcher’s available resources and the number
of available alternatives (Robson, 2011).
As Robson (2011) states, the “real world” research, can be fixed and quantitative or
flexible and qualitative. He admits that experiments have proven that the fixed ones
are superior. He also supports that research, needs to be systematic, sceptical and
ethical, offering conclusions of high quality, useful and socially responsible.
A researcher who conducts a survey needs to experiment, examine and investigate
possible alternatives, following a systematic, critical, logical and objective method
(“Impediments to the Adoption of Total Quality Management ( TQM ) in Jordanian ISO
9000 series Certified Manufacturing Companier Faisal Nayef Al-Madi Management
and Management Sciences Research Institute School of Management Faculty of
Business and Informat”, 2005).
Considering that for the research design different approaches exist, Gill and Johnson
(1997) found that the design depends on the number of variables examined in a
survey. These variables, should be related to the amount and the type of information
needed so their processing will allow the research question to be answered. In

Chapter 5: Research Methodology
Page 118 of 292
Georgios Sainis Ph.D. Thesis
addition, the type and the kind of the research question plays a role in the research
design selection process.
In that process, it is vital to decide if the strategy followed is going to be a fixed, a
flexible or a multi design strategy. The researcher also needs to decide if the survey is
going to be an evaluation type or an action type survey (Robson, 2011). Defining the
purpose of the survey, will help a researcher choose the most appropriate strategy. In
turn the purpose of the survey, can be defined based on the survey’s research question
and sub-questions, as well as the tactics of the inquiry used.
Different perceptions exist regarding the quality of the research design. Gill and
Johnson (1997) support that using a number of variables in a research is what will
bring a solution to a problem in the most efficient and effective way. Oppenheim (1992)
alternatively believes, that the suitability of a survey is what really matters. Blaxter et
al., (2002) additionally place importance not only in identifying the “true” answer to a
question, but also in developing a research that will be characterised by reliability,
professionalism, honesty and feasibility that will reveal the “true” answer.
Included in a strategic research design are the different plans that describe the stages
that should be covered. The stages refer to the research paradigms available to the
researcher and the strategies and the approach that could be used. Following that is
the methodology the researcher adopted for the data collection and the techniques
used for their analysis and evaluation. Eventually this will reveal if the research’s aim
and objectives have been fulfilled (Creswell, 2003).
Table 19: Methodological Approaches
Positivism research Approach
(Associated Methodologies)
Phenomenological Research Approach
(Associated Methodologies)
Cross sectional studies Action research
Experimental studies Case studies
Longitudinal studies Ethnography
Survey Feminist perspective
Grounded theory
Hermeneutics
Participative enquiry
Source: (Collis and Hussey, 2003)

Chapter 5: Research Methodology
Page 119 of 292
Georgios Sainis Ph.D. Thesis
The positivism (traditional) and the phenomenological approach are the two research
perspectives that a researcher can adopt. In Table 19, the two research approaches
and their equivalent methodologies are presented. “Perspectives” refers to the beliefs
that the researcher has regarding the way the research components will be combined
and how they will be used, in order to come to conclusions (Wisker, 2001; Saunders,
et.al. 2003)
Positivism, as an approach is used by researchers, mostly in natural science research.
It involves the use of objective methods and not subjective ones. With the term
“objective” it is meant that the methods are based on hypothesis that needs to be
tested, the researcher is assumed to be independent, and the variables selected are
analysed using quantitative techniques. It mostly entails the decomposition of a
problem that can and will be vertically and horizontally analysed using a cross sectional
analysis (Collis and Hussey, 2003; Robson, 2011).
Johnson and Duberley (2003), have identified that in the management discipline,
positivism, continues to be the most adopted epistemological method for research,
despite its strong criticism.
The criticisms imposed on it, revealed the phenomenology method. The basic principle
of governing that method is that all social events are images of the human mind. Reality
can be presented only with quantitative means and humans cannot be treated as a
“social unit”, but as a unit that has its own perceptions. Humans shouldn’t be treated
as a scientific object, but as a partner who with his character, personality and beliefs,
will contribute positively to a survey’s conclusions (Robson, 2011).
What phenomenology approach (post-positivism perspective) states, is that there is a
need to take into consideration the differences existing between humans and objects.
It requires from the researcher to subjectively consider the role of the social factor
(Bryman, 2004). The way people think, feel, interpret phenomena and needs to be
considered under the phenomenological approach.
However it is thought that the positivism’s approach variables, like the research
hypothesis, the researcher’s values and the related theories, could potentially
influence a survey’s outcome (Ghauri, et. al., 1995).
So, Collis et al., (2003) and Bryman (2004), concluded that there is a difference
between the social and the natural science. Each one of them requires different
research procedures and each one emphasizes and places different varying degrees
of importance on the human factor and its characteristics.
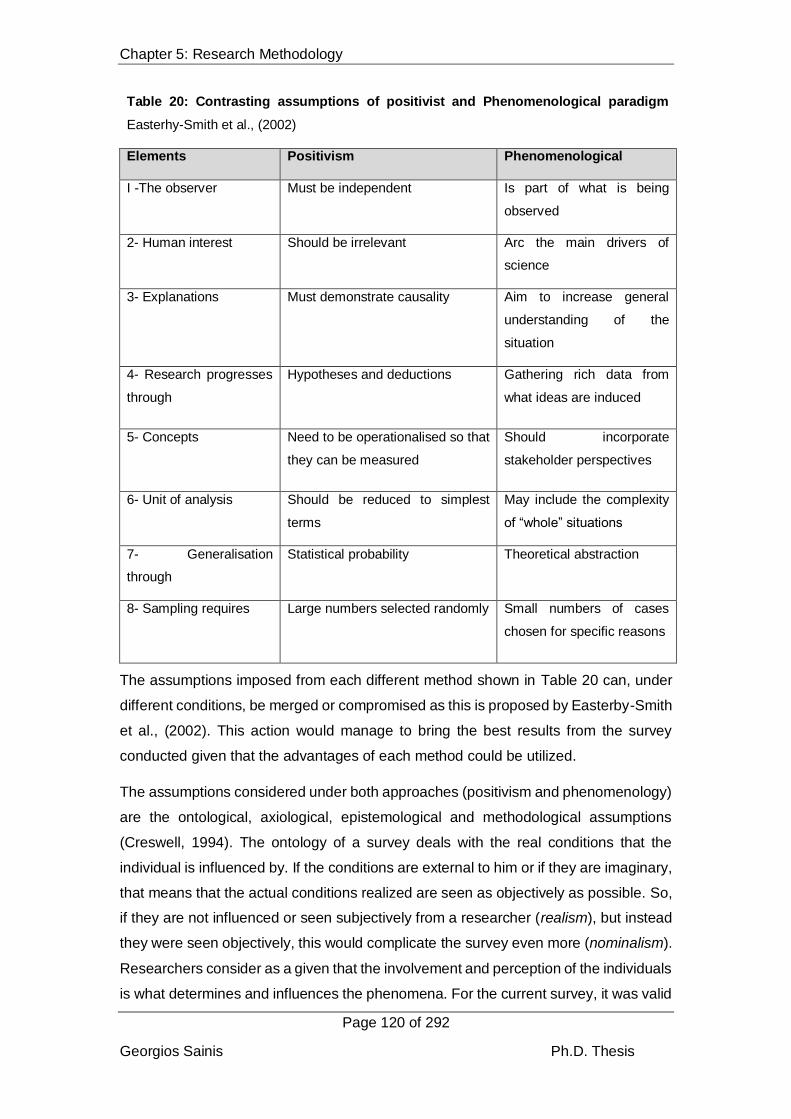
Chapter 5: Research Methodology
Page 120 of 292
Georgios Sainis Ph.D. Thesis
Table 20: Contrasting assumptions of positivist and Phenomenological paradigm
Easterhy-Smith et al., (2002)
Elements Positivism Phenomenological
I -The observer Must be independent Is part of what is being
observed
2- Human interest Should be irrelevant Arc the main drivers of
science
3- Explanations
Must demonstrate causality Aim to increase general
understanding of the
situation
4- Research progresses
through
Hypotheses and deductions
Gathering rich data from
what ideas are induced
5- Concepts
Need to be operationalised so that
they can be measured
Should incorporate
stakeholder perspectives
6- Unit of analysis Should be reduced to simplest
terms
May include the complexity
of “whole” situations
7- Generalisation
through
Statistical probability Theoretical abstraction
8- Sampling requires
Large numbers selected randomly
Small numbers of cases
chosen for specific reasons
The assumptions imposed from each different method shown in Table 20 can, under
different conditions, be merged or compromised as this is proposed by Easterby-Smith
et al., (2002). This action would manage to bring the best results from the survey
conducted given that the advantages of each method could be utilized.
The assumptions considered under both approaches (positivism and phenomenology)
are the ontological, axiological, epistemological and methodological assumptions
(Creswell, 1994). The ontology of a survey deals with the real conditions that the
individual is influenced by. If the conditions are external to him or if they are imaginary,
that means that the actual conditions realized are seen as objectively as possible. So,
if they are not influenced or seen subjectively from a researcher (realism), but instead
they were seen objectively, this would complicate the survey even more (nominalism).
Researchers consider as a given that the involvement and perception of the individuals
is what determines and influences the phenomena. For the current survey, it was valid

Chapter 5: Research Methodology
Page 121 of 292
Georgios Sainis Ph.D. Thesis
to consider that the use and the level of implementation of quality, could not be
measured separately from the elements that characterise the company and the
manager(s) who control it.
Realism, the perception that neither the company nor the managers’ characteristics
influence or determine the phenomena, explains how they could respond to those.
Their response would not be affected from what they (managers) really believe or from
what their internal characteristics (companies) are, but instead would be based on how
they will be influenced from those and by other external factors. In the current survey,
both approaches were adopted. The first, nominalism, was adopted for the qualitative
research conducted (interviews) and the second, realism, was adopted for the
quantitative research conducted (survey). The selection of the first (nominalism) for
our study was due to the close relationship that exists between the decision for further
implementing the quality elements and the characteristics of the company and the
owner who controls it. The selection of the second (realism) was based on the
assumption that objectivity is needed in order to understand and explain reality. No
perceptions or beliefs should change or influence the description of what is actually
happening. Under the objective approach, a problem should be identified and
formulated, equivalent hypothesis or hypotheses should be defined based on the
related data collected and analysed. Then the results from the subsequent analysis
would lead the analyst to either accept or reject the hypothesis (Tull and Albaum,
1973).
The next group of assumptions is the Axiological, which can be either deterministic or
voluntaristic (Burrell and Morgan, 1979). In the deterministic perception it is presumed
that individuals’ responses to their external environment are based on the assumption
that they are an extension of the environment they operate in and that they are
“shaped” from it. On the contrary the voluntaristic perception, assumes that the
external environment is “shaped” from just the individuals (Creswell, 1994).
For the current survey, the voluntaristic approach was deemed suitable for the
qualitative survey. It was considered that the individual’s perceptions, values and
beliefs are the determinants for implementing quality and the TQM elements in SME.
The deterministic approach was then used for the quantitative analysis. It was chosen
based on the premise that the selection of the quality elements and how they will be
reinforced, is mostly based on the experience, training and education of the managers
responsible for implementing them.

Chapter 5: Research Methodology
Page 122 of 292
Georgios Sainis Ph.D. Thesis
The epistemological assumption is related to the body of knowledge that a researcher
will accept and use in his research analysis (Hussey and Hussey, 1997). It is related
to what the characteristics that make that body of knowledge suitable and acceptable
from a specialty (Bryman, 2004). In literature, variants assumptions exist regarding
epistemology, like the positivism, interpretivist, objectivism, subjectivism,
constructionism and anti-positivism (Burrell and Morgan, 1979). For objectivism,
knowledge is achieved independently of the individual’s perception and is based on
what is easily identifiable and measurable. For subjectivism, the knowledge comes
from the analysis of the subject itself. For phenomenologist the knowledge is based
only on the phenomenon examined. For constructionists the body of knowledge is
simply built from the beginning, using the individual’s and/ or the group’s perception
and experience as building blocks.
The methodological assumptions are related to the process followed by a researcher.
Inductive and deductive are the two methodological approaches that can be followed.
In the first (inductive), the researcher is guided from the remarks collected in order to
develop new theories; and in the second (deductive), the researcher is guided by the
remarks in confirming and validating existing theories (Chileshe, 2004). Literature
revealed that for quantitative surveys, the confirmatory and inductive assumptions are
mainly used compared to qualitative surveys in which the explanatory and the inductive
assumptions are chosen (Trochim, 2001). For the current survey and for the purpose
of identifying the level of implementation of the TQM elements in the Greek, ISO
certified SME and determining their influence on their financial performance, the
triangulation approach was the selected methodology. Under this approach a
combined set of methodologies are used in order to explain the same observations. It
was considered that this approach would give a better understanding of the quality
dimensions that influence the implementation of TQM. It would reveal the SME
sustainability in the market given the remarkable economic, social and cultural
changes that have taken place in the last eight years (Sieber, 1973). Using both
approaches to support the current survey’s aims and objectives will make the results
derived more reliable and realistic. The interviews conducted and the questionnaires
distributed would offer a better understanding of the level of quality implemented in the
Greek SME. It would allow the strengths of the one approach to overcome the
limitations of the other.
In the current survey, positivism is used as the basic approach for conducting the
research supported from the phenomenological approach. The reason for this

Chapter 5: Research Methodology
Page 123 of 292
Georgios Sainis Ph.D. Thesis
selection is the belief that when a survey appeals to companies that have different
organizational issues and management disciplines, positivism is the most appropriate
approach to use. In addition, when a survey attempts to reveal the perception people
within an organization have for quality, the phenomenological approach is the most
appropriate approach to use. (Robson, 2011)
To select the appropriate research strategy for the study,, Table 21 below shows all
the possible strategies (methodologies) used in developing the survey’s research
strategy.
Their categorization is based on the paradigm selected (meaning that it is based on
the theoretical model used in the research).
Table 21 shows Yin’s (2003) perspective regarding the variables used in deciding
which research strategy to use.
The variables examined will
enable the researcher to
decide on which is the most
appropriate strategy to follow;
what form the research
questions will have; the control
on the participants’ behaviour
and the focus on any possible
contemporary events.
Under the perspective of
Johnson and Duberley (2003)
as well as Robson (2011),
survey strategy is the most
commonly used positivistic
strategy that best fits the
management discipline and the
research needs.
Positivism was the paradigm and survey the methodology selected for the current
study. The aforementioned have been identified in literature as the best fit for the needs
of a social survey. They both support that for accomplishing the expected outcome of
a survey, the research question and the survey’s aims should be supported from the
use of a set of suitable statistical methods.
Table 21: Research Strategy selection variables
(Yin, 2003)
Strategies
Form of
research
question
Required
control
over
behaviour
Focus on
contemporary
event
Experiment How, Why Yes Yes
Survey
Who, What,
When, How
many, How
much
No Yes
Archival
Analysis
Who, What,
Where, How
many, How
much
No Yes, No
History How, Why No No
Case study How, Why No Yes
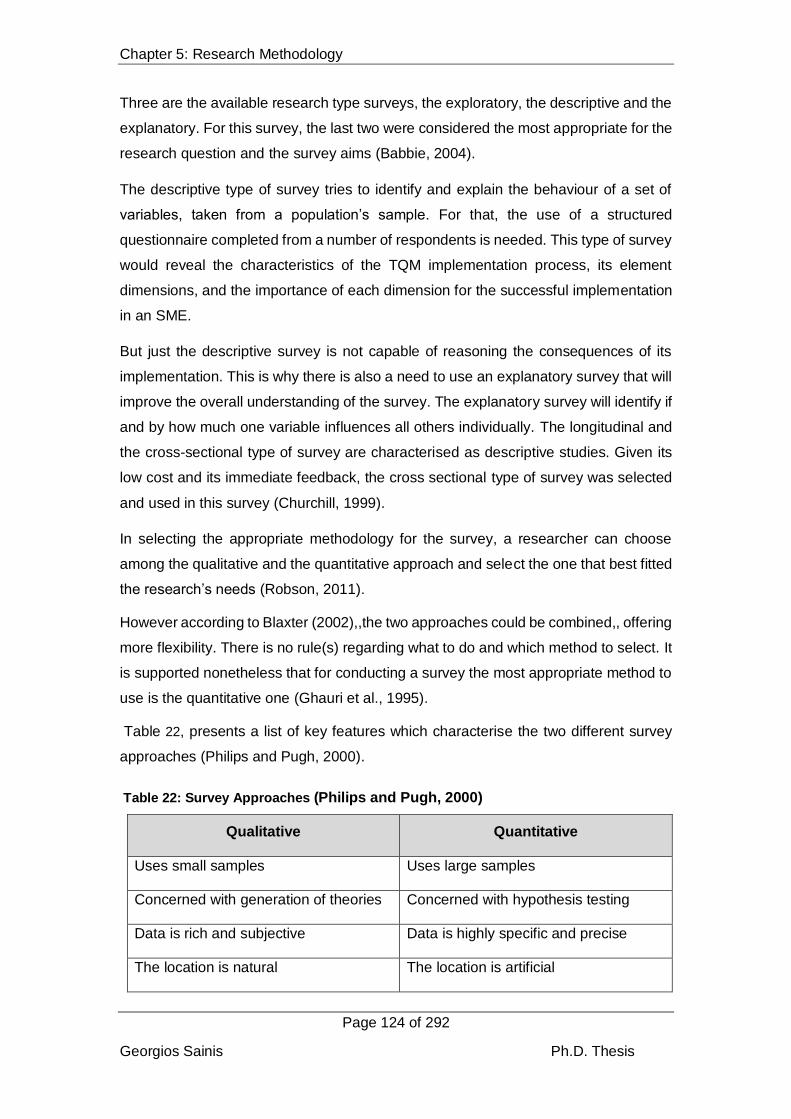
Chapter 5: Research Methodology
Page 124 of 292
Georgios Sainis Ph.D. Thesis
Three are the available research type surveys, the exploratory, the descriptive and the
explanatory. For this survey, the last two were considered the most appropriate for the
research question and the survey aims (Babbie, 2004).
The descriptive type of survey tries to identify and explain the behaviour of a set of
variables, taken from a population’s sample. For that, the use of a structured
questionnaire completed from a number of respondents is needed. This type of survey
would reveal the characteristics of the TQM implementation process, its element
dimensions, and the importance of each dimension for the successful implementation
in an SME.
But just the descriptive survey is not capable of reasoning the consequences of its
implementation. This is why there is also a need to use an explanatory survey that will
improve the overall understanding of the survey. The explanatory survey will identify if
and by how much one variable influences all others individually. The longitudinal and
the cross-sectional type of survey are characterised as descriptive studies. Given its
low cost and its immediate feedback, the cross sectional type of survey was selected
and used in this survey (Churchill, 1999).
In selecting the appropriate methodology for the survey, a researcher can choose
among the qualitative and the quantitative approach and select the one that best fitted
the research’s needs (Robson, 2011).
However according to Blaxter (2002),,the two approaches could be combined,, offering
more flexibility. There is no rule(s) regarding what to do and which method to select. It
is supported nonetheless that for conducting a survey the most appropriate method to
use is the quantitative one (Ghauri et al., 1995).
Table 22, presents a list of key features which characterise the two different survey
approaches (Philips and Pugh, 2000).
Table 22: Survey Approaches (Philips and Pugh, 2000)
Qualitative Quantitative
Uses small samples Uses large samples
Concerned with generation of theories Concerned with hypothesis testing
Data is rich and subjective Data is highly specific and precise
The location is natural The location is artificial
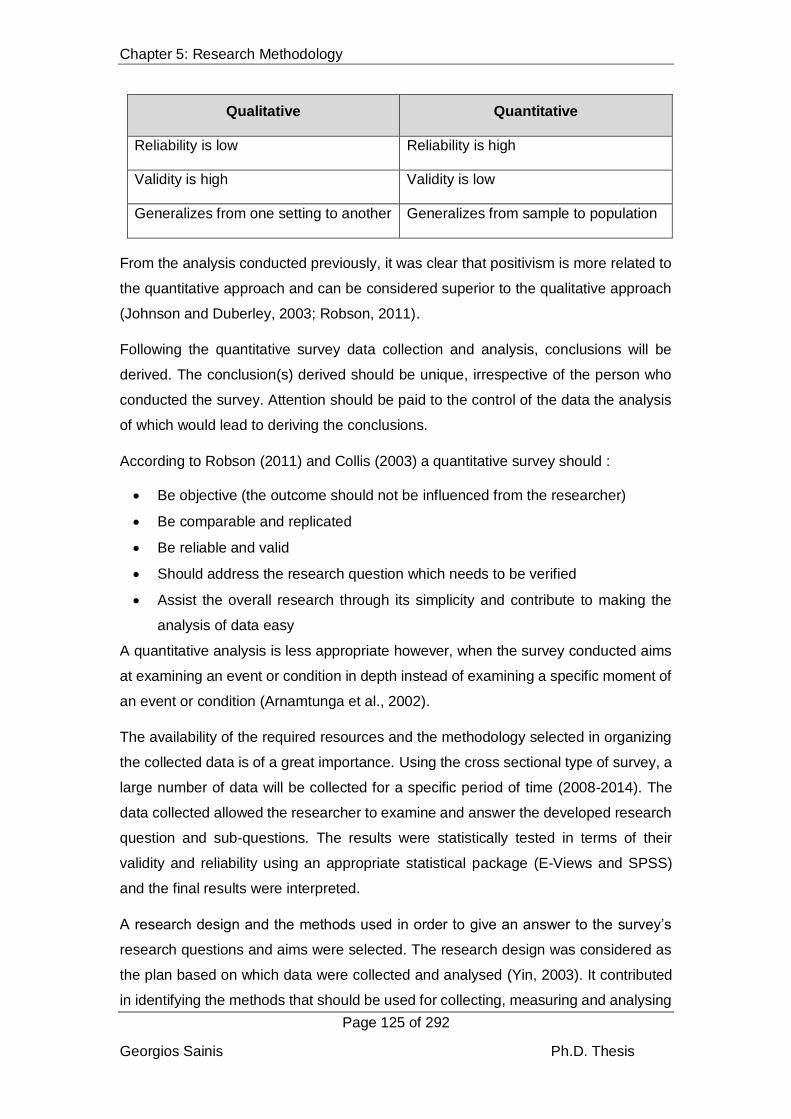
Chapter 5: Research Methodology
Page 125 of 292
Georgios Sainis Ph.D. Thesis
Qualitative Quantitative
Reliability is low Reliability is high
Validity is high Validity is low
Generalizes from one setting to another Generalizes from sample to population
From the analysis conducted previously, it was clear that positivism is more related to
the quantitative approach and can be considered superior to the qualitative approach
(Johnson and Duberley, 2003; Robson, 2011).
Following the quantitative survey data collection and analysis, conclusions will be
derived. The conclusion(s) derived should be unique, irrespective of the person who
conducted the survey. Attention should be paid to the control of the data the analysis
of which would lead to deriving the conclusions.
According to Robson (2011) and Collis (2003) a quantitative survey should :
Be objective (the outcome should not be influenced from the researcher)
Be comparable and replicated
Be reliable and valid
Should address the research question which needs to be verified
Assist the overall research through its simplicity and contribute to making the
analysis of data easy
A quantitative analysis is less appropriate however, when the survey conducted aims
at examining an event or condition in depth instead of examining a specific moment of
an event or condition (Arnamtunga et al., 2002).
The availability of the required resources and the methodology selected in organizing
the collected data is of a great importance. Using the cross sectional type of survey, a
large number of data will be collected for a specific period of time (2008-2014). The
data collected allowed the researcher to examine and answer the developed research
question and sub-questions. The results were statistically tested in terms of their
validity and reliability using an appropriate statistical package (E-Views and SPSS)
and the final results were interpreted.
A research design and the methods used in order to give an answer to the survey’s
research questions and aims were selected. The research design was considered as
the plan based on which data were collected and analysed (Yin, 2003). It contributed
in identifying the methods that should be used for collecting, measuring and analysing

Chapter 5: Research Methodology
Page 126 of 292
Georgios Sainis Ph.D. Thesis
the needed set of information (Zikmund, 2003). Supported from the research
methodology, referring to the methods and approaches used, an answer to the
survey’s research questions was obtained.
The research question in this survey is about determining the degree to which TQM
elements have been implemented in the Greek ISO certified SME, and how this has
affected their financial and operational performance. It will try to provide evidence that
the Greek SME are better able to deal with the Greek crisis conditions, if they have
continued their journey towards quality through implementing quality elements.
5.3. The Quality variables
For conducting the qualitative and quantitative survey, it was necessary to firstly
identify the set of variables that would be used in determining the level of TQM
implemented in SME. With the term “variables”, we refer to the quality characteristics
and properties that can be identified and measured (Nachmias and Nachmias, 2000).
Different types of quality variables exist and are used in different surveys. In this study,
the quality variables, were used as a means of identifying any causal relationships,
meaning how they caused a specific outcome, i.e. if they caused any change (improve
or worsen) in the level of quality implementation or if they caused any change in their
financial performance. The existence of causal relationships, could help reveal which
operational and/ or financial activities have been changed and the degree of that
change.
The first group of variables used were the quality elements that support the TQM
implementation in a company and more specifically in an SME. These were the quality
tools and techniques, the quality processes, the performance appraisal and the quality
culture. Secondly, the size of SME based on the number of employees they employee
was used, to unveil three categories the Micro, the Small and the Medium SME. As it
is explained in literature, SME are categorized into different groups based on different
criteria. For their categorization, staff headcount was used similar to the criterion used
by the European Union’s directives. The Micro SME employed less than 10 persons,
the Small SME employed 10 to 49 employees and the Medium SME employed 50 to
249 people. Companies that employed more than 250 employees are characterised
as large Companies.(SBA, 2014a)
The identification of those variables came from a series of valid and ratified models
used from different researchers that tried to examine the TQM implementation level in
companies and more specifically in SME. The main sources used for the identification

Chapter 5: Research Methodology
Page 127 of 292
Georgios Sainis Ph.D. Thesis
of the quality variables adopted in measuring an SME’s quality level was the S-P model
developed by Saunders and Preston in 2006. In addition, other quality variables found
in literature which have been developed and tested by different researchers in their
attempt to identify the implementation level of TQM to SME were used. Among those
were the surveys conducted by Hunt (1993) and the survey developed by Dandekar
(2012). The selected variables constituted the basis for which the current survey’s
variables were identified and adopted.
To strengthen the survey’s statistical analysis, the conversion of the variables used
from ordinal to categorical was made. That is, instead of scoring the quality elements
on all the ISO certified SME, they were scored after they were grouped, into different
categories using size as the criterion. That criterion, given a number of other criteria
available, i.e. the asset value, the liability or equity value, was selected as being in
congruence to the effects that the size of a company has on its operational and
financial performance (Bourlakis et al., 2014; Sedliacikova et al., 2016).
A third group of variables was also included, referring to the financial ratios used in
supporting an SME’s financial performance, explained from their liquidity, profitability,
efficiency and solvency status. The specific group of variables are explained in a
following section.
5.4. Phase One: The Qualitative Data Analysis: Methodology
Considering that a research area is clear and understandable, the use of the qualitative
approach in exploring the key research areas in detail, can further reinforce a study’s
validity factor (Boynton and Greenhalgh, 2004). Another reason for conducting a
qualitative survey was the opportunity the researchers had to verify the quality of the
questions included in the questionnaire that was used in the quantitative survey
conducted in phase two. This would allow the collection of information regarding the
SME manager’s actions and their intention to continue or discontinue the quality
implementation process.
Qualitative data are frequently used as supplementary to quantitative data collection
and analysis. The objective is to compare and contrast both sets of results. When a
qualitative analysis is conducted as supportive to a quantitative survey, a small amount
of data and a simple analysis justifies the conclusions derived (Robson, 2011)
The main characteristics of a qualitative survey which are simultaneously the main
differentiators from a quantitative survey, are that it is more flexible, it can be used in

Chapter 5: Research Methodology
Page 128 of 292
Georgios Sainis Ph.D. Thesis
different conditions and it is capable of revealing information that are intentionally or
unintentionally hidden.(King, 1994).
According to Brownell, (1995) the benefits derived from a qualitative survey and the
use of interviews are:
their flexibility - they can be used under different conditions,
their high response rate,
they allow the interviewer to identify non-verbal responses from the interviewees,
they promote higher cooperative and communicative skills,
they allow the interviewer to have better control and coordination of the
communication,
they allows the interviewer to have control over the sequence of the questions
and clarify any misunderstandings,
they allow the interviewer to have an instant follow-up,
they allow the interviewer to introduce new and unrecognized issues that were
revealed during the interview.
However interviews have a number of disadvantages with the most crucial being the
bias of the interviewer, the high cost in terms of its value and in terms of the time used.
Different type of interviews exist, depending on the way the questions are offered to
the interviewees and how the responses are controlled. The three possible type of
interviews noted in literature are the structured, semi structured and unstructured type
of interviews (Creswell, 2003). The current survey uses the semi-structured type of
interviews which allows the interviewer to ask general and diverse type of questions
and collect a large amount of valuable information (Bryman, 2001). An additional
advantage of interviews is that they allow the interviewer to ask for clarifications so the
meaning of the interviewees’ responses are better understood. It also allows the
introduction of topics and questions that were not included in the original set of
questions, but were revealed during the discussion of the two participants.
The existence of biases originating either from the interviewer or the interviewee,
requires that steps be taken to ensure the reliability of the information collected. The
clarity of the questions asked is what could minimize the interviewer’s bias. The
possibility the interviewer states the question in such a way that will pre-determine or
direct the interviewee’s answer, should be eliminated. Also, during the interpretation of
the interviewees’ statements, the personal intervention of the interviewer may also
cause bias in the results of the survey (Robson, 2011). Additionally, the lack of

Chapter 5: Research Methodology
Page 129 of 292
Georgios Sainis Ph.D. Thesis
standardisation in the interview process usually causes bias from the side of the
respondent. The validity of the interview, also needs to be secured considering that
the results derived from it should show the existence (or absence) of a relationship
between the variables examined (Saunders et al., 2003). Designing an interview,
having as controllable variables not questions, but the themes that support the
questions is a means of overcoming the possibility of being biased, and not
misinterpreting the interviewee’s questions. Interviewees’ responses were recorded
into forms and confirmed by them for their accuracy via email, before they were
processed for analysis.
The methodology approach used for their analysis was the thematic coding approach.
Codes were defined and themes were formed, relevant to the research questions.
The themes defined and the codes chosen are presented below:
Section 1’
Theme: Quality Culture Codes
Awareness of strategic challenge
Vision for the future
Innovation
Quality Policy/Philosophy
Value systems/ ethics
Top Management Involvement
Visible Commitment to Goals
Role in Quality Improvement process
Concern for improvement
Systems/ Structure for Quality Improvement
Awareness of Productivity/ Quality issues
Attitudes/ Morale
Cooperation
Involvement
Perceptions of work environment
Social Interactions
Task Characteristics
Consequential constraints
Customer Orientation
Communication

Chapter 5: Research Methodology
Page 130 of 292
Georgios Sainis Ph.D. Thesis
Section 2’
Theme: Quality Processes Codes
Job Analysis
Higher Authority
Quality Emphasis
Top Management Leadership
Customer/ Service Activities
Define Improvements
Unit Goals
Organizational Goals
Quality Planning
Planning Strategy
Organizational Streamlining
Investment/ Appropriate Technology
Methods/ Process Improvement
New Ideas
People-oriented Input
Track Progress
Measurement
Feedback
Evaluation
Results
Awards
Personnel Evaluation
Section 3’
Theme: Quality Tools &
Techniques Codes
Assessments
Definition of Tools
Measurement / Process Analysis
Awareness / Communication
Organizational Development

Chapter 5: Research Methodology
Page 131 of 292
Georgios Sainis Ph.D. Thesis
Section 4’
Theme: Performance
Appraisal Codes
Work Flow/ Delays
Waste
Tools/ Equipment
Staffing
Facilities
Training
Supplies/ Parts
Organization/ Group Structure
Customer Quality Survey
Quantity
Reliability
The more codes identified in the interviewee responses, the higher the weight assigned
to the respective theme related to the TQM elements examined.
The scale and rates used for each theme are shown below:
a/a Conditions Weight
a. Meet ISO certification standards 1
b. Meet ISO certification standards and goes for TQM 2
c. Meet TQM standards 3
The score assigned to each theme, increased or decreased the value of each response
towards quality implementation.
The average sum of all the participants of all the responses per theme, gives the value
of quality theme and the element examined. From the sum of the theme and the
element values, the value of quality implementation was identified. The maximum
value that could be assigned is equal to 3 and the minimum to 1.
Ten Greek, ISO certified SME were selected from the i-Mentor Hellastat database,
sample collected (1,245 SME) and the quality managers responsible for quality issues
were interviewed.
The methodology followed in the selection of the ten SME interviewed was the
systematic random sampling approach. Following that approach the selection of the
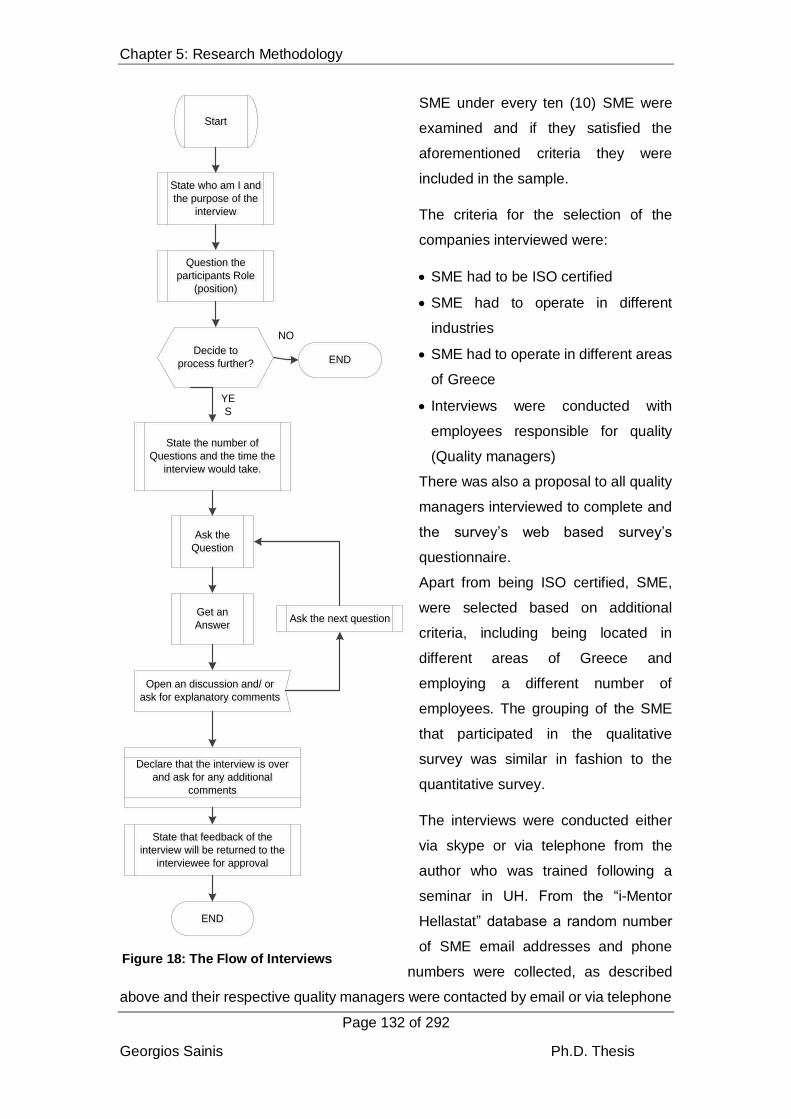
Chapter 5: Research Methodology
Page 132 of 292
Georgios Sainis Ph.D. Thesis
SME under every ten (10) SME were
examined and if they satisfied the
aforementioned criteria they were
included in the sample.
The criteria for the selection of the
companies interviewed were:
SME had to be ISO certified
SME had to operate in different
industries
SME had to operate in different areas
of Greece
Interviews were conducted with
employees responsible for quality
(Quality managers)
There was also a proposal to all quality
managers interviewed to complete and
the survey’s web based survey’s
questionnaire.
Apart from being ISO certified, SME,
were selected based on additional
criteria, including being located in
different areas of Greece and
employing a different number of
employees. The grouping of the SME
that participated in the qualitative
survey was similar in fashion to the
quantitative survey.
The interviews were conducted either
via skype or via telephone from the
author who was trained following a
seminar in UH. From the “i-Mentor
Hellastat” database a random number
of SME email addresses and phone
numbers were collected, as described
above and their respective quality managers were contacted by email or via telephone
Figure 18: The Flow of Interviews
StartStart
State who am I and
the purpose of the
interview
State who am I and
the purpose of the
interview
Question the
participants Role
(position)
Question the
participants Role
(position)
Decide to
process further?
Decide to
process further? ENDEND
NO
State the number of
Questions and the time the
interview would take.
State the number of
Questions and the time the
interview would take.
YE
S
Ask the
Question
Ask the
Question
Get an
Answer
Get an
Answer
Open an discussion and/ or
ask for explanatory comments
Open an discussion and/ or
ask for explanatory comments
Ask the next questionAsk the next question
ENDEND
Declare that the interview is over
and ask for any additional
comments
Declare that the interview is over
and ask for any additional
comments
State that feedback of the
interview will be returned to the
interviewee for approval
State that feedback of the
interview will be returned to the
interviewee for approval

Chapter 5: Research Methodology
Page 133 of 292
Georgios Sainis Ph.D. Thesis
to assess their willingness to participate in the interview. If the offer was accepted an
appointment was arranged during which the interview was conducted. It is important
to note, that all individuals approached, instantly responded positively to the request.
Notes were kept of the interviewee’s responses, in hard copy format. For confidentiality
reasons, the names of the companies participating in the survey are not shown.
Instead, in each form completed a code number was assigned, so it could be
processed and filed. For example the first participant’s code was the IP-1 (Interview
Participant-1), the second’s was the IP-2 till IP-10.
During the interview, a form with the questions that would be asked was available as
a guide to the interviewer for the process of the interview. In Figure 18 the flow chart
presented, shows and describes the structure and the flow of the interviews conducted.
It was also crucial for the quality of the survey that the opinions, beliefs and the
intentions recorded in each question came from the SME’s quality expert. So, the
managers responsible for the SME quality issues and the quality assurance
certification, support and maintenance (i.e. quality manager, production manager,
general manager) were the ones selected for the interview.
The interview form with the list of questions and the design of the interview was
assessed by a number of academics and ultimately approved by my supervisors
subject to minor corrections and improvements which related to the interview questions
and their phrasing in the Greek language.
Through a set of open ended questions (Appendix B) that were asked and discussed
with the SME quality managers, the role of quality in their company was determined
and the level of the quality elements implemented was identified.
Finally, their perception regarding the overall role of quality in their company’s
operational and financial performance was questioned.
All interviews begun with the introduction of the interviewer and the purpose of the
interview. After obtaining permission from the interviewee to continue the interview, a
set of questions related to the demographics of the company followed, i.e. the role of
the interviewee in the company, the number of employees, the industry in which the
company operates, the period that the company is ISO certified.
The second section, with a total number of six thematic questions, tried to reveal
information related to the level of TQM implementation and how each element is
perceived. Two questions related to the importance placed on quality tools and
techniques element in terms of implementing TQM. With three questions an attempt

Chapter 5: Research Methodology
Page 134 of 292
Georgios Sainis Ph.D. Thesis
was made to identify the role of the quality processes. With another two questions, the
SME’s quality culture was discussed and with one question the performance appraisal
methods and techniques adopted was discussed and analysed. The interviewees were
also asked about their perception of TQM as an idea and corporate philosophy and
about the limitations or challenges they encountered from its implementation. They
were also asked about how they perceived or realized the improvements to their
operational activities-, if any existed furthering the implementation of quality.
In the third and final part of the interview, the interviewees were questioned about the
company’s financial performance. They were asked if they consider quality as being
positively or negatively related to a company’s financial performance and if its further
implementation could result in the increase of the SME’s overall value.
It is also important to note, that the interviewer apart from the form with the interview
questions also had a list with the critical success factors corresponding to each quality
element, as these were presented in table-7 in Chapter two. This helped the
interviewer pose the questions in a clear, specific and understandable way.
It was considered as given that the company was a quality certified SME. Having been
awarded a certificate from either ELOT or from Bureau Veritas Hellas or from TÜV
HELLAS or from any other company authorized to issue standardization certificates,
the employees working and the procedures designed in this company where subject
to the ISO quality standards.
Regarding the questions in the interview, a set of ten open ended questions (in Greek
and in English), presented in Appendix-E’ were delivered to the interviewees. The first
question, A1, was related to the level of implementing quality tools and techniques in
the company’s operations. Interviewees were expected to respond that the criterion
has been fulfilled to a point that satisfies the ISO requirements. Alternatively that the
ISO standards have been fully introduced and effort has been put into further
introducing TQM tools and techniques. Another possible response could be admitting
that the attempt to fully satisfy the TQM requirements and specifications was made.
The second question, B2, examined the rate by which the level of training of the
employees engaged in the company’s operations, has been improved. Possible
responses included that the ISO requirements have been satisfied or that the company
has introduced training programs that satisfy the ISO requirements, together with new
and more TQM oriented training programs. Another possible answer could be that the
Chapter 5: Research Methodology
Page 135 of 292
Georgios Sainis Ph.D. Thesis
company will attempt to introduce advanced training programs according to the
specifications and the needs of TQM.
The next section referred to the level by which the TQM processes had been
implemented. Question B1, referred to the level of cooperation and teamwork
incorporated into the company’s processes. Possible responses to this question
included the use of formal and/or informal groups, the use of group evaluation
procedures, or the formation of project groups only. Question B2 referred to the level
of innovation and creativity that had been introduced to the company’s quality
processes. Interviewees possible responses included the implementation of the ISO
requirement for the development of new ideas, the development of a new ideas plan,
the introduction of a new ideas reward package, or the availability of a special fund,
suitable for financing new highly rated ideas. Question B3 also referred to the TQM
processes and specifically to the “continuous improvement” processes. Respondents
were expected to answer either that they use the “continuous improvement” as it is
specified by the ISO specifications, or that the “continuous improvement” idea spread
over the whole organization, or through formal groups (assigned project) or informal
groups (TQM level). Question D1 was developed in order to measure the level of
implementation of the company’s quality culture. At first the question tried to identify if
the company has developed and operated according to a long term quality plan. The
company’s method of implementing this plan would reveal the elements related to its
corporate culture and whether the quality cultural characteristics had been
incorporated within it. In question E1, the interviewer tried to identify the extent to which
performance appraisal techniques had been implemented into the SME’s quality
functions. Possible measurements used from measuring the quality cost and the time
the company saved from introducing quality in its operations was what this question
was trying to reveal. The interviewees’ response would be evaluated based on whether
they maintain the performance appraisal techniques at a level specified in the ISO
standards, or if they had improved them further with the implementation of more
advanced techniques (i.e. balance scorecard, six sigma). Finally, question F1 tried to
assess the consequences of the TQM implementation level on the company’s financial
performance. The question referred to possible improvements in the company’s
liquidity, solvency, profitability and/or efficiency ratios. During the interview,
interviewees, where asked about the rates of the ratios found in the i-Mentor Hellastat
database during the period 2008-2014. Interviewees were likely to mention one of the
following scenarios: an improvement in the company’s financial performance, minor
improvements in its financial performance, acknowledging that no improvements had

Chapter 5: Research Methodology
Page 136 of 292
Georgios Sainis Ph.D. Thesis
occurred or that the improved level of the quality elements implementation had led to
the deterioration of the company’s financial performance.
It is important to note that all the aforementioned questions were open ended
questions. This meant that during the interview all interviewees were capable as well
as encouraged, to propose different ways of answering the questions.
5.5. Phase Two: The Quantitative Data Analysis: Methodology
A quantitative approach gives a researcher the ability to collect numeric information
capable of identifying and measuring different experiences, that come from different
quality experts who work in the Greek ISO certified SME. (Maxim, 1999)
The selection of the quantitative survey aims at the collection of data that will manage
to give an answer to the survey’s research questions. The data also have to be
statistically tested for their causes and for their relationships (Bryman and Cramer,
2001). An added value to a researcher’s survey is the chance to identify something
that can also be used in other occasions and surveys (Hussey and Hussey, 1997).
Selecting the most appropriate research design, a survey offers an opportunity to
examine a number of social elements that are interrelated or mutually influential. The
data collected from the survey conducted, after being analysed, could reveal
explainable and rational information. Those could lead a researcher in developing a
rational and explainable set of conclusions, models and/ or events. The results derived
from it however, should appeal to the whole population and not only to the sample
examined. It should also appeal to all the variables examined and to their in- between
interrelationships. Following the cross sectional design, the advantages derived are
the independence it offers the researcher in what it examines and the availability of the
information needed. The method’s inability to rationally explain any correlations among
the used variables and the (mainly external) factors that influence their behaviour, are
thought to be its major disadvantages (Bryman and Bell, 2003).
Given that the survey needs to examine different groups formed from the Greek, ISO
certified SME, the cross sectional design, is considered the most appropriate method
for comparing them. Under the cross sectional design, the analysis of the variability of
the outcome is determined from the different characteristics of the groups being
examined (Easterby-Smith et al., 2001).

Chapter 5: Research Methodology
Page 137 of 292
Georgios Sainis Ph.D. Thesis
5.5.1. Sample size selection and use in the survey
Using positivism as the research approach, and the mixed methodology approach
(questionnaire and interviews), specific answers were explored as being related to the
survey’s research questions (Who, What, When, How many, How much). They also
focused on the contemporary events associated with the Greek SME quality and TQM
implementation level (Yin, 2003).
Regarding the process of collecting the survey’s sample, it was important that the
sample size be big enough to represent the population of SME that are currently
operating in the Greek market. A company would be included in the sample, if it was
at first a small in size entrepreneurship (SME), as this is defined in the 2015 SBA
(Small Business Act) in Europe and if it was an ISO certified company.
The total population of SME in Greece according to the SBA fact sheets (SBA, 2014a)
is equal to 653,944 of which 629,811 are micro companies, 21,669 are small and 2,464
are medium sized companies. The SME that are certified with the ISO-9001 standards,
according to a sector study developed by the ICAP Group, the only Greek company
that is recognized by the Bank of Greece as an external credit assessment Institution
(ECAI), are equal to 6,000 companies. This number of companies will constitute the
survey’s population from which the sample will be derived. The size of the sample that
could give reliable returns, was found with the use of a sample size calculator with a
95% confidence level, and a confidence interval of 6 points. The sample size that the
formula returned was 400 SME (Creative Research Systems, 2015). This is also the
amount of SME that should respond to the survey in order for it to be statistically
significant.
The reasons for selecting the specific sample were:
In recent years, the Greek SME have realized the importance of implementing
the quality elements and becoming ISO certified. Without having the ISO
certification, they couldn’t participate in any of the public, private, local or
international tenders. Without introducing quality to their operations they were
directly and indirectly reducing their investment opportunities.
To be ISO certified, the Greek SME have developed and implemented
procedures and management processes, which offer them the capability of
primarily measuring and valuing their operational performance.
Chapter 5: Research Methodology
Page 138 of 292
Georgios Sainis Ph.D. Thesis
That it included SME operating in all the different sectors of the Greek economy
into the sample of this survey. Including SME from various sectors of the Greek
economy, has improved the reliability of the results derived. Using data selected
from a single industry or sector, would reflect deficiencies or peculiarities of that
economic sector in the analysis and the results derived from the thesis.
Having reviewed the questionnaire, an email was prepared and a memo was send to
a number of recipients inviting them to participate in the survey. The memo also
included the web-address (link) that would lead them to the appropriate site where the
questionnaire was located.
The email was send to approximately 1,245 ISO certified SME. The email addresses
were taken from the data base “i-Mentor Hellastat”, in which the American College of
Greece (Deree College), the institution that currently employs the researcher is
officially registered. The database i-Mentor Hellastat is managed by Hellastat S.A, the
Greek Statistical & Economic Data Service. It operates in the areas of business
information, market research, decision support systems and advisory services.
Hellastat is a strategic partner of Moody's and of Thomson-Reuters plc and is certified
by Lloyd's Register for quality assurance process in information. It generally provides
services related to the provision of economic and business information and services.
Hellastat SA is also a member of SEV (the Federation of Greek Industries), EADP (the
European Association of Database & Directories Publishers) and ESOMAR (the World
Association of Opinion & Marketing Research Professionals). The database i-Mentor
Hellastat constituted the main source for also collecting the secondary data (financial
information - financial statements, ratios) of this survey for the examination of the
Greek SME financial performance and sustainability.
The invitation email was send to 1.450 email addresses but only 1,245 recipients
opened and read the message. From those only 413 questionnaires were fully or
partially completed, giving a response rate equal to 28%. Further examination of the
answered questionnaires, revealed that a number of them were not fully answered and
thus were excluded from the analysis. Eventually, only 392 of them were considered
as fully completed and constituted the survey’s collected sample presented in
Appendix A’, resulting in a response rate equal to 27%. It is important to note, that the
invitation email was send six consecutive times in regular intervals to all potential
respondents –SME, recorded in the i-Mentor Hellastat database.

Chapter 5: Research Methodology
Page 139 of 292
Georgios Sainis Ph.D. Thesis
5.5.2. The statistical analysis adopted
Considering that this survey aims at finding and giving answers to a set of research
questions; different quantitative methods were used in analysing and testing their
correctness and accuracy, starting from simple descriptive statistics and moving
towards more advanced techniques like scoring analysis; correlation coefficient
analysis; analysis of variance (ANOVA) and multivariate analysis of variance
(MANOVA). The use of a statistical package appropriate for social sciences like the E-
Views and the SPSS packages were used.
In order to organize and summarize the collected data, descriptive statistics were used.
Descriptive statistics give meaning to a set of data and help a researcher measure and
derive those values that characterise their behaviour (Nachmias and Nachmias, 2000)
Means, averages and standard deviations were used in describing the responses of
the participants. Graphs and figures were also used in order to plot, measure and
compare the performance of different variables.
Alpha coefficient or Cronbach alpha, was used to measure the consistency and
reliability of the data collected. Alpha coefficient is considered as the average of all the
correlations in a set of data. High rates of alpha coefficient is an indication that the data
included in the analysis, share the same scope of the analysis. Low rates of alpha
coefficient indicate that part of that data should be excluded from the group. The data
eliminated would represent data that have low or zero correlation with the total score
and would cause a reduction in the single to total correlation (Rollins et al., 2007).
Pearson correlation coefficient was used as a means of explaining the relationship
between two variables. Pearson’s “r” has a range between -1 to +1, depending if the
correlation is positive or negative. When correlation among two variables is equal to 1
it means that the first variable explains the behaviour of the second and if it is equal to
zero, it doesn’t (Pallant, 2001)
The ANOVA and MANOVA analysis were used to identify possible existing differences
among two or more groups of variables. In the current survey, ANOVA was used for
the identification of possible differences between the different sized SME, in relation to
the level of the implemented TQM elements and their financial performance.
Supportive to the ANOVA and MANOVA analysis is the F-ratio and the P-value
statistics. The first, refers to the ratio that shows the relationship between the mean
variability of each group with the mean variability among the groups. The F-ratio
measures the cause of variance due to a given action or in our case, a given SME’s

Chapter 5: Research Methodology
Page 140 of 292
Georgios Sainis Ph.D. Thesis
size. Rejecting the null hypothesis is the result of a high F ratio, because it shows that
there is no difference between the means among the groups. Regarding the p-value,
its value should be equal to 0.5 or less in order to be considered significant (Tourna-
Germanou, 2007).
5.5.3. The questionnaire design and the Pilot Study
The development of a questionnaire is regarded as the most important task a
researcher has to undertake. It will guarantee the quality of the data collected and the
quality of the research conducted. By designing a reliable, understandable and clear
rated questionnaire a researcher will have the opportunity to collect all the necessary
information needed to arrive to reliable conclusions (Oppenheim, 1992).
According to a number of researchers, Robson (2011), Bryman (Bryman, 2004),
Sekaran (2003) and Ghauri et al., (1995), the reasons why a questionnaire is selected
in a survey include the following:
1. The questionnaire covers the needs of the survey strategy
2. It can be broadly used in management studies;
3. It needs a limited amount of time to be completed, which is beneficial for the
researcher but for the respondents as well;
4. It is effective in its use and its cost in collecting primary data
5. It minimizes the negative effect(s) realized from the presence of an
interviewer, leaving the respondent to respond freely and without bias;
6. Values, beliefs and motives can be identified more easily and directly than
in any other method used;
7. It can be completed on the web with the expectation for a high response
rate.
The research conducted is an in depth research in literature related to TQM in SME
and their financial performance. The research focuses on the period 2008-2014 during
the economic crisis, which started in the years 2007-08 and during that time reached
its peak. The eight year period will also examine the SME’s financial performance and
their financial and operational sustainability under the crisis conditions.
The questionnaire was distributed in a period that started on the 12 th of August 2015
and ended on the 29th of February 2016. Equivalent approval from the University’s
Ethics Committee was granted. The interviews conducted with the Greek SME quality
managers, took place within that same period.

Chapter 5: Research Methodology
Page 141 of 292
Georgios Sainis Ph.D. Thesis
A questionnaire is designed and constructed with the aim of collecting the information
needed to answer the survey’s research questions and sub questions. A number of
drafts were prepared until a final version was developed and distributed to a number
of experts in the field of quality or in the field of finance. Experts like the researcher’s
supervisors, a number of business people and experts in the quality assurance and
TQM received, examined and commented on the final version of the questionnaire.
The questionnaire was also given for review to a number of the researcher’s
colleagues who given their status as Professors/ Instructors of courses related to the
area of quality management, operations management and finance, who have critically
reviewed and evaluated the questionnaire and their comments were incorporated into
the final version of it.
A questionnaire should allow the respondent the appropriate time and space, to
express his/her opinion on the questions posed. At the same time, it should, not tire
him/her, so the questions can’t be too long nor too short. (Creswell, 2003) The main
objective in the design of the questionnaire, is to have questions that are short, simple
and meaningful. Thus those responding to the survey will understand what the
questions ask and offer a correct answer(s) in return (Ghauri et al., 1995).
It is believed that a questionnaire’s role is to offer "objective means of collecting
information knowledge, beliefs, attitudes and behaviour" (Oppenheim, 1992). As it is
supported from Boynton & Greenhalgh (2004), the use of a previously validated and
published questionnaire is effective and helpful because it will save the researcher
time and resources, enabling him to make comparisons between his findings and the
findings originating from similar surveys.
So, to formulate a validated questionnaire for the survey, a set of questions were
initially selected from a pool of questions, developed by Daniel Hunt (1993). The
questions selected were related to the variables/critical factors that the survey is
examining. A number of questions were combined and merged with questions
presented in other questionnaires that have been developed and used. At first, the one
developed by Sashkin M. and Rosenbach (2013) was used, which assessed the
cultural variables implemented in an organization. At second, the questionnaires
developed by Samson’s and Terziovski (1999) who tried to identify the relationship
between TQM implementation and operational performance were considered. In
addition, the questionnaire developed by Sousa et. al., (2005) and the questionnaire
developed for the examination and implementation of the EFQM quality model were
used.

Chapter 5: Research Methodology
Page 142 of 292
Georgios Sainis Ph.D. Thesis
Keeping in line with the categorization of the selected and adjusted questions into
different sections as Hunt D. (1993) and Phu V. (2011) proposed, different sections
were formed. Each section would try to identify and measure the quality elements that
characterise a TQM company. These sections refer to the organization’s quality
culture, the quality processes, the quality tools and techniques adopted and the quality
methods used in appraising the company’s operational performance. Each section
also contains a set of assessment criteria that could be applied to an SME. The
assessment criteria will not only assess the practices, policies, procedures and
attitudes used to further support quality, but will also be used for checking the progress
of the company from the quality assurance stage to the TQM implementation stage.
The questions chosen were adjusted in their phrasing, to incorporate all the
assessment criteria that was found in almost all five questionnaires used. In addition,
all four groups of questions, were also related to the variables (quality elements)
included in the four layers that Saunders and Preston (2006) presented and used in
their S-P model. The layers used were named “the basic”, “the prerequisites”, “the
ability to improve” and “the outcomes derived”. They characterise a quality system as
being a part of a company’s and more specifically an SME’s, business strategy. The
test was conducted in order to identify and justify not only if an SME implements a
TQM system, but also if any added value has been recognized from that. The analysis
and evaluation of the Greek SME’s financial performance would indicate the rate of
growth of that added value.
In addition to the above mentioned sections, at the end of the questionnaire one more
section was introduced asking participants to provide financial data relating to their
company. The questions asked for the rates of a specific number of financial ratios to
be used in the SME financial performance evaluation. The i-Mentor Hellastat database
among other financial data (Financial statements) also includes data related to
companies’ financial performance (financial ratios). Given that the questionnaire was
distributed only to SME that were registered in the i-Mentor Hellastat database,
participants were requested to only use those rates when responding to the equivalent
questions. These would be used to identify the consequences (positive or negative)
from the implementation of the TQM elements on the SME selected financial position
and financial performance.
With the aim of improving the quality of the instrument (questionnaire) used in
collecting the necessary for the survey data, its reliability and validity were statistically
examined. Both would increase its strength as a measurement tool and improve the

Chapter 5: Research Methodology
Page 143 of 292
Georgios Sainis Ph.D. Thesis
scale used in measuring the value of each variable examined. If the instrument is not
adequately developed the low levels of consistency and accuracy of the results leaves
room for criticism (Babbie, 2004).
Reliability deals with the accuracy of the scale. It tests if the scale used in measuring
the value of a response is the same every time a specific issue is measured (Babbie,
2004). Reliability is measured through the Cronbach’s alpha coefficient. It measures
the internal reliability of a scale, that is, if each scale measures just one idea and not
more than one. Values higher that 0.6 are considered as valid. In addition to the
internal, the external reliability was also examined which determines how consistent a
scale is over time. The method that can improve the external reliability of an instrument
is the test-retest method which entails that, the same person completes the
questionnaire at two different points in time. The closer the results derived, the higher
the external reliability of the instrument. This process was followed with two of the
quality consultants who participated in the questionnaire’s design. The differences
among the answers returned from the same people, on average, were less than 1.5%.
The instrument’s (questionnaire) validity, refers to its ability of measuring what has to
be measured (Babbie, 2004). Different types of Validity exist, the face validity, the
content validity and the construct validity. The first deals with how the questionnaire
looks. The questionnaire in this survey was a web based questionnaire so not many
format options were available. The content validity, deals with the meaning and the
concept of every question in the questionnaire and ensures that the instrument
measures and examines all the dimensions of a concept (Babbie, 2004). The sources
used for the design and preparation of the questionnaire’s questions were instruments
(questionnaires) that have already been used and verified for their validity. They have
been defined as instruments that could measure what they intend to measure [Saskin
and Galagan (1992), Hunt (1993), Sousa and Aspinwall (2010)]. Thus the current
survey’s questionnaire content validity was directly verified. Construct validity, mainly
deals with the validity of the relationships that exist among the variables used in an
instrument. For verifying the construct validity, different methods can be used, such as
the internal structural analysis or the cross-structural analysis. The first examines the
relationship between the questions and the scales selected and the second examines
the relationship between the selected scales and the scales used in similar instruments
(Babbie, 2004). It is commonly accepted that the best technique for combining
(merging) similar questions and assigning the best scale, is the factor analysis and
specifically the principle component factor analysis (Ford et al., 1986). Given that the
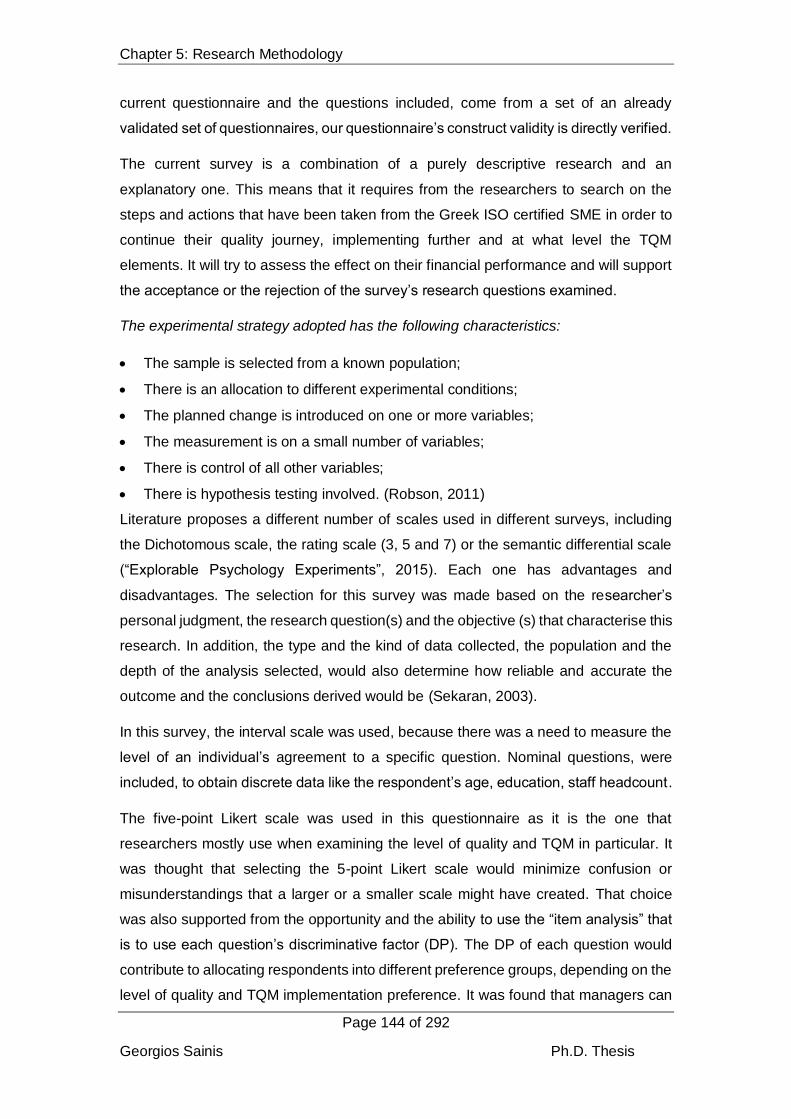
Chapter 5: Research Methodology
Page 144 of 292
Georgios Sainis Ph.D. Thesis
current questionnaire and the questions included, come from a set of an already
validated set of questionnaires, our questionnaire’s construct validity is directly verified.
The current survey is a combination of a purely descriptive research and an
explanatory one. This means that it requires from the researchers to search on the
steps and actions that have been taken from the Greek ISO certified SME in order to
continue their quality journey, implementing further and at what level the TQM
elements. It will try to assess the effect on their financial performance and will support
the acceptance or the rejection of the survey’s research questions examined.
The experimental strategy adopted has the following characteristics:
The sample is selected from a known population;
There is an allocation to different experimental conditions;
The planned change is introduced on one or more variables;
The measurement is on a small number of variables;
There is control of all other variables;
There is hypothesis testing involved. (Robson, 2011)
Literature proposes a different number of scales used in different surveys, including
the Dichotomous scale, the rating scale (3, 5 and 7) or the semantic differential scale
(“Explorable Psychology Experiments”, 2015). Each one has advantages and
disadvantages. The selection for this survey was made based on the researcher’s
personal judgment, the research question(s) and the objective (s) that characterise this
research. In addition, the type and the kind of data collected, the population and the
depth of the analysis selected, would also determine how reliable and accurate the
outcome and the conclusions derived would be (Sekaran, 2003).
In this survey, the interval scale was used, because there was a need to measure the
level of an individual’s agreement to a specific question. Nominal questions, were
included, to obtain discrete data like the respondent’s age, education, staff headcount.
The five-point Likert scale was used in this questionnaire as it is the one that
researchers mostly use when examining the level of quality and TQM in particular. It
was thought that selecting the 5-point Likert scale would minimize confusion or
misunderstandings that a larger or a smaller scale might have created. That choice
was also supported from the opportunity and the ability to use the “item analysis” that
is to use each question’s discriminative factor (DP). The DP of each question would
contribute to allocating respondents into different preference groups, depending on the
level of quality and TQM implementation preference. It was found that managers can
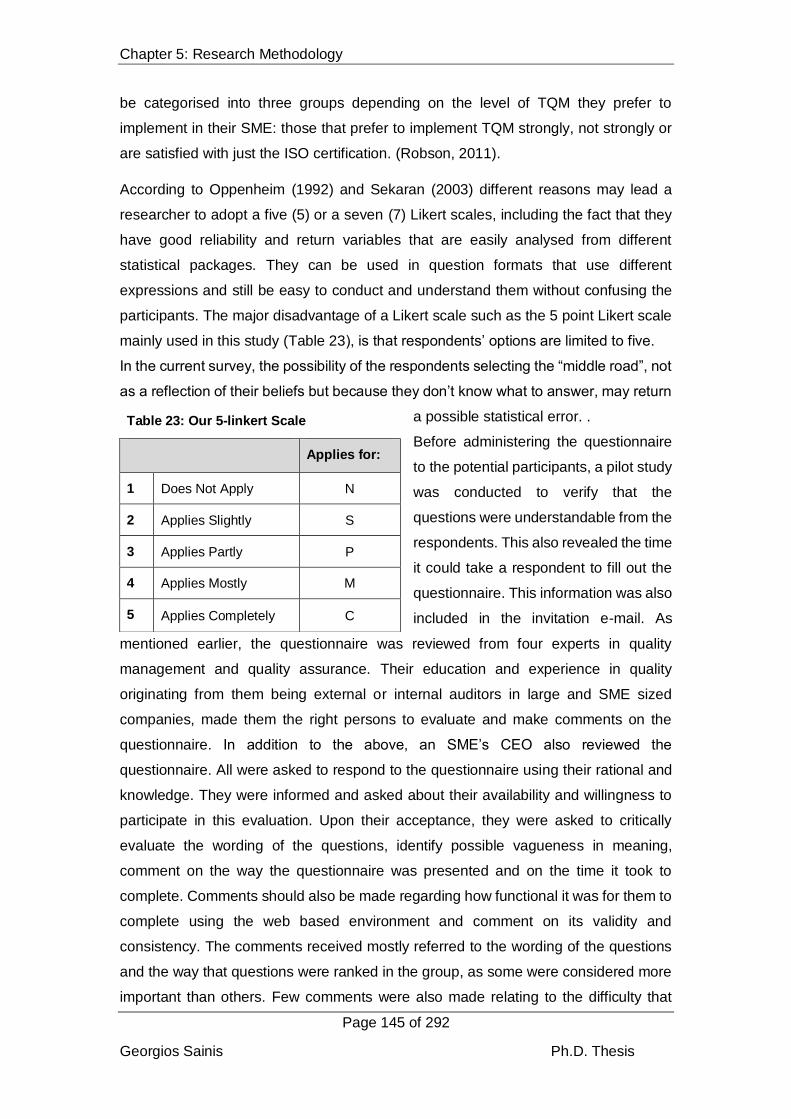
Chapter 5: Research Methodology
Page 145 of 292
Georgios Sainis Ph.D. Thesis
be categorised into three groups depending on the level of TQM they prefer to
implement in their SME: those that prefer to implement TQM strongly, not strongly or
are satisfied with just the ISO certification. (Robson, 2011).
According to Oppenheim (1992) and Sekaran (2003) different reasons may lead a
researcher to adopt a five (5) or a seven (7) Likert scales, including the fact that they
have good reliability and return variables that are easily analysed from different
statistical packages. They can be used in question formats that use different
expressions and still be easy to conduct and understand them without confusing the
participants. The major disadvantage of a Likert scale such as the 5 point Likert scale
mainly used in this study (Table 23), is that respondents’ options are limited to five.
In the current survey, the possibility of the respondents selecting the “middle road”, not
as a reflection of their beliefs but because they don’t know what to answer, may return
a possible statistical error. .
Before administering the questionnaire
to the potential participants, a pilot study
was conducted to verify that the
questions were understandable from the
respondents. This also revealed the time
it could take a respondent to fill out the
questionnaire. This information was also
included in the invitation e-mail. As
mentioned earlier, the questionnaire was reviewed from four experts in quality
management and quality assurance. Their education and experience in quality
originating from them being external or internal auditors in large and SME sized
companies, made them the right persons to evaluate and make comments on the
questionnaire. In addition to the above, an SME’s CEO also reviewed the
questionnaire. All were asked to respond to the questionnaire using their rational and
knowledge. They were informed and asked about their availability and willingness to
participate in this evaluation. Upon their acceptance, they were asked to critically
evaluate the wording of the questions, identify possible vagueness in meaning,
comment on the way the questionnaire was presented and on the time it took to
complete. Comments should also be made regarding how functional it was for them to
complete using the web based environment and comment on its validity and
consistency. The comments received mostly referred to the wording of the questions
and the way that questions were ranked in the group, as some were considered more
important than others. Few comments were also made relating to the difficulty that
Table 23: Our 5-linkert Scale
Applies for:
1 Does Not Apply N
2 Applies Slightly S
3 Applies Partly P
4 Applies Mostly M
5 Applies Completely C
Chapter 5: Research Methodology
Page 146 of 292
Georgios Sainis Ph.D. Thesis
respondents would experience regarding the completion of the financial performance
section.
All proposals and suggestions made by the experts, were considered and a revised
version of the questionnaire was send to them together with a document which they
had to sign to declare their agreement with the fact that the specific questionnaire was
capable of collecting the information for which it was designed for.
In concluding the questionnaire’s development process, special codes were assigned
to each question and different groups of questions were formed in order to be further
processed by a statistical package. The software used for this survey were the E-
Views, the SPSS (Statistical Package for Social Sciences) and the Microsoft Excel
package, each used in different occasions.
Before administering the questionnaire to the selected sample of SME, it was
translated into Greek to increase its reliability. Despite the fact that the majority of
Greek managers understand and speak the English language, the conceptual
understanding of the questions posed was considered vital. It was thought that
translation would minimize the possibility of the questions being misinterpreted so each
question on the questionnaire was shown simultaneously in English and in Greek.
To verify the reliability of the translation, the “back translation” approach was followed.
Based on this approach, the questionnaire was first translated from English to Greek,
and the resulting document was translated from another person from Greek back to
English. In this case the individual selected to “back translate” was a Greek-English
instructor. The two “English versions” of the questionnaire were then compared, Minor
differences were found between the two versions allowing the distribution of the
questionnaire to begin.
The questionnaire that was finally produced was broken down into six sections, the
first four were related to the quality elements of TQM applied to an SME, the fifth
focused on the financial indicators (financial ratios) that characterise the SME and the
sixth one was related to the participants demographics and the number of employees
they are currently employ.
The sections developed are presented below along with their equivalent aim:
Section I: Quality Management Tools and techniques.
Based on Shaskin’s and Kiser’s research (1993) three are the uses of the statistical
processing control tools adopted by TQM. The first is to understand and describe the

Chapter 5: Research Methodology
Page 147 of 292
Georgios Sainis Ph.D. Thesis
work processes and activities performed within a company’s operations in order to be
in a position to count, record and interpret the results derived from them. The second
contributes in identifying, focusing on, understanding and correcting any abnormal
variations and their causes and the third is to provide the required information in
improving the performance of all the work processes and activities implemented. So,
the role and the purpose of the statistical process control procedures is to establish a
“continuous improvement process” to a company’s operations.
The aim of this part of the questionnaire is to understand the participants’ perception
for the quality tools and techniques applied in terms of the level of training received
from the involved employees and the level of their use in measuring the level of quality
and its improvements.
Section II: Organizational Culture
As Deming stated “Tools are necessary but not sufficient” (Sashkin & Kiser, 1993).
The Tools and techniques used are the most real evidence of TQM implementation.
But statistical tools and only those cannot lead to quality and TQM. Additionally, J.M.
Juran (February 6, 1990) stated that “a good way to lose time in improving quality is to
focus on tools and try to apply them”. Just using statistical tools will never bring quality
and TQM to a company.
To implement TQM into an organization, all the values and beliefs that support the
company’s culture should be based on the TQM’s assumptions (Sashkin and Kiser,
1993b). When we see and interpret TQM as being an element within an organization’s
cultural dimensions, it is important to also see and know what these cultural elements
are. According to Sashkin (1993) the crucial cultural elements in an organizations are
eight. The first is the quality information that needs to be used as a means of appraising
and improving employees’ performance and not just for evaluating or controlling them.
A second element is the authority level that should be equal to the responsibility level
assigned to all the people operating in an organization. A third one, is to have a
rewarding system capable of supporting the results and conclusions derived. The
fourth element is the sense of cooperation instead of competition among the people
that are working as a team. A fifth element is the feeling of security transmitted to the
people working in the organization and the sixth is the sense of fairness that exists in
a company's environment. The seventh element is the equitability among the
employees compensation plan and the eighth is the expectation that all employees of
an organization have in ownership stake. Supporting all those eight elements is what
could improve a company’s quality and TQM cultural level.
Chapter 5: Research Methodology
Page 148 of 292
Georgios Sainis Ph.D. Thesis
Section III: Processes
In business literature it is realized that the constant improvement in a company’s level
of quality requires a continuous improvement in its processes. If a company wants to
increase the level of its quality, it needs to reduce the variability of its processes. For
that it needs to apply a set of quality performance measures to its processes. Some of
those measures are identified from a number of authors, like Juran & Godfrey (1999),
Hakes (2001), Divorski & Scheirer (2001) who among others pointed out the need for
establishing and validating the objectives of the performance measures adopted for
each and every different process implemented. These measures will guide a company
and its management in making more accurate and reliable strategic decisions
regarding the processes adopted. Performance measures would influence the
company’s behaviour and affect the implementation of its processes and its strategic
plans (Neely et al., 1994). So, the actual work flow from suppliers to customers through
work processes should incorporate quality management process that have a reverse
direction. This would further support the quality character of a company’s cultural
environment and further encourage the TQM implementation.
Section IV: Organizational performance Assessment
The performance appraisal (assessment) system design and use is a critical factor in
determining whether a company’s quality journey has succeeded or not. It is important
even if a TQM program is not successfully implemented in a company, that the
appraisal systems remain functional. This is because, as Deming and other
researchers have noted, such a system supports a company’s operational and
financial performance consistency. The idea to comprise a performance appraisal
system into a company’s quality management system (TQM) is supported extensively
from literature (Blackburn and Rosen, 1993; Soltani et al., 2006). Specifically, it states
the importance of implementing a quality system in terms of a company’s training
products that would standardise its review process and apply or adjust its progress
reports. This would create a continuous monitoring process applied on the whole
organization’s agreed goals and objectives.
Section V: Financial Performance indicators
This section trys to identify a set of financial indicators that will characterise the
financial performance of a company participating in the survey. Considering that the
company’s overall financial performance is expressed through its profitability,
efficiency, liquidity and solvency level, a set of the most powerful and extensively used
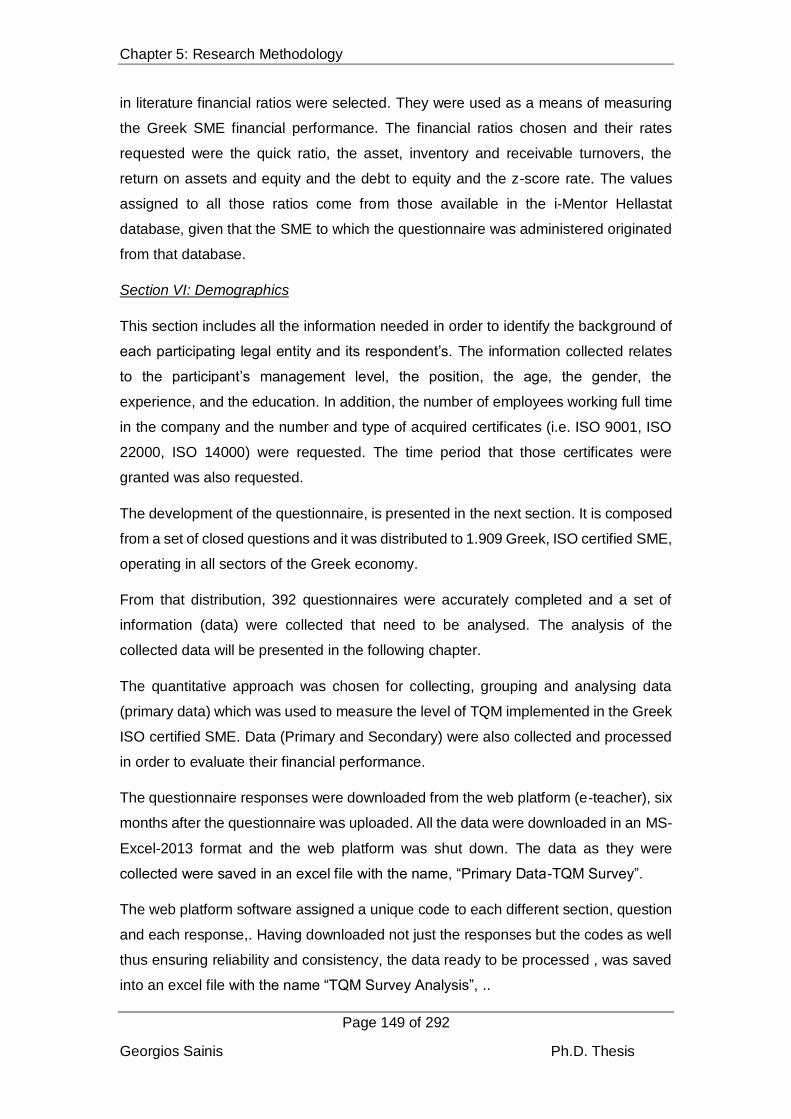
Chapter 5: Research Methodology
Page 149 of 292
Georgios Sainis Ph.D. Thesis
in literature financial ratios were selected. They were used as a means of measuring
the Greek SME financial performance. The financial ratios chosen and their rates
requested were the quick ratio, the asset, inventory and receivable turnovers, the
return on assets and equity and the debt to equity and the z-score rate. The values
assigned to all those ratios come from those available in the i-Mentor Hellastat
database, given that the SME to which the questionnaire was administered originated
from that database.
Section VI: Demographics
This section includes all the information needed in order to identify the background of
each participating legal entity and its respondent’s. The information collected relates
to the participant’s management level, the position, the age, the gender, the
experience, and the education. In addition, the number of employees working full time
in the company and the number and type of acquired certificates (i.e. ISO 9001, ISO
22000, ISO 14000) were requested. The time period that those certificates were
granted was also requested.
The development of the questionnaire, is presented in the next section. It is composed
from a set of closed questions and it was distributed to 1.909 Greek, ISO certified SME,
operating in all sectors of the Greek economy.
From that distribution, 392 questionnaires were accurately completed and a set of
information (data) were collected that need to be analysed. The analysis of the
collected data will be presented in the following chapter.
The quantitative approach was chosen for collecting, grouping and analysing data
(primary data) which was used to measure the level of TQM implemented in the Greek
ISO certified SME. Data (Primary and Secondary) were also collected and processed
in order to evaluate their financial performance.
The questionnaire responses were downloaded from the web platform (e-teacher), six
months after the questionnaire was uploaded. All the data were downloaded in an MS-
Excel-2013 format and the web platform was shut down. The data as they were
collected were saved in an excel file with the name, “Primary Data-TQM Survey”.
The web platform software assigned a unique code to each different section, question
and each response,. Having downloaded not just the responses but the codes as well
thus ensuring reliability and consistency, the data ready to be processed , was saved
into an excel file with the name “TQM Survey Analysis”, ..

Chapter 5: Research Methodology
Page 150 of 292
Georgios Sainis Ph.D. Thesis
From the web platform e-teacher, the following information and codes were assigned.
For each questionnaire, a code has been given (i.e. 1, 2, 3…) together with the date
and the time that the questionnaire was completed (i.e. 2015-12-06 08:14:02). Codes
were also given to each different response recorded (i.e. A1 or A2 or A3 or A4….).
Finally the values given to each financial ratio were downloaded each with a different
serial number (i.e. Z1 [SQ003]). Specifically, from the section Z1 (Profitability), the
equivalent question answered had the code SQ003 (Acid Test ratio).
Based on the use of the five point Likert scale, the first part of the questionnaire that
examined the Quality tools and techniques with seven questions, could get a maximum
value equal to 35 and a minimum value equal to 7. The second part that examined the
quality processes with sixteen questions, could obtain a maximum value of 80 and a
minimum of 16. For the third and fourth part that examined the quality culture and the
performance appraisal respectively, each with nine questions, the maximum value
could be equal to 45 and the minimum to 9. The maximum value of the total score
could be equal to 205 and the minimum to 41.
5.6 Phase Three - Financial Data Analysis: Methodology
In order to investigate the impact of TQM implementation on the financial performance
of the Greek ISO certified SME’s, financial data that refer and give a clear and reliable
picture of that performance should be collected and analysed.
A number of tools have been used in different surveys trying to reveal a company’s
financial performance. However the easiest and more applicable method used in
identifying a company’s financial power and status, is the ratio analysis (Shahin, 2011).
Through analysing a company’s financial ratios we can identify, the outcomes of the
internal decisions and the different and occasionally difficult environmental conditions
in a quantifiable, unbiased and meaningful way (Voulgaris et al., 2000) Different sets
of ratios are used for different purposes but they are mainly used to examine a
company’s comparative performance in terms of either their own h istoric data or in
terms of their competition. Financial ratios are used in order to measure the operational
and the financial performance of a company and specifically an SME. (Hirt et al., 2013)
Four different group of ratios are commonly used to measure a company’s financial
performance. These are the profitability ratios, the solvency ratios, the efficiency ratios
and the liquidity ratios. Of the four groups of ratios, the ratios that were mostly used
from other surveys and those that were stricter in evaluating a company’s financial
performance were selected as these are shown in the following graph. (Figure 19).
Chapter 5: Research Methodology
Page 151 of 292
Georgios Sainis Ph.D. Thesis
Figure 19: Ratios for Measuring Financial Performance
The selected number of financial ratios derived from the groups above, the quality data
collected from the returned questionnaires and the financial data collected from i-
Mentor Hellastat database, enabled the identification of the SME financial
performance. This level was then related with the TQM implementation level from each
different group of SME formed and examined.
Delen et al., (2013) have stated that ROA and ROE, (supported by the earnings before
taxes over equity ratio and the net profit margin ratio) were considered the most
valuable ratios among others for measuring a company’s profitability. In addition, the
debt ratio was one of the most valuable for measuring a company’s level of solvency.
From the group of ratios that examine a company’s efficiency, the Asset turnover was
considered as the most valuable.
In addition to the above ratios, a number of additional ratios were selected and used
in this survey, taken from the group of ratios that Delen’s et al.,(2013) survey revealed
as the most valuable in measuring a company’s financial performance. The ratios
selected are shown in Figure 20, and refer to the ROA and ROE for measuring a
company’s profitability, the acid-test ratio for measuring the company’s liquidity, the
debt ratio and the Altman’s Z-score ratio for valuing a company’s solvency level and
• Debt to Equity
• Altman Z-Score
•Profit margin•Return on Assets
•Return on Equity
•Current Ratio
•Acid Test Ratio
•Receivable Turnover
•Inventory Turnover
•Fixed Asset Turnover
•Total Asset Turnover
Efficiency Liquidity
SolvencyProfitability

Chapter 5: Research Methodology
Page 152 of 292
Georgios Sainis Ph.D. Thesis
the Asset turnover, the Inventory turnover, and the accounts receivable turnover for
measuring a company’s operational and financial efficiency.
Figure 20: Ratios for measuring an SME’s Financial Performance
The liquidity ratio, and the acid test (quick) ratio, mainly come from the current ratio
(Current Assets over Current Liabilities) which becomes stricter, given that it excludes
the less liquid, inventory account from the current assets. The company’s ability to pay
off its short term obligations was then determined. The profitability ratios examined the
company’s returns including its net income, in relation to its total assets, its total equity,
its total capital invested or its sales revenues. The ROA (Net Profit / Total Assets) and
the ROE (Net Profit / Net Worth) were the ratios selected in the current analysis. The
efficiency or asset utilization ratios are those that can reveal a company’s ability to
effectively utilize its resources. The company’s ability to utilize its accounts receivable
and its inventories thus improving its overall asset productivity will be revealed, from
the use of the Asset turnover (Sales/ Total Assets), the inventory turnover (Sales/
Inventory) and the accounts receivable turnover (Sales/ Accounts receivable) ratios.
The last and most important for the purpose of this study is the solvency or debt
utilization group of ratios. The debt ratio (𝐷𝑒𝑏𝑡
𝐸𝑞𝑢𝑖𝑡𝑦) and the Altman Z-score Ratio
[1.2 (𝑊𝐶
𝑇𝐴) + 1.4 (
𝑅𝐸
𝑇𝐴) + 3.3 (
𝐸𝐵𝐼𝑇
𝑇𝐴) + 0.6 (
𝑀𝑉𝐸
𝑇𝐿) + 1.0 (
𝑆
𝑇𝐴)]8 are the ones that are capable
8 WC=Working Capital, TA=Total Assets, RE=Retained Earnings, EBIT=Earnings before Interest and Taxes, MVE=Market Value of Equity, TL=Total Liabilities and S=Sales
Liquidity Ratio
Acid-Test Ratio
Profitability Ratios
ROA
ROE
Solvency Ratios
Debt Ratio
Altman's
Z-score
Efficiency Ratios
Asset Turnover
Inventory Turnover
A/R Turnover
Chapter 5: Research Methodology
Page 153 of 292
Georgios Sainis Ph.D. Thesis
of recognizing the borrowing intensity of a company, in relation to its assets, its equity
and its earnings power (Hirt et al., 2013)
In addition, the value of all the selected ratios for all the SME sample size (1,245) were
downloaded from the i-Mentor Hellastat data base. The analysis of all the SME ratios
and the valuation of their financial performance was then processed. Within the 1,245
SME, the 392 that participated and responded to the questionnaire’s questions are
also included, but it was impossible to identify them from the rest, given the anonymous
character of the survey. However, these SME also included into their response, the
values of their financial ratios taken from the database i-Mentor Hellastat. It is important
to notice that the email addresses used to send the invitation letter to the
corresponding SME were also used to obtain the financial data used in determining
those SME financial performance.
Comparative analysis was conducted on both groups (1.245 and 392) of SME financial
ratios. The reason for that analysis was the availability of quality data only for the 392
SME included in the survey and their equivalent financial performance. This analysis
could provide an indication of how the whole sample (1,245) behaves in terms of the
TQM implementation if the criterion for implementation is the improvement of their
financial performance.
The data downloaded from the i-Mentor Hellastat database referred to the period 2008
2014. It’s a period where Greece experienced the most severe economic and
sociocultural crisis conditions. For this period, financial data were available in the i-
Mentor Hellastat database for the whole sample size that is the 1,245 ISO certified
SME.
The data related to the quality elements implemented from the Greek, ISO certified
SME refer to the period 2014-2015 during which the questionnaire was administered
and the SME quality managers submitted their responses.
To eliminate the outliers from the financial data collected, data cleansing was adopted,
substantially reducing the “noise” caused by mistakes identified in the data base.
The classification of all SME into three different groups followed, using the employees’
headcount as the criterion. The names assigned to each group were exactly the same
as the ones used from the European commission in categorizing and grouping the
European SME (SBA, 2015) and included; “Micro SME”, “Small SME” and “Medium
SME”. The same grouping, using the same criterion was used for categorizing the
questionnaires collected.
Chapter 5: Research Methodology
Page 154 of 292
Georgios Sainis Ph.D. Thesis
The categorization of the 392 SME using as criteria their credit indicator, their z-score
rate followed. Under this categorization SME were separated and named “High Risk”
SME if they were almost bankrupt, “Medium Risk” SME if they were close to bankruptcy
and “Low Risk” SME if they were not in danger of bankruptcy.
For each group of SME and for each SME separately, the financial ratios of all groups
of ratios were calculated. The statistical analysis of all those ratios revealed the areas
where the SME presented different levels of performance (good – medium – bad). It
showed which ratios and which group of ratios were the strongest and which the
weakest in the SME overall financial performance.
How those ratios and group of ratios behaved in each different group of SME (Micro,
Small and Medium) was examined. The behaviour of the same ratios of the SME
grouped as High, Medium and Low risk was examined. This type of analysis was made
in both groups of SME, the 1,245 group and the 392 group of SME.
The analysis of their behaviour to all ratios and group of ratios, enabled the ranking of
the SME according to their financial performance. The weight that was assigned to
each different group, namely the liquidity, the profitability, the solvency and the
efficiency group was equal to twenty five percent (25%). The ranking of the SME based
on their financial performance was applied to all groups separately, namely the groups
that were formed based on their size (No. of employees), on their credit level (riskiness)
(Z-Score) and on both.
The final stage in our analysis is the identification of the correlation recorded among
the TQM elements (Tools and techniques, processes, culture and appraisal) and the
ratios examined. To record this correlation, the Spearman’s correlation coefficient (rho)
was used. Spearman’s correlation is a non-parametric correlation model that was
chosen because of its inability to identify any normality in the financial data collected
(Asteriou and Hall, 2007) .
5.7 Concluding Remarks
In this chapter the research design and the methodologies used were presented. The
different stages of the research were presented, and emphasis was placed on the
methods used and the selection of the triangulation approach as a means of increasing
the reliability of the survey’s results.
The survey’s reliability and validity were also addressed together with the design and
the methods used in collecting the appropriate amount of data (primary and
Chapter 5: Research Methodology
Page 155 of 292
Georgios Sainis Ph.D. Thesis
secondary). The Statistical analysis methods used were also presented, leading to the
analysis of the results derived that will be shown in the next chapter.

Georgios Sainis Ph.D. Thesis
Chapter 6: Data Analysis and Results
Page 156 of 292
Georgios Sainis Ph.D. Thesis
Chapter- 6 Data Analysis and Results
6.1 Introduction to Chapter 6
This chapter contains the results derived from both the qualitative and the quantitative
analysis conducted as well as the answers to the research question and sub questions.
The data used to derive those results, was collected and subsequently analysed during
a period of great economic, social and cultural turmoil in Greece, challenges which the
country is still struggling with.
The analysis of the interviews conducted which is presented first, reveals the
interviewees belief on quality and their SME’ intention to continue the journey towards
quality.
The scoring approach which was used for analysing the data collected, reveals which
quality elements SME entrepreneurs pay greater attention to when implementing
quality and TQM in their SME.
The same approach (scoring) was used on the quantitative data collected from the
distributed questionnaire, to the sample of the ISO certified Greek SME. The
questionnaire responses were collected from the web platform (e-teacher). The
questionnaire which had been uploaded on that web platform was completed (fully or
partially) by the quality managers or the general managers of the SME in the sample
registered in the i-Mentor Hellastat database.
The sample of SME used, were grouped into three different groups based on the
number of their employees. The data analysis conducted with the use of the scoring
approach, revealed the level of quality adopted by each group of SME. It also revealed
whether each group intended to continue its journey towards quality and how it
determined its financial performance. For that analysis the use of the correlation and
covariance analysis of the quality elements was adopted. The one-way analysis of
variance (ANOVA) was used for testing the significance of the mean differences
among each group. From the analysis of their equivalent p-values, the significance and
the importance of each quality element was calculated as well as the relationships
existing among them.
Further analysis was conducted regarding the SME financial performance. With the
use of ratio analysis, the areas which indicated or did not indicate financial
improvement, for all SME registered in the i-Mentor Hellastat database and the ones

Chapter 6: Data Analysis and Results
Page 157 of 292
Georgios Sainis Ph.D. Thesis
which responded to the questionnaire, in total and per group (micro, small and
medium), were identified. The analysis focused on their solvency, profitability,
efficiency and liquidity level of performance. Different statistical tests (descriptive
statistics, the Pearson’s coefficient, the Pillai’s F test, the Post Hoc analysis, the
Levene’s test) were used in order to verify the assumptions needed for applying the
regression analysis and the significance of the conclusions derived from it.
A comparative analysis was also conducted among the Greek ISO certified SME
financial ratios registered in the i-Mentor Hellastat (Hellastat) database and the SME
that participated in the survey. The results from both sets of data were critically
evaluated supporting further the answers to the research question and sub-questions.
Similarities and differences between the two samples were identified thus offering a
clearer picture of the financial behaviour of the SME population, impacted from the
level of the quality elements implemented.
The extent to which the Greek SME implemented quality elements was used as the
basis on which three different groups were formed. The first group, included the SME
(which were named TQM SME) that continued their quality journey, the second
included the SME (which were named ISO-Plus SME) that were cautiously continuing
their quality journey; and the third group included the SME (labelled ISO SME) that
maintained quality elements at a level that enabled them to be ISO certified. The
behaviour of each group’s financial ratios was identified and analysed to reveal the
impact of quality on the SME’ financial performance.
The number of transitions of the Greek SME from one quality level group to another
(higher or lower), based on the rate of their Z-Score (level of riskiness), supported their
financial sustainability despite the crisis conditions.
A specially designed dependence variable, called “extra variable” was developed with
the use of the SPSS syntax function. That function was used to identify the coefficients
assigned to each ratio, for each year in the eight year period examined. The
coefficients revealed the importance of each financial ratio and its impact of the SME
financial performance.
6.2 Qualitative Survey Analysis –Results
The qualitative survey being supportive to the quantitative survey conducted
(Triangulation approach) was limited to ten interviews representing the 2.5% of the
quantitative survey’s sample size (400). From the ten interviews conducted, the
response forms were completed. The conclusions derived from each of the ten forms

Chapter 6: Data Analysis and Results
Page 158 of 292
Georgios Sainis Ph.D. Thesis
completed, are presented below. The duration of each interview was on average 30 to
45 minutes. Participants understood that the scope of this survey and the derived
results could attest their decision to invest in quality with the scope of bringing them
an accountable rate of return on their investment. Interviews were conducted following
an approved procedure from the University’s ethics committee. Due to confidentiality
reasons, the names of the companies participating in the survey are not shown.
Instead a coding system has been used were the names of the participant were
expressed as a code, i.e. the first participant’s code was the IP-1 (Interview Participant-
1).
6.2.1. Interview Analysis and Results
a. Interview with IP1
The first SME interviewed is a private company, an organization in its legal form, with
seventy employees working on its premises. Given the number of employees, the
company was categorized as a medium SME. The company is specialized in the
production of Chemicals and plastic products and received its first ISO certification in
2014, but has also been awarded with the ISO-9001:2008 the ISO-22000:2005. The
quality manager of the company [IP1] has admitted that TQM is within the company’s
executive teams’ first priorities. The company uses sophisticated and advanced tools
and techniques like the “kaizen” and the ”cobra” tools techniques through which
cooperation and teamwork is established. Training and employee evaluation
procedures are also introduced in the company’s quality processes. The company
follows an open door policy and there is a goal assignment in each operational unit
(departmental and employee) based on which evaluation is established. A research
and development department was inaugurated, where new and innovative ideas are
examined and their implementation is structured. Different environmental, feasibility
and risk analysis studies are performed together with studies focusing on establishing
health and safety procedures and working regulations. Regular reviews of the
operational procedures also take place.
IP1, stated that the company maintains a three year plan which also entails a quality
plan. With those plans, implementation activities are introduced and responsibilities
and deadlines are assigned. In addition, a set of control procedures and a feedback
and rescheduling process, ensure that the quality processes are continuously
appraised and improved.

Chapter 6: Data Analysis and Results
Page 159 of 292
Georgios Sainis Ph.D. Thesis
IP1 responded affirmatively to the questions regarding the existence of any financial
improvements caused from the implementation of an improved level of quality, but no
specific data was provided to the interviewer.
b. Interview with IP2
The second SME interviewed, is an energy company that employs thirty people
rendering it in the small SME category. The company is certified with the ISO-
9001:2008 since 2005. The executive interviewed (IP2) was the quality manager of
this private enterprise.
The executive’s responses, indicated that the company tries to maintain the
established quality system by merely satisfying the ISO standards. They organize
weekly meetings in order to examine and evaluate the progress of the projects
assigned. However the activities related to the employees training, are conducted and
supported mainly by the Headquarters (Mother Company) and are focused mostly on
hygiene and safety issues. Training processes also exist and are focused on inspection
issues an important element for achieving the ISO standards. No processes have been
introduced regarding quality culture issues.
For evaluating the quality processes and the SME’s operational performance,
management focuses on customers’ complaints that are recorded but not analysed
and evaluated. For every project they develop a quality plan, setting goals the
achievement of which is simply measured but not linked to any equivalent reward plan.
The company is open to new partnerships, mostly with ISO certified companies, which
contributes to keeping their quality at an acceptable level. They also create
partnerships with non-ISO certified companies so as not to lose their flexibility and their
level of productivity, but attempt to convince them to become at the very least ISO
certified.
The development of new and innovative ideas mostly come from the technical
department due to the initiatives taken from their Mother Company. A bonus is offered
to those who have achieved personal improvement and this was recorded as the only
internally oriented innovative attempt. The company’s processes include a process
which tries to support new and innovative ideas through simply testing and improving
the existing processes.
For that SME, quality culture is limited to the short term horizon, the “ISO horizon”. A
long term plan focusing on the improvement of its quality elements exists, but focuses

Chapter 6: Data Analysis and Results
Page 160 of 292
Georgios Sainis Ph.D. Thesis
only on the costs realized (reduction of cost).and the minimization of its production
cycle through introducing effective and efficient procedures. However the element of
“continuous improvement” is not applied at this company and penalties are assigned
whenever specific costs exceed the pre-defined limits.
The performance appraisal elements focus mostly on the company’s main operations
and processes and not on any of the supportive or supplementary activities. These
appraisal procedures are designed and controlled by the Mother Company and not
from the SME itself.
IP2, is convinced that the introduction of quality only in the company’s production
operations and not in its administrative activities, will not enable the reduction of its
operational costs, thus will not improve their financial performance.
Noteworthy is IP2’s acceptance of the fact that all the cost reductions achieved,
enabled the company to cope better with the difficult financial conditions associated
with the Greek economic crisis.
c. Interview with IP3
IP3 is the quality manager of a private ISO-9001:2008 certified SME operating in the
food and beverage industry which employs seven people, rendering it in the micro
SME category.
The quality manager is the only person within the company that directs and coordinates
the quality system’s activities and stated that the company is concerned with
maintaining the same level of quality in the products and services it produces and
deliver’s to its customers. No other quality elements are supported from the company’s
management.
The IP3’s responses indicated that the company and its top management do not
implement any quality plan. They simply assign and direct the SME projects and
activities to individuals. Given the company’s small size, teamwork and cooperation
are achieved and further encouraged.
The company hasn’t introduced any quality processes that focus on the development
and evaluation of innovative ideas. The only source of innovative ideas are the
discussions that take place among workers or the discussions during regular meetings.
The evaluation and implementation of ideas however are entirely based on
management’s decision (Individualistic) and feasibility.
Chapter 6: Data Analysis and Results
Page 161 of 292
Georgios Sainis Ph.D. Thesis
The company’s quality cultural environment as it was stated by IP3 is “in the minds of
the employees and of the top management”. They are all ready to realize the
‘continuous improvement’ quality element, but they only follow it up to the level where
the ISO standards are satisfied and their quality assurance certification is approved.
For appraising their operational performance, the company assesses the customer’s
satisfaction response rate. That rate is valuable and important for evaluating the
company’s operational activities, but no other quality ratio based on which they could
evaluate their overall quality level is used.
IP3 states that “from the moment ISO was applied, the company is more organized.
However, ISO hasn’t contributed in the reduction of its operational costs or in the
improvement of any other financial ratio. Instead, it increased its overall costs”. In
addition to that IP3 expressed apprehension regarding the bureaucratic procedures
following the ISO-9001:2008, which have actually reduced the worker’s available and
productive time and increased the SME’s overall production cost.
d. Interview with IP4
The next interview was conducted with a private enterprise operating in the logistics
sector. The company is certified with the ISO-9001:2008 from the TUV Hellas since
2005. It currently employs eleven people so was categorized as a Micro SME. The
executive (IP4) interviewed has the position of the quality manager in that SME. From
the responses to the questions regarding the implementation of quality tools and
techniques in the SME’s operations, it became clear that management focuses only
on satisfying the ISO requirements. They focus on training their employees on the ISO
standards and on how well they know the quality manual and its procedures. They also
test how clearly they have understood the authorities and responsibilities assigned to
them. However, no statistical processes have been implemented to evaluate the
outcome of their performance or that of any proposal (s) made for the improvement of
employee activities. Instead, their implementation and evaluation are entirely based on
the related costs. IP4 stated that there are cost limitations due to the company’s limited
resources. For that reason, tasks are assigned to single units in order to minimize the
implementation costs. Teamwork is encouraged within the sales department, but not
in other departments. Meetings take place on a daily basis (formal and informal) where
possible proposals for improvements and innovative ideas are discussed, but they are
presented in a undocumented way. IP4 admits that “the development and
implementation of the quality elements and specifically the -continuous improvement-
element of the company’s products and processes is in the company’s culture”.

Chapter 6: Data Analysis and Results
Page 162 of 292
Georgios Sainis Ph.D. Thesis
Attention is placed only on the short term plans and the long term development plan
remains “on paper”. The crisis conditions that the company is facing limit the ability of
developing long term plans.
IP4 also declared that even though they are familiar with the performance appraisal
techniques used in implementing quality improvements; the company simply records
customers complaints and customers returns as specified by the ISO manual; without
further examination or analysis which could lead to meaningful conclusions and
possible corrective actions.
IP4 also admitted that the ISO certification enables the company to cope better despite
the crisis conditions that the Greek economy and the Greek market are facing.
e. Interview with IP5
The IP5 interviewee is the quality manager of a private company functioning in the
Water bottling sector of the Greek economy. The company employees thirty-three
people and is categorized as a small SME. It has been certified with the ISO-9001:2008
and the ISO-22000 (HACCP) since 2003.
IP5 stated, that the company’s employees adopt quality tools and techniques as a
means of supporting the quality system established and currently implemented. A
training program on the quality manual and it processes is applied to all employees.
However special training regarding the use of special statistical tools and techniques
which will contribute in measuring and evaluating the company’s operations, is offered
to employees who work in the production department. However IP5 stated that “the
company needs more training in order to further improve its quality level”.
Teamwork is encouraged from top management and from the employees themselves.
IP5 stated however that “there are things that happen (informally) within the company,
that if the TQM elements were implemented and adequately realized, they would
contribute more to the company’s overall quality improvement”.
New and innovative ideas are developed and examined, but due to the difficult
economic conditions, it is almost impossible to put them into action. It is encouraging
however that these new ideas originate from all management areas, with the majority
stemming from the production department.
SME’s management has decided to be a technologically advanced company. For this
reason, new technologies are introduced in the production department, remarkably
improving the quality of the products produced. Introducing advanced technology is

Chapter 6: Data Analysis and Results
Page 163 of 292
Georgios Sainis Ph.D. Thesis
what gave them the opportunity to accurately measure incurred production delays and
prohibit malfunctions.
The IP5 admitted that the company operates solely on a short term plan and there is
no process or activity related to the development of a long term plan. However IP5,
stressed that they aspire to maintain an adequate amount of ratios based on which
they could measure their performance, such as ratios for measuring the scrap value
from the units produced, which are not easily identified and measured; or the overall
quality cost achieved in a specific period.
IP5 admits that introducing quality has improved the level of their sales and has
boosted their customers’ confidence in the quality of their final products. For the
employees IP5 specifically stated that “with quality, working people have managed to
become more conscious of the way they have to do their work. They respect the
company more”.
f. Interview with IP6
The next interview was made with IP6, who is the quality manager of a private
company specialized in vehicles technical control (ECU’s). The company is
categorized as a micro SME given that it employs seven individuals. The company is
ISO certified based on the ISO-9001-2008 standards.
The company offers technical inspection to all types and kind of vehicles and as IP6
stated it offers specific kind of treatment according to the standards specified by law.
What really worries management, is the difficulty it faces in identifying experts in the
field capable of offering this type of service. It’s also too difficult and costly for them to
train new people in new methodologies and make them capable of introducing
improved and innovative quality tools and techniques in their processes that will
eventually offer their customers’ better services.
The training offered to their employees is mainly concentrated on health and safety
issues and on current legislation specifications. IP6 however has admitted the
company’s inability to measure the consequences of that training on the effectiveness
and efficiency of employees’ productivity.
IP6 supports that quality and the ISO model, if used as a promotional and not as an
operational tool, adds extra value to an SME, especially if strong competition exists.
IP6 specifically, stated that all the people working in this company “see our store from
the inside and not from the outside”, meaning that they primarily care for the quality of
the products and services they deliver to the end customers.

Chapter 6: Data Analysis and Results
Page 164 of 292
Georgios Sainis Ph.D. Thesis
Outsourcing is also utilized whenever current employees do not possess sufficient
training to handle or solve a problem. The consequence of that is the increased cost
of production. IP6 stated that the goals and objectives related to the “continuous
improvement” quality element, are applied only to the marketing processes, in an
attempt to serve their customers better.
“Total Quality is not a goal for us and is not a goal for our industry” IP6 declared. To
obtain feedback, the company uses a questionnaire that the customers complete
usually after they have received the final product, which is mostly perceived as the
service received and not the product itself.
IP6 believes that quality’s contribution and the company’s financial performance are
not related. IP6’s perception is that revenues are determined mainly from the pricing
policy the company follows and not from its costs. The only alternative is to better
control their costs, to impose greater control over their suppliers and to request that
they are certified, which for the time being is not easily feasible. It was also stated that
the company “has achieved from its operations a break-even point that is not related
to the services it performs”. This is because the high fixed cost they are incurring due
to their high payroll costs has substantially reduced their contribution margin and
through that their overall financial performance.
g. Interview with IP7
The quality manager of a marble construction company is the next interviewee (IP7).
This private company employees 189 people and is categorized as a medium sized
SME. The company is certified with the ISO-9001:2008 certificate which it was granted
on the 17th of July 2003.
The company has in its organizational chart, a quality (internal) audit department
responsible for the quality manual and all the quality issues related to the production
and the company’s overall operations.
The company uses the “continuous training” in all the processes, tools & techniques
applied to its operations.
IP7 clearly stated that “the company is a living organism, where each department
influences all others. It is necessary that they communicate among one another, state
their goals and objectives and together with the quality manager develop and
implement new procedures, new rules and new directions”. The quality manager’s
statement reveals the significance which management places on the procedures and
activities performed. In addition IP7 stated, that there are opportunities where
Chapter 6: Data Analysis and Results
Page 165 of 292
Georgios Sainis Ph.D. Thesis
responsible managers can propose new ways and methods that would improve the
company’s or a department’s efficiency and effectiveness. That is the reason why the
quality processes as well as the tools and the techniques adopted, continuously
change. They are constantly updated in order to satisfy the technological and
environmental changes and innovations.
The company develops and implements an annual plan and does not intend to develop
a long term one. Thus new goals are set annually, and the evaluation of the existing
goals is conducted only for the sake of satisfying the ISO standards.
The company measures its quality cost through measuring its maintenance and its
production cost. It has also produced a set of ratios in order to evaluate its sales returns
and its customer’s satisfaction.
IP7 acknowledged that since introducing quality the company has managed to improve
and further smooth out the company’s operations, the production and the
administrative operations. IP7 is a strong believer that in the future, quality and TQM
in particular will manage to contribute even more to an SME’s overall improvement.
h. Interview with IP8
The next interview was with the quality manager (IP8) of a private company that
produces and bottles mineral water. The company employs thirty six people and is
categorized as a small sized SME. The company has been granted the ISO-
9001:2008, the HACCP, the IFR and the FSSE certificates.
From the discussion conducted with the IP8, it was found that the SME has developed
an office responsible for employee training. Experts in Chemistry and other specialties
regularly visit and give lectures to the employees. With regards to quality issues the
only seminars conducted are related to the ISO-9001 standards.
IP8 specifically stated that “Employees are slowly but steadily working towards making
quality part of their –own- life”. For implementing quality and quality processes in
particular, both formal and informal teams are formed. Management supports
teamwork and tries to demonstrate to all company employees that “being indifferent”
will not help anyone.
With the aim of improving the functioning of the company’s operations through the
introduction of quality characteristics, employees have proposed to management a
series of innovative ideas following formal and sometimes informal paths.

Chapter 6: Data Analysis and Results
Page 166 of 292
Georgios Sainis Ph.D. Thesis
Management strongly believes that those innovative ideas together with the quality
elements of ISO and its procedures are what majorly contribute to this objective.
The SME basically operates based on a short term plan. No long term plan has been
developed and as IP8 stated “there is a silent observation regarding the goals set for
productivity and if and when these have been met or not and why”.
The IP8 also admitted that the quality ratios used are mainly related to the operational
performance of the company and focus on the quality control procedures. Though no
ratios are developed in measuring the company’s quality cost.
Finally the quality manager has admitted that introducing quality in the company’s
operations has improved its financial performance. That is one of the reasons why the
company, continues to invest in advanced technology in particular. What supports the
role of quality in the company’s improved financial performance is the IP8’s statements
that states “the reason we are surviving under crisis conditions is that we are a quality
company”.
i. Interview with IP9
The next interview conducted was with the quality manager (IP9) of a chemical
company that prepares the base for the production of perfumes. The company is a
private corporation and employs 100 people, so it is categorized as a medium sized
SME. The company, during the last seven years has been awarded the following
quality certificates: ISO-9001:2008, HACCP and the FSSE 22000 from TUV HELLAS.
IP9 specifically stated that no quality tools or techniques are used in this company, due
to their inability to collect and organize the required data. Additionally no support exists
from any ERP system that could “feed” top management with the necessary
information that would lead to conclusions and the application of possible corrective
actions. IP9 characteristically stated that “…given that the only criterion for measuring
the products quality is its ‘smell’, it is not so easy to impose control over that”.
Whilst examining the company’s cultural characteristics, the element of teamwork was
found to be absent. IP9 stated that the cost of not adopting and motivating teamwork
is undertaken by the company itself. Top management prefers to assign projects to
individuals, but considers the level of communication among its employees and the
departments as efficient and important.
Even though the people working in that company have the knowledge and the
experience to propose new and innovative ideas, IP9 stated that top management is

Chapter 6: Data Analysis and Results
Page 167 of 292
Georgios Sainis Ph.D. Thesis
not willing to accept and use them at all. Top management’s believes that the only
expert in the field is the company’s owner and nobody else has the right of proposing
something different. The owner is the only source of innovation and creativity. IP9
concluded that “there are no funds available” for investing in research and
development projects. In addition, only short term quality plans exist, suitable for
covering the needs of the ISO quality model, needs that are not related to any strategic
plan.
Top management considers quality as a marketing tool not as an investment. Thus,
the quality system that is currently in use, despite being recorded in its manual, is not
implementing any element related to the performance measurement and performance
evaluation. Notably IP9’s stated “this is something that we all know but nobody will do
anything to change”.
IP9s’ personal opinion, is that quality and the ISO certification in particular hasn’t
managed to improve the company’s overall financial performance. The only thing that
has been achieved from its implementation, is that the company has managed to
“come closer” to the customer, satisfying their needs better, without however impacting
the company’s overall sales level.
j. Interview with IP10
The last interview was conducted with the production and quality manager (IP10) of a
pastry production company. The company employs 100 people and is categorized as
a medium sized SME. The company is certified with the ISO-9001:2008 certificate
since 2000.
The quality tools and techniques implemented, merely satisfy the needs of the ISO-
9001:2008 certification. Effort is placed on implementing all the tools and techniques
that the quality manager or the external auditor proposes, but that effort never goes
beyond that.
A training program/seminar on quality exists, which mainly covers the quality manual
and the procedures it involves. The seminar is repeated every six months and is
compulsory for all the company’s employees.
Regarding the company’s cultural environment, it was found that employees work to
the most part on an individual basis, but teamwork emerges on occasion depending
on whether the kind and type of processes being implemented require the cooperation
of the people and the departments involved, in order to be fully and accurately
implemented.

Chapter 6: Data Analysis and Results
Page 168 of 292
Georgios Sainis Ph.D. Thesis
IP10 stated that the SME’s top management is willing to motivate its employees to be
creative and encourages them to propose new and innovative ideas. Though, because
they are very cautious of anything new, the company thoroughly examines proposals
before introducing them to all the departments involved in implementation. The
evaluation of any new idea takes place on a monthly basis and from a regular quality
review process. IP10 supports the belief that employees care for their job and for
making all operations run smoothly. When they realize that something is not working
correctly, they feel personally responsible and they try to find the way to improve it. To
that respect, IP10 admitted that the inspections imposed from the ISO manual were of
great help. In addition, a formal and informal communication network exists among the
people and the departments. That network is used as a means of achieving what
quality has as a goal that is to establish the ‘continuous improvement’ element.
IP10 also stated that the company uses a quality plan that has been developed just for
the satisfaction of the ISO’s requirements. No long term quality plan is developed.
Referring to the SME’s appraisal methods, IP10 stated that the ones used, mainly
measure customers complaints and the default products produced, but the company
is not in a position to value (determine the cost) those default products.
The comments made from IP10 regarding the role of quality in the SME’s financial
performance, indicated that quality has improved the company’s image in the market
and has improved its sales level, especially during the economic crisis. That improved
sales level stems not only from the product’s improved quality, but also from the
company’s ability to better control prices and maintain them at a low level, due to cost
decreases. However the company is unable to measure the cost of quality and the
financial benefits derived from that improved level of quality.
6.2.2. Qualitative surveys Coding and Results (All)
Using the phenomenological approach as described in Chapter 5, and assigning
different themes, codes and scores to each code, the results derived are presented in
Appendix C.
Specifically in Table 24, the results derived from the ten interviews conducted showed
that on average the interviewees’ perception is that quality is among their preferences
(1.55/3.00) with emphasis being placed on the organizational culture (1.6) and
performance appraisal (1.6). The quality tools (1.5) and the quality processes (1.5)
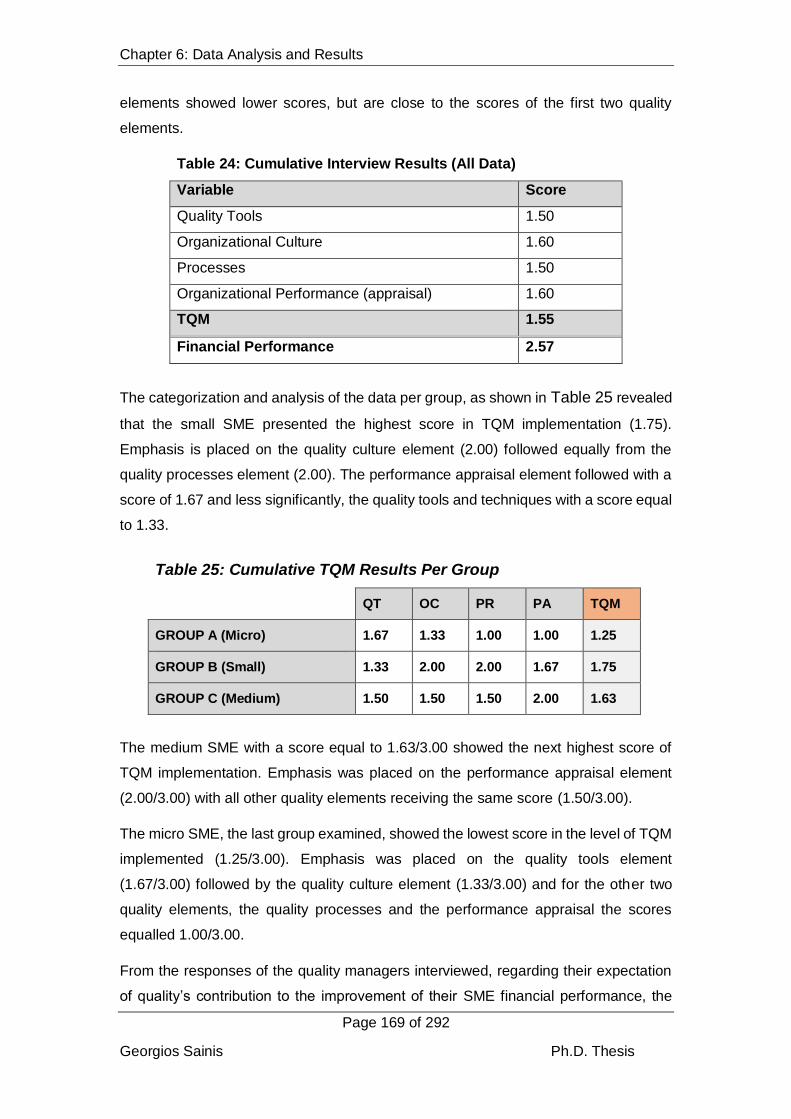
Chapter 6: Data Analysis and Results
Page 169 of 292
Georgios Sainis Ph.D. Thesis
elements showed lower scores, but are close to the scores of the first two quality
elements.
Table 24: Cumulative Interview Results (All Data)
Variable Score
Quality Tools 1.50
Organizational Culture 1.60
Processes 1.50
Organizational Performance (appraisal) 1.60
TQM 1.55
Financial Performance 2.57
The categorization and analysis of the data per group, as shown in Table 25 revealed
that the small SME presented the highest score in TQM implementation (1.75).
Emphasis is placed on the quality culture element (2.00) followed equally from the
quality processes element (2.00). The performance appraisal element followed with a
score of 1.67 and less significantly, the quality tools and techniques with a score equal
to 1.33.
Table 25: Cumulative TQM Results Per Group
QT OC PR PA TQM
GROUP A (Micro) 1.67 1.33 1.00 1.00 1.25
GROUP B (Small) 1.33 2.00 2.00 1.67 1.75
GROUP C (Medium) 1.50 1.50 1.50 2.00 1.63
The medium SME with a score equal to 1.63/3.00 showed the next highest score of
TQM implementation. Emphasis was placed on the performance appraisal element
(2.00/3.00) with all other quality elements receiving the same score (1.50/3.00).
The micro SME, the last group examined, showed the lowest score in the level of TQM
implemented (1.25/3.00). Emphasis was placed on the quality tools element
(1.67/3.00) followed by the quality culture element (1.33/3.00) and for the other two
quality elements, the quality processes and the performance appraisal the scores
equalled 1.00/3.00.
From the responses of the quality managers interviewed, regarding their expectation
of quality’s contribution to the improvement of their SME financial performance, the
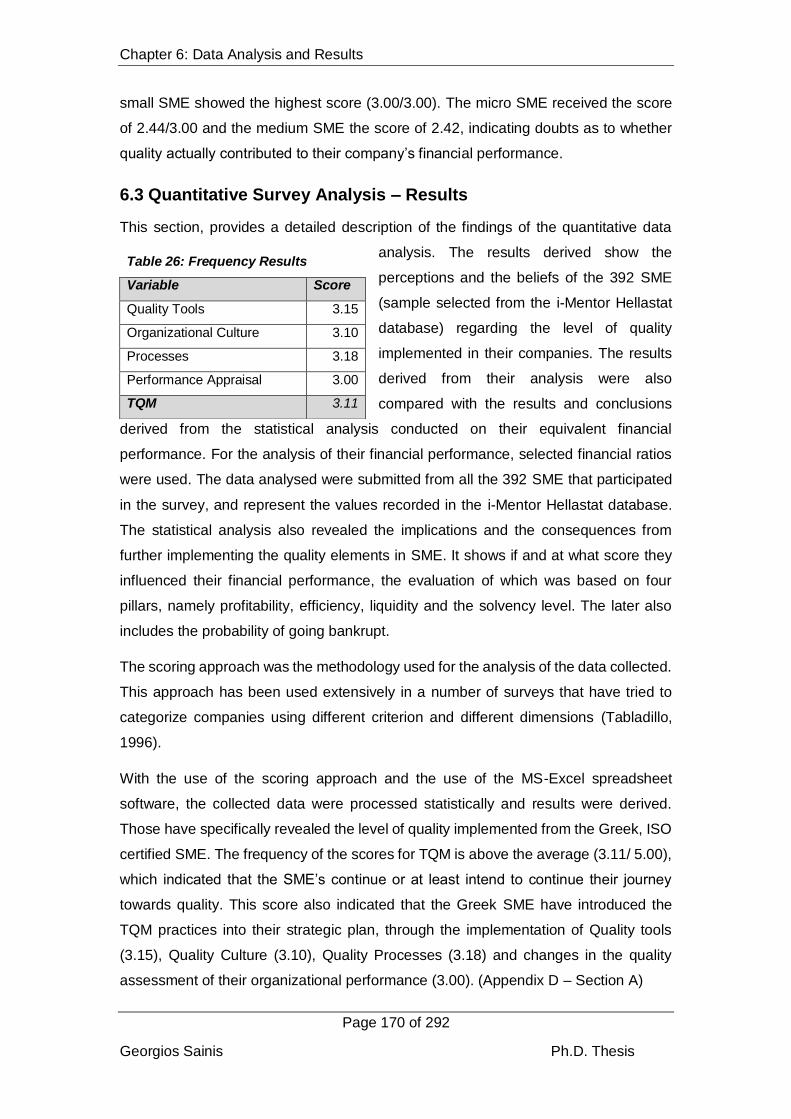
Chapter 6: Data Analysis and Results
Page 170 of 292
Georgios Sainis Ph.D. Thesis
small SME showed the highest score (3.00/3.00). The micro SME received the score
of 2.44/3.00 and the medium SME the score of 2.42, indicating doubts as to whether
quality actually contributed to their company’s financial performance.
6.3 Quantitative Survey Analysis – Results
This section, provides a detailed description of the findings of the quantitative data
analysis. The results derived show the
perceptions and the beliefs of the 392 SME
(sample selected from the i-Mentor Hellastat
database) regarding the level of quality
implemented in their companies. The results
derived from their analysis were also
compared with the results and conclusions
derived from the statistical analysis conducted on their equivalent financial
performance. For the analysis of their financial performance, selected financial ratios
were used. The data analysed were submitted from all the 392 SME that participated
in the survey, and represent the values recorded in the i-Mentor Hellastat database.
The statistical analysis also revealed the implications and the consequences from
further implementing the quality elements in SME. It shows if and at what score they
influenced their financial performance, the evaluation of which was based on four
pillars, namely profitability, efficiency, liquidity and the solvency level. The later also
includes the probability of going bankrupt.
The scoring approach was the methodology used for the analysis of the data collected.
This approach has been used extensively in a number of surveys that have tried to
categorize companies using different criterion and different dimensions (Tabladillo,
1996).
With the use of the scoring approach and the use of the MS-Excel spreadsheet
software, the collected data were processed statistically and results were derived.
Those have specifically revealed the level of quality implemented from the Greek, ISO
certified SME. The frequency of the scores for TQM is above the average (3.11/ 5.00),
which indicated that the SME’s continue or at least intend to continue their journey
towards quality. This score also indicated that the Greek SME have introduced the
TQM practices into their strategic plan, through the implementation of Quality tools
(3.15), Quality Culture (3.10), Quality Processes (3.18) and changes in the quality
assessment of their organizational performance (3.00). (Appendix D – Section A)
Table 26: Frequency Results
Variable Score
Quality Tools 3.15
Organizational Culture 3.10
Processes 3.18
Performance Appraisal 3.00
TQM 3.11
Chapter 6: Data Analysis and Results
Page 171 of 292
Georgios Sainis Ph.D. Thesis
From the results derived, it was found that the element “Quality Processes” shows the
highest score in relation to all other quality elements (3.18). This is an indication of the
participants’ perceptions regarding the quality processes and explains the significant
role of a quality system in the design and implementation of its quality processes
included in its quality manual. Moreover, the quality processes used as the basic units
on which an internal auditor will measure an SME’s quality level additionally supports
the need for recording their improvements. It enables them to realize that the quality
processes are what will lead them to the achievement of the TQM goals and the
development of the “continuous improvement” process (Sashkin and Kiser, 1993).
But to achieve a “continuous improvement” process, the need to also adopt and
implement advanced quality tools and techniques is needed. The simple use of the
quality processes without the use of advanced quality tools and techniques, will not
lead the company to a higher quality level (Schroeder et al., 2005). This explains the
importance and the quality processes element’s high score (3.15/5.00).
Considering that TQM implementation is determined from an organization’s cultural
dimensions, the perception of the survey’s participants for the organizational culture
element showed an above average score equal to 3.10/5.00, which is considered high.
This explains why the participants believe that quality will be introduced to an SME
only when all the quality elements are adopted. This can only happen however, when
the required quality improvements related to a company’s customs, tradition, attitudes,
values, norms, ideas and symbols, become part of a company’s cultural
characteristics. These however shouldn’t be utilized simply as a means of imposing
more control over its people (Pujari, 2016).
The quality element “performance appraisal”, which was found to have a score of
3.00/5.00, shows the perception of the survey’s participants regarding their willingness
to succeed with continuing their quality journey. This quality element is highly
dependent on imposing higher control over the procedures implemented in the SME
operations. It indicates the participants’ strong belief on the use of authority and
responsibility as tools for the development of an appropriate and of high quality
rewarding system. That system is what will support and further reinforce the
implementation of the quality elements. From those elements implemented the
employees will sense the security and the fairness within the organization.
Juran & Godfrey, Hakes, Divorski & Scheirer (Sousa et al., 2005) were among those
who concluded that the establishment and validation of a set of performance

Chapter 6: Data Analysis and Results
Page 172 of 292
Georgios Sainis Ph.D. Thesis
measures, imposed on the quality processes and quality tools and techniques of a
company, can develop and further support its strategic decisions (Sashkin and Kiser,
1993).
Figure 21 where bins were used as a class interval of sorting the frequencies of the
quality elements in a histogram, illustrates that among the four quality elements, the
“Quality tools and techniques”, the “Quality processes” and the “Performance
appraisal”, are closer to the normality assumption, with a low kurtosis rate. The “Quality
culture” however follows the linear assumptions, but at a higher rate than all other
variables.
Figure 21: Quality elements -Frequencies
To that end, the SME that have already established a quality control system (ISO
certified) and are capable of identifying and preventing the non-conformities within their
operations, are the ones that can and will manage to develop a system, a TQM system,
capable of maintaining and further improving their quality level (Padma et al., 2008)

Chapter 6: Data Analysis and Results
Page 173 of 292
Georgios Sainis Ph.D. Thesis
Table 27: Quality Elements - Correlations
TQM QUALITY
CULTURE
PERFORMANCE
APPRAISAL
QUALITY
PROCESSES
QUALITY
TOOLS
TQM 1.00
QUALITY CULTURE 0.72 1.00
PERFORMANCE APPRAISAL 0.77 0.36 1.00
QUALITY PROCESSES 0.77 0.40 0.54 1.00
QUALITY TOOLS 0.76 0.47 0.44 0.35 1.00
From the correlations examined among the elements that contribute to TQM
implementation in an SME, which are shown in Table 27, it is clear that all except the
Performance Appraisal element, are closely related to the TQM implementation.
Positive are the correlations of TQM with the Quality Tools (0.76) and the Quality
Processes (0.77), as well as with the Performance Appraisal (0.77) and the
Organizational Culture (0.72).
Supportive to the above conclusions, is the determination of the equivalent p-values
that indicate the significance of these positive correlations. More specifically:
There is a significant positive relationship between “Quality tools” and
“Organizational culture” r(392)=0.24, p<0.01
There is a significant positive relationship between “Quality tools” and “Processes”
r(392)=0.30, p<0.01
There is a significant positive relationship between “Organizational culture” and
“Processes” r(392)=0.47, p<0.01
The p-value examination, clarifies the results derived from the descriptive analysis
conducted. It reveals the strong and positive relationship (0.47) between the SME
“Organizational culture” and the “Processes” adopted. The “Quality tools” are also
positively related (0.30) with the “Quality processes” adopted. The lower score
recorded is attributed to the inability of the tools and techniques to be used under the
terms and conditions of the SME processes. In addition, the “Organizational culture”
was found to be positively related (0.24) with the “Quality tools” used from the Greek
SME, but to a smaller degree, considering that Greek SME’s live and experience
quality mainly through their processes and not through their organizational culture.
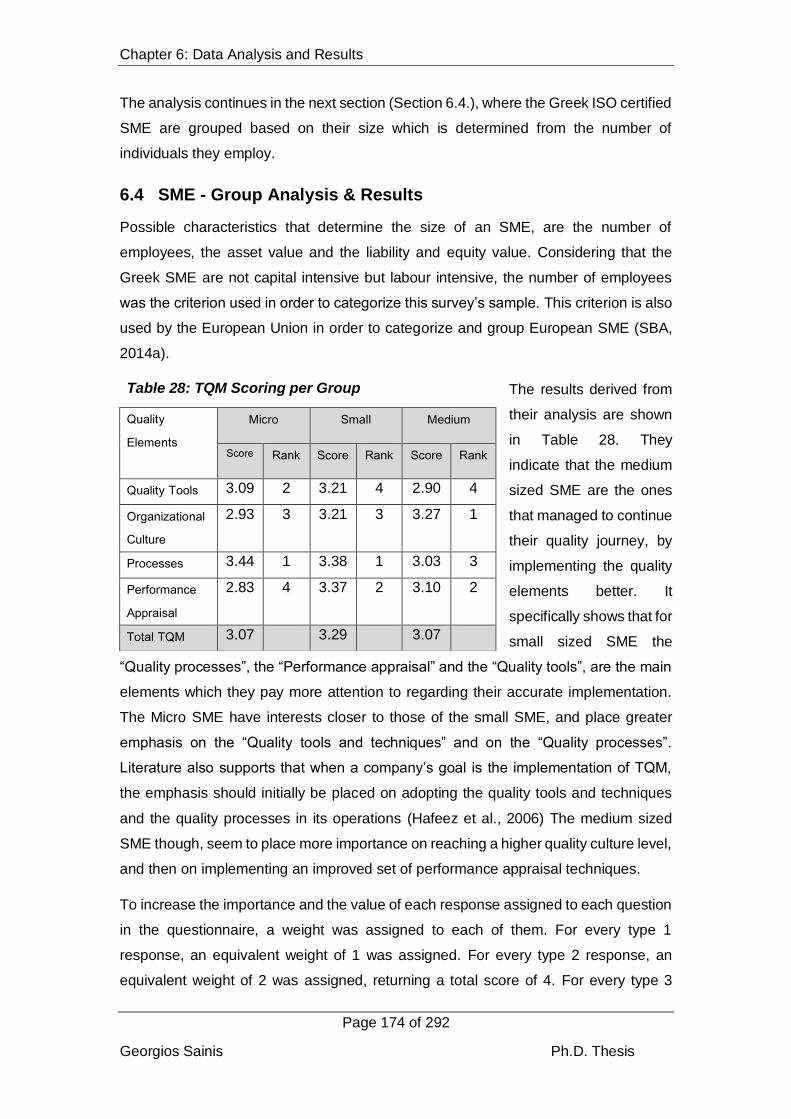
Chapter 6: Data Analysis and Results
Page 174 of 292
Georgios Sainis Ph.D. Thesis
The analysis continues in the next section (Section 6.4.), where the Greek ISO certified
SME are grouped based on their size which is determined from the number of
individuals they employ.
6.4 SME - Group Analysis & Results
Possible characteristics that determine the size of an SME, are the number of
employees, the asset value and the liability and equity value. Considering that the
Greek SME are not capital intensive but labour intensive, the number of employees
was the criterion used in order to categorize this survey’s sample. This criterion is also
used by the European Union in order to categorize and group European SME (SBA,
2014a).
The results derived from
their analysis are shown
in Table 28. They
indicate that the medium
sized SME are the ones
that managed to continue
their quality journey, by
implementing the quality
elements better. It
specifically shows that for
small sized SME the
“Quality processes”, the “Performance appraisal” and the “Quality tools”, are the main
elements which they pay more attention to regarding their accurate implementation.
The Micro SME have interests closer to those of the small SME, and place greater
emphasis on the “Quality tools and techniques” and on the “Quality processes”.
Literature also supports that when a company’s goal is the implementation of TQM,
the emphasis should initially be placed on adopting the quality tools and techniques
and the quality processes in its operations (Hafeez et al., 2006) The medium sized
SME though, seem to place more importance on reaching a higher quality culture level,
and then on implementing an improved set of performance appraisal techniques.
To increase the importance and the value of each response assigned to each question
in the questionnaire, a weight was assigned to each of them. For every type 1
response, an equivalent weight of 1 was assigned. For every type 2 response, an
equivalent weight of 2 was assigned, returning a total score of 4. For every type 3
Table 28: TQM Scoring per Group
Quality Elements
Micro Small Medium
Score Rank Score Rank Score Rank
Quality Tools 3.09 2 3.21 4 2.90 4
Organizational Culture
2.93 3 3.21 3 3.27 1
Processes 3.44 1 3.38 1 3.03 3
Performance Appraisal
2.83 4 3.37 2 3.10 2
Total TQM 3.07 3.29 3.07
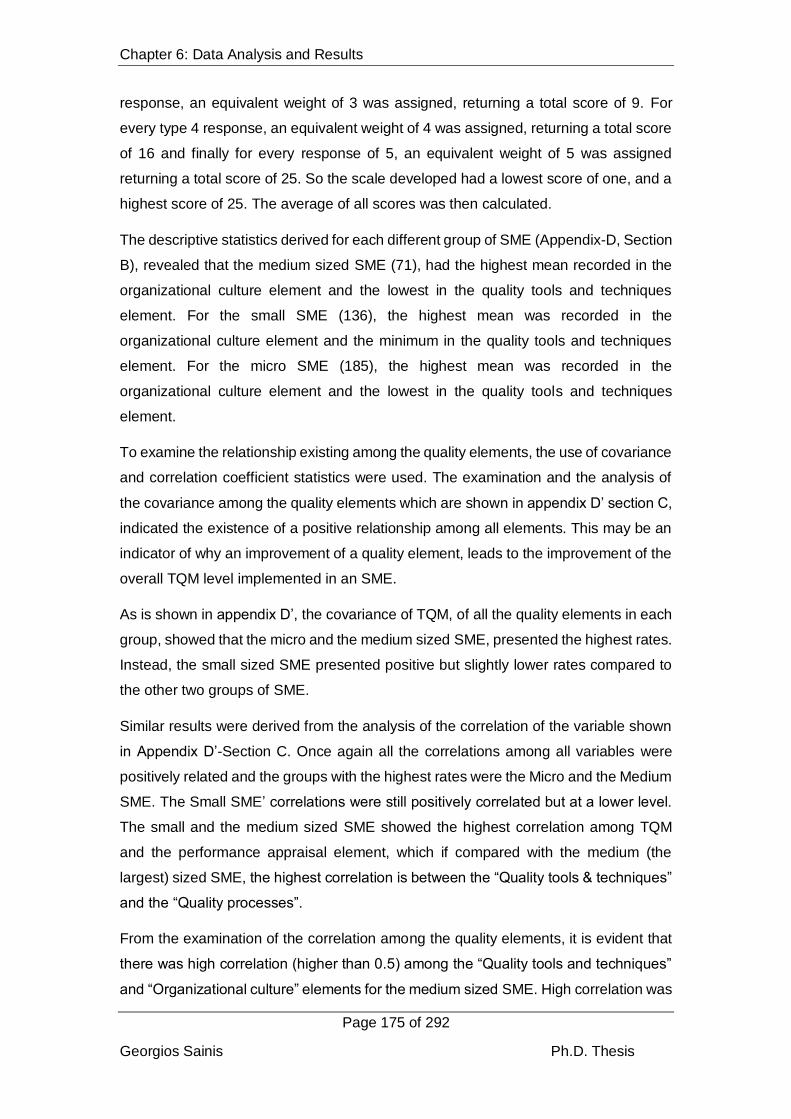
Chapter 6: Data Analysis and Results
Page 175 of 292
Georgios Sainis Ph.D. Thesis
response, an equivalent weight of 3 was assigned, returning a total score of 9. For
every type 4 response, an equivalent weight of 4 was assigned, returning a total score
of 16 and finally for every response of 5, an equivalent weight of 5 was assigned
returning a total score of 25. So the scale developed had a lowest score of one, and a
highest score of 25. The average of all scores was then calculated.
The descriptive statistics derived for each different group of SME (Appendix-D, Section
B), revealed that the medium sized SME (71), had the highest mean recorded in the
organizational culture element and the lowest in the quality tools and techniques
element. For the small SME (136), the highest mean was recorded in the
organizational culture element and the minimum in the quality tools and techniques
element. For the micro SME (185), the highest mean was recorded in the
organizational culture element and the lowest in the quality tools and techniques
element.
To examine the relationship existing among the quality elements, the use of covariance
and correlation coefficient statistics were used. The examination and the analysis of
the covariance among the quality elements which are shown in appendix D’ section C,
indicated the existence of a positive relationship among all elements. This may be an
indicator of why an improvement of a quality element, leads to the improvement of the
overall TQM level implemented in an SME.
As is shown in appendix D’, the covariance of TQM, of all the quality elements in each
group, showed that the micro and the medium sized SME, presented the highest rates.
Instead, the small sized SME presented positive but slightly lower rates compared to
the other two groups of SME.
Similar results were derived from the analysis of the correlation of the variable shown
in Appendix D’-Section C. Once again all the correlations among all variables were
positively related and the groups with the highest rates were the Micro and the Medium
SME. The Small SME’ correlations were still positively correlated but at a lower level.
The small and the medium sized SME showed the highest correlation among TQM
and the performance appraisal element, which if compared with the medium (the
largest) sized SME, the highest correlation is between the “Quality tools & techniques”
and the “Quality processes”.
From the examination of the correlation among the quality elements, it is evident that
there was high correlation (higher than 0.5) among the “Quality tools and techniques”
and “Organizational culture” elements for the medium sized SME. High correlation was
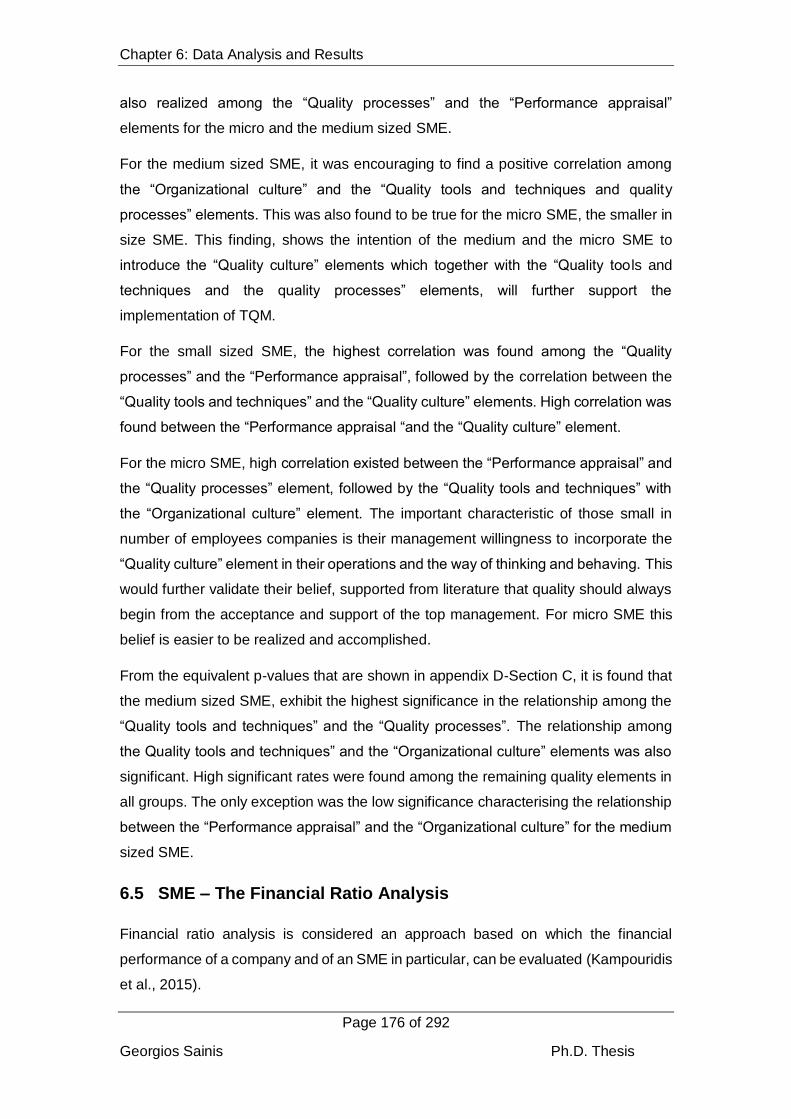
Chapter 6: Data Analysis and Results
Page 176 of 292
Georgios Sainis Ph.D. Thesis
also realized among the “Quality processes” and the “Performance appraisal”
elements for the micro and the medium sized SME.
For the medium sized SME, it was encouraging to find a positive correlation among
the “Organizational culture” and the “Quality tools and techniques and quality
processes” elements. This was also found to be true for the micro SME, the smaller in
size SME. This finding, shows the intention of the medium and the micro SME to
introduce the “Quality culture” elements which together with the “Quality too ls and
techniques and the quality processes” elements, will further support the
implementation of TQM.
For the small sized SME, the highest correlation was found among the “Quality
processes” and the “Performance appraisal”, followed by the correlation between the
“Quality tools and techniques” and the “Quality culture” elements. High correlation was
found between the “Performance appraisal “and the “Quality culture” element.
For the micro SME, high correlation existed between the “Performance appraisal” and
the “Quality processes” element, followed by the “Quality tools and techniques” with
the “Organizational culture” element. The important characteristic of those small in
number of employees companies is their management willingness to incorporate the
“Quality culture” element in their operations and the way of thinking and behaving. This
would further validate their belief, supported from literature that quality should always
begin from the acceptance and support of the top management. For micro SME this
belief is easier to be realized and accomplished.
From the equivalent p-values that are shown in appendix D-Section C, it is found that
the medium sized SME, exhibit the highest significance in the relationship among the
“Quality tools and techniques” and the “Quality processes”. The relationship among
the Quality tools and techniques” and the “Organizational culture” elements was also
significant. High significant rates were found among the remaining quality elements in
all groups. The only exception was the low significance characterising the relationship
between the “Performance appraisal” and the “Organizational culture” for the medium
sized SME.
6.5 SME – The Financial Ratio Analysis
Financial ratio analysis is considered an approach based on which the financial
performance of a company and of an SME in particular, can be evaluated (Kampouridis
et al., 2015).

Chapter 6: Data Analysis and Results
Page 177 of 292
Georgios Sainis Ph.D. Thesis
Different sets of financial ratios are capable of examining different performance
characteristics of a company, like its liquidity, profitability, solvency and efficiency. An
analyst with the use of those ratios, is able to identify the strengths and the
weaknesses of a company that are related directly or indirectly to those characteristics.
In the literature review, it was admitted that is difficult and occasionally impossible for
a company in particular an SME to collect all the necessary information required in
order to proceed to the evaluation of their financial performance.
In order to reduce the possibility of bias, a preliminary ratio analysis was conducted to
the financial statements on all the ISO certified SME registered in the i-Mentor Hellastat
database (1,245). This database was also used for selecting the SME email addresses
where the questionnaire was delivered and from where the quantitative data (Quality
and Financial) was collected.
The ratios used in this survey were presented in the methodology chapter and include
the quick ratio, the asset; inventory and receivable turnover ratios; the return on assets
and equity ratios; the debt to equity ratio and the z-score ratio (Altman’s Function). The
values of all those ratios, for all the SME registered in the i-Mentor Hellastat database
were found and downloaded from it. The zip files downloaded, were converted into an
xls format (MS-Excel), and the data were stored in a file with the name “SME financial
Ratios”. The data were then imported to the SPSS (v.20) software9 in order to be
processed further.
The period for which the Greek SME financial performance is analysed starts in 2008,
the year in which the Greek financial crisis begun, and reaches the year 2014. Within
these eight years, the selected financial ratios of all types and sizes of SME were
identified. Those were also grouped based on the number of employees employed
(Check the special field in the i-Mentor Hellastat database).
6.5.1. Financial Ratio Analysis – Descriptive Statistics
To proceed in the analysis of the financial ratios for each group of SME (Micro, Small
and Medium) formed, it was vital to verify the equality of mean among each group.
This equality was verified for each ratio and each year. For the equality of means
analysis the EViews_V9 was used and the results derived are presented below and in
Appendix F’.
9 An authorized version is available in the premises of the American College of Greece (Deree College).
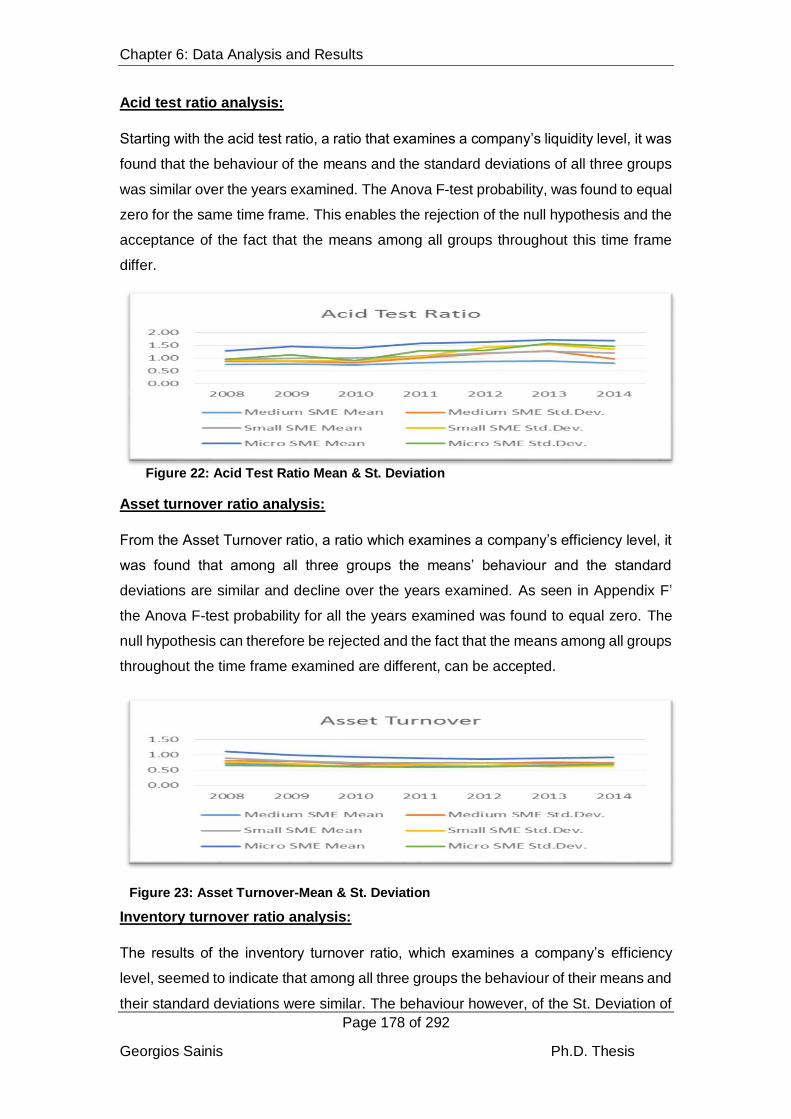
Chapter 6: Data Analysis and Results
Page 178 of 292
Georgios Sainis Ph.D. Thesis
Acid test ratio analysis:
Starting with the acid test ratio, a ratio that examines a company’s liquidity level, it was
found that the behaviour of the means and the standard deviations of all three groups
was similar over the years examined. The Anova F-test probability, was found to equal
zero for the same time frame. This enables the rejection of the null hypothesis and the
acceptance of the fact that the means among all groups throughout this time frame
differ.
Asset turnover ratio analysis:
From the Asset Turnover ratio, a ratio which examines a company’s efficiency level, it
was found that among all three groups the means’ behaviour and the standard
deviations are similar and decline over the years examined. As seen in Appendix F’
the Anova F-test probability for all the years examined was found to equal zero. The
null hypothesis can therefore be rejected and the fact that the means among all groups
throughout the time frame examined are different, can be accepted.
Figure 23: Asset Turnover-Mean & St. Deviation
Inventory turnover ratio analysis:
The results of the inventory turnover ratio, which examines a company’s efficiency
level, seemed to indicate that among all three groups the behaviour of their means and
their standard deviations were similar. The behaviour however, of the St. Deviation of
Figure 22: Acid Test Ratio Mean & St. Deviation

Chapter 6: Data Analysis and Results
Page 179 of 292
Georgios Sainis Ph.D. Thesis
the Micro SME presented a significantly higher flexibility in their means. From the
results presented in Appendix F’, it appears that for all the years examined the Anova
F-test probability, is equal to zero. This enables the acceptance of the fact that the
means among all groups, for all the years are different and the rejection of the null
hypothesis.
Figure 24: Inventory Turnover-Mean & St. Deviation
Receivable Turnover ratio analysis:
The receivable turnover ratio, which examines a company’s efficiency level,
showcased that the behaviour of the means and the standard deviations for all the
groups for the period examined, look similar. The Anova F-test probability, shown in
Appendix F’ for all the years examined is equal to zero. This proves that the null
hypothesis can be rejected and enables the acceptance of the fact that the means
among the groups, for the period examined are different.
Figure 25: Receivable Turnover-Mean & St. Deviation
Return on Assets (ROA) ratio analysis:
The results of the Return on Assets ratio, which examines a company’s profitability
level, indicated that among all three groups, the mean and standard deviation
behaviour look similar. For the micro SME however, the ratio’s mean has a slightly

Chapter 6: Data Analysis and Results
Page 180 of 292
Georgios Sainis Ph.D. Thesis
increased variation in the years 2012-2013. In Appendix F’ and for all years examined
the Anova F-test probability is either equal to zero or close to zero. That acts as an
indication for the rejection of the null hypothesis and the acceptance of the fact that
the means among all groups for all the years examined are different.
Figure 26: Return on Assets (ROA)-Mean & St. Deviation
Return on Equity (ROE) ratio analysis:
The results from the Return on Equity ratio, which examines a company’s profitability
level, seemed to indicate that among all three groups, the behaviour of their means
and their standard deviations are different. Even though the means of all groups
seemed to be down sloping, their standard deviations are up-sloping and with a great
variability, especially for the medium sized SME. As it is shown in Appendix F’, for the
whole period examined, the Anova F-test probability, is either equal to zero or close to
zero. This enables the rejection of the null hypothesis and acceptance of the fact that
the means among groups for all years, are different.
Figure 27: Return on Equity (ROE)-Mean & St. Deviation
Debt to Equity Ratio analysis:
From the analysis of the Debt to Equity ratio, which examines a company’s solvency
level, it was found that among all three groups, the behaviour of their means and their

Chapter 6: Data Analysis and Results
Page 181 of 292
Georgios Sainis Ph.D. Thesis
standard deviations appeared to be similar. The exception was the St. Deviation of the
Micro SME which for the year 2013 showed an up-sloping trend followed by a decline.
In Appendix E’, the Anova F-test probability is shown to be equal to zero or close to
zero which allows the rejection of the null hypothesis and acceptance of the fact that
the means among the groups, for all the years examined, are different.
Figure 28: Debt to Equity-Mean & St. Deviation
Altman’s Z-Score analysis:
Finally the most valuable ratio for determining a company’s solvency and possibility of
bankruptcy, the Altman’s Z-Score, showed that among all three groups, the behaviour
of their means and their standard deviations is similar. Evident in Appendix F’ the
Anova F-test probability, is equal to zero or close to zero for the whole period
examined. This is an indication for rejecting the null hypothesis and accepting that the
means among all groups for the whole period examined are different.
Figure 29: Altman's Z' Score-Mean & St. Deviation
6.5.2. Ratio Analysis (Trend analysis- Sample’s population SME)
The values of the selected financial ratios for all the SME registered in the i-Mentor
Hellastat database, were entered into the E-Views statistical package. This special

Chapter 6: Data Analysis and Results
Page 182 of 292
Georgios Sainis Ph.D. Thesis
statistical software would contribute to the development of a trend analysis for each of
the financial ratios for all the years of the period examined.
The first ratio examined was the Quick Ratio (Acid Test Ratio). This ratio is an
extension of the current ratio (current assets over current liabilities) which tries to show
a company’s liquidity level. It is considered an “extension”, because it aims at revealing
the most liquid condition of a company, by simply excluding the less liquid conditions
(such as the inventories, the prepaid expenses or any other), from the current assets
(Hirt et al., 2013).
From the graphical representation of the acid test ratio, it is clear that the micro SME
show a much higher liquidity than the small or the medium sized SME, especially after
2010. Trend analysis showed that the micro SME managed to cope better under the
crisis conditions, in terms of their liquidity, compared with the other two groups of SME.
The asset turnover, a ratio that pictures a company’s efficient use of its Assets was
examined next. From its trend analysis, the relationship between the turnover ratio
behaviour over the eight years period is illustrated. The average value of the assets
used during this period and the way they were used, brought an over increase in the
SME level of sales. Only for the years 2010 and 2013 did the liquidity of all the SME
groups decline.
1.00
1.20
1.40
1.60
1.80
2008 2009 2010 2011 2012 2013 2014
Rat
e
Years
Acid Ratio
Micro
Small
Medium
Figure 30: Acid Test Ratio-All SME Trend

Chapter 6: Data Analysis and Results
Page 183 of 292
Georgios Sainis Ph.D. Thesis
From the ratio’s trend representation, it was clear that from 2008 to 2010, all the groups
of SME experienced a decline in their efficiency. The most severe decline was realized
from the micro SME, compared to the small and the medium SME, which managed to
cope better with crisis given the improved utilization of their assets. The increase in
the efficient use of the small SME assets from 2010 to 2012 should also be noted.
Another important issue, is the decline of the medium SME efficiency compared to the
increase in the other two groups, the micro and the small ones, in a period where
financial crisis was the most severe.
Another ratio used in measuring a company’s efficiency, is the inventory turnover ratio.
It shows the relationship between a company’s sales and its average inventory level.
For management it is an indicator of how to control their inventories, in order to
effectively and efficiently support their sales.
0.80
0.90
1.00
1.10
1.20
2008 2009 2010 2011 2012 2013 2014
Rat
e
Years
Asset Turnover
Micro
Small
Medium
1.50
6.50
11.50
16.50
21.50
26.50
31.50
2008 2009 2010 2011 2012 2013 2014
Rat
e
Years
Inventory Turnover
Micro
Small
Medium
Figure 31: Asset Turnover-All SME trend
Figure 32: Inventory Turnover-All SME Trend

Chapter 6: Data Analysis and Results
Page 184 of 292
Georgios Sainis Ph.D. Thesis
From the graphical representation of the inventory turnover’s behaviour, it was realized
that the micro SME showed a significantly higher level of efficiency in controlling their
inventories. It was also revealed that they managed to cope better with the crisis
conditions. This is because throughout the eight years, they managed to keep their
inventory turnover ratio at better levels compared to all the other groups. The low but
stable level of inventory turnover, realized from the medium SME should be noted.
This can be compared to the unstable behaviour found in the small SME’ ratio. From
their trend, the inverse behaviour of the small SME to the behaviour of the other two
groups’ turnover rates becomes obvious. In 2013, the decline realized in the ratio from
the micro and medium sized SME, is in contrast to the increase realized from the small
sized SME.
The
accounts receivable turnover ratio reveals the relationship between sales and the
average level of accounts receivable. The examination of its trend, reveals the way a
company controls its credit policy. The importance of this ratio when economic and
financial crisis conditions are realized is vital. When the opportunities for borrowing
money are reduced, the option to use credit terms as a way of financing the activities
of an enterprise is the only available option.
From the graphical representation of the trend of Receivable turnover ratio, it is evident
that the micro and the medium SME managed to cope and better control their accounts
receivable. The small SME showed the highest variability in the ratio’s behaviour and
is the only group that in the year 2013, experienced a sharp decline in that ratio. This
decline can be interpreted in two ways: The first is that sales were declining
substantially. The second is that there was a reduction in the companies offered credit
2.00
2.20
2.40
2.60
2.80
3.00
3.20
3.40
2008 2009 2010 2011 2012 2013 2014
Rat
e
Years
ReceivableTurnover
Micro
Small
Medium
Figure 33: Receivable Turnover-All SME Trend
Chapter 6: Data Analysis and Results
Page 185 of 292
Georgios Sainis Ph.D. Thesis
terms as a means of improving their liquidity. Worth mentioning is the behaviour of the
micro SME A/R turnover ratio, that with the exception of a tremendous decline in 2009,
managed to keep the A/R turnover ratio constant until 2012 during which growth was
achieved again. That growth could be the result of either an increase in the company’s
overall sales or a simultaneous decrease in its offered credit terms.
The return on equity ratio is a ratio that examines a company’s profitability and
specifically the relationship between a company’s earnings and its owner’s investment.
The company’s earnings characterise the shareholder’s (owner’s) return on
investment.
From that ratio’s trend representation, it was found that after the year 2010, all groups
experienced a tremendous increase in their return on equity and their profitability.
Specifically, all groups managed to improve their earnings management procedures
or even reduce their equity investments. It is clear however, that the micro SME
controlled them better than all others; which acts as an indication that the micro SME
are mostly composed of sole-proprietorships and are more focused on owners’ returns.
The above thoughts are also supported from the decline in the medium (the largest)
SME ratio. The negative sign in 2012, could explain the attitude and the approach that
the medium SME have for the improved financial performance of a company not
necessarily resulting in higher owner’s returns.
-0.01
0.00
0.01
0.02
0.03
0.04
0.05
0.06
2008 2009 2010 2011 2012 2013 2014
Rat
e
Years
Return on Equity
Micro
Small
Medium
Figure 34: Return on Equity-All SME Trend
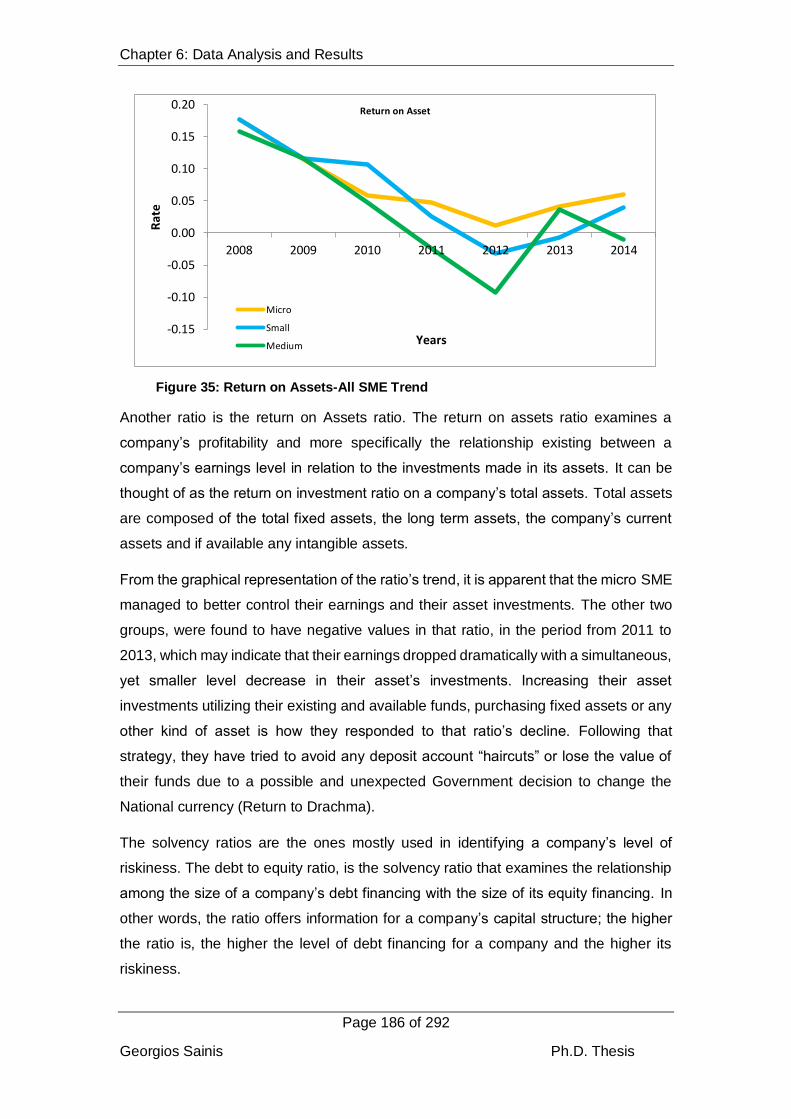
Chapter 6: Data Analysis and Results
Page 186 of 292
Georgios Sainis Ph.D. Thesis
Another ratio is the return on Assets ratio. The return on assets ratio examines a
company’s profitability and more specifically the relationship existing between a
company’s earnings level in relation to the investments made in its assets. It can be
thought of as the return on investment ratio on a company’s total assets. Total assets
are composed of the total fixed assets, the long term assets, the company’s current
assets and if available any intangible assets.
From the graphical representation of the ratio’s trend, it is apparent that the micro SME
managed to better control their earnings and their asset investments. The other two
groups, were found to have negative values in that ratio, in the period from 2011 to
2013, which may indicate that their earnings dropped dramatically with a simultaneous,
yet smaller level decrease in their asset’s investments. Increasing their asset
investments utilizing their existing and available funds, purchasing fixed assets or any
other kind of asset is how they responded to that ratio’s decline. Following that
strategy, they have tried to avoid any deposit account “haircuts” or lose the value of
their funds due to a possible and unexpected Government decision to change the
National currency (Return to Drachma).
The solvency ratios are the ones mostly used in identifying a company’s level of
riskiness. The debt to equity ratio, is the solvency ratio that examines the relationship
among the size of a company’s debt financing with the size of its equity financing. In
other words, the ratio offers information for a company’s capital structure; the higher
the ratio is, the higher the level of debt financing for a company and the higher its
riskiness.
-0.15
-0.10
-0.05
0.00
0.05
0.10
0.15
0.20
2008 2009 2010 2011 2012 2013 2014
Rat
e
Years
Return on Asset
Micro
Small
Medium
Figure 35: Return on Assets-All SME Trend

Chapter 6: Data Analysis and Results
Page 187 of 292
Georgios Sainis Ph.D. Thesis
From its trend’s graphical representation, it is discernible that the small SME faced the
greatest decline in their debt to equity ratio during the period examined. A possible
increase in their equity financing and/ or a possible decline in their debt financing could
cause this behaviour, reducing this way their overall exposure to risk. The graph also
illustrates the good capital structure defined from the micro and the medium SME. Both
have managed to reduce their debt to equity ratio in the years 2013 and 2012
respectively. Though after 2013, only the medium sized SME showed an increase in
their ratio, indicative of the fact that the financial crisis imposed a higher level of
riskiness on them. This behaviour can also be explained from the ability and reliability
of only this size of companies to raise new funds through debt financing. The other two
groups, the micro and the small SME, continue from 2013 onwards, to show a decline
in that ratio accompanied by a reduced level in their riskiness.
The last and equally important ratio to the debt to equity ratio, is the z-score (Altman’s
score). As it has already been described in Chapter 3, the Altman’s z-score is a
combination of ratios aimed at identifying the possibility of a company going bankrupt.
1.50
2.00
2.50
3.00
3.50
2008 2009 2010 2011 2012 2013 2014
Rat
e
Years
Debt-to-Equity
Micro
Small
Medium
Figure 36: Debt to Equity-All SME Trend

Chapter 6: Data Analysis and Results
Page 188 of 292
Georgios Sainis Ph.D. Thesis
A company going bankrupt means that it is unable to pay its short and long term
obligations, due to low earnings over its total assets, its low working capital (current
assets less current liabilities) over its total assets, and low retained earnings over its
total assets. In addition, the company’s asset turnover and its debt over equity ratio do
not adequately support its financial strategy.
The trend graphical representation, illustrates that the group with the highest Z-score,
meaning the lowest possibility of going bankrupt, was the micro SME. The period from
2011 to 2013 was the worst period for the medium sized SME, given the ratios
substantial decline. On the contrary, during the same period the small SME
experienced an increase in their Z-score, indicating that they managed to continuously
improve their financial strategy, resulting in a reduced probability of bankruptcy.
It is also important to note, that the worst period for all SME was 2009-2010, during
which almost all groups were found to have a decline in their Z-score. Once again, the
companies that managed to respond faster and continued to improve their financial
position against bankruptcy were the micro SME. It is also important to note the almost
constant trend of the medium sized SME. Their size and their ability to borrow at a
lower cost and with better terms, gave them the chance to cope in a more efficient and
effective way with the crisis conditions.
6.5.3. Ratio Analysis (Trend analysis- Sample SME)
The values of the selected financial ratios of the SME responded in the survey’s
questionnaire were entered into the E-Views statistical package. This special statistical
2.50
2.70
2.90
3.10
3.30
3.50
3.70
3.90
4.10
2008 2009 2010 2011 2012 2013 2014
Rat
e
Years
Z-Score
Micro
Small
Medium
Figure 37: Z-Score-All SME Trend

Chapter 6: Data Analysis and Results
Page 189 of 292
Georgios Sainis Ph.D. Thesis
software contributed to the development of a trend analysis for each of the financial
ratios and for all the years examined.
Starting with the acid test ratio and from its trend’s graphical representation, it is clear
that the behaviour of the micro and the small SME was not that different, especially
after 2010. For that period, the small SME showed a tremendous increase in their
liquidity level that was substantially reduced in 2013 onwards. Though, this was a
behaviour that almost all groups of the sample experienced.
The Asset turnover ratio, the ratio that examines the level of utilization and the level of
efficiency of a company’s total assets, for all groups examined showed a tremendous
decrease in their value from 2008 to 2012. The exception is the micro SME which in
2009 managed to stop the decline and instead experience growth in that ratio. The
1.00
1.50
2.00
2.50
3.00
3.50
2008 2009 2010 2011 2012 2013 2014
Rat
e
Years
Acid Ratio
Micro
Small
Medium
0.80
0.85
0.90
0.95
1.00
1.05
1.10
1.15
2008 2009 2010 2011 2012 2013 2014
Rat
e
Years
Asset Turnover
Micro
Small
Medium
Figure 38: Acid Test Ratio-SME Sample Trend
Figure 39: Asset Turnover-SME Sample Trend

Chapter 6: Data Analysis and Results
Page 190 of 292
Georgios Sainis Ph.D. Thesis
other two groups of SME, managed to simply reduce the rate of its decline. From 2012
onwards, growth is recorded in both the micro and the medium SME, but for the small
SME growth begun one year later, in 2013. This was an indication that all groups of
SME, managed to impose better control over their assets, in order to have the
necessary funds needed for their maintenance.
For the inventory turnover ratio, the only group that managed to show stability was the
medium (large) SME group. Similar behaviour though also appears from the total
number of SME examined. It is important to note the great instability that both micro
and small SME showed on that ratio during the period 2012-2013. This instability is
characterised from an increase in its growth rate in 2012 and an immediate decrease
in the following year. Similar decrease in the ratios growth rate, was realized from the
medium sized SME. Instead, the small SME managed to achieve positive growth rates
in 2014.
The procedures used in controlling their inventory level, in comparison with the
anticipated level in sales, brought all groups, excluding the medium SME, to incur
instability in their inventory turnover ratio. Minor differences were realized among our
sample and the population of the SME.
The receivable turnover, is a ratio that shows the relationship between sales and the
average level of the SME account receivable account. For that ratio, no differences
have been realized among the two sets of data (Population and sample) examined.
0.00
5.00
10.00
15.00
20.00
25.00
30.00
35.00
2008 2009 2010 2011 2012 2013 2014
Ra
te
Years
Inventory Turnover
Micro
Small
Medium
Figure 40: Inventory Turnover-SME Sample Trend

Chapter 6: Data Analysis and Results
Page 191 of 292
Georgios Sainis Ph.D. Thesis
Focus on the behaviour of the sample, indicated that the medium SME presented a
much higher utilization of their accounts receivable account. That is, they managed to
correctly implement the procedures that supported the increase in their sales level,
offering achievable and more attractive credit terms to their customers. That was a
behaviour realized in both samples of SME. Among the three groups of SME
examined, the small SME are those that show the lowest rates in the receivable
turnover ratio. However it is an achievement to have not attained negative growth rates
in the period 2010-2014 given the crisis conditions. The best performance of all is
realized from the micro SME which managed, in the period examined, to achieve
positive growth rates, especially during and after 2011. Their ability to maintain their
credit policy at a level so as to support consumption, satisfying their customers under
such difficult economic conditions can be considered a challenge that was successfully
accomplished.
2.00
2.20
2.40
2.60
2.80
3.00
3.20
3.40
3.60
2008 2009 2010 2011 2012 2013 2014
Rat
e
Years
ReceivableTurnover
Micro
Small
Medium
0.000.010.020.030.040.050.060.070.080.090.10
2008 2009 2010 2011 2012 2013 2014
Rat
e
Years
Return on Equity
Micro
Small
Medium
Figure 41: Receivable Turnover-SME Sample Trend
Figure 42: Return on Equity (ROE)-SME Sample Trend
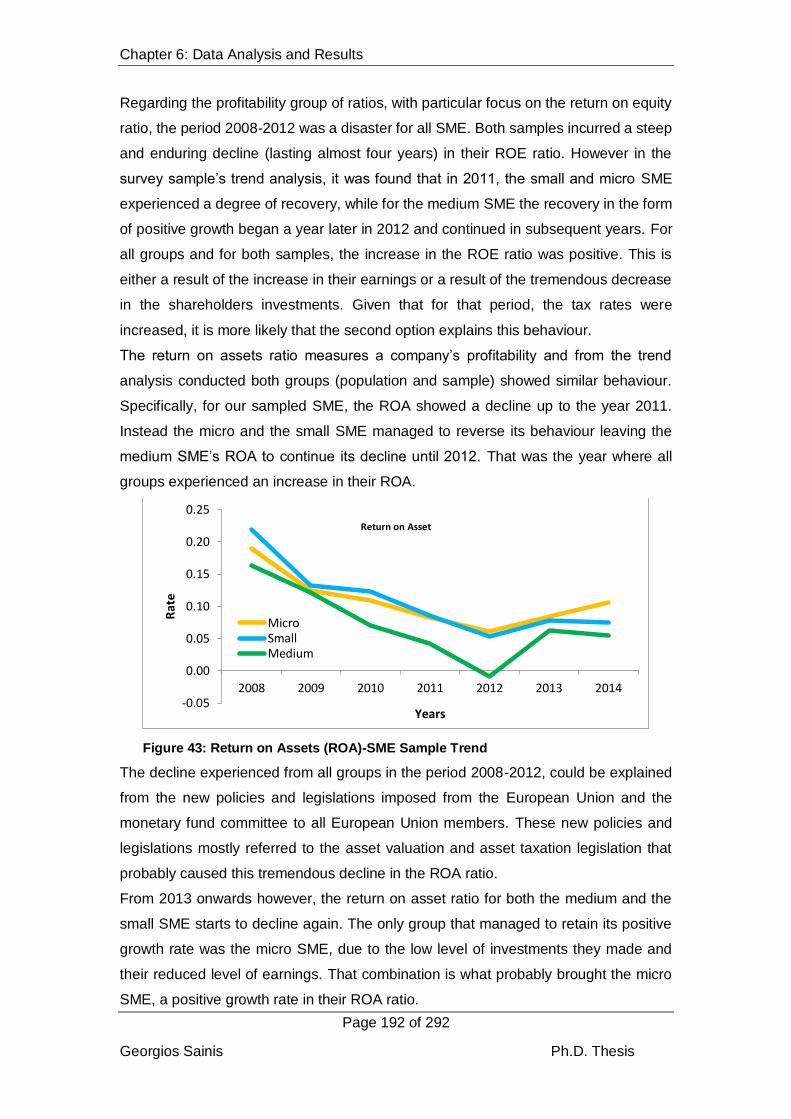
Chapter 6: Data Analysis and Results
Page 192 of 292
Georgios Sainis Ph.D. Thesis
Regarding the profitability group of ratios, with particular focus on the return on equity
ratio, the period 2008-2012 was a disaster for all SME. Both samples incurred a steep
and enduring decline (lasting almost four years) in their ROE ratio. However in the
survey sample’s trend analysis, it was found that in 2011, the small and micro SME
experienced a degree of recovery, while for the medium SME the recovery in the form
of positive growth began a year later in 2012 and continued in subsequent years. For
all groups and for both samples, the increase in the ROE ratio was positive. This is
either a result of the increase in their earnings or a result of the tremendous decrease
in the shareholders investments. Given that for that period, the tax rates were
increased, it is more likely that the second option explains this behaviour.
The return on assets ratio measures a company’s profitability and from the trend
analysis conducted both groups (population and sample) showed similar behaviour.
Specifically, for our sampled SME, the ROA showed a decline up to the year 2011.
Instead the micro and the small SME managed to reverse its behaviour leaving the
medium SME’s ROA to continue its decline until 2012. That was the year where all
groups experienced an increase in their ROA.
The decline experienced from all groups in the period 2008-2012, could be explained
from the new policies and legislations imposed from the European Union and the
monetary fund committee to all European Union members. These new policies and
legislations mostly referred to the asset valuation and asset taxation legislation that
probably caused this tremendous decline in the ROA ratio.
From 2013 onwards however, the return on asset ratio for both the medium and the
small SME starts to decline again. The only group that managed to retain its positive
growth rate was the micro SME, due to the low level of investments they made and
their reduced level of earnings. That combination is what probably brought the micro
SME, a positive growth rate in their ROA ratio.
-0.05
0.00
0.05
0.10
0.15
0.20
0.25
2008 2009 2010 2011 2012 2013 2014
Rat
e
Years
Return on Asset
MicroSmallMedium
Figure 43: Return on Assets (ROA)-SME Sample Trend

Chapter 6: Data Analysis and Results
Page 193 of 292
Georgios Sainis Ph.D. Thesis
Regarding the solvency ratios, the debt to equity ratio shows a decline which started
in 2008 and continued until 2014 that almost matches the behaviour of the whole
population of SME. The medium SME experienced the highest decline but during the
period 2010-2012 an increase was recorded. Though the ratio’s decline continued at
a higher rate until 2014 at which time negative growth rates ensued. For the small and
the micro SME that ratio decline was not as steep. The capital structure they decided
and followed gave them the opportunity to reduce the negative growth rate. In
particular, in 2012, the micro SME managed to turn that negative growth rate into a
positive one, but in 2013 onwards, growth rates became negative again.
For the last group (solvency) of ratios examined, the behaviour of the z-score rate is
encouraging for both the population and the survey’s sample of SME. Specifically, for
the medium and the small SME, the z-score showed an increase for all the years
examined except for the period 2011-2012 during which the medium SME showed an
almost zero growth rate.
-0.50
0.00
0.50
1.00
1.50
2.00
2008 2009 2010 2011 2012 2013 2014
Rat
e
Years
Debt-to-Equity
MicroSmallMedium
4.00
5.00
6.00
7.00
8.00
9.00
10.00
11.00
2008 2009 2010 2011 2012 2013 2014
Rat
e
Years
Z-Score
MicroSmallMedium
Figure 44: Debt to Equity-SME Sample Trend
Figure 45: Altman's Z-Score-SME Sample Trend

Chapter 6: Data Analysis and Results
Page 194 of 292
Georgios Sainis Ph.D. Thesis
Close to zero is the growth rate for both the small and the micro SME for the years
2012 and 2013. From 2013 onwards, the only group that showed a reduced growth
rate is the micro SME. The heavy taxation imposed to sole proprietorships, during that
period of time, is what may have caused this behaviour. Though, considering that the
behaviour of the micro SME population (registered in the i-Mentor Hellastat database)
z-score was improved, the belief that these are the companies that can survive better
under crisis conditions is still verified.
6.6 TQM and Financial Performance
This section introduces the most important analysis of the results derived. It shows the
results derived from all groups of SME financial performance in relation to the level of
quality they implemented. The three different groups of SME based on their size were
the micro, small and medium SME and the three different groups of SME based on the
level of quality implemented were the ISO SME, the ISO+ SME and the TQM SME.
The analysis approach as this is
presented in Figure 46 will blend the
characteristics of the first groups with the
characteristics of the second groups of
SME and identify their financial
performance identified from their ratio
analysis.
Financial Performance
TQM SME
ISO+ SME
ISO SME
Financial Performance
Medium SME
SmallSME
Micro SME
Figure 46: SME Categorization (Size & Quality Level)

Chapter 6: Data Analysis and Results
Page 195 of 292
Georgios Sainis Ph.D. Thesis
6.6.1. TQM SME Results
The first group of SME examined was the one that implemented the elements of TQM
more and showed willingness to continue their journey towards quality. Those
companies were named “TQM SME”. In the 5-point likert scale the TQM SME where
the ones that assigned all questions with a value of 5.
Figure 47: TQM SME - Acid Test Ratio
From the analysis of the acid test ratio, a ratio that shows an SME’s level of liquidity, it
seems that the Micro SME were the ones that outperformed in the period 2012-2014
(Figure 47). The higher the ratio, the higher the level of liquidity a company has. The
micro SME managed to keep their liquidity growth rate at a continuously growing rate.
During the period 2008-2010 however, the ratio of that group and that of the medium
SME group were declining. The small SME were the only ones whose acid test ratio
displayed growth in the period 2008-2013. The acid test ratio of the medium SME,
showed a remarkable increase from 2010 onwards together with the small SME, an
29%
41%
30%
Acid Test
Micro Small Medium
0.00
1.00
2.00
3.00
4.00
5.00
6.00
7.00
2007 2008 2009 2010 2011 2012 2013 2014 2015
Rat
e
Years
Acid Test Ratio
Micro Small Medium

Chapter 6: Data Analysis and Results
Page 196 of 292
Georgios Sainis Ph.D. Thesis
indication of the efficient and effective working capital management they applied.
Though the same ratio and the same SME experienced a substantial rate reduction in
the period 2013- 2014. From the average of the means for all the years examined and
their standard deviation, the small SME were the ones that showed the highest
variability in their acid test ratio and in their liquidity level overall followed by the micro
and the medium SME respectively. (Appendix F’).
From the analysis of the next group of ratios, the solvency ratios, the behaviour of the
debt to equity ratio for the micro and small SME were identified as being similar. The
medium SME presented a higher variation in their ratio behaviour, specifically for the
period 2009-2010. From the pie diagram in Figure 48, it is evident that the medium
SME are the ones that show the highest variability given the economic crisis
conditions.. They were followed by the small and micro SME, which incurred a slight
decline in their debt to equity ratio over the period examined.
Figure 48: TQM SME - Debt to Equity
From the analysis of the Altman Z-Score, it was found that the variability of the small
SME is not large. Instead for the period 2010-2012 the variability of the mean of the
8%
19%
73%
Debt/Equity
Micro Small Medium
-2.00
-1.00
0.00
1.00
2.00
3.00
2007 2008 2009 2010 2011 2012 2013 2014 2015
Rat
e
Years
Debt/Equity
Debt/Equity Micro Debt/Equity Small Debt/Equity Medium

Chapter 6: Data Analysis and Results
Page 197 of 292
Georgios Sainis Ph.D. Thesis
medium SME Z-score rate was the largest. Overall, all SME groups experienced an
increase in their ratios over the period examined, (Figure 49) except the small and the
medium SME for which the ratio declined in the years 2010 and 2012 respectively.
That behaviour was an indication that the SME were either withdrawing from the Greek
market, or they were simply trying to restructure and adjust their operational and
financial strategies, in order to survive against the severe economic and financial crisis
conditions.
Figure 49: TQM SME-Altman's Z-Score
A valuable set of ratios are the ones that try to identify the efficiency level of a company.
The first, is the asset turnover ratio which examines the efficiency of a company’s
assets in relationship to the company’s level of sales. The productive and efficient use
of a company’s assets is what can lead a company to increase its level of sales. From
the ratios behaviour, in all groups of SME it was evident that the medium SME
managed to better control its behaviour (Figure 50). Substantial is the growth that
occurred immediately after 2012. Whilst testing the ratios sensitivity for all groups of
SME, it was clear that the small SME were the ones with the highest variability with
29%
39%
32%
Z-Score
Micro Small Medium
0.00
10.00
20.00
30.00
2007 2008 2009 2010 2011 2012 2013 2014 2015
Rat
e
Years
Z-Score
Micro Small Medium

Chapter 6: Data Analysis and Results
Page 198 of 292
Georgios Sainis Ph.D. Thesis
the other two groups (medium and small) displaying a similar rate of variability and
sensitivity.
Figure 50: TQM SME-Asset Turnover
For the Inventory turnover, the micro SME showed the best but the most unstable
performance. This unstableness is probably explained from the variability (St.
Deviation) that the micro SME showed on average (84%) on the acid test ratio for the
whole period as this is shown in the pie chart (Figure 51). The small and the medium
SME managed to retain a more stable behaviour over the years of the economic crisis.
30%
37%
33%
Asset Turnover
Micro Small Medium
0.00
0.50
1.00
1.50
2007 2008 2009 2010 2011 2012 2013 2014 2015
Rat
e
Years
Asset Turnover
Micro Small Medium

Chapter 6: Data Analysis and Results
Page 199 of 292
Georgios Sainis Ph.D. Thesis
Figure 51: TQM SME - Inventory Turnover
The least variable behaviour comes from the small SME, which was closer to the
behaviour of the medium sized SME.
Concerning the receivable turnover, once again the micro SME had the best
performance. Excluding the period 2011-2013 when micro SME showed a no-growth
variation to that ratio, in all other years its growth was positive. This behaviour
compared to the behaviour of the other two types of SME (Small and Medium) that
appear in Figure 52 is very promising.
84%
6%10%
Inventory Turnover
Micro Small Medium
0.00
20.00
40.00
60.00
2007 2008 2009 2010 2011 2012 2013 2014 2015
Rat
e
Years
Inventory Turnover
Micro Small Medium
55%
11%
34%
Receivable Turnover
Micro Small Medium

Chapter 6: Data Analysis and Results
Page 200 of 292
Georgios Sainis Ph.D. Thesis
Figure 52: TQM SME - Receivable Turnover
The micro SME also present the highest variability (55%) in the receivable turnover
ratio, followed by the medium SME, (34%) and the small SME (11%).
For the profitability ratios, both the ROA and ROE show similar behaviour. From 2008,
the TQM SME experience a continuous decline in their profitability and their
owners/Investors. It is evident that this decline is more severe for the medium SME
than for the small or micro SME. In fact, the small SME managed to respond better to
the crisis conditions in terms of their profitability (ROA and ROE).
0.00
2.00
4.00
6.00
2007 2008 2009 2010 2011 2012 2013 2014 2015
Rat
e
Years
Receivable Turnover
Micro Small Medium
33%
23%
44%
ROA
Micro Small Medium
-0.10
-0.05
0.00
0.05
0.10
0.15
2007 2008 2009 2010 2011 2012 2013 2014 2015
Rat
e
Years
ROA
Micro Small Medium

Chapter 6: Data Analysis and Results
Page 201 of 292
Georgios Sainis Ph.D. Thesis
Figure 53: TQM SME - ROA & ROE
It is also important to note, that in 2011 the rates of the ROA and ROE of the medium
SME dropped to negative values and remained negative until 2014.
It is also clear from the pie charts (Figure 53), that the medium TQM SME and the
small TQM SME sustained the highest variability in the ROA rate and in the ROE rate
respectively. For the ROA ratio, the next most volatile group of SME, was the micro
SME and the least volatile the small SME group. The next most volatile ratio was the
ROE of the medium TQM SME group and the least volatile was the micro TQM SME
group.
6.6.2. ISO+ SME Results
The next group examined was the ISO+ SME, which are the SME that decided to
continue their quality journey with further enriching the quality elements developed for
receiving the ISO certification. The ISO+ SME are characterised from processes, tools
and activities, cultural elements and appraisal techniques that exceed the ISO
requirements, but not at a level which would elevate them to TQM SME. The rate that
29%
41%
30%
ROE
Micro Small Medium
-0.20
0.00
0.20
0.40
2007 2008 2009 2010 2011 2012 2013 2014 2015
Rat
e
Years
ROE
Micro Small Medium

Chapter 6: Data Analysis and Results
Page 202 of 292
Georgios Sainis Ph.D. Thesis
characterised the responses of these SME as being ISO+ was between 3 and 4 in the
scale of 5.
For testing their liquidity, the acid test ratio was used. The results showed that all
groups realized an up-sloping growth rate until 2013, but only the small ISO+ SME
continued to have ascending rates the following year (2014). The medium and the
micro ISO+ SME incurred a decline in their growth rate (Figure 54).
Figure 54: ISO+ SME - Acid Test
In terms of the ratios variability, it was found that the micro and the small ISO+ SME
showed similar deviations in their liquidity, followed by the medium ISO+ SME that the
ratios deviations were slightly lower. Exception was the year 2013 when the small SME
had a decline in their liquidity level. This is an indication that all groups had
approximately the same responsiveness to the economic, political and financial events
that characterised the Greek crisis during that period.
36%
36%
28% Acid Ratio
Micro Small Medium
0.00
1.00
2.00
3.00
4.00
2007 2008 2009 2010 2011 2012 2013 2014 2015
Rat
e
Years
Acid Ratio
Micro Small Medium

Chapter 6: Data Analysis and Results
Page 203 of 292
Georgios Sainis Ph.D. Thesis
The examination of the solvency ratios of the ISO+ SME, revealed that all groups
exhibited a down sloping trend in their debt to equity ratio. The companies attempted
to reduce their dependency on the banking system that was collapsing and this
resulted in the ratios decline (Figure 55).
As the debt to equity ratio decreased however, the probability of the companies going
bankrupt increased. The differences among the groups are minimal, with the
exemption of the micro ISO+ SME which only showed an increase in the ratio for the
years 2008 and 2010.
Regarding variability and sensitiveness, it was evident that the micro ISO+ SME were
the more sensitive to the Debt to Equity ratio (44%), followed by the medium ISO+
SME (29%) and the small ISO+ SME (27%).
For the Z-score ratio, the small and the micro ISO+ SME showed the highest rates,
followed by the medium ISO+ SME (Figure 56). This is an indication that the micro
Figure 55: ISO+ SME - Debt to Equity
44%
29%
27% Debt/Equity
Micro Small Medium
0.00
0.50
1.00
1.50
2007 2008 2009 2010 2011 2012 2013 2014 2015
Rat
e
Years
Debt/Equity
Debt/Equity Micro Debt/Equity Small Debt/Equity Medium

Chapter 6: Data Analysis and Results
Page 204 of 292
Georgios Sainis Ph.D. Thesis
mostly and the small SME that were more sensitive to the debt to equity ratio have
managed to keep their probability for bankruptcy at a lower level compared to the
medium ISO+ SME that their Z-score ratio has been declined. Once again the micro
and the small SME’s flexibility and ability to survive under different and difficult
condition, has been verified.
Figure 56: ISO+ SME - Altman's Z-Score
The examination of the asset turnover ratio (Figure 57), illustrated that all groups of
ISO+ SME exhibited the same behaviour over the examined period. The medium ISO+
SME however did perform slightly better than all others, and their variability is recorded
as high (41%). The subsequent less sensitive ratio and the one that showed the lowest
performance is the micro ISO+ SME ratio and the least sensitive is the ratio of the
small ISO+ SME.
33%
38%
29% Z-Score
Micro Small Medium
0.00
2.00
4.00
6.00
8.00
10.00
12.00
2007 2008 2009 2010 2011 2012 2013 2014 2015
Rat
e
Years
Z-Score
Z-Score Micro Z-Score Small Z-Score Medium

Chapter 6: Data Analysis and Results
Page 205 of 292
Georgios Sainis Ph.D. Thesis
Figure 57: ISO+ SME – Asset Turnover
For the inventory turnover ratio, the micro ISO+ SME outperform all other groups
(Figure 58). However the small SME during 2012-2013, experienced a sharp growth
rate in their inventory turnover ratio and where the only group which from that time
onwards exhibited some degree of growth in this ratio. Instead, decline was recorded
in the behaviour of the other two groups. The micro and the small groups of ISO+ SME
presented the highest variability in their inventory turnover ratio scoring 49% and 43%
respectively. The medium ISO+ SME continued to follow a more stable but low rate,
revealing their ability to better control their inventory account.
33%
26%
41% Asset Turnover
Micro Small Medium
0.00
0.20
0.40
0.60
0.80
1.00
1.20
1.40
2007 2008 2009 2010 2011 2012 2013 2014 2015
Rat
e
Years
Asset Turnover
Micro Small Medium
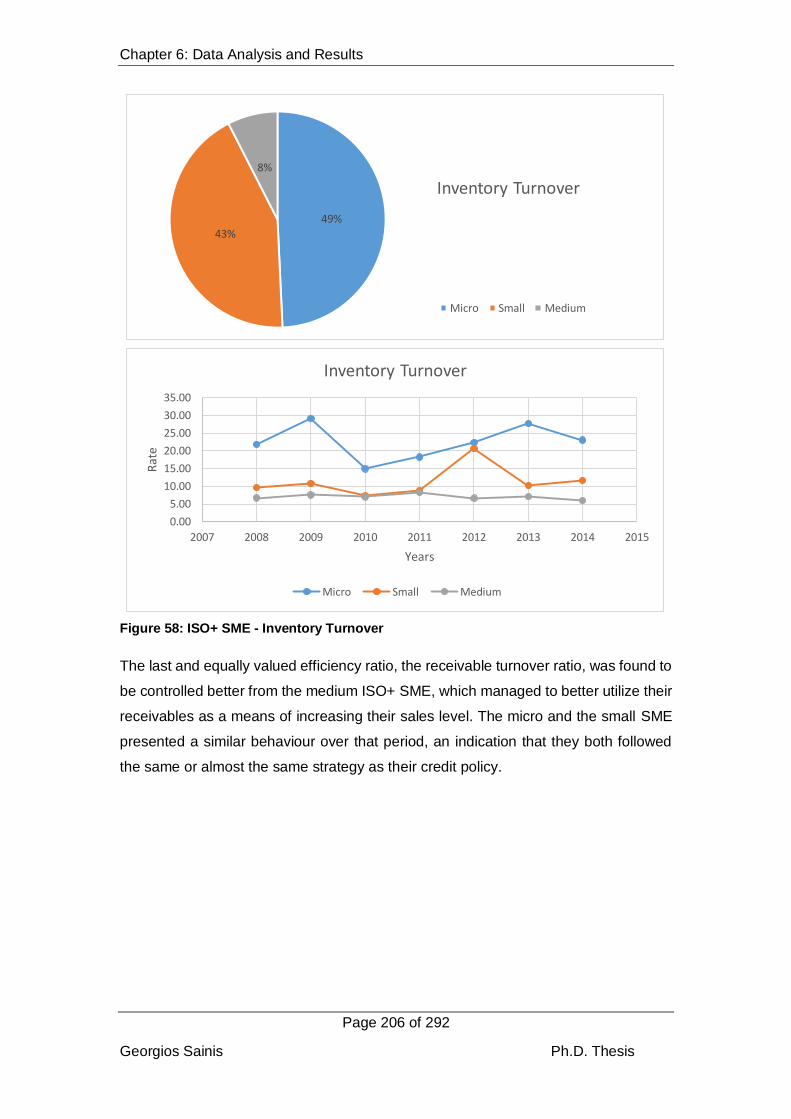
Chapter 6: Data Analysis and Results
Page 206 of 292
Georgios Sainis Ph.D. Thesis
Figure 58: ISO+ SME - Inventory Turnover
The last and equally valued efficiency ratio, the receivable turnover ratio, was found to
be controlled better from the medium ISO+ SME, which managed to better utilize their
receivables as a means of increasing their sales level. The micro and the small SME
presented a similar behaviour over that period, an indication that they both followed
the same or almost the same strategy as their credit policy.
49%43%
8%
Inventory Turnover
Micro Small Medium
0.00
5.00
10.00
15.00
20.00
25.00
30.00
35.00
2007 2008 2009 2010 2011 2012 2013 2014 2015
Rat
e
Years
Inventory Turnover
Micro Small Medium
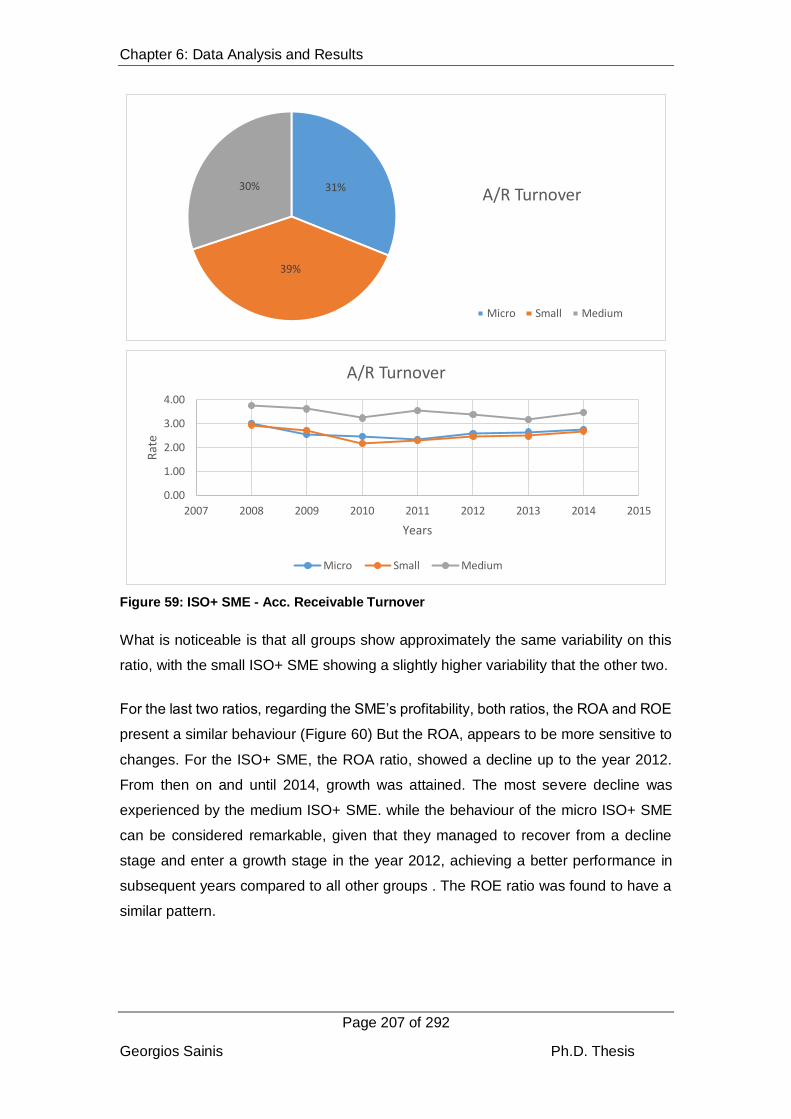
Chapter 6: Data Analysis and Results
Page 207 of 292
Georgios Sainis Ph.D. Thesis
Figure 59: ISO+ SME - Acc. Receivable Turnover
What is noticeable is that all groups show approximately the same variability on this
ratio, with the small ISO+ SME showing a slightly higher variability that the other two.
For the last two ratios, regarding the SME’s profitability, both ratios, the ROA and ROE
present a similar behaviour (Figure 60) But the ROA, appears to be more sensitive to
changes. For the ISO+ SME, the ROA ratio, showed a decline up to the year 2012.
From then on and until 2014, growth was attained. The most severe decline was
experienced by the medium ISO+ SME. while the behaviour of the micro ISO+ SME
can be considered remarkable, given that they managed to recover from a decline
stage and enter a growth stage in the year 2012, achieving a better performance in
subsequent years compared to all other groups . The ROE ratio was found to have a
similar pattern.
31%
39%
30%A/R Turnover
Micro Small Medium
0.00
1.00
2.00
3.00
4.00
2007 2008 2009 2010 2011 2012 2013 2014 2015
Rat
e
Years
A/R Turnover
Micro Small Medium

Chapter 6: Data Analysis and Results
Page 208 of 292
Georgios Sainis Ph.D. Thesis
27%
31%
42%ROA
Micro Small Medium
0.00
0.05
0.10
0.15
2007 2008 2009 2010 2011 2012 2013 2014 2015
Rat
e
Years
ROA
Micro Small Medium
31%
34%
35%
ROE
Micro Small Medium

Chapter 6: Data Analysis and Results
Page 209 of 292
Georgios Sainis Ph.D. Thesis
Figure 60: ISO+ SME - ROA & ROE
Regarding the ratios sensitiveness, both the ROA and ROE ratios were most sensitive
for the Medium ISO+ SME (35%) and less sensitive for the micro ISO+ SME (31%).
The low flexibility of the micro ISO+ SME is what gave them the opportunity to better
control their level of profitability.
6.6.3. ISO SME - Results
The last group examined was the ISO SME, which includes the ISO certified
companies. Their responses showed that no decisions or actions were implemented
throughout the course of this study to indicate top management’s willingness to
continue the quality journey.
From the examination of their liquidity level using the acid test ratio, it appeared that
the micro ISO SME are the ones that performed better in the period examined
compared to all other groups. The other two groups (small and medium) presented
similar behaviour but at a lower level. Noticeable is the exchange of positions among
the small and medium ISO SME at different points in time. For example, the small
performed better than the medium SME in 2010, and the medium performed better
than the small SME in 2012. In the latest years, both groups of companies showed
similar behaviour with the small ISO performing better than the medium SME (Figure
61). Regarding their behaviour sensitiveness the micro ISO SME (47%) were
considered more sensitive, while the other two groups responded equivalently to the
changes in the economic and financial environment which manifested throughout the
years.
0.00
0.05
0.10
0.15
0.20
0.25
2007 2008 2009 2010 2011 2012 2013 2014 2015
Rat
e
Years
ROE
Micro Small Medium

Chapter 6: Data Analysis and Results
Page 210 of 292
Georgios Sainis Ph.D. Thesis
Figure 61: ISO SME - Acid Test
Regarding the groups’ solvency level, it was found that the ISO SME faced a decline
in their debt to equity ratio (Figure 62), which is an indication of the difficulties
associated with controlling the funding sources. Consequently their z-score declined,
especially after 2013. The medium ISO SME, despite the severity of the decline of their
debt to equity ratio, managed to keep their z-score at a constant level. This revealed
their ability to more adequately control their financial strategy compared to companies
in any other group. Even though is not explicitly clear for the other two groups of ISO
SME the reduction in their debt to equity ratio resulted in the decline of their Z-score
rate, increasing their vulnerability to the crisis conditions.
The debt to equity ratio of the medium ISO SME and the z-score of the micro ISO SME
were found to be more sensitive to changes. Considering that the size of Debt and
47%
27%
26% Acid Ratio
Micro Small Medium
0.00
0.50
1.00
1.50
2.00
2007 2008 2009 2010 2011 2012 2013 2014 2015
Rat
e
Years
Acid Ratio
Micro Small Medium
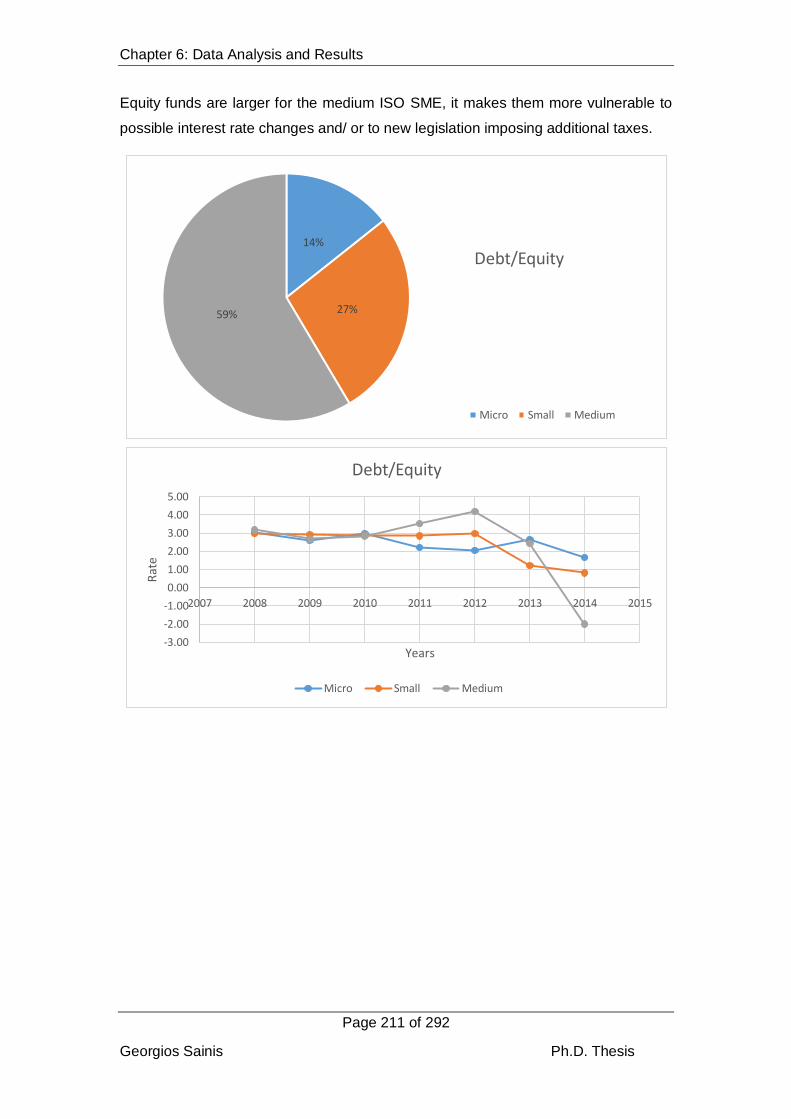
Chapter 6: Data Analysis and Results
Page 211 of 292
Georgios Sainis Ph.D. Thesis
Equity funds are larger for the medium ISO SME, it makes them more vulnerable to
possible interest rate changes and/ or to new legislation imposing additional taxes.
14%
27%59%
Debt/Equity
Micro Small Medium
-3.00
-2.00
-1.00
0.00
1.00
2.00
3.00
4.00
5.00
2007 2008 2009 2010 2011 2012 2013 2014 2015
Rat
e
Years
Debt/Equity
Micro Small Medium
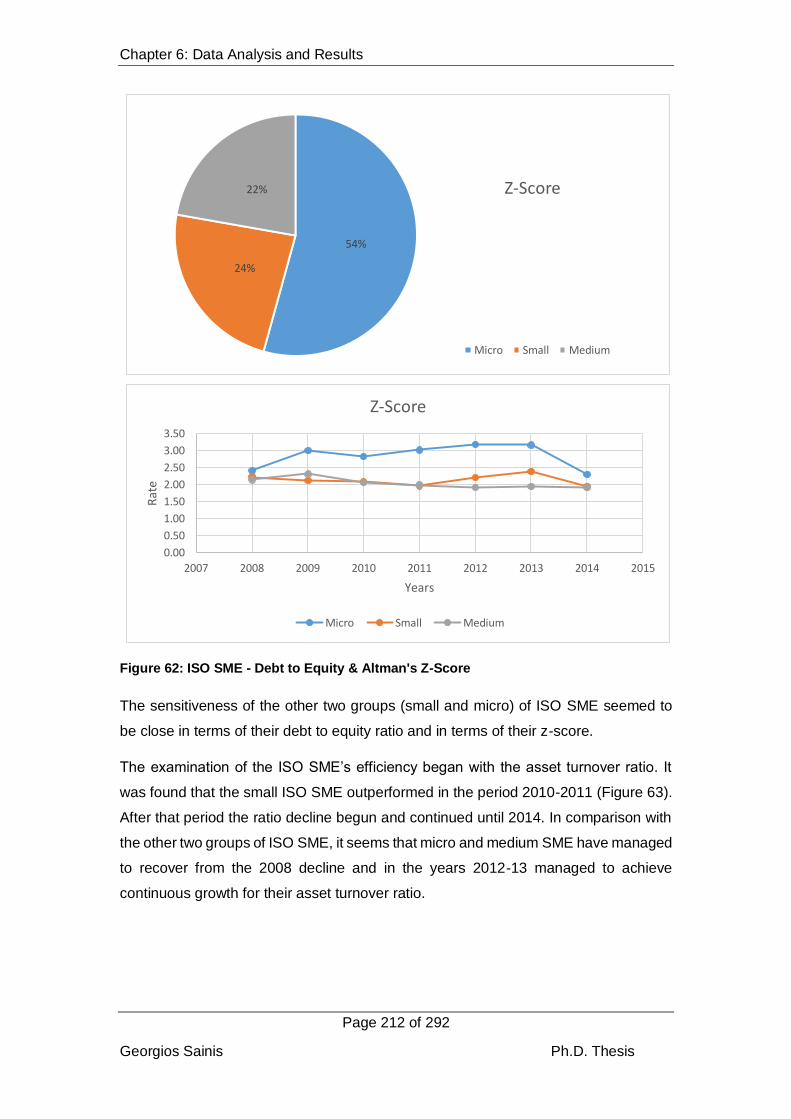
Chapter 6: Data Analysis and Results
Page 212 of 292
Georgios Sainis Ph.D. Thesis
Figure 62: ISO SME - Debt to Equity & Altman's Z-Score
The sensitiveness of the other two groups (small and micro) of ISO SME seemed to
be close in terms of their debt to equity ratio and in terms of their z-score.
The examination of the ISO SME’s efficiency began with the asset turnover ratio. It
was found that the small ISO SME outperformed in the period 2010-2011 (Figure 63).
After that period the ratio decline begun and continued until 2014. In comparison with
the other two groups of ISO SME, it seems that micro and medium SME have managed
to recover from the 2008 decline and in the years 2012-13 managed to achieve
continuous growth for their asset turnover ratio.
54%
24%
22% Z-Score
Micro Small Medium
0.00
0.50
1.00
1.50
2.00
2.50
3.00
3.50
2007 2008 2009 2010 2011 2012 2013 2014 2015
Rat
e
Years
Z-Score
Micro Small Medium

Chapter 6: Data Analysis and Results
Page 213 of 292
Georgios Sainis Ph.D. Thesis
Figure 63: ISO SME - Asset Turnover
The examination of the sensitiveness of each group to the ratio, revealed that on
average the small ISO SME showed the highest variability (40%), followed by the micro
ISO SME (32%) and the medium ISO SME (28%). The numbers clearly suggest that
the differences among the three groups of ISO SME are not very big.
Referring to the inventory turnover ratio, the micro SME were the ones that showed a
remarkable growth and a remarkable decline in the period 2012- 2014.
32%
40%
28%Asset Turnover
Micro Small Medium
0.00
0.20
0.40
0.60
0.80
1.00
1.20
1.40
2007 2008 2009 2010 2011 2012 2013 2014 2015
Rat
e
Years
Asset Turnover
Micro Small Medium
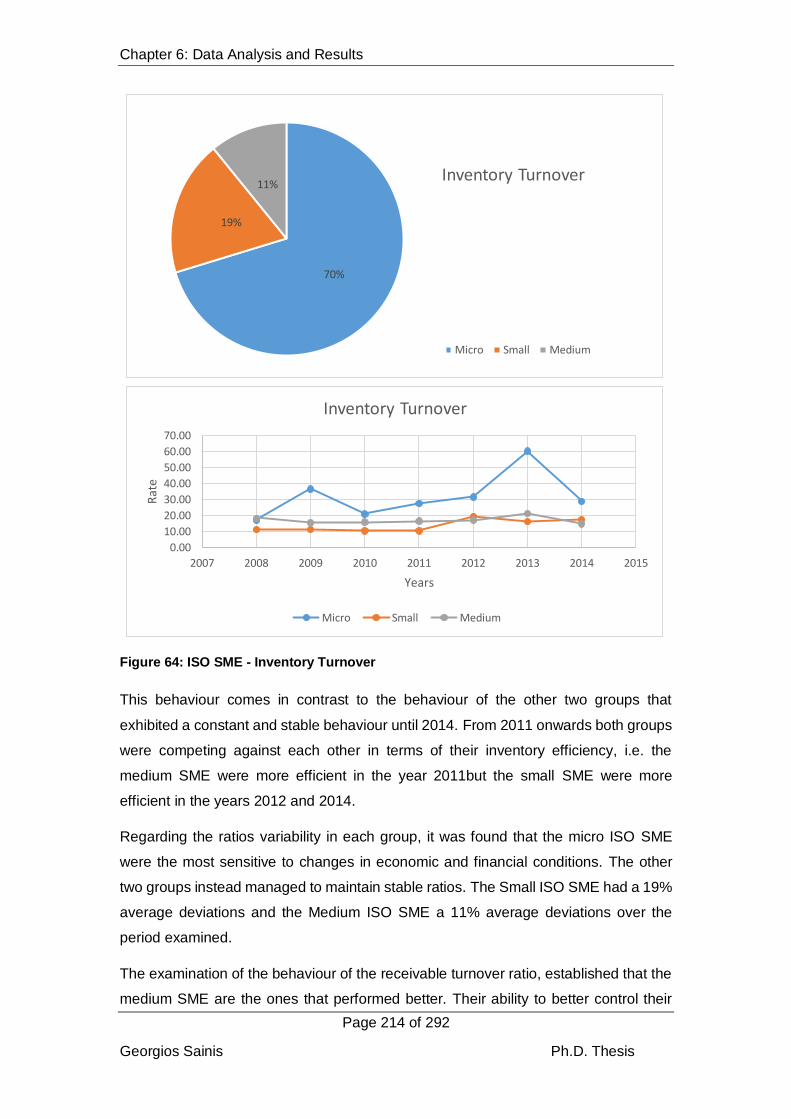
Chapter 6: Data Analysis and Results
Page 214 of 292
Georgios Sainis Ph.D. Thesis
Figure 64: ISO SME - Inventory Turnover
This behaviour comes in contrast to the behaviour of the other two groups that
exhibited a constant and stable behaviour until 2014. From 2011 onwards both groups
were competing against each other in terms of their inventory efficiency, i.e. the
medium SME were more efficient in the year 2011but the small SME were more
efficient in the years 2012 and 2014.
Regarding the ratios variability in each group, it was found that the micro ISO SME
were the most sensitive to changes in economic and financial conditions. The other
two groups instead managed to maintain stable ratios. The Small ISO SME had a 19%
average deviations and the Medium ISO SME a 11% average deviations over the
period examined.
The examination of the behaviour of the receivable turnover ratio, established that the
medium SME are the ones that performed better. Their ability to better control their
70%
19%
11%Inventory Turnover
Micro Small Medium
0.00
10.00
20.00
30.00
40.00
50.00
60.00
70.00
2007 2008 2009 2010 2011 2012 2013 2014 2015
Rat
e
Years
Inventory Turnover
Micro Small Medium

Chapter 6: Data Analysis and Results
Page 215 of 292
Georgios Sainis Ph.D. Thesis
credit terms in proportion to their sales level, contributed to improving their A/R ratio
over the period examined. The year 2010 was a good year for the small ISO SME, but
a bad year for the micro and the medium ISO SME. Contrastingly, regarding their A/R
turnover, 2012 was a good year for both micro and medium ISO SME, but a bad year
for the small ISO SME.
Figure 65: ISO SME - Acc. Receivable Turnover
It was found that in 2014, the only group that showed a decline in its ratio was the small
ISO SME as the other two groups showed a positive trend. The analysis of each
group’s variability, showed that the micro ISO SME were the ones with the highest
(40%) variability, followed by the small ISO SME (33%) and then by the medium ISO
SME (27%). This is an indication that the medium ISO SME managed to better control
their credit terms offered to their customers as a mean of supporting their sales.
40%
33%
27%A/R Turnover
Micro Small Medium
0.00
1.00
2.00
3.00
4.00
2007 2008 2009 2010 2011 2012 2013 2014 2015
Rat
e
Years
A/R Turnover
Micro Small Medium
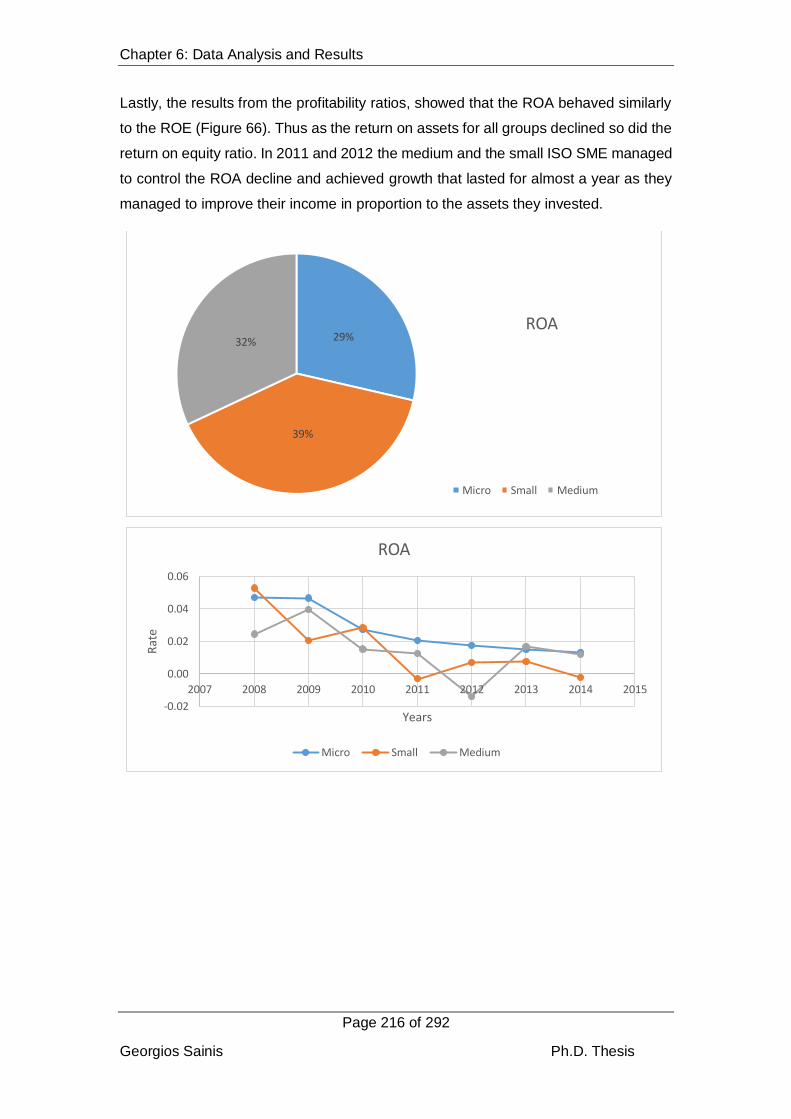
Chapter 6: Data Analysis and Results
Page 216 of 292
Georgios Sainis Ph.D. Thesis
Lastly, the results from the profitability ratios, showed that the ROA behaved similarly
to the ROE (Figure 66). Thus as the return on assets for all groups declined so did the
return on equity ratio. In 2011 and 2012 the medium and the small ISO SME managed
to control the ROA decline and achieved growth that lasted for almost a year as they
managed to improve their income in proportion to the assets they invested.
29%
39%
32%
ROA
Micro Small Medium
-0.02
0.00
0.02
0.04
0.06
2007 2008 2009 2010 2011 2012 2013 2014 2015
Rat
e
Years
ROA
Micro Small Medium

Chapter 6: Data Analysis and Results
Page 217 of 292
Georgios Sainis Ph.D. Thesis
Figure 66: ISO SME - ROA & ROE
For the ROE it was evident that the decline was more severe. Negative values were
realized for both medium and small ISO SME. Notable was the positive growth that the
small ISO SME experienced in their ROE for the period 2011-2013, when all other
groups of ISO SME had declining ROE. In addition to that increase, an increase in the
ROE ratio of the micro SME was attained. This increase started in 2014 and may signal
the beginning of their recovery from the economic depression. This growth comes in
contrast with the decline that the other two groups of ISO SME faced in the same
period. Another issue that needs to be referred to, is that even though the micro SME’s
ROE was increasing their ROA continued to decline. This is an indication that the ISO
SME shareholders decided to use any available income generated from their
companies’ operations, differently.
24%
32%
44%
ROE
Micro Small Medium
-0.30
-0.20
-0.10
0.00
0.10
0.20
0.30
2007 2008 2009 2010 2011 2012 2013 2014 2015
Rat
e
Years
ROE
Micro Small Medium

Chapter 6: Data Analysis and Results
Page 218 of 292
Georgios Sainis Ph.D. Thesis
In terms of the ROE sensitiveness, the medium ISO SME, were found to have higher
volatility (44%) in relation to all other groups. In terms of the ROA sensitiveness the
small ISO SME showed the highest volatility (39%) compared to the other two groups.
Micro SME presented the lowest variability in both ratios, an indication that their
increased flexibility, gave them the ability to achieve an acceptable profitability level
despite the economic and financial crisis conditions.
6.7 MANOVA: Differences in Financial ratios between years
Manova (Multivariate analysis of variance) is a statistical analysis tool used in
comparing different sample means derived from different groups of data (Asteriou and
Hall, 2007). The data collected and used in the current survey, refer firstly to the level
of quality implemented by the Greek ISO certified SME and secondly to the financial
ratios that indicate an SME's financial performance, during a financial crisis.
The research questions that were investigated refer to:
the different sized SME (based on the number of their employees) and questions
if they achieved an improved financial performance over the period of eight years,
during which Greece experienced severe financial crisis conditions and
the degree to which SME implemented quality, and if this impacted their financial
performance.
How the SME were grouped is presented in the previous section of this chapter. The
use of the multivariate analysis of variance (MANOVA) was selected for conducting
the financial data analysis. MANOVA is a model that protects an analyst from
committing the type I statistical error in the event of a statistically significant Manova
F-value (Asteriou and Hall, 2007). The LSD (Least significance difference) method was
selected as being the most powerful way of finding the statistically significant effects
given that a significant MANOVA F is found. Having chosen the LSD method the t-test
was used across the comparison of the group of means.
For the analysis of the financial data a similar design to the design used in the ratio
analysis was adopted. That is, a preliminary statistical analysis in all the data collected
from the i-Mentor Hellastat database SME (1.245) and a main statistical analysis in the
data collected from the distributed questionnaire to the sampled SME (392). Following
that design, the results could be compared as a means of minimizing the possibility of
bias in the results derived.

Chapter 6: Data Analysis and Results
Page 219 of 292
Georgios Sainis Ph.D. Thesis
6.7.1. Variance Analysis – Population Sample of SME
The Pillai’s trace test was selected for testing the normality of all the combined
dependent variables. Pillai’s test is considered as the best test to use in most situations
returning results similar to the Wilks’ and Lawley-Hotelling’s tests. It tested the
assumption regarding a perfect covariance matrix for all the groups examined. Pillai’s
test is considered the most powerful and robust test and the one that is least sensitive
to the violation of the assumption regarding the covariance matrix (Asteriou and Hall,
2007). From the SPSS output generated, presented in Appendix H, Section A’, the
significance level of 0.00 for all years revealed that the assumption regarding the
financial ratios having the same mean in all years, is rejected.
To examine the homogeneity variance assumption the levene’s test was used. The
levene’s test examines the equality of the means that exist in two or more groups of
data (scores, rates). The null hypothesis for Levene’s test is that the mean of variances
is equal. So, if the p-value or the level of significance is less than 0.05, it means that
this assumption is rejected. In the tables presented in Appendix H, section A’, the
Levene’s F rates and their equivalent level of significance, for each ratio and year are
shown. From the analysis, it was found that the majority of the ratios in all years
showed a non-significance level, confirming the assumption of the homogeneity of the
variances (Field, 2000).
Given that there was a statistically significant MANOVA effect, the next step was to
develop a Post Hoc test in the analysis of variance, using the Tukey’s HSD test. This
test reveals the influence that each ratio has on each other ratio and among
themselves and was used to reveal the influence of each ratio on the financial
performance of each group of SME. In other words, for all the ratios used to reveal the
level of liquidity, efficiency, profitability and solvency for an SME, the test would show
the degree to which they influenced (or didn’t influenced) its overall financial
performance. The test would also show how each group of SME was influenced, over
the period examined. The SPSS output derived from that analysis is shown in
Appendix G and depicts which ratios were influenced significantly in which group of
SME.
The means for which SPSS placed an asterisk on, show the significance of the ratios
to the SME financial performance. Specifically for the acid test ratio and for 2009, the
relationship between the micro and the medium SME with the small SME seemed
substantial. This significance appeared in almost all the years until the end of the

Chapter 6: Data Analysis and Results
Page 220 of 292
Georgios Sainis Ph.D. Thesis
period examined (2014) for both the micro and the medium SME. The only exception
were the small SME for which the significance exists only for 2011. Significance also
existed in the relationship between the small and the medium SME but only for 2014.
For the asset turnover ratio, the relationship between the micro and the medium SME
appeared to be significant from 2009 to 2014. The relationship between the medium
and the small SME for the years 2010, 2013 and 2014 was also found to be significant.
For the inventory turnover ratio, the significant relationship among the micro and the
medium SME continued throughout the period 2008-2014. Similar significance was
also identified between the micro and the small SME, for the same period. A significant
relationship was found among the small and the medium SME but only for the year
2012.
For the receivable turnover ratio, the relationship between the micro and the small
SME was recorded as significant for the years 2010, 2011 and 2014. The micro SME
were found to have a relationship with the medium SME in the year 2012 but just for
that year. For the specific ratio, significant was the relationship between the small with
the medium sized SME for the years 2010, 2011, 2012 and 2014.
For the profitability ratio ROA (Return on Assets), significant was the relationship
between the micro and the small SME for the years 2010, 2011 and 2012. The micro
and the medium SME were found to be significantly related for the years 2012 and
2013. It is also important to note that a significant relationship existed between the
small and the medium SME for the years 2010 and 2011.
For the second profitability ratio ROE (Return on Equity), a significant relationship
between the micro and the medium SME was found for the years 2011, 2012 and
2014. Significant was the relationship also found between the micro and the small
SME, but for the years 2010 and 2013. Between the small and the medium sized SME
the significant relationship was found to be longer, starting in 2010 and lasting until
2013.
Referring to the solvency ratios and specifically to the debt to equity ratio, no
relationship was found to exist among any of the groups examined. The only
relationship that was found was in 2008 and in 2012, among the micro and the medium
SME. In 2008, there was also a relationship among the small and the medium SME for
the specific ratio.

Chapter 6: Data Analysis and Results
Page 221 of 292
Georgios Sainis Ph.D. Thesis
For the Z-Score no substantial relationship was recorded among any of the groups
examined. The only exception was the relationship between the micro and the small
SME in 2011 and the micro and the medium SME in 2012.
Having established a clear picture from my research of the significant relationship
existing between the financial ratios of all groups of SME throughout the period
examined, the next step was to take full advantage of the MANOVA method. MANOVA
is capable of creating a linear regression equation upon which it can calculate a
variable. That variable will maximally discriminate among all eight groups of variables
which determine the SME financial performance
Running the multiple regression equation in Manova, enabled the extraction of the
output of the un-standardized regression weights assigned to all the canonical variants
used (ratios) that are presented in Appendix H, Section A.
The coefficients were negative, but this was arbitrarily derived from MANOVA. Flipping
the negative values to positive and the positive to negative would simply adjust the
coefficients for the purpose of the survey’s interpretation.
These coefficients were given the weights that the SPSS assigned to each variable.
Those represented the carrying weight assigned to each variable in the discriminant
function called “the canonical variant”. For example, in 2008, the asset turnover
represented 59.95% of the FP behaviour, which is the SME financial performance (FP)
behaviour.
So, it is clear that the differences between the means of the independent variable, the
FP variable developed by MANOVA, were mostly a combination of the asset turnover
and the ROE ratio for 2008. These were the variables with the highest significance.
For 2009, the Acid test ratio, the asset turnover ratio, the ROA and the ROE were the
most significant variables for that years’ FP. Only the ROA was the significant
dependent variable for 2010 and the Asset turnover ratio and the ROA for 2011. For
2012, the ROA and ROE were significant and for 2013 the ROA, ROE and the Asset
turnover ratio were significant. Finally, for 2014, the Acid test, the Asset turnover and
ROE were found to be the most significant coefficients.
Using those financial performance (FP) functions, the financial performance score of
the canonical variate or the Financial Performance variable was found. The canonical
variate is the combined set of the financial performance dependent variables, which
have been assigned unequal weights to all different ratios for all the different years
examined.

Chapter 6: Data Analysis and Results
Page 222 of 292
Georgios Sainis Ph.D. Thesis
At the end, each ratio’s contribution was derived from the multiplication of each ratio’s
score with the discriminant function coefficient. Correct results can only be derived if
the raw discriminant function coefficients not the standardized ones are used. Their
addition makes the value of the Financial Performance (FP) that its syntax is presented
below.
𝐸𝑥𝑡𝑟𝑎 𝑉𝑎𝑟𝑖𝑎𝑏𝑙𝑒 (𝐹𝑃)
= (𝐶𝑜𝑒𝑓𝑓𝑖𝑐𝑖𝑒𝑛𝑡 ∗ 𝐴𝐶𝐼𝐷) + (𝐶𝑜𝑒𝑓𝑓𝑖𝑐𝑖𝑒𝑛𝑡 ∗ 𝐴𝑆𝑆_𝑇𝑢𝑟𝑛 )
+ (𝐶𝑜𝑒𝑓𝑓𝑖𝑐𝑖𝑒𝑛𝑡 ∗ 𝐷_𝐸) + (𝐶𝑜𝑒𝑓𝑓𝑖𝑐𝑖𝑒𝑛𝑡 ∗ 𝐼𝑁𝑉_𝑇𝑈𝑅𝑁)
+ (𝐶𝑜𝑒𝑓𝑓𝑖𝑐𝑖𝑒𝑛𝑡 ∗ 𝑅𝐸𝐶_𝑇𝑈𝑅𝑁) + (𝐶𝑜𝑒𝑓𝑓𝑖𝑐𝑖𝑒𝑛𝑡 ∗ 𝑅𝑂𝐴)
+ (𝐶𝑜𝑒𝑓𝑓𝑖𝑐𝑖𝑒𝑛𝑡 ∗ 𝑅𝑂𝐸) + (𝐶𝑜𝑒𝑓𝑓𝑖𝑐𝑖𝑒𝑛𝑡 ∗ 𝑍_𝑆𝑐𝑜𝑟𝑒)
In Table 29 the outcome of all the Financial Performance (FP) functions, for each year
is shown.
Table 29: Extra Variable - Results (Population)
2008 2009 2010 2011 2012 2013 2014
Type III
Sum of
Squares
65.9995 55.9501 16.0654 74.0029 61.345 53.9168 65.2274
F 32.9962 27.9781 8.1248 37.0011 30.6736 26.9537 32.6079
Sig. 0.0000 0.0000 0.0000 0.0000 0.0000 0.0000 0.0000
In Figure 67 the statistical significance of the canonical variate or FP is shown. It is
where all the F-tests and their significance are shown. It is also clear that the behaviour
of the FP that
showed an
overall decline
in the financial
performance of
all SME in 2012,
begun to grow.
6.7.2. Variance Analysis –Survey’s sample of SME
Regarding the analysis of the survey’s sample, the Pillai’s trace test was used to test
the normality and the perfect covariance matrices assumption for all SME groups. The
results derived are shown in Appendix H, section B, where the statistical significance
of all the coefficients appear for all the years examined. For the homogeneity variance
assumption, the Levene’s test was also used and its results are also shown in the
same appendix. From the levene’s test results, it was found that for 2008 significant
Figure 67: Financial Performance (FP)-Statistical significance

Chapter 6: Data Analysis and Results
Page 223 of 292
Georgios Sainis Ph.D. Thesis
were the inventory turnover ratio, the ROA and the Z-score coefficients. For 2009, the
Acid ratio and the inventory turnover ratio were considered significant. For 2010,
significant were the Debt to Equity ratio, the inventory turnover ratio and the receivable
turnover ratio coefficients. For 2011, significant were the Inventory turnover and the
receivable turnover ratios. For 2012, the debt to equity ratio, the inventory turnover,
the receivable turnover and the ROA ratio were the significant coefficients. For 2013,
the acid ratio, the Asset turnover, the inventory turnover, the ROA and the ROE and
lastly for 2014, the ratios, acid test, asset turnover, inventory and receivable turnover
and the ROA, were considered significant.
The Post-Hoc test of Tukey (Appendix G, Section B’), was used to examine the
survey’s sample of SME, and the results revealed that the acid test ratio showed a
significant relationship between the micro and the medium SME in 2009, 2010 and
2014. The relationship between the micro and the small SME was also found
significant but only for 2014.
The Asset turnover ratio shows significance between the micro and the medium SME
only in the year 2009. For the inventory turnover ratio significance is shown in between
the same group of SME (micro and medium) for all the years (2008-2014) and between
the small and the medium SME but only from the years 2011 till 2013.
The profitability ratio, ROA, showed significance between the micro and the small SME
from 2010 to 2013 and with the medium SME in 2012 and 2013. Instead the ROE
showed significance only between the micro and the medium SME and only in 2012.
From all solvency ratios, the debt to equity ratio, showed no significant relationship
among any of the group of SME for the period examined. The Z-score function however
showed significance in the relationship of the micro with the small SME but only for
2012.
The last stage of the analysis was the development of the FP (Financial Performance)
canonical variate, the variate that combines all ratios and returns the financial
performance of all the survey’s sample SME. In Table 30 the syntax and the outcome
of all the Financial Performance (FP) functions, for each year is shown. The output
derived from SPSS is shown is Appendix H, section B’.

Chapter 6: Data Analysis and Results
Page 224 of 292
Georgios Sainis Ph.D. Thesis
Table 30: Extra Variable - Results (Survey’s Sample)
2008 2009 2010 2011 2012 2013 2014
Type III
Sum of
Squares
28.48402 43.15136 1338.749 21.29805 31.69991 36.33442 45.96243
F 14.23936 21.57522 11.36683 10.64889 15.85249 15.29022 22.98188
Sig. 0.0000 0.0000 0.0000 0.0000 0.0000 0.0000 0.0000
For 2008 it was found that the ROA and ROE were the two ratios that contributed the
most in the value of the FP, having the most discriminant function coefficients in the
regression equation.
For 2009, the ROA and the acid test ratios were considered as the more discriminant
coefficients for this year’s FP, followed by the asset turnover.
For 2010, the most discriminant variables were the Acid test, the asset turnover, the
ROA and with equal weights the ROE and the debt to equity ratio.
For 2011, the ROA and ROE were considered the most valuable variables for the
determination of the FP.
For 2012, again the ROA and ROE together with the asset turnover ratio, were
considered the most discriminant coefficients. For 2013, the ROA, ROE and the asset
turnover were found once more to contribute the most to the FP function.
Finally, for 2014, once more the ROA and ROE together with the asset turnover,
constituted the most valuable coefficients for the determination of the FP value which
is the SME financial performance.
The next phase of the study, was the development and computation of the FP, the
developed functions and the results which are depicted in Appendix H, section B’.
Specifically, for each ratio and for every year the coefficients were identified and the
function for every year was formulated.

Chapter 6: Data Analysis and Results
Page 225 of 292
Georgios Sainis Ph.D. Thesis
From the SPSS output, referring to the survey’s sample, the results showed that all
variables, for all years were significant in the determination of the FP.
From that sample it was
revealed that the
behaviour of the Financial
Performance (FP)
experienced a decline
which if ignoring the slight
increase in 2011,
continued until 2014 after
which time it increased.
6.8 TQM and Financial Performance-Comparative Results
In this section an attempt is made to relate and comparatively examine the results derived from
the quantitative survey and the ratio analysis conducted on the SME which participated in the
survey. The results of this analysis will contribute in the ranking of the SME based on the level
of quality they implemented and the level of their equivalent financial performance. The
approach used for this ranking was the scoring approach. This process constitutes, scoring
financial performance using the results derived from the ratio analysis conducted and applying
those to the scores denoting the level of quality they implemented (Quantitative survey). The
scoring approach was applied to all different groups of SME formed based on their size. Equal
weight was assigned to all the financial areas used in determining the SME overall financial
performance. The first ranking scale was the level of quality implemented from all size groups
Figure 68: Financial Performance (FP) - Results (SME Sample)

Chapter 6: Data Analysis and Results
Page 226 of 292
Georgios Sainis Ph.D. Thesis
of SME and have shown an improved financial performance. In , the micro SME that were
characterised as ISO certified (ISO SME) received an average score equal to 1.36. This group
of SME placed emphasis on their efficiency, followed by their solvency, their liquidity and their
profitability. The small ISO SME received an average score of 0.52 emphasising the same
financial areas as the micro ISO SME.
Table 31: SME Quality Groups and their Financial Performance (Ranking A)
ISO ISO+ TQM
Micro Small Medium Micro Small Medium Micro Small Medium
Profitability 0.01 0.01 0.02 0.01 0.01 0.01 0.01 0.01 0.01
Efficiency 1.22 0.35 0.21 0.44 0.39 0.09 1.45 0.12 0.23
Solvency
/Leverage 0.11 0.14 0.27 0.26 0.27 0.21 0.54 0.76 0.72
Liquidity 0.02 0.01 0.01 0.16 0.16 0.12 0.29 0.42 0.30
Score 1.36 0.52 0.52 0.86 0.82 0.43 2.29 1.31 1.26
Final Score 0.80 0.70 1.62
Rank 2 3 1
Finally, the medium SME received the score of 0.52 on average and placed emphasis
on their solvency at first followed by their efficiency, profitability and their liquidity. It
was concluded that the best financial performance among all groups of companies, for
the period examined was attained by the micro ISO SME. The average score assigned
to all ISO certified SME was equal to 0.8 placing them in the second position among
all other groups, in terms of their financial performance at the specified level of quality
they implemented.
In the second group of SME, the ISO+ SME meaning the ISO certified companies with
the intention and willingness to continue their quality journey, were ranked. The micro
ISO+ SME received an average score of 0.86, and placed emphasis on their efficiency,
solvency, liquidity and profitability. The small ISO+ SME received a score of 0.82 and
gave priority to efficiency, solvency, liquidity and profitability. Finally, the medium ISO+
SME received a score of 0.43 emphasizing their solvency, liquidity, efficiency and
profitability. The average score assigned to all ISO+ SME was equal to 0.70 placing
them in the third position among all other groups, in terms of their financial performance
at the specific level of quality implemented.
Finally, the TQM SME, the group of ISO certified SME which decided to continue their
quality journey with the full adoption of all the quality elements that characterise their

Chapter 6: Data Analysis and Results
Page 227 of 292
Georgios Sainis Ph.D. Thesis
quality system was ranked. It was found that the micro TQM SME received an average
score of 2.29, and gave priority to efficiency, solvency, liquidity and profitability. The
small TQM SME received a score of 1.31 and placed importance on their solvency,
liquidity, efficiency and profitability in relation to their overall financial performance.
Finally, the medium TQM SME received a score of 1.26 and preferred to focus on the
solvency, liquidity, efficiency and profitability of their financial performance. The
average score assigned to all TQM SME was equal to 1.62 placing them at the first
position in terms of their financial performance.
The first ranking scale was the level of quality implemented from all size groups of
SME and have shown an improved financial performance
was restructured to feature a new table, named that is ranking the different size group of SME
that have implemented quality at different levels, based on which has shown an improved
financial performance.
Table 32: SME Quality Groups and their Financial Performance (Ranking B)
Micro Small Medium
ISO ISO+ TQM ISO ISO+ TQM ISO ISO+ TQM
Profitability 0.01 0.01 0.01 0.01 0.01 0.01 0.02 0.01 0.01
Efficiency 1.22 0.44 1.45 0.35 0.39 0.12 0.21 0.09 0.23
Solvency
/Leverage 0.11 0.26 0.54 0.14 0.27 0.76 0.27 0.21 0.72
Liquidity 0.02 0.16 0.29 0.01 0.16 0.42 0.01 0.12 0.30
Score 1.36 0.86 2.29 0.52 0.82 1.31 0.52 0.43 1.26
Final Score 1.50 0.88 0.74
Rank 1 2 3
The results derived showed that the Micro, ISO SME, received a score of 1.36 and
placed priority on their efficiency, solvency, liquidity and profitability. The micro ISO+
SME received a score of 0.86 and emphasized efficiency, solvency, liquidity and
profitability. Finally, the micro TQM SME received a score of 2.29 and focused on the
efficiency, solvency, liquidity and profitability.
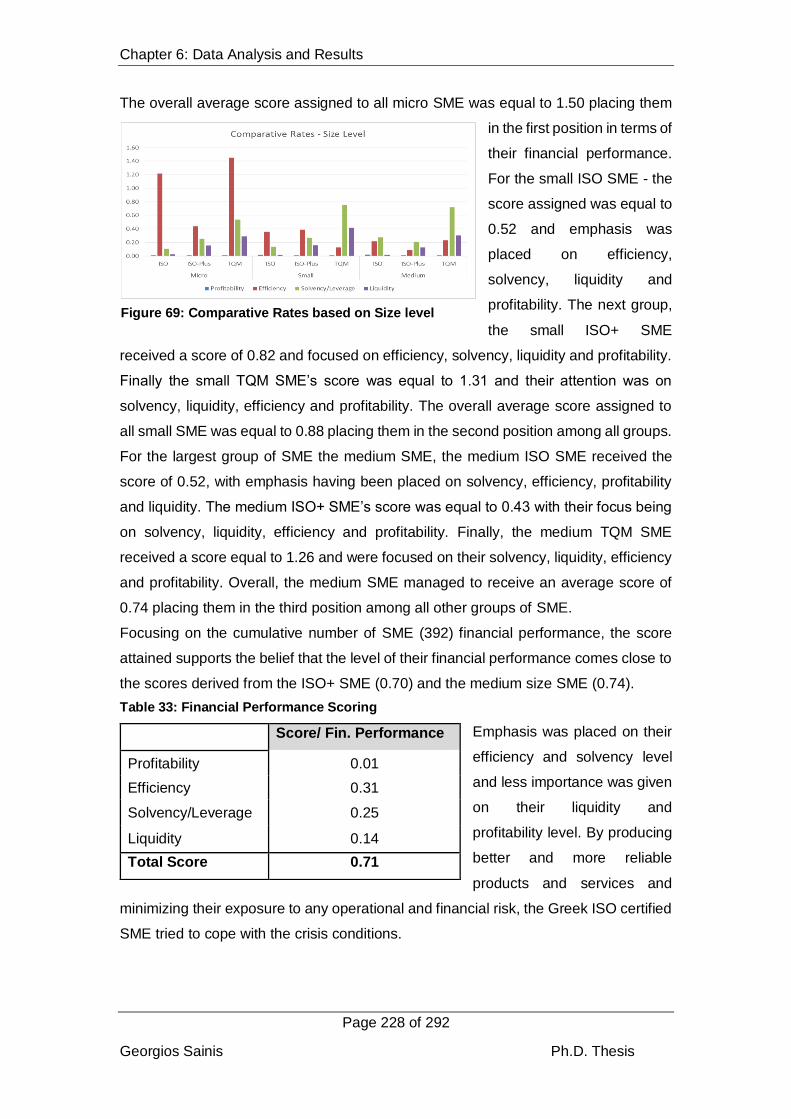
Chapter 6: Data Analysis and Results
Page 228 of 292
Georgios Sainis Ph.D. Thesis
The overall average score assigned to all micro SME was equal to 1.50 placing them
in the first position in terms of
their financial performance.
For the small ISO SME - the
score assigned was equal to
0.52 and emphasis was
placed on efficiency,
solvency, liquidity and
profitability. The next group,
the small ISO+ SME
received a score of 0.82 and focused on efficiency, solvency, liquidity and profitability.
Finally the small TQM SME’s score was equal to 1.31 and their attention was on
solvency, liquidity, efficiency and profitability. The overall average score assigned to
all small SME was equal to 0.88 placing them in the second position among all groups.
For the largest group of SME the medium SME, the medium ISO SME received the
score of 0.52, with emphasis having been placed on solvency, efficiency, profitability
and liquidity. The medium ISO+ SME’s score was equal to 0.43 with their focus being
on solvency, liquidity, efficiency and profitability. Finally, the medium TQM SME
received a score equal to 1.26 and were focused on their solvency, liquidity, efficiency
and profitability. Overall, the medium SME managed to receive an average score of
0.74 placing them in the third position among all other groups of SME.
Focusing on the cumulative number of SME (392) financial performance, the score
attained supports the belief that the level of their financial performance comes close to
the scores derived from the ISO+ SME (0.70) and the medium size SME (0.74).
Table 33: Financial Performance Scoring
Emphasis was placed on their
efficiency and solvency level
and less importance was given
on their liquidity and
profitability level. By producing
better and more reliable
products and services and
minimizing their exposure to any operational and financial risk, the Greek ISO certified
SME tried to cope with the crisis conditions.
Score/ Fin. Performance
Profitability 0.01
Efficiency 0.31
Solvency/Leverage 0.25
Liquidity 0.14
Total Score 0.71
Figure 69: Comparative Rates based on Size level
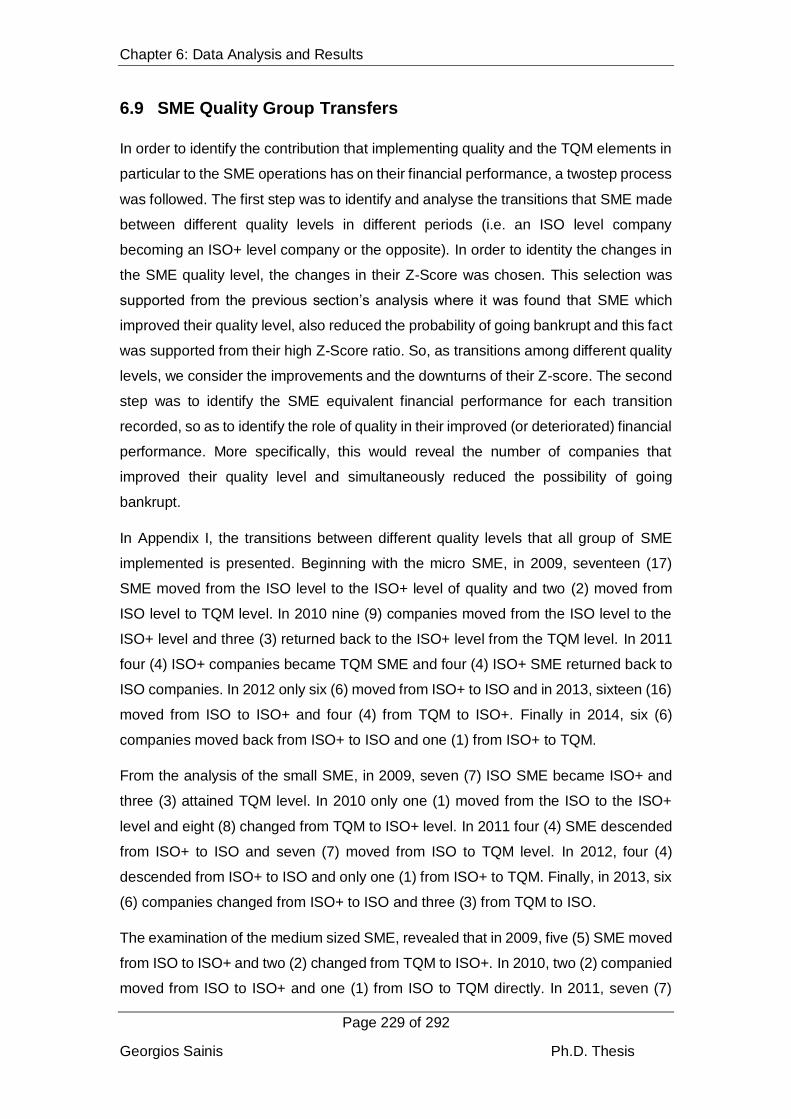
Chapter 6: Data Analysis and Results
Page 229 of 292
Georgios Sainis Ph.D. Thesis
6.9 SME Quality Group Transfers
In order to identify the contribution that implementing quality and the TQM elements in
particular to the SME operations has on their financial performance, a twostep process
was followed. The first step was to identify and analyse the transitions that SME made
between different quality levels in different periods (i.e. an ISO level company
becoming an ISO+ level company or the opposite). In order to identity the changes in
the SME quality level, the changes in their Z-Score was chosen. This selection was
supported from the previous section’s analysis where it was found that SME which
improved their quality level, also reduced the probability of going bankrupt and this fact
was supported from their high Z-Score ratio. So, as transitions among different quality
levels, we consider the improvements and the downturns of their Z-score. The second
step was to identify the SME equivalent financial performance for each transition
recorded, so as to identify the role of quality in their improved (or deteriorated) financial
performance. More specifically, this would reveal the number of companies that
improved their quality level and simultaneously reduced the possibility of going
bankrupt.
In Appendix I, the transitions between different quality levels that all group of SME
implemented is presented. Beginning with the micro SME, in 2009, seventeen (17)
SME moved from the ISO level to the ISO+ level of quality and two (2) moved from
ISO level to TQM level. In 2010 nine (9) companies moved from the ISO level to the
ISO+ level and three (3) returned back to the ISO+ level from the TQM level. In 2011
four (4) ISO+ companies became TQM SME and four (4) ISO+ SME returned back to
ISO companies. In 2012 only six (6) moved from ISO+ to ISO and in 2013, sixteen (16)
moved from ISO to ISO+ and four (4) from TQM to ISO+. Finally in 2014, six (6)
companies moved back from ISO+ to ISO and one (1) from ISO+ to TQM.
From the analysis of the small SME, in 2009, seven (7) ISO SME became ISO+ and
three (3) attained TQM level. In 2010 only one (1) moved from the ISO to the ISO+
level and eight (8) changed from TQM to ISO+ level. In 2011 four (4) SME descended
from ISO+ to ISO and seven (7) moved from ISO to TQM level. In 2012, four (4)
descended from ISO+ to ISO and only one (1) from ISO+ to TQM. Finally, in 2013, six
(6) companies changed from ISO+ to ISO and three (3) from TQM to ISO.
The examination of the medium sized SME, revealed that in 2009, five (5) SME moved
from ISO to ISO+ and two (2) changed from TQM to ISO+. In 2010, two (2) companied
moved from ISO to ISO+ and one (1) from ISO to TQM directly. In 2011, seven (7)

Chapter 6: Data Analysis and Results
Page 230 of 292
Georgios Sainis Ph.D. Thesis
companies dropped from TQM to ISO and seven (7) from ISO+ to just ISO. In 2012,
eleven (11) companies moved from ISO to ISO+ and one (1) to TQM. In 2013, one (1)
company dropped from ISO+ to ISO and two (2) moved from ISO+ to TQM. Finally in
2014 eight (8) companies descended from ISO+ to ISO and three (3) from TQM to
ISO.
With the exclusion of the companies presented above, the remaining SME retained
the same quality level.
It is also important to note, that the SME with the lowest transition movements in their
quality level, were the medium SME (Figure 70). Instead the more volatile companies
were the micro SME. The medium sized SME were recorded to have the highest
number of transitions in 2012 and 2014 and the micro SME were found to have the
most changes in 2009 and 2013. .
-20
-10
0
10
20
2009 2010 2011 2012 2013 2014
Medium
ISO ISO+ TQM
-20
-10
0
10
20
2009 2010 2011 2012 2013 2014
Small
ISO ISO+ TQM
-20
-10
0
10
20
2009 2010 2011 2012 2013 2014
Micro
ISO ISO+ TQM
Figure 70: SME Transitions per Size
Chapter 6: Data Analysis and Results
Page 231 of 292
Georgios Sainis Ph.D. Thesis
Similarly, Figure 71 depicts that the TQM SME were the ones that realized the least
number of transition movements. On the contrary, the ISO+ SME were the ones that
showed the highest number of transitions among different levels of quality.
6.10 Concluding Remarks
This chapter includes all the statistical tests conducted as well as the results derived,
relating to the research questions that were examined and analysed.
Initially, it was confirmed that SME’ improved level of quality leads to improved financial
performance. This improved financial performance was achieved mainly by the
medium sized SME and at a lesser extent by the small and the micro sized SME. Both
the qualitative and the quantitative surveys conducted,, returned on average similar
results in both, the whole population of SME (i-Mentor Hellastat) and the survey’s
sample of SME (qualitative and quantitative survey).
The SME financial performance was analysed for the population and for the survey’s
sample. A set of selected financial ratios were used to measure the SME liquidity,
-20
-10
0
10
20
2009 2010 2011 2012 2013 2014
ISO
Medium Small Micro
-20
-10
0
10
20
2009 2010 2011 2012 2013 2014
ISO+
Medium Small Micro
-20
-10
0
10
20
2009 2010 2011 2012 2013 2014
TQM
Medium Small Micro
Figure 71: SME Transitions per Quality Level

Chapter 6: Data Analysis and Results
Page 232 of 292
Georgios Sainis Ph.D. Thesis
profitability, solvency and efficiency. The four aforementioned were assigned equal
weights and used to determine financial performance. It was found that differences in
the level of quality implemented by SME had a direct effect on their equivalent financial
performance. The SME which improved their quality level were the ones that also
showed a higher level of sustainability to the financial distress caused by the crisis
conditions.
The SPSS was used as a tool to analyse the SME financial performance, through their
financial ratios, in all eight years of the crisis. With the SPSS software a special function
was developed which offered the opportunity to identify the contribution that each ratio
had (expressed as a coefficient) on the SME financial performance, for each of the
years examined.
Differences in the financial ratios were found among different groups of SME, over the
years examined (2008-2014). The following chapter, attempts to shed light on the
relationship existing between those differences and the political and economic events
which transpired throughout the period examined.

Georgios Sainis Ph.D. Thesis

Chapter 7: Discussion, Conclusions, Recommendations.
Page 233 of 292
Georgios Sainis Ph.D. Thesis
Chapter 7: Discussion, Conclusions, Recommendations.
7.1 Introduction to Chapter 7
The challenge of this thesis was to establish a set of measurable quality elements that
together with a set of measurable financial criteria (ratios), could determine the level
and the impact of quality on the financial performance of Greek ISO certified SME. The
challenge was substantial as the period examined was a period when Greece and the
Greek market suffered severe economic, financial and political crisis conditions.
Three are the crucial components that characterise an economic and financial crisis.
These are: the threat for bankruptcy, the abruptness of unpredictable events and the
limited available time top management has in order to take corrective action. These
components make the implementation of quality practices and TQM in particular, a
valuable tool (Seeger et al., 1998). An improved set of elements such as the Quality
processes and the Tools and techniques, supported from another set of elements such
as the Appraisal techniques and a Quality oriented cultural environment, would
positively contribute to an SME’s ability to cope better with crisis conditions. So, as it
was supported and from Vargo & Seville (2011), the challenge to quality is the ability
to convert crisis conditions to opportunities.
Introducing quality elements in their operations could help Greek SME adjust or re-
design their strategic plan or even enable them to design one in case they don’t use
one. This would in turn allow them to clarify their future preferences and handle the
rapid, continuous and unexpected environmental changes and any socio-cultural
issues.
The results derived from the analysis of the available data are analysed and discussed
in a process that it is shown in Figure 72. The Discussion section begins with the
analysis of the results derived from the qualitative analysis and the interviews
conducted. It continues with the discussion on the results derived from the quantitative
analysis and the 392 questionnaires collected. Both the surveys qualitative and
quantitative results are compared and any similarities or differences among them are
identified and analysed.
The data analysis and the discussion will support the thesis findings responding to the
research question and the sub-questions and the aims of the research.

Chapter 7: Discussion, Conclusions, Recommendations.
Page 234 of 292
Georgios Sainis Ph.D. Thesis
.
7.2 Discussion
The discussion begins with a reference to the results derived from the qualitative and
the quantitative survey. It continues with the analysis of the financial ratios submitted
from the Greek ISO certified SME that participated in the survey. An analysis and
discussion is also conducted on the ratios of all the ISO certified SME whose financial
data were included and downloaded from the i-Mentor Hellastat database (population).
In the discussion, the results derived from the analysis of all different groups of SME
formed, including those that have implement the quality element at different levels (i.e.
the “ISO SME”, the “ISO+ SME” and the “TQM SME”), are elaborated on. The
relationship of the TQM elements implemented by SME and how this determined the
behaviour of the selected set of ratios is also discussed. Their behaviour was examined
in relation to the level of their profitability, solvency, efficiency and liquidity that
constitute components of their overall financial performance. The political and financial
events that may influenced that behaviour, as these are shown in Figure 73 was also
examined.
Figure 72: Discussion of the Results Derived

Chapter 7: Discussion, Conclusions, Recommendations.
Page 235 of 292
Georgios Sainis Ph.D. Thesis
Figure 73: Indicative Political & Financial Events (2009-2015)
2009PASOK wins
the Greek
legislative
elections
2009PASOK wins
the Greek
legislative
elections
2010
The First, Second
and Third austerity
package are
passed by the
Greek parliament.
2010
The First, Second
and Third austerity
package are
passed by the
Greek parliament.
2011
Fourth & Fifth austerity
package is passed by
the Greek Parliament
Coalition Government is
formed.
2011
Fourth & Fifth austerity
package is passed by
the Greek Parliament
Coalition Government is
formed.
2012 Sixth austerity
package is passed by the Greek Parliament
Elections (MP: A.Samaras)
2012 Sixth austerity
package is passed by the Greek Parliament
Elections (MP: A.Samaras)
2013Reforms are Approved.
2013Reforms are Approved.
2014Due to a non-win
Presidential elections the
Government Falls
2014Due to a non-win
Presidential elections the
Government Falls
2015 Syriza wins the Elections Greek bailout referendum
is held (61%) Three Bailout packages are
approved by the Parliament
2015 Syriza wins the Elections Greek bailout referendum
is held (61%) Three Bailout packages are
approved by the Parliament
2009 Deficit -12.5% of GDP Greece’s Downgrading
from the Big Three(A2)
2009 Deficit -12.5% of GDP Greece’s Downgrading
from the Big Three(A2)
2010 Yield Curve
surpasses the 300 base points
Further Downgrading
2010 Yield Curve
surpasses the 300 base points
Further Downgrading
2011 Further Downgrading ASE below 1000
points
2011 Further Downgrading ASE below 1000
points
PO
LITICA
LFIN
AN
CIA
L2012 Debt Restructuring (83.5%) ASE falls below 500 points
2012 Debt Restructuring (83.5%) ASE falls below 500 points
2013An Upgrade from
Moody’s
2013An Upgrade from
Moody’s
2014 Primary Budget Surplus (1.5%) An Upgrade from Fitch
2014 Primary Budget Surplus (1.5%) An Upgrade from Fitch
2015 Capital Controls are imposed Banks close for a Week ASE Reopens but influenced from
the Chinese Stock market crash
2015 Capital Controls are imposed Banks close for a Week ASE Reopens but influenced from
the Chinese Stock market crash

Chapter 7: Discussion, Conclusions, Recommendations.
Page 236 of 292
Georgios Sainis Ph.D. Thesis
7.2.1. The qualitative Survey
From the qualitative analysis conducted and the scoring approach used, the results
derived showed that the SME managers implement all the TQM elements at a rate
slightly higher than the average (1.55/3.00). It is the participants’ belief, that Quality
culture is the important quality element (1.6/3.0) in TQM, because it incorporates
practices like cooperation and teamwork, as well as the continuous improvement
attitude. It also encourages innovation and creativity. The Performance appraisal
element is the next valuable quality element (1.6/3.0). The belief is that inspection and
control processes could keep a quality system functional for a longer period of time.
The Quality tools (1.5/3.0) and Quality processes (1.5/3.0) elements show slightly
lower rates in the preference of the participants. This explicitly indicates that their
perception, that come in agreement with what Hansson (2001) supported, is that just
the tools and the processes implemented, are not good enough if the SME wish to
continue their quality journey and implement all the TQM elements.
In order to analyse their responses further, three different groups of SME were formed,
based on the number of their employees. The groups formed were the Micro, the Small
and the Medium SME. This grouping brought into light the privilege the Small SME
have in favour of TQM implementation (1.75). The Medium SME (1.63/3.00) followed
leaving the Micro SME (1.25/3.00) last. The Small SME were the ones that continued
to invest in quality more than any of the other two groups. Their size and their ability to
diversify as a means of facing crisis conditions, was what enabled them to offer their
customers products and services at high quality. Instead, the Medium SME
substantially reduced the size of the funds invested in quality, as a way of minimising
their costs and increasing their profitability. Similar to that is the immediate response
of the Micro SME. Having “felt” the consequences of the economic crisis, the Micro
SME also stopped investing in quality and just tried to retain their ISO certification.
Being easier and less costly for them to formally implement practices of the Quality
culture element, the Small SME were the ones that placed greater importance on
quality culture issues (2.00/3.00). Instead the Medium SME, trying to impose greater
control over their processes, placed greater importance on the performance appraisal
element (2.00/3.00) that comes in congruence with what Hansson (2001) has
supported . Their size was what explained that behaviour. It was easier for the smaller
and harder for the bigger SME to implement the element of quality in their operations.
This was mainly due to their efficient and more effective communication processes.
Instead the larger in size SME used the performance appraisal element and a set of

Chapter 7: Discussion, Conclusions, Recommendations.
Page 237 of 292
Georgios Sainis Ph.D. Thesis
control procedures to support any improved level in their quality. Instead, for the
Quality tools and techniques element and the Quality processes element, the Micro
SME placed greater emphasis on the first quality element and the Small SME placed
more emphasis on the second. This supports the decision that the Micro SME to
sustain their ISO certification, composed mainly from the quality tools and techniques
element. On the contrary, the decision of the Small SME to continue their quality
journey further, explained the importance they placed on their quality processes
element. As this was also supported and from Youssef et al., (2002) the Just In Time
production (JIT), the Design For Manufacturability (DFM), cellular manufacturing;
statistical process control and design of experiment (DOE) being more applicable for
production oriented SME;, can further support the TQM implementation and for other
types of SME from achieving an improved level of customer’s satisfaction.
Positive was the participants’ response regarding the contribution of quality to the
improvement of their SME’s financial performance. They admitted that ISO is just the
beginning of their quality journey. They accepted that ISO offers them the capability of
organizing their processes better and that it had as a consequence improved their
financial performance. However, a number of interviewees have expressed doubts
regarding the contribution of TQM in the development of their SME financial strength,
which is definitely required for coping with the crisis conditions that Greece is currently
facing.
The interviewees’ response referring to the SME’s financial performance indicated that
the Small SME were the ones that received the highest return on their investments
(3.00). Next were the Micro SME (2.44) and at a slightly lower rate the Medium SME
(2.42). The small SME were those that strongly believed that quality and financial
performance are closely related. They also claimed, in congruence with what Demirbag
et al., (2006) have supported, that when the TQM elements are further implemented
the opportunity to overcome the consequences of the economic and financial crisis will
be actualized more easily and at a lower cost.
7.2.2. The Quantitative Survey
From the quantitative analysis conducted, it was found that the Greek, ISO certified
SME continue their quality journey to TQM showing a score slightly higher than the
average (3.08/5.00). Supported from the triangulation strategy followed it was found
that the Greek SME, under both research approaches (Qualitative & Quantitative)
produced a score higher than the average. Both approaches also revealed that the

Chapter 7: Discussion, Conclusions, Recommendations.
Page 238 of 292
Georgios Sainis Ph.D. Thesis
Small SME were those that implemented most of the TQM elements (3.292). Also,
both approaches showed that the next group to further implement the quality elements
was the Medium SME (3.074) and then the Micro SME (3.072) Differences existed in
the participant’s preferences on the quality elements implemented. Specifically in the
quantitative survey, the participants placed less importance on the Quality culture
(3.10) and the Performance appraisal (3.00) elements and higher importance on the
Quality tools (3.15) and the Quality processes (3.18) elements, than in the qualitative
survey. The low but with high significance score found for the Performance appraisal
element, supports Deming’s belief that imposing higher control in a company’s
operations reduces the employees’ motivation for higher quality. The results supported
the conclusion that the SME entrepreneurs and their quality managers were willing to
further improve their quality standards through specifically improving their quality tools
and techniques. But their concern was that without the implementation of the Quality
culture element, this improvement would not be easily achieved. Innovation, creativity,
cooperation and teamwork, constitute the quality practices supporting a company’s
‘continuous improvement’ required for TQM implementation. Given that SME have
limitations in the “knowhow” and the needed resources for fully implementing the TQM
elements, they make compromises on what they can accomplish. That is, to make all
the necessary improvements, as this was supported and from Sousa et al., (2005)
focusing mainly on the less costly or easy to implement quality elements.
From the analysis of the formed groups of SME, it was established that the Small SME
were those that showed the highest score (3.29/5.0) in implementing the quality
elements, followed by the Medium SME (3.074/5.00) and the Micro SME (3.072/5.00).
The results derived support the conclusion that the Small SME are more competent in
further implementing the quality elements. Their preferences on the quality elements
show that the Small SME invested more on the Quality processes (3.38) and the
Performance appraisal (3.37) elements. The Quality culture element (3.21) is the next
most important element for them together with the Quality tools element (3.21) that
shared the same score. For the Medium SME, priority was given to the Quality culture
element (3.27) followed by the Performance appraisal element (3.10), the Quality
processes element (3.03) and the Quality tools element (2.90). For the Micro SME,
first priority was the Quality processes (3.44), followed by the Quality tools (3.09), the
Quality culture (2.93) and the Performance appraisal (2.83) elements. The results
showed that the larger sized SME paid more attention to the Quality cultural and the
Performance appraisal elements. That preference helped them impose better control
on the already established and implemented Quality processes and Quality tools

Chapter 7: Discussion, Conclusions, Recommendations.
Page 239 of 292
Georgios Sainis Ph.D. Thesis
elements. On the contrary, the Micro SME, the smallest in size SME, preferred to invest
in the Quality processes and the Quality tools elements. Supporting those elements
more, enabled them to better restructure and enrich their operations offering them the
opportunity to be more flexible and diversified. That was the only alternative they had
in order to cope with the crisis conditions they faced. The Small SME that stand in-
between the two other groups, received the highest score in TQM implementation.
They supported the Quality processes and the Performance appraisal elements more.
Their belief that comes in agreement with what Reid and Sanders (2009) believe was
that these two elements would further support and ensure the quality of the products
or the services they produced. The other two quality elements, the Organizational
culture and the Quality tools elements, being supportive to the first two, would enable
those SME to accomplish the TQM level.
The analysis of the p-values, of the interrelationships between the quality elements
showed high significance at p<0.05. The only relationship that showed no-significance
was between the Performance appraisal and the Quality culture elements and
specifically for the Medium SME (0.04961). This conclusion is supported from what
Deming claims in his “seven deadly diseases”. He identified that the performance
appraisal element is a barrier to the effective implementation of quality. Instead the
Quality culture element as this is supported and from Soltani et al., (2006) is
considered the most valuable quality element. This implies that the role of those
elements in the implementation of TQM is also determined from the size of the SME
supported also and from the survey conducted by Kalak & Hudson (2016) who claim
that the difference between the Micro and the Small SME with the Medium SME is their
credit risk. However, the management team of all groups of SME examined, attempted
to implement both elements. This was because even the employees of the Medium
SME considered as Fons (2011) has also considered, the appraisal methods and the
techniques adopted as rigorous. Following that strategy, however made the adoption
of quality culture practices, like teamwork and innovative procedures difficult to be
established and expanded.
From the analysis of the covariance and correlation of all the quality elements for all
the groups examined, it was found that for the Micro SME, the Quality processes and
the Performance appraisal were the ones that mostly determined the implementation
of TQM. For the Small SME the Quality tools and the Performance appraisal elements
were considered as more important. For the Medium SME, the Quality processes and
the Quality tools and techniques were shown to have the highest correlation. The
Chapter 7: Discussion, Conclusions, Recommendations.
Page 240 of 292
Georgios Sainis Ph.D. Thesis
analysis of the element’s correlations, also supports the conclusion that the larger SME
were those that placed emphasis an0d attention to the Quality processes and the
Quality tools and techniques elements adopted. Instead the smaller SME, paid
attention to the Appraisal methods. Regarding the Quality culture element, the larger
SME were those who gave greater emphasis and support to it and to its practices. That
is why the Medium SME compared to all others, presented for the Quality culture
element the highest score. That occurred because the resources they needed to
implement this element were much higher, so its importance was much higher. For the
other two groups (smaller groups), the Quality culture element was ranked as their
third priority among all other quality elements. This was, as it is also supported and
from Shortell et al., (1995) because its implementation needed the minimum of
resources given that it is left upon their stakeholders.
7.2.3. The Greek SME and their Financial Performance
The financial ratios used in analysing the financial performance of SME were; the quick
ratio for analysing the SME liquidity, the asset turnover, the inventory turnover and the
receivable turnover for analysing the SME efficiency; the return on Assets and the
return on Equity ratios for analysing the SME profitability; as well as the debt to equity
ratio and the Altman’s Z-score for analysing the SME solvency. In the analysis, the
size of SME and the level of quality they implemented had a significant influence on
the way the ratios behaved in a period were severe economic and financial crisis
conditions were recorded.
The period that the financial ratios behaviour was examined was from 2008 to 2014.
The year 2008 is considered the beginning of the Greek and European financial crisis.
Within the first two years, the country’s GDP dropped approximately 20%. As it is
presented in the Small Business Administration-SBA report (2014c), the decline
continued until the end of 2014, which is the end of the period examined and the time
when a budgetary primary surplus in the country’s GDP became equal to 1.5%.
From the descriptive statistics and the statistical tests applied (Appendix E) on the
financial ratio values, the reliability of the results derived (i.e. normality, equality of
means, homogeneity) was confirmed. So, the data used in the processing in order to
come to conclusions that would support the survey’s research question, were verified.
The group of SME used for the purpose of the financial analysis were the same as the
ones used in the quantitative and the qualitative analysis conducted. The Micro, the
Small and the Medium SME and their equivalent ratios were examined. The ratios
Chapter 7: Discussion, Conclusions, Recommendations.
Page 241 of 292
Georgios Sainis Ph.D. Thesis
were used as they were also used by Shahin (2011) in order to examine the SME’s
liquidity, profitability, solvency and efficiency level for the examined period of time.
From the results derived (Appendix H’ Post Hoc), it seems that the liquidity level of the
Micro and the Medium SME are statistically significant (acid test). This significance
was evident in almost all the years of the period examined (2009-2014).The Micro SME
were the ones that performed better compared to the Medium SME in terms of their
liquidity. Significance was also found between the Micro and the Small SME, in the
years 2009 and 2011, in favour of the Micro SME. That significant rate meant that the
smaller sized SME managed to hold more cash collected from their sales, as being
needed due to the difficulties they face to raise any external financing (Loans or equity
funds).
For the solvency ratio, only some significance among all group of SME was found. In
particular, the debt to equity ratio of the Micro SME showed a relationship with the
Medium SME, but only for the years 2008 and 2012. That relationship begun in the
year 2008, a period that the Micro SME experienced an improved performance
compared to the Medium SME. But this relationship was reversed in the year 2012.
During that year, the Medium SME outperformed the Micro SME in the specific ratio.
The decision from the European parliament to release the second economic bailout of
€31.5 billion could explain this behaviour. A certain amount of that fund was given to
the largest SME in an attempt to keep them alive and reduce the unemployment rate.
Another reason, could be the discussions between the newly elected Greek
Government and its creditors. These discussions which referred to the restructuring of
Greece’s total debt, presented and in Dasilas and Papasyriopoulos survey (2015),
developed potential investors’ expectations for greater and less risky investments. It is
encouraging to note, that even when the full sample of SME was used, higher
significance was shown in the year 2012. An indication that is also critically discussed
and from the Anderson and Stallings (2014) that the sources of financing of the Greek
SME were not entirely based on a structured and strategically related decision plan,
but instead were opportunistic and mainly determined by the policies imposed by the
Government, the central bank and particularly for Greece and by the Troika.
For the solvency ratios, the Z-score function combined a set of ratios trying to identify
the probability of a company and more specifically of an SME going bankrupt. From its
analysis few relationships among the groups of SME were identified and those were
only in the years 2011 and 2012. Those were between the Micro and the Small SME
with the first having a better performance than the second. This relationship proves

Chapter 7: Discussion, Conclusions, Recommendations.
Page 242 of 292
Georgios Sainis Ph.D. Thesis
what literature and particularly karagianni and Labrianidis (2001) support, that is that
the smaller in size SME assuming the role of subcontractors to larger companies, took
on a smaller amount of risk associated with big projects, a fact that is also supported
from their ability to diversify and be involved in more than one project at a given time.
A significant relationship between the Micro and the Medium SME was also revealed
in the asset turnover ratio, but only for the year 2009. In that year, the SME responded
in this survey that they managed to control their size and the use of their assets in
relation to their sales level, effectively. The financial crisis conditions considered in all
other years and the collapse of the real estate market, potentially explains the reduced
size of their assets and sales values, as well as the reduction of their invested funds.
However, the inventory turnover, the second ratio of the efficiency ratios, showed a
different behaviour. High significance was seen among the Micro and the Medium SME
for the whole period examined. Significance was also found among the Small and the
Medium SME. In addition, the Medium SME exhibited, a better performing inventory
turnover ratio, than both the Micro and the Small SME for the whole period examined.
Differences however existed between the results derived from the analysis of the
sampled SME and those attained from the whole sample of SME registered in the i-
Mentor Hellastat Database. It is interesting to note, that in the sample, the Medium
SME showed better control over their inventory account in relation to their sales level.
This difference could be due to the size of the sample analysed, considering that in
literature the adequately flexible Micro SME, are those that organize their inventory
control procedures better. The result is not totally irrelevant as this is supported and
from Baños-Caballero et al., (2014), given that the Medium SME are those that have
all the necessary resources they need in order to adequately organize their inventory
control procedures. So, both have the potential for achieving better control over their
inventory. The issue and the contribution of this survey, was to identify how different
sized SME responded in structuring and controlling their inventory account, in a period
where economic crisis conditions existed.
Significance was also recorded in the receivable turnover ratio. It was found that the
Micro SME were significantly related to the Medium SME for the years 2009 and 2011.
The Small SME, showed significance with the Micro SME for the years 2010, 2011 and
2014. The results derived come close to the results derived from the whole sample of
SME examined. From all groups, the Micro SME were the ones that showed the best
performance on the receivable turnover ratio. Despite the crisis causing payment
delays from the suppliers and the public sector, the Small and the Micro SME did not
Chapter 7: Discussion, Conclusions, Recommendations.
Page 243 of 292
Georgios Sainis Ph.D. Thesis
encounter a major problem in their ledger account, accounts receivable. The number,
the size and the type of their agreements gave them, as this is revealed and in
Anderson’s and Stallings’s survey (2014), the opportunity to keep their receivable
accounts at a low level and impose better control over them.
The ROA (Return on Assets) ratio seemed to be significant only in the last years of the
period examined. This significance was found to be between the Micro and the Medium
SME for the years 2012 and 2014. In addition, significance between the Micro and the
Small SME was recorded in the years 2010, 2012 and 2013. In all years the Micro and
the Small SME down-performed in relation to the Medium SME in terms of their ROA
ratio. Similar conclusions are derived from both samples of SME examined (survey &
population) that come in congruence with what Miras-Rodríguez et al., (2015) have
concluded. This acts as an indication that the largest SME are those that have the
required resources to better control their investments and the high dependency of the
smaller SME investment strategy on the largest ones.
For the second profitability ratio, the Return on Equity (ROE), significance was
identified between the Micro and the Medium SME, but only in 2012. Specifically, the
Medium outperformed the Micro SME. Significance between the Micro and Small SME
with the Medium SME was revealed only in the population sample and for the years
2011, 2012 and 2013. In that analysis, the Micro and the Small SME were those that
performed better than the Medium SME. To explain that behaviour, it is important to
note, that in the year 2010 the general index of the Greek stock exchange started
dropping and in 2013 fell below 500 points.
This resulted in the reduction of the equity value of the Greek Companies and the SME
in particular. That reduced value in equity was better controlled by the Micro and the
Small SME. That improved their financial performance further from 2010 onwards.
Acting as subcontractors to Medium SME they managed to substantially reduce their
operational and financial risk that is also supported and from Dasilas and
Papasyriopoulos (2015) survey. This resulted in the further improvement of their ROE
ratio, in comparison to the Medium SME. From the year 2013, potential Greek and
international investors seemed more confident about the Greek economy and the
relationship between the Small and the Medium SME. Positive contribution led to that
year’s upgrading of the Greek economy from Moody’s organization.

Chapter 7: Discussion, Conclusions, Recommendations.
Page 244 of 292
Georgios Sainis Ph.D. Thesis
From the function with the name “Financial Performance-(FP)” that was developed
using the MANOVA syntax suitable for univariate and multivariate analysis, the
contribution and importance of each ratio on the SME financial performance for each
year, was identified. From the analysis it was found that the ratios, ROA, ROE, acid
test ratio and asset turnover ratio were the ones that mostly determined the financial
performance (FP) value of all SME. As is shown in Table 34, the results apply to all
the SME included in the i-Mentor Hellastat database for all eight years examined.
As is seen from the results, during this time frame, the R.O.A (profitability) was the
most important ratio for all the groups of SME. It is followed by the Asset turnover ratio
(efficiency) and the R.O.E (Profitability) ratio. The least important was the acid test
ratio (liquidity).
The above results, support the belief that what really worried the Greek, ISO certified
SME entrepreneurs is not the size of their debt or the probability of going bankrupt.
Instead, they cared about keeping their SME’ profitability at an adequate level in
relation to the total investment (assets) made. Less importance was placed on the
return of their own investment (Equity investment). They were also interested in
keeping the SME liquidity at a level that would satisfy their short term obligations and
needs. Characteristically, concerns for the level of their liquidity were aroused in the
years 2009 and 2014, during which Greece was downgraded three consecutive times
from all the “big three” credit rating agencies (Moody’s, Standard & Poor’s, Firtch).
Particularly, in 2010 Greece expected the enforcement of three different austerity
packages from Troika. From 2014 onwards the recovery of the Greek economy begun
and the Greek bonds gradually started to be traded again, in the financial markets.
However, the expectation that the forthcoming elections were going to be won by a left
party (SYRIZA) which proclaimed in its political campaign the exit of Greece from the
European Union, increased the feelings of uncertainty in the business environment. Of
course, the closing down of most of the Greek Banks and the capital controls imposed
Table 34: Ratio contribution to the Financial Performance (FP) determination-
Whole Population
2008 2009 2010 2011 2012 2013 2014
Asset Turnover √ √ √ √ √
ROA √ √ √ √ √ √
ROE √ √ √ √
Acid Test √ √

Chapter 7: Discussion, Conclusions, Recommendations.
Page 245 of 292
Georgios Sainis Ph.D. Thesis
in 2015, supported the Greek entrepreneurs’ concerns regarding the SME liquidity and
solvency level.
From the analysis of the survey’s sample size, it was found that the R.O.A and the
Asset turnover ratio had once again the most important contribution to the SME
financial performance. This time the R.O.E seemed to have a higher contribution to
the SME financial performance. The acid test ratio, remained a valuable component in
the determination of the SME financial performance, but contributed the least to it.
Table 35: Ratio contribution to the Financial Performance (FP) determination-
Survey's sample
2008 2009 2010 2011 2012 2013 2014
Asset Turnover √ √ √ √ √
ROA √ √ √ √ √ √ √
ROE √ √ √ √ √
Acid Test √ √ √
In Table 35, the R.O.A ratio is revealed as being the most crucial and important ratio
for all the SME entrepreneurs and the R.O.E ratio the least important. This behaviour
leads to the conclusion that the SME entrepreneurs mostly worried about how they
would keep their companies alive and their assets productive, than how they would
improve their own return on investment.
The three downgrades of the Greek economy by the Fitch and the Moody’s agencies;
the four downgrades by the Standard and Poor’s agency; the five austerity packages
imposed and approved by Troika and the Greek parliament; the resignation of the
Greek Government and the take over from a coalition Government, were some of the
political and financial events that took place after 2011. The Greek SME entrepreneurs
seeing and trying to predict the consequences of all aforementioned events, worried
more about their survival and less about their liquidity adequacy. This is seen from the
importance they placed on the asset turnover ratio, a ratio that is directly related to the
SME’s strategic and capital investment plan. Supported and from Shahin’s (2011)
survey, not that much importance is placed on the inventory turnover or the receivable
turnover ratios, given that both are mostly related to the SME’s working capital
management and working capital fund.
From the financial ratio analysis conducted and the results derived (Appendix F-
Section A) it was revealed at first that all groups of SME improved on average their
profitability level between the years 2008 to 2012. For the last three years (2012-13-

Chapter 7: Discussion, Conclusions, Recommendations.
Page 246 of 292
Georgios Sainis Ph.D. Thesis
14) however, a decline in the mean of their acid test ratio and their liquidity level was
recorded. A similar decline was seen in the trend of the mean of their efficiency ratios.
For their solvency, an average decline was recorded in the mean of the debt to equity
ratio, but an increase was shown in the Z-score’s average mean of all the groups of
SME. This is an indication that all the SME managed by reducing the level of their
liquidity, efficiency and solvency (debt to equity ratio) together with improving their
profitability level;, to increase and improve their z-score (probability of going bankrupt).
From the financial ratio analysis of the per size groups of SME, it seemed that the
Micro SME were those that better controlled their efficiency and specifically their
inventory level (Ch.6, fig.12), compared to the other two groups of SME. The Micro
SME were those that managed to reduce the probability of going bankrupt (z-score)
(Ch.6, fig.17). The problems that the Micro SME were facing were with their asset
turnover ratio (Ch.6, fig.11) and occasionally (years 2010 and 2013) with their debt to
equity ratio (Ch.6, fig16). Being more flexible than all other groups, is what gave them
the ability to diversify and find the way to survive, better than any other group of SME
that is also supported and from Germanos conclusions (2011). However, based on the
Small Business Administration report-SBA (2015), the large number of Micro SME that
operated in the Greek business environment, with just one employee, had no other
option but to liquidate. That is also supported from the negative values found in the
Micro SME trend in their return on equity ratio (Ch.6, fig14).
The Medium SME instead preferred to be externally financed. This resulted in their
higher probability (lower Z-score) of going bankrupt (z-score) (Ch.6, fig.17). The
exception is the mean of the Medium SME asset turnover ratio. Having efficiently
utilized their total assets they were able to keep a stable behaviour in all other
efficiency ratios (Inventory and Receivable turnover). Such a behaviour was not found
for their profitability and liquidity level. Among all the per size groups, the Medium SME
were those that showed the worst behaviour in the mean of those ratios (Ch.6, fig.10,
14, 15).
The Small SME, in almost all the financial ratios exhibited a behaviour that lay in
between the behaviour of the Micro and the Medium SME with the exception of the
receivable turnover ratio, which for the Small SME showed a lower rate especially from
the year 2010 onwards (Ch.6, fig.13). That behaviour could be due to their reduced
level in sales and/ or from their increased level in their accounts receivable account.
Irrespective of the reason, the consequence was their reduced level in liquidity as this
is shown in Ch.6, fig.10. Their low sales level as a result of the low demand, and the
Chapter 7: Discussion, Conclusions, Recommendations.
Page 247 of 292
Georgios Sainis Ph.D. Thesis
uncertainty they experienced with their customers (public and private sector) may have
caused this decline. Supported and from Anderson and Stalling (2014) conclusions,
this is explained from the customers’ inability to pay his/her obligations on time is what
caused that increase in the level of the accounts receivable account.
From all ratios, the most improved was the behaviour of the Z-score ratio of the Small
SME (Ch.6, fig.17). Keeping their profitability, especially the R.O.E (Ch.6, fig.15), at a
high level and their Debt to Equity ratio (Ch.6, fig.16) at a reduced and almost constant
thus predictable level; the Small SME managed, from 2010 onwards, to reduce the
probability of going bankrupt.
From the financial ratio analysis conducted using the data collected from the SME that
participated in the survey (specific sample) and completed the questionnaire, no major
differences were recorded between the two groups. Any differences recognized
referred mainly to the period incurred and on the magnitude of each ratio’s behaviour.
For example, the Micro SME continued to be the ones with the highest liquidity level
(Ch.6, fig.18), but in terms of their efficiency were not as good as the Medium SME
(Ch.6, fig.19, 20, 21). Equally good was the performance of the Small SME in terms of
their solvency (Ch.6, fig.24, 25) and profitability (Ch.6, fig.22, 23) compared to the other
two groups of SME.
Specifically, the Medium SME showed an improved performance in their Asset and
Receivable turnover ratios. Due to their larger size, the medium SME enjoyed better
negotiating terms in the agreements with their customers and suppliers and managed
to utilize their assets more. They managed to impose higher control on their sales and
the accounts receivable account. Though, this improved behaviour didn’t seem to
improve their liquidity level. The acid test ratio (Ch.6, fig.18) still remained at a low level
in comparison with the other two groups.
Similarly, the Small SME were the group of the “specific sample” that showed similar
behaviour with the SME in the total sample, in terms of their liquidity and their efficiency
ratios (Ch.6, fig.18, 19, 20, 21). Also, no difference was recognized in their debt to
equity ratio (Ch.6, fig. 24). So, similar conclusions as the ones derived from the
analysis of the “total sample” of SME were generated. However, their profitability ratios
behaviour was found to be better (Ch.6, fig.22 & 23) and their Z-score ratio behaviour
was found to be worse (Ch.6, fig.25). The reason for these minor differences, could be
the smaller amount of Small SME included in the “specific sample” compared to those
included in the total sample group of SME.

Chapter 7: Discussion, Conclusions, Recommendations.
Page 248 of 292
Georgios Sainis Ph.D. Thesis
From the comparison of the Micro SME behaviour included in the “specific sample”, to
the equivalent behaviour of the “total sample” of SME; it was revealed that the Micro
SME of the “specific sample” group were equally efficient in controlling their inventory
account and the account receivable account (Ch.6, fig.20, 21) despite being less
efficient to utilize their assets (Ch.6, fig.19). In addition, the behaviour of their liquidity
ratio was found to be similar (Ch.6, fig.18) but the behaviour of their profitability ratios
was found to be at a higher level (Ch.6, fig.22 & 23). Considering that the number of
SME included in the “specific sample” was what mainly caused these differences, it is
important to note the importance Micro SME place on efficiently managing their
working capital (inventory and receivable turnovers) and keeping their profitability at
high levels.
Differences between the two samples in all groups of SME could be caused due to the
special characteristics of those that are included in the “specific sample” group as for
example their size, the industry sector, the asset and sales size. In addition, the
assigned percentage weight that each group of SME (Micro, Small, and Medium)
included in each sample (total vs specific) could cause these differences. These
differences are not capable of changing the perception regarding the SME financial
behaviour, given that almost all ratios of both samples produce very similar results.
Conclusions on the SME financial performance in relation to their size can be reliably
derived from the analysis of the “specific sample” of SME. In the next section the above
is presented having taken into consideration the level of quality implemented in each
group of SME.
7.2.4. The Greek SME-Financial Performance & TQM implementation (Trend
Analysis)
The analysis of the SME financial performance follows. More specifically, in this section
the results derived from the trend analysis conducted on the rates of the financial ratios
collected from the SME participating in the survey (specific sample) are presented. In
that trend analysis, the SME were categorized, firstly, based on their size (no. of
employees employed) and secondly based on the level of quality they had
implemented. The trend analysis was conducted on each financial ratio and for each
group of SME formed, using as criteria their size and the level of quality that was
derived from the analysis of the questionnaires collected. Based on their size, the “size
groups” that emerged were the Micro, Small and Medium SME and based on the level
of quality implemented the “quality groups” formed were the “TQM SME”, the “ISO-
plus (+) SME” and the “ISO SME”.

Chapter 7: Discussion, Conclusions, Recommendations.
Page 249 of 292
Georgios Sainis Ph.D. Thesis
The “ISO SME” group, exhibited the most stable behaviour among all sized groups of
SME (Micro, Small and Medium) regarding the acid test ratio and the level of their
liquidity (Ch.6, fig.41); followed by the Z-score ratio (Ch.6, fig.42), the level of their
solvency, the A/R turnover ratio (Ch.6, fig.45) and the level of their efficiency. All other
ratios presented a great variability over the period examined, with the highest shown
during the last years of the period examined (2012-2014). Of that group, the Small
SME showed the highest performance for all the ratios (Ch.6, fig.44). The same group,
also showed with its R.O.A and R.O.E ratios (Ch.6, fig.46) that it managed to keep its
profitability, at a declining yet sustainable level. The ratio that down performed, in this
group of SME, was the debt to equity ratio (Ch.6, fig.42) and the level of their solvency.
All quality groups showed a decline in their exposure to debt financing, considering the
increase in their costs, with the Medium SME being the ones with the highest rate of
decline, given that their operational costs were usually the highest.
From the analysis it seemed that the “ISO SME” managed to sustain their liquidity level
and the utilization of their assets and A/R turnover, more than any other ratio. That is
what gave them the opportunity to keep their Z-Score ratio high thus the probability of
going bankrupt low, having the Micro SME receiving the highest rate.
For next quality group, the “ISO+ SME”, the liquidity ratio showed the highest growth
among all different sized groups of SME (Ch.6, fig.34). Their profitability ratios were
found to decline (Ch.6, fig. 40). This decline continued until 2012 when growth
appeared again. Also remarkable was the down slopping behaviour of their debt to
equity ratio (Ch.6, fig.35) in almost all size groups. Their initiative to change their capital
structure could explain the upsloping curve in their Z-score ratio (Ch.6, fig.36) and the
reduced probability of going bankrupt. The most unstable (risky) behaviour as this is
supported and from Hirt et al., (2013) was identified in the inventory turnover ratio
(Ch.6, fig.38), particularly from the Micro SME, despite this group outperforming in that
efficiency ratio the other two size groups. So, in a period of instability, bearing more
risk is what could bring more returns to a company. Noteworthy was also the behaviour
of the profitability ratios which after the year 2012 displayed a growing rate (Ch.6,
fig.40). The Micro and the Small SME were those whose performance on profitability
was better compared to the Medium SME which came last. This was an indication that
mass production and the economies of scale concepts are not capable of increasing
the SME profitability; further supporting the decision of a large number of medium sized
SME to search for new markets abroad. From the year 2002 there is a continuous
increase of Greek exports to foreign markets and there is an expectation, as this is

Chapter 7: Discussion, Conclusions, Recommendations.
Page 250 of 292
Georgios Sainis Ph.D. Thesis
presented in McKinsey Global Institute report (2012) that they will continue to grow
from -9% to +2% (Exports over GDP) from 2010 to 2021.
In addition, the SME decision to reduce their external funding as a means of reducing
their risk (lower Debt to equity ratio) was what gave them the opportunity to minimize
their probability of bankruptcy. That decision was also supported from the initiative of
the Greek Government to motivate the development and growth of the whole
entrepreneurship environment and business creativity as this is reported in the Small
Business Administration Report-SBA (2014c). Notable is the increase of the
profitability of all size groups, especially of the Micro and the Small SME (Ch.6, fig.39
& 40). This growth is specifically evident during the last years of the period examined.
Also notable is the improved efficiency characterised from the high inventory turnover
ratio rate that both the Small and the Micro SME showed in relation to the low but
stable rate of the Medium SME. Imposing better control on their inventory, explained
the increased level in the liquidity for the first two size groups of SME. But it also
explained the reduced, in relation to the Medium SME, level in their A/R turnover. By
increasing the number of the purchase orders and reducing the size of those orders
they managed to reduce their exposure to risk, minimizing the possibility of having a
large number of units unsold at the end of a period,.
Regarding the last quality group of SME, the “TQM SME”, are the ones that showed
the most improved financial performance in terms of their liquidity, efficiency and
solvency. Decline was realized in their profitability. Considering that overreliance on a
company’s profits is not needed in measuring an SME’s financial performance it is
supported and from Pacheco (2015) that the “TQM SME” are those that managed to
show the best financial performance among all other quality groups of SME. They
specifically showed improvements in their liquidity level (Ch.6, fig.27) up to the year
2013 and improvements in their efficiency level (Ch.6, fig.30, 31, and 32). The
progressive reduction in their debt to equity ratio (Ch.6, fig. 28) increased their
sustainability in the market resulted from their increased z-score ratio (Ch.6, fig.29)
that substantially reduced their bankruptcy probability.
Among the three sized groups, the Small SME were the ones that performed better in
terms of their Z-score ratio. It is also important to note the great variability of the Micro
SME’s behaviour and their deviation from the other groups regarding the inventory and
the receivable turnover ratios. Their ability to be more flexible and easily diversifiable
is what gave them the chance to be more efficient and effective. Offering better credit
terms to their customers made them capable of increasing their sales level and their

Chapter 7: Discussion, Conclusions, Recommendations.
Page 251 of 292
Georgios Sainis Ph.D. Thesis
inventory turnover rate. They also applied an adequate and efficient approach to
collecting their receivables and this had as a consequence the improvement and of
their liquidity level.
Summarizing the consequences from implementing the quality elements at different
levels, for the whole number of SME, it was revealed that the “TQM SME” were the
ones that have substantially improved their financial performance in the period
examined. That conclusion comes close to what is supported in literature and in
particular from Herzallah et al., (2014); Marimuthu et al., (2014); Paulet et al., (2014)
and Rose and Approach, (2003) that is the SME inability to fully and effectively
implement all the quality elements and make them part of their strategic plan, if one
existed. Their inability to view their investment in quality as a long term investment and
not a short term one, was also brought to light. The quality elements selected for
determining the quality level adopted by Greek SME, revealed, as is supported by
literature, that their improved financial performance is attained only from those
companies that have fully implemented all the quality elements meaning the “TQM
SME” (Ch.6, table.6).
The next quality group that was revealed to have an improved financial performance
was the “ISO SME” group, which includes the SME that chose to implement quality
elements only up to the level that satisfied the ISO standards. The quality group with
the least improvement in their financial performance was the “ISO+ SME”. The ISO+
SME decision was to improve the selected quality elements but not in a fully structured
manner and they have also considered their investment to quality as a short and not a
long term investment. In addition, the role and contribution of quality to the
improvement of their strategic plan was never considered.
From the “TQM SME” quality group, in terms of their size, the Micro TQM SME
achieved the highest financial performance followed by the Small TQM SME and the
Medium TQM SME. This is an indication that the smallest in size TQM SME, were the
ones that managed to better control the selected quality elements resulting in their
improved financial performance (Profitability, Efficiency, Solvency and Liquidity). The
Micro SME flexibility and their ability to adapt to changes as this is shown also in the
surveys conducted by Herzallah et al., (2014) and Sharma, (2005), so to be diversified
when the economic and financial conditions impose such a behaviour, could explain
that result. The Micro “TQM SME” were the ones that gave higher importance to their
efficiency level, followed by their solvency level. In comparison to the other two groups

Chapter 7: Discussion, Conclusions, Recommendations.
Page 252 of 292
Georgios Sainis Ph.D. Thesis
(Small TQM and Medium TQM SME) the Micro SME were those that placed greater
importance on their solvency and liquidity level (Ch.6, Table.6).
For the next quality group, the “ISO SME” group, in terms of their size, the Micro SME
showed the best financial performance in relation to the other groups. Similar to the
previous quality group, emphasis was given on the improved efficiency and solvency
level. It is important to note, that the efficiency and solvency performance was
emphasized by all sized groups with the Micro ISO SME placing more emphasis on
their efficiency level (Ch.6, Table.6).
Similarly for the “ISO+ SME” quality group, the Micro SME showed the best financial
performance. The Micro SME placed higher importance on their efficiency and
solvency level, similar to the importance that was given from the small ISO+ SME.
Instead the medium ISO+ SME placed greater importance on the solvency and liquidity
level of their financial performance (Ch.6, Table.6). Notable was that none of the
groups placed importance on the profitability level supporting the conclusions derived
from Pacheco L.(2015). Pacheco supported that profitability is not a good indicator of
a company’s financial performance and instead emphasis should be placed on a
company’s creditworthiness and ability to control its debt and equity variables.
Efficiency together with solvency are the two of the most important financial
performance indicators, a conclusion that is supported from this survey. Both financial
indicators and the role and contribution of quality elements on them, are supported
from a number of surveys presented in literature as for example from Kampouridis et
al., (2015); Wali and Boujelbene, (2011) and from Zairi et al., (1994)., nonetheless with
a great amount of criticism
To further support the results derived from the above analysis, table 6 (Ch.6) was
replaced with a new table, forming table 7. In that new table (Ch.6, Table 7) the primary
variable is the Micro, Small and Medium SME and the secondary variable is the level
of quality that each one implements (ISO, ISO+ and TQM SME). From that table it was
found that the Micro SME were the ones that showed the highest financial performance
(score: 1.5). Of those, the micro TQM SME were the ones with the highest financial
performance among the other quality groups (score: 2.29). Emphasis was placed
again initially on their efficiency (score: 1.45) and secondly on their solvency (score:
0.54). All quality groups of that size group of SME showed similar preferences on these
two financial performance indicators.

Chapter 7: Discussion, Conclusions, Recommendations.
Page 253 of 292
Georgios Sainis Ph.D. Thesis
The Small SME (score: 0.88) follow with the “TQM SME” being those with the highest
score in their financial performance (score: 1.31), placing importance on their solvency
and liquidity level. They were followed by the “ISO+ SME” (score: 0.82) and of those
the “ISO SME” (score: 0.52) being financial better, placing emphasis on their efficiency
and solvency level.
The Medium SME, with a financial performance score equal to 0.74 (Ch.6, Table.7)
attained the weakest position. In that group, the “TQM SME” were those that performed
better financially (score: 1.26) having placed emphasis on their solvency and liquidity.
This score was followed by that of the “ISO+ SME” and the “ISO SME" each of which
placed similar emphasis on the solvency and efficiency.
From the results derived that come in agreement with the results of Lawless et al.,
(2015) survey it was concluded that the largest in size SME (medium) emphasized
their liquidity adequacy, compared with the other two groups that emphasized their
efficiency capabilities. That result leads to the conclusion supported by Kalak &
Hudson (2016) that the Micro and the Small SME should be treated differently
compared to the Medium SME on how to control and determine their credit risk.
Solvency and the ability to be creditworthy was a financial criterion that was adopted
with high priority from all groups of SME.
The survey’s conclusions regarding the micro SME being the group that presents the
most improved financial performance during a crisis period, is also supported from the
financial data presented in the report of the IIF (Institute of International Finance) as
this is shown in the Anderson and Stallings, (2014) survey. That report shows that the
Micro SME were and continue to be the ones that give the highest added value to the
Greek economy (almost 50% of the value added from all SME). Due to the fact that
almost 370.000 Greek SME defaulted their operations in the period 2009-2013, the
consolidation of the least power micro SME primarily with the Small and secondarily
with the Medium SME, in order to continue functioning, was an option that was followed
empowering them further.
From the transition analysis (upgrading/ downgrading) of SME in-between different
quality levels (ISO, ISO+, TQM) it was revealed that the “ISO” and the “ISO+ SME”
were those whose quality level was mostly downgraded. The “TQM SME” quality level
was also downgraded, due to the difficulties they faced in maintaining their quality
system at such high levels. However, they were downgraded to the level of ISO+ SME
but not lower. This is an indication supported and from the surveys conducted by

Chapter 7: Discussion, Conclusions, Recommendations.
Page 254 of 292
Georgios Sainis Ph.D. Thesis
Anderson and Stallings, (2014) the Kalak and Hudson, (2016) and the Lawless et al.,
(2015) that the SME the further processes their quality level have managed to keep
their quality standards at a high level ready to further implement them again in the
future, when the crisis conditions ceased. It is important to note, that the average
transitions recorded from the “ISO+ SME” and the “TQM SME” took place in the middle
and towards the last years of the crisis period examined. This is an indication that any
quality downgrading was not a result of management’s decision, but a result of the
consequences of the crisis conditions. In contrast, the average number of transitions
in all the “ISO SME” were recorded in the beginning and the middle of the period
examined. This is an indication supported and from Prajogo and Brown, (2006) that
the ISO SME were the ones that were affected first from the crisis conditions and their
decision was to either upgrade their quality standards in order to survive or to default
7.3 Conclusions
The aim of the thesis, was to use the quality theory to identify the level of implementing
the quality elements that characterise the Greek, ISO certified SME. The Quality tools
and techniques, the Quality processes, the Quality culture and Performance appraisal
elements and their recorded scores were used as a means of determining the sampled
SME quality (TQM) level implemented. On those, the relationship and the
consequences of implementing the quality elements on their financial performance
was further examined. Their liquidity, profitability, solvency and efficiency level, using
ratio analysis, were the performance criteria based on which their financial
performance was evaluated.
7.3.1 Findings
It was identified from the qualitative analysis conducted that the Greek SME place
more emphasis in supporting the Performance appraisal and the Quality culture
elements, than the Quality tools and the Quality processes elements. The reason could
be their inability to bear the high cost of implementing advanced Quality tools &
techniques and Quality processes, compared to the lowers cost in adopting
Performance appraisal techniques and introducing Quality cultural elements into their
existing processes. The small SME, the largest in size SME, are the ones which
continued to invest in quality and the micro SME opted to completely abandon their
attempts to continue their quality journey, given their inability to invest.
Following the triangulation approach, the conclusions derived from the quantitative
analysis come close to the qualitative analysis. Specifically, it showed that the Greek
Chapter 7: Discussion, Conclusions, Recommendations.
Page 255 of 292
Georgios Sainis Ph.D. Thesis
SME continue their quality journey to TQM are placing more emphasis on the Quality
tools and the Quality processes elements. Quality culture and Performance appraisal
are the next two quality elements which Greek entrepreneurs focus on. The results
derived reinforce the belief that the Greek entrepreneurs have understood the
importance of the quality culture and the performance appraisal elements when
implementing TQM in their SME. This is something that has been mostly recognized
from the largest in size SME (small) and less by the smallest (micro) SME, due to their
ability to financially support this quality journey. This conclusion was derived from both
types of surveys conducted.
From the implementation of the Financial Performance (FP) function developed in the
SPSS software (MANOVA syntax), it was found that the ROA and ROE (Profitability),
the Acid Test ratio (Liquidity) and the Asset Turnover Ratio (Efficiency) were the ones
that mostly determined the value of the SME financial performance.
The first part of the comparative analysis conducted, using the level of quality
implemented, as a criterion, showed from the results derived that the TQM SME are
the ones that showed a sustainable financial performance over the period examined,
followed by the ISO SME and the ISO+ SME.
The results also showed that from the TQM SME, the ones that exhibit better financial
results were the medium size SME (the largest), followed by the micro and then the
small SME.
Amongst the ISO SME, the best financial performance was achieved by the micro SME
with the other two groups showing similar results.
The best financial results were achieved by the micro ISO+ SME, with the small SME
being in second place, leaving the medium SME last.
From the second part of the comparative analysis conducted, using the SME’s size,
as the criterion the results derived showed that the Micro SME (the smallest) were the
ones that showed the most sustainable financial performance, followed by the small
and the medium SME.
In all categories, the TQM SME were the ones that showed the best performance,
followed by the ISO and the ISO+ SME, except in the small size SME where the ISO+
SME showed better performance than the ISO SME.
A clear indication that, at first, quality has a role in an SME’s financial performance and
that in a period of severe crisis conditions, quality is capable of offering SME the

Chapter 7: Discussion, Conclusions, Recommendations.
Page 256 of 292
Georgios Sainis Ph.D. Thesis
competitive advantage that would enable them to sustain their operational and
financial position within the market they operate.
7.3.2 Quality elements applied to SME
The primary data collected from the distributed and returned questionnaires showed a
score nearly above the average in almost all the TQM elements implemented from the
Greek ISO certified SME. This was an indication that they had the intention and the
willingness to continue their quality journey. Those scores also showed that the quality
elements they preferred to implement were the ones that are closer to the concepts
and ideas of the ISO standards, these being the “Quality tools & techniques” and the
“Quality processes” elements. The scores also showed that they intended to
additionally implement the other two quality elements namely the “Quality culture” and
the “Performance appraisal” elements, given that their scores are also higher than the
average score. That comes close and is supported from the conclusions derived from
the survey conducted by Siakas et al (2014) who pointed out the differences existing
between the family and non-family Greek SME in relation to their improved financial
performance. The differences they recognized were due to the use of their self-
developed methods that were mainly supporting their cultural characteristics including
strategy, governance, succession conflict; and appraisal characteristics. .
Literature and in particular Pinho (2008) reveals, that the level of implementing the
TQM elements in SME is subject to criticism. In a number of surveys, it has been
admitted that the role of quality implementation in SME is to give them primarily the
opportunity to be competitive, utilize their (limited) resources effectively and easily
identify their target markets. In almost all those studies among which is the Muhammad
and Khairul (2015) study, the conclusions and/or suggestions that come in congruence
with this survey’s conclusions were that the SME need to develop their own way of
incorporating the quality elements into their own corporate strategy and operations. A
way that would enable the SME to do this is the use of a model, as for example the S-
P model that could be used as a guidance for establishing the needed for TQM
implementation quality elements and standards. Incorporating such a model, the
quality elements that this thesis proposed and proved as efficient and effective in
different quality levels and in different sized SME; would motivate the Greek
entrepreneurs to improve or sustain the already achieved quality level. The improved
financial performance of the SME that reached the TQM level compared to all others,
could offer additional motivation to the Greek entrepreneurs to continue their quality
journey. The survey conducted by Nurazree and Mohd Faiz (2014) have also found

Chapter 7: Discussion, Conclusions, Recommendations.
Page 257 of 292
Georgios Sainis Ph.D. Thesis
that implementing TQM would lead an SME to improve its operational and financial
performance together with its learning processes.
7.3.3 Quality elements applied to different in size SME
To value the SME implemented quality level, the scoring analysis conducted was also
based on the groups of SME formed based the number of employees employed. The
results derived, showed that for all groups, the quality level implemented score was
above average. That is, all groups continued or had the intention to continue their
quality journey. The highest score though was attained from the small in size SME,
followed by the Medium and the Micro SME.
The Small SME, being the ones that showed high importance in further implementing
all the quality elements are those that gave more importance to the Quality processes
and the Performance appraisal elements. Less importance was given to the Quality
tools and Quality culture elements. The difference is due to the dedication and the
strong motivation that characterises the work force of the small in size SME. Thus,
placing higher importance on the Quality processes and Performance appraisal
elements, the Small SME brought an improved effectiveness to the TQM
implementation process and added higher value to their operations than the Medium
SME. Similar conclusions are also derived from the surveys conducted by Fening et
al., (2012), by Nyanga et al., (2013) and by Bourlakis et al., (2014).
Considering that the Micro SME (the smallest) are composed mostly of one or two
employees, with one of them being the company’s owner, it is considered easy and
almost costless for them to give priority and implement the Quality culture element in
their operations. The micro SME, were found to have similar results as the small SME.
The only difference, rationally explained is the higher importance they give to the
Quality tools and techniques and lower to the Performance appraisal elements. What
characterises the Micro SME is to be OME (Owner-Manager entrepreneur) centric
creating difficulties to them to implement the performance appraisal element. So, all
the funds invested in developing performance appraisal techniques, instead are
invested in developing new and innovative Quality tools and techniques, improving
their overall quality level.
The Medium SME instead, placed high importance on the Quality culture and the
Performance appraisal elements and lower importance on the Quality processes and
Quality tools elements. Supportive to this low preference, is that those elements are in
proportion to their size more difficult and more costly to implement. This comes in

Chapter 7: Discussion, Conclusions, Recommendations.
Page 258 of 292
Georgios Sainis Ph.D. Thesis
congruence with the results derived for the Medium SME financial performance
analysis that recognized them as the worst performing group among all, in the crisis
period examined.
This conclusion supports what Bourlakis et al.,(2014) noted, that is the excel of the
Small and the Micro SME compared to the Medium SME in terms of their study’s
selected sustainable performance criteria, i.e. gross profit margin, supply chain
performance.
It is again important to note that all quality elements showed scores that were above
the average.
Pun et al, (2012) have also stated that the Medium rather than any of the other two
groups of SME (Micro and Small) place more emphasis on the Quality cultural element.
They specifically point out that the large size SME positively influence the low “power
distance” element, meaning that each employee has his/her position and responsibility
in a company’s hierarchy, which facilitates the implementation of the Quality
management principles (QMP’s). However, they have stated that as the size of an
SME increases beyond 200 employees, that contribution is eliminated. They noted that
the “uncertainty avoidance”, the femininity, the collectivism and the “confusion
dynamics” quality culture elements, do not facilitate the development of the QMPs.
That could be the reason why the Performance appraisal element was the second
preference among the managers of the Medium size SME.
Following the triangulation approach, the analysis of the interviews conducted gave
similar conclusions with the results derived from the quantitative analysis. This further
supported the conclusion that the Small SME were those that effectively and efficiently
implemented the selected quality elements of TQM in a period where economic and
financial crisis conditions were present. The qualitative survey analysis revealed that
the preferences of the interviewees are in favour of further implementing all the quality
elements. All scores recorded were slightly higher than the average score. The Small
SME were those with the highest score followed by the Medium and the Micro SME.
Their preferences on the quality elements were close to the preferences realized from
the quantitative analysis with some worth mentioning differences. In particular, the
Small SME placed more importance on the Quality processes element and less
importance on the Quality tools and techniques. Their inability to find the necessary
funds in order to invest in more advanced and technologically improved tools and
techniques brought rendered the Quality culture and the Performance appraisal

Chapter 7: Discussion, Conclusions, Recommendations.
Page 259 of 292
Georgios Sainis Ph.D. Thesis
elements in second place in their preferences. The Medium SME presented similar
results to the quantitative survey’s results, giving higher importance to the
Performance appraisal element and for all other Quality elements showing equal
scores. The Micro SME were those that came last in their quality implementation
preferences. Their attention was on the Quality tools and techniques element and to
the Quality culture element. Their preference on the Quality culture element supported
and from Gherhes et.al., (2016) encourages the perception that the Micro SME
constitute enterprises of an “owner-manager entrepreneurs”. So the cultural
background of the entrepreneur, characterises the Cultural element in the TQM
implementation process. That gives a direct and an indirect role to the Quality culture
element in the TQM implementation process, a fact which is also supported from the
conclusions that Valmohammadi & Roshanzamir (2015) and Tidor et al., (2012) found
in their survey’s. In the first’s survey results, the significant and direct relationship of
culture and TQM on a company’s performance and the indirect relationship of culture
on TQM was identified. Similarly, in the second’s survey results the establishment of a
quality culture in improving an SME’s financial performance was identified as being the
first priority element before any other.
7.3.4 The financial performance of SME (trend analysis) under crisis conditions
SME entrepreneurs recognize the need for developing or altering their corporate
strategy when financial and social crisis conditions exist. Those changes can be
achieved by reinforcing the innovativeness of the products and services produced from
increasing control of their costs and prices thus improving their financial performance;
from better developing the relationships with their stakeholders and from improving
their information management processes. All the above, can be interpreted from the
simple introduction of the TQM elements into their operations. These changes will give
them the “weapons” to fight and overcome the difficulties imposed on them from the
economic crisis. That conclusion comes in congruence with the results derived from
the survey conducted by Bourletidis & Triantafyllopoulos, (2014), with the exception
that the term “TQM strategies” was not used.
In order to examine the SME financial performance, a trend analysis on a selected set
of financial ratios was conducted. The selected ratios revealed the SME liquidity,
profitability, solvency, and efficiency level. On the values assigned from each
participant (Questionnaire) in each of the eight ratios selected, statistical significance
tests were applied (Anova F-test and Welch F-test) and the hypothesis for the equality
of their means was ratified. This allowed the application of the ratio analysis. The ratios

Chapter 7: Discussion, Conclusions, Recommendations.
Page 260 of 292
Georgios Sainis Ph.D. Thesis
were selected from the pool of ratios that exist in literature. The number and the type
of the ratios selected as a means of examining the SME profitability, liquidity, efficiency
and solvency level, including the Altman Z-score rate; makes the results of the analysis
valuable and pioneering. Those ratios (Acid test, Asset turnover, Accounts receivable
turnover, Inventory turnover, ROA, ROE, debt to equity and Altman Z-score) were used
in order to measure the SME and their per size and per quality level groups’ financial
performance.
In the ratio analysis conducted for the period 2008-2014, it was found that the Micro
SME were the group that exhibited the most improved financial performance (on
average) than all other groups, followed by the Small and the Medium SME,
respectively.
The growth in the Micro-businesses is characterised from their business capabilities,
the owner-manager’s characteristics, the owner-manager’s ambition and the business
environment (Gherhes et al., 2016). Those characteristics distinguish them from all
other groups. Those are the SME the growth of which is based on their capabilities to
improve their efficiency, their liquidity, their profitability and partly their solvency level
more easily and with adequate flexibility, compared to all other groups.
Regarding the efficiency ratios, the Medium SME revealed an increased variability
(high risk) in all ratios and an improved rate on their asset and receivable turnover
ratios. The Micro SME instead, showed an improved efficiency in their inventory
turnover ratio and the Small SME low efficiency in almost all the efficiency ratios with
the receivable turnover ratio being the lowest among all groups, over the period
examined. Thus, the largest in size SME (medium), were those that their efficiency
level was at the highest level. In contrast to the perception that stability rather than
variability and flexibility are what the Medium SME are looking for the variability and
the increased level of uncertainty recorded in the efficiency ratios behaviour were
simply explained from the crisis conditions that the Medium SME were coping with as
this was also supported and from the surveys conducted by Muhammad and Khairul,
(2015) and Afthonidis and Tsiotras, (2014),. So, flexibility and adaptation to new
environmental conditions is also required for the Medium SME to sustain their
efficiency.
Examining the profitability ratios, a remarkable downturn was recorded until the year
2012, when growth was again achieved. The peak of the financial crisis, with more
than five downgrades from all credit rating agencies (Fitch, Moody’s, Standard &
Chapter 7: Discussion, Conclusions, Recommendations.
Page 261 of 292
Georgios Sainis Ph.D. Thesis
Poor’s) might have been the reason for this downturn. Improved however was the
profitability level of the Micro and the Small SME from 2012 onwards. The Medium
SME instead showed an occasional improvement in their profitability performance after
2012 though it was lower than the performance of any of the other two groups. Their
stability and ability of not being as vulnerable to the external environmental conditions
as the other two groups could explain that behaviour.
A continuous downturn expressed the behaviour of all the per size groups of SME
regarding their solvency level. From those the Micro and the Medium SME were the
ones that managed to experience occasional improvement in their solvency ratios.
When Greece's economy was downgraded from the credit rating agencies in the period
2009-2010, the micro SME were offered the opportunity to minimize their credit risk. In
addition, the Medium SME in the period 2011-2013, when the economy started to
recover (upgrading from Moody’s) and new funds (European) supported the economy,
gave them the opportunity to improve their solvency level. This comes in agreement
with what Marimuthu et.al (2014), have identified that the smaller in size SME are those
that have shown a sustainable average performance in their solvency level compared
to the large SME.
An up-sloping trend was evident for all per size groups of SME in their Altman Z-Score
rate. The one with the highest trend was the Micro SME and with the lowest was the
Small and the Medium SME interchangeably. This could be explained by the large
number of Micro SME presented in Small Business Administration-SBA (2014b) that
were liquidated in the early years of the crisis period. Based on that result, it was
concluded and supported by Vermoesen et al., (2013) conclusions that the SME that
managed to survive during the crisis period were those that their chances for identifying
new investments were the highest and the Micro SME followed by the Small SME were
the most suitable. Their probability for bankruptcy was also influenced as being the
lowest, given that they exhibited the highest Z-score rate. The inability of the medium
(largest) SME to be solvent and their high probability to default is due to their inability
to generate an adequate level of sales that would support the use of their assets as
this was also sustained and by Marimuthu, et.al, (2014).
It is also important to note, that comparing the results derived from the analysis of the
two sets of data (sample population and sample SME) no major differences, in terms
of their trends, were found. This is an indication that our sample adequately explains
the behaviour of all the ISO certified SME that are registered in the database (i-Mentor
Hellastat) used.
Chapter 7: Discussion, Conclusions, Recommendations.
Page 262 of 292
Georgios Sainis Ph.D. Thesis
7.3.5 The financial performance of SME (MANOVA) under crisis conditions
To further statistically support the result derived from the ratio analysis conducted in
section 7.3.3, MANOVA was used in identifying the SME and their financial behaviour
on the per size groups over the period examined. All the necessary statistical tests,
Box’s M (equality of means), Pillai’s test (normality) and levene’s test (homogeneity)
were used, proving the level of significance for all the ratios used in the period
examined. The extra variable developed, using the Manova syntax function,
contributed to that analysis. This extra variable was named the “financial performance
variable (FP)” and a post Hoc test was conducted incorporating all the financial ratios
used in the ratio analysis. The use of the post hoc test revealed any significant
interrelationship existing among all the financial ratios used for each year of the period
examined. The FP variable contributed in identifying the financial performance of all
SME for each year of the period examined.
The results derived from the SME which responded to the questionnaire, showed that:
3.3.4. The best financial performance was exhibited in 2009 and in 2014, with the
return on assets and the acid test ratios presenting the highest contribution to the
SME financial performance in both years. The worse financial performance (FP)
was in 2010 and in 2011, with only the R.O.A and the R.O.E ratios showing small
but positive contribution to that value.
3.3.5. The SME’ financial performance was mostly affected from the crisis conditions
during the year 2008, as well as in the years from 2010 to 2013. In 2014, an
improvement in their financial performance is evident from their improved efficiency
(Asset and receivable turnover), profitability (ROA and ROE) and solvency (Z-
score). This behaviour can be explained by the political and financial events that
took place during those years and influenced positively the Greek financial
environment, i.e. change in the Government, change in the Presidency of
Democracy, change in the Ministry of Finance, surplus in the primary budget,
issuance of a 3 billion Eurobond, and an upgrade of Greece from Fitch.
3.3.6. The post-hoc analysis conducted, revealed that the most statistically significant
relationship was among the Micro and the Medium SME on the liquidity, profitability
and efficiency ratios, for all the years examined. Instead no relationship was
revealed among any group, regarding the solvency ratios. Some statistical
significance was shown in the relationship between the Micro and the Small SME
but only for the years 2012, 2013 and 2014. Notable was also the inverse

Chapter 7: Discussion, Conclusions, Recommendations.
Page 263 of 292
Georgios Sainis Ph.D. Thesis
relationship recorded between the micro and the medium SME, showing that they
both operated in a very competitive environment and a worst financial performance
of the medium SME has as a consequence the improved performance of the micro
SME and vise-versa. Imposing capital controls and closing of the stock exchange
market the Government caused the dis-functioning of the medium SME leaving
space for the micro SME to function better.
3.3.7. Summarizing, the total number of SME, included in the i-Mentor Hellastat
database (1,245) showed a poor financial performance for the period 2009 to 2010,
as well as for the period 2012 to 2013. Instead, in the years 2009, 2011 and 2014
they exhibited an improved financial performance. Similar were the results derived
from the post hoc analysis of the sampled SME (392).
Figure 74: SME Financial Behaviour over the examined period (2008-2014)
2008 2009 2010 2011 2012 2013 2014
Decline DeclineDecline GrowthGrowth Decline/ Growth Decline
D e c l I n e D e c l I n e
7.3.6 The effect of quality elements on SME financial performance
While fully answering the research question of the thesis meaning identifying those
quality elements the implementation level of which could contribute to the continuation
of the Greek ISO certified SME’ quality journey, resulting in the improvement of their
financial performance and subsequently their ability to cope adequately with the
financial crisis conditions that Greece has been facing for the last eight years, the
following conclusions have been derived.
Considering the results found, it is clear that the level of quality an SME
implements, determines its financial performance under crisis conditions. This
finding is also supported in the results derived from Shahin’s analysis (2011). In
his survey he has used also the ratio analysis as a tool of measuring a company’s
financial performance. The ratios he used were the current ratio, the quick ratio,
the return of assets ratio, the return on equity ratio, the debt to total assets ratio,
and the total assets turnover ratio. It outcome shown a 95% level of confidence
that TQM has a positive influence on a company’s financial performance. Being
more focused on TQM and using the results derived from the current survey’s
quantitative survey as a criterion, the Quality processes and the Quality tools

Chapter 7: Discussion, Conclusions, Recommendations.
Page 264 of 292
Georgios Sainis Ph.D. Thesis
elements are the ones that are emphasized most. Given that it is easier for the
smaller in size SME to implement the Quality culture and Performance appraisal
elements, the larger SME are those that implement those elements further.
Following the triangulation strategy, similar are the results from the qualitative
survey, which emphasized the Quality culture element more, indicating that all
SME entrepreneurs have conceptually understood the importance of that element
in order to continue their quality journey.
Considering the above conclusions, the Micro SME size group, showed better
financial performance over the period examined, followed by the Small SME and
the Medium SME. For the Micro SME, the ones that coped better financially were
the “TQM SME” followed by the “ISO SME” and the poorly performing “ISO+ SME”.
For the Medium SME, the best financial performance was exhibited by the “TQM
SME” followed by the “ISO SME” and the “ISO+ SME”. Finally, for the Small SME,
the best financially performing companies were the “TQM SME”, followed by the
“ISO+ SME” and the “ISO SME”. Concluding, the “TQM SME” were the ones whose
financial performance was improved the most compared to any other quality group
among all size groups proving the contribution of quality to the ISO certified Greek
SME. The significant relationship between the TQM elements and the SME
financial performance is also shown in the survey conducted by Herzallah et al.,
(2014). The authors managed to show the indirect, positive and significant
relationship existing between the TQM elements and the SME financial
performance among competitive strategies (i.e. cost leadership, differentiation and
focus (Porter, 1980)) that under the Greek economy’s crisis conditions could
constitute alternative courses of action. Other studies, have shown no relationship
between TQM and financial performance such as the study by Kober et al., (2012),
support the need for focusing more on each sub-group of SME examined, the
extent of the quality elements examined, as well as enlarging the areas of financial
performance evaluation criteria, i.e. liquidity and efficiency ratios. This current
study takes into account a set of financial ratios that examine different financial
categories simultaneously (efficiency, profitability, solvency and profitability and
the Z-Score rate) that may cause this differentiation in the results derived.
At different levels of quality implemented, the quality group that coped better
financially among all other groups, over the period examined, were the “TQM
SME”, followed by the “ISO SME” and then the “ISO+ SME”. For the “TQM SME”,
the best financial performance was achieved by the Micro SME followed by the
Chapter 7: Discussion, Conclusions, Recommendations.
Page 265 of 292
Georgios Sainis Ph.D. Thesis
Small and the Medium SME respectively. In the “ISO SME” group, the best
financial performance was realized by the Micro SME followed by the Small and
the Medium SME, which showed less improved financial performance with equal
scores. For the “ISO+ SME” group, the best financial performance was attained
by the Micro SME followed by the Small and the Medium SME. From the above
referred results, it is clear that irrespective of the level of quality implemented in
the Greek SME, the Micro SME characteristics are those that under crisis
conditions, are capable of sustaining an adequate financial performance. Micro
SME characteristics, like the customer’s satisfaction, management’s expertise,
the owner’s management style and characteristics, the company’s financial and
other resources, their existing corporate strategy and networking as this was also
stated and from Fatoki, (2013), are those that would reinforce more the
implementation of the TQM elements and support their sustainability and
longevity.
The importance placed on the efficiency and solvency and not on their profitability
and liquidity of all size groups is also supported by Voulgaris et al., (2000) and
Soininen et al., (2012) who identified them as significant before the crisis years.
That leads to the conclusion supported and from (Campa and Camacho-Miñano,
2015) that their first priority should be to continue their operations, producing
more of their products and services. They should also depend more on real
activities and not on accruals, increasing this way their earnings management.
Searching for new avenues in new markets to supply their production is the only
available alternative for their survival under crisis conditions. This option is clearer
to the smaller sized SME (Micro & Small) than to the larger sized SME (Medium)
where importance is placed mostly on their solvency level, due to the larger size
of their assets and required working capital funds. Though problems may occur
from the lack of liquidity (imposed capital controls) as it was identified and from
(Afrifa, 2016) but also and of the availability of funds invested in the SME’ required
working capital for supporting sales.
• From the transition analysis conducted, the improvements and downgrades of
the SME financial performance based on their Z-score value and their probability
of going bankrupt, revealed that for the per size group of SME’s, the Medium and
the Small SME are those that presented the least transitions compared to the
Micro SME that showed the highest rate of transitions. In addition, for the per
quality level group of SME, the “TQM SME” were those with the least number and
size (risk level) of transitions compared to the “ISO” and the “ISO+ SME”. They

Chapter 7: Discussion, Conclusions, Recommendations.
Page 266 of 292
Georgios Sainis Ph.D. Thesis
were those with the more volatile in terms of number and size (Risk level) of
transitions. The downturns of the “ISO SME” were more that the downturns of the
“ISO+ SME” which instead showed an increase in the number and size of their
improvements. The conclusions derived are firstly that as the size of an SME
increases the transitions to different levels of solvency (Z-score), lower for the
larger SME and get higher for the smaller SME, but decrease in terms of their
number and size. Similarly, as the quality level implemented approaches the TQM
level, the number of transitions and their size are also reduced. So, the larger
SME and the more quality oriented SME, are those that present better financial
performance, and are much less likely to go bankrupt in a period of severe
economic crisis conditions. Focusing on the SME size, it is also considered and
supported from the thesis, and from the surveys conducted by (Bourlakis et al.,
2014; El Kalak and Hudson, 2016) that between the Small and the Micro SME,
no big differences exist in the way their credit risk behaves. Evidence of the fact
that the higher the level of quality implemented in an SME, the better the
improvement of its financial performance and bigger the reduction of the
probability of going bankrupt is also supported from a number of different
perspectives and from a number of surveys conducted such as those by Pinho,
(2008); Ntombekaya, (2010); Pacheco, (2015); and Shahin, (2011).
7.4 Recommendations
Going one step further on the already existing research that refers to the TQM
implementation on SME and its contribution to their financial performance, the element
of risk is introduced, given that the thesis refers to the Greek ISO certified SME that
are operating in severe financial crisis conditions.
The opportunity to further develop the same topic, entails the replication of the same
study in a few years from now. This survey would show the progression in the
implementation of TQM in Greek SME, in a period that the country and its economy
would hopefully start recovering from the prolonged financial crisis.
An additional alternative in the same direction, could be as mentioned in the previous
section changing the research approach from a self-study type to a longitudinal type.
Though, the availability of data for that kind of research would be of a great concern.
Another research opportunity within this field could include developing a comparative
study between the Greek ISO certified SME and the ISO certified SME of other

Chapter 7: Discussion, Conclusions, Recommendations.
Page 267 of 292
Georgios Sainis Ph.D. Thesis
European, American or Asian countries, which have experienced but recovered from
similar financial crisis conditions, such as Italy, Spain, Portugal, Philippines, Malaysia,
Venezuela,
Another opportunity could be to expand the qualitative part of this survey and enrich it
with more interviews or with a number of case studies. These new elements would
examine the effect of TQM implementation on an SME’s financial performance in more
depth and its ability to cope with unstable and uncertain economic environment.
An option for further research, could also be the investigation of the relationship
between the SME customers or employees satisfaction rate, at different levels of
quality implemented and their equivalent financial performance, or researching on the
consequences and effects realized from further implementing the quality elements on
the capabilities of the core internal processes, or the corporate social responsibility
level of the SME.
Finally, another opportunity could also be to investigate the possibility and the benefits
derived from merging the SME that are not in a position to fully implement the TQM
practices with those that can. This alternative is valid given that total quality is identified
as a means of realizing long term profitability and an increase in an SME’s market
share. This could offer to these merged companies the opportunity to better survive
under crisis conditions at the present or in a future occasion.
7.5. Implications
This thesis contributes to literature and to the business environment with a set of
practical implications.
It is suggested that the Greek ISO certified SME, should continue to implement their
already established quality elements, in an attempt to reach the TQM standards. It is
concluded that the SME that improved their quality system further than what the ISO
standards specify, managed to improve their financial performance and cope better
with the consequences of the financial crisis that the Greek economy is facing. So, the
SME that will manage to advance their already implemented quality system will be the
ones that may improve their chances of surviving in a crisis or of growing in the future.
It is also important to reiterate, that the development of a theoretical framework is
needed, regarding the TQM implementation process, for it to be suitable for all sizes
of SME. An example of such a framework is the S-P model developed by Saunders &
Preston (2006). This framework should be part of an SME’s strategic plan making it a
strategic quality plan suitable for SME.

Chapter 7: Discussion, Conclusions, Recommendations.
Page 268 of 292
Georgios Sainis Ph.D. Thesis
From the results derived it is clear that the SME entrepreneurs and their quality
managers have understood that improving their quality level is what could lead them
in improving their financial performance . That is what will lead them in improving their
internal processes, their cultural strategies and their product and service quality
characteristics. This would have as a result the increase in the level of their
employability, their productivity and innovativeness. They would contribute positively
to the value of the Greek economy and make them stronger in order to better face the
economic crisis conditions and reduce the probability of going bankrupt.
Managing to incorporate a quality plan within their strategic plan, SME can manage to
improve their financial performance and this will give them the opportunity to reduce
their probability of going bankrupt. In this scenario, a possible alternative could be to
strengthen an SME’s financial position by further implementing the quality elements
making it feasible to be involved in a merging process with a stronger bigger company
or to lead it to an agreement with companies that would support their internalization.
This would increase the possibility for them to survive in such severe economic and
financial crisis conditions.
7.6. Limitations
In any thesis stating the limitations that characterised the whole research process
contributes to the more realistic and reliable interpretation of the conclusions and
implications presented. The limitations that characterise the current survey and its
conclusions are shown below.
1. One of the limitations identified was the type of survey conducted and the use of a
self-report type questionnaire. This type of survey is prone to a number of biases
including for example, that respondents may exaggerate their answers or attempt
to minimize the importance of an issue so it is not recorded as a problem; or that
questions may be misinterpreted or misunderstood. To overcome this bias, a
qualitative survey also took place and a triangulation approach was followed as a
means of realizing possible differences between the two derived results. In addition
to this approach, certain validity tests were conducted to the results derived from
the distributed questionnaire. It should be noted, that a self-report study is
considered as the most valid way of collecting data when these data are
characterised as subjective and based on the perception of the participants.
Following the above approaches we strongly believe that we have substantially
increased the validity of the results derived from this thesis.
Chapter 7: Discussion, Conclusions, Recommendations.
Page 269 of 292
Georgios Sainis Ph.D. Thesis
2. A second limitation considered was the focus on a single market, the Greek market.
Given that Greece is a country whose market heavily depends on the functioning
of the SME industry and is among -if not the only- European country facing such
severe consequences from the financial crisis; it was a challenge to maintain focus.
The homogeneity of the market, may have given the researcher the ability to easily
identify possible irrelevant factors that determined the results derived, the option
of expanding the survey in other countries which are facing the same financial
conditions constitutes an opportunity for future research.
3. The selection of the quality elements was considered a third limitation. Even though
their selection was the result of a thoughtful and in-depth research regarding the
variables that literature proposed for the determination of the quality level in a
company and specifically for an SME, the comprehensive way they were examined
could cause imperfection to the results derived. The option of individually analysing
all the components that determine a quality element could give more reliable and
complete results, though the inclusion of those, four quality elements (Quality tools
and techniques, Quality processes, Quality culture and Performance appraisal)
facilitated the process and minimized the possibility of realizing unexpected
statistical errors.
4. A fourth limitation could be the way that the data were collected and statistically
processed. The use of panel data and a cross sectional design instead of a time
series and a longitudinal design could result in the loss of valuable information and
conclusions including possible effects resulting from a time gap. Such an example
is to research the SME level of quality implemented and their equivalent financial
performance in a period where crisis conditions are not present and then develop
proportional comparisons.
5. A fifth limitation could be the way that the sample of SME was selected. A web
based platform (e-teacher) for uploading the questionnaire was used, followed by
the forwarding of an email to 1,450 recipients, periodically for a period of six
months, to all SME characterised as “ISO certified SME” in the i-Mentor Hellastat
(Hellastat) database. A total number of 413 questionnaires were returned back to
us representing a reliable number of completed questionnaires that managed to
give us an acceptable response rate (28%) for the survey. The people who
completed the questionnaire, identified themselves as the quality manager’s or the
production managers responsible for quality issues or the owners of the company.
This ratified the reliability and the quality of the information included in the returned

Chapter 7: Discussion, Conclusions, Recommendations.
Page 270 of 292
Georgios Sainis Ph.D. Thesis
questionnaires. In addition to that and mostly for the qualitative survey conducted,
an approval from the university’s Ethics Committee was granted
(ENT/PG/UH/00105).
7.7 Thesis Concluding Remarks
In this chapter the survey’s findings were presented in a way that could be applied or
used to enrich the existing literature. The implications of the survey’s findings were
also presented together with possible limitations.
This thesis aimed at enriching the literature regarding the effects of further
implementing quality elements in an SME, which is transitioning from an ISO certified
SME to a TQM SME, on its financial performance.
The current study directly contradicts the perception described in literature, which is
that TQM implementation is applicable mainly in large companies rather than SME. It
proposes that despite the difficulties, implementing TQM elements, can make SME
financially stronger and thus enable them to cope more efficiently and effectively with
possible financial crisis conditions.
The aim of this study, was to examine the strategic decision that the Greek ISO certified
SME could take, regarding the continuation of their quality journey and the
implementation of the TQM elements to their operations, during a period of economic
and financial crisis conditions. In addition and in relation to that, it attempted to
recognize the consequences of that decision and how it could influence their financial
performance.
The quality theory and the financial analysis theory, constitute the theoretical
framework of this study. The study’s’ design was based on the analysis of the results
derived from the primary data collected and on what has been recorded in literature.
Originally based on the evaluation approach developed by Hunt (1993) and Saskin
(1996), and a number of quality evaluation theories shown in literature; the TQM
elements considered were the Quality tools and techniques, the Quality processes, the
Quality culture and the Performance appraisal elements. Apart from exploring the level
of implementation of all those quality elements in the Greek SME, the thesis also
identified possible similarities and differences among the different groups of SME
which were grouped based on the number of their employees. The current study claims
that different sized SME, approach and implement the quality elements differently.

Chapter 7: Discussion, Conclusions, Recommendations.
Page 271 of 292
Georgios Sainis Ph.D. Thesis
Different research methods were used as a means of examining the elements that
mostly determined the implementation level of the quality elements in different sized
SME. The influence that these quality elements had on the liquidity, profitability,
solvency and efficiency level of all SME and on each group separately was examined.
The methodology adopted was a multi-stage research approach, incorporating a
quantitative survey that was also supported from a qualitative survey in an attempt to
apply the triangulation approach. The triangulation approach adopted as a
methodology, increased the reliability and validity of the concepts that this thesis
entails. The use of primary and secondary financial data were incorporated into the
analysis process. A cross-sectional study with the use of a questionnaire distributed to
a set of randomly selected Greek, ISO certified SME and the use of a semi-structured
set of interviews, enabled the identification and the analysis of the perception and
experience of the SME quality managers.
Ten interviews and a total of 389 valid questionnaires were collected within the period
2013-2016, that constituted the period based on which the TQM level of
implementation to the Greek ISO certified SME and their equivalent financial
performance was examined. Significant contribution was found in all the quality
elements in relation to the implementation of TQM to the Greek, ISO certified SME.
Different elements were identified as being more significant to different sized SME
(Micro, Small and Medium). With the use of correlation tests, the identification of which
elements mostly influence the implementation of quality, in different sized SME, was
revealed.
A financial ratio analysis was conducted using the E-Views and the MS-Excel software,
for all SME that participated in the survey and for the Greek, ISO certified SME the
financial data of which were downloaded from the i-Mentor Hellastat database, for the
years 2008 to 2014 when Greece was faced with severe economic and financial crisis
conditions. The analysis focused on all the SME collected and on each group formed
based on size (number of employees).
Complementary to the ratio analysis, a MANOVA analysis was conducted, with the use
of the SPSS software. The analysis identified the contribution of each ratio of each
group of SME on their financial performance and the syntax of the “Financial
Performance” variable for each year. This gave us the ability to determine the
contribution of each ratio to the SME liquidity, solvency, efficiency and profitability level
and to their financial performance overall. The analysis was applied to the SME that
Chapter 7: Discussion, Conclusions, Recommendations.
Page 272 of 292
Georgios Sainis Ph.D. Thesis
participated in the survey and with the aim of increasing the results reliability were also
applied to the whole sample of SME for which the financial data was collected from the
i-Mentor Hellastat database. The analysis revealed the consequences of the financial
crisis on the SME and on each group of SME’ financial performance. For our sample
(392) the best years for the SME financial performance were the years 2009, 2012 and
2014. The worst was the year 2011. It was also identified that for the years 2008, 2011
and 2014, the total number of SME (1,245) in the database showed the best financial
performance. The worst was shown in 2010. Their statistical significance was also
verified.
In the final stage of the analysis, ratio analysis was applied to the SME which
depending on the level of quality applied, were characterised as either “ISO”, “ISO+”
or “TQM” SME.
In a period where the economic crisis conditions have imposed difficulties in the
operational and financial performance of the small and medium size companies, those
that their micro size and the full adoption of the quality elements (TQM) are the ones
that have managed to survive better.
Considering that the crisis and its consequences continue and will continue in the
future, the option the Greek SME entrepreneurs have is to continue implementing the
quality elements as being, possibly the only way to sustain or even improve their
financial performance

References
Page 273 of 292
Georgios Sainis Ph.D. Thesis
References: Aba, E.K., Badar, M.A. and Hayden, M.A. (2016), “Impact of ISO 9001 certification on
firms financial operating performance”, International Journal of Quality &
Reliability Management, Vol. 33 No. 1, pp. 78–89.
Abdullah, A. (2010), “Measuring TQM implementation: a case study of Malaysian SME”, Measuring Business Excellence, Vol. 14 No. 3, pp. 3–15.
Abraham, M., Crawford, J. and Fisher, T. (1999), “"Key factors predicting effectiveness of cultural change and improved productivity in implementing total quality management”, International Journal of Quality & Reliability Management,
Vol. 16 No. 1, pp. 112–132.
Afrifa, G.A. (2016), “Net Working capital, cash flow and performance of UK SME”, Review of Accounting and Finance, Vol. 15 No. 1.
Agus, A. (2005), “The Structural Linkages between TQM, Product Quality Performance, and Business Performance: Preliminary Empirical Study in Electronics Companies”, Singapore Management Review, Singapore Institute of
Management.
Aized, T. (2012), Total Quality Management and Six Sigma, available
at:https://doi.org/http://dx.doi.org/10.5772/2559.
Al-Dhaafri, H.S. and Al-Swidi, A. (2016), “The impact of total quality management and entrepreneurial orientation on organizational performance”, International
Journal of Quality & Reliability Management, Vol. 33 No. 5, pp. 597–614.
Alesch, D.. (2001), “Organizations at risk: what happens when small businesses and not-for-profits encounter natural disasters.”, Fairfax, VA: Public Entity Risk Institute, Vol. 105.
Almansour, Y.M. (2012), “The Impact of Total Quality Management Components on Small and Medium Enterprises ’ Financial Performance in Jordan”, Researchers
World, Vol. III No. 1, pp. 87–91.
Anderson, J. and Stallings, J. (2014), Restoring Financing and Growth to Europe’s SME, Institute of International Finance, available at:
http://www.bain.com/publications/articles/restoring-financing-and-growth-to-
europes-SME.aspx.
Arnamtunga, Baldry, Sarshar and Newton. (2002), Quantitative and Qualitative Research in the Built Enviromnent: Application Of “mixed” research Approach,
Vol. 51.
Asteriou, D. and Hall, S.G. (2007), Applied Econometrics: A Modern Approach Using
EVies and Microfit., 2nd ed., Palgrave Machmillan.
Azizan, A. (2007), A Study of TQM Application by Malaysian SME, Cardiff business
school.
Babbie, E.R. (2004), The Practice of Social Research, 10th ed., Belmont, CA and
London: Thomson/Wadsworth.
Baños-Caballero, S., García-Teruel, P.J. and Martínez-Solano, P. (2014), “Working capital management, corporate performance, and financial constraints”, Journal
of Business Research, Elsevier Inc., Vol. 67 No. 3, pp. 332–338.

References
Page 274 of 292
Georgios Sainis Ph.D. Thesis
Berman, J.A., Gordon, D.D. and Sussman, G. (1997), “A study to determine the benefits mall business firms derive from sophisticated planning versus less sophisticated types of planning.”, The Journal of Business and Economic
Studies, Vol. 3 No. 3, pp. 1–11.
Biazzo, S. (2005), “The New ISO 9001 and the Problem of Ceremonial Conformity : How have Audit Methods Evolved?”, Total Quality Management, Vol. 16 No. 3,
pp. 381–399.
Black, S. and Porter, L. (1996), “Identification of the Critical Factors of TQM.”, Decision Sciences, Vol. 27 No. 1, pp. 1–21.
Blackburn, R. and Rosen, B. (1993), “‘Total Quality and Human Resources Management: Lessons learned from Balddge award-winning companies’”, Academy of Management Executive, Vol. 17 No.3, pp. 49–66.
Blaxter, L., Hughes, C. and Tightý, M. (2002), How to Research, Second., Open
University Press.
Bossink, B., Gieskes, J. and Pas, T. (1992), “Diagnosing total quality management”, Total Quality Management, Vol. 3 No.3, pp. 223–231.
Bourgeouis, L.J.I. and Eisenhardt, K.M. (1988), “Strategic decision processes in high velocity environments: four cases in the microcomputer industry.”, Management
Science, Vol. 34 No. 7, pp. 816–835.
Bourlakis, M., Maglaras, G., Aktas, E., Gallear, D. and Fotopoulos, C. (2014), “Firm size and sustainable performance in food supply chains: Insights from Greek SME”, International Journal of Production Economics, Elsevier, Vol. 152, pp.
112–130.
Bourletidis, K. and Triantafyllopoulos, Y. (2014), “SME Survival in Time of Crisis: Strategies, Tactics and Commercial Success Stories”, Procedia - Social and Behavioral Sciences, Elsevier B.V., Vol. 148, pp. 639–644.
Bowen, D.E. and Lawler, E.. (1992), “Total Quality-oriented Human Resource Management”, Organizational Dynamics, pp. 29–41.
Bradley, M. (1994), “Starting Total Quality Management from ISO 9000”, The TQM
Magazine, Vol. 6 No. 1, pp. 50–54.
Brown, M.G., Hitchcock, D.E. and Willard, M.L. (1994), Why TQM Fails and What to Do About It, Irwin, Burr Ridge, Illinois.
Brownell, P. (1995), Research Methods in Management Accounting, Coopers and
Lybrand.
Bryman, A. (2001), Social Research Methods, Oxford, UK: Oxford University Press.
Bryman, A. (2004), Social Research Method, 2nd ed., Oxford University Press Inc.,
New York, USA.
Bryman, A. and Bell, E. (2003), Business Research Methods., New York: Oxford
University Press Inc.
Bryman, A. and Cramer, D. (2001), Quantitative Analysis with SPSS Release 10 for Windows: A Guide for Social Scientists., London: Routledge.
Burnett, J.J. (1998), “A strategic approach to managing crisis.”, Public Relations Review, Vol. 24 No. 4, pp. 475–484.

References
Page 275 of 292
Georgios Sainis Ph.D. Thesis
Burrell, G. and Morgan, G. (1979), Sociological Paradigms and Organizational
Analysis., London: Heinemann.
Calandro, J. (2007), “Considering the utility of Altman’s Z-score as a strategic assessment and performance management tool.”, Strategy and Leadership, Vol.
35 No. 5, pp. 37–43.
Calingo, L. (1995), “The Corporate Guide to the Singapore Quality Award.”, EPB
Publishers Pte Ltd., Singapore, p. 5.
Cammock, P. (2001), The Dance of Leadership, edited by Auckland, N.Z.Auckland,
New Zealand: Pearson Education., Pearson Education.
Campa, D. and Camacho-Miñano, M.-M. (2015), “The impact of SME’s pre-bankruptcy financial distress on earnings management tools”, International
Review of Financial Analysis, Elsevier Inc., Vol. 42, pp. 222–234.
Cánovas, J.J.G., Hernández, P.J.S. and Botella, J.J.A. (2009), “Effectiveness of internal quality assurance programmes in improving clinical practice and
reducing costs”, Vol. 15, pp. 813–819.
Carlos Pinho, J. (2008), “TQM and performance in small medium enterprises”, International Journal of Quality & Reliability Management, Vol. 25 No. 3, pp.
256–275.
Chang, D.-S. and Sun, K.-L. (2007), “Exploring the Correspondence between Total Quality Management and Peter Senge’s Disciplines of a Learning Organization: A Taiwan Perspective”, Total Quality Management & Business Excellence, Vol.
18 No. 7, pp. 807–822.
Chileshe, N. (2004), The Application Medium of Tqm Within Small and Related Sized
Construction Organisations, Sheffield Hallam University.
Chong, A.Y.-L., Ooi, K.-B., Lin, B. and Teh, P.-L. (2010), “TQM, knowledge management and collaborative commerce adoption: A literature review and research framework”, Total Quality Management & Business Excellence, Vol. 21
No. 5, pp. 457–473.
Churchill, G.A. (1999), Marketing Research: Methodological Foundations., Fort
Worth, Texas and London: Dryden Press.
Cohen, E. (1994), “Cohen-Project focused TQM in NY Department.pdf”, Public Administration Review, Vol. 54 No. 5.
Collis, J. and Hussey, R. (2003), Business Research: A Practical Guide for Undergraduate and Postgraduate Students, edited by Palgrave Macmillan, U.,
2nd ed.
Commission, E. (2013), SBA Fact Sheet Greece - 2013, European Commission.
Corbett, C.J., Montes-Sancho, M.J. and Kirsch, D. a. (2005), “The Financial Impact of ISO 9000 Certification in the United States: An Empirical Analysis”, Management Science, Vol. 51 No. 7, pp. 1046–1059.
Corredor, P. and Goñi, S. (2010), “Quality awards and performance: is there a relationship?”, The TQM Journal, Vol. 22 No. 5, pp. 529–538.
Costanzo, D.G., Silipo, D.B. and Succurro, M. (2013), Over-Indebtedness and
Innovation: Some Preliminary Results., No.201304.
References
Page 276 of 292
Georgios Sainis Ph.D. Thesis
Crandal, R.E. and Julien, O. (2010), “Measuring the cost of quality”, Industrial
Management, Institute of Industrial Engineers, Vol. 52 No. 4, pp. 14–18.
Creative Research Systems. (2015), “Sample Size Calculator”, available at: http://www.surveysystem.com/sscalc.htm.
Creswell, J.W. (1994), Research Design: Qualitative & Quantitative Approaches.,
London: SAGE Publications.
Creswell, J.W. (2003), Research Design-Qualitative, Quantitative, and Mixed
Methods and Approaches, edited by Thousand Oaks, C., 2nd ed., Sage.
Croson, R. and Donohue, K. (2003), “Impact of POS data sharing on supply chain management: An experimental study”, Production and Operations Management,
Vol. 12 No. 1, pp. 1–11.
Crowe, T.J., Noble, S.J. and Machimada, S.J. (1998), “Multi-attribute analysis of ISO 9001 registration using AHP”, International Journal of Quality&Reliability Management”, International Journal of Quality&Reliability Management, Vol. 15
No. 2, pp. 205–22.
Dale, B. (1994), Managing Quality, edited by Dale, edited by B.G., 2nd ed., Prentice-
Hall, 1994, available at:https://doi.org/10.1002/qre.4680100421.
Dale, B.., Wu, P.., Zairi, M., Williams, A.R.T. and Van Der Wiele, T. (2001), “Total quality management and theory: An exploratory study of contribution”, Total
Quality Management, Carfax Publishing Company, Vol. 12 No. 4, pp. 439–449.
Dandekar, Kalpande and Gupta. (2012), “Framework of TQM implementation in Small Businesses of an industrially backward region: A concept”, Performance
Improvement-Wiley On-Line Library, Vol. 51 No. 7, pp. 7–14.
Dasilas, A. and Papasyriopoulos, N. (2015), “Corporate governance, credit ratings and the capital structure of Greek SME and large listed firms”, Small Business
Economics, Vol. 45 No. 1, pp. 215–244.
Davies. Paul. (1990), “TQM in Small Size Firms”, Total Quality Management, pp.
251–252.
Delen, D., Kuzey, C. and Uyar, A. (2013), “Measuring firm performance using financial ratios: A decision tree approach”, Expert Systems with Applications,
Vol. 40 No. 10, pp. 3970–3983.
Demirbag, M., Koh, S.C.L., Tatoglu, E. and Zaim, S. (2006), “TQM and Market orientation’s impact on SME’s performance”, Industrial Management & Data Systems, Vol. 106 No. 8, pp. 1206–1228.
Demirbag, M., Koh, S.C.L., Tatoglu, E., Zaim, S., Demirbag, M., Koh, S.C.L., Tatoglu, E., et al. (2006), “TQM and market orientation’s impact on SME’ performance”, Industrial Management & Data Systems, Vol. 106 No. 8, pp. 1206–1228.
Dennehy, R.F. (1995), “Deconstructing the reengineering storey: reengineering is Taylorism”.
Desai, D. a. (2008), “Cost of quality in small- and medium-sized enterprises: case of an Indian engineering company”, Production Planning & Control, Vol. 19 No. 1,
pp. 25–34.
Divorski, S. and Scheirer, M. (2001), “Improving data quality for performance measures: results from GAO study of verification and validation”, Evaluation and

References
Page 277 of 292
Georgios Sainis Ph.D. Thesis
Program Planning, No. 24, pp. 83–94.
Doherty, G.D. (2008), “On quality in education.”, Quality Assurance in Education, Vol.
16 No. 3, pp. 255–265.
Douglas, T.J. and Judge, W. (2001), “TQM implementation and competitive Advantage - Structural control and exploration”, Academy of Management
Journal, Vol. 44 No. 1, pp. 158–189.
Duh, R., Hsu, A. and Huang, P. (2012), “Determinants and performance effect of TQM practices: An integrated model approach”, Total Quality Management &
Business Excellence, Vol. 23 No. 5/6, pp. 689–701.
Easterby-Smith, M., Thorpe, R. and Lowe, A. (2001), Management Research: An Introduction, 2nd ed., Sage Publication Ltd.
Easton, G. (1993), “‘The State of US Total Quality Management: A Balddge Examiner’s Perspective’”, California Management Review, Vol. 35, pp. 32–54.
Ehrenberg, R. and Stupak, R. (1994), “Total Quality Management: Its relationship to administrative Theory and Organizational behavior in the public sector.”, Frontiers of Empirical Research & Development, Vol. 90 No. 8, p. 23.
Eisen, H., Mulraney, B. and Sohal, A. (1992), “Impediments to the adoption of modern quality management practices.”, Asia-Pacific Journal of Quality
Management, Vol. 9 No. 5, pp. 17–41.
Erdoğan, E.O., Erdoğan, M. and Ömürbek, V. (2015), “Evaluating the Effects of Various Financial Ratios on Company Financial Performance: Application in Borsa Đstanbul”, Business & Economics Research Journal, Vol. 6 No. 1, pp.
35–42.
“Explorable Psychology Experiments”. (2015), , available at:
https://explorable.com/survey-response-scales.
Fatoki, O. (2013), “Determinants of Longevity of Micro Enterprises in South Africa”, Journal of Economics, Vol. 4 No. 2, pp. 133–143.
Fening, F.A., Reagin, L. and Park, B. (2012), “Impact of Quality Management Practices on the Performance and Growth of Small and Medium Sized Enterprises ( SME ) in Ghana”, International Journal of Business and Social
Science, Vol. 3 No. 13, pp. 1–14.
Ferrand, A., Robinson, L. and Valette-Florence, P. (2010), “The Intention-to-Repurchase Paradox: A Case of the Health and Fitness Industry.”, Journal of Sport Management, Vol. 24, pp. 83–105.
Field, A.P. (2000), Discovering Statistics Using SPSS for Windows: Advanced
Techniques for the Beginner., London: SAGE Publications.
Fitzerland, C. and Erdmann, T. (1992), “TQM in American automotive industry”, American Automotive Industry Action Group Magazine: Productivity Press, Cambridge, pp. 45–56.
Fleming, H., Coffman, C. and Harter, J. (2005), “MANAGE YOUR Human Sigma”, The High Performance Organization, p. 10.
Fons, L. a. S. (2011), “Measuring economic effects of quality management systems”, The TQM Journal, Vol. 23 No. 4, pp. 458–474.

References
Page 278 of 292
Georgios Sainis Ph.D. Thesis
Ford, J.K., MacCallum, R.C. and Tait, M. (1986), “The applications of exploratory factor analysis in applied psychology: A critical review and analysis”, Personnel Psychology, Vol. 39 No. 2, pp. 291–314.
Fotopoulos, C. and Psomas, E. (2009), “The impact of soft and hard TQM elements on quality management results.”, International Journal of Quality & Reliability
Management., Vol. 26 No. 2, pp. 150–163.
Fotopoulos, C. V. and Psomas, E.L. (2010), “The structural relationships between TQM factors and organizational performance”, The TQM Journal, Vol. 22 No. 5,
pp. 539–552.
Fowler, A., Wibberley, M. and Sheard, M. (1992), “‘Two Routes to Quality’”, Personnel Review, Vol. 12, pp. 30–4.
FROST, F.A. and OAKI.AND, J. (1992), “Strategic considerations for the implementation of TQM. , .”, Brisbane-Paper Presented at Australian Centre for Strategic Management Conference Implementation Strategies for TQM.
Galagan. (1992), “Galagan - TQM TRAINING - Magazine”, Nation’s Business, Vol.80
No. 10.
Garengo, P. and Biazzo, S. (2013), “From ISO quality standards to an integrated management system: an implementation process in SME”, Total Quality
Management & Business Excellence, Vol. 24 No. 3–4, pp. 310–335.
Garvin, D. (2000), “How the Baldrige award really works”, Harvard Business Review.
Garvin, D.A. (1987), “Competing on the eight dimensions of quality”, Harvard Business Review, Vol. 65 No. 6, pp. 101–109.
Germanos, G. (2011), The Process of Strategy Formulation in Small and Medium
Enterprises in Greece and the Role of Accounting Information.
Ghauri, P., Gronhaug, K. and Kristianslund, L. (1995), Research Methods in
Business Studies: A Practical Guide, Prentic Hall. Ghobadian.
Gherhes, C., Williams, N., Vorley, T. and Vasconcelos, A.C. (2016), “Distinguishing micro-businesses from SME: a systematic review of growth constraints”, Journal of Small Business and Enterprise Development, Vol. 23 No. 4, pp. 939–963.
Ghobadian, A. and Gallear, D. (1997), “TQM and organization size.”, International Journal of Operations & Production Management., Journal Article, , Vol. 17
No.2, pp. 121–163.
Ghobadian, A., Gallear, D. and Gallear, V. (1996), “Total quality management in SME”, The International Journal of Management Science, Vol. 24 No. 1, pp.83–
106.
Gill, J. and Johnson, P. (1997), Research Methods for Management, 2 Nd Ed, edited
by Paul Chapman, L.
Gitlow, H., Gitlow, S., Oppenheim, A. and Oppenheim, R. (1989), Tools and Methods
for the Improvement of Quality, (1989), IRWIN, Homewood, IL.
Goh, P.L. (2000), The Implementation of TQM in SME, The University of Sheffield,
University of Sheffield.
Grammelis, L. and Pedioti, V. (2014), “The Development of SME in Greece Policy Document.”, p. 60.

References
Page 279 of 292
Georgios Sainis Ph.D. Thesis
Gregory, M. (1993), “Integrated performance measurement: a review of current practice and emerging trends.”, International Journal of ProductionEconomics,
Vol. 30 No. 31, pp. 281–96.
GSEVEE, I. (2014), Reinforcing the Institutional and Operational Capabilities of
GSEVEE - Summary.
Gupta, V., Garg, D. and Kumar, R. (2014), “Depiction of Total Quality Management during a Span of 2003-2013”, Journal of Engineering and Technology, Vol. 4
No. 2, pp. 81–87.
Hafeez, K., Malak, N. and Abdelmeguid, H. (2006), “A Framework for TQM to Achieve Business Excellence”, Total Quality Management & Business
Excellence, Routledge, Vol. 17 No. 9, pp. 1213–1229.
Hakes, J. (2001), “Can measuring results produce results: one manager’s overview”, Evaluation and Program Planning, No. 24, pp. 319–327.
Haksever, C. (1996), “Total Quality Management in the Small Business Environment”, Business Horizon, Vol. 39 No. 2, pp. 33–40.
Han, S.B. and Chen., S.K. (2007), “Effects of ISO 9000 on customer satisfaction”, International Journal of Productivity and Quality Management, Vol. 2 No. 3.
Hand, M. and Plowman, B. (1992), Quality Management Handbook England.
Hannee, J. (2011), Investigation on TQM Implementation in Medical Science
Universities of IRAN.
Hansson, J. (2001), “Implementation of total quality management in small organizations: A case study in Sweden”, Total Quality Management, Vol. 12
No.7, pp. 988–994.
Hansson, J. (2003), Total Quality Management - Aspects of Implementation and Performance - Investigations with a Focus on Small Organisations.
Harris, C.R. and Purdy, R.L. (1998), “The role of participative management in the implementation of total quality management”, International Journal of
Technology Management, Vol. 16, pp. 466–78.
Heifetz, R. (1994), Leadership without Easy Answers., Cambridge: Harvard
University Press.
Hellenic Chamber of Commerce. (2014), “The Development of SME in Greece-Policy Document”, Creative Team SYNTHESI, available at: https://ec.europa.eu
/avservices/photo/photoByMediaGroup.cfm?sitelang=en&mgid=635
Hendricks, K.B. and Singhal, V.R. (2000), “The Impact of Total Quality Management (TQM ) on Financial Performance : Evidence from Quality Award Winners”, Quality Progress, Vol. 33 No. 4, pp. 35–42.
Hendricks, K.B. and Singhal, V.R. (2001), “Firm characteristics, total quality management, and financial performance”, Journal of Operations Management,
Vol. 19 No. 3, pp. 269–285.
Henricks, M. (1992), “Quality makes a difference”, Small Business Reports, Vol. 34
No. 8, pp. 29–32.
Hertzog, M. (2008), “Considerations in Determining Sample Size for Pilot Studies”, Research in Nursing & Health, Vol. 31 No. 4, pp. 341–354.
References
Page 280 of 292
Georgios Sainis Ph.D. Thesis
Herzallah, A.M., Gutierrez-Gutierrez, L. and Munoz Rosas, J.F. (2014), “Total quality management practices, competitive strategies and financial performance: the case of the Palestinian industrial SME”, Total Quality Management & Business
Excellence, Vol. 25 No. 5–6, pp. 635–649.
Hirt, G.A., Block, S.B. and Danielsen, B.R. (2013), Principles of Finance - Corporate
Finance Foundations, 14th ed., McGraw Hill.
Holmegaard, J. (1990), “Industdal Quality Systems Profiles”, EOQ, QUALITY, Vol. 4,
pp. 5–7.
Holota, T., Hrubec, J., Kotus, M., Holiencinová, M. and Caposová, E. (2016), “The management of quality costs analysis model”, Serbian Journal of Management,
Vol. 11 No. 1, pp. 119–127.
Huang, Y., Liao, J. and Lin, Z. (2009), “A Study on Aggregation of Group Decisions”,
Vol. 454 No. December 2008, pp. 445–455.
Huarng, F. and Chen, Y.-T. (2002), “Relationships of TQM philosophy, methods and performance: a survey in Taiwan”, Industrial Management & Data Systems, Vol.
102 No. 4, pp. 226–234.
Hunt, V.D. (1993), Managing for Quality - Integrating Quality and Business Strategy.,
Irwin Professional Publishing.
Hussey, J. and Hussey, R. (1997), Business Research., London: Macmillan Press
Ltd.
“Impediments to the Adoption of Total Quality Management ( TQM ) in Jordanian ISO 9000 series Certified Manufacturing Companier Faisal Nayef Al-Madi Management and Management Sciences Research Institute School of
Management Faculty of Business and Informat”. (2005), , No. August.
Johnson, P. and Duberley, J. (2003), Understanding Management Research: An
Introduction to Epistemology, SAGE Publications Ltd.
Juran, J. M. & Godfrey, A.B. (1999), Juran’s Quality Handbook, edited by McGraw-
Hill.
El Kalak, I. and Hudson, R. (2016), “The effect of size on the failure probabilities of SME: An empirical study on the US market using discrete hazard model”, International Review of Financial Analysis, Elsevier Inc., Vol. 43, pp. 135–145.
Kalpande, S.D., Gupta, R. and Dandekar, M.D. (2013), “Identification of important factors for implementation of TQM in Indian SME in context of Vidarbha and Khandesh region”, International Journal Of Management & Enterprise
Development, Vol. 12 No. 4, pp. 411–424.
Kampouridis, G., Giannopoulos, G.I. and Tsirkas, S.A. (2015), “The relationship between TQM and financial performance of Greek companies of structural construction sector during crisis period.”, Journal of Economics and Business,
Vol. 18 No. 1, pp. 61–78.
Kaplan, R.S. and Norton, D. (2008), “MASTERING the Management System.”, Harvard Business Review, Vol. 86 No. 1, pp. 62–77.
Karafet, T., Xu, L., Du, R., Wang, W., Feng, S., Wells, R.S., Redd, a J., et al. (2001), “Paternal population history of East Asia: sources, patterns, and

References
Page 281 of 292
Georgios Sainis Ph.D. Thesis
microevolutionary processes.”, American Journal of Human Genetics, Vol. 69
No. 3, pp. 615–628.
Karagianni, S. and Labrianidis, L. (2001), “The pros and cons of SME going international”, Eastern European Economics, Vol. 39 No. 2, pp. 5–29.
Kaynak, H. (2003), “The relationship between total quality management practices and their effects on firm performance”, Journal of Operations Management, Vol.
21 No. 4, pp. 405–435.
King, N. (1994), The Qualitative Research Interview. In Cassell, C. and Symon, G. (Eds.), Qualitative Methods in Organisational Research: A Practical Guide.,
London: Sage.
Klingenberg, B., Timberlake, R., Geurts, T.G. and Brown, R.J. (2013), “The relationship of operational innovation and financial performance—A critical perspective”, International Journal of Production Economics, Elsevier, Vol. 142
No. 2, pp. 317–323.
Kluse, C. (2009), “TQM and the Government and Personal Transformation”, The Journal for Quality & Participation.
De Knop, P., Van Hoecke, J. and De Bosscher, V. (2004), “Quality Management in Sports Clubs”, Sport Management Review, Journal Article, , Vol. 7 No. 1, pp.
57–77.
Ko, Y. and Pastore, D. (2004), “Current Issues and Conseptualizations of Service Quality in the Recreation”, Sport Marketing., Vol. 13, pp. 158–166.
Kober, R., Subraamanniam, T. and Watson, J. (2012), “The impact of total quality management adoption on small and medium enterprises ’ financial
performance”, Vol. 52 No. June 2007, pp. 421–438.
Koch, J. (2003), “TQM: why is its impact on higher education so small?”, The TQM
Magazine, Vol. 15, pp. 325–333.
Kolesar, P. (1995), “Partial quality management: An essay”, Production and Operations Management, Vol. 4 No. 3, pp. 195–200.
Kriemadis, A. (1997), “Strategic planning in higher education athletic departments”, International Journal of Educational Management, Vol. 11 No. 6, pp. 238–247.
Krumwiede, D.. and Lavelle, J. (2000), “The effect of top-manager personality on a total quality management environment”, Engineering Management Journal, Vol.
12 No. 2, pp. 9–14.
Krumwiede, D.W., Sheu, C. and Lavelle, J. (1998), “Understanding the relationship of top management personality to TQM implementation”, Production and Inventory
Management Journal, Vol. 39 No. 2, pp. 6–10.
Kufidu, S. and Vouzas, F. (1998), “Human resource aspects of quality management: evidence from MNEs operating in Greece”, International Journal of Human Resource Management, Routledge.
Kumar, M., Antony, J. and Douglas, A. (2009), “Does size matter for Six Sigma implementation?: Findings from the survey in UK SME”, The TQM Journal, Vol.
21 No. 6, pp. 623–635.
Kumar, V., De Grosbois, D., Choisne, F., Kumar, U., Grosbois, D. De, Choisne, F. and Kumar, U. (2008), “Performance measurement by TQM adopters”, The

References
Page 282 of 292
Georgios Sainis Ph.D. Thesis
TQM Journal, Vol. 20 No. 3, pp. 209–222.
Lam, E.T.C., Zhang, J.J. and Jensen, B.E. (2005), “Service Quality Assessment Scale (SQAS): An Instrument for Evaluating Service Quality of Health-Fitness Clubs.”, Measurement in Physical Education an Exercise Science, Vol. 9,
pp.79–111.
Lam, M.Y., Poon, G.K.K. and Chin, K.S. (2008), “An organizational learning model for vocational education in the context of TQM culture.”, International Journal of
Quality & Reliability Management., Vol. 25, pp. 238–255.
Lambert, G. and Ouedraogo, N. (2008), “Empirical investigation of ISO 9001 quality management systems’ impact on organisational learning and process performances”, Total Quality Management & Business Excellence, Routledge,
Vol. 19 No. 10, pp. 1071–1085.
Lawless, M., O’Connell, B. and O’Toole, C. (2015), “SME recovery following a financial crisis: Does debt overhang matter?”, Journal of Financial Stability,
Elsevier B.V., Vol. 19 No. 2, pp. 45–59.
Lewis, W.G., Pun, K.F. and Lalla, T.R.. (2007), “The Effect of ISO 9001 on TQM Implementation in SME in Trinidad”, West Indian Journal of Engineering, Vol. 30
No. 1, pp. 1–16.
Lewis, W.G., Pun, K.F. and Lalla, T.R.M. (2005), “An AHP-based study of TQM benefits in ISO 9001 certified SME in Trinidad and Tobago.”, TQM Magazine,
Vol. 17 No. 6, pp. 558–572.
Lewis, W.G., Pun, K.F. and Lalla, T.R.M. (2006a), “Exploring soft versus hard factors for TQM implementation in small and medium‐sized enterprises”, International Journal of Productivity and Performance Management, Vol. 55 No. 7, pp. 539–
554.
Lewis, W.G., Pun, K.F. and Lalla, T.R.M. (2006b), “Empirical investigation of the hard and soft criteria of TQM in ISO 9001 certified small and medium-sized enterprises”, International Journal of Quality & Reliability Management, Vol. 23
No. 8, pp. 964–985.
López-Ortega, E., Canales-Sanchez, D., Bautista-Godinez, T. and Macias-Herrera, S. (2016), “Classification of micro, small and medium enterprises (M-SME) based on their available levels of knowledge”, Technovation, Elsevier, Vol. 47,
pp. 59–69.
Lukacs Edit, (2005). "The Economic Role of SMEs in World Economy Especially in Europe", European Integration Studies, Miskolc, Vol.4 No.1 pp.3-12.
Marchingthon, M., Dale, B. and Wilkinson, A. (1993), “Who is Really Taking the Lead on Quality”, Personnel Management, Vol. 25 No.4, pp. 30–3.
Marimuthu, M., Arokiasamy, L. and Woon, L.F. (2014), “Size Effect and Insolvency Profiles among the SME : An Empirical Investigation”, Global Business and Management Research: An International Journal, Vol. 6 No. 4, pp. 290–299.
Maxim, P. (1999), Quantitative Research Methods in the Social Sciences., Oxford
University Press.
McKinsey Global Institute (Athens Office). (2012), Greece 10 Years Ahead Defining
Greece ’ S New Growth Model and Strategy.

References
Page 283 of 292
Georgios Sainis Ph.D. Thesis
Meegan, S.T. (1997), “A model for managing the transition from ISO 9000 to TQM”, Training for Quality, Vol. 5 No. 1, pp. 35–39.
Meirovich, G. and Romar, J.E. (2006), “The difficulty in implementing TQM in higher education instruction the duality of instructor/student roles.”, Quality Assurance
in Education, Vol. 14, pp. 324–337.
Mendes, L. and Lourenço, L. (2014), “Factors that hinder quality improvement programs’ implementation in SME”, Journal of Small Business and Enterprise
Development, Vol. 21 No. 4, pp. 690–715.
Miras-Rodríguez, M. del M., Escobar Pérez, B. and Carrasco Gallego, A. (2015), “Are companies less environmentally-friendly due to the crisis? Evidence from Europe”, Encontros Científicos - Tourism & Management Studies, Vol. 11
No. 1, pp. 129–135.
Mitroff, I. (1988), “Crisis management: cutting through the confusion.”, Sloan Management Review, Vol. 29, pp. 15–20.
Moccia, S. (2016), “The role of value and virtues in TQM: an overview of literature”, The TQM Journal, Emerald Group Publishing Limited, Vol. 28 No. 2, pp. 216–
234.
Moon, K., Kim, M., Ko, Y., Connaughton, D. and Lee, J. (2011), “The influence of consumer’s event quality perception on destination image.”, Managing Service Quality, Vol. 21, pp. 287–303.
Morrison and Rahim. (1993), “Adopt a new philosophy: The TQM challenge”, Total
Quality Management, Vol. 4 No. 2.
Motwani, J. (2001), “Measuring critical factors of TQM”, Measuring Business
Excellence, Vol. 5 No. 2, pp. 27–30.
Muhammad, N.M.Y. and Khairul, A.M.A. (2015), “Total Quality Management Approach for Malaysian SME: Conceptual Framework”, International Journal of Business and Social Science, Vol. 6 No. 1, pp. 152–161.
Munir Ahmad, M. and Alaskari, O. (2014), “Development of assessment methodology for improving performance in SME’s”, International Journal of Productivity and
Performance Management, Vol. 63 No. 4, pp. 477–498.
Nachmias, C. and Nachmias, D. (2000), Research Methods in the Social Sciences,
6th Editio., New York: Wadsworth.
Neil, M. (1996), “Competitive advantage, quality strategy and the role of marketing”, British Journal of Management, Vol. 7 No. 3, pp. 231–245.
Newall, D. and Dale, B.G. (1991), “The introduction and development of a quality improvement process: a study”, International Journal of Production Research,
Vol. 29 No. 9, pp. 1747–1760.
Ntombekaya, A. (2010), The Application of Total Quality Management within Small and Medium Enterprises., Cape Peninsula University of Technology.
Nurazree, M. and Mohd Faiz, H. (2014), “TQM and Malaysian SME Performance: The Mediating Roles of Organization Learning”, Procedia - Social and
Behavioral Sciences, Elsevier B.V., Vol. 130, pp. 216–225.
Nyanga, T., Z., Mupani, H., Chifamba, E.. and Mashavira, N. (2013), “SURVIVAL OF THE VULNERABLE”:, Journal of Sustainable Development in Africa (Volume,
References
Page 284 of 292
Georgios Sainis Ph.D. Thesis
Vol. 15 No. 6, pp. 142–152.
Oakland, J.S. (1993), Total Quality Management: The Route to Improving
Performance., edited by Butterworth-Heinemann, O., Second edi.
Oakland, J.S. and Beardmore, D. (1995), “Best practice customer service”, Vol. 6 No.2.
Onuwa, W. (2008), Quality Management Practices Organisational Performance, Thesis.
Oppenheim, A.N. (1992), Questionnaire Design, Interviewing and Attitude
Measurement, edited by Osuagwu, New editio.
Oschman, J.J. (2017), “The Role of Strategic Planning in Implementing a Total Quality Management Framework : An Empirical View”, Quality Management Journal, Vol. 24 No. 2014, pp. 41–54.
P. Afthonidis, E. and D. Tsiotras, G. (2014), “Strategies for business excellence under an economic crisis”, The TQM Journal, Vol. 26 No. 6, pp. 610–624.
Pacheco, L. (2015), “SME probability of default: the case of the hospitality sector.”, Tourism & Management Studies, Vol. 11 No. 1, pp. 153–159.
Padma, P., Ganesh, L.S. and Rajendran, C. (2008), “A study on the critical factors of ISO 9001:2000 and organizational performance of Indian manufacturing firms”, International Journal of Production Research, Vol. 46 No. 18, pp. 4981–5011.
Pallant, J. (2001), SPSS Survival Manual: A Step by Step Guide to Data Analysis
Using SPSS for Windows ., NSW: Allen and Unwin.
Pan, W.-T. (2009), “Forecasting classification of operating performance of enterprises by ZSCORE combining ANFIS and genetic algorithm”, Neural
Computing and Applications, Vol. 18 No. 8, pp. 1005–1011.
Pantouvakis, A. and Dimas, A. (2010), “Does ISO 9000 series certification matter for the financial performance of ports? Some preliminary findings from Europe”, Maritime Policy & Management, Vol. 37 No. 5, pp. 505–522.
Paulet, E., Parnaudeau, M. and Abdessemed, T. (2014), “The SME struggle for financing: a clampdown in European banks post-crisis”, Journal of Business Strategy, pp. 36–45.
Philip, G. and McKeown, I. (2004), “Business Tranformation and Organizational Culture: The Role of Competency, IS and TQM.”, European Management
Journal, Vol. 22 No. 6, pp. 624–636.
Philips, E.M. and Pugh, D.S. (2000), How to Get a Ph. D: A Handbook for Students
and Their Supervisors, Open University Press, Buckingham.
Phu, V.H. (2011), Total Quality Management Approach to the Information Development Processes.
Pinho, C.J. (2008), “TQM and performance in small medium enterprises”, International Journal of Quality & Reliability Management, Vol. 25 No. 3, pp.
256–275.
Plewa, M., Kaiser, G. and Hartmann, E. (2016), “Is quality still free?”, International
Journal of Quality & Reliability Management, Vol. 33 No. 9, pp. 1270–1285.
References
Page 285 of 292
Georgios Sainis Ph.D. Thesis
Pool, S.W. (2000), “The learning organization: motivating employees by integrating TQM philosophy in a supportive organizational culture.”, Leadership and Organization Development Journal, Vol. 21 No. 8, pp. 373–378.
Porter, M. (1980), “Competitive strategy: Techniques for analyzing industries and competitors.”, London:The Free Press.
Powell, T.C. (1995), “Total quality management as competitive advantage: A review and empirical study”, Strategic Management Journal, Vol. 16, pp. 15–37.
Prajogo, D.I. and Brown, A. (2006), “Approaches to adopting quality in SME and the impact on quality management practices and performance”, Total Quality Management & Business Excellence, Vol. 17 No. 5, pp. 555–566.
Prajogo, D.I. and Brown, A. (2011), “Total Quality Management & Business Approaches to adopting quality in SME’s and the impact on quality management practices and performance Approaches to Adopting Quality in SME’s and the Impact on Quality Management Practices and Performance.”, Total Quality
Management, pp. 37–41.
Prajogo, D.I. and Sohal, A.S. (2006), “The relasionship between organization strategy, TQM, and organization performance the mediating role of TQM.”, European Journal of Operational Research, pp. 35–50.
Preble, J.F. (1997), “Integrating the crisis management perspective into the strategic management process.”, Journal of Management, Vol. 34, p. 769–791.
Price, M.J. and Chen, E.E. (1993), “Total Quality Management in a Small, High-Technology Company”, California Management Review, Vol. 35 No. 3, pp. 96–
117.
Psomas, E., Vouzas, F. and Kafetzopoulos, D. (2014), “Quality management benefits through the ‘soft’ and ‘hard’ aspect of TQM in food companies”, TQM Journal,
Vol. 26 No. 5, p. 431.
Pujari, S. (2016), “Culture: The meaning, Characteristics, and Functions”, Your Article Library.com, available at:
http://www.yourarticlelibrary.com/culture/culture-the-meaning-characteristics-and-functions/9577/.
Pun, K.F. and Jaggernath-Furlonge, S. (2012), “Impacts of company size and culture on quality management practices in manufacturing organisations: An empirical study”, The TQM Journal, Vol. 24 No. 1, pp. 83–101.
Quazi, H.A. and Padibjo, S.R. (1998), “A journey toward total quality management through ISO 9000 certification - a study on small- and medium-sized enterprises in Singapore.”, International Journal of Quality & Reliability Management.,
Vol.15 No. 5, pp. 489–508.
Rad, A.M.M. (2006), “The impact of organizational culture on the successful implementation of total quality management.”, The TQM Magazine, Vol. 18,
pp.606–625.
Rallabandi, S., Satyanarayana, R., Vuda, S., Srikanth Reddy, R., Srinivasu, R., Reddy, G.S., Sreenivasarao, V., et al. (2010), “The Contributions of TQM And Six SIGMA in the Organizations to Achieve the Success in Terms of Quality”, International Journal of Computer Applications, Vol. 8 No. 4, pp. 16–22.
Ree, H.J. Van. (2009), Service Quality Indicators for Business Support Services.
References
Page 286 of 292
Georgios Sainis Ph.D. Thesis
Regan, N.O. (2000), The Relationship between Culture, Leadership, Strategic Planning an Performance in SME, Middlesex University Business School,
Middlesex University Business School.
Reid, D. and Sanders, N. (2009), “Total quality management”, Operational
Management, pp. 136–170.
Robinson, L. (2006), “Customer Expectations of Sport Organisations.”, European
Sport Management, Vol. 6 No. 1, pp. 67–84.
Robson, C. (2011), Real World Research, 3d Edition., John Wiley & Sons, Inc., West
Sussex, UK.
Rollins, J., Chen, S.K., Island, R., Han, S.B. and Ebrahimpour, M. (2007), “The Impact of ISO 9000 on TQM and Business Performance”, Allied Academies
International Conference, Vol. 13, pp. 1-23-108.
Rose, T.J. and Approach, M. (2003), Sustained Growth in Small Enterprises: A
Process Management Approach.
Ross, S., Westerfield, R., Jaffe, J. and Jordan, B. (2007), Corporate Finance:Core
Principles and Applications, 3d Edition., McGraw Hill.
Rudestam, K.E. and Newton, R.R. (1992), Surviving Your Dissertation: A Comprehensive Guide to Content and Process., Sage Publication Ltd.
Rungasamy, S., Antony, J. and Ghosh, S. (2002), “Critical success factors for SPC implementation in UK small and medium enterprises: some key findings from a survey”, The TQM Magazine, Vol. 14 No. 4, pp. 217–224.
Sainis, G., Haritos, G., Kriemadis, A. and Fowler, M. (2016), “The willingness of ISO certified Greek SME to continue their quality journey to TQM under crisis conditions : a systemic approach”, Int. J. Applied Systemic Studies, Vol. 6 No. 4,
pp. 327–348.
Salaheldin, S.I. (2009), “Critical success factors for TQM implementation and their impact on performance of SME”, International Journal of Productivity and Performance Management, Vol. 58 No. 3, pp. 215–237.
Samson, D. and Terziovski, M. (1999), “The relationship between total quality management practices and operational performance”, Journal of Operations
Management, Vol. 17 No. 4, pp. 393–409.
Santos, G., Mendes, F. and Barbosa, J. (2011), “Certification and integration of management systems: the experience of Portuguese small and medium enterprises.”, Journal of Cleaner Production, Vol. 19 No. 17, pp. 1965–1974.
Saraph, J., Benson, G. and Schroeder, R. (2003), “An Instrument for measuring the critical factors of quality management”, Industrial Management and Data
Systems, Vol. 106 No. 4, pp. 52–60.
Sashkin, M. and Kiser, K.J. (1993), Putting Total Quality Management to Work: What TQM Means, How to Use It & How to Sustain It over the Long Run, Berrett-
Koehler Publishers, Oakland, USA.
Sashkin, M. and Rosenbach, W.E. (1996), Organizational Culture Assessment Questionnaire, available at:
http://www.google.ocom_www.leadingandfollowing.com/documents/OCAQParticipantManual.pdf.

References
Page 287 of 292
Georgios Sainis Ph.D. Thesis
Saunders, I.W. and Preston, A.P. (2006), “A model and a research agenda for total quality management”, Total Quality Management, Vol. 5 No. 4, pp. 185–202.
Saunders, M., Lewis, P. and Thronhill, A. (2003), Research Methods for Business Students, edited by Prentic Hall.
SBA, F.S. (2014a), “SBA Fact Sheet - 2014”, European Commission.
SBA, F.S.-G. (2012), Newsletter for SBA 2012 - Greece.
SBA, F.S.-G. (2014b), SBA FACT SHEET-2014, European Commission, Brussels.
SBA, F.S.G. (2014c), 2014 SBA Fact Sheet, European Commission, Vol. 44556,
Brussels.
SBA, F.S.G. (2015), SBA Fact Sheet Greece - 2015, European Commission.
Schroeder, R.G., Linderman, K. and Dongli, Z. (2005), “Evolution of Quality: First Fifty Issues of Production and Operations Management”, Production &
Operations Management, Wiley-Blackwell, Vol. 14 No. 4, pp. 468–481.
Schultz, K.L. and Juran, D.C. (1998), “Schultz, K. L., D. C. Juran. 1998. Modeling and worker motivation in JIT production systems. Management Science 44(12) 1595–1607”, Management Scienc, Vol. 44 No. 12, pp. 1595–1607.
Schultz, K.L., Juran, D.C. and Boudreau, J.W. (1999), “The effects of low inventory on the development of productivity norms. Manage- ment Science 45(2) 1664–1678.”, Management Science, Vol. 45 No. 2, pp. 1664–1678.
Sedliacikova, M., Hajduchova, I., Kristofik, P., Viszlai, I. and Gaff, M. (2016), “Improving the Performance of Small and Medium Wood- Processing Enterprises”, Bioresources, Vol. 11 No. 1, pp. 439–450.
Seeger, M.W., Sellnow, T.L. and Ulmer, R.R. (1998), “Communication, organization and crisis”, Communication Yearbook, 21, Vol. 21, pp. 231–275.
Sekaran, U. (2003), Research Methods for Business: A Skill Building Approach, 4th
ed., John Wiley and Sons, Inc.
Shahin, A. (2011), “An investigation on the influence of total quality management on financial performance the case of Boutan industrial corporation”, International
Journal of Business and Social Science, Vol. 2 No. 15, pp. 105–112.
Sharma, D.S. (2005), “The association between ISO 9000 certification and financia l performance”, International Journal of Accounting, Vol. 40 No. 2, pp. 151–172.
Sharma, U. and Hoque, Z. (2002), “TQM implematation in a public sector entity in Fiji-public sector reform, commercialization and institutionalism.”, The International Journal of Public Sector Management, Vol. 15, pp. 340–360.
Shortell, S.M., O’Brien, J.L., Carman, J.M., Foster, R.W., Hughes, E.F., Boerstler, H. and O’Connor, E.J. (1995), “Assessing the impact of continuous quality improvement/total quality management: concept versus implementation.”, Health Services Research, Vol. 30 No. 2, pp. 377–401.
Siakas, K., Naaranoja, M., Vlachakis, S. and Siakas, E. (2014), “Family Businesses in the New Economy: How to Survive and Develop in Times of Financial Crisis”, Procedia Economics and Finance, Vol. 9 No. 14, pp. 331–341.
Sieber, S.D. (1973), “The integration of fieldwork and survey methods.”, American
Journal of Sociology, Vol. 78 No. 6, pp. 1335–1359.

References
Page 288 of 292
Georgios Sainis Ph.D. Thesis
Sila, I. and Ebrahimpour, M. (2002), “An investigation of the total quality management survey based research published between 1989 and 2000: A literature review.”, International Journal of Quality & Reliability Management, Vol. 19, pp. 902–970.
Simons, G.B. and Kerr, C. (1993), “Networking TQM for small manufacturing”, Journal of Quality and Participation, Vol. 16, pp. 6–11.
Singh, T. (2011), “A Theoretical Framework for Soft dimensions of Total Quality Management”, 2011 International Conference on Economics and Finance
Research, Vol. 4, pp. 529–533.
Sinha, N., Garg, A.K. and Dhall, N. (2016), “Effect of TQM principles on performance of Indian SME: the case of automotive supply chain”, The TQM Journal, Vol. 28
No. 3, pp. 338–359.
Sinha, N., Garg, A.K., Dhingra, S. and Dhall, N. (2016), “Mapping the linkage between Organizational Culture and TQM”, Benchmarking: An International Journal, Vol. 23 No. 1, pp. 208–235.
Sirvanci, M. (2004), “Critical issues for TQM implementation in higher education.”, The TQM Magazine, Vol. 16, pp. 382–386.
Smith, D. (1990), “Beyond contingency planning: towards a model of crisis management.”, Industrial Crisis Quarterly, Vol. 4, pp. 263–275.
Sohail, M.S. and Hoong, S.R. (2003), “TQM practices and organizational Performances of SME’s in Malaysia: Some empirical observations.”, Benchmarking: An International Journal., Vol. 10 No. 1, pp. 37–53.
Soininen, J., Puumalainen, K., Sjögrén, H. and Syrjä, P. (2012), “The impact of global economic crisis on SME”, Management Research Review, Vol. 35 No. 10,
pp.927–944.
Soltani, E., Van Der Meer, R.B., Williams, T.M. and Lai, P. (2006), “The compatibility of performance appraisal systems with TQM principles - evidence from current practice”, available at:https://doi.org/10.1108/01443570610637030.
Son, Y.K. and Lie-Fern, H. (1991), “A method of measuring quality costs”, International Journal of Production Research, Taylor & Francis Ltd, Vol. 29
No.9, p. 1785.
Sousa, R. (2003), “Linking quality management to manufacturing strategy: An empirical investigation of customer focus practices”, Journal of Operations
Management, Vol. 21 No. 1, pp. 1–18.
Sousa, S. and Aspinwall, E. (2010), “Development of a performance measurement framework for SME”, Total Quality Management & Business Excellence, Vol. 21
No. 5, pp. 475–501.
Sousa, S.D., Aspinwall, E. and Sampaio, P.A. (2005), “Performance Measures and Quality Tools in Portuguese Small and Medium Enterprises : Survey Results”, Total Quality Management, Vol. 16 No. 2, pp. 277–307.
Sturkenboom, J., Van Der Wiele, T. and Brown, A. (2001), “An action-oriented approach to quality management self-assessment in small and medium-sized enterprises”, Total Quality Management, Vol. 12 No. 2, pp. 231–246.
Sutcliffe, Sitkin and Browning. (2000), Tailoring Process Management to Situational Requirements: Beyond the Control and Fauzia Siddiqui, Abid Haleem and S.W
Exploration Dichotomy, The Quality Movement and Organization Theory.
References
Page 289 of 292
Georgios Sainis Ph.D. Thesis
Tabladillo, M. (1996), Quality Management Climate Assessment in Healthcare.
Temtime, Z.T. (2003), “The moderating impacts of business planning and firm size on total quality management practices”, The TQM Magazine, Vol. 15 No. 1, pp. 52–
60.
Temtime, Z.T. and Pansiri, J. (2006), “Perceived managerial problems in SME: evidence from Botswana”, Development and Learning in Organizations, Vol. 20,
pp. 15–17.
Temtime, Zelealem, T. and Solomon, G.H. (2002), “Total quality management and the planning behavior of SME’s in developing economies.”, The TQM Magazine,
Vol. 14, pp. 181–191.
Terziovski, M.M. and Guerrero-Cusumano, J.-L. (2009), “ISO 9000 quality system certification and its impact on innovation performance”, Academy of
Management Annual Meeting, pp. 1–6.
Tidor, A., Gelmereanu, C., Baru, P. and Morar, L. (2012), “Diagnosing Organizational Culture for SME Performance”, Procedia Economics and Finance, Elsevier B.V.,
Vol. 3 No. 12, pp. 710–715.
Tourna-Germanou, E. (2007), Understanding, Predicting and Influencing Business
Students’ Accounting Career Choice, Sheffield Hallam University.
Trevor, J.G. (2007), “Quality costs in education.”, The TQM Magazine, Journal
Article, , Vol. 19, pp. 308–314.
Trochim, W. (2001), Research Methods Knowledge Base., Atomic Dog Pub.
Tsitskari, E., Tsiotras, D. and Tsiotras, G. (2006), “Measuring service quality in sport services.”, Total Quality Management & Business Excellence, Vol. 17, pp. 623–
631.
Tull, D. and Albaum, G. (1973), Survey Research: A Decisional Approach, Intext
Educational Publishers.
Tuttle, T. (1991), “Human Resources and the TQ Revolution”, Human Resource
Professional, Vol. 3. No.2, pp. 5–11.
Valmohammadi, C. and Roshanzamir, S. (2015), “The guidelines of improvement: Relations among organizational culture, TQM and performance”, International
Journal of Production Economics, Elsevier, Vol. 164, pp. 167–178.
Vargo, J. and Seville, E. (2011), “Crisis strategic planning for SME: finding the silver lining”, International Journal of Production Research, Vol. 49 No. 18, pp. 5619–
5635.
Vermoesen, V., Deloof, M. and Laveren, E. (2013), “Long-term debt maturity and financing constraints of SME during the Global Financial Crisis”, Small Business
Economics, Vol. 41 No. 2, pp. 433–448.
Voulgaris, F., Doumpos, M. and Zopounidis, C. (2000), “On the evaluation of Greek industrial SME’s performance via multicriteria analysis of financial ratios”, Small Business Economics, Vol. 15 No. 1978, pp. 127–136.
Wali, S. and Boujelbene, Y. (2011), “Cultural Influences on Tqm Implementation and Financial Performance in Tunisian Firms”, E & M Ekonomie a Management, Vol.
14 No. 3, pp. 30–45.

References
Page 290 of 292
Georgios Sainis Ph.D. Thesis
Watson, J., Kober, R., Ng, J. and Subramaniam, T. (2003), “The impact of TQM adoption on SME financial performance.”, 16th Annual Conference of Small Enterprise Association of Australia and New Zealand., Ballarat, pp. 1–9.
Wayhan, V.B. and Balderson, E.L. (2007a), “TQM and Financial Performance: A Research Standard”, Total Quality Management & Business Excellence,
Routledge (Taylor & Francis group), Vol. 18 No. 4, pp. 393–401.
Wayhan, V.B. and Balderson, E.L. (2007b), “TQM and Financial Performance: What has Empirical Research Discovered?”, Total Quality Management & Business Excellence, Routledge.
Whitney, G. and Pavett, C. (1998), “Total quality management as an organisational change: predictors of successful implementation.”, Quality Management
Journal, Vol. 5 No. 4, pp. 9–22.
Widyaningrum, H.A., Raharjo, K. and Nuzula, F.N. (2017), “Analysis of factors affecting the decision to adopt information technology and its impact on business performance: study on micro, small and medium enterprises (SME)”, RJOAS, Vol. 2 No. February, pp. 164–173.
van der Wiele, T., van Iwaarden, J., Williams, R. and Eldridge, S. (2011), “A new foundation for quality management in the business environment of the twenty-first century”, Total Quality Management & Business Excellence, Vol. 22 No. 5,
pp. 587–598.
Wilkes, N. and Dale, B. (1998), “Attitudes to Self- Assessment and quality awards: A study in small and medium-sized companies.”, Total Quality Management, Vol.
9 No. 8, pp. 731–739.
Wilkinson, A., Allen, P. and Snape, E. (1991), “TQM and the Management of Labour”, Employee Relations, Vol. 13, No.1, pp. 24–31.
Williams, R., Wiele, T. Van Der, Iwaarden, J. Van, Bertsch, B. and Dale, B. (2006), “Quality Management : The New Challenges”, Total Quality Management,
Vol.17 No. 10, pp. 1273–1280.
Wisker, G. (2001), The Postgraduate Research Handbook: Success with Your MA, MPhil, EdD and Ph. D, Palgrave.
Wisner, J.. and Eakings, S.G. (1994), “A performance assessment of the US Baldrige quality award winners.”, International Journal of Quality and Reliability
Management, Vol. 11 No. 2, pp. 8–25.
Yin, R.K. (2003), Case Study Research, Design and Methods, Sage Publications,
Inc.
York, K.M. and Miree, C.E. (2004), “Causation or covariation: An empirical re-examination of the link between TQM and financial performance”, Journal of
Operations Management, Vol. 22 No. 3, pp. 291–311.
Youssef, M., Mohamed, Z., Sawyer, G. and Whaley, G. (2002), “Testing the impact of integrating TQM and DFM on the ability of small to medium size firms to respond to their customer needs”, Total Quality Management, Vol. 13 No. 3, pp.
301–313.
Yurdakul, M. (2002), “Measuring a manufacturing system’s performance using Saaty’s system with feedback approach”, Integrated Manufacturing Systems,
Vol. 13 No. 1, pp. 25–34.
References
Page 291 of 292
Georgios Sainis Ph.D. Thesis
Yusof, S.M. and Aspinwall, E. (1999), “Critical success factors for total quality management implementation in small and medium enterprises”, Vol. 10 No.1988, pp. 803–810.
Yusof, S.M. and Aspinwall, E. (2000), “TQM implementation frameworks: Comparison and review”, Total Quality Management, Vol. 11 No. 3, pp. 281–
294.
Yusof, S.M., Aspinwall, E., Yusof, M. and Aspinwall, E. (2001), “Case studies on the implementation of TQM in the UK automotive SME”, International Journal of Quality & Reliability Management, Vol. 18 No. 7, pp. 722–744.
Zairi, M., Letza, S.R. and Oakland, J.S. (1994), “Does TQM Impact on Bottom-line Results?”, The TQM Magazine, Vol. 6 No. 1, pp. 38–43.
Zhang, Z. (1963), Implementation of Total Quality Management.
Zikmund, W.G. (2003), Business Research Methods, Mason, OH and Great Britain:
Thomson/South-Western.

APPENDICES

Appendix A
Quantitative Survey’s
Questionnaire
Summary: Appendix A has the questionnaire used in the quantitative survey
conducted. It also includes the welcome page and the author’s invitation for
participation letter shown in the ‘e-teacher’ software that was used in collecting the
survey’s primary data. A set of 52 questions are presented in the Greek and English
language.

Appendix A - Quantitative Survey’s Questionnaire
[A-2]
TQM & Financial Performance Questionnaire /Ολική Ποιότητα & Χρημα/μική
απόδοση
This Questionnaire refers to my PHD Thesis. The goal is to collect data/Information
on whether ISO-9001 certified SME's operating in the Greek Environment continued
their Quality Journy implementing Total Quality Management (TQM) practices and
how its adoption affected its financial performance.
-----------------------------------------------------------------------------------------------------------
(Το Ερωτηματολόγιο αναφέρεται στην Διδακτορική μου διατριβή. Στόχος είναι η
συλλογή στοιχείων Ελληνικών Μικρομεσαίων Επιχειρήσεων που έχουν
πιστοποιηθεί με ISO-9001 διαπιστώνοντας εάν συνέχισαν το ταξίδι τους στην
ποιότητα με την εφαρμογή της φιλοσοφίας της Ολικής ποιότητας, καθώς και εάν και
κατά πόσον επηρεάστηκε από αυτό η Χρηματοοικονομική τους απόδοση.)
------------------------------------------------------------------------------------------------------------

Appendix A - Quantitative Survey’s Questionnaire
[A-3]
(The questionnaire has an English and a Greek Version) (Το ερωτηματολόγιο έχει
Αγγλική και Ελληνική έκδοση)
(English Version)
Dear Manager,
Developments in global competition, has prompted Companies, to implement Quality
Assurance Systems (ISO 9001:2000 and ISO 9001:2008) followed by the
implementation of Total Quality Management Systems (TQM) as a strategic
alternative in order to meet customers’ requirements.
It is recognized that TQM and ISO 9001 can complement each other and that ISO
9001 is a good start for the TQM journey.
The research question that this thesis is going to explore is whether and to what
extent the Greek SME’s, ISO 9001 certified companies, are continuing their Quality
journey towards a TQM system, after registration, and identify the impact of Quality
practices to the company’s’ financial performance.(Especially under economic crisis
conditions)
We would like to ensure you that your answers will be confidential!
To complete the questionnaire you need approximately 10-15 minutes.
Moreover, provided that you wish, after the completion of the research a copy of the
results will be sent to you.
We believe that, you will find the subject of our study interesting and you will
contribute with your knowledge and experience in the development of useful and
valuable conclusions.
Thank you very much for your contribution
George Sainis
(Ελληνική έκδοση)
Αξιότιμο Στέλεχος
Οι εξελίξεις στον παγκόσμιο ανταγωνισμό, έχουν προτρέψει τις επιχειρήσεις, να
εφαρμόσουν συστήματα διασφάλισης ποιότητας (ISO 9001:2000 και ISO
9001:2008) που ακολουθούνται από την εφαρμογή ενός συνολικού συστήματος
Ολικής Ποιότητας (TQM) ως εναλλακτική στρατηγική για να την καλύτερη κάλυψη
των απαιτήσεων των πελατών τους.
Αναγνωρίζεται ότι το TQM και το ISO 9001 μπορούν να συμπληρώσουν το ένα το
άλλο, και ότι το ISO 9001 είναι μια καλή αρχή για μία επιχείρηση που έχει πάρει
απόφαση να παρακολουθήσει το ταξίδι της Ολικής Ποιότητας (TQM).
Η ερευνητική ερώτηση αυτής της διατριβής είναι να εξερευνήσει εάν και σε τι
βαθμό οι Ελληνικές ΜΜΕ, πιστοποιημένες σύμφωνα με τα πρότυπα του ISO
9001, συνεχίζουν το ποιοτικό τους ταξίδι προς την Ολική ποιότητα, μετά από την
πιστοποίηση τους, και κατά πόσο η εφαρμογή αυτή
επηρεάζει την χρηματοοικονομική απόδοση τους. (Ιδιαίτερα σε μία περίοδο
οικονομικής κρίσης)

Appendix A - Quantitative Survey’s Questionnaire
[A-4]
Θα επιθυμούσαμε να σας διασφαλίσουμε ότι οι απαντήσεις σας θα είναι
εμπιστευτικές!
Για την ολοκλήρωση του Ερωτηματολογίου απαιτούνται περίπου 10-15 λεπτά.
Επιπλέον, υπό τον όρο ότι το επιθυμείτε, μετά από την ολοκλήρωση της έρευνας ένα
αντίγραφο των αποτελεσμάτων θα σας αποσταλεί.
Πιστεύουμε ότι, θα βρείτε το θέμα της μελέτης μας ενδιαφέρον και θα
συμβάλετε ουσιαστικά με τη γνώση και την εμπειρία σας στην ανάπτυξη χρήσιμων
και πολύτιμων συμπερασμάτων.
Με εκτίμηση
Σαΐνης Γεώργιος
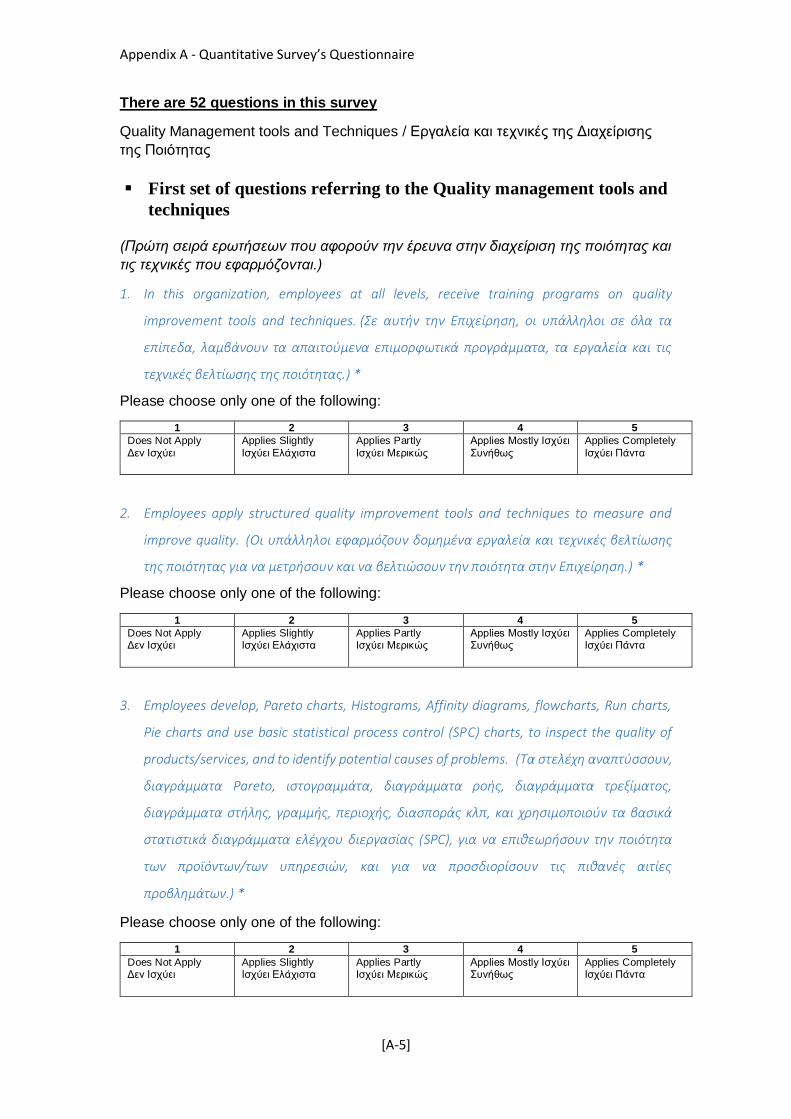
Appendix A - Quantitative Survey’s Questionnaire
[A-5]
There are 52 questions in this survey
Quality Management tools and Techniques / Εργαλεία και τεχνικές της Διαχείρισης
της Ποιότητας
First set of questions referring to the Quality management tools and
techniques
(Πρώτη σειρά ερωτήσεων που αφορούν την έρευνα στην διαχείριση της ποιότητας και
τις τεχνικές που εφαρμόζονται.)
1. In this organization, employees at all levels, receive training programs on quality
improvement tools and techniques. (Σε αυτήν την Επιχείρηση, οι υπάλληλοι σε όλα τα
επίπεδα, λαμβάνουν τα απαιτούμενα επιμορφωτικά προγράμματα, τα εργαλεία και τις
τεχνικές βελτίωσης της ποιότητας.) *
Please choose only one of the following:
1 2 3 4 5
Does Not Apply
Δεν Ισχύει
Applies Slightly
Ισχύει Ελάχιστα
Applies Partly
Ισχύει Μερικώς
Applies Mostly Ισχύει
Συνήθως
Applies Completely
Ισχύει Πάντα
2. Employees apply structured quality improvement tools and techniques to measure and
improve quality. (Οι υπάλληλοι εφαρμόζουν δομημένα εργαλεία και τεχνικές βελτίωσης
της ποιότητας για να μετρήσουν και να βελτιώσουν την ποιότητα στην Επιχείρηση.) *
Please choose only one of the following:
1 2 3 4 5
Does Not Apply Δεν Ισχύει
Applies Slightly Ισχύει Ελάχιστα
Applies Partly Ισχύει Μερικώς
Applies Mostly Ισχύει Συνήθως
Applies Completely Ισχύει Πάντα
3. Employees develop, Pareto charts, Histograms, Affinity diagrams, flowcharts, Run charts,
Pie charts and use basic statistical process control (SPC) charts, to inspect the quality of
products/services, and to identify potential causes of problems. (Τα στελέχη αναπτύσσουν,
διαγράμματα Pareto, ιστογραμμάτα, διαγράμματα ροής, διαγράμματα τρεξίματος,
διαγράμματα στήλης, γραμμής, περιοχής, διασποράς κλπ, και χρησιμοποιούν τα βασικά
στατιστικά διαγράμματα ελέγχου διεργασίας (SPC), για να επιθεωρήσουν την ποιότητα
των προϊόντων/των υπηρεσιών, και για να προσδιορίσουν τις πιθανές αιτίες
προβλημάτων.) *
Please choose only one of the following:
1 2 3 4 5
Does Not Apply Δεν Ισχύει
Applies Slightly Ισχύει Ελάχιστα
Applies Partly Ισχύει Μερικώς
Applies Mostly Ισχύει Συνήθως
Applies Completely Ισχύει Πάντα
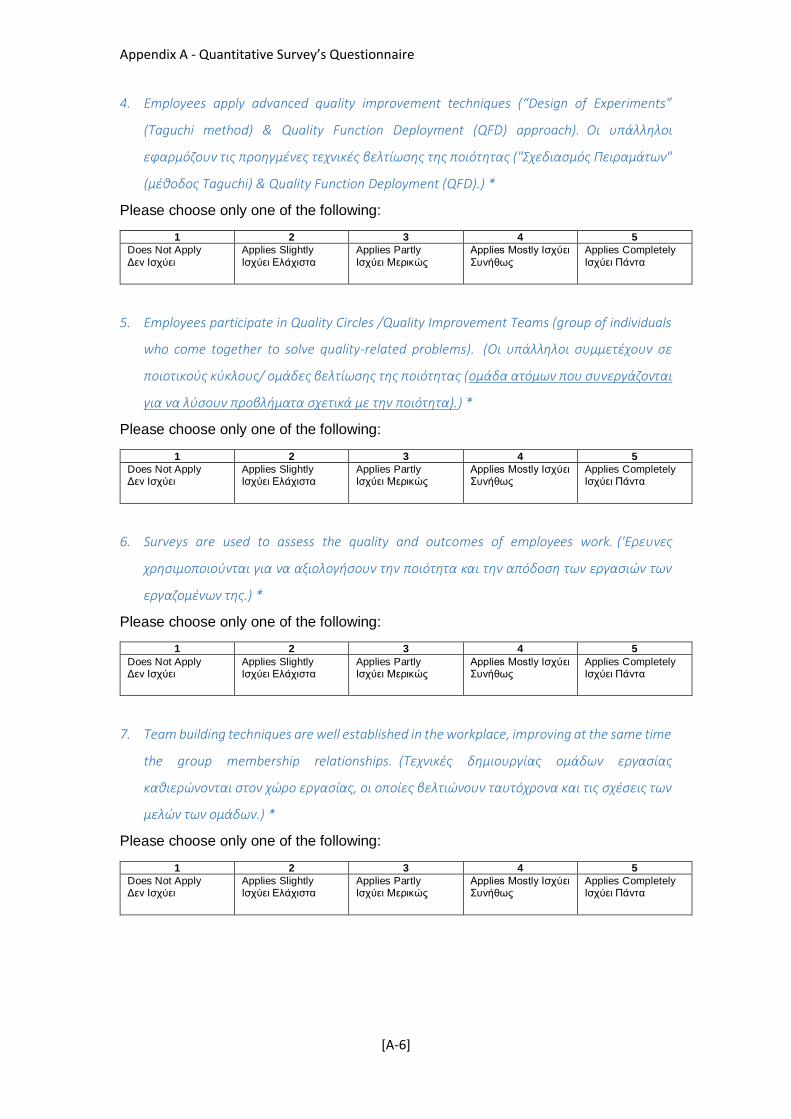
Appendix A - Quantitative Survey’s Questionnaire
[A-6]
4. Employees apply advanced quality improvement techniques (“Design of Experiments”
(Taguchi method) & Quality Function Deployment (QFD) approach). Οι υπάλληλοι
εφαρμόζουν τις προηγμένες τεχνικές βελτίωσης της ποιότητας ("Σχεδιασμός Πειραμάτων"
(μέθοδος Taguchi) & Quality Function Deployment (QFD).) *
Please choose only one of the following:
1 2 3 4 5
Does Not Apply
Δεν Ισχύει
Applies Slightly
Ισχύει Ελάχιστα
Applies Partly
Ισχύει Μερικώς
Applies Mostly Ισχύει
Συνήθως
Applies Completely
Ισχύει Πάντα
5. Employees participate in Quality Circles /Quality Improvement Teams (group of individuals
who come together to solve quality-related problems). (Οι υπάλληλοι συμμετέχουν σε
ποιοτικούς κύκλους/ ομάδες βελτίωσης της ποιότητας (ομάδα ατόμων που συνεργάζονται
για να λύσουν προβλήματα σχετικά με την ποιότητα).) *
Please choose only one of the following:
1 2 3 4 5
Does Not Apply Δεν Ισχύει
Applies Slightly Ισχύει Ελάχιστα
Applies Partly Ισχύει Μερικώς
Applies Mostly Ισχύει Συνήθως
Applies Completely Ισχύει Πάντα
6. Surveys are used to assess the quality and outcomes of employees work. ('Ερευνες
χρησιμοποιούνται για να αξιολογήσουν την ποιότητα και την απόδοση των εργασιών των
εργαζομένων της.) *
Please choose only one of the following:
1 2 3 4 5
Does Not Apply Δεν Ισχύει
Applies Slightly Ισχύει Ελάχιστα
Applies Partly Ισχύει Μερικώς
Applies Mostly Ισχύει Συνήθως
Applies Completely Ισχύει Πάντα
7. Team building techniques are well established in the workplace, improving at the same time
the group membership relationships. (Τεχνικές δημιουργίας ομάδων εργασίας
καθιερώνονται στον χώρο εργασίας, οι οποίες βελτιώνουν ταυτόχρονα και τις σχέσεις των
μελών των ομάδων.) *
Please choose only one of the following:
1 2 3 4 5
Does Not Apply Δεν Ισχύει
Applies Slightly Ισχύει Ελάχιστα
Applies Partly Ισχύει Μερικώς
Applies Mostly Ισχύει Συνήθως
Applies Completely Ισχύει Πάντα

Appendix A - Quantitative Survey’s Questionnaire
[A-7]
Organizational Culture / Επιχειρησιακή Φιλοσοφία
8. People in this organization are aware of the mission, vision, values and the Company's
organizational strategy. (Τα στελέχη της Επιχείρησης γνωρίζουν την αποστολή, το όραμα,
τις αξίες και την οργανωτική της στρατηγική.) *
Please choose only one of the following:
1 2 3 4 5
Does Not Apply
Δεν Ισχύει
Applies Slightly
Ισχύει Ελάχιστα
Applies Partly
Ισχύει Μερικώς
Applies Mostly Ισχύει
Συνήθως
Applies Completely
Ισχύει Πάντα
9. Continuous improvement is seen as essential and is implemented by all organizational
members. (Η συνεχής βελτίωση θεωρείται ουσιαστική και εφαρμόζεται από όλα τα
στελέχη της Επιχείρησης.) *
Please choose only one of the following:
1 2 3 4 5
Does Not Apply Δεν Ισχύει
Applies Slightly Ισχύει Ελάχιστα
Applies Partly Ισχύει Μερικώς
Applies Mostly Ισχύει Συνήθως
Applies Completely Ισχύει Πάντα
10. Creativity and innovation is actively encouraged and supported in this organization. (Η
δημιουργικότητα και η καινοτομία ενθαρρύνονται και υποστηρίζονται ενεργά στην
Επιχείρηση αυτή.) *
Please choose only one of the following:
1 2 3 4 5
Does Not Apply Δεν Ισχύει
Applies Slightly Ισχύει Ελάχιστα
Applies Partly Ισχύει Μερικώς
Applies Mostly Ισχύει Συνήθως
Applies Completely Ισχύει Πάντα
11. The spirit of cooperation & teamwork exists in this organization. (Στην Επιχείρηση αυτή
υπάρχει πνεύμα συνεργασίας & ομαδικής εργασίας.) *
Please choose only one of the following:
1 2 3 4 5
Does Not Apply
Δεν Ισχύει
Applies Slightly
Ισχύει Ελάχιστα
Applies Partly
Ισχύει Μερικώς
Applies Mostly Ισχύει
Συνήθως
Applies Completely
Ισχύει Πάντα
12. People in this organization know how to define quality of what (Job) they are doing. (Τα
στελέχη στην Επιχείρηση αυτή, ξέρουν πώς να ορίζουν την ποιότητα αυτών (εργασιών) που
κάνουν.) *

Appendix A - Quantitative Survey’s Questionnaire
[A-8]
Please choose only one of the following:
1 2 3 4 5
Does Not Apply Δεν Ισχύει
Applies Slightly Ισχύει Ελάχιστα
Applies Partly Ισχύει Μερικώς
Applies Mostly Ισχύει Συνήθως
Applies Completely Ισχύει Πάντα
13. Company's Leadership is committed to provide quality products/ services/ work. (Η ηγεσία
της Επιχείρησης είναι δεσμευμένη στην παροχή ποιοτικών Προϊόντων/ Υπηρεσιών/
Εργασιών.) *
Please choose only one of the following:
1 2 3 4 5
Does Not Apply
Δεν Ισχύει
Applies Slightly
Ισχύει Ελάχιστα
Applies Partly
Ισχύει Μερικώς
Applies Mostly Ισχύει
Συνήθως
Applies Completely
Ισχύει Πάντα
14. The way things are done in this organization is consistent with quality. (Ο τρόπος που
γίνονται τα πράγματα σε αυτήν την Επιχείρηση είναι σύμφωνα με τους κανόνες της
ποιότητας.) *
Please choose only one of the following:
1 2 3 4 5
Does Not Apply Δεν Ισχύει
Applies Slightly Ισχύει Ελάχιστα
Applies Partly Ισχύει Μερικώς
Applies Mostly Ισχύει Συνήθως
Applies Completely Ισχύει Πάντα
15. People in this organization know who their customers are. (Τα στελέχη στην Επιχείρηση
ξέρουν ποιοί είναι οι πελάτες τους.) *
1 2 3 4 5
Does Not Apply
Δεν Ισχύει
Applies Slightly
Ισχύει Ελάχιστα
Applies Partly
Ισχύει Μερικώς
Applies Mostly Ισχύει
Συνήθως
Applies Completely
Ισχύει Πάντα
16. We constantly aim at customers satisfaction from our products/services/ work. (Πάντα
στοχεύουμε στην ικανοποίηση των πελατών μας από τα προϊόντα μας/ τις υπηρεσίες μας/
την εργασία μας.) *
Please choose only one of the following:
1 2 3 4 5
Does Not Apply Δεν Ισχύει
Applies Slightly Ισχύει Ελάχιστα
Applies Partly Ισχύει Μερικώς
Applies Mostly Ισχύει Συνήθως
Applies Completely Ισχύει Πάντα

Appendix A - Quantitative Survey’s Questionnaire
[A-9]
17. People in this organization typically have the authority to take decisions and actions for
their job responsibilities, without the approval of their superior manager. (Τα στελέχη της
επιχείρηση έχουν την εξουσία να λαμβάνουν αποφάσεις και μέτρα σχετικά με τις
εργασιακές τους ευθύνες χωρίς την έγκριση ανώτερου στελέχους της Επιχείρησης.) *
1 2 3 4 5
Does Not Apply
Δεν Ισχύει
Applies Slightly
Ισχύει Ελάχιστα
Applies Partly
Ισχύει Μερικώς
Applies Mostly Ισχύει
Συνήθως
Applies Completely
Ισχύει Πάντα
18. People in this organization care about Customers and are committed in meeting their needs
and expectations. (Τά στελέχη της Επιχείρηση φροντίζουν τους Πελάτες της και είναι
δεσμευμένοι να ικανοποιήσουν τις ανάγκες και προσδοκίες τους.) *
Please choose only one of the following:
1 2 3 4 5
Does Not Apply Δεν Ισχύει
Applies Slightly Ισχύει Ελάχιστα
Applies Partly Ισχύει Μερικώς
Applies Mostly Ισχύει Συνήθως
Applies Completely Ισχύει Πάντα
19. It is the Company's Policy to meet frequently with customers in discussing their approach to
quality services and their needs. (Είναι στην Πολιτική της Επιχείρησης να συναντιέται
συχνά με τους πελάτες της και να συζητάει μαζί τους την προσέγγισή τους στην Ποιότητα
και τις ανάγκες τους.) *
Please choose only one of the following:
1 2 3 4 5
Does Not Apply
Δεν Ισχύει
Applies Slightly
Ισχύει Ελάχιστα
Applies Partly
Ισχύει Μερικώς
Applies Mostly Ισχύει
Συνήθως
Applies Completely
Ισχύει Πάντα
20. Performance and quality information are used by all people in this organization, to achieve
continuous improvement and not just to judge individuals’ performance. (Οι πληροφορίες
απόδοσης και ποιότητας, χρησιμοποιούνται από τα στελέχη της Επιχείρησης, με στόχο την
συνεχή βελτίωση τους και όχι μόνο την αξιολόγηση της απόδοσης τους.) *
Please choose only one of the following:
1 2 3 4 5
Does Not Apply Δεν Ισχύει
Applies Slightly Ισχύει Ελάχιστα
Applies Partly Ισχύει Μερικώς
Applies Mostly Ισχύει Συνήθως
Applies Completely Ισχύει Πάντα

Appendix A - Quantitative Survey’s Questionnaire
[A-10]
21. Effective communication channels exist in this Company, reinforcing the need for
continuous improvement and error minimization. (Αποτελεσματικά κανάλια επικοινωνίας
υπάρχουν στην Επιχείρηση, που ενισχύουν την ανάγκη για συνεχή βελτίωση και
ελαχιστοποίηση των λαθών.) *
Please choose only one of the following:
1 2 3 4 5
Does Not Apply
Δεν Ισχύει
Applies Slightly
Ισχύει Ελάχιστα
Applies Partly
Ισχύει Μερικώς
Applies Mostly Ισχύει
Συνήθως
Applies Completely
Ισχύει Πάντα
22. The Company involves everyone in the quality improvement process. (Η Επιχείρηση
συμπεριλαμβάνει όλα τα στελέχη της στην διαδικασία βελτίωσης της ποιότητας.) *
Please choose only one of the following:
1 2 3 4 5
Does Not Apply
Δεν Ισχύει
Applies Slightly
Ισχύει Ελάχιστα
Applies Partly
Ισχύει Μερικώς
Applies Mostly Ισχύει
Συνήθως
Applies Completely
Ισχύει Πάντα
23. Surveys are used to assess employee opinion about the organization’s practices and
policies. (Έρευνες χρησιμοποιούνται για να αξιολογήσουν την άποψη των υπαλλήλων για
τις πρακτικές και τις πολιτικές της Επιχείρησης.) *
1 2 3 4 5
Does Not Apply Δεν Ισχύει
Applies Slightly Ισχύει Ελάχιστα
Applies Partly Ισχύει Μερικώς
Applies Mostly Ισχύει Συνήθως
Applies Completely Ισχύει Πάντα
Processes / Διαδικασίες
24. To What Extent the following factors are used to determine if improvements in quality are
needed. (Μέχρι ποιό σημείο οι ακόλουθοι παράγοντες χρησιμοποιούνται για να
καθορίσουν εάν οι βελτιώσεις στην ποιότητα απαιτούνται.) *
Please choose the appropriate response for each item:
1 2 3 4 5
Surveys (Έρευνα)
Formal Interviews (Συνεντεύξεις)
Focus group methods (Μέθοδοι επιλογής
κοινού)
Analysis of performance data (Ανάλυση
στοιχείων απόδοσης)

Appendix A - Quantitative Survey’s Questionnaire
[A-11]
1 2 3 4 5
Senior management / leadership
guidelines/ policies (Ανώτερη Διοίκηση/
Ηγετικές κατευθύνσεις/ Αρχές)
Employee suggestions (Προτάσεις
Στελεχών)
Legal considerations (Νομικά δεδομένα)
Benchmarking data (Σημεία Αναφοράς)
Stakeholder’s suggestions (Suppliers,
Partners etc.) (Προτάσεις μετόχων -
(Προμηθευτές, Συνεργάτες))
Technological advancements
(τεχνολογικά επιτεύγματα)
Economic considerations (Οικονομικοί
παράγοντες)
To What extent (Σε τί βαθμό):
25. Employees are familiar with the company’s quality improvement policies? (Τα στελέχη
γνωρίζουν τις βασικές αρχές βελτίωσης της Ποιότητας της Επιχείρησης;) *
Please choose only one of the following:
1 2 3 4 5
Does Not Apply Δεν Ισχύει
Applies Slightly Ισχύει Ελάχιστα
Applies Partly Ισχύει Μερικώς
Applies Mostly Ισχύει Συνήθως
Applies Completely Ισχύει Πάντα
To What extent (Σε ποιό βαθμό):
26. The organization’s quality improvement policies are taken seriously by the employees? (Οι
Αρχές βελτίωσης της ποιότητας λαμβάνονται σοβαρά υπόψη από τα στελέχη;) *
Please choose only one of the following:
1 2 3 4 5
Does Not Apply Δεν Ισχύει
Applies Slightly Ισχύει Ελάχιστα
Applies Partly Ισχύει Μερικώς
Applies Mostly Ισχύει Συνήθως
Applies Completely Ισχύει Πάντα

Appendix A - Quantitative Survey’s Questionnaire
[A-12]
To What extent (Σε ποιό βαθμό):
27. Managers at all levels have defined roles in the quality improvement process? (Τα Στελέχη
όλων των επιπέδων έχουν ορίσει τους ρόλους τους στην διαδικασία της βελτίωσης της
ποιότητας;) *
1 2 3 4 5
Does Not Apply
Δεν Ισχύει
Applies Slightly
Ισχύει Ελάχιστα
Applies Partly
Ισχύει Μερικώς
Applies Mostly Ισχύει
Συνήθως
Applies Completely
Ισχύει Πάντα
To What extent (Σε ποιό βαθμό):
28. The company has a database /tracking system for relevant quality information? (Η
Επιχείρηση έχει βάση δεδομένων/ σύστημα διαχείρισης σχετικών στοιχείων ποιότητας;) *
Please choose only one of the following:
1 2 3 4 5
Does Not Apply Δεν Ισχύει
Applies Slightly Ισχύει Ελάχιστα
Applies Partly Ισχύει Μερικώς
Applies Mostly Ισχύει Συνήθως
Applies Completely Ισχύει Πάντα
To What extent (Σε τι βαθμο):
29. The company has set a long term plan (objectives & strategies) referring to quality
improvements? (Η Επιχειρηση έχει ορίσει μακροπρόθεσμο σχέδιο (Στόχους & Στρατηγικές)
που αφορά την βελτίωση της ποιότητας;) *
Please choose only one of the following:
1 2 3 4 5
Does Not Apply
Δεν Ισχύει
Applies Slightly
Ισχύει Ελάχιστα
Applies Partly
Ισχύει Μερικώς
Applies Mostly Ισχύει
Συνήθως
Applies Completely
Ισχύει Πάντα
30. The company has set a short term plan (objectives & strategies) regarding quality
improvements? (Η Επιχείρηση έχει βραχυπρόθεσμο σχέδιο (στόχους & στρατηγικές) που
αφορά βελτιώσεις στην Ποιότητα;) *
Please choose only one of the following:
1 2 3 4 5
Does Not Apply Δεν Ισχύει
Applies Slightly Ισχύει Ελάχιστα
Applies Partly Ισχύει Μερικώς
Applies Mostly Ισχύει Συνήθως
Applies Completely Ισχύει Πάντα

Appendix A - Quantitative Survey’s Questionnaire
[A-13]
To What extent (Σε τι βαθμό) :
31. In your company’s strategic planning there is an integration of quality improvement
planning? (Στον Στρατηγικό Σχεδιασμό της επιχείρησης σας, υπάρχει σχέδιο ποιοτικής
βελτίωσης;) *
Please choose only one of the following:
1 2 3 4 5
Does Not Apply Δεν Ισχύει
Applies Slightly Ισχύει Ελάχιστα
Applies Partly Ισχύει Μερικώς
Applies Mostly Ισχύει Συνήθως
Applies Completely Ισχύει Πάντα
To What extent (Σε τί βαθμό):
32. Appropriate training for the use of all kind of equipment/ Technology has been
implemented? (Εφαρμόζεται πρόγραμμα κατάρτισης για όλα τα μηχανήματα και τις
τεχνολογίες της επιχείρησης;) *
Please choose only one of the following:
1 2 3 4 5
Does Not Apply
Δεν Ισχύει
Applies Slightly
Ισχύει Ελάχιστα
Applies Partly
Ισχύει Μερικώς
Applies Mostly Ισχύει
Συνήθως
Applies Completely
Ισχύει Πάντα
Performance Appaisal / Εκτίμηση/ Έλεγχος απόδοσης
To what extent…(Σε τί βαθμό)
33. The Company monitor’s data regarding Efficiency? (Η Επιχείρηση συλλέγει και
παρακολουθεί στοιχεία σχετικά με την Αποδοτικότητα της;) *
Please choose only one of the following:
1 2 3 4 5
Does Not Apply
Δεν Ισχύει
Applies Slightly
Ισχύει Ελάχιστα
Applies Partly
Ισχύει Μερικώς
Applies Mostly Ισχύει
Συνήθως
Applies Completely
Ισχύει Πάντα
To what extent….(Σε τι βαθμό)
34. The Company monitor’s data regarding Effectiveness? (Η Επιχείρηση παρακολουθεί τα
στοιχεία που αφορούν την Αποτελεσματικότητα της;) *
1 2 3 4 5
Does Not Apply Δεν Ισχύει
Applies Slightly Ισχύει Ελάχιστα
Applies Partly Ισχύει Μερικώς
Applies Mostly Ισχύει Συνήθως
Applies Completely Ισχύει Πάντα
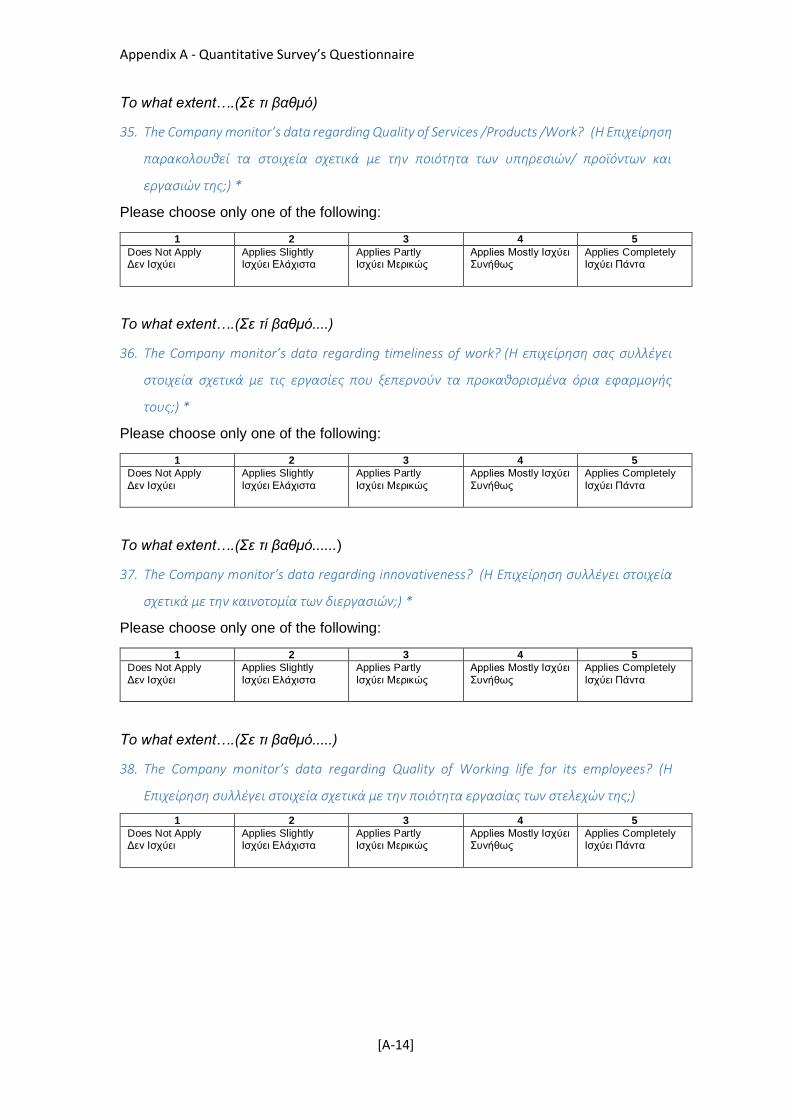
Appendix A - Quantitative Survey’s Questionnaire
[A-14]
To what extent….(Σε τι βαθμό)
35. The Company monitor’s data regarding Quality of Services /Products /Work? (Η Επιχείρηση
παρακολουθεί τα στοιχεία σχετικά με την ποιότητα των υπηρεσιών/ προϊόντων και
εργασιών της;) *
Please choose only one of the following:
1 2 3 4 5
Does Not Apply Δεν Ισχύει
Applies Slightly Ισχύει Ελάχιστα
Applies Partly Ισχύει Μερικώς
Applies Mostly Ισχύει Συνήθως
Applies Completely Ισχύει Πάντα
To what extent….(Σε τί βαθμό....)
36. The Company monitor’s data regarding timeliness of work? (Η επιχείρηση σας συλλέγει
στοιχεία σχετικά με τις εργασίες που ξεπερνούν τα προκαθορισμένα όρια εφαρμογής
τους;) *
Please choose only one of the following:
1 2 3 4 5
Does Not Apply
Δεν Ισχύει
Applies Slightly
Ισχύει Ελάχιστα
Applies Partly
Ισχύει Μερικώς
Applies Mostly Ισχύει
Συνήθως
Applies Completely
Ισχύει Πάντα
To what extent….(Σε τι βαθμό......)
37. The Company monitor’s data regarding innovativeness? (Η Επιχείρηση συλλέγει στοιχεία
σχετικά με την καινοτομία των διεργασιών;) *
Please choose only one of the following:
1 2 3 4 5
Does Not Apply
Δεν Ισχύει
Applies Slightly
Ισχύει Ελάχιστα
Applies Partly
Ισχύει Μερικώς
Applies Mostly Ισχύει
Συνήθως
Applies Completely
Ισχύει Πάντα
To what extent….(Σε τι βαθμό.....)
38. The Company monitor’s data regarding Quality of Working life for its employees? (Η
Επιχείρηση συλλέγει στοιχεία σχετικά με την ποιότητα εργασίας των στελεχών της;)
1 2 3 4 5
Does Not Apply Δεν Ισχύει
Applies Slightly Ισχύει Ελάχιστα
Applies Partly Ισχύει Μερικώς
Applies Mostly Ισχύει Συνήθως
Applies Completely Ισχύει Πάντα

Appendix A - Quantitative Survey’s Questionnaire
[A-15]
To what extent….(Σε τι βαθμό.....)
39. The Company monitor’s data regarding Financial issues? (Η Επιχείρηση παρακολουθεί τα
χρηματοοικονομικά της στοιχεία;)
Please choose only one of the following:
1 2 3 4 5
Does Not Apply Δεν Ισχύει
Applies Slightly Ισχύει Ελάχιστα
Applies Partly Ισχύει Μερικώς
Applies Mostly Ισχύει Συνήθως
Applies Completely Ισχύει Πάντα
To what extent….(Σε τι βαθμό.....)
40. In the company’s strategic planning there is a process of monitoring quality improvement
effectiveness over time? (Στον Στρατηγικό σχεδιασμό της Επιχείρησης υπάρχει διαδικασία
που ελέγχει την αποτελεσματικότητα των ποιοτικών βελτιώσεων στον χρόνο;)
Please choose only one of the following:
1 2 3 4 5
Does Not Apply Δεν Ισχύει
Applies Slightly Ισχύει Ελάχιστα
Applies Partly Ισχύει Μερικώς
Applies Mostly Ισχύει Συνήθως
Applies Completely Ισχύει Πάντα
41. The Company's performance Assessment criteria are….. (Τα Κριτήρια αξιολόγησης της
Επιχειρηματικής απόδοσης .......) *
Please choose the appropriate response for each item:
1 2 3 4 5
Tracked over time (Παρακολουθούνται
στον χρόνο)
Compared with goals, standards or
objectives (Συγκρίνονται με στόχους,
σταθερές ή σκοπούς)
Compared with other similar
organizations and the best in the
industry (Συγκρίνονται με παρόμοιες ή/και
τις καλύτερες Επιχειρήσεις στον χώρο)
1. Does not Apply 2. Applies Slightly 3. Apply Partly 4. Applies Mostly 5. Applies
Completely

Appendix A - Quantitative Survey’s Questionnaire
[A-16]
Financial Performance Indicators (Financial Ratios) - Χρημα/μικοί
Δείκτες
42. For the Years 2008 till 2014, please fill in the following table using data taken from the i-
Mentor database:
(Για τα έτη 2008 έως 2014 παρακαλώ συμπληρώστε τον παρακάτω πίνακα αντλώντας
στοιχεία από την Βάση δεδομένων i-Mentor.
Year Acid-Test
Ratio
Asset
Turnover
Inventory
Turnover
Acc.
Receivable Turnover
Debt/Equi
ty Ratio
Z-Score
Ratio
Return on
Assets
Return on
Equity
2008
2009
2010
2011
2012
2013
2014
Demographics - Δημογραφικά
43. Please select the Industry Sector you operate.
Παρακαλώ επιλέξτε τον Κλάδο της Βιομηχανίας που λειτουργείται. *
Please choose all that apply:
Oil & Gas (Πετρέλαιο και Αέριο)
Chemicals (Χημικά)
Basic Resources (Πρώτες Υλες)
Construction & Materials (Κατασκευές & Υλικά Κατασκευών)
Industrial Goods & Services (Βιομηχανικά Προϊόντα & Υπηρεσίες)
Food & Beverage (Τρόφιμα & Ποτά)
Personal & Household Goods (Προσωπικά & Οικιακά Αγαθά)
Health Care (Υγεία)
Retail (Εμπόριο)
Media (Μέσα Ενημέρωσης)
Travel & Leisure (Ταξίδια & Αναψυχή)
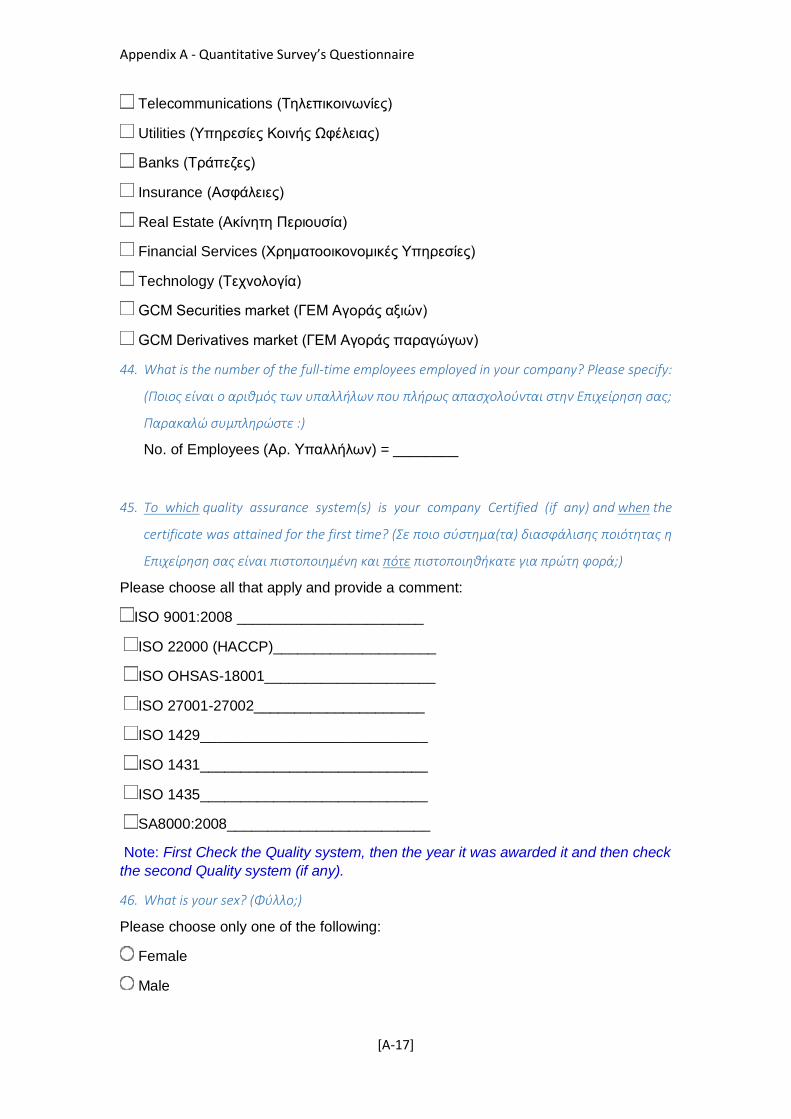
Appendix A - Quantitative Survey’s Questionnaire
[A-17]
Telecommunications (Τηλεπικοινωνίες)
Utilities (Υπηρεσίες Κοινής Ωφέλειας)
Banks (Τράπεζες)
Insurance (Ασφάλειες)
Real Estate (Ακίνητη Περιουσία)
Financial Services (Χρηματοοικονομικές Υπηρεσίες)
Technology (Τεχνολογία)
GCM Securities market (ΓΕΜ Αγοράς αξιών)
GCM Derivatives market (ΓΕΜ Αγοράς παραγώγων)
44. What is the number of the full-time employees employed in your company? Please specify:
(Ποιος είναι ο αριθμός των υπαλλήλων που πλήρως απασχολούνται στην Επιχείρηση σας;
Παρακαλώ συμπληρώστε :)
No. of Employees (Αρ. Υπαλλήλων) = ________
45. To which quality assurance system(s) is your company Certified (if any) and when the
certificate was attained for the first time? (Σε ποιο σύστημα(τα) διασφάλισης ποιότητας η
Επιχείρηση σας είναι πιστοποιημένη και πότε πιστοποιηθήκατε για πρώτη φορά;)
Please choose all that apply and provide a comment:
ISO 9001:2008 _______________________
ISO 22000 (HACCP)____________________
ISO OHSAS-18001_____________________
ISO 27001-27002_____________________
ISO 1429____________________________
ISO 1431____________________________
ISO 1435____________________________
SA8000:2008_________________________
Note: First Check the Quality system, then the year it was awarded it and then check
the second Quality system (if any).
46. What is your sex? (Φύλλο;)
Please choose only one of the following:
Female
Male

Appendix A - Quantitative Survey’s Questionnaire
[A-18]
47. What is your Age (Select one....) - Ποιά είναι η ηλικία σας; (Επιλέξτε...) *
Please choose only one of the following:
21-30
31-40
41-50
51 and above
48. What is the highest degree in education you have completed? (Ποιο είναι το ανώτερο
πτυχίο σπουδών που έχετε ολοκληρώσει;) *
Please choose all that apply:
High school graduate –
Associate degree
Bachelor's degree
Master's degree
Professional degree
Doctorate degree
49. Working Position (Θέση Εργασίας) *
Please choose all that apply:
Top-Level Management
Middle-level Management
First-level Management
50. Working experience (in years). (Προϋπηρεσία (σε έτη).) *
Please choose all that apply:
0-5 years
6-10 years
10-20 years
More than 20 years

Appendix A - Quantitative Survey’s Questionnaire
[A-19]
51. Your quality management experience is as….. (Η Εμπειρία σας στην ποιότητα ήταν
ως.......) *
Please choose all that apply:
Analyst
Associate
Auditor
Black belt
Calibration technician
Champion
Quality Consultant
Coordinator
Director
Educator/ Instructor
Green Belt
Inspector
Manager
Master Black Belt
Process/manufacturing/project engineer
Quality engineer
Reliability/ safety engineer
Software quality engineer
Specialist
Supervisor
Supplier quality engineer / professional
Technician
Vice President/ executive
I would like to thank you for your contribution to the development of accurate and
reliable Information.
----------------------------------------------------------------------------------------------------------------
Θα ήθελα να σας ευχαριστήσω για την συμβολή σας στην ανάπτυξη αξιόπιστων
πληροφοριών.
Appendix B
Qualitative Survey
(Interview Questions)
Summary: Appendix Β has the questionnaire used in the Qualitative survey
conducted. A set of eight questions are presented in the Greek and English
language.
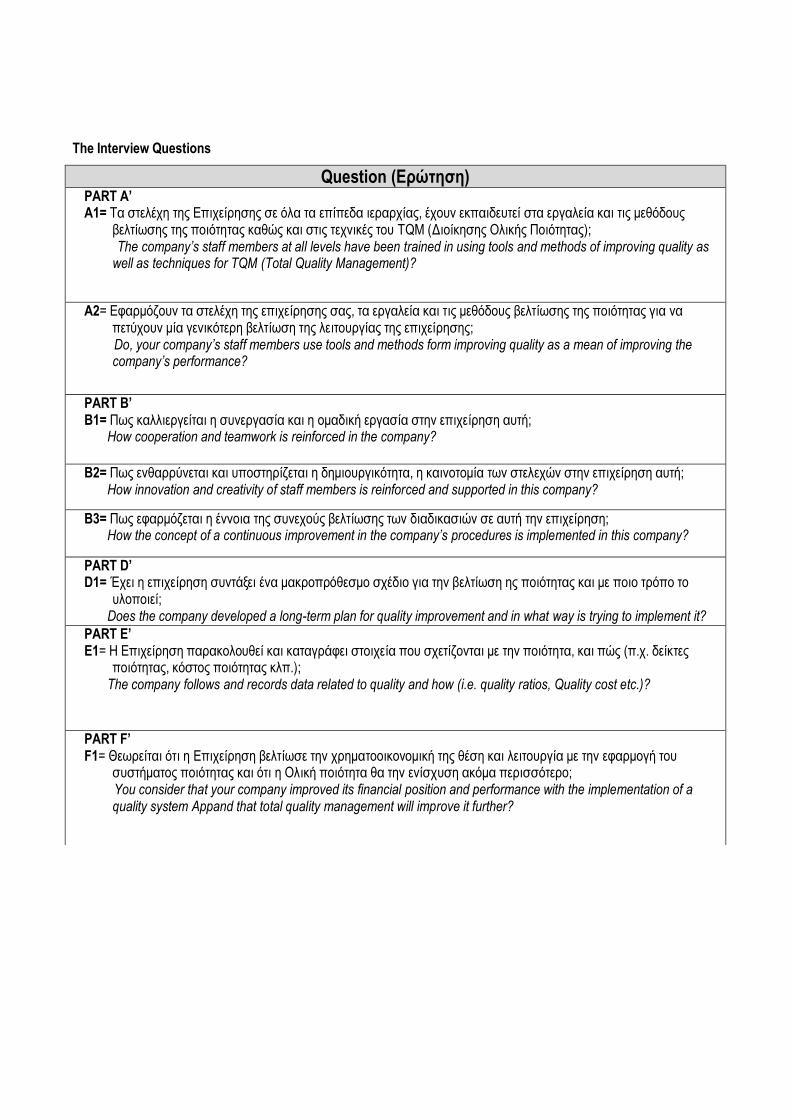
The Interview Questions
Question (Ερώτηση) PART A’ A1= Τα στελέχη της Επιχείρησης σε όλα τα επίπεδα ιεραρχίας, έχουν εκπαιδευτεί στα εργαλεία και τις μεθόδους
βελτίωσης της ποιότητας καθώς και στις τεχνικές του TQM (Διοίκησης Ολικής Ποιότητας); The company’s staff members at all levels have been trained in using tools and methods of improving quality as
well as techniques for TQM (Total Quality Management)?
Α2= Εφαρμόζουν τα στελέχη της επιχείρησης σας, τα εργαλεία και τις μεθόδους βελτίωσης της ποιότητας για να πετύχουν μία γενικότερη βελτίωση της λειτουργίας της επιχείρησης;
Do, your company’s staff members use tools and methods form improving quality as a mean of improving the company’s performance?
PART B’ Β1= Πως καλλιεργείται η συνεργασία και η ομαδική εργασία στην επιχείρηση αυτή; How cooperation and teamwork is reinforced in the company?
Β2= Πως ενθαρρύνεται και υποστηρίζεται η δημιουργικότητα, η καινοτομία των στελεχών στην επιχείρηση αυτή; How innovation and creativity of staff members is reinforced and supported in this company?
Β3= Πως εφαρμόζεται η έννοια της συνεχούς βελτίωσης των διαδικασιών σε αυτή την επιχείρηση; How the concept of a continuous improvement in the company’s procedures is implemented in this company?
PART D’ D1= Έχει η επιχείρηση συντάξει ένα μακροπρόθεσμο σχέδιο για την βελτίωση ης ποιότητας και με ποιο τρόπο το
υλοποιεί; Does the company developed a long-term plan for quality improvement and in what way is trying to implement it?
PART E’ E1= Η Επιχείρηση παρακολουθεί και καταγράφει στοιχεία που σχετίζονται με την ποιότητα, και πώς (π.χ. δείκτες
ποιότητας, κόστος ποιότητας κλπ.); The company follows and records data related to quality and how (i.e. quality ratios, Quality cost etc.)?
PART F’ F1= Θεωρείται ότι η Επιχείρηση βελτίωσε την χρηματοοικονομική της θέση και λειτουργία με την εφαρμογή του
συστήματος ποιότητας και ότι η Ολική ποιότητα θα την ενίσχυση ακόμα περισσότερο; You consider that your company improved its financial position and performance with the implementation of a
quality system Appand that total quality management will improve it further?

APPENDIX C
QUALITATIVE SURVEY’S
RESULTS
Summary: Appendix C shows the results derived from the Qualitative survey conducted.
It includes seven tables were the results derived from the ten interviews conducted are
shown.
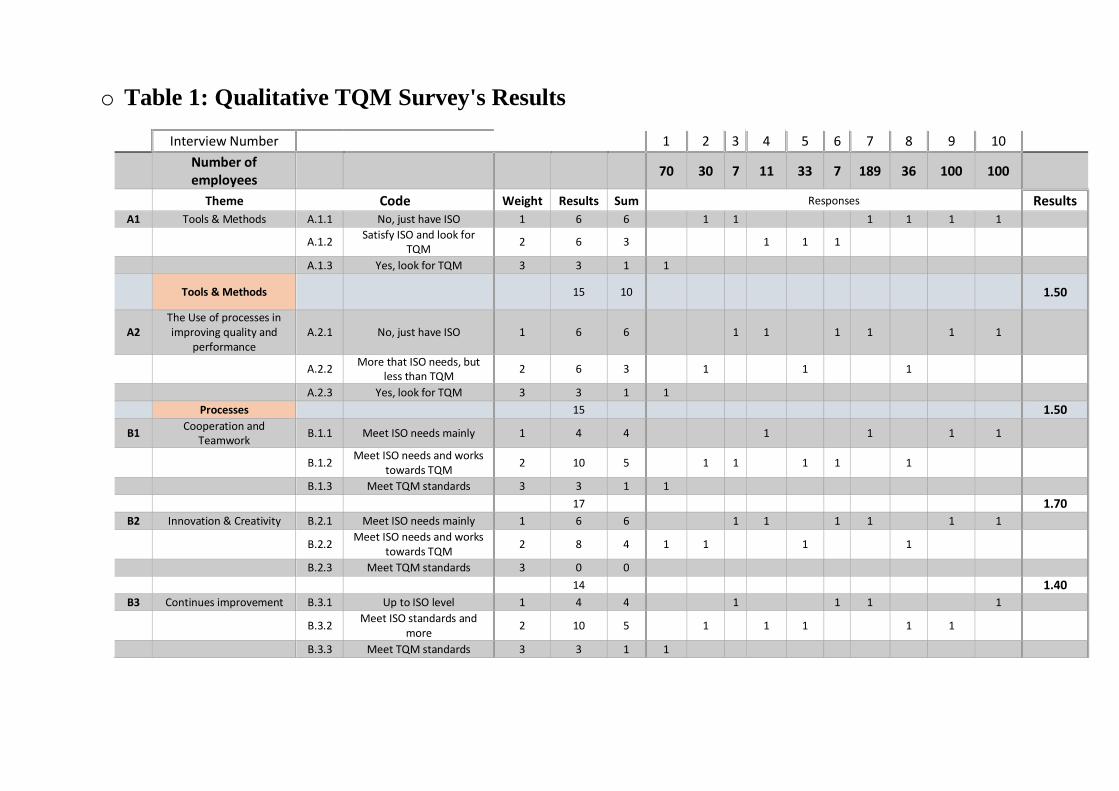
o Table 1: Qualitative TQM Survey's Results
Interview Number 1 2 3 4 5 6 7 8 9 10
Number of employees
70 30 7 11 33 7 189 36 100 100
Theme Code Weight Results Sum Responses Results A1 Tools & Methods A.1.1 No, just have ISO 1 6 6 1 1 1 1 1 1
A.1.2 Satisfy ISO and look for
TQM 2 6 3 1 1 1
A.1.3 Yes, look for TQM 3 3 1 1
Tools & Methods 15 10 1.50
A2 The Use of processes in improving quality and
performance A.2.1 No, just have ISO 1 6 6 1 1 1 1 1 1
A.2.2 More that ISO needs, but
less than TQM 2 6 3 1 1 1
A.2.3 Yes, look for TQM 3 3 1 1
Processes 15 1.50
B1 Cooperation and
Teamwork B.1.1 Meet ISO needs mainly 1 4 4 1 1 1 1
B.1.2 Meet ISO needs and works
towards TQM 2 10 5 1 1 1 1 1
B.1.3 Meet TQM standards 3 3 1 1
17 1.70
B2 Innovation & Creativity B.2.1 Meet ISO needs mainly 1 6 6 1 1 1 1 1 1
B.2.2 Meet ISO needs and works
towards TQM 2 8 4 1 1 1 1
B.2.3 Meet TQM standards 3 0 0
14 1.40
B3 Continues improvement B.3.1 Up to ISO level 1 4 4 1 1 1 1
B.3.2 Meet ISO standards and
more 2 10 5 1 1 1 1 1
B.3.3 Meet TQM standards 3 3 1 1

APPENDIX C – Qualitative Survey’s Results
[C-1]
Interview Number 1 2 3 4 5 6 7 8 9 10
17 1.70 Culture 16 1.60
D11 L/T quality improvements
(Strategic plan) D.1.1 one year as specified by ISO 1 9 9 1 1 1 1 1 1 1 1 1
D.1.2 More than one year-
Formal/ Move to TQM 2 2 1 1
D.1.3 More than one year-
Informal/TQM 3 0 0
Quality in Strategic planning
11 1.10
E1 Quality costs -
Performance appraisal methods
E.1.1 Refer to ISO standards 1 5 5 1 1 1 1 1
E.1.2 More than ISO standards 2 8 4 1 1 1 1
E.1.3 TQM measurement
methods (failure rates) 3 3 1 1
Performance appraisal 16 1.60
TQM (A1, A2, B1, B2, B3, E1) 62 1.55
1 Due to software’s weakness, section C is omitted.

APPENDIX C – Qualitative Survey’s Results
[C-2]
o Table 2: Financial Results (All Data)
F1 ISO improved fin. Performance? F.1.1.1 NO, 1 1 1 1
F.1.1.2 Kind of …. 2 6 3 1 1 1
F.1.1.3 Yes, 3 18 6 1 1 1 1 1 1
F.1.1.4 More than expected 4 0 0
25 2.50
F1 Continue to TQM will improve more Fin performance? F.1.2.1 No, it will not be improved 1 1 1 1
F.1.2.2 No, it will became worse 2 2 1 1
F.1.2.3 Yes, it will be improved 3 21 7 1 1 1 1 1 1 1
F.1.2.4 Yes, it will be improved more than expected 4 4 1 1
28 2.80
F1 Improved to better face economic crisis F.1.3.1 No, it didn't improved 1 2 2 1 1
F.1.3.2 No, it became worse 2
F.1.3.3 Yer, it was improved 3 24 8 1 1 1 1 1 1 1 1
F.1.3.4 Yes, More than expected 4 0 0
26 2.60 Total Value for Financial Performance 2.63

APPENDIX C – Qualitative Survey’s Results
[C-3]
o Table 3: Cumulative Interview Results (All Data)
Variable Rate
Quality Tools 1.50
Organizational Culture 1.60
Processes 1.50
Organizational Performance (appraisal) 1.60
TQM 1.55
Financial Performance 2.63

APPENDIX C – Qualitative Survey’s Results
[C-4]
o Table 4: Quality Survey's Results per Group
CD
Theme Codes W R S W R S W R S
Interview Code
Medium
1 9 1
0 7
Small
2 8 5
Micro
6 3 4
Number of employees
70
100
100
189
30
36 3
3 7 7
11
Theme Code Response
A1 Training in Tools & methods (TQM techniques)
A.1.1 No, just maintain ISO
1 3 3 1 1 1 1 2 2 1 1 1 1 1 1
A.1.2 Satisfy ISO
and look for TQM
2 0 0 2 2 1 1 2 4 2 1 1 C B A
A.1.3 Yes, look for
TQM 3 3 1 1 3 0 0 3 0 0 L M S
Tools & Tech.
6 4 4 3 5 3
1.50
1.33
1.67
A2 Use Processes in improving quality and performance
A.2.1 No, just maintain ISO
1 3 3 1 1 1 1 0 0 1 3 3 1 1 1
A.2.2 More that ISO
needs, but less than TQM
2 0 0 2 6 3 1 1 1 2 0 0
A.2.3 Yes, look for
TQM 3 3 1 1 3 0 0 3 0 0
Processes
6 6 3 1.
2.
1.

APPENDIX C – Qualitative Survey’s Results
[C-5]
CD
Theme Codes W R S W R S W R S
50
00
00
B1 Cooperation and Teamwork
B.1.1 Meet ISO needs mainly 1 3 3 1 1 1 1 0 0 1 1 1 1
B.1.2 Meet ISO
needs and works towards TQM
2 0 0 2 6 3 1 1 1 2 4 2 1 1
B.1.3 Meet TQM
standards 3 3 1 1 3 0 0 3 0 0
6 6 5
1.50
2.00
1.67
B2 Innovation & Creativity
B.2.1 Meet ISO needs mainly
1 3 3 1 1 1 1 0 0 1 3 3 1 1 1
B.2.2 Meet ISO
needs and works towards TQM
2 2 1 1 2 6 3 1 1 1 2 0 0
B.2.3 Meet TQM
standards 3 0 0 3 0 0 3 0 0
5 6 3
1.25
2.00
1.00
B3 Continues improvement
B.3.1 Up to ISO level
1 2 2 1 1 1 0 0 1 2 2 1 1
B.3.2 Meet ISO
standards and more
2 2 1 1 2 6 3 1 1 1 2 2 1 1
B.3.3 Meet TQM
standards 3 3 1 1 3 0 0 3 0 0
7 6 4
1.75
2.00
1.33
Culture 6 6 4 1.
2.
1.
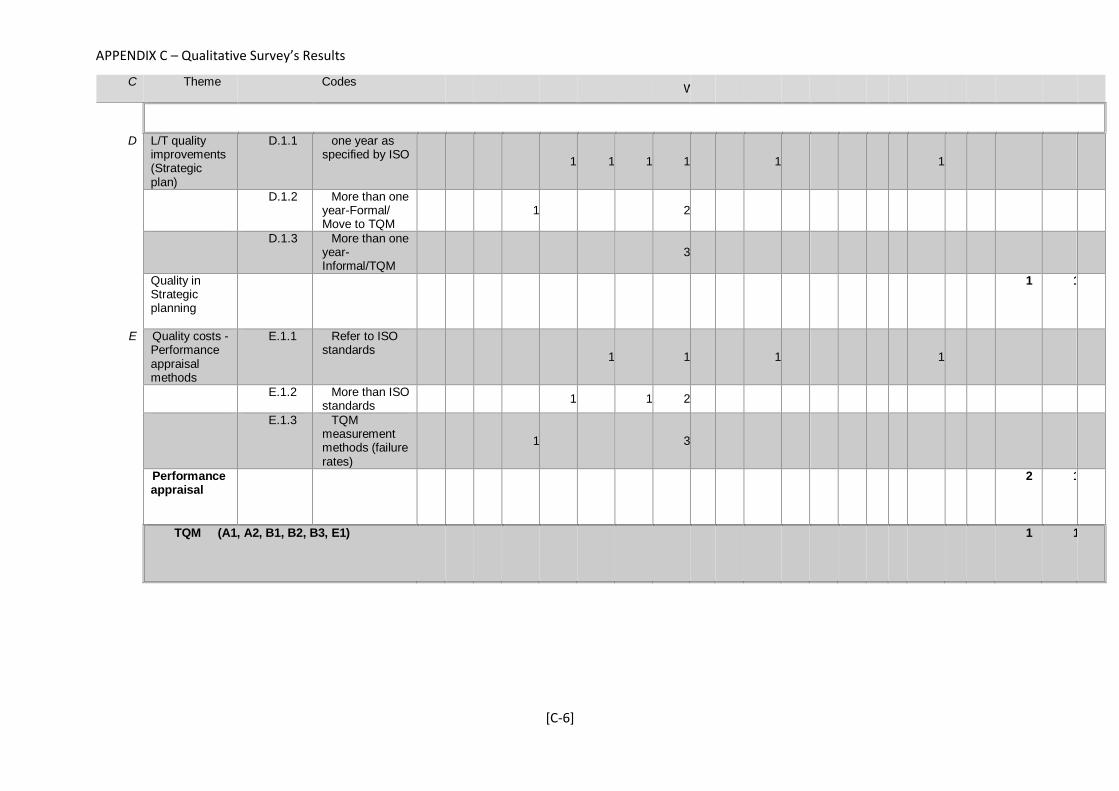
APPENDIX C – Qualitative Survey’s Results
[C-6]
CD
Theme Codes W R S W R S W R S
50
00
33
D1 L/T quality improvements (Strategic plan)
D.1.1 one year as specified by ISO
1 3 3 1 1 1 1 3 3 1 1 1 1 3 3 1 1 1
D.1.2 More than one
year-Formal/ Move to TQM
2 2 1 1 2 0 0 2 0 0
D.1.3 More than one
year-Informal/TQM
3 0 0 3 0 0 3 0 0
Quality in Strategic planning
5 3 3
1.25
1.00
1.00
E1 Quality costs - Performance appraisal methods
E.1.1 Refer to ISO standards
1 1 1 1 1 1 1 1 1 3 3 1 1 1
E.1.2 More than ISO
standards 2 4 2 1 1 2 4 2 1 1 2 0 0
E.1.3 TQM
measurement methods (failure rates)
3 3 1 1 3 0 0 3 0 0
Performance appraisal
8 5 3
2.00
1.67
1.00
TQM (A1, A2, B1, B2, B3, E1)
1.63
1.75
1.25

APPENDIX C – Qualitative Survey’s Results
[C-7]
o Table 5: TQM results per Group (Continue)
Medium Small Micro
Theme Response Results Per Group
A1 Training in Tools & methods (TQM techniques) A.1.1 No, just maintain ISO
A.1.2 Satisfy ISO and look for TQM A.1.3 Yes, look for TQM
Tools & Techniques 1.50 1.33 1.67
A2 Use Processes in improving quality and performance A.2.1 No, just maintain ISO
A.2.2 More that ISO needs, but less than TQM
A.2.3 Yes, look for TQM
Processes 1.50 2.00 1.00
B1 Cooperation and Teamwork B.1.1 Meet ISO needs mainly
B.1.2 Meet ISO needs and works towards TQM
B.1.3 Meet TQM standards
1.50 2.00 1.67
B2 Innovation & Creativity B.2.1 Meet ISO needs mainly
B.2.2 Meet ISO needs and works towards TQM
B.2.3 Meet TQM standards
1.25 2.00 1.00
B3 Continues improvement B.3.1 Up to ISO level
B.3.2 Meet ISO standards and more
B.3.3 Meet TQM standards
1.75 2.00 1.33
Culture 1.50 2.00 1.33
D1 L/T quality improvements (Strategic plan) D.1.1 one year as specified by ISO
D.1.2 More than one year-Formal/ Move to TQM
D.1.3 More than one year-Informal/TQM
Quality in Strategic planning 1.25 1.00 1.00
E1 Quality costs - Performance appraisal methods E.1.1 Refer to ISO standards
E.1.2 More than ISO standards
E.1.3 TQM measurement methods (failure rates)
Performance appraisal 2.00 1.67 1.00 TQM (A1, A2, B1, B2, B3, E1) 1.63 1.75 1.25

APPENDIX C – Qualitative Survey’s Results
[C-8]
o Table 6: Cumulative TQM Results per Group
QT: Quality Tools and Techniques OC: Organizational culture PR: Quality Processes PA: Performance Appraisal
TQM RESULTS QTT OC PR PA TQM
GROUP A (Micro) 1.67 1.33 1.00 1.00 1.25
GROUP B (Small) 1.33 2.00 2.00 1.67 1.75
GROUP C (Medium) 1.50 1.50 1.50 2.00 1.63

APPENDIX C – Qualitative Survey’s Results
[C-9]
o Table 7: Financial Performance Results - Interviews
F.1.1.1 NO, 1 0 1 1 0 0 0 0 F.1.1.2 Kind of …. 2 0 0 0 0 6 3 1 1 1 F.1.1.3 Yes, 3 9 3 1 1 1 9 3 1 1 1 0 0 F.1.1.4 More than expected 4 0 0 0 0 0 0 9 9 6 2.25 3.00 2.00
F.1.2.1 No, it will not be improved 1 1 1 1 0 0 0 0
F.1.2.2 No, it will became worse 2 0 0 0 0 2 1 1 F.1.2.3 Yes, it will be improved 3 9 3 1 1 1 9 3 1 1 1 3 1 1
F.1.2.4 Yes, it will be improved more than expected 4 0 0 0 0 4 1 1
10 9 9 2.50 3.00 3.00 F.1.3.1 No, it didn't improved 1 1 1 1 0 0 1 1 1 F.1.3.2 No, it became worse 2 0 0 0 0 0 F.1.3.3 Yer, it was improved 3 9 3 1 1 1 9 3 1 1 1 6 2 1 1 F.1.3.4 Yes, More than expected 4 0 0 0 0 0 0 10 9 7 2.50 3.00 2.33
The total value can be from 0 to 6 for a single company 2.42 3.00 2.44
Medium Small Micro
ISO improves Fin performance 2.25 3.00 2.00
TQM will improve it further 2.50 3.00 3.00
With TQM face crisis better 2.50 3.00 2.33
Financial Performance 2.42 3.00 2.44 3 1 2
Below the perception of the interview participants regarding the SMEs financial performance, is shown.

Appendix D Quantitative survey Data
Collected
Summary: Appendix D includes the data collected/ downloaded from e-teacher
software where the participants completed the Questionnaire.

Appendix D - Quantitative Survey/ Questionnaire results/Original
Questinnaire No.
A1 A2 A3 A4 A5 A6 A7 Β1 Β2 Β3 Β4 Β5 Β6 Β7 Β8 Β9
1 5 4 3 1 3 3 3 4 5 5 4 4 5 5 5 52 4 4 3 1 4 4 3 4 5 5 5 4 5 5 5 53 4 3 4 3 3 3 4 4 4 5 5 5 5 4 4 54 5 4 3 1 3 3 3 4 5 5 5 4 5 5 5 55 3 5 4 3 3 4 4 4 4 3 3 4 4 4 5 46 3 2 1 1 3 2 4 4 4 4 5 4 4 5 5 37 3 3 2 1 3 3 3 4 4 4 3 5 4 4 4 38 3 4 1 2 4 3 2 3 4 4 4 5 5 5 5 49 5 4 2 1 3 3 3 3 5 5 5 2 4 4 4 510 5 5 3 4 3 4 3 4 4 3 5 2 5 5 5 511 5 3 4 3 5 4 4 4 4 4 5 4 5 5 5 512 5 4 4 4 3 2 4 4 4 4 5 2 4 5 5 513 5 5 5 3 3 3 4 5 4 4 5 2 5 4 5 514 4 5 5 3 2 5 3 5 5 5 3 5 5 5 5 515 4 5 1 1 3 2 3 4 5 3 4 5 5 4 4 316 4 4 1 1 3 2 2 4 4 3 3 2 4 4 5 517 3 3 2 3 3 3 3 3 4 4 4 5 4 4 4 318 4 3 3 1 4 4 4 5 5 4 5 5 5 4 5 519 4 4 2 1 4 4 2 4 4 5 4 5 4 4 4 320 4 2 1 4 3 4 3 4 5 3 4 4 4 5 4 321 2 2 1 2 3 3 4 4 4 5 5 4 5 5 4 522 2 2 4 2 3 3 4 3 5 3 3 3 4 4 5 423 3 3 3 3 3 4 4 4 4 3 3 3 4 4 4 424 5 2 2 1 3 2 2 5 5 5 5 4 5 5 5 525 5 2 4 4 5 5 4 5 5 5 4 5 5 5 5 526 5 3 3 1 5 5 4 5 4 5 3 3 5 4 5 527 5 3 2 2 3 2 4 4 4 5 5 3 5 4 5 528 3 3 2 1 2 2 3 4 4 5 5 3 5 4 4 529 4 3 1 4 5 2 3 4 5 5 4 4 4 4 5 330 3 3 3 4 4 4 4 3 4 5 4 3 5 4 5 531 2 3 3 1 4 4 4 3 5 3 3 4 5 5 4 432 3 3 2 1 5 3 4 4 5 5 4 4 5 4 5 533 3 2 1 2 5 3 4 4 4 5 4 4 5 4 5 534 3 2 4 2 5 3 4 4 4 5 4 5 5 5 5 535 3 4 2 1 5 3 3 5 4 5 4 5 4 4 5 536 3 4 2 4 5 3 4 5 5 5 5 4 5 5 5 5
D1

Appendix D - Quantitative Survey/ Questionnaire results/Original
Questinnaire No.
A1 A2 A3 A4 A5 A6 A7 Β1 Β2 Β3 Β4 Β5 Β6 Β7 Β8 Β9
37 5 4 3 4 4 3 4 5 5 5 5 5 4 4 5 538 1 4 3 1 3 4 1 4 4 2 3 3 5 4 4 439 1 3 1 1 1 1 1 4 5 4 4 3 4 5 5 540 3 3 1 1 1 2 1 4 5 4 4 2 5 5 4 541 4 3 ,2 2 1 1 2 5 5 4 5 2 5 5 4 542 3 5 3 3 2 3 2 5 4 2 5 4 4 4 4 543 4 4 3 2 2 2 2 4 4 4 4 5 5 4 5 444 4 2 2 2 3 4 3 3 4 2 3 5 5 3 5 545 3 2 2 3 3 4 2 5 5 2 5 5 5 3 4 546 4 3 3 1 4 4 3 5 4 2 5 5 5 4 3 547 4 5 2 1 3 3 1 4 4 3 4 4 5 4 4 548 4 3 3 2 2 2 2 4 5 2 4 4 5 4 3 549 4 3 3 2 2 2 2 4 5 4 5 4 4 5 3 450 3 3 2 2 3 1 2 4 3 5 5 5 5 4 5 551 4 3 2 2 3 2 2 4 4 3 4 3 4 4 5 552 4 4 3 1 5 2 3 4 4 4 4 5 5 4 4 553 4 4 3 1 4 2 3 3 4 3 2 3 5 4 4 554 3 4 2 3 4 3 3 5 4 5 3 3 5 5 5 455 4 5 3 1 4 1 3 4 4 5 5 5 5 5 5 556 3 4 4 3 3 4 1 4 3 5 5 3 5 5 5 557 3 5 4 4 3 4 4 4 4 5 5 5 5 5 4 558 4 4 1 1 3 2 4 5 5 4 5 4 4 4 3 559 4 3 2 1 4 1 4 5 5 4 4 4 4 4 3 560 4 3 3 2 4 1 2 4 5 4 4 5 5 4 4 461 4 3 3 2 3 2 3 4 4 3 4 5 4 3 5 562 1 5 4 2 3 3 4 5 4 3 4 3 5 3 5 463 1 5 1 3 3 4 5 5 4 5 3 2 5 3 5 564 3 5 1 4 1 4 1 4 5 5 3 2 4 4 4 565 3 5 1 1 3 4 4 4 4 5 4 3 5 5 5 566 4 5 4 2 2 1 2 5 3 4 4 3 4 4 4 567 3 4 1 1 3 1 1 4 3 4 4 3 4 4 4 568 3 4 3 1 3 1 2 4 3 4 3 3 4 4 5 469 3 4 4 1 3 2 1 3 4 4 3 3 5 4 4 570 1 4 1 1 4 2 1 2 4 4 5 2 5 5 4 571 4 5 2 1 2 2 2 2 1 3 2 2 3 3 4 472 4 5 3 2 5 1 2 2 4 3 2 2 3 5 4 373 3 5 3 1 2 3 2 4 1 3 2 2 3 5 4 5
D2

Appendix D - Quantitative Survey/ Questionnaire results/Original
Questinnaire No.
A1 A2 A3 A4 A5 A6 A7 Β1 Β2 Β3 Β4 Β5 Β6 Β7 Β8 Β9
74 3 5 4 3 2 3 1 5 4 4 5 4 5 3 4 475 4 4 2 4 2 1 2 2 5 5 3 4 4 3 5 476 4 1 1 1 1 4 1 2 5 5 4 5 1 5 5 577 3 2 3 1 1 1 1 2 1 1 2 4 1 1 3 478 5 3 4 2 3 4 3 5 4 4 5 4 5 5 5 579 4 3 1 1 2 2 1 5 5 4 5 4 4 4 5 580 5 5 3 1 1 8 4 5 4 4 5 4 4 5 3 581 5 4 3 1 3 5 4 5 4 5 3 4 5 5 4 582 3 2 4 2 2 3 5 2 5 1 2 5 5 1 4 583 4 2 4 2 2 8 5 5 5 1 5 5 5 5 4 584 1 2 1 2 2 1 5 4 5 1 5 3 4 5 5 485 5 2 3 2 4 4 4 4 4 4 5 4 4 4 4 586 5 3 4 3 5 4 5 5 4 4 5 5 5 4 4 587 3 3 4 4 3 3 3 4 4 4 4 3 4 4 4 588 4 3 2 3 5 4 5 4 4 4 4 3 4 4 5 589 3 4 3 3 3 1 4 4 4 2 5 3 4 4 5 490 3 5 1 2 3 3 4 4 4 4 4 3 4 5 4 491 4 2 3 2 2 8 5 5 4 4 5 5 4 5 5 492 5 2 2 2 2 5 5 3 4 2 5 4 5 4 4 593 1 4 3 2 3 1 5 2 2 2 4 4 5 4 4 594 4 2 2 2 2 2 1 2 2 2 3 3 4 4 4 395 3 2 4 1 1 3 1 2 4 4 3 4 4 4 4 396 4 2 3 1 2 1 1 3 4 4 3 4 4 5 5 397 5 3 3 1 2 5 1 3 5 4 5 5 5 5 4 598 4 3 3 3 4 4 4 5 4 4 4 5 5 4 5 599 1 3 4 1 3 1 5 5 5 4 4 5 5 5 5 5100 1 3 3 2 3 1 5 5 5 5 4 5 4 4 5 5101 3 3 2 4 3 3 3 4 5 5 4 5 5 5 5 4102 3 4 1 1 3 4 3 5 5 1 5 4 5 5 5 5103 4 4 1 2 3 1 3 4 4 2 5 3 4 5 4 5104 5 3 3 4 5 5 4 4 5 4 4 3 5 4 5 5105 1 2 1 1 1 1 1 4 5 4 4 3 5 5 5 5106 1 3 1 1 1 1 1 4 5 4 4 3 5 5 5 5107 4 3 2 1 4 4 2 5 4 2 5 3 5 4 5 5108 4 3 2 2 4 4 3 4 4 2 4 3 4 4 3 5109 4 4 3 2 3 2 3 4 5 3 5 3 4 5 3 5110 3 4 3 3 3 2 2 4 4 3 5 3 4 5 4 4
D3

Appendix D - Quantitative Survey/ Questionnaire results/Original
Questinnaire No.
A1 A2 A3 A4 A5 A6 A7 Β1 Β2 Β3 Β4 Β5 Β6 Β7 Β8 Β9
111 3 3 3 2 4 4 2 4 4 2 5 3 5 4 4 5112 4 3 3 2 4 1 2 5 4 3 4 3 5 4 5 5113 4 3 3 1 4 4 3 5 4 2 5 5 5 4 3 5114 4 3 2 2 2 4 1 3 4 1 4 5 4 5 4 5115 3 3 4 3 3 4 3 5 5 2 5 5 5 5 5 5116 3 3 4 1 3 2 1 4 5 3 5 5 5 4 3 5117 3 3 4 1 3 2 2 4 3 2 4 3 4 4 3 5118 4 4 2 2 3 2 2 4 4 3 4 3 4 4 5 5119 4 4 2 2 4 4 1 4 3 3 4 3 5 4 3 5120 4 5 1 2 4 4 4 5 4 3 4 5 5 5 4 4121 5 3 2 3 4 3 3 5 5 3 5 5 4 5 5 5122 4 3 3 1 4 4 3 4 4 5 5 5 5 5 5 5123 4 3 1 1 5 3 1 4 4 5 5 5 5 5 5 5124 5 3 1 4 5 3 1 2 3 5 5 5 5 5 5 4125 5 3 1 4 3 5 2 4 3 4 4 5 5 4 4 5126 5 3 2 3 4 4 2 5 4 4 2 5 4 4 4 5127 3 4 4 3 4 4 3 5 5 2 5 3 4 4 5 5128 4 2 2 4 2 2 1 4 5 5 2 3 5 5 5 5129 3 2 2 2 4 2 4 3 4 5 4 3 4 5 4 5130 3 2 3 2 4 4 1 3 5 4 5 3 5 5 4 4131 3 2 1 4 4 1 1 4 4 4 5 3 4 5 4 5132 3 2 1 1 3 4 4 4 4 5 4 3 5 5 5 5133 4 3 2 1 3 1 3 4 4 4 5 5 4 5 3 5134 3 3 1 1 3 1 1 4 3 4 4 3 4 4 4 5135 5 3 2 1 4 2 4 3 4 5 4 3 4 4 3 5136 5 3 3 2 4 3 2 4 4 3 5 3 3 3 4 4137 5 3 3 3 2 3 2 5 3 3 2 3 3 3 5 4138 4 4 2 1 2 2 2 2 1 3 2 2 3 3 4 4139 4 4 3 3 4 2 3 4 4 1 4 2 4 3 5 5140 4 4 4 3 3 3 3 2 3 4 5 2 1 4 4 5141 3 4 4 4 3 4 3 2 3 4 5 2 1 5 4 4142 3 3 2 2 3 5 1 3 5 4 4 3 5 5 4 4143 4 3 2 4 3 4 1 4 5 4 5 2 5 5 5 5144 3 4 3 1 1 1 1 4 1 1 2 1 4 1 3 4145 5 4 4 2 3 4 3 5 4 4 5 4 5 5 5 5146 4 4 1 1 2 2 1 5 5 4 5 4 4 4 5 5147 4 4 1 3 4 4 4 4 4 4 3 1 4 1 4 5
D4

Appendix D - Quantitative Survey/ Questionnaire results/Original
Questinnaire No.
A1 A2 A3 A4 A5 A6 A7 Β1 Β2 Β3 Β4 Β5 Β6 Β7 Β8 Β9
148 5 4 4 2 2 4 5 5 1 4 5 1 5 1 4 5149 5 2 3 2 1 2 5 3 1 3 4 4 5 4 4 5150 5 3 3 3 4 2 3 4 5 4 4 4 4 5 4 5151 4 3 2 3 3 4 4 4 3 4 5 4 5 4 4 5152 5 3 3 2 4 4 4 4 4 4 5 4 4 4 4 5153 5 4 4 3 5 4 5 5 4 4 5 5 5 4 4 5154 3 4 4 4 3 3 3 4 4 4 4 4 5 4 4 5155 5 4 4 3 3 4 1 5 5 3 3 4 5 5 5 5156 4 4 4 4 3 4 4 4 3 5 3 4 5 5 5 5157 3 3 4 2 4 2 2 4 2 4 3 4 4 4 4 5158 3 3 2 2 4 3 3 2 3 4 4 3 5 5 5 5159 5 3 2 3 5 3 3 4 5 5 2 5 5 4 5 5160 4 3 1 1 5 4 4 4 4 3 4 3 5 4 4 5161 4 4 2 2 2 2 1 2 2 2 3 3 4 4 4 3162 4 4 1 1 2 4 3 5 4 4 5 1 4 5 5 3163 3 4 2 4 4 4 3 5 4 5 5 3 4 4 5 3164 4 4 3 1 3 5 4 4 3 4 4 3 5 4 5 3165 4 4 3 2 4 4 4 5 4 4 4 5 5 4 5 5166 4 3 3 3 4 4 2 4 5 4 2 3 1 4 4 5167 5 3 2 3 3 5 2 4 5 4 5 3 2 5 4 5168 5 3 1 1 3 5 3 4 3 4 5 4 5 5 5 3169 3 4 1 1 3 4 3 5 5 4 5 4 5 5 5 5170 3 4 3 1 4 4 4 5 4 5 4 4 4 4 4 4171 5 4 3 4 5 5 4 4 5 4 4 3 5 4 5 5172 4 3 4 1 5 4 4 4 4 4 4 3 4 5 5 5173 5 3 2 2 5 4 3 5 3 4 4 3 5 5 5 5174 5 3 2 3 1 4 3 5 4 4 3 3 5 4 5 5175 3 4 4 3 3 2 3 5 4 4 2 3 4 5 5 3176 4 4 3 3 2 3 3 5 4 4 5 5 5 5 5 5177 1 1 1 1 1 2 2 4 1 3 5 1 5 4 4 4178 1 5 1 1 1 1 1 4 5 4 4 3 5 5 5 5
179 4 4 2 2 2 2 3 3 3 3 4 2 4 4 5 4180 4 4 2 2 2 1 2 3 3 4 3 3 4 5 4 3181 4 3 1 1 3 3 1 4 4 4 3 3 5 5 5 5182 3 5 1 1 2 3 2 5 4 4 4 4 5 4 5 5183 4 4 1 2 4 2 3 4 4 3 4 3 4 4 4 5184 3 4 3 1 2 2 3 3 4 2 5 3 3 5 4 5
D5
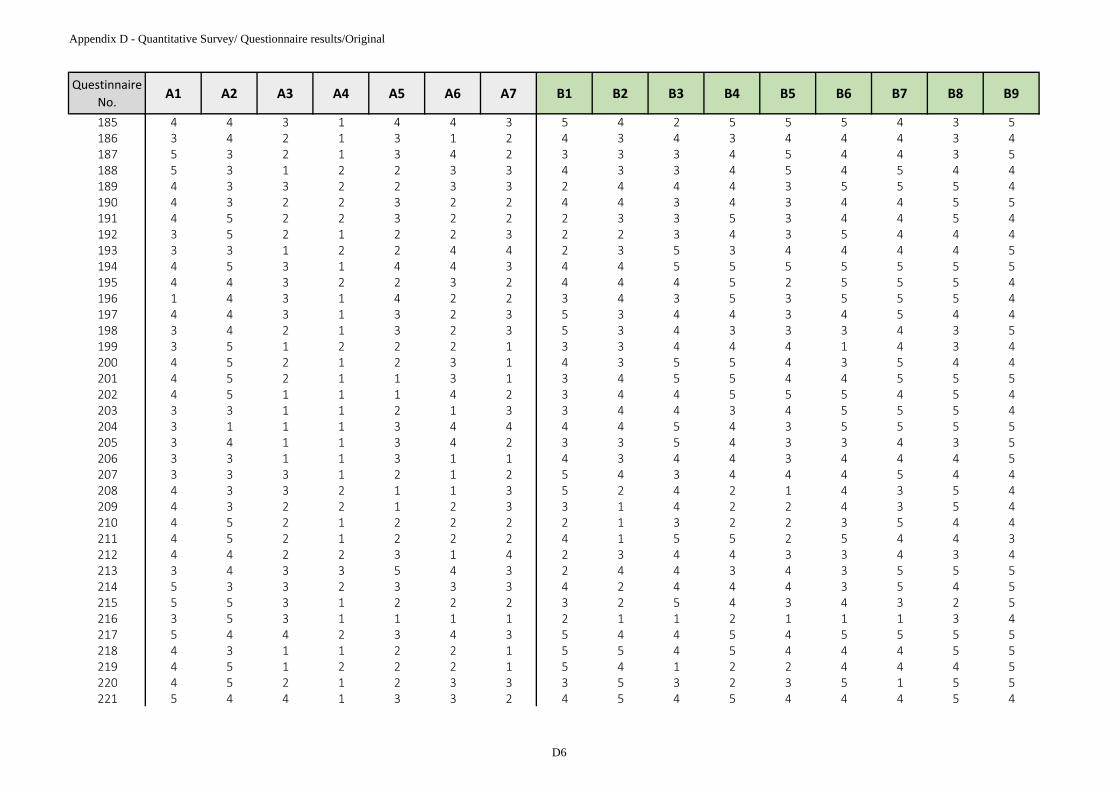
Appendix D - Quantitative Survey/ Questionnaire results/Original
Questinnaire No.
A1 A2 A3 A4 A5 A6 A7 Β1 Β2 Β3 Β4 Β5 Β6 Β7 Β8 Β9
185 4 4 3 1 4 4 3 5 4 2 5 5 5 4 3 5186 3 4 2 1 3 1 2 4 3 4 3 4 4 4 3 4187 5 3 2 1 3 4 2 3 3 3 4 5 4 4 3 5188 5 3 1 2 2 3 3 4 3 3 4 5 4 5 4 4189 4 3 3 2 2 3 3 2 4 4 4 3 5 5 5 4190 4 3 2 2 3 2 2 4 4 3 4 3 4 4 5 5191 4 5 2 2 3 2 2 2 3 3 5 3 4 4 5 4192 3 5 2 1 2 2 3 2 2 3 4 3 5 4 4 4193 3 3 1 2 2 4 4 2 3 5 3 4 4 4 4 5194 4 5 3 1 4 4 3 4 4 5 5 5 5 5 5 5195 4 4 3 2 2 3 2 4 4 4 5 2 5 5 5 4196 1 4 3 1 4 2 2 3 4 3 5 3 5 5 5 4197 4 4 3 1 3 2 3 5 3 4 4 3 4 5 4 4198 3 4 2 1 3 2 3 5 3 4 3 3 3 4 3 5199 3 5 1 2 2 2 1 3 3 4 4 4 1 4 3 4200 4 5 2 1 2 3 1 4 3 5 5 4 3 5 4 4201 4 5 2 1 1 3 1 3 4 5 5 4 4 5 5 5202 4 5 1 1 1 4 2 3 4 4 5 5 5 4 5 4203 3 3 1 1 2 1 3 3 4 4 3 4 5 5 5 4204 3 1 1 1 3 4 4 4 4 5 4 3 5 5 5 5205 3 4 1 1 3 4 2 3 3 5 4 3 3 4 3 5206 3 3 1 1 3 1 1 4 3 4 4 3 4 4 4 5207 3 3 3 1 2 1 2 5 4 3 4 4 4 5 4 4208 4 3 3 2 1 1 3 5 2 4 2 1 4 3 5 4209 4 3 2 2 1 2 3 3 1 4 2 2 4 3 5 4210 4 5 2 1 2 2 2 2 1 3 2 2 3 5 4 4211 4 5 2 1 2 2 2 4 1 5 5 2 5 4 4 3212 4 4 2 2 3 1 4 2 3 4 4 3 3 4 3 4213 3 4 3 3 5 4 3 2 4 4 3 4 3 5 5 5214 5 3 3 2 3 3 3 4 2 4 4 4 3 5 4 5215 5 5 3 1 2 2 2 3 2 5 4 3 4 3 2 5216 3 5 3 1 1 1 1 2 1 1 2 1 1 1 3 4217 5 4 4 2 3 4 3 5 4 4 5 4 5 5 5 5218 4 3 1 1 2 2 1 5 5 4 5 4 4 4 5 5219 4 5 1 2 2 2 1 5 4 1 2 2 4 4 4 5220 4 5 2 1 2 3 3 3 5 3 2 3 5 1 5 5221 5 4 4 1 3 3 2 4 5 4 5 4 4 4 5 4
D6

Appendix D - Quantitative Survey/ Questionnaire results/Original
Questinnaire No.
A1 A2 A3 A4 A5 A6 A7 Β1 Β2 Β3 Β4 Β5 Β6 Β7 Β8 Β9
222 5 3 4 2 3 2 3 3 4 4 5 4 4 5 5 4223 3 3 2 2 2 1 3 3 3 5 4 4 5 4 4 5224 3 2 3 2 4 4 4 4 4 4 5 4 4 4 4 5225 5 5 4 3 5 4 5 5 4 4 5 5 5 4 4 5226 3 4 4 4 3 3 3 2 4 3 3 4 4 5 4 5227 3 5 4 1 4 2 5 4 4 5 3 3 5 5 4 4228 4 5 2 2 4 3 2 3 3 5 4 3 5 4 4 4229 5 5 2 3 5 4 3 3 5 5 4 4 5 4 5 5230 3 5 1 4 2 2 2 2 5 4 4 4 4 4 5 4231 4 4 3 2 1 1 3 2 4 4 4 4 3 5 5 4232 4 3 2 1 1 2 3 1 3 4 5 3 4 5 5 5233 4 4 2 2 2 2 1 2 2 2 3 3 4 4 4 3234 4 3 1 1 2 2 2 3 2 2 4 5 5 4 4 4235 3 3 3 1 1 2 1 3 3 2 3 5 5 5 5 4236 3 3 3 1 2 1 1 4 4 5 3 3 5 5 4 5237 4 5 3 3 4 4 4 5 4 4 4 5 5 4 5 5238 2 4 3 2 1 4 3 5 4 3 5 4 4 4 5 4239 5 3 2 2 3 4 4 5 4 3 5 4 4 4 5 3240 5 3 2 1 2 2 2 3 5 4 4 3 5 5 4 5241 3 4 1 1 3 4 3 5 5 4 5 4 5 5 5 5242 5 5 1 1 4 5 1 4 4 4 4 4 4 4 5 4243 5 4 3 4 5 5 4 4 5 4 4 3 5 4 5 5244 4 3 3 3 3 2 2 4 4 5 4 4 4 5 3 5245 1 3 3 3 3 1 3 5 5 5 5 3 4 5 4 4246 1 5 3 4 2 3 2 3 5 4 5 3 3 5 4 4247 4 5 4 2 2 2 3 3 4 4 4 3 5 5 4 5248 5 2 2 2 3 3 3 4 3 5 3 4 2 5 5 5249 3 3 2 2 2 1 1 4 3 1 3 3 2 3 4 4250 3 2 2 2 2 1 1 3 3 1 5 4 3 3 4 5251 3 3 2 1 1 1 1 4 5 2 5 4 4 3 3 4252 3 4 3 1 1 3 1 4 4 3 4 3 4 5 4 4253 4 4 3 1 3 4 1 5 4 2 4 4 4 5 3 5254 4 3 3 1 4 2 4 5 4 4 4 4 3 4 5 5255 4 3 3 2 3 5 3 3 3 3 5 3 2 5 5 5256 3 3 2 2 3 2 3 4 3 3 4 4 5 4 5 5257 1 3 1 2 2 4 4 3 4 2 5 3 4 5 4 5258 5 4 1 1 3 1 2 3 5 2 4 3 5 4 5 5
D7

Appendix D - Quantitative Survey/ Questionnaire results/Original
Questinnaire No.
A1 A2 A3 A4 A5 A6 A7 Β1 Β2 Β3 Β4 Β5 Β6 Β7 Β8 Β9
259 5 5 5 1 1 1 4 5 3 4 4 4 5 5 5 5260 1 3 4 1 2 2 2 5 3 5 4 4 5 4 5 4261 5 3 3 2 2 3 3 4 4 4 4 5 3 5 3 4262 1 4 3 2 3 4 3 3 4 4 5 5 5 5 4 5263 3 3 1 1 4 3 3 5 4 5 5 5 5 4 5 5264 5 3 4 4 5 4 5 5 5 5 5 5 5 5 5 5265 5 4 2 1 2 2 2 3 5 4 5 2 5 4 4 5266 4 3 4 2 2 3 1 1 2 3 2 3 5 4 4 4267 4 3 5 1 4 1 1 1 5 5 1 3 4 5 5 5268 4 4 3 2 3 1 2 4 1 5 1 4 5 5 5 5269 5 5 5 3 3 2 3 3 2 4 3 4 4 4 4 5270 3 5 2 2 3 3 3 3 5 4 4 5 5 3 5 4271 4 3 2 1 3 2 3 4 4 5 5 3 5 4 5 5272 4 2 1 1 4 1 5 5 5 5 5 5 5 5 5 5273 3 4 2 1 2 2 2 5 3 4 5 3 4 4 4 5274 3 4 4 5 1 5 1 4 4 3 4 4 5 5 5 5275 5 3 5 1 4 4 3 5 5 3 4 4 5 5 5 5276 3 4 2 1 2 2 2 2 3 3 3 3 4 3 4 4277 5 3 5 5 4 4 4 5 5 5 5 4 5 5 5 5278 4 2 1 1 2 1 1 4 4 5 3 5 4 5 5 5279 5 2 1 1 3 1 2 4 5 5 4 4 5 4 4 4280 5 3 4 5 5 3 4 4 5 5 5 5 5 5 5 5281 3 4 2 1 4 3 3 4 5 4 4 3 4 4 5 5282 5 3 1 5 5 4 2 5 5 4 4 5 4 5 4 5283 4 3 4 2 2 3 3 4 3 4 4 4 4 5 5 4284 5 3 3 1 3 3 3 5 5 5 5 4 5 5 4 5285 5 4 3 1 3 2 3 3 4 5 5 3 5 4 5 4286 5 4 2 3 4 2 5 5 5 5 5 5 5 5 5 5287 4 3 2 3 2 2 3 3 4 3 3 4 5 4 5 3288 4 4 2 2 3 4 5 3 4 4 4 5 5 4 4 4289 5 5 4 1 4 3 3 5 4 4 4 5 5 5 4 5290 3 5 2 4 5 2 3 3 3 3 3 3 4 4 4 5291 3 3 1 1 5 5 5 3 4 5 5 5 5 5 5 5292 3 3 1 4 4 3 3 4 4 5 5 4 5 4 5 5293 3 3 1 1 3 3 4 4 5 3 3 4 4 5 5 5294 4 3 1 2 2 2 5 3 5 3 4 4 4 5 5 4295 5 3 3 2 5 1 4 5 4 4 5 3 5 5 4 4
D8

Appendix D - Quantitative Survey/ Questionnaire results/Original
Questinnaire No.
A1 A2 A3 A4 A5 A6 A7 Β1 Β2 Β3 Β4 Β5 Β6 Β7 Β8 Β9
296 3 3 2 2 5 3 5 5 3 3 5 3 5 4 4 5297 3 3 1 1 4 3 1 3 3 3 4 3 5 5 5 5298 3 4 1 1 4 1 3 4 4 5 4 3 3 4 5 5299 2 2 3 3 3 3 3 4 3 3 4 3 3 4 5 5300 3 1 2 1 4 3 3 5 4 3 4 4 4 4 5 5301 3 1 2 1 2 3 3 4 4 4 3 3 3 3 4 4302 5 3 5 5 5 3 4 4 5 4 4 5 5 4 5 5303 4 3 1 2 1 1 2 3 2 5 2 3 3 4 2 5304 4 2 3 3 4 4 3 4 4 5 4 4 4 4 5 5305 3 1 2 2 2 1 1 1 3 3 3 4 4 4 5 5306 2 1 1 1 3 3 3 3 3 3 4 3 3 4 5 5307 5 3 5 3 5 3 5 5 5 4 4 5 5 4 5 5308 4 3 3 3 4 4 3 5 4 4 5 4 5 5 4 5309 3 4 2 1 3 2 2 3 3 4 4 3 4 4 4 5310 4 4 3 2 5 5 4 4 4 3 4 4 4 4 5 5311 3 5 3 1 3 4 3 4 4 4 4 4 4 4 4 5312 4 3 4 1 3 1 2 5 4 4 4 3 4 5 4 4313 3 4 2 2 3 2 3 2 3 3 3 3 5 4 4 4314 5 3 5 1 3 2 3 4 5 4 3 4 5 5 5 5315 4 3 3 1 3 5 3 3 4 3 4 4 5 4 5 5316 3 4 3 2 4 4 4 4 4 4 4 4 5 4 5 5317 4 4 4 3 5 4 4 4 4 5 4 4 5 5 5 5318 3 5 4 1 4 5 5 5 5 5 5 5 5 4 4 5319 3 4 3 2 4 4 4 4 4 4 5 4 5 4 5 5320 4 4 3 1 4 4 4 4 5 4 4 4 4 5 4 5321 5 5 4 3 5 5 5 4 4 5 4 4 5 5 4 5322 5 4 4 1 5 4 5 5 5 5 5 5 5 5 5 5323 5 4 2 3 4 5 4 5 4 4 5 5 4 4 5 5324 4 5 4 4 3 3 5 4 4 4 4 4 5 5 4 5325 3 5 4 5 4 5 5 5 4 5 5 5 5 5 4 5326 4 5 4 4 3 3 4 4 5 5 4 5 5 5 5 5327 4 4 3 5 4 4 4 4 5 4 4 5 5 5 4 5328 3 5 4 3 5 3 4 4 4 5 5 4 5 5 5 4329 4 4 2 1 4 3 4 4 4 4 4 4 4 5 5 5330 4 4 2 4 5 4 5 4 4 4 4 4 4 5 4 5331 4 4 3 2 5 4 4 5 4 5 5 4 5 4 5 5332 3 5 2 5 4 3 4 4 5 5 5 5 5 5 5 5
D9

Appendix D - Quantitative Survey/ Questionnaire results/Original
Questinnaire No.
A1 A2 A3 A4 A5 A6 A7 Β1 Β2 Β3 Β4 Β5 Β6 Β7 Β8 Β9
333 4 4 3 5 5 4 4 4 4 4 4 5 4 4 5 4334 4 5 4 3 5 4 4 5 5 4 4 4 5 5 4 5335 3 5 3 3 3 3 4 5 4 4 5 5 4 5 5 5336 4 4 4 1 4 4 5 4 4 5 4 4 5 4 5 5337 5 4 4 1 3 3 4 5 4 4 4 4 5 5 5 5338 3 4 4 2 4 4 2 5 4 4 4 4 5 5 5 5339 4 4 3 1 4 1 2 5 5 4 4 4 4 4 5 5340 4 4 5 3 3 3 4 4 4 5 5 4 4 5 4 4341 3 5 3 5 4 1 3 4 5 5 4 4 5 4 4 5342 5 5 5 5 5 4 5 5 5 5 5 5 5 5 4 5343 3 3 1 1 2 1 3 4 4 5 5 4 4 4 5 5344 3 3 1 1 2 3 4 4 4 3 3 4 4 5 3 4345 4 4 2 1 3 4 4 5 5 3 5 4 5 5 5 5346 4 3 3 2 3 4 3 4 5 5 4 5 5 5 5 5347 2 1 1 1 3 2 2 3 3 1 3 3 3 3 4 4348 2 4 2 4 5 2 2 4 4 3 4 4 5 5 5 4349 1 1 1 1 5 4 4 4 3 4 3 3 3 5 4 5350 4 3 3 2 4 1 4 3 4 3 5 4 4 3 5 5351 3 3 4 2 3 1 5 3 4 4 5 5 5 3 4 4352 3 4 4 1 4 4 2 4 5 2 4 4 4 5 5 5353 4 5 2 1 3 3 3 4 3 1 4 4 4 5 4 5354 3 4 1 3 3 3 3 3 3 3 3 3 5 4 4 5355 5 3 2 2 3 3 2 4 4 3 4 4 4 5 5 4356 2 3 1 1 1 1 1 3 3 5 3 4 5 4 4 5357 3 2 2 2 4 4 1 4 4 4 5 3 4 5 4 5358 3 2 2 1 3 4 2 3 4 3 3 2 4 4 4 4359 3 4 4 1 3 1 2 3 4 4 4 2 3 5 5 5360 1 2 3 3 4 3 2 4 3 3 4 4 4 4 4 4361 4 3 3 2 3 4 2 3 3 2 3 3 5 5 5 5362 1 1 1 1 1 1 1 3 4 5 4 4 5 5 5 5363 3 4 1 2 3 4 1 4 2 4 3 3 4 4 5 5364 4 5 2 2 5 5 5 5 5 5 5 5 5 5 5 5365 3 5 1 2 5 4 5 4 2 4 4 5 5 5 4 4366 4 1 3 1 1 4 2 4 2 2 4 3 4 3 3 5367 2 2 4 2 4 4 4 4 4 4 4 4 5 5 5 5368 1 2 1 1 1 1 1 2 1 1 2 3 2 3 4 4369 2 2 2 2 4 4 2 5 2 3 2 4 5 3 3 5
D10

Appendix D - Quantitative Survey/ Questionnaire results/Original
Questinnaire No.
A1 A2 A3 A4 A5 A6 A7 Β1 Β2 Β3 Β4 Β5 Β6 Β7 Β8 Β9
370 4 3 4 2 2 4 4 4 4 4 4 5 5 5 4 5371 5 4 3 4 5 3 3 5 3 5 5 4 5 4 5 5372 5 4 4 4 4 3 1 5 5 5 5 5 5 5 5 5373 4 4 3 3 2 3 4 2 1 2 4 3 5 3 4 5374 4 3 2 4 3 3 3 1 4 1 5 4 4 5 5 5375 4 5 2 1 2 1 1 2 3 2 5 4 5 5 5 5376 3 5 1 4 4 1 4 4 5 1 5 5 5 4 5 5377 3 4 2 3 5 3 3 4 4 3 4 4 4 5 4 4378 3 3 2 2 3 4 2 4 5 5 4 4 5 4 3 5379 3 2 2 1 3 2 1 4 3 2 3 4 4 4 4 5380 4 2 3 1 4 2 2 3 3 2 3 4 5 4 4 5381 5 5 4 1 5 5 5 5 5 5 5 5 5 5 5 5382 5 4 2 1 5 5 4 5 5 5 5 4 5 5 4 5383 4 3 4 2 3 5 1 5 4 5 5 4 5 5 5 4384 5 3 1 1 2 3 2 2 5 3 4 3 5 5 4 5385 3 1 2 1 4 2 4 4 4 3 3 2 5 4 3 5386 3 4 3 1 5 1 2 5 5 4 4 3 4 5 4 4387 4 4 5 3 4 4 4 5 5 4 4 5 5 4 5 5388 5 4 1 1 4 2 4 2 4 3 4 2 5 5 3 5389 4 4 5 1 4 1 4 4 3 4 3 4 4 4 5 5390 3 3 3 3 3 4 2 4 5 5 5 3 5 5 4 4391 4 4 2 1 3 1 1 4 4 4 4 3 4 4 5 5392 4 3 1 1 3 2 2 4 4 4 4 3 4 4 4 4
D11

Appendix D - Quantitative Survey/ Questionnaire results/Original
Questinnaire No.123456789101112131415161718192021222324252627282930313233343536
Β10 Β11 Β12 Β13 Β14 Β15 Β16 D1 D2 D3 D4 D5 D6 D7 D8 D9
5 2 2 4 4 5 3 3 4 4 5 5 3 4 3 45 5 1 5 4 5 4 3 4 5 5 5 3 4 3 43 5 5 4 4 4 4 3 5 3 2 4 4 4 4 55 5 1 4 4 5 3 3 4 4 5 5 3 4 3 45 4 2 5 3 4 3 4 4 5 3 4 4 3 5 45 4 2 5 3 5 3 4 3 4 3 3 4 5 5 45 5 3 4 5 5 3 4 4 4 5 3 3 5 4 42 5 3 4 4 4 1 4 4 4 4 4 2 3 4 54 5 4 2 4 4 2 4 5 5 4 5 3 5 5 54 5 4 3 5 3 3 4 4 5 5 3 4 3 3 43 5 5 5 4 4 1 4 5 5 5 5 4 4 5 53 4 3 4 4 4 4 3 5 3 3 5 4 3 3 54 4 3 5 4 5 5 4 4 3 3 5 3 3 4 34 4 5 5 3 4 5 4 3 3 4 4 3 4 5 34 5 5 4 4 5 3 4 5 5 4 5 2 4 5 33 4 2 4 4 4 1 4 4 3 2 5 4 5 4 43 4 3 3 3 4 3 4 3 3 3 3 3 3 3 35 5 3 5 4 4 3 4 5 5 5 5 4 5 5 53 2 2 5 4 4 3 3 3 4 2 3 4 5 5 45 2 3 4 5 4 3 3 4 4 4 3 4 5 4 53 2 3 3 4 4 4 3 3 3 2 3 2 3 3 45 4 2 4 5 3 4 3 4 4 5 5 3 3 4 52 4 3 4 3 5 4 3 4 4 4 5 2 3 4 43 5 4 4 4 5 3 3 4 5 5 5 4 5 4 45 5 5 5 5 5 5 5 5 5 5 5 5 5 5 55 4 1 5 4 4 4 4 3 5 4 3 5 5 5 44 5 5 4 3 5 4 4 3 5 4 5 5 5 5 54 5 5 4 4 5 5 3 3 3 3 5 5 5 4 54 5 4 4 4 5 3 3 5 5 5 3 4 4 3 54 5 5 4 5 5 4 4 5 4 3 3 4 4 3 44 2 4 5 4 5 4 4 4 3 3 5 4 5 4 45 5 5 3 4 5 4 4 5 5 4 3 4 5 4 55 5 5 3 5 5 4 4 4 4 4 5 3 5 5 45 5 5 4 5 3 4 4 4 3 3 5 2 5 5 43 5 5 5 4 5 5 4 3 4 4 4 4 4 4 44 5 5 3 4 5 4 4 3 3 4 4 4 5 3 4
D12

Appendix D - Quantitative Survey/ Questionnaire results/Original
Questinnaire No.37383940414243444546474849505152535455565758596061626364656667686970717273
Β10 Β11 Β12 Β13 Β14 Β15 Β16 D1 D2 D3 D4 D5 D6 D7 D8 D9
3 5 5 4 4 5 3 3 4 4 4 4 4 4 5 53 4 4 4 3 2 4 2 3 3 3 3 5 5 4 43 4 5 4 5 5 2 2 3 3 3 5 3 5 4 43 4 4 4 4 3 2 3 4 5 3 4 3 5 4 44 3 5 5 4 4 3 3 5 5 3 5 3 3 5 43 5 5 5 2 5 3 3 5 5 4 4 4 4 4 44 5 4 4 2 5 4 3 4 3 4 3 4 4 4 34 4 4 4 4 4 5 3 2 5 4 3 4 5 4 34 5 6 4 4 4 6 3 5 5 4 3 3 5 4 33 5 4 5 4 5 3 3 4 5 4 3 3 4 4 43 5 4 4 5 5 4 4 4 5 4 4 3 4 4 44 5 5 5 5 5 4 3 4 5 3 4 5 5 4 54 4 5 5 4 4 2 3 4 5 3 4 5 5 4 44 4 5 4 4 5 3 3 3 5 3 4 4 3 4 54 4 5 4 4 4 3 3 5 3 4 4 3 3 4 53 4 4 4 4 5 2 3 2 4 4 3 3 4 5 54 5 4 4 5 4 4 3 4 4 4 3 3 3 5 44 3 4 4 4 4 2 3 5 4 4 4 4 5 4 34 5 5 4 5 4 4 3 4 5 4 3 4 4 4 34 4 5 5 4 4 4 3 5 3 4 4 4 3 4 53 5 5 4 4 5 2 3 5 3 4 4 4 4 4 43 5 4 5 5 5 3 3 4 4 4 4 5 4 5 42 4 4 5 5 5 2 3 4 5 4 3 5 5 4 53 5 5 4 4 4 2 3 4 5 3 3 5 3 4 42 3 2 4 4 4 2 4 4 5 3 3 4 4 4 33 5 4 4 4 5 3 4 3 5 3 3 4 4 5 43 4 5 5 4 4 3 3 3 4 3 3 5 3 4 53 3 4 4 4 5 5 3 5 4 3 3 5 5 4 52 5 4 5 4 3 5 4 5 4 4 3 5 4 5 33 4 5 4 5 3 5 3 5 3 4 3 4 2 4 43 4 4 5 4 3 2 3 2 3 3 3 3 4 4 32 3 4 5 3 3 2 4 2 4 4 4 4 4 5 42 5 4 5 5 2 5 3 5 5 4 4 3 5 5 44 5 4 5 3 3 5 3 3 5 4 4 4 3 4 33 3 2 2 3 2 2 3 4 5 4 4 5 5 4 54 4 5 5 3 5 1 3 4 5 3 4 3 4 4 54 5 5 4 5 4 1 3 4 3 3 4 3 2 4 5
D13

Appendix D - Quantitative Survey/ Questionnaire results/Original
Questinnaire No.7475767778798081828384858687888990919293949596979899100101102103104105106107108109110
Β10 Β11 Β12 Β13 Β14 Β15 Β16 D1 D2 D3 D4 D5 D6 D7 D8 D9
3 4 4 4 4 4 4 2 5 3 3 5 5 2 4 43 2 1 2 5 5 4 3 5 4 4 5 4 3 2 34 2 5 4 5 5 4 3 5 4 4 5 4 3 2 41 2 1 2 1 2 1 2 4 3 3 1 2 2 2 14 5 5 4 4 4 4 3 4 4 4 3 4 4 4 33 5 5 4 3 4 2 3 5 5 3 1 2 4 4 31 5 4 4 1 2 2 3 4 5 3 3 2 5 5 33 5 4 5 3 1 4 3 4 3 3 3 4 5 5 34 5 5 2 4 4 4 3 5 3 3 1 5 3 3 21 5 5 2 4 5 1 3 5 5 3 4 3 5 3 11 4 5 5 4 5 4 4 5 4 3 3 3 4 4 14 5 5 5 5 4 4 4 5 4 5 4 5 5 5 44 5 5 5 5 5 4 4 5 5 5 5 5 5 5 54 4 4 5 5 4 4 3 5 4 4 4 5 4 4 14 5 5 5 5 5 4 3 5 4 4 5 5 4 5 22 3 2 4 4 5 3 3 5 5 4 5 4 5 5 32 4 4 4 4 4 3 3 5 4 4 1 3 5 4 43 5 5 4 4 4 1 3 3 4 4 3 4 5 5 54 3 5 5 5 5 4 3 4 4 4 3 3 4 3 44 3 5 5 5 5 4 3 4 5 4 4 3 5 2 52 3 3 1 1 1 1 3 3 3 4 2 1 3 3 34 4 3 4 5 1 4 3 4 4 4 2 1 4 4 34 5 2 5 1 4 3 3 4 5 3 4 4 5 4 33 4 5 4 5 4 2 4 3 5 4 2 5 5 4 14 5 4 4 5 4 4 3 3 4 4 2 1 5 5 23 4 4 5 4 5 1 3 3 5 4 3 5 4 5 22 4 5 4 4 5 5 3 4 5 4 4 5 4 4 13 4 5 4 4 4 5 3 3 5 4 4 3 4 4 24 5 4 5 5 4 3 3 4 5 4 3 4 4 4 21 5 5 5 5 4 3 3 3 5 4 3 4 5 4 33 4 2 4 4 3 5 3 3 4 4 5 4 5 4 35 5 5 4 5 5 5 2 2 3 3 5 5 5 5 43 5 5 4 5 5 5 2 3 3 3 5 5 5 4 44 5 4 4 5 5 4 2 3 3 3 5 5 5 5 44 4 4 4 4 4 4 3 3 3 3 5 5 5 5 44 5 4 5 4 4 4 3 3 5 3 5 3 5 4 43 5 5 5 5 5 4 3 3 5 3 3 3 5 4 4
D14

Appendix D - Quantitative Survey/ Questionnaire results/Original
Questinnaire No.111112113114115116117118119120121122123124125126127128129130131132133134135136137138139140141142143144145146147
Β10 Β11 Β12 Β13 Β14 Β15 Β16 D1 D2 D3 D4 D5 D6 D7 D8 D9
3 5 5 5 5 5 5 3 4 5 4 3 3 5 4 44 5 5 5 4 4 3 3 4 5 4 3 3 5 4 53 5 4 5 4 5 3 3 4 5 4 3 3 4 4 43 5 4 5 4 4 3 3 4 3 4 3 3 4 4 42 4 4 4 4 4 3 3 4 3 4 3 3 4 4 52 4 5 4 5 5 4 3 5 3 4 4 4 4 4 53 5 4 4 4 5 4 3 5 5 3 4 4 4 4 54 4 5 4 4 4 3 3 5 3 4 4 3 3 4 54 5 5 4 4 4 3 3 4 5 4 4 4 3 4 54 4 5 4 4 4 3 3 5 5 4 4 4 3 5 44 5 5 4 5 4 4 3 4 5 4 3 3 4 5 44 5 4 4 5 4 4 4 4 5 3 3 4 4 4 44 5 4 4 5 5 4 4 4 4 4 3 4 3 4 54 5 4 5 4 5 3 4 5 4 4 3 4 3 4 52 5 2 5 5 4 3 4 5 4 4 3 4 3 5 33 5 2 4 4 3 2 3 5 3 5 3 3 4 5 33 3 2 5 4 3 2 3 2 3 5 3 5 5 5 32 3 4 5 3 5 3 2 3 5 3 5 5 5 34 3 4 4 3 4 5 3 5 3 4 3 5 4 4 34 4 5 5 3 5 5 3 4 5 3 4 5 4 4 35 4 5 4 3 5 2 4 5 5 3 4 3 3 4 32 5 4 5 4 3 5 4 5 4 4 3 5 5 4 34 5 4 5 4 4 5 3 5 5 3 4 3 3 4 43 4 4 4 4 3 2 3 2 3 3 3 3 4 4 34 4 4 4 4 4 5 3 5 5 3 4 4 3 4 43 4 5 2 3 4 5 3 4 5 4 3 4 3 4 43 3 2 2 3 2 4 3 4 5 4 3 4 4 5 53 3 2 2 3 2 2 3 5 4 5 1 4 4 5 44 4 2 4 3 2 4 3 5 3 5 1 4 4 5 44 5 1 2 1 2 4 3 4 3 5 3 2 4 5 11 5 4 4 1 2 5 3 5 4 4 3 2 4 5 11 2 2 4 4 4 5 3 4 4 3 3 4 2 5 15 5 1 5 4 5 5 3 5 4 3 3 4 2 5 31 2 1 2 1 2 1 2 4 3 3 1 2 2 2 14 5 5 4 4 4 4 3 4 4 4 3 4 4 4 33 5 5 4 3 4 2 4 5 4 5 4 4 4 5 43 5 5 4 3 4 1 4 5 4 5 5 4 4 5 4
D15
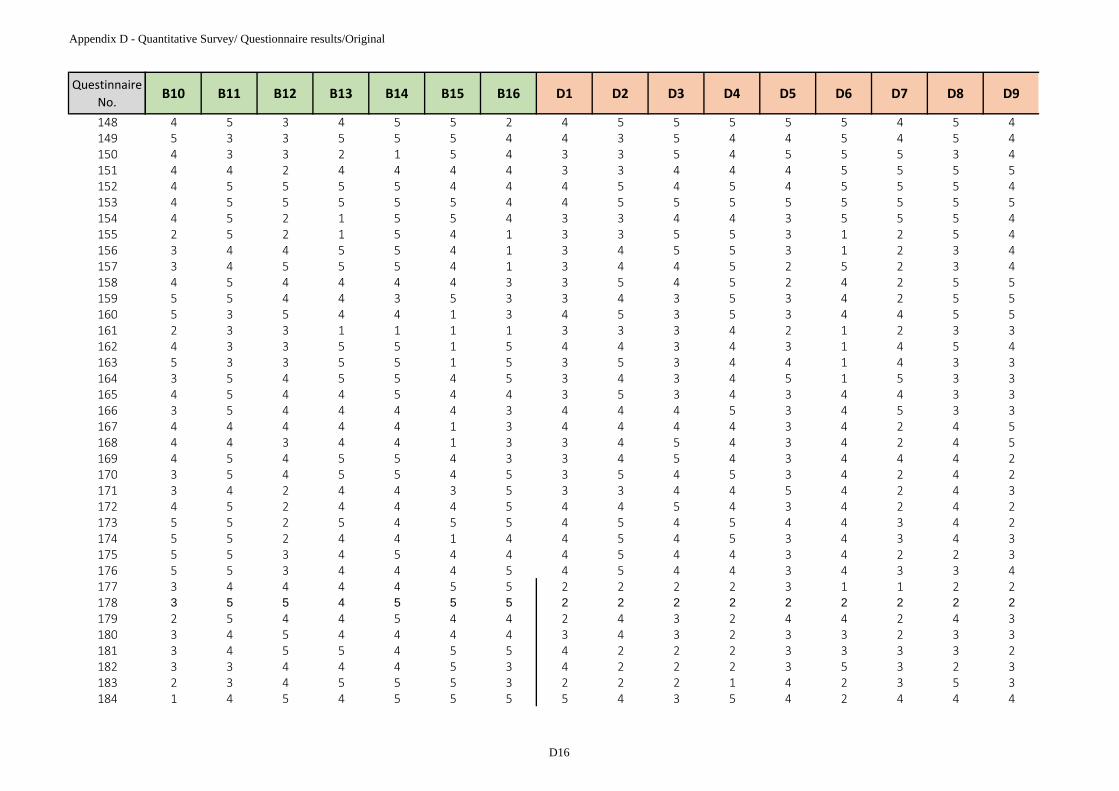
Appendix D - Quantitative Survey/ Questionnaire results/Original
Questinnaire No.148149150151152153154155156157158159160161162163164165166167168169170171172173174175176177178179180181182183184
Β10 Β11 Β12 Β13 Β14 Β15 Β16 D1 D2 D3 D4 D5 D6 D7 D8 D9
4 5 3 4 5 5 2 4 5 5 5 5 5 4 5 45 3 3 5 5 5 4 4 3 5 4 4 5 4 5 44 3 3 2 1 5 4 3 3 5 4 5 5 5 3 44 4 2 4 4 4 4 3 3 4 4 4 5 5 5 54 5 5 5 5 4 4 4 5 4 5 4 5 5 5 44 5 5 5 5 5 4 4 5 5 5 5 5 5 5 54 5 2 1 5 5 4 3 3 4 4 3 5 5 5 42 5 2 1 5 4 1 3 3 5 5 3 1 2 5 43 4 4 5 5 4 1 3 4 5 5 3 1 2 3 43 4 5 5 5 4 1 3 4 4 5 2 5 2 3 44 5 4 4 4 4 3 3 5 4 5 2 4 2 5 55 5 4 4 3 5 3 3 4 3 5 3 4 2 5 55 3 5 4 4 1 3 4 5 3 5 3 4 4 5 52 3 3 1 1 1 1 3 3 3 4 2 1 2 3 34 3 3 5 5 1 5 4 4 3 4 3 1 4 5 45 3 3 5 5 1 5 3 5 3 4 4 1 4 3 33 5 4 5 5 4 5 3 4 3 4 5 1 5 3 34 5 4 4 5 4 4 3 5 3 4 3 4 4 3 33 5 4 4 4 4 3 4 4 4 5 3 4 5 3 34 4 4 4 4 1 3 4 4 4 4 3 4 2 4 54 4 3 4 4 1 3 3 4 5 4 3 4 2 4 54 5 4 5 5 4 3 3 4 5 4 3 4 4 4 23 5 4 5 5 4 5 3 5 4 5 3 4 2 4 23 4 2 4 4 3 5 3 3 4 4 5 4 2 4 34 5 2 4 4 4 5 4 4 5 4 3 4 2 4 25 5 2 5 4 5 5 4 5 4 5 4 4 3 4 25 5 2 4 4 1 4 4 5 4 5 3 4 3 4 35 5 3 4 5 4 4 4 5 4 4 3 4 2 2 35 5 3 4 4 4 5 4 5 4 4 3 4 3 3 43 4 4 4 4 5 5 2 2 2 2 3 1 1 2 23 5 5 4 5 5 5 2 2 2 2 2 2 2 2 2
2 5 4 4 5 4 4 2 4 3 2 4 4 2 4 33 4 5 4 4 4 4 3 4 3 2 3 3 2 3 33 4 5 5 4 5 5 4 2 2 2 3 3 3 3 23 3 4 4 4 5 3 4 2 2 2 3 5 3 2 32 3 4 5 5 5 3 2 2 2 1 4 2 3 5 31 4 5 4 5 5 5 5 4 3 5 4 2 4 4 4
D16

Appendix D - Quantitative Survey/ Questionnaire results/Original
Questinnaire No.185186187188189190191192193194195196197198199200201202203204205206207208209210211212213214215216217218219220221
Β10 Β11 Β12 Β13 Β14 Β15 Β16 D1 D2 D3 D4 D5 D6 D7 D8 D9
3 5 4 5 4 5 3 3 4 3 2 4 4 2 3 24 5 4 4 4 4 4 3 4 2 1 2 4 3 4 23 4 4 3 4 5 1 3 3 2 2 3 4 2 3 23 4 5 4 5 5 2 2 2 3 2 3 4 2 3 32 5 3 5 3 4 1 2 2 3 2 3 3 2 3 44 4 5 4 5 4 3 2 2 2 2 3 3 3 3 33 4 4 5 5 5 4 4 4 2 5 4 5 3 4 43 5 4 4 4 4 3 4 4 3 3 4 4 4 3 31 5 5 4 4 4 5 2 3 4 2 1 4 3 4 34 5 5 4 5 4 4 4 4 4 2 4 4 2 4 42 4 4 5 3 5 4 4 4 4 3 4 3 3 3 43 4 5 5 4 4 5 3 4 3 1 3 3 2 4 23 4 5 5 4 4 3 4 2 3 1 2 3 2 3 24 5 4 4 5 4 2 2 2 2 1 2 4 3 3 34 5 5 4 5 5 2 2 4 2 3 3 4 3 3 32 2 4 5 5 5 3 4 4 3 2 3 3 3 4 43 4 4 4 4 4 5 5 4 3 2 4 4 2 4 33 5 5 5 4 5 4 4 2 2 2 4 5 2 3 44 5 5 5 5 3 4 4 3 3 2 4 1 3 4 32 5 4 5 4 3 5 5 3 2 5 4 3 4 3 43 4 4 4 4 3 4 3 3 1 1 2 1 4 4 43 4 4 4 4 3 2 2 4 2 2 3 4 3 3 32 5 4 4 4 4 5 2 4 4 3 3 2 3 4 33 5 5 5 5 5 1 2 4 2 4 3 1 3 3 53 4 5 5 5 2 4 5 4 2 2 3 3 2 3 43 3 2 2 3 2 2 4 5 3 2 3 3 4 3 32 3 2 2 3 5 5 4 3 4 3 4 3 3 4 14 3 2 2 3 5 5 3 3 4 2 1 4 2 4 13 5 4 4 4 4 5 4 3 3 3 2 4 5 3 33 4 5 5 5 4 3 4 4 3 2 3 3 3 3 43 4 5 5 5 5 3 4 4 2 1 2 5 1 3 31 2 1 2 1 2 1 1 2 1 1 5 1 2 3 24 5 5 4 4 4 4 3 3 3 3 3 3 3 3 43 5 5 4 3 4 2 1 2 1 1 5 1 4 4 41 2 4 4 1 4 3 1 2 1 3 2 2 2 4 22 3 1 5 1 5 2 4 4 3 2 3 3 2 3 23 5 1 5 4 2 5 5 3 3 2 4 3 3 3 2
D17

Appendix D - Quantitative Survey/ Questionnaire results/Original
Questinnaire No.222223224225226227228229230231232233234235236237238239240241242243244245246247248249250251252253254255256257258
Β10 Β11 Β12 Β13 Β14 Β15 Β16 D1 D2 D3 D4 D5 D6 D7 D8 D9
2 4 4 4 5 2 5 3 3 4 4 4 1 3 4 34 4 5 5 5 4 5 3 3 3 3 4 3 2 3 34 5 5 5 5 4 4 4 4 4 4 4 4 4 4 44 5 5 5 5 5 4 4 4 3 4 4 5 3 3 53 4 5 4 4 5 4 4 4 1 3 3 4 2 4 43 5 5 2 5 5 4 4 4 4 4 3 2 4 4 52 3 5 3 5 4 4 5 3 1 2 2 5 4 3 53 2 4 4 4 4 4 2 3 3 2 1 5 5 2 34 2 4 5 5 5 5 1 4 5 2 1 3 4 2 44 4 5 5 1 5 3 3 3 1 1 4 4 1 1 13 5 5 4 5 5 2 3 4 3 3 3 3 5 1 22 3 5 1 1 1 1 1 3 3 1 1 2 4 3 32 5 3 1 4 1 4 3 4 3 4 4 4 4 4 34 5 5 4 5 4 3 4 2 3 4 2 1 4 3 23 4 4 5 5 4 5 4 2 4 4 3 3 5 4 24 5 4 4 5 4 4 4 2 4 3 2 5 5 3 34 4 4 4 4 5 4 2 2 3 3 3 2 3 3 34 5 4 4 4 5 3 2 4 1 2 3 2 3 3 23 5 4 5 1 3 5 2 2 2 2 4 3 4 4 44 5 4 5 5 4 4 3 3 1 5 4 5 5 4 32 4 5 4 4 4 5 2 2 3 2 4 1 4 4 43 4 2 4 4 3 5 3 2 4 3 3 5 1 3 43 4 2 4 4 3 3 3 3 1 4 2 3 2 3 14 5 5 5 5 3 5 3 3 1 3 3 5 3 1 34 5 4 4 5 4 5 4 3 3 3 3 4 3 4 23 4 5 5 5 5 1 3 4 3 1 4 2 4 3 23 4 3 5 3 1 1 3 2 4 3 1 3 5 3 41 4 3 1 2 1 1 1 2 1 1 1 2 2 1 11 5 3 1 2 5 5 2 2 5 4 4 2 2 1 42 5 4 4 2 4 2 1 4 5 3 3 3 3 4 22 4 5 5 3 3 3 1 3 1 2 3 3 1 2 34 4 3 3 4 2 2 2 2 1 5 4 4 5 4 24 4 3 3 4 4 5 2 4 4 1 3 4 2 2 33 5 4 3 4 5 2 1 3 3 3 4 3 3 2 22 4 5 4 4 4 2 1 4 4 4 5 4 5 2 22 5 4 4 4 4 5 2 1 3 4 4 4 5 4 34 5 5 5 5 5 4 3 2 2 4 4 4 4 2 4
D18

Appendix D - Quantitative Survey/ Questionnaire results/Original
Questinnaire No.259260261262263264265266267268269270271272273274275276277278279280281282283284285286287288289290291292293294295
Β10 Β11 Β12 Β13 Β14 Β15 Β16 D1 D2 D3 D4 D5 D6 D7 D8 D9
5 5 5 4 5 4 1 1 1 5 4 5 5 3 1 34 4 5 4 4 4 1 3 3 2 4 1 3 3 3 35 5 4 5 5 5 4 3 4 2 3 5 5 3 1 43 4 5 5 5 3 5 1 3 3 2 3 5 4 2 34 5 4 4 4 5 3 2 2 3 4 4 4 3 3 24 5 5 5 5 5 4 4 3 4 4 4 5 4 4 44 4 4 4 4 5 5 4 4 4 3 5 5 4 1 34 5 5 5 3 4 3 3 1 4 4 5 1 3 1 44 5 3 5 2 3 3 1 5 3 4 5 3 4 2 45 5 2 4 1 1 5 2 3 3 5 2 4 3 2 33 4 2 4 5 4 5 2 4 2 4 3 4 5 3 33 5 5 5 5 5 4 2 3 4 4 3 4 3 1 23 4 2 3 4 4 3 2 3 1 2 4 3 5 3 41 5 5 5 5 5 1 1 1 1 3 5 5 3 5 53 4 3 3 5 4 4 3 1 4 2 4 3 4 3 24 4 4 4 4 4 4 4 4 1 4 3 3 2 3 22 5 4 4 4 5 3 4 1 1 3 3 5 3 3 32 4 2 3 3 3 1 2 3 2 2 5 2 5 2 34 5 5 5 5 5 4 3 4 3 5 5 5 5 4 52 4 4 4 4 5 5 3 4 3 2 4 5 5 2 42 5 5 5 5 3 4 3 3 1 3 3 3 3 4 54 5 5 5 5 5 4 4 5 4 4 4 4 5 4 54 5 4 3 3 3 3 3 4 3 3 3 3 3 3 34 5 5 5 4 4 3 2 1 1 4 5 4 3 2 33 5 5 3 3 3 2 5 2 2 3 4 3 4 1 44 5 3 4 5 5 4 3 1 1 3 4 4 4 1 24 4 5 5 4 5 5 4 3 1 2 4 5 5 3 33 5 4 4 4 5 4 4 1 1 3 5 5 5 5 44 4 5 4 5 5 4 3 2 2 1 5 5 5 3 43 5 3 4 5 4 4 3 2 3 4 5 3 4 4 23 5 4 5 4 3 3 4 3 4 3 2 4 3 4 33 5 3 3 3 4 3 1 1 2 2 3 3 4 3 44 4 3 3 5 3 2 4 4 1 5 4 5 4 5 54 4 3 5 3 3 2 4 4 1 2 3 4 4 4 44 4 5 3 4 4 5 3 4 2 2 4 4 3 3 55 5 4 3 5 3 1 3 4 3 3 5 3 3 5 52 5 2 4 5 5 1 2 4 2 4 5 4 2 1 4
D19

Appendix D - Quantitative Survey/ Questionnaire results/Original
Questinnaire No.296297298299300301302303304305306307308309310311312313314315316317318319320321322323324325326327328329330331332
Β10 Β11 Β12 Β13 Β14 Β15 Β16 D1 D2 D3 D4 D5 D6 D7 D8 D9
3 4 1 5 5 5 5 2 1 1 5 5 3 1 2 45 4 5 3 3 3 3 3 4 1 2 2 3 5 4 35 4 3 5 4 4 2 3 3 3 3 3 3 3 3 34 5 4 3 3 5 2 4 4 2 3 3 2 3 4 41 5 5 3 3 3 1 4 1 1 3 4 4 2 3 32 5 4 5 4 3 2 4 1 1 1 4 4 4 1 34 5 5 5 4 5 2 1 2 3 4 4 3 5 5 44 4 1 2 3 3 2 1 2 3 4 4 4 3 3 24 4 5 4 4 5 3 2 2 3 3 3 3 3 3 33 4 3 4 3 4 1 5 2 1 1 1 3 3 4 33 4 4 4 4 4 4 4 4 3 4 5 4 5 4 44 5 4 4 4 5 3 3 3 2 5 5 3 5 5 34 5 4 4 4 5 4 3 3 3 3 4 4 4 3 33 5 5 4 4 5 2 1 1 3 2 4 4 2 2 44 4 4 4 4 5 3 4 2 1 4 5 4 5 2 44 5 4 4 4 4 4 4 2 2 2 4 5 3 3 43 4 5 4 2 4 3 1 2 4 3 4 4 3 1 33 4 4 3 3 3 1 2 3 2 1 3 4 3 2 23 5 4 3 3 5 3 1 4 1 2 3 5 3 2 23 5 4 5 4 4 3 5 2 2 5 5 5 5 2 44 5 5 4 4 4 5 4 3 3 4 3 4 4 3 44 5 5 5 4 4 5 4 2 3 4 3 4 5 2 35 5 4 5 5 5 4 3 3 2 5 4 5 2 3 44 5 5 4 4 4 5 4 3 3 4 3 4 4 5 44 4 5 4 4 4 4 5 3 2 4 3 4 2 4 45 5 4 5 5 5 4 4 2 2 5 4 4 2 2 31 5 2 5 5 5 4 3 3 3 4 4 4 5 3 44 5 2 4 5 5 4 4 3 3 4 4 4 5 3 43 5 4 5 4 5 5 3 3 2 4 5 5 5 3 33 5 5 5 5 3 3 5 4 3 5 5 5 2 5 53 5 3 4 4 4 4 3 3 3 4 4 4 4 4 45 4 3 4 4 3 3 5 4 3 4 4 4 2 4 53 5 5 5 5 4 4 3 3 1 3 4 4 4 5 44 5 5 4 4 4 3 3 4 4 3 4 4 4 4 34 5 4 5 4 4 3 4 4 4 4 4 5 4 3 31 4 3 5 5 4 3 4 3 3 5 4 4 2 3 45 5 5 5 5 5 4 3 3 4 5 3 4 5 4 4
D20

Appendix D - Quantitative Survey/ Questionnaire results/Original
Questinnaire No.333334335336337338339340341342343344345346347348349350351352353354355356357358359360361362363364365366367368369
Β10 Β11 Β12 Β13 Β14 Β15 Β16 D1 D2 D3 D4 D5 D6 D7 D8 D9
3 5 5 4 4 3 5 4 4 3 4 4 4 2 5 33 5 5 4 5 4 4 5 2 2 4 3 4 4 4 34 5 4 5 5 5 3 4 3 4 3 4 5 4 4 21 4 4 4 4 4 3 4 2 3 4 3 4 2 3 31 4 4 4 3 5 3 3 2 4 4 3 4 2 4 23 4 5 4 3 5 3 4 3 3 3 3 4 4 5 23 4 3 4 4 4 2 3 2 4 4 4 5 5 4 33 3 3 5 4 4 2 3 4 3 4 4 4 5 4 44 5 4 4 4 5 4 5 4 2 5 5 4 4 4 44 5 4 4 5 5 4 5 4 4 5 5 5 4 4 44 4 3 4 4 3 1 5 4 3 5 5 4 4 3 42 4 3 4 4 4 3 3 3 4 3 2 4 3 4 43 5 5 4 4 4 4 4 4 1 5 5 4 5 5 43 5 4 4 4 3 2 2 4 3 3 4 4 3 3 43 4 3 3 2 3 3 1 1 1 1 1 2 2 2 23 5 3 4 2 3 2 4 1 3 3 1 4 3 2 23 4 4 3 4 4 2 3 4 2 3 2 2 2 5 34 5 4 4 3 4 2 4 3 1 3 4 4 3 3 33 5 3 4 5 5 4 4 1 1 1 3 4 4 4 21 4 4 4 4 4 3 3 4 3 2 4 5 4 4 41 4 5 3 3 5 3 3 3 4 4 1 4 3 5 13 5 4 4 2 5 4 4 3 5 3 2 5 2 3 33 4 3 3 3 5 2 5 4 3 2 1 5 2 4 33 3 3 3 3 5 3 5 3 2 2 4 3 5 5 44 3 3 3 4 5 2 4 3 4 3 3 3 5 3 41 4 4 4 3 3 2 4 2 1 4 3 3 2 3 33 4 4 4 4 4 3 4 3 3 4 4 3 5 2 43 4 4 3 3 5 4 3 1 2 3 4 4 2 3 34 4 4 3 4 3 4 5 2 3 3 4 5 3 4 35 4 3 4 3 3 3 5 3 2 3 3 4 4 4 23 4 4 3 4 4 4 1 4 2 4 3 5 4 3 45 5 4 5 5 5 5 5 5 3 4 4 3 3 3 34 5 4 5 5 4 5 4 3 1 3 4 5 3 3 13 3 3 3 2 1 3 2 1 1 1 3 2 1 2 14 5 4 4 4 4 4 3 3 3 3 3 3 4 3 41 4 2 3 5 1 3 4 4 3 1 3 2 1 5 53 3 2 5 2 4 4 5 3 1 3 4 2 1 2 4
D21

Appendix D - Quantitative Survey/ Questionnaire results/Original
Questinnaire No.370371372373374375376377378379380381382383384385386387388389390391392
Β10 Β11 Β12 Β13 Β14 Β15 Β16 D1 D2 D3 D4 D5 D6 D7 D8 D9
3 4 3 3 3 3 2 5 3 2 4 4 4 2 4 53 5 5 5 4 4 3 3 3 4 4 5 5 5 5 41 5 5 5 5 5 3 2 2 3 5 5 5 3 5 41 5 5 3 5 3 1 4 3 2 5 3 4 4 5 43 4 4 5 4 5 3 5 1 3 3 5 5 3 2 31 5 5 2 4 5 1 1 1 1 3 5 4 5 5 43 3 5 5 4 4 4 5 4 3 4 5 2 5 2 31 5 3 2 5 4 3 5 4 2 3 5 4 5 4 22 5 5 5 4 3 4 3 4 1 4 5 5 5 2 43 4 3 3 3 3 2 3 3 1 3 4 5 4 4 42 4 5 3 3 3 2 4 3 2 3 3 4 3 5 32 5 4 4 5 5 4 3 3 2 4 5 5 4 3 43 5 5 5 5 5 2 4 3 2 4 4 3 3 2 31 5 4 4 5 4 2 4 3 2 2 4 3 4 4 32 5 5 5 5 4 1 4 3 3 3 5 4 5 3 54 4 5 4 3 3 4 1 2 2 2 3 4 2 2 42 5 4 4 5 5 3 5 2 3 3 4 4 2 3 52 4 4 5 4 5 3 4 2 3 4 4 3 5 3 44 4 5 5 4 3 4 4 3 2 4 4 4 5 3 43 5 5 5 3 4 3 3 2 3 1 3 3 4 2 32 4 4 4 4 5 4 3 1 1 3 4 4 3 5 22 4 4 3 2 3 1 2 1 1 1 4 3 1 2 23 4 2 4 4 4 3 1 1 1 3 3 3 1 3 3
D22

Appendix D - Quantitative Survey/ Questionnaire results/Original
Questinnaire No.123456789101112131415161718192021222324252627282930313233343536
E1 E2 E3 E4 E5 E6 E7 E8 No. EmplyeesQuestinnaire
No. ACID AS_TURN D_E INV_TURN3 3 3 2 4 4 4 3 38 1 1.22 0.91 8.03 3.375 4 4 3 4 4 4 3 7 2 0.47 1.29 11.15 3.005 5 4 1 4 4 4 4 55 3 1.29 1.48 0.63 9.133 3 3 2 3 4 5 5 70 4 1.02 0.79 1.52 3.285 5 5 4 3 5 5 4 38 5 3.66 0.42 0.06 58.264 4 4 4 5 4 5 4 9 6 0.48 0.88 3.28 4.925 4 4 4 4 4 4 4 91 7 1.04 0.60 6.53 97.743 4 5 2 5 5 4 5 40 8 1.06 0.34 12.26 58.263 5 3 3 2 5 4 5 10 9 0.47 0.62 0.53 2.704 4 4 2 2 4 4 4 6 10 1.28 1.40 3.06 75.195 5 5 4 4 4 4 4 6 11 1.31 1.26 3.15 4.145 5 4 1 4 4 4 5 75 12 1.01 1.36 3.78 21.503 4 4 4 4 5 4 5 85 13 1.39 0.49 1.58 2.233 3 4 5 2 5 4 5 25 14 0.82 1.52 6.56 4.613 3 3 4 2 5 5 5 55 15 1.22 1.24 2.57 34.514 4 4 5 4 4 5 4 45 16 2.85 1.29 0.21 2.193 3 4 3 5 4 4 5 94 17 0.96 1.04 1.34 37.224 4 4 4 4 4 4 4 53 18 0.86 1.26 5.41 8.204 4 5 3 5 4 4 5 100 19 1.74 2.06 1.17 58.264 5 5 1 5 4 4 5 6 20 0.82 0.58 1.65 0.894 4 4 1 5 4 5 4 82 21 0.30 0.67 0.53 1.794 4 5 4 5 4 5 3 9 22 1.47 1.10 0.67 6.403 5 5 3 5 2 4 1 83 23 0.52 0.76 4.01 1.194 4 3 2 4 4 4 3 18 24 1.35 0.75 1.09 20.665 5 5 4 4 4 5 4 4 25 0.81 1.42 2.16 1.474 4 4 4 2 5 5 3 13 26 1.61 0.31 0.53 1.734 4 4 4 2 4 5 3 10 27 0.75 1.15 5.07 2.913 4 4 3 2 3 5 3 100 28 0.96 2.02 3.10 12.404 5 5 3 3 4 4 4 16 29 1.01 0.96 0.65 4.925 4 3 2 3 4 4 5 103 30 1.34 1.60 3.83 3.834 4 4 3 4 5 4 4 72 31 1.49 3.64 1.23 9.794 5 5 4 2 3 5 4 14 32 1.38 0.85 1.92 7.315 4 3 4 4 4 5 4 30 33 1.77 0.68 0.69 13.883 4 4 4 5 5 5 5 10 34 1.07 1.30 5.25 25.394 4 5 3 4 4 4 5 11 35 0.52 0.19 1.05 0.424 4 4 3 4 5 4 4 102 36 0.94 0.33 7.08 1.30
200
D23

Appendix D - Quantitative Survey/ Questionnaire results/Original
Questinnaire No.37383940414243444546474849505152535455565758596061626364656667686970717273
E1 E2 E3 E4 E5 E6 E7 E8 No. EmplyeesQuestinnaire
No. ACID AS_TURN D_E INV_TURN5 4 4 4 4 4 5 3 100 37 1.37 1.26 0.61 3.274 5 5 4 2 4 4 4 90 38 2.19 0.46 0.23 2.554 4 5 5 4 5 5 4 50 39 0.52 1.18 1.04 2.554 4 5 4 4 5 5 4 160 40 3.56 1.66 0.32 8.105 4 5 4 4 5 5 3 74 41 1.50 1.13 0.46 4.025 4 5 5 3 5 5 3 10 42 1.73 0.81 0.96 23.044 4 5 4 3 5 4 4 35 43 1.86 0.96 0.42 2.055 4 4 1 4 4 4 3 10 44 0.85 0.44 0.42 78.604 4 5 5 2 5 5 4 75 45 1.26 1.82 3.50 58.263 4 4 1 2 5 4 3 14 46 1.14 0.98 2.31 18.553 5 5 4 3 5 5 4 70 47 2.45 1.62 0.48 6.865 4 4 5 5 5 5 3 24 48 5.77 0.95 0.14 58.264 4 4 5 4 5 5 3 18 49 0.87 0.84 3.65 5.433 4 5 4 5 4 5 3 9 50 1.29 0.24 1.99 2.774 5 5 5 4 5 5 4 24 51 2.10 1.23 0.11 13.815 5 4 4 5 4 4 4 1 52 1.77 0.93 0.57 2.645 5 5 4 5 5 5 4 37 53 0.93 1.27 2.45 8.685 4 5 4 5 5 4 4 192 54 1.54 0.42 0.12 0.735 5 5 4 4 5 5 4 32 55 1.06 1.27 0.71 13.923 4 5 4 4 5 4 4 9 56 5.04 1.23 0.24 73.935 4 4 5 5 5 5 4 10 57 1.33 0.52 1.92 3.194 4 4 5 2 4 5 4 70 58 2.64 1.33 0.47 29.014 4 5 3 2 5 5 4 10 59 2.79 0.94 0.39 4.234 4 5 3 3 4 5 4 50 60 0.69 2.07 2.83 3.565 5 5 4 2 5 5 1 4 61 1.58 2.37 1.79 58.263 4 5 5 4 4 4 3 21 62 2.50 1.98 0.54 6.934 4 5 5 5 5 5 3 9 63 3.17 1.14 0.21 16.674 4 5 4 5 4 5 4 77 64 0.12 0.41 0.44 0.475 4 4 3 2 5 5 3 12 65 0.58 0.62 2.27 1.295 4 4 4 4 4 4 4 95 66 1.13 0.43 0.37 1.703 4 4 3 3 4 5 3 32 67 0.87 0.04 0.13 0.343 4 5 4 5 4 5 4 8 68 1.51 0.56 0.79 58.264 4 5 4 2 4 5 4 190 69 7.19 1.44 0.08 37.584 4 4 5 3 5 5 3 5 70 1.59 1.09 0.64 6.675 5 4 4 4 4 5 4 16 71 1.34 0.24 1.33 0.785 4 5 5 5 4 5 4 6 72 0.67 0.35 0.29 33.485 4 5 5 5 4 5 4 14 73 2.82 1.42 0.30 36.34
D24

Appendix D - Quantitative Survey/ Questionnaire results/Original
Questinnaire No.7475767778798081828384858687888990919293949596979899100101102103104105106107108109110
E1 E2 E3 E4 E5 E6 E7 E8 No. EmplyeesQuestinnaire
No. ACID AS_TURN D_E INV_TURN5 4 5 2 4 4 5 4 9 74 1.11 1.63 5.08 67.874 4 5 2 5 4 5 4 34 75 2.84 1.60 0.94 8.144 4 4 4 4 4 4 4 2 76 1.68 1.26 0.92 18.194 4 4 4 4 5 5 5 97 77 0.84 1.84 1.65 4.025 5 5 5 4 4 5 4 10 78 1.45 0.92 0.32 2.914 4 4 4 4 2 5 4 9 79 1.14 0.85 4.70 162.494 5 4 5 4 4 5 5 90 80 1.08 1.19 1.96 5.994 5 5 5 4 5 5 4 9 81 2.68 0.91 0.27 34.384 4 5 4 4 4 5 4 7 82 0.73 1.01 1.31 8.584 4 4 4 4 5 5 4 18 83 3.13 1.04 0.47 6.383 4 4 5 4 2 5 3 10 84 2.61 0.53 0.95 58.264 4 4 4 4 5 5 5 50 85 0.64 0.00 0.29 0.324 5 5 4 4 2 5 4 25 86 2.15 1.04 0.54 37.813 4 4 4 4 4 5 3 80 87 1.50 1.45 1.29 16.475 4 4 2 4 5 5 4 60 88 2.04 0.36 0.23 88.604 4 4 2 4 5 5 5 60 89 1.63 0.45 0.36 22.034 4 5 2 4 4 5 4 40 90 0.69 1.62 7.91 41.174 4 5 4 4 5 5 4 10 91 3.13 0.93 0.45 9.984 5 4 5 4 2 5 4 50 92 1.08 0.89 0.64 2.724 4 5 5 4 5 5 5 20 93 0.85 0.40 0.43 10.864 4 4 2 4 4 5 4 5 94 1.58 1.08 1.37 2.754 4 4 5 4 4 5 5 20 95 1.15 1.21 1.56 9.684 4 4 3 4 4 5 3 100 96 2.38 0.64 0.34 58.264 5 4 3 4 4 5 5 46 97 0.87 0.98 2.55 4.014 4 4 3 4 4 5 5 29 98 0.64 0.34 0.23 1.474 4 4 4 4 4 5 5 1 99 0.84 0.86 0.55 2.004 4 4 3 4 4 5 5 25 100 4.21 0.76 0.17 2.774 4 4 5 4 4 5 4 12 101 1.14 1.68 2.32 58.264 4 5 3 4 4 5 3 9 102 2.27 1.32 0.69 8.184 4 4 4 4 4 5 4 10 103 1.41 1.28 1.49 15.954 4 4 3 4 4 5 4 26 104 0.80 1.49 19.30 4.704 4 4 5 4 4 4 4 7 105 1.41 1.20 1.19 11.154 4 5 5 4 5 4 4 8 106 3.80 1.02 0.20 58.264 4 4 5 4 5 4 5 25 107 1.24 0.52 0.41 39.324 4 4 5 4 5 4 5 135 108 1.22 0.85 0.58 132.083 4 5 1 4 5 4 5 40 1093 4 5 5 2, 5 4 5 1 110 0.81 2.41 8.63 98.56
D25
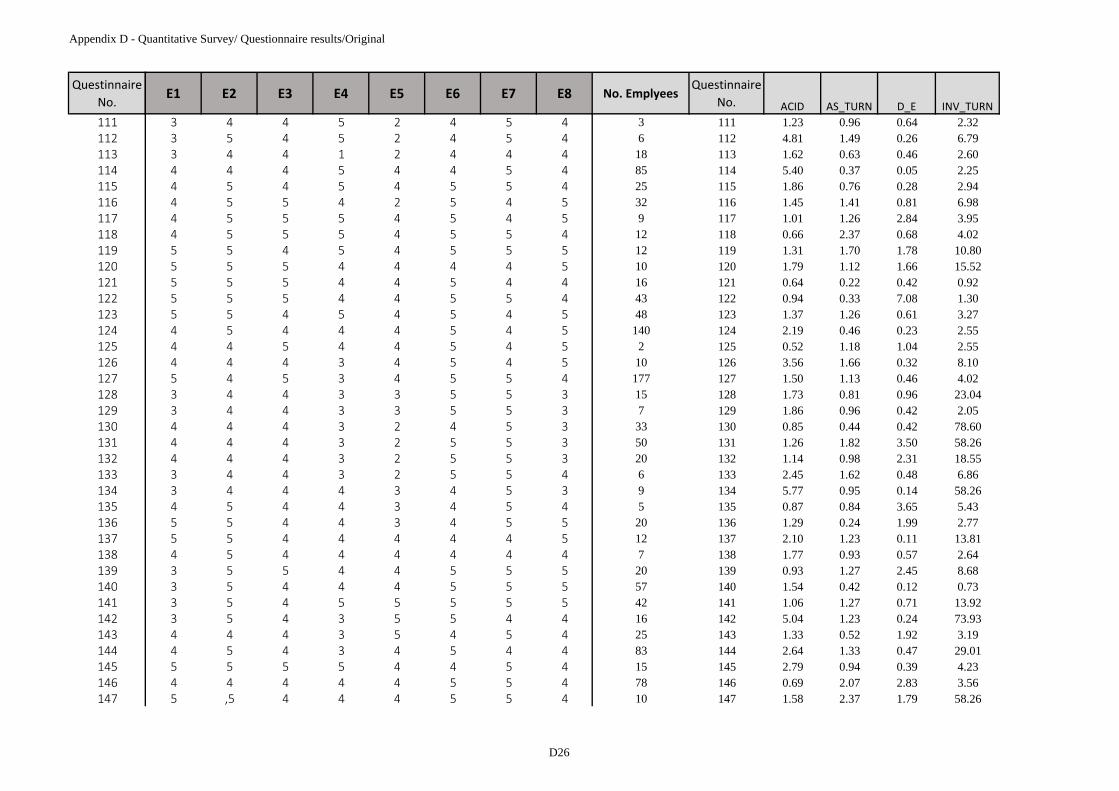
Appendix D - Quantitative Survey/ Questionnaire results/Original
Questinnaire No.111112113114115116117118119120121122123124125126127128129130131132133134135136137138139140141142143144145146147
E1 E2 E3 E4 E5 E6 E7 E8 No. EmplyeesQuestinnaire
No. ACID AS_TURN D_E INV_TURN3 4 4 5 2 4 5 4 3 111 1.23 0.96 0.64 2.323 5 4 5 2 4 5 4 6 112 4.81 1.49 0.26 6.793 4 4 1 2 4 4 4 18 113 1.62 0.63 0.46 2.604 4 4 5 4 4 5 4 85 114 5.40 0.37 0.05 2.254 5 4 5 4 5 5 4 25 115 1.86 0.76 0.28 2.944 5 5 4 2 5 4 5 32 116 1.45 1.41 0.81 6.984 5 5 5 4 5 4 5 9 117 1.01 1.26 2.84 3.954 5 5 5 4 5 5 4 12 118 0.66 2.37 0.68 4.025 5 4 5 4 5 5 5 12 119 1.31 1.70 1.78 10.805 5 5 4 4 4 4 5 10 120 1.79 1.12 1.66 15.525 5 5 4 4 5 4 4 16 121 0.64 0.22 0.42 0.925 5 5 4 4 5 5 4 43 122 0.94 0.33 7.08 1.305 5 4 5 4 5 4 5 48 123 1.37 1.26 0.61 3.274 5 4 4 4 5 4 5 140 124 2.19 0.46 0.23 2.554 4 5 4 4 5 4 5 2 125 0.52 1.18 1.04 2.554 4 4 3 4 5 4 5 10 126 3.56 1.66 0.32 8.105 4 5 3 4 5 5 4 177 127 1.50 1.13 0.46 4.023 4 4 3 3 5 5 3 15 128 1.73 0.81 0.96 23.043 4 4 3 3 5 5 3 7 129 1.86 0.96 0.42 2.054 4 4 3 2 4 5 3 33 130 0.85 0.44 0.42 78.604 4 4 3 2 5 5 3 50 131 1.26 1.82 3.50 58.264 4 4 3 2 5 5 3 20 132 1.14 0.98 2.31 18.553 4 4 3 2 5 5 4 6 133 2.45 1.62 0.48 6.863 4 4 4 3 4 5 3 9 134 5.77 0.95 0.14 58.264 5 4 4 3 4 5 4 5 135 0.87 0.84 3.65 5.435 5 4 4 3 4 5 5 20 136 1.29 0.24 1.99 2.775 5 4 4 4 4 4 5 12 137 2.10 1.23 0.11 13.814 5 4 4 4 4 4 4 7 138 1.77 0.93 0.57 2.643 5 5 4 4 5 5 5 20 139 0.93 1.27 2.45 8.683 5 4 4 4 5 5 5 57 140 1.54 0.42 0.12 0.733 5 4 5 5 5 5 5 42 141 1.06 1.27 0.71 13.923 5 4 3 5 5 4 4 16 142 5.04 1.23 0.24 73.934 4 4 3 5 4 5 4 25 143 1.33 0.52 1.92 3.194 5 4 3 4 5 4 4 83 144 2.64 1.33 0.47 29.015 5 5 5 4 4 5 4 15 145 2.79 0.94 0.39 4.234 4 4 4 4 5 5 4 78 146 0.69 2.07 2.83 3.565 ,5 4 4 4 5 5 4 10 147 1.58 2.37 1.79 58.26
D26
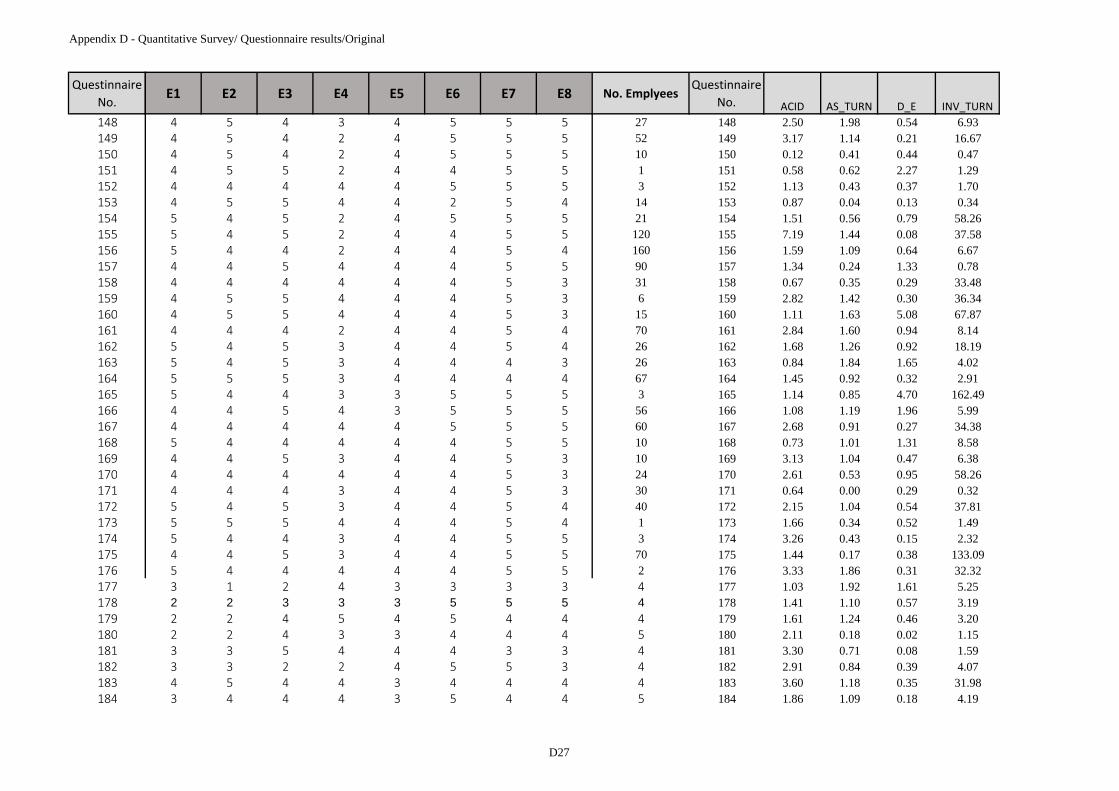
Appendix D - Quantitative Survey/ Questionnaire results/Original
Questinnaire No.148149150151152153154155156157158159160161162163164165166167168169170171172173174175176177178179180181182183184
E1 E2 E3 E4 E5 E6 E7 E8 No. EmplyeesQuestinnaire
No. ACID AS_TURN D_E INV_TURN4 5 4 3 4 5 5 5 27 148 2.50 1.98 0.54 6.934 5 4 2 4 5 5 5 52 149 3.17 1.14 0.21 16.674 5 4 2 4 5 5 5 10 150 0.12 0.41 0.44 0.474 5 5 2 4 4 5 5 1 151 0.58 0.62 2.27 1.294 4 4 4 4 5 5 5 3 152 1.13 0.43 0.37 1.704 5 5 4 4 2 5 4 14 153 0.87 0.04 0.13 0.345 4 5 2 4 5 5 5 21 154 1.51 0.56 0.79 58.265 4 5 2 4 4 5 5 120 155 7.19 1.44 0.08 37.585 4 4 2 4 4 5 4 160 156 1.59 1.09 0.64 6.674 4 5 4 4 4 5 5 90 157 1.34 0.24 1.33 0.784 4 4 4 4 4 5 3 31 158 0.67 0.35 0.29 33.484 5 5 4 4 4 5 3 6 159 2.82 1.42 0.30 36.344 5 5 4 4 4 5 3 15 160 1.11 1.63 5.08 67.874 4 4 2 4 4 5 4 70 161 2.84 1.60 0.94 8.145 4 5 3 4 4 5 4 26 162 1.68 1.26 0.92 18.195 4 5 3 4 4 4 3 26 163 0.84 1.84 1.65 4.025 5 5 3 4 4 4 4 67 164 1.45 0.92 0.32 2.915 4 4 3 3 5 5 5 3 165 1.14 0.85 4.70 162.494 4 5 4 3 5 5 5 56 166 1.08 1.19 1.96 5.994 4 4 4 4 5 5 5 60 167 2.68 0.91 0.27 34.385 4 4 4 4 4 5 5 10 168 0.73 1.01 1.31 8.584 4 5 3 4 4 5 3 10 169 3.13 1.04 0.47 6.384 4 4 4 4 4 5 3 24 170 2.61 0.53 0.95 58.264 4 4 3 4 4 5 3 30 171 0.64 0.00 0.29 0.325 4 5 3 4 4 5 4 40 172 2.15 1.04 0.54 37.815 5 5 4 4 4 5 4 1 173 1.66 0.34 0.52 1.495 4 4 3 4 4 5 5 3 174 3.26 0.43 0.15 2.324 4 5 3 4 4 5 5 70 175 1.44 0.17 0.38 133.095 4 4 4 4 4 5 5 2 176 3.33 1.86 0.31 32.323 1 2 4 3 3 3 3 4 177 1.03 1.92 1.61 5.252 2 3 3 3 5 5 5 4 178 1.41 1.10 0.57 3.192 2 4 5 4 5 4 4 4 179 1.61 1.24 0.46 3.202 2 4 3 3 4 4 4 5 180 2.11 0.18 0.02 1.153 3 5 4 4 4 3 3 4 181 3.30 0.71 0.08 1.593 3 2 2 4 5 5 3 4 182 2.91 0.84 0.39 4.074 5 4 4 3 4 4 4 4 183 3.60 1.18 0.35 31.983 4 4 4 3 5 4 4 5 184 1.86 1.09 0.18 4.19
D27
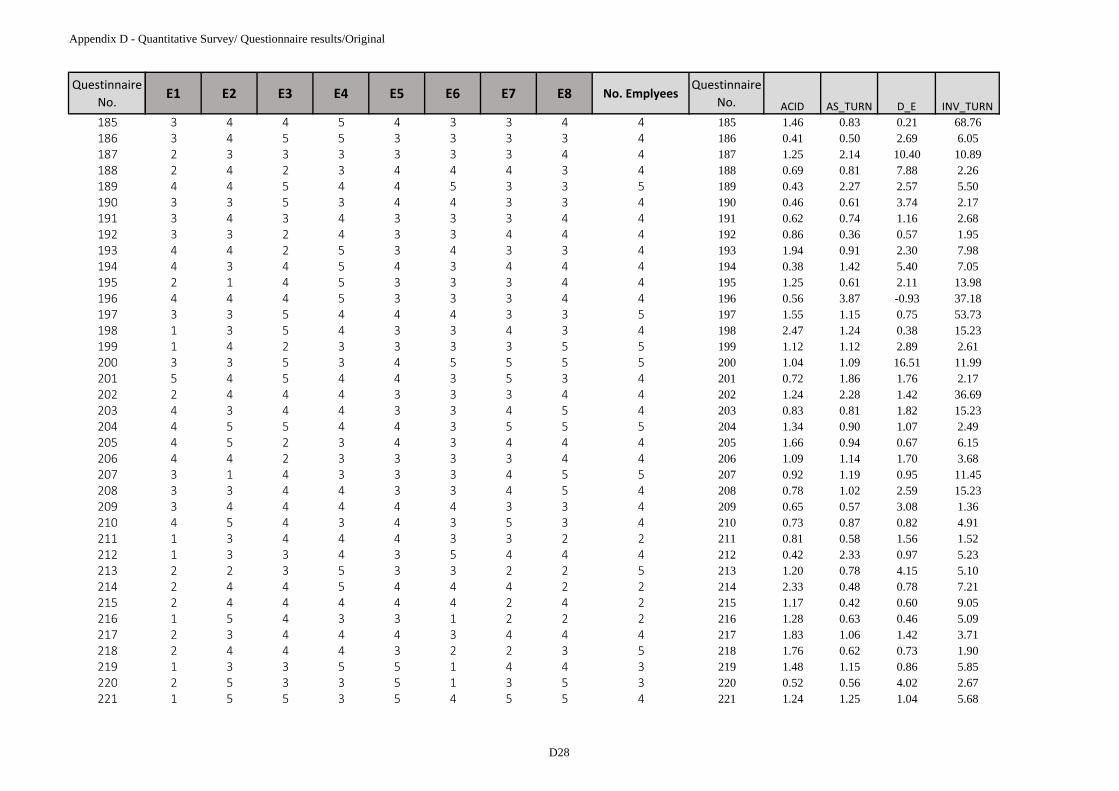
Appendix D - Quantitative Survey/ Questionnaire results/Original
Questinnaire No.185186187188189190191192193194195196197198199200201202203204205206207208209210211212213214215216217218219220221
E1 E2 E3 E4 E5 E6 E7 E8 No. EmplyeesQuestinnaire
No. ACID AS_TURN D_E INV_TURN3 4 4 5 4 3 3 4 4 185 1.46 0.83 0.21 68.763 4 5 5 3 3 3 3 4 186 0.41 0.50 2.69 6.052 3 3 3 3 3 3 4 4 187 1.25 2.14 10.40 10.892 4 2 3 4 4 4 3 4 188 0.69 0.81 7.88 2.264 4 5 4 4 5 3 3 5 189 0.43 2.27 2.57 5.503 3 5 3 4 4 3 3 4 190 0.46 0.61 3.74 2.173 4 3 4 3 3 3 4 4 191 0.62 0.74 1.16 2.683 3 2 4 3 3 4 4 4 192 0.86 0.36 0.57 1.954 4 2 5 3 4 3 3 4 193 1.94 0.91 2.30 7.984 3 4 5 4 3 4 4 4 194 0.38 1.42 5.40 7.052 1 4 5 3 3 3 4 4 195 1.25 0.61 2.11 13.984 4 4 5 3 3 3 4 4 196 0.56 3.87 -0.93 37.183 3 5 4 4 4 3 3 5 197 1.55 1.15 0.75 53.731 3 5 4 3 3 4 3 4 198 2.47 1.24 0.38 15.231 4 2 3 3 3 3 5 5 199 1.12 1.12 2.89 2.613 3 5 3 4 5 5 5 5 200 1.04 1.09 16.51 11.995 4 5 4 4 3 5 3 4 201 0.72 1.86 1.76 2.172 4 4 4 3 3 3 4 4 202 1.24 2.28 1.42 36.694 3 4 4 3 3 4 5 4 203 0.83 0.81 1.82 15.234 5 5 4 4 3 5 5 5 204 1.34 0.90 1.07 2.494 5 2 3 4 3 4 4 4 205 1.66 0.94 0.67 6.154 4 2 3 3 3 3 4 4 206 1.09 1.14 1.70 3.683 1 4 3 3 3 4 5 5 207 0.92 1.19 0.95 11.453 3 4 4 3 3 4 5 4 208 0.78 1.02 2.59 15.233 4 4 4 4 4 3 3 4 209 0.65 0.57 3.08 1.364 5 4 3 4 3 5 3 4 210 0.73 0.87 0.82 4.911 3 4 4 4 3 3 2 2 211 0.81 0.58 1.56 1.521 3 3 4 3 5 4 4 4 212 0.42 2.33 0.97 5.232 2 3 5 3 3 2 2 5 213 1.20 0.78 4.15 5.102 4 4 5 4 4 4 2 2 214 2.33 0.48 0.78 7.212 4 4 4 4 4 2 4 2 215 1.17 0.42 0.60 9.051 5 4 3 3 1 2 2 2 216 1.28 0.63 0.46 5.092 3 4 4 4 3 4 4 4 217 1.83 1.06 1.42 3.712 4 4 4 3 2 2 3 5 218 1.76 0.62 0.73 1.901 3 3 5 5 1 4 4 3 219 1.48 1.15 0.86 5.852 5 3 3 5 1 3 5 3 220 0.52 0.56 4.02 2.671 5 5 3 5 4 5 5 4 221 1.24 1.25 1.04 5.68
D28

Appendix D - Quantitative Survey/ Questionnaire results/Original
Questinnaire No.222223224225226227228229230231232233234235236237238239240241242243244245246247248249250251252253254255256257258
E1 E2 E3 E4 E5 E6 E7 E8 No. EmplyeesQuestinnaire
No. ACID AS_TURN D_E INV_TURN3 4 5 3 4 3 4 3 4 222 1.02 1.65 0.57 4.294 4 4 4 4 3 4 4 4 223 0.99 1.03 0.90 4.434 4 5 4 5 4 5 5 5 224 6.31 0.30 0.06 5.675 4 5 5 5 5 5 5 5 225 1.08 0.86 0.74 2.644 4 4 5 4 5 4 4 5 226 1.63 1.36 0.40 2.753 3 5 5 5 4 3 4 3 227 2.44 0.33 0.54 113.143 3 5 4 5 4 1 3 3 228 0.16 1.81 5.96 2.185 5 4 5 4 5 4 3 4 229 2.14 0.99 0.45 5.765 3 4 4 5 5 2 5 4 2305 4 5 5 4 3 3 5 3 231 1.17 1.51 1.21 3.173 4 3 3 4 3 5 2 4 232 1.29 1.75 2.40 15.233 5 3 3 4 2 1 2 3 233 1.55 0.66 0.69 2.834 4 5 4 4 2 5 4 4 234 2.12 0.89 0.82 15.231 3 4 5 5 4 1 5 4 235 0.50 0.67 0.39 8.941 3 4 5 5 4 1 3 3 236 1.66 0.61 0.42 3.192 5 5 4 4 2 4 1 4 237 1.44 1.03 0.51 1.923 3 5 4 4 2 4 2 5 238 1.70 1.85 0.48 7.894 4 3 5 4 3 3 2 4 2395 2 3 3 5 3 4 4 3 240 1.36 1.45 1.84 20.732 3 4 5 4 3 4 4 4 241 1.93 1.00 0.54 3.193 3 4 4 4 3 4 5 4 242 1.29 0.65 0.63 3.035 3 3 4 4 5 4 5 3 243 2.16 1.26 0.39 8.261 1 4 4 4 4 4 5 2 244 1.89 1.28 0.49 11.072 2 4 3 4 4 2 4 2 245 1.55 0.47 0.15 60.974 2 5 4 4 5 4 2 4 246 0.56 1.37 0.70 2.214 4 2 4 5 3 2 3 4 247 0.88 0.78 2.29 2.335 4 4 5 5 1 2 2 3 248 3.50 1.14 2.97 14.631 2 2 3 1 4 2 2 2 249 1.86 0.66 0.69 5.404 4 4 4 1 4 3 4 4 250 2.55 0.89 0.37 7.783 3 5 5 1 3 4 4 3 251 2.26 1.03 0.20 3.343 1 3 5 5 4 2 5 3 252 3.03 0.18 0.11 1.623 4 5 4 4 5 4 4 4 253 1.60 0.91 1.67 2.062 2 3 3 4 5 4 5 4 254 2.58 0.75 0.17 1.192 1 2 4 2 4 3 3 3 255 6.60 1.10 0.10 5.622 4 2 4 2 4 2 3 2 256 4.65 1.04 0.23 27.153 3 4 4 2 4 3 3 2 257 1.42 1.54 1.23 6.533 4 4 4 4 4 3 3 4 258 4.32 1.59 0.72 8.60
D29

Appendix D - Quantitative Survey/ Questionnaire results/Original
Questinnaire No.259260261262263264265266267268269270271272273274275276277278279280281282283284285286287288289290291292293294295
E1 E2 E3 E4 E5 E6 E7 E8 No. EmplyeesQuestinnaire
No. ACID AS_TURN D_E INV_TURN1 1 5 5 5 5 3 4 5 259 1.09 1.06 0.99 3.941 4 3 5 5 3 4 4 2 260 1.48 1.15 0.53 1.773 3 3 5 4 3 4 5 2 261 1.44 1.40 0.78 3.715 1 5 4 2 5 5 3 4 262 2.22 1.07 0.79 33.585 4 5 5 4 5 4 4 4 263 1.35 1.33 2.02 42.883 5 5 5 5 5 5 5 5 264 0.91 0.63 0.84 3.283 3 4 3 4 5 3 4 5 265 1.64 0.51 1.13 1.572 4 5 4 1 4 4 5 4 266 1.75 0.66 0.42 4.243 3 3 5 1 3 2 5 5 267 0.89 1.22 0.72 6.232 4 2 5 5 5 4 4 4 268 1.24 1.47 1.38 3.831 4 2 4 4 5 3 2 3 269 0.57 0.54 0.59 4.433 4 3 4 4 4 4 5 4 270 1.53 0.47 0.88 9.714 4 4 3 3 2 2 2 3 271 1.45 1.14 1.01 6.613 3 5 5 4 1 5 5 5 272 0.95 1.51 3.15 6.594 3 4 3 3 2 3 5 5 273 0.81 0.58 1.56 1.523 4 4 4 4 5 5 5 4 274 0.42 2.33 0.97 5.233 5 5 5 5 5 5 5 5 275 1.20 0.78 4.15 5.103 5 2 3 3 2 2 4 2 276 2.33 0.48 0.78 7.215 3 5 5 5 5 5 5 5 277 1.17 0.42 0.60 9.055 5 4 3 3 1 5 4 4 278 1.28 0.63 0.46 5.093 3 4 3 3 2 5 4 5 279 1.83 1.06 1.42 3.714 4 4 4 5 5 4 4 4 280 1.76 0.62 0.73 1.903 3 4 4 4 4 3 3 4 281 1.48 1.15 0.86 5.854 4 3 5 4 3 3 3 3 282 0.52 0.56 4.02 2.673 4 5 4 4 4 4 4 4 283 1.24 1.25 1.04 5.684 4 5 5 5 5 5 5 5 284 1.02 1.65 0.57 4.294 5 2 4 5 4 5 4 3 285 0.99 1.03 0.90 4.434 4 5 4 5 5 5 4 5 286 6.31 0.30 0.06 5.674 5 4 5 4 5 3 5 4 287 1.08 0.86 0.74 2.643 5 3 5 4 5 4 4 5 288 1.63 1.36 0.40 2.752 1 3 4 5 5 4 4 5 289 2.44 0.33 0.54 113.144 4 4 4 4 5 4 4 4 290 0.16 1.81 5.96 2.185 5 5 5 5 5 5 5 5 291 2.14 0.99 0.45 5.764 4 4 4 4 4 5 5 4 2921 4 5 5 4 3 4 3 4 293 1.17 1.51 1.21 3.172 5 5 5 5 4 3 5 5 294 1.29 1.75 2.40 15.232 4 4 5 2 5 3 3 3 295 1.55 0.66 0.69 2.83
D30

Appendix D - Quantitative Survey/ Questionnaire results/Original
Questinnaire No.296297298299300301302303304305306307308309310311312313314315316317318319320321322323324325326327328329330331332
E1 E2 E3 E4 E5 E6 E7 E8 No. EmplyeesQuestinnaire
No. ACID AS_TURN D_E INV_TURN1 5 4 4 4 5 4 3 4 296 2.12 0.89 0.82 15.234 4 3 3 4 4 3 2 3 297 0.50 0.67 0.39 8.943 3 5 4 4 5 5 5 5 298 1.66 0.61 0.42 3.195 5 2 1 2 4 4 4 4 299 1.44 1.03 0.51 1.923 4 3 3 3 5 4 4 4 300 1.70 1.85 0.48 7.893 3 3 3 3 5 4 4 3 3015 5 3 5 3 5 4 4 4 302 1.36 1.45 1.84 20.734 4 3 4 2 4 1 2 3 303 1.93 1.00 0.54 3.194 4 4 4 4 5 3 3 4 304 1.29 0.65 0.63 3.034 4 3 3 3 3 2 3 3 305 2.16 1.26 0.39 8.265 5 3 3 3 4 4 4 3 306 1.77 0.79 0.79 2.304 5 5 5 5 5 5 5 5 307 1.36 1.50 1.05 7.814 4 5 4 5 4 5 5 5 308 2.25 1.20 0.32 2.502 4 4 3 4 2 4 4 4 309 1.97 0.53 0.13 2.453 4 5 4 4 4 3 4 5 310 0.87 0.33 0.60 2.554 4 4 4 3 4 3 4 4 311 3.79 1.00 0.25 21.701 4 5 3 3 4 3 4 4 312 1.37 1.58 2.21 10.383 4 3 3 2 5 2 5 2 313 0.98 0.76 1.45 2.402 3 4 4 2 4 3 3 5 314 1.77 0.79 0.79 2.302 5 4 5 4 4 4 4 4 315 1.36 1.50 1.05 7.815 4 4 4 3 4 3 4 3 316 2.25 1.20 0.32 2.504 5 5 5 3 5 4 5 4 317 1.97 0.53 0.13 2.452 4 4 5 4 5 5 5 5 318 0.87 0.33 0.60 2.554 4 4 4 3 4 3 4 3 319 3.79 1.00 0.25 21.704 4 4 4 4 4 5 4 4 320 1.37 1.58 2.21 10.382 4 4 5 4 5 4 5 4 321 0.98 0.76 1.45 2.404 5 5 5 5 5 5 5 5 322 1.25 1.50 3.90 5.093 5 5 4 5 5 4 4 4 323 0.59 1.42 3.29 11.235 5 4 5 4 5 5 5 5 324 0.83 0.56 1.50 2.285 5 5 5 5 5 4 5 5 325 0.30 0.22 1.90 72.594 4 4 5 4 5 4 4 4 326 0.93 0.65 6.25 0.564 4 4 4 4 4 3 4 4 327 0.68 0.93 3.07 3.684 4 4 4 5 4 3 4 4 328 1.00 0.45 7.11 1.484 4 4 4 4 5 4 4 5 329 1.83 0.91 0.57 25.633 4 5 5 4 5 4 5 5 330 1.05 1.38 5.12 5.715 5 4 4 5 5 3 5 5 331 0.64 0.69 1.49 37.463 3 4 4 5 4 5 4 4 332 1.08 3.45 7.80 37.46
D31

Appendix D - Quantitative Survey/ Questionnaire results/Original
Questinnaire No.333334335336337338339340341342343344345346347348349350351352353354355356357358359360361362363364365366367368369
E1 E2 E3 E4 E5 E6 E7 E8 No. EmplyeesQuestinnaire
No. ACID AS_TURN D_E INV_TURN5 4 5 4 4 4 3 4 4 333 2.35 1.15 0.72 18.104 5 4 5 4 5 3 4 4 334 0.68 1.13 1.31 5.544 5 4 5 5 4 4 5 3 335 2.24 0.32 0.43 31.305 4 5 4 3 4 3 4 4 336 3.05 0.31 0.40 4.135 3 5 4 3 5 4 4 4 337 3.35 1.67 0.51 6.685 3 4 5 4 4 4 4 4 338 1.30 1.10 0.54 2.583 4 4 4 3 5 4 5 5 339 2.07 1.21 0.31 2.484 5 5 4 5 5 3 4 4 340 1.05 1.12 2.39 7.704 4 5 4 3 5 4 4 4 341 1.06 1.11 0.57 4.074 5 5 5 5 5 5 5 5 342 2.09 1.23 0.57 5.212 4 4 5 4 4 5 5 5 343 1.49 1.67 0.72 8.654 3 3 4 3 4 3 4 4 344 0.39 1.39 1.53 2.264 4 4 4 5 5 5 5 5 345 0.77 1.67 0.72 3.594 4 4 4 4 4 5 5 5 346 1.33 1.03 0.52 5.332 2 3 3 3 3 3 3 3 347 1.14 1.89 2.09 6.674 2 3 3 4 4 3 4 3 348 1.09 0.57 0.98 3.193 4 3 3 3 5 3 3 4 349 3.03 1.15 0.22 6.845 5 4 3 3 3 4 3 3 350 1.31 1.24 1.35 5.235 4 3 4 4 3 5 4 3 351 1.20 1.33 0.69 2.923 5 3 5 4 5 3 5 4 352 2.62 0.75 0.18 2.333 4 4 4 5 4 3 4 3 353 1.40 1.11 0.63 4.234 3 5 5 4 4 4 5 5 354 0.81 0.99 1.12 3.294 2 3 4 4 3 5 4 5 355 0.98 1.21 1.59 2.714 5 2 4 2 3 4 5 5 356 0.86 2.36 1.45 8.413 2 2 4 2 3 5 3 3 357 1.99 1.28 0.73 13.303 4 3 3 2 3 3 3 3 358 0.76 0.78 1.96 5.324 4 3 3 4 4 3 3 5 359 2.04 0.73 0.19 1.264 4 4 3 4 4 3 4 4 360 1.35 0.98 0.74 7.894 2 3 4 5 5 4 5 4 361 0.62 2.52 2.61 5.644 1 2 5 3 4 3 5 3 362 3.20 1.88 0.22 5.403 4 3 5 3 5 5 4 4 363 1.98 1.14 0.32 2.294 4 5 5 5 5 5 5 5 364 3.28 0.78 0.45 4.633 1 5 4 4 4 3 4 3 365 1.69 0.54 0.14 3.821 1 3 3 3 4 4 3 3 366 2.33 1.11 0.23 10.383 4 4 4 4 5 4 4 5 367 1.94 0.71 0.36 13.871 4 4 3 4 5 4 3 5 368 0.90 1.78 3.06 6.751 4 5 3 3 5 4 5 4 369 5.28 0.97 0.56 6.20
D32

Appendix D - Quantitative Survey/ Questionnaire results/Original
Questinnaire No.370371372373374375376377378379380381382383384385386387388389390391392
E1 E2 E3 E4 E5 E6 E7 E8 No. EmplyeesQuestinnaire
No. ACID AS_TURN D_E INV_TURN4 4 4 4 3 5 4 4 4 370 1.67 0.85 0.42 12.555 5 5 5 4 5 4 5 5 371 1.39 0.90 0.54 9.603 5 5 4 5 5 5 5 5 372 1.52 1.51 0.28 5.601 5 4 1 4 4 4 4 5 373 2.62 0.42 0.16 0.884 5 3 4 5 5 5 5 4 374 2.23 0.82 0.40 4.105 5 4 1 3 5 4 5 5 375 0.71 1.28 10.43 5.475 4 4 5 3 4 5 5 5 376 1.77 3.46 0.48 18.074 2 5 4 4 5 4 5 4 377 0.51 0.47 1.55 0.904 5 4 5 3 4 4 5 4 378 1.31 0.86 0.50 2.813 3 5 1 3 5 3 4 4 379 0.11 0.56 0.58 8.133 1 4 4 4 4 3 4 5 380 3.75 0.52 0.09 46.213 1 5 5 4 5 5 5 5 381 0.88 2.17 0.84 12.155 5 4 4 5 5 5 5 5 382 5.06 0.59 0.20 2.024 4 5 4 4 5 4 5 5 383 3.06 0.68 0.14 4.153 5 2 5 4 5 5 5 5 384 1.93 1.13 0.33 2.963 4 2 3 2 1 4 3 4 385 0.86 0.82 2.26 3.534 4 3 3 5 1 4 5 5 386 1.59 1.18 0.72 6.274 4 4 4 4 5 4 5 5 387 2.27 0.26 0.07 37.463 3 2 4 2 5 5 3 4 388 4.14 0.52 0.14 5.545 5 2 5 2 4 5 4 5 389 3.26 0.76 0.21 2.614 4 3 3 3 5 4 5 5 390 0.88 2.17 0.84 12.154 4 3 3 2 3 3 4 4 391 1.75 1.08 0.95 6.694 5 4 4 3 3 3 3 3
D33

Appendix D - Quantitative Survey/ Questionnaire results/Original
Questinnaire No.123456789101112131415161718192021222324252627282930313233343536
REC_TURN ROA ROE Z_SCORE ACID AS_TURN D_E INV_TURN REC_TURN ROA ROE Z_SCORE ACID1.75 0.01 0.06 2.43 1.66 0.94 6.45 4.76 1.75 0.01 0.08 3.01 1.513.90 -0.16 -0.20 -3.26 0.55 1.12 5.85 3.85 2.64 -0.02 -0.12 -3.34 0.543.22 0.01 0.02 3.75 2.10 1.51 0.43 28.16 2.66 0.11 0.16 6.19 2.001.99 0.03 0.07 2.04 1.08 0.56 1.22 1.96 1.50 0.02 0.04 2.27 1.205.58 0.00 0.00 1.66 2.37 0.57 0.23 86.41 5.65 0.00 0.00 4.25 1.402.83 0.02 0.10 -0.93 0.45 0.81 1.55 3.81 3.14 0.02 0.04 0.00 0.3222.52 0.03 0.22 1.22 1.10 1.47 3.87 187.86 3.43 0.20 0.10 2.99 1.040.36 0.03 0.42 0.95 1.06 0.15 9.21 86.41 0.16 0.02 0.16 0.61 1.145.06 0.00 0.01 2.18 0.38 0.49 0.55 2.01 4.05 -0.03 -0.04 1.75 0.862.38 0.16 0.64 3.67 1.43 2.03 1.96 114.67 2.51 0.14 0.41 4.28 1.843.01 0.03 0.13 3.39 1.25 0.93 5.37 6.43 2.65 0.01 0.08 2.45 1.874.12 0.06 0.28 1.60 1.34 1.23 2.82 24.08 2.04 0.09 0.33 3.31 1.430.65 0.02 0.05 4.51 1.39 0.43 1.30 1.33 0.62 0.00 0.00 4.65 1.442.30 0.02 0.12 1.01 0.79 1.55 6.85 4.92 2.34 0.01 0.06 0.50 0.801.53 0.01 0.05 1.46 1.34 1.56 2.29 120.43 1.88 0.01 0.03 1.79 1.043.04 0.10 0.12 1.26 0.99 0.91 3.15 6.15 1.28 0.06 0.26 2.18 1.431.99 0.20 0.48 2.74 1.35 1.19 0.68 44.36 2.18 0.21 0.36 5.04 1.361.78 0.03 0.18 0.94 0.97 1.18 4.50 10.62 1.53 0.05 0.25 1.61 0.982.51 0.15 0.33 4.85 2.51 1.52 1.98 86.41 2.26 0.14 0.42 5.55 2.502.91 0.00 0.01 2.90 0.91 0.57 1.78 0.88 2.35 0.00 0.01 2.78 0.7010.08 0.01 0.02 2.59 1.03 0.69 0.34 2.10 4.68 0.02 0.02 4.73 0.851.91 0.01 0.01 3.71 1.09 1.08 0.81 3.08 3.51 0.00 0.01 3.15 0.612.29 0.02 0.12 1.46 1.13 0.61 5.59 1.22 2.21 0.02 0.13 3.32 1.181.22 0.00 0.00 2.48 1.08 0.21 1.26 86.41 0.38 -0.06 -0.13 0.60 0.465.40 0.09 0.28 3.89 3.54 2.21 1.03 5.92 9.07 0.21 0.42 8.53 2.881.61 -0.05 -0.08 3.69 2.09 0.36 0.36 2.63 1.72 0.00 0.00 4.84 1.941.94 0.02 0.14 1.40 0.97 1.33 4.16 6.37 1.78 0.09 0.44 1.98 0.844.15 0.04 0.15 1.53 1.39 1.24 2.69 7.31 2.25 0.02 0.07 2.94 1.282.74 0.01 0.01 3.00 1.05 0.84 0.57 10.58 2.37 0.01 0.01 2.57 1.473.04 0.31 0.20 5.59 1.04 1.39 4.61 2.56 2.87 0.04 0.28 5.32 1.0714.58 0.06 0.13 5.52 1.04 2.70 1.60 10.52 8.11 0.06 0.16 3.45 0.982.64 0.10 0.30 3.27 1.28 0.72 1.70 7.66 2.22 0.02 0.05 2.51 1.112.90 -0.02 -0.03 4.03 8.07 0.40 0.76 14.47 2.55 -0.01 -0.02 4.99 0.722.78 0.24 0.15 2.27 1.27 1.25 2.90 296.41 3.59 0.17 0.64 3.13 2.820.96 0.03 0.06 1.26 0.44 0.14 1.03 0.33 0.78 0.00 0.00 0.77 0.540.40 0.01 0.11 1.56 0.85 0.41 5.95 0.84 0.75 -0.04 -0.03 1.91 0.91
08 2009
D34

Appendix D - Quantitative Survey/ Questionnaire results/Original
Questinnaire No.37383940414243444546474849505152535455565758596061626364656667686970717273
REC_TURN ROA ROE Z_SCORE ACID AS_TURN D_E INV_TURN REC_TURN ROA ROE Z_SCORE ACID2.63 0.06 0.09 5.56 1.73 1.15 0.90 3.58 2.58 0.05 0.09 5.37 2.101.32 0.04 0.05 7.40 2.60 0.32 0.21 2.05 0.85 0.03 0.04 7.96 3.525.50 0.05 0.10 2.31 0.52 1.11 1.68 2.05 4.45 0.00 0.00 1.66 0.762.05 0.06 0.09 9.24 2.31 1.57 0.57 7.18 1.98 0.02 0.03 6.59 1.933.08 0.14 0.20 6.79 2.06 0.68 0.29 2.23 2.13 0.10 0.13 8.27 1.961.12 0.05 0.10 4.83 1.76 0.79 1.21 18.79 1.59 0.09 0.19 4.30 2.132.41 0.24 0.35 8.54 1.69 0.67 0.50 1.12 2.90 0.16 0.25 7.59 2.8017.85 0.04 0.06 2.79 1.28 0.41 0.33 61.18 3.34 0.07 0.09 4.36 1.066.46 0.26 1.23 4.00 0.83 1.46 2.37 86.41 8.00 0.08 0.29 1.20 1.611.39 0.02 0.07 1.91 1.31 0.89 1.90 5.09 1.47 0.00 0.01 3.12 1.362.80 0.33 0.48 9.56 4.15 1.47 0.26 9.96 2.29 0.20 0.26 11.70 2.362.07 0.03 0.03 14.41 3.86 0.86 0.22 86.41 2.00 -0.02 -0.02 9.29 2.521.36 0.10 0.46 1.54 1.00 0.83 1.89 5.33 1.46 0.12 0.35 2.83 1.290.80 0.02 0.05 1.20 9.80 0.33 0.09 2.25 0.49 0.03 0.04 16.91 0.898.96 -0.12 -0.14 10.42 1.62 0.88 0.23 4.79 3.18 -0.06 -0.08 5.56 2.921.79 0.02 0.03 7.10 2.04 0.87 0.49 2.35 1.56 0.02 0.03 7.76 2.722.54 0.00 0.02 0.76 1.22 1.06 1.84 16.19 2.04 0.01 0.03 1.92 1.773.50 0.01 0.01 12.61 1.88 0.23 0.10 0.35 1.52 0.00 0.00 14.72 1.183.34 0.03 0.05 2.67 1.08 1.05 0.42 6.36 3.63 0.02 0.03 3.88 2.432.03 0.28 0.37 12.80 4.84 1.36 0.27 44.11 2.36 0.20 0.30 11.11 3.800.63 0.10 0.28 4.16 1.42 0.51 1.71 2.11 0.69 0.09 0.25 4.65 1.363.02 0.28 0.41 8.33 3.90 1.00 0.26 18.87 1.57 0.15 0.19 10.45 3.691.58 0.11 0.15 8.11 5.05 0.66 0.19 3.46 1.54 0.07 0.08 11.42 2.194.14 0.05 0.18 2.51 0.62 1.94 2.25 2.84 4.60 0.03 0.08 2.84 0.894.32 0.28 0.86 5.84 2.83 2.50 1.26 86.41 4.80 0.05 0.12 9.64 3.442.54 0.06 0.95 12.42 1.24 1.46 1.13 2.65 2.76 0.03 0.67 7.66 1.454.44 0.01 0.01 9.39 2.68 1.11 0.32 184.95 3.67 0.03 0.04 8.39 3.2811.52 0.04 0.06 6.69 0.49 0.61 0.37 1.32 5.01 0.04 0.06 5.90 0.901.96 0.03 0.11 1.80 0.72 0.69 1.52 1.55 1.97 0.06 0.15 2.98 0.772.30 0.03 0.04 5.10 2.28 0.49 0.30 1.90 2.63 0.01 0.01 6.31 1.410.45 0.00 0.00 11.44 0.96 0.33 2.30 86.41 0.49 0.04 0.13 0.83 0.890.84 0.32 0.58 6.13 0.96 0.33 2.30 86.41 0.49 0.04 0.13 0.83 0.893.49 0.05 0.05 18.15 4.42 0.52 0.28 8.49 1.68 0.00 0.00 9.36 3.771.80 0.00 0.01 4.95 1.62 0.93 0.46 4.39 1.86 0.00 0.00 5.66 1.770.36 0.00 0.00 4.35 1.25 0.19 1.75 0.73 0.27 0.00 0.01 3.67 1.465.90 0.02 0.03 3.66 1.66 0.32 0.30 49.12 17.58 -0.02 -0.03 4.18 2.942.32 0.09 0.11 8.28 4.79 0.93 0.18 3.79 1.78 0.02 0.02 10.99 1.93
D35
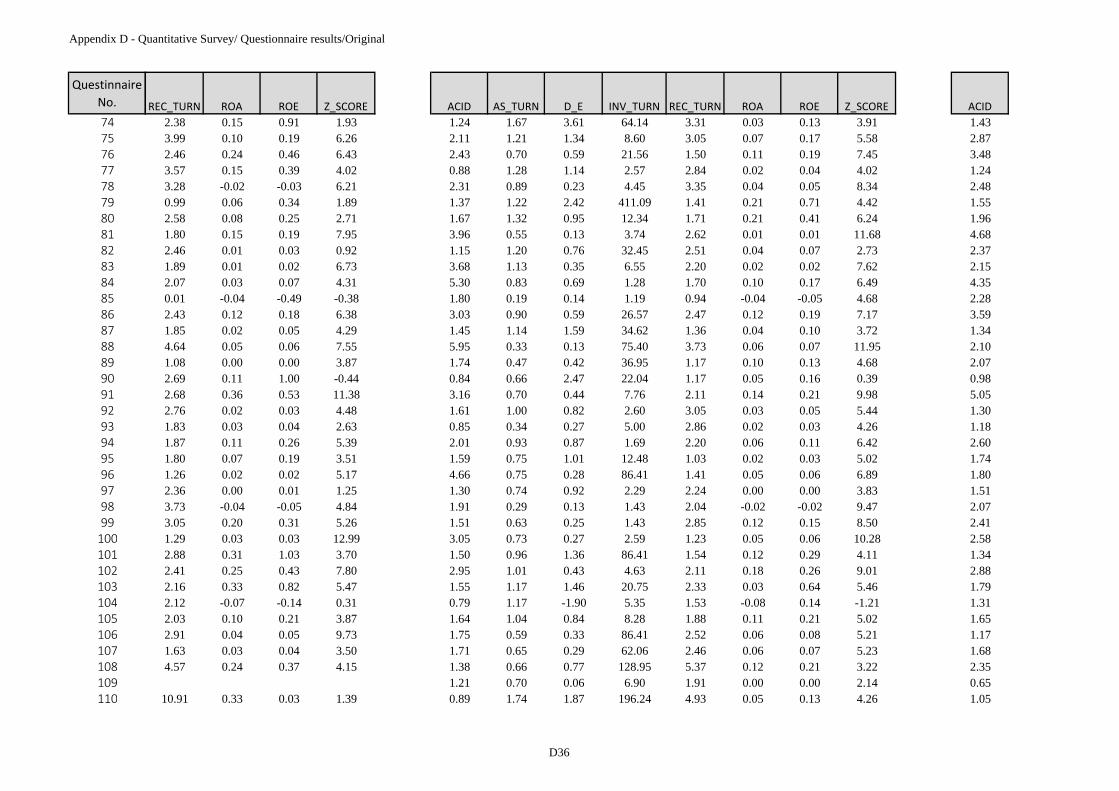
Appendix D - Quantitative Survey/ Questionnaire results/Original
Questinnaire No.7475767778798081828384858687888990919293949596979899100101102103104105106107108109110
REC_TURN ROA ROE Z_SCORE ACID AS_TURN D_E INV_TURN REC_TURN ROA ROE Z_SCORE ACID2.38 0.15 0.91 1.93 1.24 1.67 3.61 64.14 3.31 0.03 0.13 3.91 1.433.99 0.10 0.19 6.26 2.11 1.21 1.34 8.60 3.05 0.07 0.17 5.58 2.872.46 0.24 0.46 6.43 2.43 0.70 0.59 21.56 1.50 0.11 0.19 7.45 3.483.57 0.15 0.39 4.02 0.88 1.28 1.14 2.57 2.84 0.02 0.04 4.02 1.243.28 -0.02 -0.03 6.21 2.31 0.89 0.23 4.45 3.35 0.04 0.05 8.34 2.480.99 0.06 0.34 1.89 1.37 1.22 2.42 411.09 1.41 0.21 0.71 4.42 1.552.58 0.08 0.25 2.71 1.67 1.32 0.95 12.34 1.71 0.21 0.41 6.24 1.961.80 0.15 0.19 7.95 3.96 0.55 0.13 3.74 2.62 0.01 0.01 11.68 4.682.46 0.01 0.03 0.92 1.15 1.20 0.76 32.45 2.51 0.04 0.07 2.73 2.371.89 0.01 0.02 6.73 3.68 1.13 0.35 6.55 2.20 0.02 0.02 7.62 2.152.07 0.03 0.07 4.31 5.30 0.83 0.69 1.28 1.70 0.10 0.17 6.49 4.350.01 -0.04 -0.49 -0.38 1.80 0.19 0.14 1.19 0.94 -0.04 -0.05 4.68 2.282.43 0.12 0.18 6.38 3.03 0.90 0.59 26.57 2.47 0.12 0.19 7.17 3.591.85 0.02 0.05 4.29 1.45 1.14 1.59 34.62 1.36 0.04 0.10 3.72 1.344.64 0.05 0.06 7.55 5.95 0.33 0.13 75.40 3.73 0.06 0.07 11.95 2.101.08 0.00 0.00 3.87 1.74 0.47 0.42 36.95 1.17 0.10 0.13 4.68 2.072.69 0.11 1.00 -0.44 0.84 0.66 2.47 22.04 1.17 0.05 0.16 0.39 0.982.68 0.36 0.53 11.38 3.16 0.70 0.44 7.76 2.11 0.14 0.21 9.98 5.052.76 0.02 0.03 4.48 1.61 1.00 0.82 2.60 3.05 0.03 0.05 5.44 1.301.83 0.03 0.04 2.63 0.85 0.34 0.27 5.00 2.86 0.02 0.03 4.26 1.181.87 0.11 0.26 5.39 2.01 0.93 0.87 1.69 2.20 0.06 0.11 6.42 2.601.80 0.07 0.19 3.51 1.59 0.75 1.01 12.48 1.03 0.02 0.03 5.02 1.741.26 0.02 0.02 5.17 4.66 0.75 0.28 86.41 1.41 0.05 0.06 6.89 1.802.36 0.00 0.01 1.25 1.30 0.74 0.92 2.29 2.24 0.00 0.00 3.83 1.513.73 -0.04 -0.05 4.84 1.91 0.29 0.13 1.43 2.04 -0.02 -0.02 9.47 2.073.05 0.20 0.31 5.26 1.51 0.63 0.25 1.43 2.85 0.12 0.15 8.50 2.411.29 0.03 0.03 12.99 3.05 0.73 0.27 2.59 1.23 0.05 0.06 10.28 2.582.88 0.31 1.03 3.70 1.50 0.96 1.36 86.41 1.54 0.12 0.29 4.11 1.342.41 0.25 0.43 7.80 2.95 1.01 0.43 4.63 2.11 0.18 0.26 9.01 2.882.16 0.33 0.82 5.47 1.55 1.17 1.46 20.75 2.33 0.03 0.64 5.46 1.792.12 -0.07 -0.14 0.31 0.79 1.17 -1.90 5.35 1.53 -0.08 0.14 -1.21 1.312.03 0.10 0.21 3.87 1.64 1.04 0.84 8.28 1.88 0.11 0.21 5.02 1.652.91 0.04 0.05 9.73 1.75 0.59 0.33 86.41 2.52 0.06 0.08 5.21 1.171.63 0.03 0.04 3.50 1.71 0.65 0.29 62.06 2.46 0.06 0.07 5.23 1.684.57 0.24 0.37 4.15 1.38 0.66 0.77 128.95 5.37 0.12 0.21 3.22 2.35
1.21 0.70 0.06 6.90 1.91 0.00 0.00 2.14 0.6510.91 0.33 0.03 1.39 0.89 1.74 1.87 196.24 4.93 0.05 0.13 4.26 1.05
D36
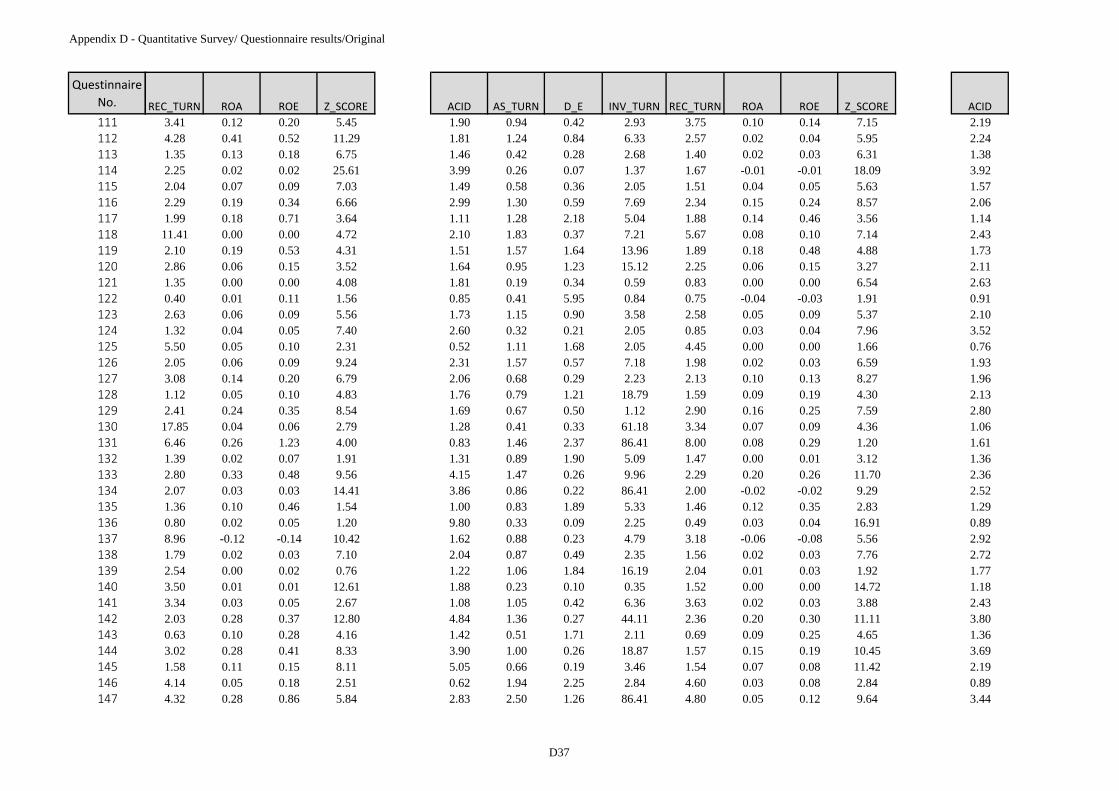
Appendix D - Quantitative Survey/ Questionnaire results/Original
Questinnaire No.111112113114115116117118119120121122123124125126127128129130131132133134135136137138139140141142143144145146147
REC_TURN ROA ROE Z_SCORE ACID AS_TURN D_E INV_TURN REC_TURN ROA ROE Z_SCORE ACID3.41 0.12 0.20 5.45 1.90 0.94 0.42 2.93 3.75 0.10 0.14 7.15 2.194.28 0.41 0.52 11.29 1.81 1.24 0.84 6.33 2.57 0.02 0.04 5.95 2.241.35 0.13 0.18 6.75 1.46 0.42 0.28 2.68 1.40 0.02 0.03 6.31 1.382.25 0.02 0.02 25.61 3.99 0.26 0.07 1.37 1.67 -0.01 -0.01 18.09 3.922.04 0.07 0.09 7.03 1.49 0.58 0.36 2.05 1.51 0.04 0.05 5.63 1.572.29 0.19 0.34 6.66 2.99 1.30 0.59 7.69 2.34 0.15 0.24 8.57 2.061.99 0.18 0.71 3.64 1.11 1.28 2.18 5.04 1.88 0.14 0.46 3.56 1.1411.41 0.00 0.00 4.72 2.10 1.83 0.37 7.21 5.67 0.08 0.10 7.14 2.432.10 0.19 0.53 4.31 1.51 1.57 1.64 13.96 1.89 0.18 0.48 4.88 1.732.86 0.06 0.15 3.52 1.64 0.95 1.23 15.12 2.25 0.06 0.15 3.27 2.111.35 0.00 0.00 4.08 1.81 0.19 0.34 0.59 0.83 0.00 0.00 6.54 2.630.40 0.01 0.11 1.56 0.85 0.41 5.95 0.84 0.75 -0.04 -0.03 1.91 0.912.63 0.06 0.09 5.56 1.73 1.15 0.90 3.58 2.58 0.05 0.09 5.37 2.101.32 0.04 0.05 7.40 2.60 0.32 0.21 2.05 0.85 0.03 0.04 7.96 3.525.50 0.05 0.10 2.31 0.52 1.11 1.68 2.05 4.45 0.00 0.00 1.66 0.762.05 0.06 0.09 9.24 2.31 1.57 0.57 7.18 1.98 0.02 0.03 6.59 1.933.08 0.14 0.20 6.79 2.06 0.68 0.29 2.23 2.13 0.10 0.13 8.27 1.961.12 0.05 0.10 4.83 1.76 0.79 1.21 18.79 1.59 0.09 0.19 4.30 2.132.41 0.24 0.35 8.54 1.69 0.67 0.50 1.12 2.90 0.16 0.25 7.59 2.8017.85 0.04 0.06 2.79 1.28 0.41 0.33 61.18 3.34 0.07 0.09 4.36 1.066.46 0.26 1.23 4.00 0.83 1.46 2.37 86.41 8.00 0.08 0.29 1.20 1.611.39 0.02 0.07 1.91 1.31 0.89 1.90 5.09 1.47 0.00 0.01 3.12 1.362.80 0.33 0.48 9.56 4.15 1.47 0.26 9.96 2.29 0.20 0.26 11.70 2.362.07 0.03 0.03 14.41 3.86 0.86 0.22 86.41 2.00 -0.02 -0.02 9.29 2.521.36 0.10 0.46 1.54 1.00 0.83 1.89 5.33 1.46 0.12 0.35 2.83 1.290.80 0.02 0.05 1.20 9.80 0.33 0.09 2.25 0.49 0.03 0.04 16.91 0.898.96 -0.12 -0.14 10.42 1.62 0.88 0.23 4.79 3.18 -0.06 -0.08 5.56 2.921.79 0.02 0.03 7.10 2.04 0.87 0.49 2.35 1.56 0.02 0.03 7.76 2.722.54 0.00 0.02 0.76 1.22 1.06 1.84 16.19 2.04 0.01 0.03 1.92 1.773.50 0.01 0.01 12.61 1.88 0.23 0.10 0.35 1.52 0.00 0.00 14.72 1.183.34 0.03 0.05 2.67 1.08 1.05 0.42 6.36 3.63 0.02 0.03 3.88 2.432.03 0.28 0.37 12.80 4.84 1.36 0.27 44.11 2.36 0.20 0.30 11.11 3.800.63 0.10 0.28 4.16 1.42 0.51 1.71 2.11 0.69 0.09 0.25 4.65 1.363.02 0.28 0.41 8.33 3.90 1.00 0.26 18.87 1.57 0.15 0.19 10.45 3.691.58 0.11 0.15 8.11 5.05 0.66 0.19 3.46 1.54 0.07 0.08 11.42 2.194.14 0.05 0.18 2.51 0.62 1.94 2.25 2.84 4.60 0.03 0.08 2.84 0.894.32 0.28 0.86 5.84 2.83 2.50 1.26 86.41 4.80 0.05 0.12 9.64 3.44
D37

Appendix D - Quantitative Survey/ Questionnaire results/Original
Questinnaire No.148149150151152153154155156157158159160161162163164165166167168169170171172173174175176177178179180181182183184
REC_TURN ROA ROE Z_SCORE ACID AS_TURN D_E INV_TURN REC_TURN ROA ROE Z_SCORE ACID2.54 0.06 0.95 12.42 1.24 1.46 1.13 2.65 2.76 0.03 0.67 7.66 1.454.44 0.01 0.01 9.39 2.68 1.11 0.32 184.95 3.67 0.03 0.04 8.39 3.2811.52 0.04 0.06 6.69 0.49 0.61 0.37 1.32 5.01 0.04 0.06 5.90 0.901.96 0.03 0.11 1.80 0.72 0.69 1.52 1.55 1.97 0.06 0.15 2.98 0.772.30 0.03 0.04 5.10 2.28 0.49 0.30 1.90 2.63 0.01 0.01 6.31 1.410.45 0.00 0.00 11.44 0.96 0.33 2.30 86.41 0.49 0.04 0.13 0.83 0.890.84 0.32 0.58 6.13 0.96 0.33 2.30 86.41 0.49 0.04 0.13 0.83 0.893.49 0.05 0.05 18.15 4.42 0.52 0.28 8.49 1.68 0.00 0.00 9.36 3.771.80 0.00 0.01 4.95 1.62 0.93 0.46 4.39 1.86 0.00 0.00 5.66 1.770.36 0.00 0.00 4.35 1.25 0.19 1.75 0.73 0.27 0.00 0.01 3.67 1.465.90 0.02 0.03 3.66 1.66 0.32 0.30 49.12 17.58 -0.02 -0.03 4.18 2.942.32 0.09 0.11 8.28 4.79 0.93 0.18 3.79 1.78 0.02 0.02 10.99 1.932.38 0.15 0.91 1.93 1.24 1.67 3.61 64.14 3.31 0.03 0.13 3.91 1.433.99 0.10 0.19 6.26 2.11 1.21 1.34 8.60 3.05 0.07 0.17 5.58 2.872.46 0.24 0.46 6.43 2.43 0.70 0.59 21.56 1.50 0.11 0.19 7.45 3.483.57 0.15 0.39 4.02 0.88 1.28 1.14 2.57 2.84 0.02 0.04 4.02 1.243.28 -0.02 -0.03 6.21 2.31 0.89 0.23 4.45 3.35 0.04 0.05 8.34 2.480.99 0.06 0.34 1.89 1.37 1.22 2.42 411.09 1.41 0.21 0.71 4.42 1.552.58 0.08 0.25 2.71 1.67 1.32 0.95 12.34 1.71 0.21 0.41 6.24 1.961.80 0.15 0.19 7.95 3.96 0.55 0.13 3.74 2.62 0.01 0.01 11.68 4.682.46 0.01 0.03 0.92 1.15 1.20 0.76 32.45 2.51 0.04 0.07 2.73 2.371.89 0.01 0.02 6.73 3.68 1.13 0.35 6.55 2.20 0.02 0.02 7.62 2.152.07 0.03 0.07 4.31 5.30 0.83 0.69 1.28 1.70 0.10 0.17 6.49 4.350.01 -0.04 -0.49 -0.38 1.80 0.19 0.14 1.19 0.94 -0.04 -0.05 4.68 2.282.43 0.12 0.18 6.38 3.03 0.90 0.59 26.57 2.47 0.12 0.19 7.17 3.591.62 0.03 0.05 5.42 1.62 0.46 0.39 1.38 3.44 0.03 0.04 6.37 1.203.07 0.03 0.03 9.12 2.30 0.44 0.28 3.15 2.34 0.08 0.10 6.44 3.872.28 0.03 0.04 3.90 0.65 0.01 0.37 109.07 0.10 -0.03 -0.05 2.64 1.152.87 0.23 0.31 10.94 3.81 1.70 0.25 22.06 3.27 0.19 0.23 11.74 4.294.73 0.09 0.23 4.66 1.03 1.41 0.95 2.92 4.43 0.06 0.12 5.82 1.312.36 0.08 0.13 5.94 3.72 0.89 0.29 2.85 1.91 0.06 0.08 9.16 5.142.97 0.18 0.26 7.85 2.34 0.83 0.39 3.16 2.19 0.11 0.15 8.63 2.832.14 0.01 0.01 4.92 1.25 0.41 0.04 1.85 3.19 0.01 0.01 3.45 0.873.84 0.12 0.13 18.67 1.97 0.52 0.12 1.33 3.48 0.06 0.06 13.55 2.931.95 0.16 0.22 9.02 4.54 0.65 0.18 2.64 1.88 0.05 0.06 12.14 4.963.07 0.35 0.48 10.35 8.90 0.93 0.10 3.92 2.04 0.18 0.20 19.44 3.304.34 0.10 0.11 9.84 3.06 0.63 0.10 1.98 2.91 0.02 0.02 14.28 2.01
D38

Appendix D - Quantitative Survey/ Questionnaire results/Original
Questinnaire No.185186187188189190191192193194195196197198199200201202203204205206207208209210211212213214215216217218219220221
REC_TURN ROA ROE Z_SCORE ACID AS_TURN D_E INV_TURN REC_TURN ROA ROE Z_SCORE ACID3.29 0.05 0.07 14.10 2.79 0.38 0.14 585.54 2.69 0.21 0.24 17.98 1.653.92 0.01 0.02 -0.70 0.60 0.46 2.65 5.56 3.15 0.02 0.07 0.28 0.523.23 0.02 0.22 2.71 1.27 2.92 6.68 19.53 4.03 0.04 0.29 2.77 1.302.01 0.01 0.05 1.46 0.76 0.78 5.24 2.22 2.03 0.01 0.05 1.77 0.769.88 0.00 0.01 1.26 0.53 2.19 3.51 6.25 11.01 -0.08 -0.04 0.48 0.331.90 0.00 0.01 -0.62 0.33 0.46 4.12 1.47 1.99 -0.02 -0.09 -1.51 0.422.55 -0.01 -0.03 1.67 0.51 0.63 1.65 2.59 2.33 -0.07 -0.02 0.27 0.521.71 0.01 0.02 2.36 1.12 0.42 0.52 2.71 1.50 0.00 0.01 2.86 1.081.68 0.10 0.32 3.89 1.91 0.99 2.10 6.79 1.93 0.07 0.21 3.80 1.525.66 0.07 0.44 -0.92 0.64 1.03 5.84 8.16 2.79 0.03 0.23 -0.53 0.431.26 0.01 0.02 2.05 1.39 0.66 1.57 10.58 1.43 0.00 0.00 2.70 1.538.85 -0.03 0.32 -5.40 0.62 3.41 4.36 20.38 9.16 -0.02 -0.09 -2.21 0.882.00 0.03 0.06 3.40 0.98 1.02 0.86 25.90 2.82 0.02 0.03 1.89 0.682.90 0.12 0.17 6.84 3.29 0.70 0.24 19.96 2.44 0.06 0.08 8.38 3.952.07 0.07 0.27 3.83 0.81 1.09 2.48 3.44 2.10 0.08 0.29 2.49 1.321.70 0.01 0.21 1.01 1.80 0.69 14.80 6.29 1.26 0.00 -0.05 2.54 1.624.12 0.18 0.50 4.64 0.79 1.75 1.32 2.08 4.03 0.18 0.41 4.98 0.766.85 0.13 0.34 3.32 1.05 1.84 1.81 69.31 6.90 0.03 0.10 3.57 0.983.82 0.04 0.12 1.14 0.36 0.42 1.97 19.96 3.51 -0.02 -0.06 -0.55 0.381.58 0.11 0.23 6.10 1.17 0.73 1.43 2.68 1.29 0.01 0.02 4.13 1.392.41 0.00 0.01 3.72 1.01 0.78 1.02 6.08 1.87 0.00 0.00 1.68 1.061.85 0.09 0.24 4.28 1.08 1.08 1.53 4.03 1.70 0.06 0.16 4.00 1.193.89 0.01 0.02 1.94 0.78 0.83 1.23 15.18 2.48 -0.02 -0.04 -0.60 0.502.99 0.18 0.64 1.85 1.06 0.62 2.13 21.66 5.63 0.03 0.10 4.06 1.151.77 0.01 0.05 1.87 0.63 0.43 2.42 1.22 1.23 0.00 0.01 1.39 0.723.71 0.15 0.28 3.89 1.62 0.62 1.00 4.13 2.76 0.09 0.18 4.471.20 0.01 0.02 2.61 1.03 0.62 0.73 1.32 1.83 0.02 0.03 4.66 1.9213.62 0.09 0.18 3.38 0.60 2.26 0.89 7.16 14.43 0.05 0.09 3.25 0.871.21 0.02 0.11 2.41 1.22 1.18 3.92 14.70 1.51 0.05 0.26 2.67 1.420.87 0.00 0.00 4.61 2.21 0.39 0.71 7.76 0.72 0.01 0.01 3.88 1.772.24 0.00 0.01 2.70 1.71 0.40 0.57 7.18 2.17 -0.03 -0.05 3.08 2.101.70 0.08 0.12 5.68 1.53 0.59 0.43 4.69 1.45 0.05 0.07 6.14 1.741.45 0.05 0.13 5.83 1.66 0.93 1.44 3.25 1.33 0.04 0.09 5.45 1.881.66 0.21 0.36 7.63 1.87 0.55 0.83 1.70 1.67 0.18 0.32 7.17 2.251.74 0.14 0.27 5.16 1.86 1.15 0.60 5.38 1.76 0.14 0.24 6.13 1.982.22 0.04 0.22 0.55 0.53 0.51 1.93 3.52 2.45 0.07 0.21 1.27 0.462.54 0.18 0.38 4.59 1.30 1.07 1.08 5.54 1.93 0.19 0.40 4.61 1.74
D39

Appendix D - Quantitative Survey/ Questionnaire results/Original
Questinnaire No.222223224225226227228229230231232233234235236237238239240241242243244245246247248249250251252253254255256257258
REC_TURN ROA ROE Z_SCORE ACID AS_TURN D_E INV_TURN REC_TURN ROA ROE Z_SCORE ACID4.67 0.26 0.42 7.07 0.98 1.31 0.68 3.34 4.10 0.19 0.32 6.14 1.222.66 0.01 0.02 3.06 1.31 0.84 0.77 3.54 2.12 0.01 0.02 4.07 1.203.04 0.03 0.03 2.24 1.57 0.53 0.33 7.95 2.22 0.19 0.26 7.64 1.442.25 0.10 0.17 4.12 1.45 0.96 0.63 2.35 2.38 0.16 0.26 5.90 1.683.11 0.04 0.06 6.81 1.85 1.25 0.33 2.63 3.21 0.02 0.03 7.41 2.090.53 0.13 0.21 8.10 2.70 0.41 0.46 19.96 0.51 0.10 0.14 8.33 2.6910.44 0.05 0.34 1.90 1.54 1.69 1.62 19.96 5.77 0.03 0.09 4.79 1.211.96 0.25 0.37 7.26 2.19 0.92 0.45 4.92 1.74 0.03 0.38 7.43 2.60
3.33 0.56 0.22 0.87 1.80 0.04 0.05 11.23 2.392.88 0.25 0.55 6.64 0.80 0.87 1.73 1.73 2.05 0.03 0.08 3.78 0.872.13 0.04 1.20 4.76 1.05 1.64 6.83 19.96 2.10 0.03 0.02 2.54 1.331.80 0.08 0.14 5.38 3.72 0.56 0.40 2.39 1.48 0.05 0.07 7.62 0.831.10 0.03 0.62 8.21 3.30 0.87 0.39 19.96 1.31 0.03 0.41 10.45 1.797.66 0.08 0.11 2.75 0.73 0.68 0.30 8.55 6.18 0.09 0.11 4.01 1.041.45 -0.02 -0.03 4.89 1.08 0.44 0.52 1.82 1.26 -0.05 -0.07 3.38 1.082.49 0.19 0.29 8.14 2.66 0.62 0.55 1.57 2.12 0.08 0.13 7.70 1.513.67 0.07 0.11 5.90 1.65 1.73 0.43 5.98 3.80 0.09 0.13 6.52 2.10
0.52 2.90 0.21 13.39 4.35 0.11 0.16 12.65 4.421.90 0.06 0.17 3.16 1.44 1.37 1.69 35.77 1.98 0.12 0.32 3.93 1.552.30 0.00 0.00 7.63 1.87 0.81 0.70 2.68 1.79 0.03 0.05 6.99 1.432.23 0.04 0.07 3.28 3.28 0.55 0.43 2.89 1.58 -0.01 -0.01 5.00 4.153.05 0.08 0.11 6.98 2.75 1.14 0.26 9.25 2.59 -0.07 -0.09 7.21 2.812.69 0.21 0.32 7.39 2.19 0.61 0.49 24.58 1.96 0.03 0.38 6.40 2.187.18 0.10 0.12 8.37 4.30 0.42 0.06 54.60 5.15 0.11 0.11 2.00 0.616.32 0.11 0.19 5.37 0.67 1.40 0.69 2.31 5.57 0.10 0.17 5.71 0.611.49 0.00 0.01 2.07 1.15 0.83 1.85 2.65 1.57 -0.02 -0.06 2.86 1.312.99 0.10 0.38 4.66 2.45 1.00 3.17 16.70 2.03 0.03 0.14 4.04 2.542.58 0.13 0.23 5.95 2.94 0.67 0.66 7.43 2.13 0.13 0.22 7.13 4.052.05 0.07 0.09 7.38 2.61 0.90 0.30 7.52 2.52 0.05 0.07 7.90 3.164.42 0.05 0.06 8.92 2.79 1.08 0.15 3.03 4.28 0.05 0.05 11.08 2.125.13 -0.05 -0.06 8.31 1.83 0.17 0.12 162.25 7.83 -0.05 -0.06 6.92 1.672.66 0.04 0.10 5.34 1.75 0.83 1.05 1.78 2.83 0.04 0.09 6.10 1.052.57 0.05 0.06 12.09 1.22 0.87 0.43 1.37 3.06 0.04 0.06 7.00 1.382.40 0.03 0.04 14.78 4.30 1.06 0.19 9.43 2.34 0.03 0.03 9.97 4.471.62 0.17 0.21 12.82 3.25 0.92 0.38 38.22 1.40 0.21 0.29 10.61 5.122.35 0.08 0.19 4.51 1.35 1.42 0.98 3.47 2.64 0.07 0.14 5.17 1.323.83 0.20 0.35 8.86 0.65 1.23 0.50 16.07 2.67 0.03 0.42 10.38 3.34
D40

Appendix D - Quantitative Survey/ Questionnaire results/Original
Questinnaire No.259260261262263264265266267268269270271272273274275276277278279280281282283284285286287288289290291292293294295
REC_TURN ROA ROE Z_SCORE ACID AS_TURN D_E INV_TURN REC_TURN ROA ROE Z_SCORE ACID2.37 0.05 0.10 4.27 1.33 1.16 0.71 4.58 2.18 0.05 0.08 5.32 1.322.98 0.23 0.36 8.55 1.46 1.04 0.51 1.54 3.03 0.17 0.26 8.39 1.642.33 0.19 0.33 6.94 1.51 1.50 1.00 4.99 2.29 0.16 0.32 6.41 1.641.72 0.20 0.36 6.85 0.55 0.67 0.49 16.72 1.00 0.01 0.01 7.84 2.791.81 0.22 0.67 4.45 1.55 1.24 1.28 30.69 2.18 0.15 0.34 4.92 2.022.34 0.03 0.06 2.65 0.76 0.29 0.94 1.07 1.37 0.03 0.05 2.24 1.551.54 0.10 0.21 4.61 1.18 0.41 1.12 1.29 1.49 0.04 0.07 3.61 1.162.16 0.20 0.28 7.37 3.10 0.56 0.18 3.22 2.64 0.08 0.09 11.10 2.264.12 0.16 0.27 4.03 2.02 1.16 0.39 68.45 7.04 0.06 0.08 5.94 1.763.58 0.25 0.62 6.32 1.33 1.06 1.02 2.32 2.55 0.13 0.27 6.57 1.952.65 0.05 0.08 3.42 1.23 0.52 0.46 4.54 2.19 0.04 0.05 4.97 1.281.37 0.04 0.08 3.58 2.71 0.51 0.53 8.15 1.41 0.05 0.07 5.51 4.003.07 0.07 0.15 3.87 1.39 0.82 0.75 2.83 3.69 0.06 0.12 4.36 2.182.13 0.20 0.84 2.99 1.04 1.61 1.97 8.25 2.37 0.20 0.61 3.48 1.041.20 0.01 0.02 2.61 1.03 0.62 0.73 1.32 1.83 0.02 0.03 4.66 1.9213.62 0.09 0.18 3.38 0.60 2.26 0.89 7.16 14.43 0.05 0.09 3.25 0.871.21 0.02 0.11 2.41 1.22 1.18 3.92 14.70 1.51 0.05 0.26 2.67 1.420.87 0.00 0.00 4.61 2.21 0.39 0.71 7.76 0.72 0.01 0.01 3.88 1.772.24 0.00 0.01 2.70 1.71 0.40 0.57 7.18 2.17 -0.03 -0.05 3.08 2.101.70 0.08 0.12 5.68 1.53 0.59 0.43 4.69 1.45 0.05 0.07 6.14 1.741.45 0.05 0.13 5.83 1.66 0.93 1.44 3.25 1.33 0.04 0.09 5.45 1.881.66 0.21 0.36 7.63 1.87 0.55 0.83 1.70 1.67 0.18 0.32 7.17 2.251.74 0.14 0.27 5.16 1.86 1.15 0.60 5.38 1.76 0.14 0.24 6.13 1.982.22 0.04 0.22 0.55 0.53 0.51 1.93 3.52 2.45 0.07 0.21 1.27 0.462.54 0.18 0.38 4.59 1.30 1.07 1.08 5.54 1.93 0.19 0.40 4.61 1.744.67 0.26 0.42 7.07 0.98 1.31 0.68 3.34 4.10 0.19 0.32 6.14 1.222.66 0.01 0.02 3.06 1.31 0.84 0.77 3.54 2.12 0.01 0.02 4.07 1.203.04 0.03 0.03 2.24 1.57 0.53 0.33 7.95 2.22 0.19 0.26 7.64 1.442.25 0.10 0.17 4.12 1.45 0.96 0.63 2.35 2.38 0.16 0.26 5.90 1.683.11 0.04 0.06 6.81 1.85 1.25 0.33 2.63 3.21 0.02 0.03 7.41 2.090.53 0.13 0.21 8.10 2.70 0.41 0.46 19.96 0.51 0.10 0.14 8.33 2.6910.44 0.05 0.34 1.90 1.54 1.69 1.62 19.96 5.77 0.03 0.09 4.79 1.211.96 0.25 0.37 7.26 2.19 0.92 0.45 4.92 1.74 0.03 0.38 7.43 2.60
3.33 0.56 0.22 0.87 1.80 0.04 0.05 11.23 2.392.88 0.25 0.55 6.64 0.80 0.87 1.73 1.73 2.05 0.03 0.08 3.78 0.872.13 0.04 1.20 4.76 1.05 1.64 6.83 19.96 2.10 0.03 0.02 2.54 1.331.80 0.08 0.14 5.38 3.72 0.56 0.40 2.39 1.48 0.05 0.07 7.62 0.83
D41
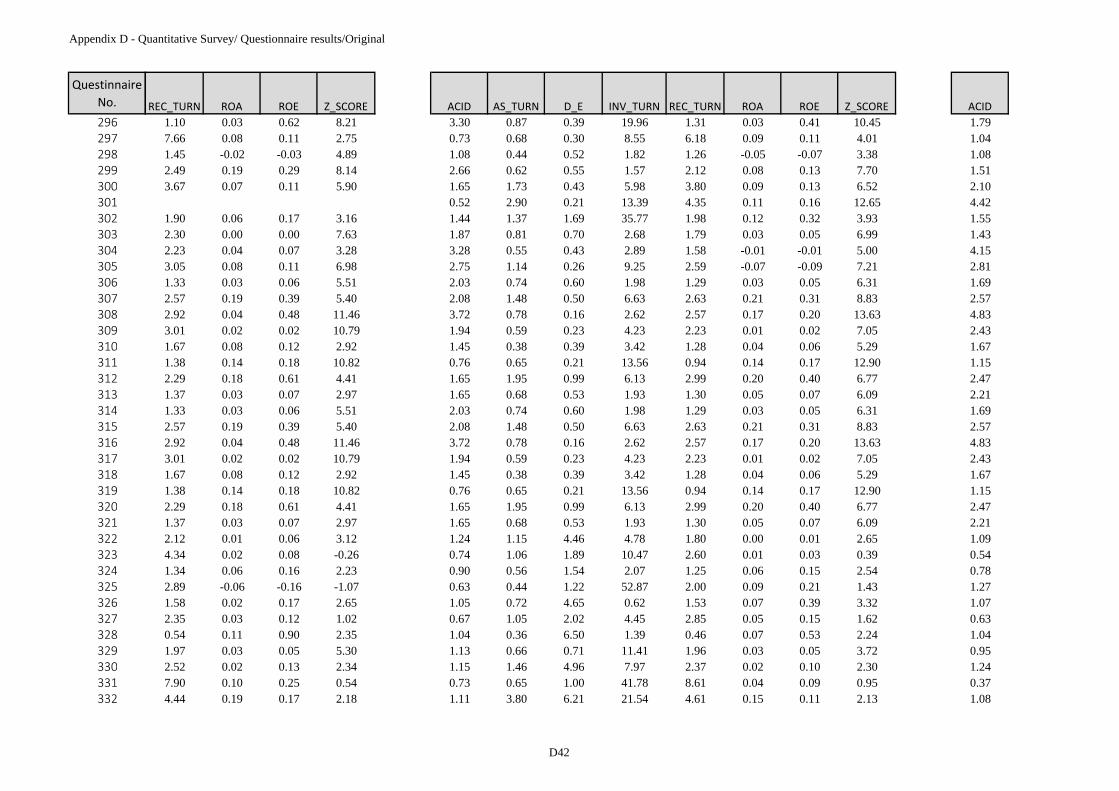
Appendix D - Quantitative Survey/ Questionnaire results/Original
Questinnaire No.296297298299300301302303304305306307308309310311312313314315316317318319320321322323324325326327328329330331332
REC_TURN ROA ROE Z_SCORE ACID AS_TURN D_E INV_TURN REC_TURN ROA ROE Z_SCORE ACID1.10 0.03 0.62 8.21 3.30 0.87 0.39 19.96 1.31 0.03 0.41 10.45 1.797.66 0.08 0.11 2.75 0.73 0.68 0.30 8.55 6.18 0.09 0.11 4.01 1.041.45 -0.02 -0.03 4.89 1.08 0.44 0.52 1.82 1.26 -0.05 -0.07 3.38 1.082.49 0.19 0.29 8.14 2.66 0.62 0.55 1.57 2.12 0.08 0.13 7.70 1.513.67 0.07 0.11 5.90 1.65 1.73 0.43 5.98 3.80 0.09 0.13 6.52 2.10
0.52 2.90 0.21 13.39 4.35 0.11 0.16 12.65 4.421.90 0.06 0.17 3.16 1.44 1.37 1.69 35.77 1.98 0.12 0.32 3.93 1.552.30 0.00 0.00 7.63 1.87 0.81 0.70 2.68 1.79 0.03 0.05 6.99 1.432.23 0.04 0.07 3.28 3.28 0.55 0.43 2.89 1.58 -0.01 -0.01 5.00 4.153.05 0.08 0.11 6.98 2.75 1.14 0.26 9.25 2.59 -0.07 -0.09 7.21 2.811.33 0.03 0.06 5.51 2.03 0.74 0.60 1.98 1.29 0.03 0.05 6.31 1.692.57 0.19 0.39 5.40 2.08 1.48 0.50 6.63 2.63 0.21 0.31 8.83 2.572.92 0.04 0.48 11.46 3.72 0.78 0.16 2.62 2.57 0.17 0.20 13.63 4.833.01 0.02 0.02 10.79 1.94 0.59 0.23 4.23 2.23 0.01 0.02 7.05 2.431.67 0.08 0.12 2.92 1.45 0.38 0.39 3.42 1.28 0.04 0.06 5.29 1.671.38 0.14 0.18 10.82 0.76 0.65 0.21 13.56 0.94 0.14 0.17 12.90 1.152.29 0.18 0.61 4.41 1.65 1.95 0.99 6.13 2.99 0.20 0.40 6.77 2.471.37 0.03 0.07 2.97 1.65 0.68 0.53 1.93 1.30 0.05 0.07 6.09 2.211.33 0.03 0.06 5.51 2.03 0.74 0.60 1.98 1.29 0.03 0.05 6.31 1.692.57 0.19 0.39 5.40 2.08 1.48 0.50 6.63 2.63 0.21 0.31 8.83 2.572.92 0.04 0.48 11.46 3.72 0.78 0.16 2.62 2.57 0.17 0.20 13.63 4.833.01 0.02 0.02 10.79 1.94 0.59 0.23 4.23 2.23 0.01 0.02 7.05 2.431.67 0.08 0.12 2.92 1.45 0.38 0.39 3.42 1.28 0.04 0.06 5.29 1.671.38 0.14 0.18 10.82 0.76 0.65 0.21 13.56 0.94 0.14 0.17 12.90 1.152.29 0.18 0.61 4.41 1.65 1.95 0.99 6.13 2.99 0.20 0.40 6.77 2.471.37 0.03 0.07 2.97 1.65 0.68 0.53 1.93 1.30 0.05 0.07 6.09 2.212.12 0.01 0.06 3.12 1.24 1.15 4.46 4.78 1.80 0.00 0.01 2.65 1.094.34 0.02 0.08 -0.26 0.74 1.06 1.89 10.47 2.60 0.01 0.03 0.39 0.541.34 0.06 0.16 2.23 0.90 0.56 1.54 2.07 1.25 0.06 0.15 2.54 0.782.89 -0.06 -0.16 -1.07 0.63 0.44 1.22 52.87 2.00 0.09 0.21 1.43 1.271.58 0.02 0.17 2.65 1.05 0.72 4.65 0.62 1.53 0.07 0.39 3.32 1.072.35 0.03 0.12 1.02 0.67 1.05 2.02 4.45 2.85 0.05 0.15 1.62 0.630.54 0.11 0.90 2.35 1.04 0.36 6.50 1.39 0.46 0.07 0.53 2.24 1.041.97 0.03 0.05 5.30 1.13 0.66 0.71 11.41 1.96 0.03 0.05 3.72 0.952.52 0.02 0.13 2.34 1.15 1.46 4.96 7.97 2.37 0.02 0.10 2.30 1.247.90 0.10 0.25 0.54 0.73 0.65 1.00 41.78 8.61 0.04 0.09 0.95 0.374.44 0.19 0.17 2.18 1.11 3.80 6.21 21.54 4.61 0.15 0.11 2.13 1.08
D42

Appendix D - Quantitative Survey/ Questionnaire results/Original
Questinnaire No.333334335336337338339340341342343344345346347348349350351352353354355356357358359360361362363364365366367368369
REC_TURN ROA ROE Z_SCORE ACID AS_TURN D_E INV_TURN REC_TURN ROA ROE Z_SCORE ACID2.42 -0.17 -0.30 4.98 2.61 1.36 0.54 14.56 1.98 0.01 0.02 5.60 2.265.92 0.00 0.01 1.44 0.92 1.15 1.14 8.96 3.78 0.00 0.01 1.78 1.013.31 -0.04 -0.06 3.20 0.67 0.29 0.52 33.77 5.11 -0.06 -0.09 1.68 0.200.40 0.00 0.01 8.23 1.91 0.48 0.76 6.17 0.63 0.01 0.02 5.93 2.161.92 0.21 0.34 7.24 3.48 1.39 0.39 9.95 1.54 0.02 0.28 8.25 4.732.60 0.31 0.48 7.38 1.09 0.93 0.65 1.93 2.40 0.10 0.16 6.44 1.132.63 0.19 0.26 9.62 2.91 1.08 0.20 2.08 2.42 0.05 0.07 11.30 3.411.84 0.09 0.29 2.33 1.04 0.92 2.07 4.08 1.48 0.05 0.15 2.14 1.687.15 0.08 0.12 3.86 0.64 1.07 0.63 5.26 8.31 0.07 0.11 2.84 0.291.69 0.10 0.16 7.71 2.33 1.13 0.48 5.04 1.50 0.08 0.12 8.22 2.172.93 0.25 0.45 6.93 1.45 1.68 0.79 8.20 2.86 0.03 0.57 6.86 1.316.87 0.13 0.32 3.95 0.53 1.51 1.03 2.84 8.03 0.11 0.23 4.87 0.555.83 0.11 0.19 4.24 1.17 1.54 0.79 4.46 3.84 0.15 0.28 4.79 1.705.08 0.11 0.17 5.36 1.88 0.83 0.30 2.61 6.29 0.01 0.15 8.21 1.932.64 0.15 0.50 3.98 1.31 1.65 1.76 7.21 2.17 0.00 0.01 3.80 1.161.10 0.03 0.06 3.35 1.18 0.60 0.89 3.38 1.19 0.05 0.09 3.90 1.443.36 0.22 0.28 11.20 3.46 0.92 0.16 3.57 3.40 0.16 0.18 13.08 2.911.73 0.09 0.23 4.12 1.35 1.08 1.60 6.87 1.40 0.11 0.29 3.71 1.463.56 0.07 0.13 5.50 0.80 1.25 1.00 2.57 3.50 0.08 0.16 3.97 0.885.70 0.14 0.17 11.82 1.25 0.60 0.66 2.12 7.84 0.14 0.24 5.49 2.392.64 0.18 0.30 6.26 1.28 0.93 0.65 4.16 2.26 0.14 0.23 5.53 1.834.38 0.05 0.11 3.84 1.07 0.99 1.44 6.39 3.09 0.08 0.19 3.61 1.152.35 0.21 0.55 5.22 1.11 1.02 1.22 3.33 1.89 0.04 0.08 4.25 1.4010.74 0.09 0.21 2.70 0.94 3.12 0.78 11.86 2.19 0.08 0.15 3.88 1.282.76 0.35 0.65 7.79 1.71 0.96 1.04 12.04 2.55 0.03 0.06 6.33 3.514.86 0.02 0.05 1.04 0.53 0.40 2.09 0.89 3.64 0.03 0.10 1.24 0.962.73 0.26 0.31 11.40 1.05 0.55 0.43 0.96 2.76 0.17 0.25 6.49 1.464.08 0.18 0.31 5.53 1.20 0.79 0.72 7.90 3.98 0.14 0.24 4.89 1.466.70 0.04 0.15 2.10 1.08 3.58 1.39 11.43 10.71 0.00 0.01 3.32 0.995.02 0.10 0.13 11.99 3.09 1.65 0.23 4.92 4.26 0.07 0.09 11.35 3.375.06 0.09 0.12 8.47 3.76 0.91 0.23 1.91 4.61 0.03 0.04 9.55 1.363.33 0.09 0.13 7.89 3.95 0.70 0.38 4.20 3.18 0.07 0.10 8.55 0.482.73 0.01 0.01 8.79 3.50 0.66 0.09 7.04 3.14 0.01 0.01 13.45 4.303.29 0.07 0.08 7.39 2.49 1.05 0.26 10.82 3.25 0.03 0.04 6.99 2.581.45 0.19 0.26 6.92 2.64 0.53 0.22 5.79 1.56 0.01 0.02 8.19 2.326.99 0.09 0.36 2.51 1.05 1.62 3.45 7.08 7.56 0.09 0.40 2.69 1.132.24 0.12 0.18 7.81 0.59 0.74 0.42 4.02 2.22 0.07 0.10 7.97 0.58
D43

Appendix D - Quantitative Survey/ Questionnaire results/Original
Questinnaire No.370371372373374375376377378379380381382383384385386387388389390391392
REC_TURN ROA ROE Z_SCORE ACID AS_TURN D_E INV_TURN REC_TURN ROA ROE Z_SCORE ACID2.47 0.24 0.34 6.73 2.16 1.08 0.34 13.74 2.47 0.02 0.31 8.19 2.055.96 0.24 0.37 5.58 1.81 1.08 0.36 9.40 9.35 0.13 0.18 7.24 1.674.89 -0.10 -0.13 3.96 2.61 1.48 0.25 6.36 3.69 -0.06 -0.07 5.71 1.273.14 0.00 0.00 10.61 1.08 0.30 0.23 0.61 2.32 -0.10 -0.12 7.55 1.411.70 0.01 0.01 6.14 2.42 0.85 0.35 4.02 1.75 0.04 0.06 6.80 2.273.17 -0.11 -0.14 -0.62 1.16 1.28 0.70 5.63 2.90 -0.05 -0.08 2.30 1.266.06 0.25 0.37 8.08 4.77 2.83 0.18 63.85 6.84 0.02 0.24 13.34 1.962.29 0.00 0.01 2.76 0.84 0.57 1.25 1.24 2.16 0.01 0.02 3.76 0.812.16 0.17 0.26 6.86 1.05 0.70 0.60 2.04 1.94 0.10 0.16 5.26 1.112.25 0.09 0.15 1.52 2.58 0.40 0.90 3.77 1.94 0.02 0.03 3.85 2.626.21 0.03 0.03 14.23 4.49 0.47 0.07 48.26 5.35 -0.05 -0.05 1.68 1.667.78 0.03 0.06 1.14 1.41 2.05 0.44 1.29 2.43 0.06 0.08 3.79 1.091.56 0.11 0.13 12.48 0.78 0.48 0.14 1.72 1.38 0.05 0.06 14.84 0.691.92 0.10 0.12 12.89 4.21 0.58 0.11 5.74 1.59 0.09 0.10 15.55 0.504.16 0.17 0.24 9.07 3.11 0.87 0.20 2.71 4.46 0.10 0.13 11.37 3.921.11 -0.02 -0.56 0.45 0.89 0.68 22.09 3.55 0.90 0.03 0.07 0.68 0.792.20 0.08 0.14 5.67 2.25 1.16 0.47 9.81 2.08 0.12 0.18 7.71 2.051.87 0.03 0.03 16.51 2.01 0.24 0.07 21.54 1.97 0.01 0.01 16.43 1.801.91 -0.03 -0.03 12.08 1.06 0.48 0.05 4.43 1.76 -0.02 -0.02 2.73 1.151.61 0.14 0.17 11.08 1.36 0.76 0.63 2.31 1.57 0.13 0.22 5.37 1.707.78 0.03 0.06 1.14 1.41 2.05 0.44 1.29 2.43 0.06 0.08 3.79 1.093.08 0.10 0.20 6.13 1.74 1.02 0.98 4.08 3.01 0.06 0.13 6.48 1.82
D44
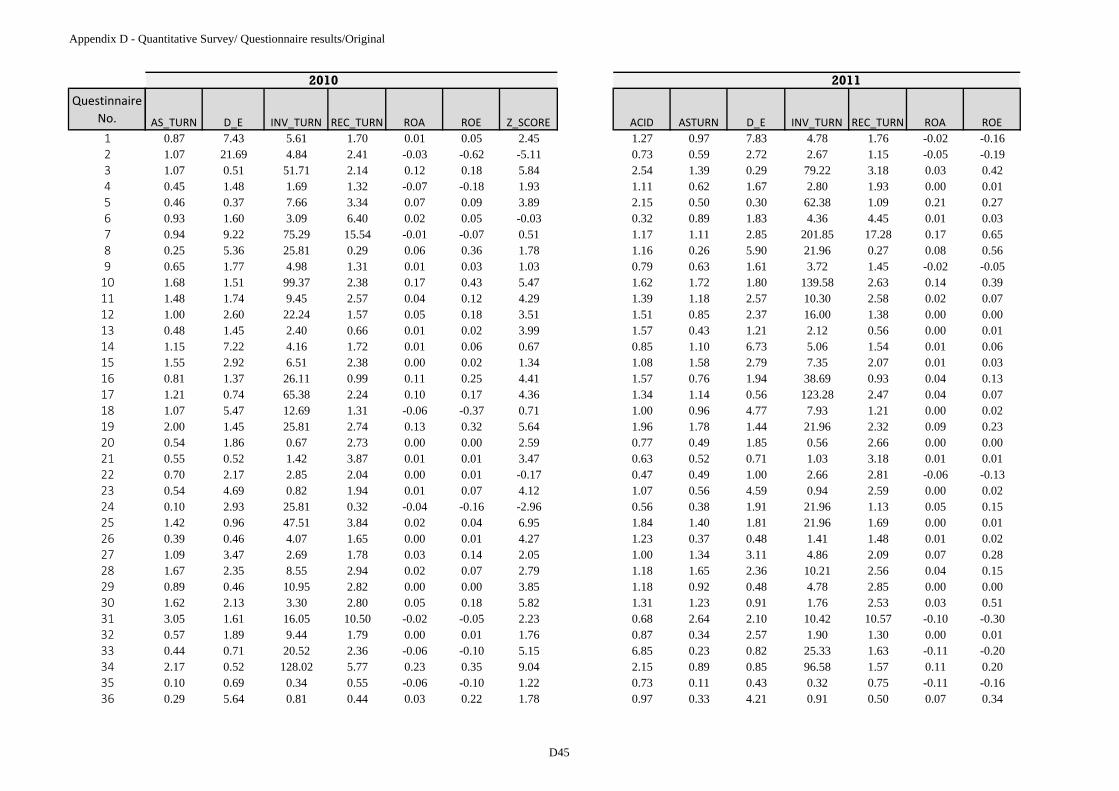
Appendix D - Quantitative Survey/ Questionnaire results/Original
Questinnaire No.123456789101112131415161718192021222324252627282930313233343536
AS_TURN D_E INV_TURN REC_TURN ROA ROE Z_SCORE ACID ASTURN D_E INV_TURN REC_TURN ROA ROE0.87 7.43 5.61 1.70 0.01 0.05 2.45 1.27 0.97 7.83 4.78 1.76 -0.02 -0.161.07 21.69 4.84 2.41 -0.03 -0.62 -5.11 0.73 0.59 2.72 2.67 1.15 -0.05 -0.191.07 0.51 51.71 2.14 0.12 0.18 5.84 2.54 1.39 0.29 79.22 3.18 0.03 0.420.45 1.48 1.69 1.32 -0.07 -0.18 1.93 1.11 0.62 1.67 2.80 1.93 0.00 0.010.46 0.37 7.66 3.34 0.07 0.09 3.89 2.15 0.50 0.30 62.38 1.09 0.21 0.270.93 1.60 3.09 6.40 0.02 0.05 -0.03 0.32 0.89 1.83 4.36 4.45 0.01 0.030.94 9.22 75.29 15.54 -0.01 -0.07 0.51 1.17 1.11 2.85 201.85 17.28 0.17 0.650.25 5.36 25.81 0.29 0.06 0.36 1.78 1.16 0.26 5.90 21.96 0.27 0.08 0.560.65 1.77 4.98 1.31 0.01 0.03 1.03 0.79 0.63 1.61 3.72 1.45 -0.02 -0.051.68 1.51 99.37 2.38 0.17 0.43 5.47 1.62 1.72 1.80 139.58 2.63 0.14 0.391.48 1.74 9.45 2.57 0.04 0.12 4.29 1.39 1.18 2.57 10.30 2.58 0.02 0.071.00 2.60 22.24 1.57 0.05 0.18 3.51 1.51 0.85 2.37 16.00 1.38 0.00 0.000.48 1.45 2.40 0.66 0.01 0.02 3.99 1.57 0.43 1.21 2.12 0.56 0.00 0.011.15 7.22 4.16 1.72 0.01 0.06 0.67 0.85 1.10 6.73 5.06 1.54 0.01 0.061.55 2.92 6.51 2.38 0.00 0.02 1.34 1.08 1.58 2.79 7.35 2.07 0.01 0.030.81 1.37 26.11 0.99 0.11 0.25 4.41 1.57 0.76 1.94 38.69 0.93 0.04 0.131.21 0.74 65.38 2.24 0.10 0.17 4.36 1.34 1.14 0.56 123.28 2.47 0.04 0.071.07 5.47 12.69 1.31 -0.06 -0.37 0.71 1.00 0.96 4.77 7.93 1.21 0.00 0.022.00 1.45 25.81 2.74 0.13 0.32 5.64 1.96 1.78 1.44 21.96 2.32 0.09 0.230.54 1.86 0.67 2.73 0.00 0.00 2.59 0.77 0.49 1.85 0.56 2.66 0.00 0.000.55 0.52 1.42 3.87 0.01 0.01 3.47 0.63 0.52 0.71 1.03 3.18 0.01 0.010.70 2.17 2.85 2.04 0.00 0.01 -0.17 0.47 0.49 1.00 2.66 2.81 -0.06 -0.130.54 4.69 0.82 1.94 0.01 0.07 4.12 1.07 0.56 4.59 0.94 2.59 0.00 0.020.10 2.93 25.81 0.32 -0.04 -0.16 -2.96 0.56 0.38 1.91 21.96 1.13 0.05 0.151.42 0.96 47.51 3.84 0.02 0.04 6.95 1.84 1.40 1.81 21.96 1.69 0.00 0.010.39 0.46 4.07 1.65 0.00 0.01 4.27 1.23 0.37 0.48 1.41 1.48 0.01 0.021.09 3.47 2.69 1.78 0.03 0.14 2.05 1.00 1.34 3.11 4.86 2.09 0.07 0.281.67 2.35 8.55 2.94 0.02 0.07 2.79 1.18 1.65 2.36 10.21 2.56 0.04 0.150.89 0.46 10.95 2.82 0.00 0.00 3.85 1.18 0.92 0.48 4.78 2.85 0.00 0.001.62 2.13 3.30 2.80 0.05 0.18 5.82 1.31 1.23 0.91 1.76 2.53 0.03 0.513.05 1.61 16.05 10.50 -0.02 -0.05 2.23 0.68 2.64 2.10 10.42 10.57 -0.10 -0.300.57 1.89 9.44 1.79 0.00 0.01 1.76 0.87 0.34 2.57 1.90 1.30 0.00 0.010.44 0.71 20.52 2.36 -0.06 -0.10 5.15 6.85 0.23 0.82 25.33 1.63 -0.11 -0.202.17 0.52 128.02 5.77 0.23 0.35 9.04 2.15 0.89 0.85 96.58 1.57 0.11 0.200.10 0.69 0.34 0.55 -0.06 -0.10 1.22 0.73 0.11 0.43 0.32 0.75 -0.11 -0.160.29 5.64 0.81 0.44 0.03 0.22 1.78 0.97 0.33 4.21 0.91 0.50 0.07 0.34
2010 2011
D45

Appendix D - Quantitative Survey/ Questionnaire results/Original
Questinnaire No.37383940414243444546474849505152535455565758596061626364656667686970717273
AS_TURN D_E INV_TURN REC_TURN ROA ROE Z_SCORE ACID ASTURN D_E INV_TURN REC_TURN ROA ROE1.33 0.63 5.84 2.32 0.06 0.09 6.19 2.50 1.34 0.47 7.57 2.26 0.10 0.150.21 0.20 1.46 0.57 0.02 0.02 8.41 3.82 0.16 0.17 1.61 0.37 0.01 0.021.58 1.22 3.22 5.38 0.11 0.24 3.26 2.23 1.64 0.46 5.68 2.90 0.03 0.481.45 0.77 7.02 1.81 0.05 0.10 5.91 1.83 1.75 0.67 4.86 2.52 0.06 0.110.58 0.36 2.09 2.09 0.05 0.07 7.34 3.75 0.64 0.14 2.26 2.90 0.05 0.060.88 0.85 18.45 1.35 0.12 0.22 5.88 2.46 0.71 0.51 14.85 1.06 0.03 0.040.55 0.23 0.98 2.97 0.14 0.17 10.84 4.21 0.44 0.14 1.47 2.73 0.09 0.100.46 0.27 79.80 2.87 0.08 0.10 5.17 1.25 0.53 0.23 82.10 2.67 0.11 0.131.63 1.45 25.81 4.66 0.09 0.23 4.00 1.88 1.06 1.23 21.96 2.68 0.12 0.280.92 1.99 11.39 1.19 0.00 0.00 2.79 1.15 0.55 1.91 2.55 0.86 -0.03 -0.101.21 0.57 8.70 2.23 0.02 0.02 6.19 1.83 0.95 0.89 7.80 1.39 -0.02 -0.400.95 0.43 25.81 1.74 -0.03 -0.41 5.18 4.54 0.96 0.23 21.96 1.64 0.05 0.060.75 0.99 4.43 1.40 0.17 0.33 4.94 1.62 0.71 0.57 3.10 1.37 0.13 0.200.45 0.20 2.02 0.67 0.04 0.04 9.84 3.20 0.64 0.31 2.67 0.90 0.06 0.071.34 0.13 7.43 4.57 -0.02 -0.02 9.56 2.30 1.29 0.23 5.56 3.66 0.06 0.070.76 0.53 2.25 1.34 0.01 0.02 7.95 3.76 0.87 0.47 2.64 1.56 0.00 0.011.16 0.82 12.59 2.29 0.08 0.14 4.68 3.59 1.20 0.28 8.08 1.82 0.10 0.120.51 0.54 1.35 1.27 0.00 0.01 4.53 1.30 0.14 0.53 0.30 0.33 -0.03 -0.041.89 0.16 10.96 10.25 0.06 0.07 9.55 1.94 2.08 0.27 14.77 6.49 0.05 0.070.93 0.34 20.51 1.46 0.22 0.31 10.59 4.65 0.84 0.27 21.26 1.59 0.20 0.270.50 1.60 2.45 0.74 0.01 0.02 4.04 1.49 0.46 1.36 1.73 0.66 -0.01 -0.030.87 0.29 25.81 1.76 0.03 0.36 10.97 7.69 0.37 0.11 10.85 0.87 0.03 0.030.38 0.04 1.73 0.96 -0.02 -0.02 3.44 1.12 0.37 0.08 1.57 1.06 0.04 0.042.20 1.59 3.99 4.09 0.03 0.07 3.60 1.15 1.80 1.18 3.89 3.54 0.02 0.041.49 0.62 25.81 2.53 0.04 0.76 11.15 4.26 1.02 0.41 21.96 1.82 0.23 0.341.26 1.79 10.55 1.54 0.02 0.72 5.84 2.19 1.40 0.61 4.25 2.31 0.03 0.510.71 0.25 26.08 3.42 0.08 0.11 9.13 4.44 0.61 0.17 19.47 3.70 0.03 0.030.62 0.20 1.43 4.36 0.06 0.08 9.01 0.98 0.14 0.06 0.20 2.66 0.03 0.030.64 1.29 1.40 1.73 0.10 0.22 3.61 0.83 0.65 1.07 1.40 1.76 0.06 0.130.51 0.36 2.12 2.42 -0.04 -0.05 5.00 1.45 0.63 0.36 2.17 2.83 0.00 0.001.42 21.89 6.96 2.41 0.02 0.42 0.53 2.89 0.58 0.24 19.11 1.13 -0.02 -0.211.42 21.89 6.96 2.41 0.02 0.42 0.53 2.89 0.58 0.24 19.11 1.13 -0.02 -0.210.60 0.22 7.21 1.45 -0.02 -0.22 8.25 2.89 0.58 0.24 19.11 1.13 -0.02 -0.210.95 0.46 7.51 1.84 0.00 0.00 5.51 1.86 0.63 0.33 3.92 1.41 -0.01 -0.020.27 1.72 3.58 0.34 0.00 0.00 3.73 1.79 0.37 1.15 4.91 0.47 0.17 0.370.30 0.24 44.12 14.79 -0.03 -0.03 5.77 2.57 0.31 0.22 49.39 17.79 0.00 0.000.68 0.31 1.34 1.85 0.00 0.00 7.97 1.55 0.62 0.39 1.15 1.74 -0.03 -0.04
D46

Appendix D - Quantitative Survey/ Questionnaire results/Original
Questinnaire No.7475767778798081828384858687888990919293949596979899100101102103104105106107108109110
AS_TURN D_E INV_TURN REC_TURN ROA ROE Z_SCORE ACID ASTURN D_E INV_TURN REC_TURN ROA ROE1.84 2.12 55.94 2.80 0.03 0.79 5.00 1.59 1.98 1.60 4.66 2.79 0.14 0.371.11 0.74 7.37 3.33 0.07 0.12 7.01 3.57 1.05 0.41 8.60 3.78 0.07 0.100.42 0.31 16.85 0.88 -0.01 -0.01 8.75 3.60 0.28 0.22 3.41 0.62 -0.06 -0.071.66 1.05 3.45 2.67 0.16 0.33 5.96 1.41 1.70 0.91 3.98 2.58 0.17 0.330.75 0.23 4.34 2.44 0.02 0.03 8.23 4.03 0.77 0.12 4.48 3.43 0.02 0.021.25 1.68 43.86 1.61 0.20 0.56 5.35 2.02 1.24 0.88 404.97 1.56 0.15 0.281.17 0.67 9.47 1.63 0.14 0.24 6.63 2.42 1.18 0.43 5.58 1.72 0.16 0.220.46 0.09 1.96 2.48 0.00 0.00 15.07 2.20 0.41 0.22 0.98 2.62 -0.01 -0.011.50 0.40 33.10 2.52 0.07 0.10 6.57 2.12 1.31 0.48 15.22 2.07 0.11 0.171.03 0.53 5.36 2.00 0.01 0.01 5.67 2.05 1.01 0.83 6.04 1.99 0.05 0.080.40 0.81 25.81 1.57 -0.02 -0.03 4.65 1.35 0.16 0.66 21.96 2.35 -0.02 -0.370.40 0.16 1.87 1.48 -0.13 -0.15 6.24 4.94 0.44 0.10 1.70 1.77 -0.06 -0.071.03 0.47 26.33 2.20 0.08 0.12 8.29 3.75 1.01 0.34 8.43 2.09 0.05 0.061.15 1.94 19.01 1.41 0.03 0.09 3.25 1.64 1.35 1.24 102.26 1.61 0.02 0.560.31 0.12 76.58 9.73 0.01 0.02 10.77 1.41 0.34 0.12 103.42 9.69 0.04 0.040.51 0.39 61.31 1.00 0.15 0.20 6.11 2.16 0.46 0.32 62.15 1.01 0.15 0.190.55 1.80 15.87 0.88 0.06 0.16 1.43 1.05 0.24 1.16 1.07 0.46 0.01 0.030.54 0.24 7.20 2.07 0.04 0.05 12.22 4.37 0.50 0.29 9.83 2.47 0.00 0.000.97 1.18 2.95 3.20 0.02 0.04 4.20 1.07 1.19 0.72 3.23 3.99 0.05 0.090.53 0.27 5.68 2.59 0.03 0.04 4.83 1.25 0.46 0.26 3.82 1.89 0.02 0.020.89 0.68 1.72 2.83 0.03 0.04 7.03 3.06 0.74 0.54 1.59 2.33 0.07 0.110.70 1.26 20.23 0.86 0.08 0.17 4.96 1.77 0.54 0.97 8.76 0.68 0.04 0.080.82 0.75 25.81 1.35 0.14 0.24 4.48 2.55 1.02 0.47 21.96 1.65 0.03 0.491.08 0.82 2.66 3.17 -0.03 -0.05 4.31 4.76 1.15 0.77 3.18 3.69 -0.02 -0.280.28 0.11 1.11 1.64 -0.03 -0.04 10.60 2.25 0.29 0.10 1.09 1.42 -0.05 -0.050.54 0.14 1.62 2.32 0.02 0.03 11.22 3.43 0.56 0.10 1.59 3.50 0.01 0.010.63 0.40 2.74 1.06 -0.01 -0.01 8.08 4.80 0.62 0.20 3.51 1.22 -0.03 -0.040.73 1.74 25.81 1.03 0.01 0.03 2.74 1.53 0.68 1.03 21.96 1.04 0.01 0.021.06 0.39 4.51 2.30 0.11 0.15 8.81 3.48 0.95 0.29 4.00 2.07 0.10 0.141.23 0.74 4.84 2.26 0.17 0.30 6.35 1.77 1.52 0.49 4.58 3.31 0.08 0.120.85 1.38 2.42 1.20 0.01 0.03 2.93 0.76 0.48 1.17 -0.14 1.28 -0.03 -0.071.09 0.76 7.48 1.82 0.13 0.22 5.60 1.85 1.41 0.57 8.18 2.44 0.15 0.230.56 0.40 25.81 1.79 0.00 0.01 3.36 1.28 0.56 0.38 21.96 2.95 0.01 0.010.74 0.55 16.77 1.40 0.07 0.10 4.12 2.72 0.48 0.30 15.52 0.83 0.04 0.050.66 0.30 156.21 4.40 0.10 0.13 5.99 2.40 0.65 0.21 128.14 5.84 0.06 0.070.65 0.13 4.71 1.47 -0.01 -0.01 12.88 6.28 0.95 0.13 12.37 1.66 0.00 0.001.35 2.04 124.86 4.20 0.13 0.41 2.51 1.07 0.64 1.05 70.58 2.76 0.19 0.38
D47

Appendix D - Quantitative Survey/ Questionnaire results/Original
Questinnaire No.111112113114115116117118119120121122123124125126127128129130131132133134135136137138139140141142143144145146147
AS_TURN D_E INV_TURN REC_TURN ROA ROE Z_SCORE ACID ASTURN D_E INV_TURN REC_TURN ROA ROE0.91 0.45 3.98 2.30 0.11 0.16 7.44 4.52 0.85 0.16 3.14 3.51 0.06 0.071.38 0.50 24.19 2.78 0.06 0.09 6.72 2.44 1.50 0.42 12.29 2.80 0.15 0.220.38 0.25 1.71 1.42 0.02 0.03 7.05 1.39 0.36 0.25 1.60 1.34 0.02 0.020.22 0.06 1.12 1.50 -0.04 -0.04 19.60 3.38 0.27 0.06 1.24 1.81 -0.04 -0.050.52 0.28 1.80 1.55 0.00 0.00 6.19 1.92 0.41 0.23 1.56 1.15 -0.06 -0.071.23 0.62 7.74 2.04 0.10 0.17 7.35 1.73 1.34 0.62 6.56 2.13 0.12 0.201.50 1.87 5.92 2.39 0.11 0.31 3.44 1.39 1.49 1.17 6.35 2.15 0.07 0.172.12 0.34 8.43 4.97 0.18 0.24 8.76 2.05 2.96 0.32 6.53 6.66 0.04 0.541.71 1.12 17.09 2.01 0.18 0.39 5.52 2.41 1.52 0.60 16.20 1.75 0.13 0.210.78 0.82 13.73 1.62 0.05 0.11 4.30 2.48 0.84 0.64 14.54 1.90 0.07 0.110.29 0.24 1.04 1.69 -0.01 -0.01 7.53 1.71 0.23 0.29 0.79 1.19 0.00 0.000.29 5.64 0.81 0.44 0.03 0.22 1.78 0.97 0.33 4.21 0.91 0.50 0.07 0.341.33 0.63 5.84 2.32 0.06 0.09 6.19 2.50 1.34 0.47 7.57 2.26 0.10 0.150.21 0.20 1.46 0.57 0.02 0.02 8.41 3.82 0.16 0.17 1.61 0.37 0.01 0.021.58 1.22 3.22 5.38 0.11 0.24 3.26 2.23 1.64 0.46 5.68 2.90 0.03 0.481.45 0.77 7.02 1.81 0.05 0.10 5.91 1.83 1.75 0.67 4.86 2.52 0.06 0.110.58 0.36 2.09 2.09 0.05 0.07 7.34 3.75 0.64 0.14 2.26 2.90 0.05 0.060.88 0.85 18.45 1.35 0.12 0.22 5.88 2.46 0.71 0.51 14.85 1.06 0.03 0.040.55 0.23 0.98 2.97 0.14 0.17 10.84 4.21 0.44 0.14 1.47 2.73 0.09 0.100.46 0.27 79.80 2.87 0.08 0.10 5.17 1.25 0.53 0.23 82.10 2.67 0.11 0.131.63 1.45 25.81 4.66 0.09 0.23 4.00 1.88 1.06 1.23 21.96 2.68 0.12 0.280.92 1.99 11.39 1.19 0.00 0.00 2.79 1.15 0.55 1.91 2.55 0.86 -0.03 -0.101.21 0.57 8.70 2.23 0.02 0.02 6.19 1.83 0.95 0.89 7.80 1.39 -0.02 -0.400.95 0.43 25.81 1.74 -0.03 -0.41 5.18 4.54 0.96 0.23 21.96 1.64 0.05 0.060.75 0.99 4.43 1.40 0.17 0.33 4.94 1.62 0.71 0.57 3.10 1.37 0.13 0.200.45 0.20 2.02 0.67 0.04 0.04 9.84 3.20 0.64 0.31 2.67 0.90 0.06 0.071.34 0.13 7.43 4.57 -0.02 -0.02 9.56 2.30 1.29 0.23 5.56 3.66 0.06 0.070.76 0.53 2.25 1.34 0.01 0.02 7.95 3.76 0.87 0.47 2.64 1.56 0.00 0.011.16 0.82 12.59 2.29 0.08 0.14 4.68 3.59 1.20 0.28 8.08 1.82 0.10 0.120.51 0.54 1.35 1.27 0.00 0.01 4.53 1.30 0.14 0.53 0.30 0.33 -0.03 -0.041.89 0.16 10.96 10.25 0.06 0.07 9.55 1.94 2.08 0.27 14.77 6.49 0.05 0.070.93 0.34 20.51 1.46 0.22 0.31 10.59 4.65 0.84 0.27 21.26 1.59 0.20 0.270.50 1.60 2.45 0.74 0.01 0.02 4.04 1.49 0.46 1.36 1.73 0.66 -0.01 -0.030.87 0.29 25.81 1.76 0.03 0.36 10.97 7.69 0.37 0.11 10.85 0.87 0.03 0.030.38 0.04 1.73 0.96 -0.02 -0.02 3.44 1.12 0.37 0.08 1.57 1.06 0.04 0.042.20 1.59 3.99 4.09 0.03 0.07 3.60 1.15 1.80 1.18 3.89 3.54 0.02 0.041.49 0.62 25.81 2.53 0.04 0.76 11.15 4.26 1.02 0.41 21.96 1.82 0.23 0.34
D48
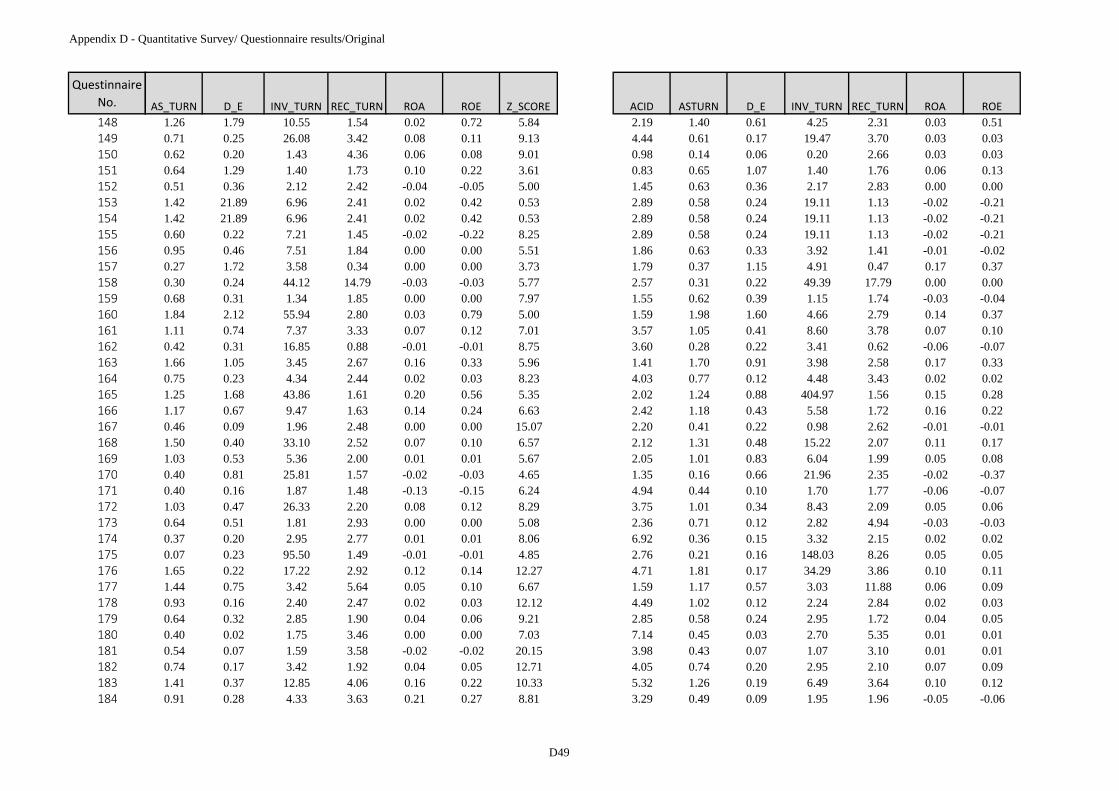
Appendix D - Quantitative Survey/ Questionnaire results/Original
Questinnaire No.148149150151152153154155156157158159160161162163164165166167168169170171172173174175176177178179180181182183184
AS_TURN D_E INV_TURN REC_TURN ROA ROE Z_SCORE ACID ASTURN D_E INV_TURN REC_TURN ROA ROE1.26 1.79 10.55 1.54 0.02 0.72 5.84 2.19 1.40 0.61 4.25 2.31 0.03 0.510.71 0.25 26.08 3.42 0.08 0.11 9.13 4.44 0.61 0.17 19.47 3.70 0.03 0.030.62 0.20 1.43 4.36 0.06 0.08 9.01 0.98 0.14 0.06 0.20 2.66 0.03 0.030.64 1.29 1.40 1.73 0.10 0.22 3.61 0.83 0.65 1.07 1.40 1.76 0.06 0.130.51 0.36 2.12 2.42 -0.04 -0.05 5.00 1.45 0.63 0.36 2.17 2.83 0.00 0.001.42 21.89 6.96 2.41 0.02 0.42 0.53 2.89 0.58 0.24 19.11 1.13 -0.02 -0.211.42 21.89 6.96 2.41 0.02 0.42 0.53 2.89 0.58 0.24 19.11 1.13 -0.02 -0.210.60 0.22 7.21 1.45 -0.02 -0.22 8.25 2.89 0.58 0.24 19.11 1.13 -0.02 -0.210.95 0.46 7.51 1.84 0.00 0.00 5.51 1.86 0.63 0.33 3.92 1.41 -0.01 -0.020.27 1.72 3.58 0.34 0.00 0.00 3.73 1.79 0.37 1.15 4.91 0.47 0.17 0.370.30 0.24 44.12 14.79 -0.03 -0.03 5.77 2.57 0.31 0.22 49.39 17.79 0.00 0.000.68 0.31 1.34 1.85 0.00 0.00 7.97 1.55 0.62 0.39 1.15 1.74 -0.03 -0.041.84 2.12 55.94 2.80 0.03 0.79 5.00 1.59 1.98 1.60 4.66 2.79 0.14 0.371.11 0.74 7.37 3.33 0.07 0.12 7.01 3.57 1.05 0.41 8.60 3.78 0.07 0.100.42 0.31 16.85 0.88 -0.01 -0.01 8.75 3.60 0.28 0.22 3.41 0.62 -0.06 -0.071.66 1.05 3.45 2.67 0.16 0.33 5.96 1.41 1.70 0.91 3.98 2.58 0.17 0.330.75 0.23 4.34 2.44 0.02 0.03 8.23 4.03 0.77 0.12 4.48 3.43 0.02 0.021.25 1.68 43.86 1.61 0.20 0.56 5.35 2.02 1.24 0.88 404.97 1.56 0.15 0.281.17 0.67 9.47 1.63 0.14 0.24 6.63 2.42 1.18 0.43 5.58 1.72 0.16 0.220.46 0.09 1.96 2.48 0.00 0.00 15.07 2.20 0.41 0.22 0.98 2.62 -0.01 -0.011.50 0.40 33.10 2.52 0.07 0.10 6.57 2.12 1.31 0.48 15.22 2.07 0.11 0.171.03 0.53 5.36 2.00 0.01 0.01 5.67 2.05 1.01 0.83 6.04 1.99 0.05 0.080.40 0.81 25.81 1.57 -0.02 -0.03 4.65 1.35 0.16 0.66 21.96 2.35 -0.02 -0.370.40 0.16 1.87 1.48 -0.13 -0.15 6.24 4.94 0.44 0.10 1.70 1.77 -0.06 -0.071.03 0.47 26.33 2.20 0.08 0.12 8.29 3.75 1.01 0.34 8.43 2.09 0.05 0.060.64 0.51 1.81 2.93 0.00 0.00 5.08 2.36 0.71 0.12 2.82 4.94 -0.03 -0.030.37 0.20 2.95 2.77 0.01 0.01 8.06 6.92 0.36 0.15 3.32 2.15 0.02 0.020.07 0.23 95.50 1.49 -0.01 -0.01 4.85 2.76 0.21 0.16 148.03 8.26 0.05 0.051.65 0.22 17.22 2.92 0.12 0.14 12.27 4.71 1.81 0.17 34.29 3.86 0.10 0.111.44 0.75 3.42 5.64 0.05 0.10 6.67 1.59 1.17 0.57 3.03 11.88 0.06 0.090.93 0.16 2.40 2.47 0.02 0.03 12.12 4.49 1.02 0.12 2.24 2.84 0.02 0.030.64 0.32 2.85 1.90 0.04 0.06 9.21 2.85 0.58 0.24 2.95 1.72 0.04 0.050.40 0.02 1.75 3.46 0.00 0.00 7.03 7.14 0.45 0.03 2.70 5.35 0.01 0.010.54 0.07 1.59 3.58 -0.02 -0.02 20.15 3.98 0.43 0.07 1.07 3.10 0.01 0.010.74 0.17 3.42 1.92 0.04 0.05 12.71 4.05 0.74 0.20 2.95 2.10 0.07 0.091.41 0.37 12.85 4.06 0.16 0.22 10.33 5.32 1.26 0.19 6.49 3.64 0.10 0.120.91 0.28 4.33 3.63 0.21 0.27 8.81 3.29 0.49 0.09 1.95 1.96 -0.05 -0.06
D49

Appendix D - Quantitative Survey/ Questionnaire results/Original
Questinnaire No.185186187188189190191192193194195196197198199200201202203204205206207208209210211212213214215216217218219220221
AS_TURN D_E INV_TURN REC_TURN ROA ROE Z_SCORE ACID ASTURN D_E INV_TURN REC_TURN ROA ROE0.38 0.12 64.03 2.12 0.02 0.03 17.77 3.63 0.39 0.07 14.19 1.86 0.04 0.040.47 2.61 5.17 2.79 0.01 0.04 -0.03 0.43 0.42 2.94 4.69 2.69 -0.01 -0.052.76 4.55 17.50 3.87 0.08 0.43 3.06 0.98 2.89 4.18 19.01 3.85 0.02 0.100.88 6.08 3.14 1.99 0.01 0.04 0.85 0.72 1.04 7.26 3.39 2.22 0.00 -0.041.29 7.07 3.38 0.92 -0.02 -0.15 -1.54 0.29 1.18 8.63 3.04 7.49 -0.20 -0.190.35 2.52 1.15 1.57 -0.01 -0.03 -0.90 0.32 0.30 4.78 0.93 1.34 -0.09 -0.550.53 2.14 2.16 1.84 -0.02 -0.07 0.17 0.68 0.78 1.83 4.02 2.39 -0.04 -0.130.57 0.59 3.10 2.00 -0.01 -0.11 2.26 1.41 0.51 0.58 4.38 1.73 -0.07 -0.111.06 2.50 8.64 1.82 0.05 0.16 3.10 1.29 1.15 2.64 7.57 1.80 0.03 0.130.61 8.07 4.43 2.28 -0.01 -0.06 -2.44 0.45 0.50 8.42 2.95 1.57 0.00 0.010.68 1.57 26.36 1.35 0.00 -0.01 2.75 1.75 0.82 1.43 39.84 1.54 -0.01 -0.030.43 2.75 34.60 1.13 0.04 0.16 3.23 1.25 5.31 1.22 33.38 1.18 0.02 0.460.85 0.86 14.58 3.11 0.01 0.03 1.19 0.71 0.76 0.70 11.94 3.33 0.01 0.020.52 0.22 12.51 1.86 0.09 0.12 9.30 2.58 0.50 0.38 14.58 1.54 -0.11 -0.161.07 2.28 3.08 2.15 0.07 0.22 4.15 1.27 1.18 1.57 3.04 2.37 0.12 0.320.49 12.84 2.98 0.94 0.01 0.16 2.40 1.66 0.46 10.14 2.13 0.84 0.03 0.351.69 1.58 2.09 3.86 0.14 0.36 4.51 0.90 1.54 1.32 2.08 3.34 0.13 0.292.16 1.17 32.66 7.86 0.12 0.28 2.63 1.14 1.68 1.10 50.82 6.70 0.09 0.190.42 1.44 12.51 3.72 0.06 0.15 0.14 0.29 0.39 1.54 14.58 4.06 -0.03 -0.080.78 1.17 3.64 1.33 0.01 0.02 4.70 1.05 0.78 1.53 2.40 1.42 0.00 0.000.94 0.94 6.47 2.01 -0.01 -0.02 2.22 1.32 0.96 1.05 10.86 1.43 0.10 0.201.09 1.42 4.69 1.57 0.08 0.19 4.32 1.17 0.98 1.79 4.38 1.34 0.08 0.230.64 1.47 10.65 2.54 -0.02 -0.05 -2.43 0.46 0.58 2.39 7.22 2.08 -0.14 -0.510.86 1.03 32.49 6.96 0.02 0.48 4.80 0.86 0.19 1.12 8.22 0.92 0.01 0.020.37 2.12 1.15 0.97 -0.02 -0.06 1.59 0.81 0.39 1.95 1.06 1.05 -0.02 -0.05
1.80 0.52 0.73 2.77 2.40 0.01 0.010.60 0.28 1.26 1.89 0.00 0.00 8.06 2.15 0.57 0.23 1.21 1.65 0.01 0.011.76 0.46 4.87 0.96 0.07 0.11 5.88 1.56 1.30 0.25 4.28 7.47 0.02 0.020.92 2.19 8.58 1.31 0.04 0.11 3.56 1.51 0.90 2.08 8.78 1.27 0.01 0.050.49 0.65 6.69 0.77 -0.01 -0.09 3.90 1.90 0.47 0.61 6.36 0.68 -0.02 -0.030.58 0.44 7.03 2.87 0.00 0.00 4.03 2.05 0.59 0.35 6.74 1.90 -0.01 -0.010.62 0.37 6.29 1.44 0.05 0.07 6.81 1.75 0.53 0.37 5.61 1.20 0.04 0.050.88 1.02 3.37 1.38 0.03 0.06 6.22 2.45 0.90 0.54 3.17 1.36 0.02 0.030.64 0.55 1.83 1.89 0.19 0.29 8.62 2.65 0.66 0.35 1.65 1.91 0.02 0.221.01 0.60 5.21 1.63 0.13 0.21 6.40 2.00 1.00 0.62 5.09 1.51 0.11 0.190.38 1.53 2.47 1.67 0.08 0.21 0.73 0.92 0.79 2.74 2.05 1.40 0.13 0.481.06 0.74 5.53 1.99 0.21 0.38 6.57 2.01 0.93 0.53 3.64 1.87 0.14 0.22
D50

Appendix D - Quantitative Survey/ Questionnaire results/Original
Questinnaire No.222223224225226227228229230231232233234235236237238239240241242243244245246247248249250251252253254255256257258
AS_TURN D_E INV_TURN REC_TURN ROA ROE Z_SCORE ACID ASTURN D_E INV_TURN REC_TURN ROA ROE1.23 0.74 4.17 2.83 0.09 0.15 5.59 1.58 1.21 0.45 3.69 2.67 0.08 0.120.86 0.69 3.25 2.17 0.00 0.00 3.99 1.27 0.99 0.65 3.47 2.37 0.01 0.010.78 0.50 13.54 2.03 0.19 0.29 6.29 2.16 0.84 0.27 16.57 2.83 0.02 0.240.97 0.55 2.11 2.26 0.18 0.28 7.17 4.08 0.76 0.26 1.95 2.19 0.02 0.241.25 0.30 2.78 2.89 0.02 0.03 8.02 3.03 1.20 0.20 3.16 2.73 0.05 0.060.31 0.52 14.99 0.36 0.13 0.20 8.57 2.89 0.24 0.45 36.83 0.53 0.06 0.091.30 1.35 12.51 3.43 0.03 0.08 2.72 1.78 0.80 0.72 14.58 1.55 0.09 0.160.82 0.32 3.33 1.46 0.11 0.14 7.72 2.49 0.89 0.26 2.47 1.99 0.12 0.160.51 0.26 0.80 1.63 0.00 0.00 10.00 2.98 0.42 0.18 0.62 1.52 -0.03 -0.040.96 2.41 3.01 2.05 0.02 0.07 2.64 0.86 0.91 2.06 2.35 1.94 0.05 0.161.82 2.11 12.51 2.19 0.03 0.93 4.85 2.06 1.80 0.77 14.58 2.12 0.03 0.500.58 0.27 3.03 1.39 -0.03 -0.05 8.96 4.43 0.51 0.33 2.95 1.37 -0.09 -0.120.84 1.07 12.51 1.18 0.03 0.59 6.51 4.77 0.93 0.27 14.58 1.32 0.04 0.500.64 0.14 7.26 5.96 -0.03 -0.03 7.94 1.32 0.63 0.10 8.34 6.52 -0.04 -0.040.45 0.68 3.39 1.18 -0.01 -0.20 1.54 1.20 0.42 0.63 2.62 1.14 0.01 0.020.66 0.45 1.58 2.29 0.10 0.14 7.57 2.02 0.67 0.29 1.56 2.80 0.09 0.111.84 0.30 6.48 3.99 0.05 0.07 7.73 2.53 1.87 0.29 7.62 4.56 0.11 0.152.32 0.22 8.08 3.85 -0.04 -0.06 11.03 6.93 1.89 0.12 5.75 3.40 -0.05 -0.071.07 1.52 22.08 1.26 0.08 0.19 4.02 1.90 0.78 1.08 24.60 1.00 0.07 0.140.84 0.72 2.96 1.88 0.03 0.06 5.78 1.52 0.94 0.62 3.22 1.98 0.04 0.060.56 0.30 3.30 1.56 -0.04 -0.05 6.40 3.08 0.59 0.28 3.01 1.49 -0.03 -0.031.19 0.30 11.70 2.45 0.07 0.09 7.82 3.24 1.24 0.22 9.65 3.20 -0.07 -0.090.49 0.46 16.09 1.30 -0.03 -0.05 6.24 1.56 0.54 0.75 8.32 1.75 0.04 0.070.36 0.05 64.82 1.37 0.08 0.09 2.52 3.00 0.36 0.10 50.61 1.37 0.05 0.051.27 0.84 2.09 5.32 0.10 0.18 5.17 0.67 1.38 0.68 2.24 6.12 0.07 0.110.73 1.20 2.49 1.37 -0.02 -0.04 3.35 1.26 0.87 1.71 6.06 1.20 0.00 0.011.14 3.42 21.11 1.96 0.14 0.64 4.59 4.29 0.99 2.25 25.24 1.44 0.11 0.360.50 0.39 5.59 2.24 0.00 0.00 7.74 1.04 0.35 0.13 4.16 1.79 -0.06 -0.060.82 0.19 4.37 3.42 0.04 0.05 10.34 4.52 0.95 0.13 5.37 3.24 0.06 0.071.11 0.26 2.80 4.30 0.04 0.06 8.36 3.97 1.17 0.13 2.79 3.61 0.05 0.060.18 0.12 12.07 6.35 -0.02 -0.02 6.97 2.25 0.21 0.11 122.63 5.45 -0.04 -0.050.96 1.04 1.84 2.52 0.05 0.10 5.29 0.74 0.96 1.24 1.53 2.78 0.06 0.130.76 0.45 1.28 2.46 0.06 0.09 7.07 2.18 0.69 0.25 1.20 2.46 0.07 0.091.13 0.17 5.94 2.19 0.03 0.04 10.78 4.80 1.34 0.15 5.80 2.51 0.01 0.010.76 0.21 12.57 1.56 0.15 0.18 13.43 6.12 0.62 0.17 10.68 1.34 0.08 0.090.99 0.90 3.04 1.66 -0.02 -0.03 2.71 1.33 0.94 0.70 1.82 2.04 0.01 0.021.65 0.57 25.58 2.72 0.00 -0.07 6.68 6.08 1.56 0.27 32.83 2.83 -0.04 -0.05
D51

Appendix D - Quantitative Survey/ Questionnaire results/Original
Questinnaire No.259260261262263264265266267268269270271272273274275276277278279280281282283284285286287288289290291292293294295
AS_TURN D_E INV_TURN REC_TURN ROA ROE Z_SCORE ACID ASTURN D_E INV_TURN REC_TURN ROA ROE1.14 0.74 4.05 2.25 0.07 0.13 5.51 1.19 1.02 0.88 3.19 2.42 0.04 0.080.96 0.45 1.55 3.07 0.15 0.22 8.59 1.84 0.89 0.28 1.17 2.78 0.09 0.121.31 0.69 3.22 2.31 0.11 0.19 7.28 2.15 1.35 0.45 3.49 2.34 0.15 0.210.73 0.70 11.06 1.22 0.03 0.05 6.84 2.85 0.46 0.66 11.49 0.57 -0.15 -0.251.02 0.72 22.56 2.04 0.12 0.21 6.59 3.29 0.99 0.35 18.94 3.59 0.02 0.320.96 0.95 10.15 1.66 0.16 0.30 4.83 3.01 0.73 0.52 4.99 1.27 0.02 0.340.40 0.79 1.23 1.65 0.03 0.06 3.99 1.84 0.41 0.48 1.23 1.88 0.02 0.030.52 0.32 4.24 1.56 0.13 0.18 8.34 2.43 0.61 0.33 3.51 1.93 0.02 0.270.60 0.29 2.09 2.72 0.05 0.06 7.56 1.94 0.73 0.43 9.60 3.46 0.05 0.080.75 0.60 2.19 1.66 0.03 0.06 7.86 2.61 0.50 0.42 1.72 1.05 -0.01 -0.010.52 0.51 4.16 1.95 0.03 0.04 4.65 1.67 0.51 0.47 3.83 1.50 0.03 0.050.58 0.41 16.19 1.26 0.05 0.08 6.37 3.73 0.62 0.43 14.74 1.27 0.05 0.081.30 0.57 6.73 3.79 0.18 0.30 6.54 3.26 1.15 0.24 4.60 4.16 0.02 0.231.59 1.65 7.81 2.50 0.18 0.49 3.44 0.90 1.13 1.65 3.78 2.07 0.06 0.150.60 0.28 1.26 1.89 0.00 0.00 8.06 2.15 0.57 0.23 1.21 1.65 0.01 0.011.76 0.46 4.87 0.96 0.07 0.11 5.88 1.56 1.30 0.25 4.28 7.47 0.02 0.020.92 2.19 8.58 1.31 0.04 0.11 3.56 1.51 0.90 2.08 8.78 1.27 0.01 0.050.49 0.65 6.69 0.77 -0.01 -0.09 3.90 1.90 0.47 0.61 6.36 0.68 -0.02 -0.030.58 0.44 7.03 2.87 0.00 0.00 4.03 2.05 0.59 0.35 6.74 1.90 -0.01 -0.010.62 0.37 6.29 1.44 0.05 0.07 6.81 1.75 0.53 0.37 5.61 1.20 0.04 0.050.88 1.02 3.37 1.38 0.03 0.06 6.22 2.45 0.90 0.54 3.17 1.36 0.02 0.030.64 0.55 1.83 1.89 0.19 0.29 8.62 2.65 0.66 0.35 1.65 1.91 0.02 0.221.01 0.60 5.21 1.63 0.13 0.21 6.40 2.00 1.00 0.62 5.09 1.51 0.11 0.190.38 1.53 2.47 1.67 0.08 0.21 0.73 0.92 0.79 2.74 2.05 1.40 0.13 0.481.06 0.74 5.53 1.99 0.21 0.38 6.57 2.01 0.93 0.53 3.64 1.87 0.14 0.221.23 0.74 4.17 2.83 0.09 0.15 5.59 1.58 1.21 0.45 3.69 2.67 0.08 0.120.86 0.69 3.25 2.17 0.00 0.00 3.99 1.27 0.99 0.65 3.47 2.37 0.01 0.010.78 0.50 13.54 2.03 0.19 0.29 6.29 2.16 0.84 0.27 16.57 2.83 0.02 0.240.97 0.55 2.11 2.26 0.18 0.28 7.17 4.08 0.76 0.26 1.95 2.19 0.02 0.241.25 0.30 2.78 2.89 0.02 0.03 8.02 3.03 1.20 0.20 3.16 2.73 0.05 0.060.31 0.52 14.99 0.36 0.13 0.20 8.57 2.89 0.24 0.45 36.83 0.53 0.06 0.091.30 1.35 12.51 3.43 0.03 0.08 2.72 1.78 0.80 0.72 14.58 1.55 0.09 0.160.82 0.32 3.33 1.46 0.11 0.14 7.72 2.49 0.89 0.26 2.47 1.99 0.12 0.160.51 0.26 0.80 1.63 0.00 0.00 10.00 2.98 0.42 0.18 0.62 1.52 -0.03 -0.040.96 2.41 3.01 2.05 0.02 0.07 2.64 0.86 0.91 2.06 2.35 1.94 0.05 0.161.82 2.11 12.51 2.19 0.03 0.93 4.85 2.06 1.80 0.77 14.58 2.12 0.03 0.500.58 0.27 3.03 1.39 -0.03 -0.05 8.96 4.43 0.51 0.33 2.95 1.37 -0.09 -0.12
D52
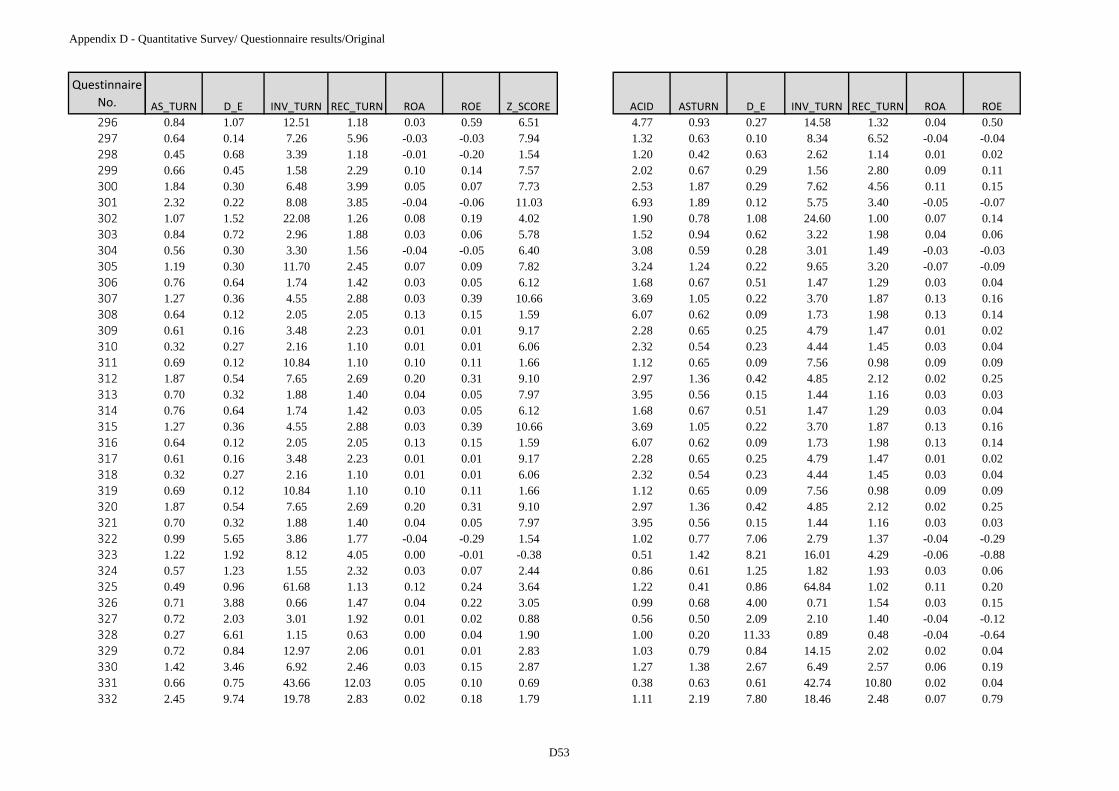
Appendix D - Quantitative Survey/ Questionnaire results/Original
Questinnaire No.296297298299300301302303304305306307308309310311312313314315316317318319320321322323324325326327328329330331332
AS_TURN D_E INV_TURN REC_TURN ROA ROE Z_SCORE ACID ASTURN D_E INV_TURN REC_TURN ROA ROE0.84 1.07 12.51 1.18 0.03 0.59 6.51 4.77 0.93 0.27 14.58 1.32 0.04 0.500.64 0.14 7.26 5.96 -0.03 -0.03 7.94 1.32 0.63 0.10 8.34 6.52 -0.04 -0.040.45 0.68 3.39 1.18 -0.01 -0.20 1.54 1.20 0.42 0.63 2.62 1.14 0.01 0.020.66 0.45 1.58 2.29 0.10 0.14 7.57 2.02 0.67 0.29 1.56 2.80 0.09 0.111.84 0.30 6.48 3.99 0.05 0.07 7.73 2.53 1.87 0.29 7.62 4.56 0.11 0.152.32 0.22 8.08 3.85 -0.04 -0.06 11.03 6.93 1.89 0.12 5.75 3.40 -0.05 -0.071.07 1.52 22.08 1.26 0.08 0.19 4.02 1.90 0.78 1.08 24.60 1.00 0.07 0.140.84 0.72 2.96 1.88 0.03 0.06 5.78 1.52 0.94 0.62 3.22 1.98 0.04 0.060.56 0.30 3.30 1.56 -0.04 -0.05 6.40 3.08 0.59 0.28 3.01 1.49 -0.03 -0.031.19 0.30 11.70 2.45 0.07 0.09 7.82 3.24 1.24 0.22 9.65 3.20 -0.07 -0.090.76 0.64 1.74 1.42 0.03 0.05 6.12 1.68 0.67 0.51 1.47 1.29 0.03 0.041.27 0.36 4.55 2.88 0.03 0.39 10.66 3.69 1.05 0.22 3.70 1.87 0.13 0.160.64 0.12 2.05 2.05 0.13 0.15 1.59 6.07 0.62 0.09 1.73 1.98 0.13 0.140.61 0.16 3.48 2.23 0.01 0.01 9.17 2.28 0.65 0.25 4.79 1.47 0.01 0.020.32 0.27 2.16 1.10 0.01 0.01 6.06 2.32 0.54 0.23 4.44 1.45 0.03 0.040.69 0.12 10.84 1.10 0.10 0.11 1.66 1.12 0.65 0.09 7.56 0.98 0.09 0.091.87 0.54 7.65 2.69 0.20 0.31 9.10 2.97 1.36 0.42 4.85 2.12 0.02 0.250.70 0.32 1.88 1.40 0.04 0.05 7.97 3.95 0.56 0.15 1.44 1.16 0.03 0.030.76 0.64 1.74 1.42 0.03 0.05 6.12 1.68 0.67 0.51 1.47 1.29 0.03 0.041.27 0.36 4.55 2.88 0.03 0.39 10.66 3.69 1.05 0.22 3.70 1.87 0.13 0.160.64 0.12 2.05 2.05 0.13 0.15 1.59 6.07 0.62 0.09 1.73 1.98 0.13 0.140.61 0.16 3.48 2.23 0.01 0.01 9.17 2.28 0.65 0.25 4.79 1.47 0.01 0.020.32 0.27 2.16 1.10 0.01 0.01 6.06 2.32 0.54 0.23 4.44 1.45 0.03 0.040.69 0.12 10.84 1.10 0.10 0.11 1.66 1.12 0.65 0.09 7.56 0.98 0.09 0.091.87 0.54 7.65 2.69 0.20 0.31 9.10 2.97 1.36 0.42 4.85 2.12 0.02 0.250.70 0.32 1.88 1.40 0.04 0.05 7.97 3.95 0.56 0.15 1.44 1.16 0.03 0.030.99 5.65 3.86 1.77 -0.04 -0.29 1.54 1.02 0.77 7.06 2.79 1.37 -0.04 -0.291.22 1.92 8.12 4.05 0.00 -0.01 -0.38 0.51 1.42 8.21 16.01 4.29 -0.06 -0.880.57 1.23 1.55 2.32 0.03 0.07 2.44 0.86 0.61 1.25 1.82 1.93 0.03 0.060.49 0.96 61.68 1.13 0.12 0.24 3.64 1.22 0.41 0.86 64.84 1.02 0.11 0.200.71 3.88 0.66 1.47 0.04 0.22 3.05 0.99 0.68 4.00 0.71 1.54 0.03 0.150.72 2.03 3.01 1.92 0.01 0.02 0.88 0.56 0.50 2.09 2.10 1.40 -0.04 -0.120.27 6.61 1.15 0.63 0.00 0.04 1.90 1.00 0.20 11.33 0.89 0.48 -0.04 -0.640.72 0.84 12.97 2.06 0.01 0.01 2.83 1.03 0.79 0.84 14.15 2.02 0.02 0.041.42 3.46 6.92 2.46 0.03 0.15 2.87 1.27 1.38 2.67 6.49 2.57 0.06 0.190.66 0.75 43.66 12.03 0.05 0.10 0.69 0.38 0.63 0.61 42.74 10.80 0.02 0.042.45 9.74 19.78 2.83 0.02 0.18 1.79 1.11 2.19 7.80 18.46 2.48 0.07 0.79
D53

Appendix D - Quantitative Survey/ Questionnaire results/Original
Questinnaire No.333334335336337338339340341342343344345346347348349350351352353354355356357358359360361362363364365366367368369
AS_TURN D_E INV_TURN REC_TURN ROA ROE Z_SCORE ACID ASTURN D_E INV_TURN REC_TURN ROA ROE1.01 0.65 15.61 1.69 0.02 0.03 5.49 2.95 1.11 0.49 18.27 1.69 0.02 0.021.44 1.34 11.16 4.33 0.00 0.01 2.06 0.98 1.49 1.43 10.88 4.86 0.01 0.020.27 0.66 33.93 7.67 -0.08 -0.13 -0.02 0.54 0.24 0.58 31.99 6.29 -0.01 -0.170.42 0.72 15.74 0.49 -0.03 -0.06 5.71 2.35 0.27 0.62 83.11 0.32 -0.03 -0.051.40 0.25 7.03 1.61 0.07 0.09 9.30 5.52 1.42 0.23 1.96 1.61 0.00 0.011.06 0.54 2.29 2.84 0.01 0.02 6.69 1.63 1.00 0.39 2.31 3.41 0.00 0.001.08 0.14 1.95 2.93 0.00 0.00 13.27 5.06 1.00 0.11 1.85 2.93 -0.03 -0.030.92 2.09 3.86 1.46 0.04 0.13 3.74 2.32 0.85 1.17 3.13 1.52 0.02 0.061.09 0.61 3.50 2.38 0.05 0.08 2.81 1.23 1.00 0.39 3.77 13.46 0.05 0.070.97 0.53 4.30 1.32 0.08 0.12 7.85 2.76 0.92 0.40 3.91 1.26 0.06 0.091.56 0.94 8.23 2.78 0.02 0.47 5.95 1.83 1.57 0.63 7.92 2.90 0.19 0.321.28 1.06 2.51 5.79 0.02 0.32 4.77 0.76 1.31 0.80 2.91 5.06 0.15 0.271.62 0.58 5.51 3.60 0.16 0.27 6.33 1.87 1.60 0.45 5.25 4.65 0.14 0.220.79 0.31 2.92 3.03 0.02 0.02 7.47 1.74 0.83 0.33 3.28 2.85 0.03 0.041.68 2.07 5.76 2.34 -0.06 -0.18 3.03 2.01 1.51 1.24 5.59 2.30 -0.04 -0.110.62 0.78 4.01 1.05 0.07 0.13 4.87 1.63 0.64 0.65 4.09 1.19 0.05 0.100.71 0.22 6.52 1.62 0.12 0.15 10.42 2.39 0.78 0.28 4.69 2.03 0.08 0.100.99 1.37 7.19 1.25 0.09 0.21 3.93 1.82 0.91 0.99 6.75 1.17 0.07 0.141.05 0.72 2.01 3.09 0.07 0.12 4.68 0.97 1.01 0.55 1.83 3.39 0.03 0.060.71 0.18 2.11 5.31 0.12 0.14 11.09 4.06 0.70 0.14 2.06 5.47 0.12 0.130.88 0.47 3.87 1.97 0.14 0.21 7.07 2.01 0.79 0.39 3.36 1.99 0.11 0.150.94 1.35 5.61 2.72 0.09 0.21 4.15 1.32 1.04 1.04 5.95 2.62 0.10 0.200.94 0.87 3.48 1.87 0.13 0.24 5.93 1.28 0.99 0.82 3.89 2.55 0.07 0.132.03 0.66 11.50 9.46 -0.01 -0.01 3.66 1.49 1.66 0.47 8.65 9.17 -0.02 -0.030.94 0.45 9.82 2.53 0.02 0.31 8.70 4.11 0.84 0.43 8.50 2.26 0.08 0.130.60 0.93 1.32 5.63 0.02 0.34 4.43 1.08 0.55 0.68 1.50 3.63 0.14 0.250.56 0.24 0.92 2.40 0.14 0.17 9.33 2.06 0.61 0.18 0.98 2.51 0.16 0.180.72 0.60 8.95 2.86 0.11 0.17 5.64 1.61 0.74 0.56 7.16 2.82 0.09 0.142.14 1.98 9.10 6.60 -0.02 -0.83 0.45 1.07 1.73 1.50 8.02 4.71 -0.02 -0.181.56 0.21 5.44 4.05 0.01 0.01 11.28 3.78 1.47 0.16 4.99 4.03 -0.05 -0.060.87 0.24 1.90 4.62 0.00 0.00 8.48 1.20 0.79 0.19 1.60 8.53 -0.02 -0.030.75 0.16 5.54 2.91 0.04 0.05 12.50 5.22 0.73 0.16 6.02 2.63 0.07 0.080.72 0.12 18.77 2.37 0.04 0.04 11.75 3.17 0.73 0.19 11.56 2.07 0.03 0.031.11 0.29 11.00 2.97 0.05 0.07 7.00 2.64 1.16 0.30 9.99 3.19 0.08 0.110.55 0.25 5.45 1.63 0.02 0.02 7.54 2.91 0.48 0.20 4.69 1.42 0.01 0.021.66 2.62 7.02 6.53 0.09 0.32 3.28 1.25 1.92 1.83 6.67 7.81 0.13 0.330.71 0.33 2.95 1.88 0.09 0.12 9.08 5.27 0.80 0.27 3.22 1.99 0.07 0.09
D54

Appendix D - Quantitative Survey/ Questionnaire results/Original
Questinnaire No.370371372373374375376377378379380381382383384385386387388389390391392
AS_TURN D_E INV_TURN REC_TURN ROA ROE Z_SCORE ACID ASTURN D_E INV_TURN REC_TURN ROA ROE0.75 0.36 15.47 2.03 0.06 0.09 6.32 2.19 0.75 0.29 14.72 1.96 0.06 0.070.91 0.56 19.57 7.87 0.02 0.32 6.13 2.13 0.82 0.41 12.39 5.92 0.19 0.281.66 0.51 8.58 4.23 -0.02 -0.03 2.05 2.70 1.90 0.34 11.32 5.18 -0.01 -0.010.32 0.23 0.61 2.46 -0.08 -0.10 7.74 1.49 0.29 0.33 0.54 2.08 -0.05 -0.070.82 0.38 3.71 1.52 0.03 0.04 6.50 2.74 0.83 0.31 3.53 1.55 -0.01 -0.011.19 0.71 5.07 2.42 0.05 0.08 3.41 1.34 1.21 0.70 5.25 2.33 0.07 0.122.21 0.46 9.34 3.61 0.10 0.14 7.62 2.62 2.25 0.44 27.09 3.33 0.15 0.220.71 1.00 1.48 3.07 0.00 0.01 4.04 0.84 0.66 0.69 1.38 3.43 0.00 0.000.64 0.55 1.72 1.78 0.09 0.14 5.69 1.34 0.64 0.44 1.89 1.85 0.08 0.110.67 0.70 4.34 4.54 -0.03 -0.05 3.74 4.01 0.62 0.49 3.74 7.92 -0.03 -0.050.41 0.13 48.48 5.56 -0.02 -0.21 7.03 2.22 0.51 0.12 53.02 4.10 -0.02 -0.021.80 0.37 41.45 2.21 0.01 0.01 3.29 1.35 2.15 0.34 29.92 2.61 0.02 0.030.42 0.14 1.62 1.37 0.05 0.06 14.58 5.30 0.33 0.18 1.20 1.06 -0.05 -0.070.51 0.09 4.96 1.56 0.03 0.03 16.72 0.76 0.48 0.07 4.62 1.44 0.02 0.030.84 0.10 1.84 2.82 0.05 0.06 16.74 0.75 0.75 0.07 1.78 3.24 0.01 0.020.65 -13.98 3.67 0.84 -0.12 0.02 -0.95 4.38 0.58 -6.94 4.26 0.79 -0.01 -0.071.01 0.48 4.71 1.99 0.05 0.08 7.19 4.58 0.67 0.29 6.52 1.38 0.01 0.020.27 0.08 19.78 2.26 0.00 0.00 14.23 1.57 0.22 0.07 18.46 2.27 0.00 0.010.45 0.04 4.26 1.90 -0.08 -0.08 2.85 1.11 0.36 0.04 2.81 1.69 -0.01 -0.120.68 0.50 2.42 1.39 0.09 0.13 6.21 3.50 0.68 0.30 2.30 1.49 0.07 0.091.80 0.37 41.45 2.21 0.01 0.01 3.29 1.35 2.15 0.34 29.92 2.61 0.02 0.030.93 0.36 5.69 2.57 0.05 0.10 6.55 2.44 0.91 0.58 5.28 2.76 0.03 0.06
D55
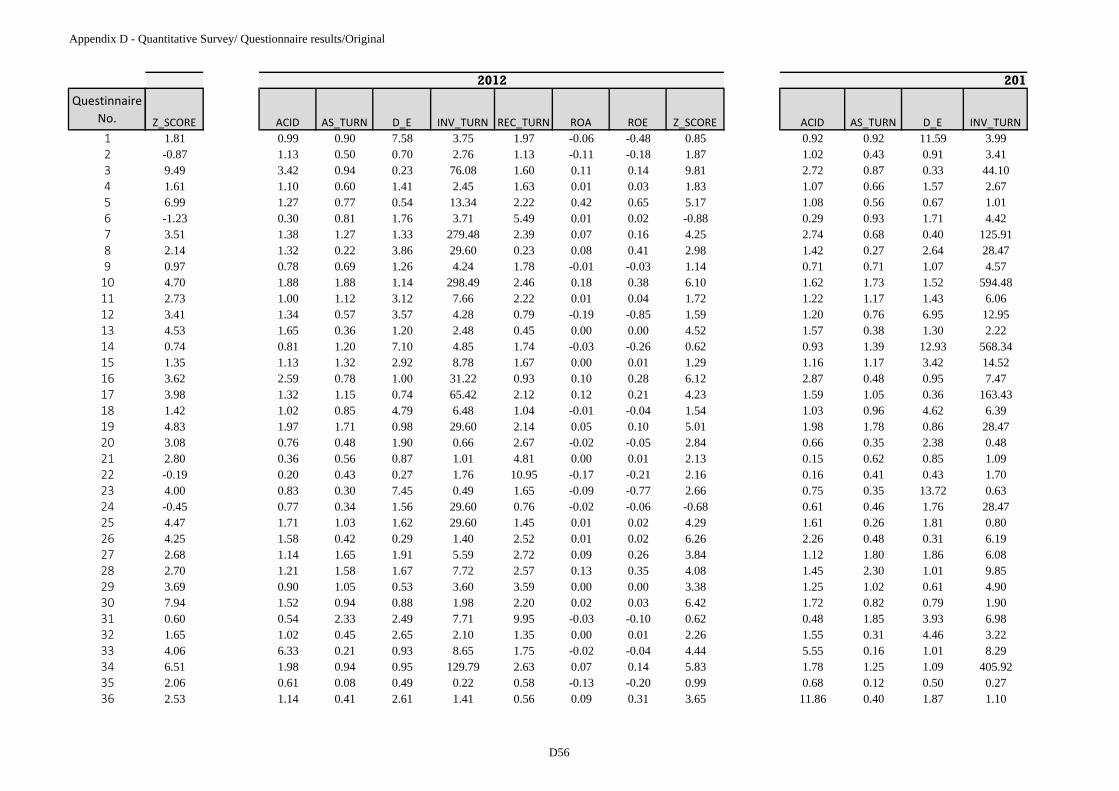
Appendix D - Quantitative Survey/ Questionnaire results/Original
Questinnaire No.123456789101112131415161718192021222324252627282930313233343536
Z_SCORE ACID AS_TURN D_E INV_TURN REC_TURN ROA ROE Z_SCORE ACID AS_TURN D_E INV_TURN1.81 0.99 0.90 7.58 3.75 1.97 -0.06 -0.48 0.85 0.92 0.92 11.59 3.99-0.87 1.13 0.50 0.70 2.76 1.13 -0.11 -0.18 1.87 1.02 0.43 0.91 3.419.49 3.42 0.94 0.23 76.08 1.60 0.11 0.14 9.81 2.72 0.87 0.33 44.101.61 1.10 0.60 1.41 2.45 1.63 0.01 0.03 1.83 1.07 0.66 1.57 2.676.99 1.27 0.77 0.54 13.34 2.22 0.42 0.65 5.17 1.08 0.56 0.67 1.01-1.23 0.30 0.81 1.76 3.71 5.49 0.01 0.02 -0.88 0.29 0.93 1.71 4.423.51 1.38 1.27 1.33 279.48 2.39 0.07 0.16 4.25 2.74 0.68 0.40 125.912.14 1.32 0.22 3.86 29.60 0.23 0.08 0.41 2.98 1.42 0.27 2.64 28.470.97 0.78 0.69 1.26 4.24 1.78 -0.01 -0.03 1.14 0.71 0.71 1.07 4.574.70 1.88 1.88 1.14 298.49 2.46 0.18 0.38 6.10 1.62 1.73 1.52 594.482.73 1.00 1.12 3.12 7.66 2.22 0.01 0.04 1.72 1.22 1.17 1.43 6.063.41 1.34 0.57 3.57 4.28 0.79 -0.19 -0.85 1.59 1.20 0.76 6.95 12.954.53 1.65 0.36 1.20 2.48 0.45 0.00 0.00 4.52 1.57 0.38 1.30 2.220.74 0.81 1.20 7.10 4.85 1.74 -0.03 -0.26 0.62 0.93 1.39 12.93 568.341.35 1.13 1.32 2.92 8.78 1.67 0.00 0.01 1.29 1.16 1.17 3.42 14.523.62 2.59 0.78 1.00 31.22 0.93 0.10 0.28 6.12 2.87 0.48 0.95 7.473.98 1.32 1.15 0.74 65.42 2.12 0.12 0.21 4.23 1.59 1.05 0.36 163.431.42 1.02 0.85 4.79 6.48 1.04 -0.01 -0.04 1.54 1.03 0.96 4.62 6.394.83 1.97 1.71 0.98 29.60 2.14 0.05 0.10 5.01 1.98 1.78 0.86 28.473.08 0.76 0.48 1.90 0.66 2.67 -0.02 -0.05 2.84 0.66 0.35 2.38 0.482.80 0.36 0.56 0.87 1.01 4.81 0.00 0.01 2.13 0.15 0.62 0.85 1.09-0.19 0.20 0.43 0.27 1.76 10.95 -0.17 -0.21 2.16 0.16 0.41 0.43 1.704.00 0.83 0.30 7.45 0.49 1.65 -0.09 -0.77 2.66 0.75 0.35 13.72 0.63-0.45 0.77 0.34 1.56 29.60 0.76 -0.02 -0.06 -0.68 0.61 0.46 1.76 28.474.47 1.71 1.03 1.62 29.60 1.45 0.01 0.02 4.29 1.61 0.26 1.81 0.804.25 1.58 0.42 0.29 1.40 2.52 0.01 0.02 6.26 2.26 0.48 0.31 6.192.68 1.14 1.65 1.91 5.59 2.72 0.09 0.26 3.84 1.12 1.80 1.86 6.082.70 1.21 1.58 1.67 7.72 2.57 0.13 0.35 4.08 1.45 2.30 1.01 9.853.69 0.90 1.05 0.53 3.60 3.59 0.00 0.00 3.38 1.25 1.02 0.61 4.907.94 1.52 0.94 0.88 1.98 2.20 0.02 0.03 6.42 1.72 0.82 0.79 1.900.60 0.54 2.33 2.49 7.71 9.95 -0.03 -0.10 0.62 0.48 1.85 3.93 6.981.65 1.02 0.45 2.65 2.10 1.35 0.00 0.01 2.26 1.55 0.31 4.46 3.224.06 6.33 0.21 0.93 8.65 1.75 -0.02 -0.04 4.44 5.55 0.16 1.01 8.296.51 1.98 0.94 0.95 129.79 2.63 0.07 0.14 5.83 1.78 1.25 1.09 405.922.06 0.61 0.08 0.49 0.22 0.58 -0.13 -0.20 0.99 0.68 0.12 0.50 0.272.53 1.14 0.41 2.61 1.41 0.56 0.09 0.31 3.65 11.86 0.40 1.87 1.10
2012 201
D56

Appendix D - Quantitative Survey/ Questionnaire results/Original
Questinnaire No.37383940414243444546474849505152535455565758596061626364656667686970717273
Z_SCORE ACID AS_TURN D_E INV_TURN REC_TURN ROA ROE Z_SCORE ACID AS_TURN D_E INV_TURN7.59 3.39 1.14 0.34 8.32 1.86 0.10 0.13 9.27 4.31 0.98 0.25 6.679.20 4.17 0.21 0.15 1.94 0.48 0.01 0.01 10.42 4.83 0.28 0.12 5.598.82 1.65 0.86 0.62 2.34 1.74 0.06 0.10 5.74 2.02 0.83 0.46 2.896.81 2.76 1.84 0.41 6.67 2.42 0.10 0.14 8.56 2.97 1.83 0.35 5.3212.50 4.16 0.69 0.13 1.75 3.49 0.10 0.11 14.34 11.04 0.54 0.04 1.306.36 2.73 0.56 0.44 7.90 0.81 0.01 0.02 7.12 2.13 1.28 0.61 17.9613.63 7.45 0.37 0.07 1.40 3.09 0.05 0.06 21.73 4.36 0.37 0.14 1.806.53 2.28 0.42 0.14 95.14 16.98 0.11 0.12 10.00 1.92 0.45 0.13 93.875.09 3.09 1.53 0.25 29.60 6.95 0.26 0.34 10.99 1.60 1.55 0.65 28.472.56 1.66 0.41 0.83 1.92 0.63 0.00 0.01 4.35 2.28 0.66 0.48 2.292.65 2.34 1.31 0.64 16.37 1.99 0.10 0.16 6.16 3.32 1.34 0.38 17.1211.92 6.27 0.55 0.19 29.60 1.01 0.12 0.15 14.05 9.43 0.61 0.12 28.476.45 1.68 0.77 0.52 2.90 1.53 0.08 0.13 6.78 2.23 0.71 0.36 3.197.96 5.38 0.51 0.17 2.24 0.69 0.02 0.02 11.84 6.70 0.42 0.14 2.087.47 3.54 1.63 0.15 6.35 3.88 0.07 0.08 11.55 3.20 1.43 0.18 3.608.67 3.06 0.85 0.43 2.53 1.74 -0.01 -0.01 8.21 4.57 0.78 0.40 2.439.11 3.49 1.15 0.35 36.50 1.43 0.01 0.01 8.38 3.45 1.09 0.37 36.934.47 1.26 0.08 0.52 0.20 0.22 -0.05 -0.08 4.20 2.11 0.13 0.21 0.316.62 2.59 1.95 0.33 9.65 6.71 0.02 0.03 6.34 2.55 1.63 0.30 7.3011.87 7.81 0.55 0.14 7.34 1.58 0.15 0.18 16.45 5.98 0.51 0.18 4.024.50 1.87 0.43 0.88 3.42 0.56 0.01 0.02 6.01 2.34 0.47 0.58 2.8715.84 6.41 0.51 0.14 11.79 1.67 0.08 0.09 14.52 4.99 0.59 0.20 232.3620.09 2.92 0.30 0.03 2.03 1.35 0.00 0.00 4.11 8.01 0.41 0.12 2.634.35 1.32 1.26 0.72 2.14 2.78 0.01 0.02 5.71 1.51 1.28 0.61 2.5110.96 4.12 0.99 0.39 29.60 1.62 0.09 0.13 10.25 3.00 0.99 0.53 28.4710.24 3.35 1.55 0.39 9.33 1.80 0.43 0.61 12.70 2.08 1.86 0.60 4.8111.20 5.97 0.38 0.12 8.05 2.37 0.01 0.01 13.98 4.54 0.37 0.17 7.3121.21 0.80 0.09 0.07 0.18 1.73 -0.01 -0.01 18.30 0.76 0.98 0.56 2.794.20 1.05 0.69 0.81 1.65 1.79 0.05 0.09 5.13 1.56 0.68 0.40 1.515.50 2.67 0.60 0.22 2.06 2.45 0.01 0.01 8.22 2.41 0.59 0.21 1.527.28 1.82 0.08 0.95 0.63 0.33 -0.07 -0.13 2.16 2.39 0.81 0.26 5.227.28 1.82 0.08 0.95 0.63 0.33 -0.07 -0.13 2.16 2.39 0.81 0.26 5.227.28 6.36 0.49 0.10 5.65 0.88 0.02 0.02 16.37 5.00 0.42 0.12 3.306.40 1.80 0.50 0.32 2.03 1.16 0.00 0.00 6.72 2.39 0.81 0.26 5.226.29 2.32 0.31 0.69 3.89 0.41 0.12 0.20 7.56 3.68 0.27 0.34 3.926.23 2.84 0.27 0.16 43.51 13.72 -0.01 -0.01 7.97 3.70 0.31 0.12 53.146.95 1.50 0.49 0.37 0.82 1.37 -0.05 -0.07 6.97 2.34 0.72 0.35 1.27
D57

Appendix D - Quantitative Survey/ Questionnaire results/Original
Questinnaire No.7475767778798081828384858687888990919293949596979899100101102103104105106107108109110
Z_SCORE ACID AS_TURN D_E INV_TURN REC_TURN ROA ROE Z_SCORE ACID AS_TURN D_E INV_TURN5.00 1.59 1.87 1.57 498.12 3.14 0.16 0.41 5.64 1.86 1.95 1.08 588.748.80 3.92 0.98 0.29 14.68 3.34 0.09 0.11 10.40 3.05 0.92 0.42 28.089.76 1.80 0.79 0.60 9.74 1.61 0.02 0.03 5.85 1.97 0.86 0.48 7.756.57 1.38 1.74 0.88 3.81 2.73 0.11 0.22 6.31 1.45 1.88 0.86 4.4112.66 5.18 0.60 0.09 3.30 3.97 0.02 0.03 15.94 3.52 0.58 0.14 3.196.92 2.71 1.14 0.54 209.15 1.62 0.06 0.09 8.28 2.62 1.01 0.56 290.298.42 3.30 1.05 0.27 3.73 1.79 0.17 0.21 11.02 2.65 1.14 0.31 3.248.40 4.30 0.56 0.11 1.42 3.35 0.01 0.01 14.06 4.53 0.65 0.12 1.806.52 2.98 1.26 0.36 15.53 2.17 0.14 0.20 8.66 2.89 1.03 0.43 26.715.20 5.86 1.16 0.33 7.01 2.34 0.02 0.02 8.13 3.78 1.11 0.42 8.412.88 3.07 0.69 0.68 29.60 3.87 0.25 0.42 6.80 2.85 0.77 0.38 28.4712.30 3.50 0.58 0.16 2.31 2.17 -0.04 -0.04 8.16 4.33 0.56 0.15 3.169.26 5.29 1.10 0.20 32.79 2.63 0.13 0.16 12.82 3.42 1.11 0.34 41.546.19 2.09 0.52 0.73 19.81 0.67 0.01 0.01 6.35 1.51 0.41 1.18 2.1610.99 1.74 0.32 0.08 101.31 6.80 0.03 0.03 15.49 1.41 0.37 0.14 13.096.88 2.25 0.31 0.33 50.28 0.62 0.07 0.09 6.55 2.43 0.34 0.40 57.492.72 1.66 0.69 0.63 5.49 1.50 0.09 0.14 5.31 1.75 1.06 0.49 3.2010.86 5.30 0.51 0.24 11.32 2.20 0.03 0.04 12.17 3.90 0.49 0.34 7.894.74 1.28 1.16 0.60 4.82 3.12 0.08 0.13 5.18 1.45 1.34 0.42 4.485.10 2.98 0.39 0.09 4.01 2.38 0.01 0.01 13.50 9.59 0.31 0.03 2.567.63 3.30 0.45 0.49 0.88 1.66 -0.04 -0.06 7.08 2.69 0.69 0.57 1.155.21 1.84 0.53 0.85 6.69 0.65 0.07 0.13 5.61 2.39 0.64 0.54 6.888.27 3.06 0.43 0.36 29.60 0.72 0.02 0.03 7.41 3.35 0.39 0.33 28.474.64 1.25 1.32 0.44 3.07 3.90 -0.11 -0.16 3.68 1.50 1.19 0.40 2.3411.38 2.32 0.23 0.09 0.83 1.30 -0.06 -0.07 12.37 2.04 0.23 0.13 0.6914.53 5.31 0.51 0.07 1.62 3.60 0.00 0.00 18.9011.29 5.28 0.71 0.16 5.20 1.31 -0.06 -0.07 12.05 5.75 0.62 0.13 4.233.87 1.37 0.66 1.26 29.60 1.43 0.02 0.04 3.33 1.57 0.66 0.97 28.4710.13 3.79 1.00 0.23 4.54 2.12 0.13 0.16 11.55 3.92 1.17 0.24 6.597.03 2.13 1.36 0.40 4.99 2.99 0.07 0.11 7.70 1.65 1.28 0.71 4.922.03 2.92 0.97 0.32 2.16 1.75 -0.13 -0.18 4.70 6.73 1.29 0.15 5.016.88 2.90 1.42 0.24 5.86 2.88 0.13 0.17 10.73 3.99 1.11 0.16 4.353.79 1.73 0.55 0.17 29.60 2.68 -0.04 -0.05 7.49 3.59 0.57 0.09 28.476.62 2.95 0.27 0.18 0.67 0.71 0.02 0.03 9.10 2.26 0.72 0.35 6.177.20 2.30 0.31 0.10 176.25 3.83 -0.16 -0.18 9.68 2.72 0.34 0.07 114.8112.39 1.03 1.03 0.07 15.57 2.53 0.00 0.00 20.06 6.06 1.15 0.12 14.573.57 1.27 0.61 0.84 27.11 1.95 0.23 0.42 5.01 2.88 0.55 0.23 8.87
D58

Appendix D - Quantitative Survey/ Questionnaire results/Original
Questinnaire No.111112113114115116117118119120121122123124125126127128129130131132133134135136137138139140141142143144145146147
Z_SCORE ACID AS_TURN D_E INV_TURN REC_TURN ROA ROE Z_SCORE ACID AS_TURN D_E INV_TURN12.60 2.32 1.12 0.36 3.18 4.27 0.19 0.25 8.98 2.32 1.25 0.34 3.308.68 3.23 1.44 0.27 9.30 3.47 0.13 0.16 10.68 1.45 1.25 0.51 9.836.97 1.61 0.41 0.27 2.27 1.29 0.02 0.03 6.91 2.06 0.39 0.21 2.3418.44 2.73 0.20 0.07 0.99 1.59 -0.06 -0.07 16.65 2.41 0.15 0.09 0.696.70 0.95 0.48 0.25 1.42 3.22 -0.03 -0.39 4.76 1.13 0.53 0.22 1.697.61 2.32 1.50 0.40 6.19 2.63 0.19 0.27 9.90 2.91 1.63 0.30 5.914.53 2.39 1.61 0.45 6.82 2.79 0.00 0.01 7.43 3.01 1.22 0.32 4.8711.86 1.65 2.86 0.23 4.46 13.66 0.16 0.19 12.05 1.04 2.07 0.65 3.937.16 3.84 1.62 0.29 10.28 2.79 0.13 0.17 10.40 2.81 1.78 0.40 7.715.46 2.74 0.81 0.53 5.05 1.94 0.09 0.15 7.04 5.07 1.10 0.32 23.326.71 1.39 0.20 0.21 0.66 1.81 0.00 0.00 7.91 1.43 0.21 0.18 0.852.53 1.14 0.41 2.61 1.41 0.56 0.09 0.31 3.65 11.86 0.40 1.87 1.107.59 3.39 1.14 0.34 8.32 1.86 0.10 0.13 9.27 4.31 0.98 0.25 6.679.20 4.17 0.21 0.15 1.94 0.48 0.01 0.01 10.42 4.83 0.28 0.12 5.598.82 1.65 0.86 0.62 2.34 1.74 0.06 0.10 5.74 2.02 0.83 0.46 2.896.81 2.76 1.84 0.41 6.67 2.42 0.10 0.14 8.56 2.97 1.83 0.35 5.3212.50 4.16 0.69 0.13 1.75 3.49 0.10 0.11 14.34 11.04 0.54 0.04 1.306.36 2.73 0.56 0.44 7.90 0.81 0.01 0.02 7.12 2.13 1.28 0.61 17.9613.63 7.45 0.37 0.07 1.40 3.09 0.05 0.06 21.73 4.36 0.37 0.14 1.806.53 2.28 0.42 0.14 95.14 16.98 0.11 0.12 10.00 1.92 0.45 0.13 93.875.09 3.09 1.53 0.25 29.60 6.95 0.26 0.34 10.99 1.60 1.55 0.65 28.472.56 1.66 0.41 0.83 1.92 0.63 0.00 0.01 4.35 2.28 0.66 0.48 2.292.65 2.34 1.31 0.64 16.37 1.99 0.10 0.16 6.16 3.32 1.34 0.38 17.1211.92 6.27 0.55 0.19 29.60 1.01 0.12 0.15 14.05 9.43 0.61 0.12 28.476.45 1.68 0.77 0.52 2.90 1.53 0.08 0.13 6.78 2.23 0.71 0.36 3.197.96 5.38 0.51 0.17 2.24 0.69 0.02 0.02 11.84 6.70 0.42 0.14 2.087.47 3.54 1.63 0.15 6.35 3.88 0.07 0.08 11.55 3.20 1.43 0.18 3.608.67 3.06 0.85 0.43 2.53 1.74 -0.01 -0.01 8.21 4.57 0.78 0.40 2.439.11 3.49 1.15 0.35 36.50 1.43 0.01 0.01 8.38 3.45 1.09 0.37 36.934.47 1.26 0.08 0.52 0.20 0.22 -0.05 -0.08 4.20 2.11 0.13 0.21 0.316.62 2.59 1.95 0.33 9.65 6.71 0.02 0.03 6.34 2.55 1.63 0.30 7.3011.87 7.81 0.55 0.14 7.34 1.58 0.15 0.18 16.45 5.98 0.51 0.18 4.024.50 1.87 0.43 0.88 3.42 0.56 0.01 0.02 6.01 2.34 0.47 0.58 2.8715.84 6.41 0.51 0.14 11.79 1.67 0.08 0.09 14.52 4.99 0.59 0.20 232.3620.09 2.92 0.30 0.03 2.03 1.35 0.00 0.00 4.11 8.01 0.41 0.12 2.634.35 1.32 1.26 0.72 2.14 2.78 0.01 0.02 5.71 1.51 1.28 0.61 2.5110.96 4.12 0.99 0.39 29.60 1.62 0.09 0.13 10.25 3.00 0.99 0.53 28.47
D59

Appendix D - Quantitative Survey/ Questionnaire results/Original
Questinnaire No.148149150151152153154155156157158159160161162163164165166167168169170171172173174175176177178179180181182183184
Z_SCORE ACID AS_TURN D_E INV_TURN REC_TURN ROA ROE Z_SCORE ACID AS_TURN D_E INV_TURN10.24 3.35 1.55 0.39 9.33 1.80 0.43 0.61 12.70 2.08 1.86 0.60 4.8111.20 5.97 0.38 0.12 8.05 2.37 0.01 0.01 13.98 4.54 0.37 0.17 7.3121.21 0.80 0.09 0.07 0.18 1.73 -0.01 -0.01 18.30 0.76 0.98 0.56 2.794.20 1.05 0.69 0.81 1.65 1.79 0.05 0.09 5.13 1.56 0.68 0.40 1.515.50 2.67 0.60 0.22 2.06 2.45 0.01 0.01 8.22 2.41 0.59 0.21 1.527.28 1.82 0.08 0.95 0.63 0.33 -0.07 -0.13 2.16 2.39 0.81 0.26 5.227.28 1.82 0.08 0.95 0.63 0.33 -0.07 -0.13 2.16 2.39 0.81 0.26 5.227.28 6.36 0.49 0.10 5.65 0.88 0.02 0.02 16.37 5.00 0.42 0.12 3.306.40 1.80 0.50 0.32 2.03 1.16 0.00 0.00 6.72 2.39 0.81 0.26 5.226.29 2.32 0.31 0.69 3.89 0.41 0.12 0.20 7.56 3.68 0.27 0.34 3.926.23 2.84 0.27 0.16 43.51 13.72 -0.01 -0.01 7.97 3.70 0.31 0.12 53.146.95 1.50 0.49 0.37 0.82 1.37 -0.05 -0.07 6.97 2.34 0.72 0.35 1.275.00 1.59 1.87 1.57 498.12 3.14 0.16 0.41 5.64 1.86 1.95 1.08 588.748.80 3.92 0.98 0.29 14.68 3.34 0.09 0.11 10.40 3.05 0.92 0.42 28.089.76 1.80 0.79 0.60 9.74 1.61 0.02 0.03 5.85 1.97 0.86 0.48 7.756.57 1.38 1.74 0.88 3.81 2.73 0.11 0.22 6.31 1.45 1.88 0.86 4.4112.66 5.18 0.60 0.09 3.30 3.97 0.02 0.03 15.94 3.52 0.58 0.14 3.196.92 2.71 1.14 0.54 209.15 1.62 0.06 0.09 8.28 2.62 1.01 0.56 290.298.42 3.30 1.05 0.27 3.73 1.79 0.17 0.21 11.02 2.65 1.14 0.31 3.248.40 4.30 0.56 0.11 1.42 3.35 0.01 0.01 14.06 4.53 0.65 0.12 1.806.52 2.98 1.26 0.36 15.53 2.17 0.14 0.20 8.66 2.89 1.03 0.43 26.715.20 5.86 1.16 0.33 7.01 2.34 0.02 0.02 8.13 3.78 1.11 0.42 8.412.88 3.07 0.69 0.68 29.60 3.87 0.25 0.42 6.80 2.85 0.77 0.38 28.4712.30 3.50 0.58 0.16 2.31 2.17 -0.04 -0.04 8.16 4.33 0.56 0.15 3.169.26 5.29 1.10 0.20 32.79 2.63 0.13 0.16 12.82 3.42 1.11 0.34 41.5411.80 1.56 0.21 0.21 0.66 0.91 -0.03 -0.04 7.48 2.09 0.21 0.08 0.6010.43 1.96 0.28 0.08 3.54 1.50 0.00 0.00 15.78 4.87 0.31 0.16 2.678.11 3.94 0.16 0.13 79.82 8.61 0.01 0.01 9.72 2.84 0.25 0.15 171.1413.17 4.50 1.97 0.15 18.34 6.46 0.09 0.11 13.69 5.16 1.78 0.12 11.607.67 3.93 1.31 0.14 2.55 13.12 0.04 0.04 15.69 2.54 1.01 0.32 2.5114.63 2.87 0.97 0.18 2.25 2.79 0.00 0.00 11.17 4.60 0.79 0.09 1.869.82 4.98 0.52 0.14 2.76 1.58 0.16 0.18 14.24 5.24 0.51 0.14 2.883.65 6.89 0.28 0.03 1.18 3.27 0.02 0.02 4.37 5.10 0.40 0.06 3.2519.12 5.08 0.31 0.05 0.75 3.17 -0.02 -0.02 25.43 2.10 0.31 0.08 0.7611.21 7.00 0.67 0.12 2.73 1.94 0.05 0.06 15.17 11.17 0.64 0.07 3.0514.23 1.12 0.93 0.08 7.03 2.83 0.05 0.05 21.56 5.40 0.73 0.18 5.8714.91 1.65 0.42 0.14 0.94 3.89 -0.05 -0.05 10.94 2.69 0.60 0.10 2.40
D60

Appendix D - Quantitative Survey/ Questionnaire results/Original
Questinnaire No.185186187188189190191192193194195196197198199200201202203204205206207208209210211212213214215216217218219220221
Z_SCORE ACID AS_TURN D_E INV_TURN REC_TURN ROA ROE Z_SCORE ACID AS_TURN D_E INV_TURN23.76 4.16 0.42 0.06 4.74 2.66 0.02 0.02 25.57 0.05 0.36 0.06 3.80-0.58 0.41 0.51 3.34 5.55 3.12 -0.01 -0.06 -0.72 0.46 0.60 3.23 6.251.74 1.33 2.89 1.59 15.04 4.88 0.03 0.07 3.79 1.50 2.83 1.27 16.690.83 0.72 0.93 7.09 2.88 2.03 0.00 0.02 0.94 0.71 0.91 7.73 2.71-2.59 0.23 0.47 11.20 1.29 3.39 -0.12 -1.44 -2.96 0.14 0.46 -18.24 1.42-2.17 0.27 0.26 10.35 0.87 1.21 -0.08 -0.96 -3.21 0.27 0.21 15.26 1.100.73 0.74 0.75 2.08 3.29 2.06 -0.02 -0.08 1.03 0.75 0.67 1.13 4.622.43 1.50 0.53 0.74 1.94 2.03 -0.03 -0.05 3.02 2.33 0.50 0.52 2.022.68 1.08 1.60 2.48 26.30 3.34 0.06 0.23 1.85 1.15 1.17 1.81 18.53-1.90 0.30 0.34 8.18 1.59 1.51 -0.03 -0.32 -2.69 0.19 0.26 -9.47 2.673.20 2.20 1.00 1.03 35.65 2.07 0.00 0.00 4.41 2.85 0.81 0.94 34.214.24 1.21 3.51 3.12 49.40 10.34 0.07 0.30 6.78 1.34 2.54 2.48 39.951.83 0.66 0.65 0.67 48.79 2.79 0.01 0.02 1.42 0.67 0.59 0.56 63.835.29 1.48 0.61 0.91 100.40 1.99 -0.02 -0.03 2.76 1.10 0.58 2.63 28.955.31 1.35 1.30 0.96 2.80 3.35 0.10 0.19 6.22 1.11 1.24 0.98 2.633.14 2.19 0.47 7.61 3.03 0.82 0.04 0.33 3.27 3.34 0.34 7.77 2.134.98 0.93 1.63 0.85 1.87 4.33 0.12 0.22 6.42 0.90 1.67 0.93 1.982.84 1.37 1.34 1.09 54.33 5.32 0.08 0.17 3.37 1.86 1.26 0.70 105.54-0.56 0.39 0.28 1.69 100.40 3.29 -0.04 -0.11 -0.39 0.45 0.28 1.49 28.953.92 1.42 0.95 0.84 3.64 1.69 -0.04 -0.06 5.34 1.30 0.88 0.92 3.473.59 1.29 0.97 0.91 6.20 1.58 0.02 0.04 3.52 1.63 0.97 0.65 10.434.12 1.55 1.12 0.91 4.85 1.60 0.11 0.21 6.37 1.24 1.15 1.39 4.08-3.58 0.31 0.56 3.53 7.83 2.87 -0.09 -0.48 -4.57 0.31 0.58 2.93 12.852.42 0.45 0.40 0.98 2.71 5.25 0.07 0.13 2.18 0.31 0.31 0.62 4.652.35 0.70 0.27 1.46 0.86 0.79 -0.04 -0.09 1.86 1.18 0.42 1.45 1.264.93 1.79 0.47 0.56 2.69 2.10 0.00 0.00 5.17 1.87 0.55 0.46 3.389.06 1.81 0.64 0.26 1.12 2.37 0.01 0.02 8.48 1.49 0.60 0.30 1.018.47 2.83 0.80 0.15 5.11 5.30 -0.06 -0.07 10.85 2.98 0.73 0.12 4.973.59 1.79 1.23 0.96 8.43 2.06 0.07 0.13 5.60 1.67 1.33 0.88 11.104.55 2.07 0.44 0.57 7.33 0.60 -0.01 -0.02 4.90 2.56 0.44 0.42 6.674.89 2.36 0.62 0.28 4.63 1.88 -0.01 -0.01 6.21 3.93 0.63 0.17 5.286.78 2.24 0.55 0.36 4.51 1.21 0.05 0.07 7.60 2.71 0.55 0.29 4.368.15 7.35 0.80 0.14 2.13 1.66 0.00 0.01 15.39 4.39 0.65 0.20 2.1010.29 2.90 0.50 0.28 1.27 1.47 0.14 0.18 11.27 2.73 0.69 0.35 2.446.50 2.56 0.96 0.43 6.03 1.57 0.11 0.16 7.97 2.15 0.92 0.58 7.252.80 1.34 0.89 1.07 1.92 1.53 0.03 0.55 6.39 1.15 0.77 1.10 1.237.36 1.91 0.83 0.49 3.41 2.15 0.05 0.07 6.63 2.12 0.97 0.40 4.10
D61

Appendix D - Quantitative Survey/ Questionnaire results/Original
Questinnaire No.222223224225226227228229230231232233234235236237238239240241242243244245246247248249250251252253254255256257258
Z_SCORE ACID AS_TURN D_E INV_TURN REC_TURN ROA ROE Z_SCORE ACID AS_TURN D_E INV_TURN7.49 1.70 1.06 0.45 3.36 2.30 0.05 0.07 7.49 3.04 1.15 0.23 3.874.41 1.41 0.97 0.73 4.12 2.78 0.02 0.04 4.48 1.71 0.90 0.57 4.169.22 2.71 0.73 0.23 16.78 2.40 0.16 0.20 10.32 1.59 0.48 0.48 8.9211.55 2.73 0.85 0.35 1.98 2.62 0.12 0.16 9.44 2.23 0.72 0.33 1.4910.16 2.35 1.34 0.31 3.67 2.56 0.14 0.18 8.93 2.83 1.15 0.24 3.208.87 3.63 0.19 0.33 156.30 0.35 0.09 0.11 10.20 4.31 0.28 0.25 28.955.13 3.11 0.92 0.39 100.40 1.85 0.10 0.14 7.83 2.35 1.16 0.65 28.958.86 1.58 0.95 0.03 2.93 2.36 0.03 0.04 4.25 4.20 0.85 0.12 2.8411.91 1.66 0.35 0.26 0.56 1.35 -0.07 -0.09 9.36 2.50 0.40 0.19 0.573.15 1.10 1.46 1.04 3.48 3.47 0.13 0.26 5.84 1.38 1.72 0.69 4.327.84 2.83 1.68 0.47 100.40 1.94 0.12 0.18 8.70 3.04 1.49 0.42 28.957.57 4.40 0.55 0.30 2.92 1.43 -0.08 -0.11 8.04 4.18 0.65 0.27 2.8913.14 7.47 0.66 0.16 100.40 0.97 0.02 0.30 15.79 2.77 0.66 0.54 28.9511.00 1.29 0.50 0.08 10.12 5.54 -0.06 -0.06 12.45 0.95 0.42 0.15 6.822.76 1.12 0.93 0.49 100.40 2.69 -0.03 -0.05 2.98 1.45 0.56 0.39 2.449.66 2.45 0.66 0.21 1.54 3.30 0.07 0.08 11.28 3.52 0.68 0.12 1.428.76 3.72 1.74 0.18 7.07 5.71 0.11 0.14 11.57 3.93 1.48 0.17 5.1315.40 7.13 1.90 0.14 6.13 2.96 -0.23 -0.32 13.25 3.60 2.03 0.35 7.065.20 2.30 0.63 0.75 31.45 0.79 0.04 0.08 6.19 2.48 0.62 0.71 36.926.30 1.57 0.86 0.61 3.18 1.75 0.02 0.03 6.30 1.71 0.85 0.53 2.976.62 3.37 0.54 0.20 2.00 1.48 -0.07 -0.09 7.84 4.63 0.37 0.16 1.988.17 2.64 1.34 0.24 10.43 3.11 -0.11 -0.14 6.67 3.08 1.20 0.20 8.654.92 1.65 0.45 0.48 11.21 1.73 -0.06 -0.09 5.01 1.88 0.70 0.40 13.2712.04 4.33 0.37 0.06 79.36 5.45 0.04 0.04 18.92 2.27 0.46 0.14 75.955.95 0.85 1.40 0.48 2.21 6.92 0.06 0.09 7.43 1.62 1.60 0.38 3.022.47 1.50 1.24 1.02 5.96 1.88 0.20 0.40 5.64 2.55 0.93 0.37 3.836.04 3.49 0.70 2.00 38.62 0.95 0.11 0.36 6.03 4.91 0.91 0.54 31.4913.49 7.02 0.27 0.10 1.77 1.50 -0.04 -0.04 15.72 5.99 0.41 0.10 2.1714.12 5.44 0.95 0.11 5.57 4.58 0.04 0.04 15.69 2.17 1.14 0.33 5.7313.33 5.67 1.09 0.10 2.87 4.12 -0.01 -0.01 15.74 4.28 1.45 0.13 3.717.97 2.47 0.20 0.10 171.65 5.76 -0.04 -0.04 8.71 2.72 0.26 0.09 171.454.81 1.07 1.28 0.81 2.23 3.85 0.14 0.26 6.77 0.92 1.01 1.12 1.869.88 1.87 0.58 0.30 0.99 2.16 0.05 0.07 8.99 4.04 0.71 0.16 1.6011.47 6.80 1.40 0.12 9.00 2.37 0.01 0.02 14.18 7.22 1.37 0.11 7.6714.48 3.41 0.69 0.32 26.73 1.54 0.10 0.13 10.16 6.81 0.39 0.12 4.904.82 2.82 1.03 0.20 1.47 2.63 0.06 0.07 10.58 3.55 0.95 0.14 1.439.81 3.44 1.70 0.38 31.21 3.60 0.04 0.06 8.57 2.54 2.14 0.56 27.47
D62
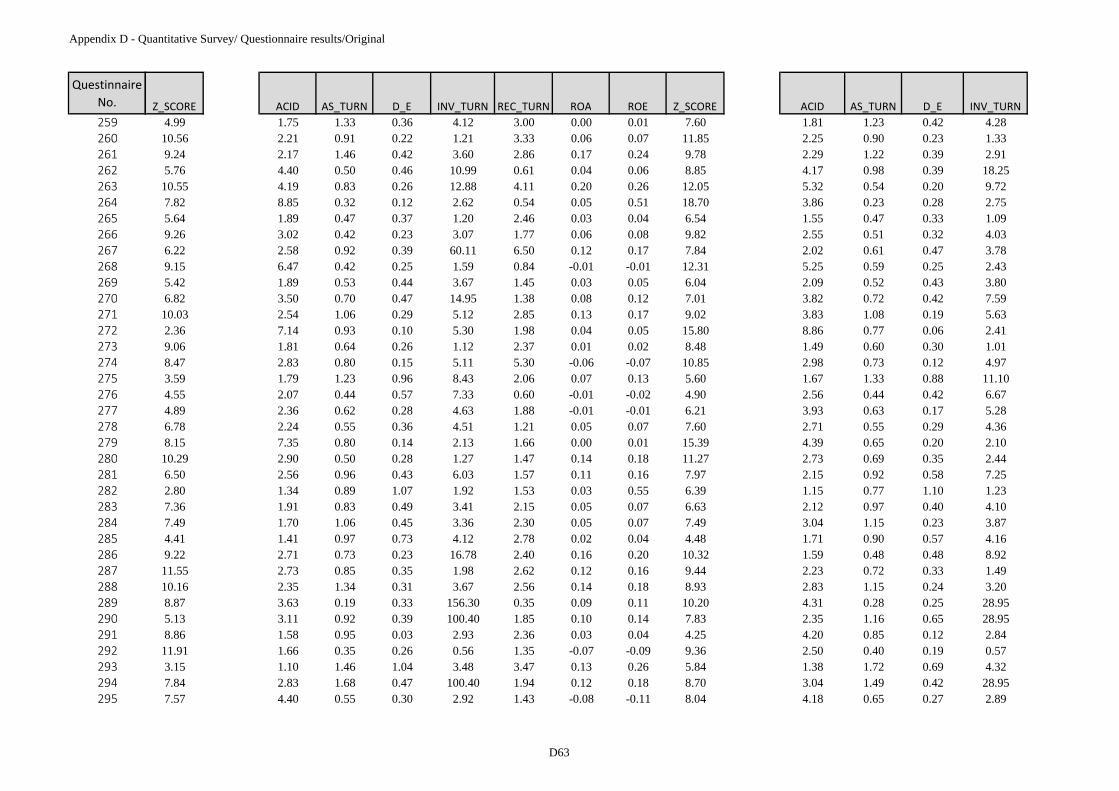
Appendix D - Quantitative Survey/ Questionnaire results/Original
Questinnaire No.259260261262263264265266267268269270271272273274275276277278279280281282283284285286287288289290291292293294295
Z_SCORE ACID AS_TURN D_E INV_TURN REC_TURN ROA ROE Z_SCORE ACID AS_TURN D_E INV_TURN4.99 1.75 1.33 0.36 4.12 3.00 0.00 0.01 7.60 1.81 1.23 0.42 4.2810.56 2.21 0.91 0.22 1.21 3.33 0.06 0.07 11.85 2.25 0.90 0.23 1.339.24 2.17 1.46 0.42 3.60 2.86 0.17 0.24 9.78 2.29 1.22 0.39 2.915.76 4.40 0.50 0.46 10.99 0.61 0.04 0.06 8.85 4.17 0.98 0.39 18.2510.55 4.19 0.83 0.26 12.88 4.11 0.20 0.26 12.05 5.32 0.54 0.20 9.727.82 8.85 0.32 0.12 2.62 0.54 0.05 0.51 18.70 3.86 0.23 0.28 2.755.64 1.89 0.47 0.37 1.20 2.46 0.03 0.04 6.54 1.55 0.47 0.33 1.099.26 3.02 0.42 0.23 3.07 1.77 0.06 0.08 9.82 2.55 0.51 0.32 4.036.22 2.58 0.92 0.39 60.11 6.50 0.12 0.17 7.84 2.02 0.61 0.47 3.789.15 6.47 0.42 0.25 1.59 0.84 -0.01 -0.01 12.31 5.25 0.59 0.25 2.435.42 1.89 0.53 0.44 3.67 1.45 0.03 0.05 6.04 2.09 0.52 0.43 3.806.82 3.50 0.70 0.47 14.95 1.38 0.08 0.12 7.01 3.82 0.72 0.42 7.5910.03 2.54 1.06 0.29 5.12 2.85 0.13 0.17 9.02 3.83 1.08 0.19 5.632.36 7.14 0.93 0.10 5.30 1.98 0.04 0.05 15.80 8.86 0.77 0.06 2.419.06 1.81 0.64 0.26 1.12 2.37 0.01 0.02 8.48 1.49 0.60 0.30 1.018.47 2.83 0.80 0.15 5.11 5.30 -0.06 -0.07 10.85 2.98 0.73 0.12 4.973.59 1.79 1.23 0.96 8.43 2.06 0.07 0.13 5.60 1.67 1.33 0.88 11.104.55 2.07 0.44 0.57 7.33 0.60 -0.01 -0.02 4.90 2.56 0.44 0.42 6.674.89 2.36 0.62 0.28 4.63 1.88 -0.01 -0.01 6.21 3.93 0.63 0.17 5.286.78 2.24 0.55 0.36 4.51 1.21 0.05 0.07 7.60 2.71 0.55 0.29 4.368.15 7.35 0.80 0.14 2.13 1.66 0.00 0.01 15.39 4.39 0.65 0.20 2.1010.29 2.90 0.50 0.28 1.27 1.47 0.14 0.18 11.27 2.73 0.69 0.35 2.446.50 2.56 0.96 0.43 6.03 1.57 0.11 0.16 7.97 2.15 0.92 0.58 7.252.80 1.34 0.89 1.07 1.92 1.53 0.03 0.55 6.39 1.15 0.77 1.10 1.237.36 1.91 0.83 0.49 3.41 2.15 0.05 0.07 6.63 2.12 0.97 0.40 4.107.49 1.70 1.06 0.45 3.36 2.30 0.05 0.07 7.49 3.04 1.15 0.23 3.874.41 1.41 0.97 0.73 4.12 2.78 0.02 0.04 4.48 1.71 0.90 0.57 4.169.22 2.71 0.73 0.23 16.78 2.40 0.16 0.20 10.32 1.59 0.48 0.48 8.9211.55 2.73 0.85 0.35 1.98 2.62 0.12 0.16 9.44 2.23 0.72 0.33 1.4910.16 2.35 1.34 0.31 3.67 2.56 0.14 0.18 8.93 2.83 1.15 0.24 3.208.87 3.63 0.19 0.33 156.30 0.35 0.09 0.11 10.20 4.31 0.28 0.25 28.955.13 3.11 0.92 0.39 100.40 1.85 0.10 0.14 7.83 2.35 1.16 0.65 28.958.86 1.58 0.95 0.03 2.93 2.36 0.03 0.04 4.25 4.20 0.85 0.12 2.8411.91 1.66 0.35 0.26 0.56 1.35 -0.07 -0.09 9.36 2.50 0.40 0.19 0.573.15 1.10 1.46 1.04 3.48 3.47 0.13 0.26 5.84 1.38 1.72 0.69 4.327.84 2.83 1.68 0.47 100.40 1.94 0.12 0.18 8.70 3.04 1.49 0.42 28.957.57 4.40 0.55 0.30 2.92 1.43 -0.08 -0.11 8.04 4.18 0.65 0.27 2.89
D63
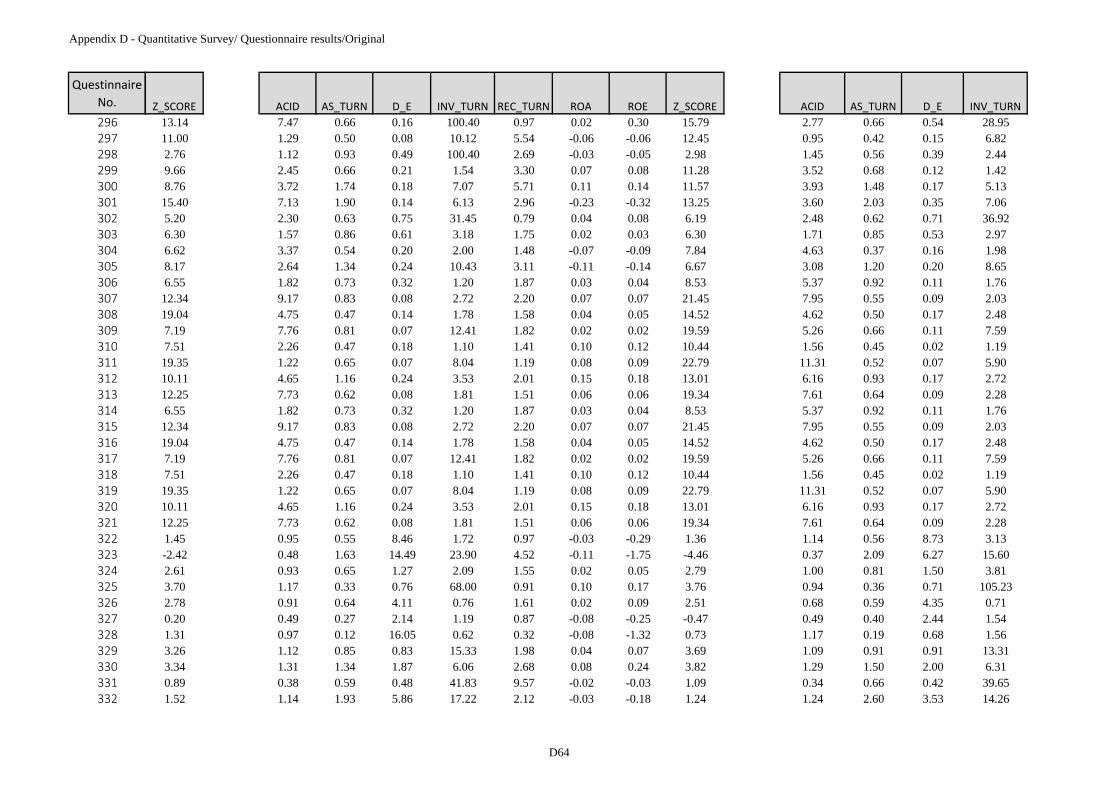
Appendix D - Quantitative Survey/ Questionnaire results/Original
Questinnaire No.296297298299300301302303304305306307308309310311312313314315316317318319320321322323324325326327328329330331332
Z_SCORE ACID AS_TURN D_E INV_TURN REC_TURN ROA ROE Z_SCORE ACID AS_TURN D_E INV_TURN13.14 7.47 0.66 0.16 100.40 0.97 0.02 0.30 15.79 2.77 0.66 0.54 28.9511.00 1.29 0.50 0.08 10.12 5.54 -0.06 -0.06 12.45 0.95 0.42 0.15 6.822.76 1.12 0.93 0.49 100.40 2.69 -0.03 -0.05 2.98 1.45 0.56 0.39 2.449.66 2.45 0.66 0.21 1.54 3.30 0.07 0.08 11.28 3.52 0.68 0.12 1.428.76 3.72 1.74 0.18 7.07 5.71 0.11 0.14 11.57 3.93 1.48 0.17 5.1315.40 7.13 1.90 0.14 6.13 2.96 -0.23 -0.32 13.25 3.60 2.03 0.35 7.065.20 2.30 0.63 0.75 31.45 0.79 0.04 0.08 6.19 2.48 0.62 0.71 36.926.30 1.57 0.86 0.61 3.18 1.75 0.02 0.03 6.30 1.71 0.85 0.53 2.976.62 3.37 0.54 0.20 2.00 1.48 -0.07 -0.09 7.84 4.63 0.37 0.16 1.988.17 2.64 1.34 0.24 10.43 3.11 -0.11 -0.14 6.67 3.08 1.20 0.20 8.656.55 1.82 0.73 0.32 1.20 1.87 0.03 0.04 8.53 5.37 0.92 0.11 1.7612.34 9.17 0.83 0.08 2.72 2.20 0.07 0.07 21.45 7.95 0.55 0.09 2.0319.04 4.75 0.47 0.14 1.78 1.58 0.04 0.05 14.52 4.62 0.50 0.17 2.487.19 7.76 0.81 0.07 12.41 1.82 0.02 0.02 19.59 5.26 0.66 0.11 7.597.51 2.26 0.47 0.18 1.10 1.41 0.10 0.12 10.44 1.56 0.45 0.02 1.1919.35 1.22 0.65 0.07 8.04 1.19 0.08 0.09 22.79 11.31 0.52 0.07 5.9010.11 4.65 1.16 0.24 3.53 2.01 0.15 0.18 13.01 6.16 0.93 0.17 2.7212.25 7.73 0.62 0.08 1.81 1.51 0.06 0.06 19.34 7.61 0.64 0.09 2.286.55 1.82 0.73 0.32 1.20 1.87 0.03 0.04 8.53 5.37 0.92 0.11 1.7612.34 9.17 0.83 0.08 2.72 2.20 0.07 0.07 21.45 7.95 0.55 0.09 2.0319.04 4.75 0.47 0.14 1.78 1.58 0.04 0.05 14.52 4.62 0.50 0.17 2.487.19 7.76 0.81 0.07 12.41 1.82 0.02 0.02 19.59 5.26 0.66 0.11 7.597.51 2.26 0.47 0.18 1.10 1.41 0.10 0.12 10.44 1.56 0.45 0.02 1.1919.35 1.22 0.65 0.07 8.04 1.19 0.08 0.09 22.79 11.31 0.52 0.07 5.9010.11 4.65 1.16 0.24 3.53 2.01 0.15 0.18 13.01 6.16 0.93 0.17 2.7212.25 7.73 0.62 0.08 1.81 1.51 0.06 0.06 19.34 7.61 0.64 0.09 2.281.45 0.95 0.55 8.46 1.72 0.97 -0.03 -0.29 1.36 1.14 0.56 8.73 3.13-2.42 0.48 1.63 14.49 23.90 4.52 -0.11 -1.75 -4.46 0.37 2.09 6.27 15.602.61 0.93 0.65 1.27 2.09 1.55 0.02 0.05 2.79 1.00 0.81 1.50 3.813.70 1.17 0.33 0.76 68.00 0.91 0.10 0.17 3.76 0.94 0.36 0.71 105.232.78 0.91 0.64 4.11 0.76 1.61 0.02 0.09 2.51 0.68 0.59 4.35 0.710.20 0.49 0.27 2.14 1.19 0.87 -0.08 -0.25 -0.47 0.49 0.40 2.44 1.541.31 0.97 0.12 16.05 0.62 0.32 -0.08 -1.32 0.73 1.17 0.19 0.68 1.563.26 1.12 0.85 0.83 15.33 1.98 0.04 0.07 3.69 1.09 0.91 0.91 13.313.34 1.31 1.34 1.87 6.06 2.68 0.08 0.24 3.82 1.29 1.50 2.00 6.310.89 0.38 0.59 0.48 41.83 9.57 -0.02 -0.03 1.09 0.34 0.66 0.42 39.651.52 1.14 1.93 5.86 17.22 2.12 -0.03 -0.18 1.24 1.24 2.60 3.53 14.26
D64

Appendix D - Quantitative Survey/ Questionnaire results/Original
Questinnaire No.333334335336337338339340341342343344345346347348349350351352353354355356357358359360361362363364365366367368369
Z_SCORE ACID AS_TURN D_E INV_TURN REC_TURN ROA ROE Z_SCORE ACID AS_TURN D_E INV_TURN6.78 3.65 1.20 0.33 20.93 1.70 0.01 0.02 8.06 3.02 1.46 0.46 41.991.95 0.96 1.53 1.53 10.60 5.39 0.01 0.03 1.84 0.98 1.61 1.42 9.350.44 0.88 0.20 0.49 30.05 4.91 -0.13 -0.20 0.89 0.85 0.24 0.61 41.746.16 2.54 0.12 0.51 8.82 0.15 -0.03 -0.05 6.61 3.69 0.09 0.29 14.269.42 6.30 1.45 0.20 3.86 1.62 -0.06 -0.08 9.53 6.94 1.50 0.17 14.268.36 2.12 0.95 0.24 2.33 3.97 -0.01 -0.01 10.03 2.22 0.84 0.22 2.0016.97 6.71 0.92 0.07 1.76 2.94 -0.06 -0.07 2.07 8.83 0.90 0.06 1.716.05 2.96 0.78 0.24 2.40 1.57 0.00 0.00 8.36 3.06 0.80 0.22 2.266.24 2.16 0.91 0.17 4.05 3.10 0.05 0.06 9.68 1.70 0.82 0.17 2.769.16 3.35 0.87 0.28 3.51 1.20 0.04 0.05 10.47 2.51 0.82 0.40 3.027.68 2.36 1.58 0.31 7.62 3.01 0.01 0.17 9.41 2.15 1.41 0.37 7.945.89 0.97 1.33 0.54 3.31 4.34 0.01 0.22 7.02 1.29 1.43 0.34 2.827.33 2.04 1.58 0.33 5.00 5.69 0.01 0.17 8.32 2.78 1.46 0.29 5.907.05 1.55 0.86 0.36 3.64 2.68 0.04 0.05 6.64 2.69 1.02 0.23 5.195.15 2.86 1.34 0.40 5.43 2.27 -0.03 -0.04 7.28 3.41 1.30 0.29 4.495.56 1.82 0.66 0.52 4.17 1.33 0.04 0.06 6.24 2.73 0.66 0.24 4.219.41 1.87 0.85 0.34 2.86 2.45 0.03 0.04 8.40 2.10 0.90 0.30 3.024.80 2.17 0.83 0.61 6.30 1.10 0.04 0.07 5.66 2.99 0.97 0.34 5.055.56 1.06 0.97 0.38 1.66 3.69 0.00 0.00 6.43 1.23 0.97 0.34 1.5714.66 5.73 0.69 0.09 2.01 5.62 0.11 0.12 18.23 1.67 0.58 0.48 1.677.76 2.19 0.71 0.31 2.86 2.01 0.08 0.10 8.46 2.02 0.70 0.35 2.875.21 1.48 1.14 0.73 6.29 2.53 0.11 0.19 6.27 1.88 1.16 0.54 7.495.20 1.17 1.05 0.76 4.29 3.23 0.02 0.03 4.47 1.96 0.74 0.42 3.134.85 1.69 1.28 0.28 5.80 8.87 -0.04 -0.05 6.05 1.43 1.37 0.32 6.378.00 4.71 0.75 0.41 7.17 1.98 -0.04 -0.06 7.30 4.41 0.70 0.45 7.075.17 1.20 0.51 0.43 1.69 1.63 0.11 0.16 5.92 1.55 0.42 0.23 1.2212.06 2.67 0.67 0.13 1.04 2.62 0.02 0.20 14.78 3.60 0.61 0.11 0.996.00 1.75 0.75 0.53 5.37 2.78 0.07 0.11 6.36 2.18 0.86 0.39 5.161.69 1.16 1.32 1.01 6.94 2.83 0.02 0.47 2.94 2.83 1.26 0.28 5.8812.64 4.19 1.39 0.12 4.55 4.01 -0.11 -0.13 14.00 4.16 1.39 0.10 4.129.95 1.04 0.71 0.14 1.31 12.45 -0.05 -0.06 11.42 0.64 0.77 0.18 1.2913.21 5.64 0.70 0.16 6.49 2.34 0.09 0.10 13.93 4.26 0.68 0.22 6.239.19 2.03 0.74 0.27 4.35 1.78 0.01 0.02 6.63 3.05 0.84 0.22 11.087.41 2.70 1.21 0.31 8.98 3.42 0.01 0.15 7.82 3.60 1.28 0.22 8.949.04 3.49 0.42 0.15 3.93 1.20 0.01 0.01 10.53 7.45 0.46 0.07 4.604.73 1.37 2.18 1.05 6.32 9.09 0.02 0.35 6.18 1.22 2.18 0.82 6.0510.22 4.76 0.89 0.20 3.49 2.09 0.06 0.07 11.37 3.51 0.86 0.23 3.17
D65

Appendix D - Quantitative Survey/ Questionnaire results/Original
Questinnaire No.370371372373374375376377378379380381382383384385386387388389390391392
Z_SCORE ACID AS_TURN D_E INV_TURN REC_TURN ROA ROE Z_SCORE ACID AS_TURN D_E INV_TURN7.36 2.33 0.75 0.22 13.97 1.89 0.05 0.06 8.39 2.95 0.74 0.19 55.177.80 2.59 0.73 0.26 5.21 3.97 0.02 0.23 9.47 4.50 0.70 0.15 6.075.34 4.13 2.14 0.18 14.06 6.12 0.01 0.01 8.62 5.16 1.27 0.12 6.866.93 1.57 0.27 0.42 0.46 1.70 -0.03 -0.04 6.13 1.74 0.30 0.40 0.427.29 3.22 0.84 0.25 3.35 1.57 -0.04 -0.06 8.09 3.08 0.82 0.25 2.793.94 1.43 1.22 0.70 5.43 2.24 0.08 0.15 4.47 1.86 1.35 0.46 5.729.20 3.29 2.29 0.41 44.84 3.05 0.02 0.30 10.78 5.14 1.79 0.21 24.285.06 0.87 0.61 0.39 1.28 3.78 0.00 0.00 6.08 0.85 0.58 0.35 1.386.74 1.56 0.65 0.32 2.06 1.93 0.06 0.09 7.79 1.34 0.61 0.42 1.995.08 5.40 0.58 0.28 3.15 11.30 -0.03 -0.04 6.41 5.72 0.60 0.15 2.619.72 2.77 0.60 0.11 57.55 2.64 0.02 0.17 12.42 2.29 0.31 0.08 43.354.58 1.60 2.51 0.31 18.39 3.02 0.04 0.05 5.86 4.18 3.73 0.08 23.2512.61 3.73 0.24 0.22 0.78 0.76 -0.16 -0.21 10.65 5.36 0.18 0.12 0.5622.90 1.02 0.44 0.05 4.29 1.31 0.02 0.02 2.91 1.25 0.39 0.04 3.4327.03 1.10 0.66 0.03 1.71 3.65 -0.02 -0.02 3.73 4.61 0.60 0.09 1.556.61 7.96 0.51 0.10 4.85 0.73 -0.13 -0.15 14.18 9.02 0.46 0.09 4.2411.64 7.12 0.33 0.10 8.33 0.76 -0.04 -0.05 16.10 8.59 0.10 0.08 2.1615.75 1.35 0.18 0.06 17.22 2.28 0.01 0.01 17.26 1.57 0.17 0.05 14.263.06 1.07 0.28 0.04 1.35 1.48 -0.16 -0.16 3.28 6.79 0.24 0.04 1.1810.81 5.30 0.67 0.11 2.17 1.59 0.04 0.05 15.41 3.98 0.61 0.12 2.214.58 1.60 2.51 0.31 18.39 3.02 0.04 0.05 5.86 4.18 3.73 0.08 23.258.48 3.06 0.90 0.61 9.76 2.80 0.02 0.03 9.45 3.41 0.89 0.18 0.15
D66

Appendix D - Quantitative Survey/ Questionnaire results/Original
Questinnaire No.123456789101112131415161718192021222324252627282930313233343536
REC_TURN ROA ROE Z_SCORE ACID AS_TURN D_E INV_TURN REC_TURN ROA ROE Z_SCORE2.06 -0.04 -0.50 0.52 0.83 0.92 18.82 3.80 1.98 -0.02 -0.42 0.200.90 -0.15 -0.29 0.15 0.67 0.27 2.10 1.87 0.60 -0.22 -0.67 -3.161.74 0.11 0.15 8.36 1.47 1.18 0.53 64.66 6.34 0.09 0.15 5.441.58 0.01 0.02 1.66 0.98 0.50 1.95 1.95 1.16 -0.14 -0.42 -0.292.03 0.11 0.19 4.55 2.12 3.08 0.44 65.53 4.96 0.07 0.09 5.456.05 0.01 0.03 -0.44 0.30 1.04 1.63 5.48 7.81 0.01 0.03 -0.4511.20 -0.01 -0.02 7.13 1.88 4.48 0.77 68.90 10.78 0.03 0.06 5.300.29 0.07 0.28 4.01 1.44 0.17 2.53 26.77 0.18 0.04 0.13 3.382.17 -0.04 -0.08 0.80 0.76 0.79 1.19 6.85 2.14 -0.04 -0.09 0.383.86 0.22 0.54 5.38 1.71 1.83 1.34 40.26 3.67 0.21 0.50 5.712.63 0.00 0.00 2.84 1.09 1.21 1.96 7.01 2.23 0.01 0.03 2.270.96 -0.08 -0.62 1.06 1.03 0.74 -24.15 47.52 0.92 -0.18 -0.06 -1.250.49 0.00 0.01 4.35 1.58 0.34 1.23 1.74 0.44 0.01 0.02 4.551.68 -0.06 -0.90 -0.33 1.01 2.67 2.63 151.07 4.46 0.16 0.59 1.841.39 0.00 0.02 1.13 1.16 1.18 3.47 15.66 1.44 0.00 0.00 1.090.55 0.04 0.13 6.23 1.77 1.07 1.64 20.98 1.40 0.10 0.30 4.972.56 0.01 0.02 5.40 0.92 1.07 0.83 243.18 3.00 -0.01 -0.02 1.451.18 0.00 0.01 2.14 1.01 1.19 4.99 9.97 1.43 0.01 0.04 1.432.23 0.02 0.03 4.91 1.67 2.07 1.13 26.77 2.83 0.06 0.13 4.252.19 -0.06 -0.20 1.99 0.64 0.32 2.62 0.45 2.29 -0.06 -0.20 1.610.26 0.01 0.01 1.71 0.11 0.57 0.89 0.89 2.19 0.01 0.01 1.5414.53 -0.03 -0.04 0.71 0.34 0.49 0.72 2.68 11.07 0.00 0.01 -0.241.39 -0.06 -0.88 2.34 0.68 0.43 -1.12 0.73 1.34 -0.07 -0.06 1.441.30 0.02 0.05 -0.61 0.74 0.55 1.90 26.77 1.52 0.03 0.08 0.120.43 0.00 0.00 5.00 1.37 0.63 2.27 26.77 0.68 0.01 0.02 2.992.90 0.03 0.05 5.89 2.19 0.34 0.31 3.23 1.92 0.02 0.03 5.942.96 0.09 0.26 3.87 1.08 1.80 1.82 5.67 3.11 0.08 0.23 3.703.88 0.09 0.19 5.57 1.21 1.89 1.36 11.26 4.42 0.07 0.17 3.853.43 0.01 0.02 3.83 1.55 1.10 0.59 8.39 3.07 0.03 0.05 4.301.92 0.07 0.12 7.11 0.94 0.86 5.60 2.26 2.25 0.08 0.55 2.388.76 -0.04 -0.20 -0.69 0.31 2.23 4.50 10.40 17.64 -0.07 -0.39 -2.480.76 -0.14 -0.79 1.27 1.73 0.14 8.13 1.71 0.33 -0.05 -0.47 1.501.33 -0.01 -0.01 4.34 4.59 0.08 1.31 2.22 0.84 -0.08 -0.19 3.192.83 0.34 0.72 7.26 1.46 1.21 1.78 101.79 2.23 0.33 0.93 5.800.97 -0.03 -0.05 1.52 1.72 0.11 0.52 0.25 1.28 -0.05 -0.07 2.250.64 0.08 0.24 8.37 3.67 0.36 1.54 1.12 0.63 0.06 0.16 8.68
3 2014
D67

Appendix D - Quantitative Survey/ Questionnaire results/Original
Questinnaire No.37383940414243444546474849505152535455565758596061626364656667686970717273
REC_TURN ROA ROE Z_SCORE ACID AS_TURN D_E INV_TURN REC_TURN ROA ROE Z_SCORE1.72 0.14 0.18 11.16 3.45 0.84 0.32 4.60 1.60 0.11 0.15 9.940.63 0.04 0.04 11.94 3.04 0.15 0.24 3.67 0.34 0.06 0.08 7.511.32 0.12 0.17 7.34 2.34 0.83 0.37 3.40 1.57 0.12 0.16 8.112.60 0.10 0.15 9.50 2.56 1.75 0.42 5.23 2.45 0.14 0.22 8.721.99 0.10 0.10 3.06 4.90 0.55 0.01 1.90 1.69 0.06 0.06 10.072.03 0.11 0.18 6.54 2.90 1.33 0.33 16.56 2.39 0.03 0.04 7.746.66 0.07 0.08 13.57 4.04 0.53 0.17 4.76 6.81 0.11 0.12 12.2311.90 0.15 0.17 10.70 3.73 0.44 0.09 83.07 11.21 0.13 0.14 14.914.22 0.34 0.59 7.21 1.99 1.74 0.43 26.77 4.13 0.36 0.54 8.870.94 0.04 0.05 7.05 3.21 0.68 0.21 0.85 1.85 -0.13 -0.15 11.861.94 0.21 0.29 9.28 2.74 1.34 0.51 16.61 2.01 0.16 0.24 7.811.07 0.27 0.31 19.03 5.99 0.41 0.18 159.66 1.40 0.11 0.13 13.691.33 0.10 0.13 8.31 1.93 0.78 0.39 2.33 1.73 0.07 0.10 8.550.60 0.00 0.00 13.74 4.97 0.38 0.18 2.06 0.55 0.00 0.00 11.044.42 0.12 0.14 11.64 3.53 1.29 0.18 4.49 3.47 0.07 0.08 11.071.64 0.00 0.01 9.06 3.57 0.66 0.44 2.13 1.36 0.02 0.02 8.661.63 0.05 0.07 8.08 3.03 1.02 0.43 13.59 1.77 0.03 0.04 7.440.39 -0.06 -0.08 7.58 2.40 0.17 0.21 0.42 0.47 -0.07 -0.08 7.415.74 0.01 0.01 6.55 3.85 1.07 0.17 5.45 5.79 -0.03 -0.04 8.821.05 0.14 0.19 13.47 4.03 0.63 0.31 7.74 1.10 0.22 0.31 11.330.64 0.01 0.02 7.51 2.99 0.53 0.58 1.75 0.84 -0.01 -0.01 7.862.24 0.11 0.13 12.40 4.44 0.36 0.23 314.84 1.49 0.04 0.05 11.161.73 0.04 0.04 15.09 7.98 0.19 0.12 1.35 0.70 0.01 0.02 14.602.63 0.01 0.02 6.38 1.99 2.19 0.44 4.89 4.53 0.06 0.09 7.861.51 0.12 0.19 9.04 2.84 1.25 0.63 26.77 2.03 0.26 0.46 9.163.41 0.28 0.45 9.83 1.93 2.10 0.61 4.35 3.77 0.19 0.31 9.092.66 0.01 0.01 11.21 3.94 0.52 0.18 6.34 3.01 0.01 0.01 10.555.49 0.15 0.24 4.88 1.03 0.67 0.29 1.22 12.92 0.21 0.28 8.382.06 0.04 0.06 7.64 1.70 0.64 0.31 1.27 1.87 0.07 0.09 8.822.75 0.03 0.04 8.67 2.32 0.73 0.22 1.78 3.08 0.05 0.06 8.871.73 0.02 0.03 8.11 2.94 0.26 0.46 4.06 0.37 0.10 0.14 8.891.73 0.02 0.03 8.11 2.94 0.26 0.46 4.06 0.37 0.10 0.14 8.890.83 -0.13 -0.15 13.25 3.21 0.48 0.20 3.24 0.89 -0.09 -0.10 9.301.73 0.02 0.03 8.11 2.76 1.03 0.23 9.39 2.08 0.00 0.00 8.480.34 0.09 0.13 10.18 2.94 0.26 0.46 4.06 0.37 0.10 0.14 8.898.81 0.03 0.03 10.40 2.10 0.31 0.17 49.23 6.15 0.08 0.09 8.131.76 0.01 0.01 8.23 2.83 0.67 0.45 1.31 1.40 0.02 0.02 7.90
D68

Appendix D - Quantitative Survey/ Questionnaire results/Original
Questinnaire No.7475767778798081828384858687888990919293949596979899100101102103104105106107108109110
REC_TURN ROA ROE Z_SCORE ACID AS_TURN D_E INV_TURN REC_TURN ROA ROE Z_SCORE3.94 0.19 0.40 6.56 2.26 2.09 0.75 61.66 4.48 0.26 0.45 8.602.97 0.17 0.24 9.48 2.77 0.90 0.45 13.13 3.42 0.10 0.14 8.651.97 0.01 0.02 6.70 2.74 1.28 0.35 118.66 2.83 -0.04 -0.06 9.192.86 0.17 0.32 6.77 2.34 1.95 0.43 5.21 2.79 0.33 0.47 10.462.72 0.05 0.06 11.64 4.09 0.53 0.12 3.13 3.17 0.05 0.06 12.931.52 0.09 0.14 8.25 2.56 0.96 0.59 264.28 1.46 0.05 0.08 7.792.09 0.12 0.16 10.05 1.92 1.41 0.50 4.41 2.37 0.11 0.17 8.165.00 0.00 0.00 13.83 2.63 1.19 0.36 8.18 5.95 0.11 0.15 7.681.64 0.22 0.33 8.91 2.99 1.02 0.43 20.26 2.35 0.27 0.39 9.982.26 0.00 0.00 7.14 11.76 1.05 0.42 6.26 2.23 -0.02 -0.03 7.773.92 0.37 0.50 9.68 3.53 0.73 0.28 26.77 3.18 0.29 0.37 10.611.44 0.03 0.04 9.94 4.46 0.67 0.16 5.28 1.96 0.10 0.11 10.212.86 0.17 0.23 10.13 3.13 1.20 0.36 23.31 3.16 0.27 0.37 10.790.60 0.03 0.06 4.90 2.20 0.79 0.71 84.02 1.13 0.18 0.31 7.737.17 0.10 0.11 10.10 1.47 0.40 0.12 11.80 6.90 0.11 0.12 11.410.58 0.05 0.08 6.80 3.17 0.38 0.31 50.47 0.62 0.05 0.08 8.042.47 0.12 0.18 7.09 3.03 1.03 0.31 8.21 2.69 0.14 0.18 9.111.85 0.03 0.04 10.49 3.03 0.58 0.49 12.45 1.69 0.09 0.15 8.794.23 0.07 0.09 6.55 2.11 1.26 0.43 5.71 3.12 0.11 0.15 7.412.29 0.01 0.01 0.37 4.58 0.50 0.08 5.85 1.72 0.02 0.03 15.322.71 0.09 0.14 7.79 2.25 0.87 0.57 1.36 5.12 0.07 0.11 7.540.80 0.02 0.04 7.04 3.05 0.74 0.40 25.94 0.88 0.03 0.05 8.060.71 0.03 0.04 7.74 4.56 0.44 0.24 26.77 0.77 0.05 0.06 9.984.08 0.03 0.04 5.61 2.25 1.04 0.26 2.38 3.22 0.05 0.07 7.801.05 -0.04 -0.04 9.45 2.15 0.30 0.13 1.17 1.23 -0.06 -0.06 8.83
1.61 0.37 0.13 0.97 3.47 -0.02 -0.02 11.401.39 -0.01 -0.01 14.17 5.07 0.47 0.12 3.27 1.07 -0.03 -0.03 14.411.07 0.04 0.08 4.36 2.33 0.73 0.44 26.77 1.70 0.06 0.09 7.392.36 0.18 0.22 11.86 3.89 1.10 0.24 6.27 2.45 0.17 0.21 11.882.68 0.27 0.46 7.32 2.59 1.24 0.47 4.54 2.31 0.04 0.67 10.891.91 0.00 0.00 10.22 4.10 1.29 0.26 4.56 2.05 0.04 0.06 7.492.87 0.11 0.13 13.15 4.86 0.87 0.14 3.56 2.38 0.07 0.08 14.452.89 0.05 0.06 14.12 2.05 0.50 0.15 26.77 3.18 0.02 0.02 8.802.38 0.05 0.07 6.31 2.64 0.72 0.29 8.73 1.84 0.06 0.08 7.313.79 -0.06 -0.06 14.76 3.58 0.77 0.10 26.77 7.74 0.14 0.15 12.882.50 0.00 0.00 12.87 3.59 1.24 0.23 16.11 2.54 0.01 0.01 8.473.18 0.14 0.18 8.65 3.68 0.54 0.20 11.36 1.51 0.12 0.15 9.73
D69

Appendix D - Quantitative Survey/ Questionnaire results/Original
Questinnaire No.111112113114115116117118119120121122123124125126127128129130131132133134135136137138139140141142143144145146147
REC_TURN ROA ROE Z_SCORE ACID AS_TURN D_E INV_TURN REC_TURN ROA ROE Z_SCORE4.47 0.21 0.28 9.25 3.23 1.59 0.18 3.71 5.40 0.22 0.26 12.785.07 0.10 0.15 5.73 1.78 1.14 0.37 8.17 4.55 0.20 0.27 7.671.13 0.02 0.03 8.42 1.26 0.25 0.21 1.00 1.27 0.01 0.01 7.921.01 -0.05 -0.05 13.52 2.49 0.09 0.08 0.45 0.81 -0.03 -0.04 14.902.93 0.02 0.02 6.84 1.22 0.61 0.20 1.97 3.89 0.03 0.04 7.592.88 0.19 0.26 11.39 3.88 1.70 0.22 6.66 2.92 0.20 0.27 13.002.17 0.02 0.03 8.62 2.93 1.25 0.32 4.32 2.76 0.09 0.13 9.2712.34 0.05 0.07 6.37 1.11 1.87 0.56 3.07 6.95 0.21 0.33 8.043.22 0.17 0.24 9.34 2.75 1.72 0.40 6.80 3.37 0.21 0.29 9.892.19 0.14 0.19 10.12 2.23 0.99 0.47 7.09 2.59 0.21 0.31 8.192.08 0.00 0.00 8.14 1.17 0.27 0.14 0.95 3.03 0.00 0.00 9.320.64 0.08 0.24 8.37 3.67 0.36 1.54 1.12 0.63 0.06 0.16 8.681.72 0.14 0.18 11.16 3.45 0.84 0.32 4.60 1.60 0.11 0.15 9.940.63 0.04 0.04 11.94 3.04 0.15 0.24 3.67 0.34 0.06 0.08 7.511.32 0.12 0.17 7.34 2.34 0.83 0.37 3.40 1.57 0.12 0.16 8.112.60 0.10 0.15 9.50 2.56 1.75 0.42 5.23 2.45 0.14 0.22 8.721.99 0.10 0.10 3.06 4.90 0.55 0.01 1.90 1.69 0.06 0.06 10.072.03 0.11 0.18 6.54 2.90 1.33 0.33 16.56 2.39 0.03 0.04 7.746.66 0.07 0.08 13.57 4.04 0.53 0.17 4.76 6.81 0.11 0.12 12.2311.90 0.15 0.17 10.70 3.73 0.44 0.09 83.07 11.21 0.13 0.14 14.914.22 0.34 0.59 7.21 1.99 1.74 0.43 26.77 4.13 0.36 0.54 8.870.94 0.04 0.05 7.05 3.21 0.68 0.21 0.85 1.85 -0.13 -0.15 11.861.94 0.21 0.29 9.28 2.74 1.34 0.51 16.61 2.01 0.16 0.24 7.811.07 0.27 0.31 19.03 5.99 0.41 0.18 159.66 1.40 0.11 0.13 13.691.33 0.10 0.13 8.31 1.93 0.78 0.39 2.33 1.73 0.07 0.10 8.550.60 0.00 0.00 13.74 4.97 0.38 0.18 2.06 0.55 0.00 0.00 11.044.42 0.12 0.14 11.64 3.53 1.29 0.18 4.49 3.47 0.07 0.08 11.071.64 0.00 0.01 9.06 3.57 0.66 0.44 2.13 1.36 0.02 0.02 8.661.63 0.05 0.07 8.08 3.03 1.02 0.43 13.59 1.77 0.03 0.04 7.440.39 -0.06 -0.08 7.58 2.40 0.17 0.21 0.42 0.47 -0.07 -0.08 7.415.74 0.01 0.01 6.55 3.85 1.07 0.17 5.45 5.79 -0.03 -0.04 8.821.05 0.14 0.19 13.47 4.03 0.63 0.31 7.74 1.10 0.22 0.31 11.330.64 0.01 0.02 7.51 2.99 0.53 0.58 1.75 0.84 -0.01 -0.01 7.862.24 0.11 0.13 12.40 4.44 0.36 0.23 314.84 1.49 0.04 0.05 11.161.73 0.04 0.04 15.09 7.98 0.19 0.12 1.35 0.70 0.01 0.02 14.602.63 0.01 0.02 6.38 1.99 2.19 0.44 4.89 4.53 0.06 0.09 7.861.51 0.12 0.19 9.04 2.84 1.25 0.63 26.77 2.03 0.26 0.46 9.16
D70

Appendix D - Quantitative Survey/ Questionnaire results/Original
Questinnaire No.148149150151152153154155156157158159160161162163164165166167168169170171172173174175176177178179180181182183184
REC_TURN ROA ROE Z_SCORE ACID AS_TURN D_E INV_TURN REC_TURN ROA ROE Z_SCORE3.41 0.28 0.45 9.83 1.93 2.10 0.61 4.35 3.77 0.19 0.31 9.092.66 0.01 0.01 11.21 3.94 0.52 0.18 6.34 3.01 0.01 0.01 10.555.49 0.15 0.24 4.88 1.03 0.67 0.29 1.22 12.92 0.21 0.28 8.382.06 0.04 0.06 7.64 1.70 0.64 0.31 1.27 1.87 0.07 0.09 8.822.75 0.03 0.04 8.67 2.32 0.73 0.22 1.78 3.08 0.05 0.06 8.871.73 0.02 0.03 8.11 2.94 0.26 0.46 4.06 0.37 0.10 0.14 8.891.73 0.02 0.03 8.11 2.94 0.26 0.46 4.06 0.37 0.10 0.14 8.890.83 -0.13 -0.15 13.25 3.21 0.48 0.20 3.24 0.89 -0.09 -0.10 9.301.73 0.02 0.03 8.11 2.76 1.03 0.23 9.39 2.08 0.00 0.00 8.480.34 0.09 0.13 10.18 2.94 0.26 0.46 4.06 0.37 0.10 0.14 8.898.81 0.03 0.03 10.40 2.10 0.31 0.17 49.23 6.15 0.08 0.09 8.131.76 0.01 0.01 8.23 2.83 0.67 0.45 1.31 1.40 0.02 0.02 7.903.94 0.19 0.40 6.56 2.26 2.09 0.75 61.66 4.48 0.26 0.45 8.602.97 0.17 0.24 9.48 2.77 0.90 0.45 13.13 3.42 0.10 0.14 8.651.97 0.01 0.02 6.70 2.74 1.28 0.35 118.66 2.83 -0.04 -0.06 9.192.86 0.17 0.32 6.77 2.34 1.95 0.43 5.21 2.79 0.33 0.47 10.462.72 0.05 0.06 11.64 4.09 0.53 0.12 3.13 3.17 0.05 0.06 12.931.52 0.09 0.14 8.25 2.56 0.96 0.59 264.28 1.46 0.05 0.08 7.792.09 0.12 0.16 10.05 1.92 1.41 0.50 4.41 2.37 0.11 0.17 8.165.00 0.00 0.00 13.83 2.63 1.19 0.36 8.18 5.95 0.11 0.15 7.681.64 0.22 0.33 8.91 2.99 1.02 0.43 20.26 2.35 0.27 0.39 9.982.26 0.00 0.00 7.14 11.76 1.05 0.42 6.26 2.23 -0.02 -0.03 7.773.92 0.37 0.50 9.68 3.53 0.73 0.28 26.77 3.18 0.29 0.37 10.611.44 0.03 0.04 9.94 4.46 0.67 0.16 5.28 1.96 0.10 0.11 10.212.86 0.17 0.23 10.13 3.13 1.20 0.36 23.31 3.16 0.27 0.37 10.793.39 -0.06 -0.07 15.43 3.25 0.84 0.06 3.16 10.25 0.01 0.02 21.171.83 0.04 0.05 9.97 10.74 0.31 0.09 2.31 1.71 0.08 0.08 16.197.62 0.11 0.13 9.51 5.25 0.28 0.06 210.00 7.81 0.11 0.12 21.919.76 0.11 0.12 15.73 7.00 1.81 0.08 10.50 8.43 0.05 0.05 20.706.37 0.07 0.09 10.62 7.09 1.32 0.06 3.31 15.15 0.05 0.05 25.542.85 -0.06 -0.07 17.40 5.28 1.04 0.10 2.91 2.83 0.04 0.04 16.111.63 0.12 0.14 14.67 8.65 0.49 0.08 2.85 2.36 0.07 0.08 20.623.97 0.03 0.04 20.61 4.42 0.33 0.08 3.93 3.18 0.02 0.02 16.322.69 0.00 0.00 18.27 3.15 0.32 0.04 0.87 2.97 -0.02 -0.02 29.892.36 0.03 0.04 21.35 1.18 0.57 0.06 2.94 2.76 0.03 0.04 22.221.83 0.01 0.01 13.59 8.07 0.96 0.11 9.63 4.18 0.02 0.02 17.415.52 0.02 0.03 14.14 2.99 0.65 0.08 2.22 6.49 0.00 0.00 16.45
D71

Appendix D - Quantitative Survey/ Questionnaire results/Original
Questinnaire No.185186187188189190191192193194195196197198199200201202203204205206207208209210211212213214215216217218219220221
REC_TURN ROA ROE Z_SCORE ACID AS_TURN D_E INV_TURN REC_TURN ROA ROE Z_SCORE2.43 -0.03 -0.03 26.63 6.56 0.24 0.06 224.36 1.55 -0.12 -0.13 26.003.10 0.02 0.06 -0.29 0.48 0.59 3.29 7.14 2.97 -0.01 -0.02 -0.545.41 0.09 0.22 5.39 1.42 2.86 1.13 11.85 5.10 0.11 0.24 5.401.94 0.00 0.01 0.96 0.80 1.05 8.27 4.89 1.92 0.00 0.04 0.594.95 -0.15 -0.15 -5.00 0.12 0.20 -6.37 0.62 2.11 -0.13 -0.11 -6.291.29 -0.03 -0.43 -2.16 0.26 0.20 -22.87 1.37 1.44 -0.09 -0.11 -2.482.23 -0.05 -0.12 0.89 0.87 0.59 1.21 1.89 1.56 -0.03 -0.08 2.142.32 0.03 0.04 4.15 2.23 0.58 0.49 1.42 2.71 -0.03 -0.04 3.912.42 0.05 0.14 2.24 0.80 1.28 2.83 13.05 2.96 0.04 0.17 0.591.71 -0.25 -0.15 -5.55 0.16 0.15 -4.77 2.81 1.26 -0.22 -0.11 -6.621.49 0.00 0.00 4.93 3.57 0.80 0.77 25.85 1.29 0.01 0.02 5.8210.63 0.07 0.26 7.76 1.17 1.90 3.98 33.82 8.21 0.07 0.34 6.343.22 0.01 0.02 1.93 1.02 0.73 0.43 149.52 3.02 0.03 0.04 3.343.14 0.01 0.05 1.21 0.96 0.68 5.13 32.32 2.64 -0.02 -0.11 -0.083.14 0.11 0.22 5.80 1.17 1.28 1.23 2.91 3.05 0.17 0.38 5.750.60 -0.01 -0.08 3.62 2.57 0.29 6.30 2.70 0.50 -0.10 -0.65 2.224.07 0.13 0.25 6.17 0.99 1.67 0.89 2.18 3.84 0.17 0.32 6.573.44 -0.06 -0.11 4.57 1.98 1.17 0.71 66.17 2.89 0.04 0.07 4.932.73 0.02 0.05 0.51 0.70 0.33 1.36 32.32 3.89 0.01 0.03 1.271.47 -0.03 -0.05 4.87 1.30 0.98 0.90 3.42 1.65 0.02 0.05 5.391.75 0.00 0.00 4.42 1.25 1.16 0.87 12.33 3.10 0.05 0.09 3.961.72 0.17 0.04 5.50 1.20 1.22 1.46 4.04 1.81 0.18 0.46 5.572.74 0.02 0.10 -4.16 0.23 0.27 10.04 9.08 1.36 -0.17 -2.06 -7.334.43 0.03 0.04 2.64 0.36 0.18 0.88 7.32 1.37 -0.23 -0.44 0.691.05 -0.03 -0.07 3.47 0.71 0.64 1.55 1.66 1.59 -0.02 -0.04 2.272.39 0.03 0.04 5.85 1.64 0.61 0.54 3.65 2.75 0.08 0.13 5.432.26 0.01 0.01 7.67 1.51 0.61 0.29 0.90 2.57 0.05 0.06 8.436.21 0.00 0.00 12.33 2.40 0.74 0.15 5.60 5.57 -0.03 -0.03 10.202.03 0.15 0.28 5.99 2.03 1.77 0.70 17.29 2.77 0.18 0.31 7.560.59 -0.01 -0.02 6.01 5.44 0.56 0.19 11.73 0.71 -0.01 -0.01 10.071.79 0.03 0.04 10.19 5.20 0.73 0.12 9.22 2.28 0.04 0.05 13.091.19 0.05 0.06 8.73 6.26 0.54 0.20 4.34 1.19 0.05 0.06 11.151.13 0.01 0.02 12.47 2.96 0.82 0.34 1.80 1.48 0.02 0.02 10.131.48 0.18 0.25 10.32 1.95 0.93 0.71 4.30 1.36 0.18 0.32 7.741.51 0.13 0.21 7.00 2.21 0.93 0.56 7.15 1.64 0.14 0.22 7.111.54 0.15 0.31 5.66 1.64 0.88 0.67 1.03 2.24 0.08 0.13 7.312.44 0.08 0.11 7.47 2.69 1.11 0.29 4.75 2.62 0.18 0.24 9.66
D72

Appendix D - Quantitative Survey/ Questionnaire results/Original
Questinnaire No.222223224225226227228229230231232233234235236237238239240241242243244245246247248249250251252253254255256257258
REC_TURN ROA ROE Z_SCORE ACID AS_TURN D_E INV_TURN REC_TURN ROA ROE Z_SCORE2.33 0.07 0.09 11.08 3.37 1.22 0.21 3.78 2.63 0.10 0.13 11.902.15 0.02 0.04 5.41 5.32 0.83 0.12 3.97 2.21 0.04 0.04 13.882.36 0.14 0.21 6.56 1.83 0.64 0.19 7.52 3.23 0.17 0.20 10.252.75 0.09 0.13 9.13 2.46 0.73 0.27 1.38 2.59 0.10 0.13 10.152.81 0.06 0.08 9.77 3.52 0.99 0.17 2.95 2.01 -0.12 -0.14 10.170.46 0.05 0.06 12.02 3.90 0.15 0.29 6.46 0.25 0.07 0.09 10.622.47 0.20 0.34 7.33 3.73 1.35 0.27 32.32 2.82 0.22 0.29 11.192.55 0.08 0.09 13.64 5.29 0.89 0.11 3.75 2.55 0.12 0.14 14.811.61 0.01 0.01 11.90 1.95 0.40 0.21 0.60 1.63 0.01 0.01 11.116.66 0.17 0.28 7.12 1.57 1.37 0.61 3.46 6.32 0.14 0.23 7.531.85 0.11 0.16 9.18 2.81 1.42 0.43 32.32 2.02 0.14 0.21 9.021.61 0.03 0.05 9.31 3.43 0.68 0.27 2.48 1.96 0.07 0.10 9.730.91 0.15 0.22 8.37 2.59 0.68 0.60 32.32 0.88 0.20 0.31 7.984.49 -0.05 -0.05 6.62 1.32 0.47 0.11 7.04 5.26 0.02 0.03 9.891.86 0.05 0.07 4.81 2.59 0.82 0.17 3.91 3.41 0.07 0.08 9.463.47 0.08 0.08 15.66 2.91 0.77 0.17 1.71 3.61 0.15 0.17 13.145.19 0.09 0.11 12.09 3.85 1.52 0.19 6.02 5.22 0.09 0.12 11.613.17 -0.09 -0.15 8.58 4.53 2.38 0.25 7.74 4.12 0.09 0.15 11.170.66 0.06 0.11 6.67 3.06 0.64 0.64 37.89 0.70 0.03 0.05 7.261.63 0.03 0.04 6.89 1.75 1.09 0.55 3.96 2.14 0.08 0.13 7.160.92 -0.13 -0.15 8.56 4.35 0.38 0.15 1.27 0.98 -0.08 -0.09 9.022.77 0.11 0.14 9.41 2.61 1.06 0.26 8.68 2.69 0.08 0.11 7.942.18 0.15 0.21 7.24 1.93 0.58 0.44 12.11 1.50 0.10 0.15 6.937.39 0.07 0.08 9.07 2.35 0.54 0.17 80.79 1.06 0.09 0.11 8.317.38 0.06 0.09 8.77 1.11 1.27 0.56 2.25 7.46 0.14 0.23 7.481.71 0.09 0.12 8.29 4.37 0.53 0.33 1.82 1.37 0.00 0.00 8.731.39 0.27 0.04 9.94 2.11 0.74 0.85 33.53 0.98 -0.05 -0.09 7.111.60 -0.05 -0.06 14.42 4.18 0.58 0.19 3.01 2.25 0.04 0.05 10.824.25 0.08 0.10 8.34 2.63 1.21 0.21 5.84 4.88 0.06 0.07 10.564.13 -0.03 -0.04 12.59 2.70 1.33 0.24 3.69 2.77 0.01 0.01 8.970.39 -0.01 -0.01 10.04 3.72 0.28 0.09 123.34 2.48 0.01 0.01 10.613.62 0.06 0.12 5.23 2.18 0.98 0.70 1.74 3.54 0.18 0.30 8.332.41 0.05 0.05 12.96 4.45 0.73 0.14 1.67 2.81 0.06 0.07 13.763.73 0.03 0.03 15.11 6.52 1.21 0.14 13.08 3.92 0.11 0.13 13.471.36 0.01 0.02 15.94 3.72 0.67 0.27 19.73 1.40 0.01 0.01 10.212.52 0.01 0.01 12.66 2.49 1.07 0.21 1.93 2.91 0.02 0.02 9.693.90 0.21 0.33 8.22 2.78 2.78 0.41 37.60 6.48 0.16 0.23 8.37
D73

Appendix D - Quantitative Survey/ Questionnaire results/Original
Questinnaire No.259260261262263264265266267268269270271272273274275276277278279280281282283284285286287288289290291292293294295
REC_TURN ROA ROE Z_SCORE ACID AS_TURN D_E INV_TURN REC_TURN ROA ROE Z_SCORE2.97 0.11 0.15 7.68 2.26 1.32 0.28 4.28 3.02 0.10 0.13 9.392.92 0.08 0.09 11.58 2.13 0.99 0.25 1.45 2.94 0.10 0.13 11.483.67 0.15 0.21 10.02 2.63 1.28 0.34 3.45 3.83 0.15 0.21 10.731.47 0.15 0.21 11.20 3.11 1.10 0.36 8.17 1.84 0.00 0.00 9.912.88 0.16 0.20 13.61 4.28 1.02 0.24 12.54 3.98 0.37 0.48 13.020.37 0.20 0.25 11.28 3.50 0.23 0.32 2.60 0.38 0.08 0.10 9.862.96 0.03 0.04 6.92 1.13 0.52 0.28 1.07 3.87 0.02 0.02 7.411.39 0.16 0.21 8.96 2.77 0.45 0.27 3.27 1.49 0.09 0.11 9.395.98 0.03 0.04 6.80 4.17 1.17 0.23 151.75 9.48 0.17 0.20 11.291.38 0.04 0.04 12.30 5.39 0.59 0.20 2.15 1.50 0.02 0.03 13.451.25 0.04 0.06 6.18 3.53 0.51 0.28 3.75 1.22 0.02 0.03 8.051.29 0.14 0.20 8.34 2.88 0.79 0.42 5.57 2.96 0.17 0.24 8.343.41 0.18 0.22 12.10 3.26 1.04 0.13 3.99 3.66 0.15 0.17 13.882.01 0.04 0.04 21.97 6.04 0.81 0.11 3.70 1.75 0.02 0.02 14.452.26 0.01 0.01 7.67 1.51 0.61 0.29 0.90 2.57 0.05 0.06 8.436.21 0.00 0.00 12.33 2.40 0.74 0.15 5.60 5.57 -0.03 -0.03 10.202.03 0.15 0.28 5.99 2.03 1.77 0.70 17.29 2.77 0.18 0.31 7.560.59 -0.01 -0.02 6.01 5.44 0.56 0.19 11.73 0.71 -0.01 -0.01 10.071.79 0.03 0.04 10.19 5.20 0.73 0.12 9.22 2.28 0.04 0.05 13.091.19 0.05 0.06 8.73 6.26 0.54 0.20 4.34 1.19 0.05 0.06 11.151.13 0.01 0.02 12.47 2.96 0.82 0.34 1.80 1.48 0.02 0.02 10.131.48 0.18 0.25 10.32 1.95 0.93 0.71 4.30 1.36 0.18 0.32 7.741.51 0.13 0.21 7.00 2.21 0.93 0.56 7.15 1.64 0.14 0.22 7.111.54 0.15 0.31 5.66 1.64 0.88 0.67 1.03 2.24 0.08 0.13 7.312.44 0.08 0.11 7.47 2.69 1.11 0.29 4.75 2.62 0.18 0.24 9.662.33 0.07 0.09 11.08 3.37 1.22 0.21 3.78 2.63 0.10 0.13 11.902.15 0.02 0.04 5.41 5.32 0.83 0.12 3.97 2.21 0.04 0.04 13.882.36 0.14 0.21 6.56 1.83 0.64 0.19 7.52 3.23 0.17 0.20 10.252.75 0.09 0.13 9.13 2.46 0.73 0.27 1.38 2.59 0.10 0.13 10.152.81 0.06 0.08 9.77 3.52 0.99 0.17 2.95 2.01 -0.12 -0.14 10.170.46 0.05 0.06 12.02 3.90 0.15 0.29 6.46 0.25 0.07 0.09 10.622.47 0.20 0.34 7.33 3.73 1.35 0.27 32.32 2.82 0.22 0.29 11.192.55 0.08 0.09 13.64 5.29 0.89 0.11 3.75 2.55 0.12 0.14 14.811.61 0.01 0.01 11.90 1.95 0.40 0.21 0.60 1.63 0.01 0.01 11.116.66 0.17 0.28 7.12 1.57 1.37 0.61 3.46 6.32 0.14 0.23 7.531.85 0.11 0.16 9.18 2.81 1.42 0.43 32.32 2.02 0.14 0.21 9.021.61 0.03 0.05 9.31 3.43 0.68 0.27 2.48 1.96 0.07 0.10 9.73
D74

Appendix D - Quantitative Survey/ Questionnaire results/Original
Questinnaire No.296297298299300301302303304305306307308309310311312313314315316317318319320321322323324325326327328329330331332
REC_TURN ROA ROE Z_SCORE ACID AS_TURN D_E INV_TURN REC_TURN ROA ROE Z_SCORE0.91 0.15 0.22 8.37 2.59 0.68 0.60 32.32 0.88 0.20 0.31 7.984.49 -0.05 -0.05 6.62 1.32 0.47 0.11 7.04 5.26 0.02 0.03 9.891.86 0.05 0.07 4.81 2.59 0.82 0.17 3.91 3.41 0.07 0.08 9.463.47 0.08 0.08 15.66 2.91 0.77 0.17 1.71 3.61 0.15 0.17 13.145.19 0.09 0.11 12.09 3.85 1.52 0.19 6.02 5.22 0.09 0.12 11.613.17 -0.09 -0.15 8.58 4.53 2.38 0.25 7.74 4.12 0.09 0.15 11.170.66 0.06 0.11 6.67 3.06 0.64 0.64 37.89 0.70 0.03 0.05 7.261.63 0.03 0.04 6.89 1.75 1.09 0.55 3.96 2.14 0.08 0.13 7.160.92 -0.13 -0.15 8.56 4.35 0.38 0.15 1.27 0.98 -0.08 -0.09 9.022.77 0.11 0.14 9.41 2.61 1.06 0.26 8.68 2.69 0.08 0.11 7.942.52 0.04 0.04 16.44 5.75 0.89 0.11 2.16 3.52 0.05 0.06 15.851.71 0.01 0.01 18.85 8.76 0.48 0.08 1.61 1.56 -0.02 -0.02 20.601.85 0.07 0.08 13.60 6.50 0.45 0.11 1.99 2.53 0.06 0.07 17.151.69 0.02 0.02 13.52 5.48 0.62 0.09 4.94 1.50 0.02 0.03 15.571.41 -0.02 -0.02 5.17 0.99 0.62 0.05 3.41 1.25 0.01 0.01 24.891.04 0.07 0.07 22.19 1.62 0.61 0.05 5.60 1.32 0.07 0.07 29.501.70 0.13 0.15 14.92 1.01 0.90 0.10 3.01 2.24 0.11 0.12 20.031.80 0.04 0.05 18.06 1.69 0.62 0.04 2.52 2.20 0.03 0.03 33.202.52 0.04 0.04 16.44 5.75 0.89 0.11 2.16 3.52 0.05 0.06 15.851.71 0.01 0.01 18.85 8.76 0.48 0.08 1.61 1.56 -0.02 -0.02 20.601.85 0.07 0.08 13.60 6.50 0.45 0.11 1.99 2.53 0.06 0.07 17.151.69 0.02 0.02 13.52 5.48 0.62 0.09 4.94 1.50 0.02 0.03 15.571.41 -0.02 -0.02 5.17 0.99 0.62 0.05 3.41 1.25 0.01 0.01 24.891.04 0.07 0.07 22.19 1.62 0.61 0.05 5.60 1.32 0.07 0.07 29.501.70 0.13 0.15 14.92 1.01 0.90 0.10 3.01 2.24 0.11 0.12 20.031.80 0.04 0.05 18.06 1.69 0.62 0.04 2.52 2.20 0.03 0.03 33.200.95 -0.02 -0.17 1.32 1.50 0.62 9.11 3.59 0.99 0.00 0.00 2.578.73 0.06 0.44 -3.23 0.37 2.53 5.25 21.29 10.96 0.03 0.16 -3.561.68 0.05 0.14 2.54 0.90 0.88 1.18 2.71 2.14 0.10 0.21 3.311.39 0.12 0.21 3.56 0.44 0.29 0.82 47.47 1.80 -0.09 -0.17 0.691.79 0.00 0.01 1.45 0.66 0.64 4.14 0.82 2.11 0.01 0.04 1.641.22 -0.03 -0.11 -0.36 0.63 0.72 1.95 2.67 1.79 0.07 0.20 1.140.72 -0.06 -0.04 1.40 1.12 0.12 -61.53 0.33 0.56 -0.03 -0.13 1.172.02 0.00 0.00 3.19 1.00 1.14 1.57 15.71 2.22 -0.10 -0.26 2.472.84 0.09 0.28 3.75 1.25 1.56 1.76 6.77 2.90 0.10 0.28 3.789.53 -0.01 -0.01 1.19 0.56 0.80 0.31 29.62 10.33 0.03 0.04 2.722.84 0.01 0.04 2.30 1.16 2.36 4.92 22.02 2.61 -0.07 -0.39 1.27
D75

Appendix D - Quantitative Survey/ Questionnaire results/Original
Questinnaire No.333334335336337338339340341342343344345346347348349350351352353354355356357358359360361362363364365366367368369
REC_TURN ROA ROE Z_SCORE ACID AS_TURN D_E INV_TURN REC_TURN ROA ROE Z_SCORE2.01 0.09 0.14 7.47 2.52 1.70 0.43 12.93 2.70 0.09 0.13 6.775.57 0.01 0.01 2.12 0.78 1.49 1.37 6.03 5.96 0.06 0.14 2.202.92 -0.08 -0.13 0.52 0.56 0.35 0.65 36.59 5.09 -0.02 -0.03 0.540.11 -0.04 -0.06 8.52 3.02 0.10 0.39 2.57 0.13 -0.04 -0.06 7.311.70 0.03 0.04 11.00 0.67 1.51 0.18 12.99 1.91 0.03 0.04 10.624.19 0.03 0.03 10.66 1.11 1.02 0.43 2.19 7.47 0.04 0.06 7.053.06 0.02 0.02 2.46 4.39 0.92 0.11 1.77 3.31 -0.07 -0.08 14.551.69 0.01 0.01 8.94 2.30 0.73 0.31 1.29 1.70 0.01 0.01 7.403.83 0.06 0.07 9.81 1.68 0.87 0.14 2.93 4.45 0.05 0.06 11.211.18 0.05 0.07 8.74 2.12 0.83 0.48 2.88 1.23 0.07 0.10 7.932.70 0.12 0.17 8.48 2.00 1.37 0.42 8.54 2.71 0.16 0.23 8.187.24 0.02 0.31 9.98 1.60 1.48 0.22 2.94 7.20 0.14 0.18 11.784.22 0.02 0.24 9.82 1.71 1.43 0.48 4.44 5.69 0.15 0.24 7.702.94 0.08 0.09 9.32 2.10 1.03 0.32 5.93 2.30 0.16 0.21 8.312.10 0.04 0.06 8.83 3.32 1.26 0.28 3.43 2.26 0.05 0.06 9.281.42 0.02 0.03 9.13 2.34 0.58 0.33 3.44 1.36 0.05 0.07 7.812.57 0.10 0.13 9.24 2.02 0.77 0.33 2.46 2.20 0.10 0.14 9.041.47 0.07 0.10 8.21 3.02 1.03 0.35 6.38 1.69 0.09 0.12 8.314.18 0.08 0.10 7.70 0.99 1.07 0.32 1.30 5.99 0.06 0.08 8.325.98 0.12 0.17 7.14 2.54 0.63 0.24 1.60 5.31 0.14 0.18 10.302.02 0.10 0.14 8.09 1.88 0.71 0.30 2.97 2.06 0.09 0.12 8.273.61 0.10 0.16 7.50 2.14 1.25 0.41 6.71 3.95 0.05 0.07 8.312.56 0.04 0.06 6.76 1.99 0.82 0.33 2.52 2.91 0.05 0.07 7.908.19 -0.04 -0.06 5.24 2.09 1.62 0.21 7.80 8.45 -0.02 -0.03 7.621.97 -0.02 -0.03 6.99 4.97 0.73 0.43 7.38 2.30 0.02 0.03 7.592.27 0.03 0.03 8.28 2.41 0.55 0.17 1.49 3.58 0.07 0.08 10.542.63 0.02 0.19 16.69 1.92 0.62 0.23 0.98 2.87 0.17 0.21 11.593.29 0.07 0.10 7.83 1.89 0.88 0.51 4.33 2.36 0.10 0.14 7.012.82 0.02 0.31 8.70 2.51 1.61 0.27 6.38 3.79 0.05 0.07 8.293.78 -0.10 -0.12 15.02 3.79 1.51 0.13 5.02 4.14 -0.06 -0.07 13.041.63 -0.01 -0.02 9.51 0.87 0.86 0.14 1.44 1.29 0.03 0.04 11.692.17 0.08 0.09 11.48 4.90 0.73 0.19 6.05 2.34 0.09 0.10 12.781.68 0.02 0.03 8.06 2.35 0.61 0.20 7.00 1.84 0.02 0.03 7.573.73 0.11 0.14 9.83 3.74 1.20 0.22 8.16 4.27 0.12 0.15 10.241.26 0.01 0.01 19.39 4.62 0.56 0.13 4.71 1.45 0.02 0.02 12.508.68 0.16 0.30 6.36 1.55 2.08 0.56 5.27 8.33 0.16 0.25 7.892.22 0.06 0.08 10.40 5.92 0.90 0.13 2.86 2.09 0.04 0.04 14.65
D76
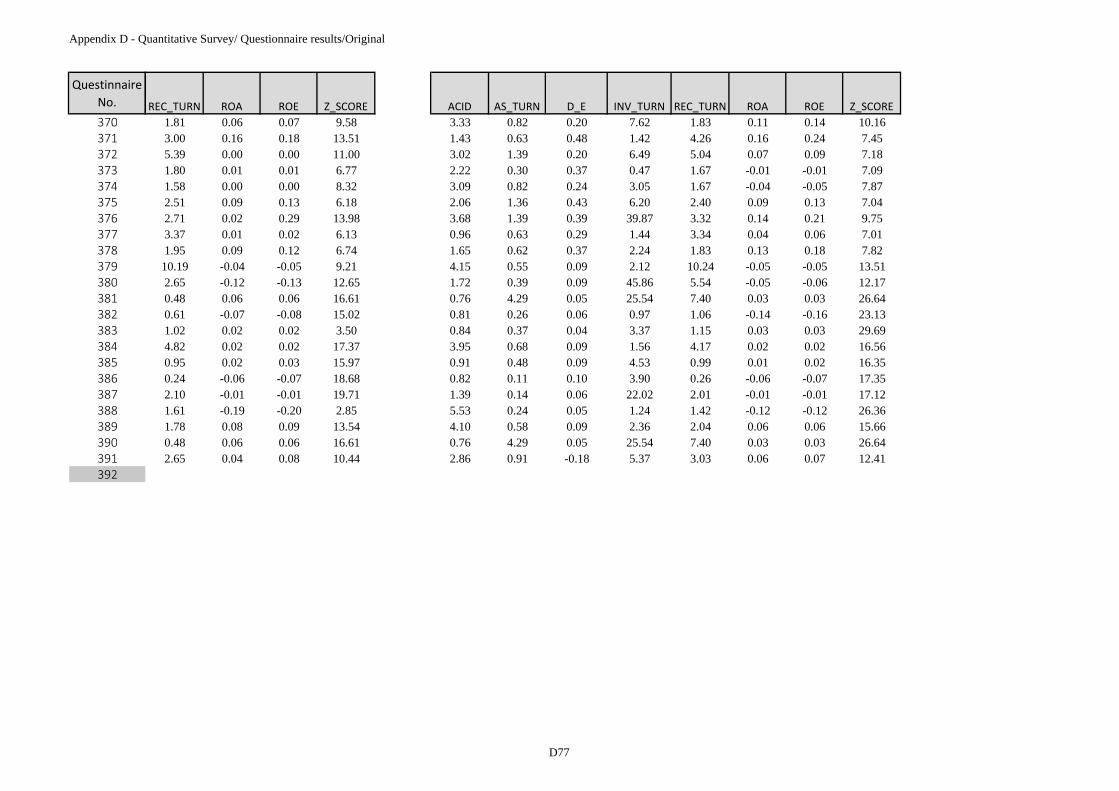
Appendix D - Quantitative Survey/ Questionnaire results/Original
Questinnaire No.370371372373374375376377378379380381382383384385386387388389390391392
REC_TURN ROA ROE Z_SCORE ACID AS_TURN D_E INV_TURN REC_TURN ROA ROE Z_SCORE1.81 0.06 0.07 9.58 3.33 0.82 0.20 7.62 1.83 0.11 0.14 10.163.00 0.16 0.18 13.51 1.43 0.63 0.48 1.42 4.26 0.16 0.24 7.455.39 0.00 0.00 11.00 3.02 1.39 0.20 6.49 5.04 0.07 0.09 7.181.80 0.01 0.01 6.77 2.22 0.30 0.37 0.47 1.67 -0.01 -0.01 7.091.58 0.00 0.00 8.32 3.09 0.82 0.24 3.05 1.67 -0.04 -0.05 7.872.51 0.09 0.13 6.18 2.06 1.36 0.43 6.20 2.40 0.09 0.13 7.042.71 0.02 0.29 13.98 3.68 1.39 0.39 39.87 3.32 0.14 0.21 9.753.37 0.01 0.02 6.13 0.96 0.63 0.29 1.44 3.34 0.04 0.06 7.011.95 0.09 0.12 6.74 1.65 0.62 0.37 2.24 1.83 0.13 0.18 7.8210.19 -0.04 -0.05 9.21 4.15 0.55 0.09 2.12 10.24 -0.05 -0.05 13.512.65 -0.12 -0.13 12.65 1.72 0.39 0.09 45.86 5.54 -0.05 -0.06 12.170.48 0.06 0.06 16.61 0.76 4.29 0.05 25.54 7.40 0.03 0.03 26.640.61 -0.07 -0.08 15.02 0.81 0.26 0.06 0.97 1.06 -0.14 -0.16 23.131.02 0.02 0.02 3.50 0.84 0.37 0.04 3.37 1.15 0.03 0.03 29.694.82 0.02 0.02 17.37 3.95 0.68 0.09 1.56 4.17 0.02 0.02 16.560.95 0.02 0.03 15.97 0.91 0.48 0.09 4.53 0.99 0.01 0.02 16.350.24 -0.06 -0.07 18.68 0.82 0.11 0.10 3.90 0.26 -0.06 -0.07 17.352.10 -0.01 -0.01 19.71 1.39 0.14 0.06 22.02 2.01 -0.01 -0.01 17.121.61 -0.19 -0.20 2.85 5.53 0.24 0.05 1.24 1.42 -0.12 -0.12 26.361.78 0.08 0.09 13.54 4.10 0.58 0.09 2.36 2.04 0.06 0.06 15.660.48 0.06 0.06 16.61 0.76 4.29 0.05 25.54 7.40 0.03 0.03 26.642.65 0.04 0.08 10.44 2.86 0.91 -0.18 5.37 3.03 0.06 0.07 12.41
D77

Appendix E: Quantitative survey, Descriptive Stat. & Scoring Results
[E-11]
Appendix E
Quantitative survey,
Descriptive Stat. &
Scoring Results
Summary: Appendix E’ includes the Quantitative survey’s results. It contains the results
derived from the scoring process, the descriptive analysis conducted as well as the statistical
analysis used for examining the correlation of the quality elements examined.

Appendix E: Quantitative survey, Descriptive Stat. & Scoring Results
[E-1]
o Section A’: Scoring Results
Sample 392 Quality Tools Organizational
Culture
Processes Performance
Appraisal
Total
Rank
(Scoring)
Group A (Small) 3.09 2.93 3.44 2.83 3.07
3
Group B (Medium) 3.21 3.21 3.38 3.37 3.29
1
Group C (Large) 2.90 3.27 3.03 3.10 3.07
2
All Groups 3.15 3.10 3.18 3.00 3.11
Total Rank (Scoring) 2 3 1 4

Appendix E: Quantitative survey, Descriptive Stat. & Scoring Results
[E-2]
Quality Elements Group A (Small)
Sample 392
Score Rank
Quality Tools 3.09 2
Organizational Culture 2.93 3
Processes 3.44 1
Performance Appraisal 2.83 4
Quality Elements Group B (Medium)
Sample 392
Score Rank
Quality Tools 3.21 4
Organizational Culture 3.21 3
Processes 3.38 1
Performance Appraisal 3.37 2
Quality Elements Group C (Large)
Sample 392

Appendix E: Quantitative survey, Descriptive Stat. & Scoring Results
[E-3]
Score Rank
Quality Tools 2.90 4
Organizational Culture 3.27 1
Processes 3.03 3
Performance Appraisal 3.10 2
o Section B: Descriptive Statistics
Medium SMEs Me_DEPENDANT Me_ORGANIZATIONAL_CU
LTURE
Me_ PERFORMANCE
APPRAISAL
Me_PROCESSES Me_QUALITY_T
OOLS
Mean 13.70 16.57 16.12 12.27 9.86
Median 13.75 16.75 16.38 13.11 9.00
Maximum 21.20 23.31 23.88 19.89 20.14
Minimum 7.37 4.31 8.25 3.89 1.86
Std. Dev. 2.73 3.24 3.34 3.64 3.88
Skewness 0.09 -1.35 -0.06 -0.18 0.48
Kurtosis 3.46 6.85 2.59 2.33 2.81
Jarque-Bera 0.71 65.19 0.53 1.72 2.83
Probability 0.70 0.00 0.77 0.42 0.24
Sum 972.94 1,176.38 1,144.38 871.00 700.00
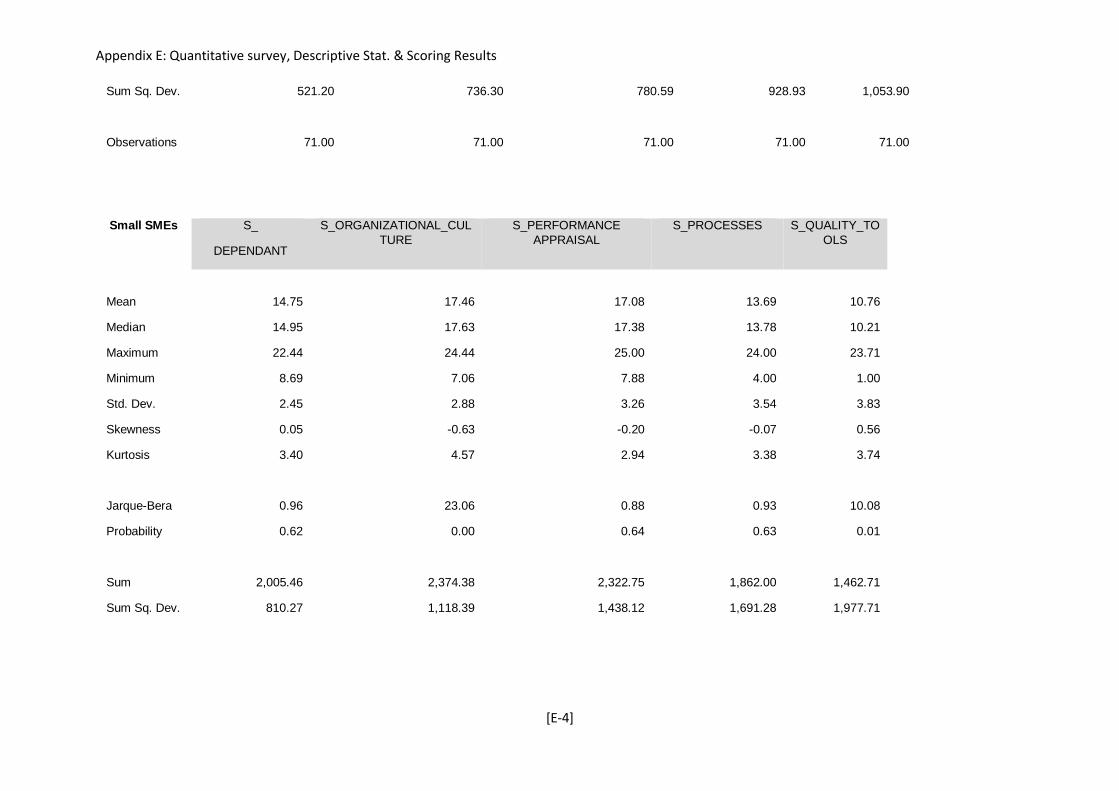
Appendix E: Quantitative survey, Descriptive Stat. & Scoring Results
[E-4]
Sum Sq. Dev. 521.20 736.30 780.59 928.93 1,053.90
Observations 71.00 71.00 71.00 71.00 71.00
Small SMEs S_
DEPENDANT
S_ORGANIZATIONAL_CUL
TURE
S_PERFORMANCE
APPRAISAL
S_PROCESSES S_QUALITY_TO
OLS
Mean 14.75 17.46 17.08 13.69 10.76
Median 14.95 17.63 17.38 13.78 10.21
Maximum 22.44 24.44 25.00 24.00 23.71
Minimum 8.69 7.06 7.88 4.00 1.00
Std. Dev. 2.45 2.88 3.26 3.54 3.83
Skewness 0.05 -0.63 -0.20 -0.07 0.56
Kurtosis 3.40 4.57 2.94 3.38 3.74
Jarque-Bera 0.96 23.06 0.88 0.93 10.08
Probability 0.62 0.00 0.64 0.63 0.01
Sum 2,005.46 2,374.38 2,322.75 1,862.00 1,462.71
Sum Sq. Dev. 810.27 1,118.39 1,438.12 1,691.28 1,977.71

Appendix E: Quantitative survey, Descriptive Stat. & Scoring Results
[E-5]
Observations 136.00 136.00 136.00 136.00 136.00
Micro SMEs Mi_
DEPENDANT
Mi
_ORGANIZATIONAL_CULT
URE
Mi _ PERFORMANCE
APPRAISAL
Mi _PROCESSES Mi
_QUALITY_TO
OLS
Mean
Median 14.03 16.94 16.17 13.18 9.84
Maximum 14.36 17.44 16.50 13.67 9.71
Minimum 22.02 24.44 23.88 25.00 21.43
Std. Dev. 4.89 3.38 5.38 2.00 1.43
Skewness 2.73 3.33 3.56 3.86 3.57
Kurtosis -0.40 -0.90 -0.31 -0.08 0.42
3.77 4.59 2.70 3.39 3.20
Jarque-Bera
Probability 9.43 44.73 3.72 1.36 5.78
0.01 0.00 0.16 0.51 0.06
Sum
Sum Sq. Dev. 2,595.72 3,133.25 2,992.13 2,437.78 1,819.71
1,373.48 2,040.93 2,336.78 2,746.25 2,350.31
Observations
185.00 185.00 185.00 185.00 185.00
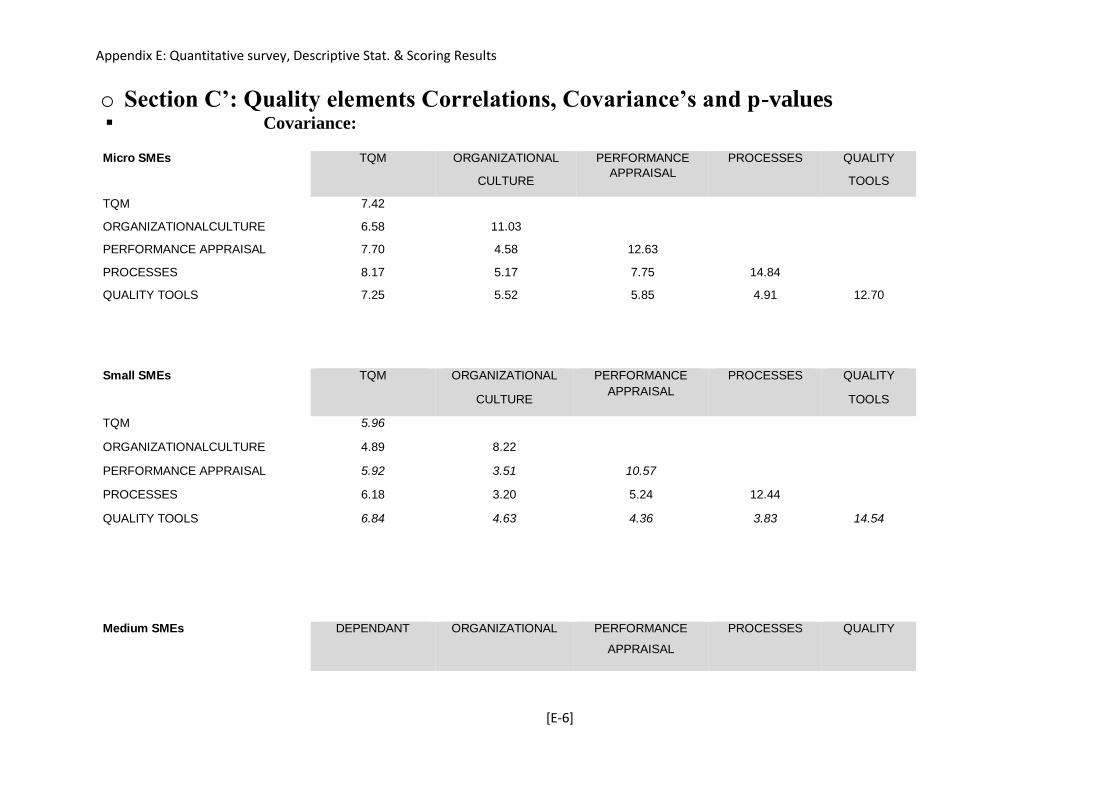
Appendix E: Quantitative survey, Descriptive Stat. & Scoring Results
[E-6]
o Section C’: Quality elements Correlations, Covariance’s and p-values Covariance:
Micro SMEs TQM ORGANIZATIONAL
CULTURE
PERFORMANCE
APPRAISAL
PROCESSES QUALITY
TOOLS
TQM 7.42
ORGANIZATIONALCULTURE 6.58 11.03
PERFORMANCE APPRAISAL 7.70 4.58 12.63
PROCESSES 8.17 5.17 7.75 14.84
QUALITY TOOLS 7.25 5.52 5.85 4.91 12.70
Small SMEs TQM ORGANIZATIONAL
CULTURE
PERFORMANCE
APPRAISAL
PROCESSES QUALITY
TOOLS
TQM 5.96
ORGANIZATIONALCULTURE 4.89 8.22
PERFORMANCE APPRAISAL 5.92 3.51 10.57
PROCESSES 6.18 3.20 5.24 12.44
QUALITY TOOLS 6.84 4.63 4.36 3.83 14.54
Medium SMEs DEPENDANT ORGANIZATIONAL PERFORMANCE
APPRAISAL
PROCESSES QUALITY
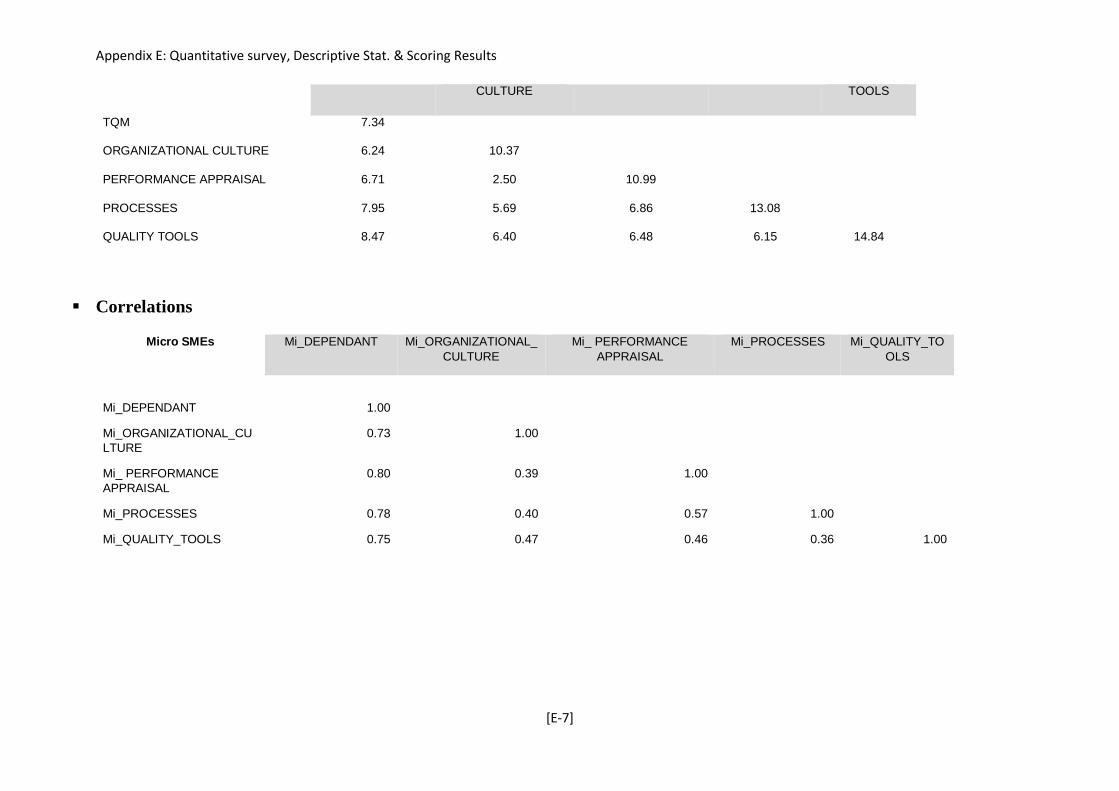
Appendix E: Quantitative survey, Descriptive Stat. & Scoring Results
[E-7]
CULTURE TOOLS
TQM 7.34
ORGANIZATIONAL CULTURE 6.24 10.37
PERFORMANCE APPRAISAL 6.71 2.50 10.99
PROCESSES 7.95 5.69 6.86 13.08
QUALITY TOOLS 8.47 6.40 6.48 6.15 14.84
Correlations
Micro SMEs Mi_DEPENDANT Mi_ORGANIZATIONAL_
CULTURE
Mi_ PERFORMANCE
APPRAISAL
Mi_PROCESSES Mi_QUALITY_TO
OLS
Mi_DEPENDANT 1.00
Mi_ORGANIZATIONAL_CU
LTURE
0.73 1.00
Mi_ PERFORMANCE
APPRAISAL
0.80 0.39 1.00
Mi_PROCESSES 0.78 0.40 0.57 1.00
Mi_QUALITY_TOOLS 0.75 0.47 0.46 0.36 1.00

Appendix E: Quantitative survey, Descriptive Stat. & Scoring Results
[E-8]
Small SMEs S_DEPENDANT S_ORGANIZATIONAL_
CULTURE
S_ PERFORMANCE
APPRAISAL
S_PROCESSES S_QUALITY_TOO
LS
S_DEPENDANT 1.00
S_ORGANIZATIONAL_CUL
TURE
0.70 1.00
S_ PERFORMANCE
APPRAISAL
0.75 0.38 1.00
S_PROCESSES 0.72 0.32 0.46 1.00
S_QUALITY_TOOLS 0.73 0.42 0.35 0.28 1.00
Medium SMEs Me_DEPENDANT Me_ORGANIZATIONAL_
CULTURE
Me_ PERFORMANCE
APPRAISAL
Me_PROCESSES Me_QUALITY_T
OOLS
Me_DEPENDANT 1.00
Me_ORGANIZATIONAL_CU
LTURE
0.72 1.00
Me_ PERFORMANCE
APPRAISAL
0.75 0.23 1.00
Me_PROCESSES 0.81 0.49 0.57 1.00
Me_QUALITY_TOOLS 0.81 0.52 0.51 0.44 1.00

Appendix E: Quantitative survey, Descriptive Stat. & Scoring Results
[E-9]
ALL SMEs G_DEPENDANT G_ORGANIZATIONAL_
CULTURE
G_ PERFORMANCE
APPRAISAL
G_PROCESSES G_QUALITY_T
OOLS
G_DEPENDANT 1.00
G_ORGANIZATIONAL_CUL
TURE
0.72 1.00
G_ PERFORMANCE
APPRAISAL
0.77 0.36 1.00
G_PROCESSES 0.77 0.40 0.54 1.00
G_QUALITY_TOOLS 0.76 0.47 0.44 0.35 1.00
(Mi-Micro, S=Small, Me=Medium, G=Total)
Quality Elements - p-values
Micro
Quality Tools Organizational
Culture Processes
Performance
Appraisal
Dependant
(TQM)
Quality Tools
Organizational Culture 0.0000000
Processes 0.0000006 0.0000000
Performance Appraisal 0.0000000 0.0000000 0.0000000
Dependant (TQM) 0.0000000 0.0000000 0.0000000 0.0000000
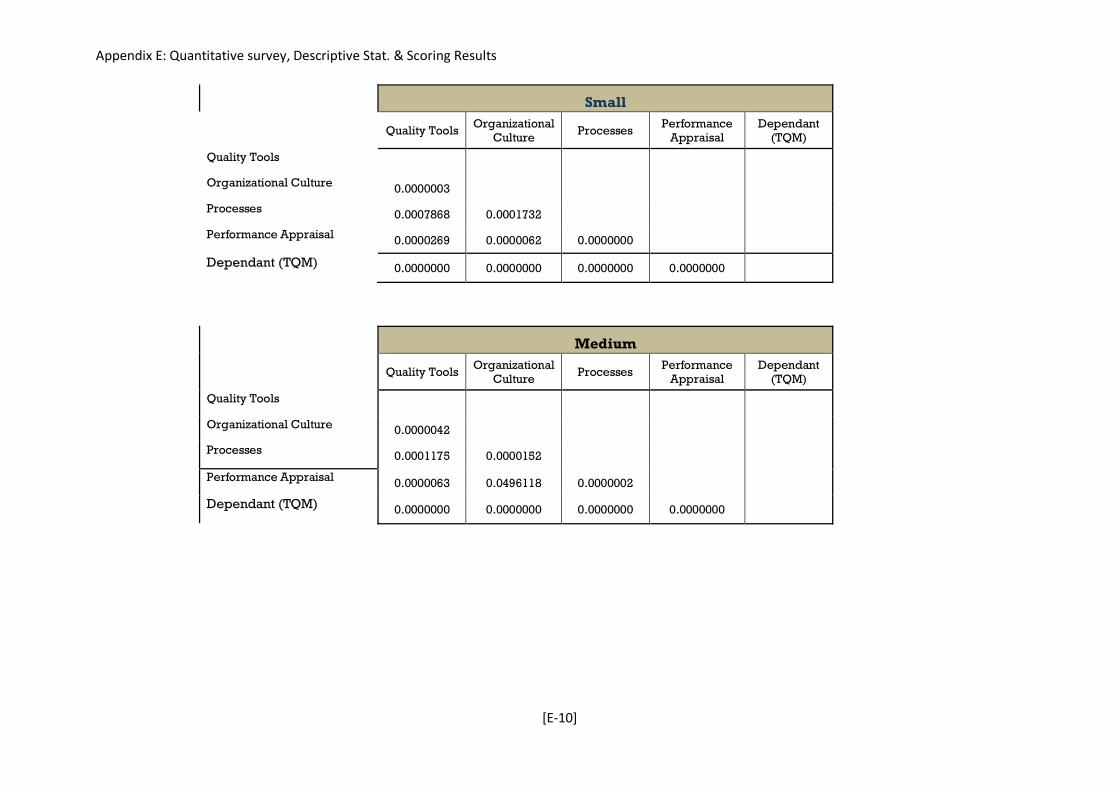
Appendix E: Quantitative survey, Descriptive Stat. & Scoring Results
[E-10]
Small
Quality Tools Organizational
Culture Processes
Performance
Appraisal
Dependant
(TQM)
Quality Tools
Organizational Culture 0.0000003
Processes 0.0007868 0.0001732
Performance Appraisal 0.0000269 0.0000062 0.0000000
Dependant (TQM) 0.0000000 0.0000000 0.0000000 0.0000000
Medium
Quality Tools Organizational
Culture Processes
Performance
Appraisal
Dependant
(TQM)
Quality Tools
Organizational Culture 0.0000042
Processes 0.0001175 0.0000152
Performance Appraisal 0.0000063 0.0496118 0.0000002
Dependant (TQM) 0.0000000 0.0000000 0.0000000 0.0000000
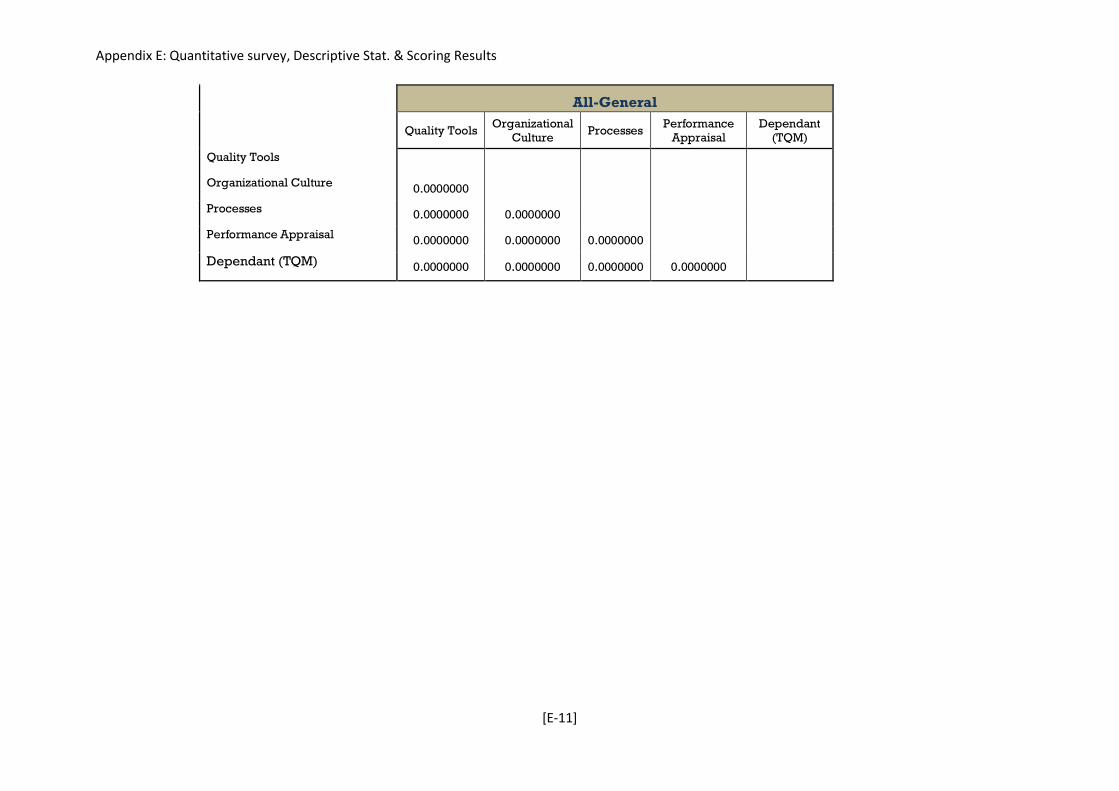
Appendix E: Quantitative survey, Descriptive Stat. & Scoring Results
[E-11]
All-General
Quality Tools Organizational
Culture Processes
Performance
Appraisal
Dependant
(TQM)
Quality Tools
Organizational Culture 0.0000000
Processes 0.0000000 0.0000000
Performance Appraisal 0.0000000 0.0000000 0.0000000
Dependant (TQM) 0.0000000 0.0000000 0.0000000 0.0000000
APPENDIX F
Ratio Analysis Statistics (Test of Equality)
Summary: Appendix F’ shows the equality tests conducted in all the financial ratios used in
evaluating the financial performance of the Greek ISO certified SMEs and their equivalent
groups (Micro, Small, Medium)

APPENDIX F Ratio Analysis Statistics (Test of Equality)
[F-1]
o Acid test Ratio (Mean and St. Deviations)
ACID TEST RATIO 2008 2009 2010
Method df Value Probability df Value Probability df Value Probability
Anova F-test (2, 1563) 46.87 0.00 (2, 1563) 70.20 0.00 (2, 1563) 75.17 0.00
Welch F-test* (2,
1040.8)
46.56 0.00
(2, 1030.8) 63.26 0.00
(2, 1039.8) 77.30
Medium SME Small SME Micro SME
Mean Std.Dev. Mean Std.Dev. Mean Std.Dev.
2008 0.75 0.87 0.94 0.92 1.29 0.94
2009 0.76 0.87 0.99 0.89 1.45 1.12
2010 0.73 0.82 1.00 0.91 1.39 0.90
2011 0.82 1.00 1.07 1.07 1.58 1.29
2012 0.86 1.18 1.20 1.42 1.63 1.29
2013 0.89 1.29 1.26 1.52 1.71 1.57
2014 0.79 0.97 1.20 1.35 1.69 1.46
ACID TEST RATIO 2011
2012
2013
Method df Value Probability
df Value Probability
df Value Probability
Anova F-test (2, 1563) 61.51 0.00
(2, 1563) 45.77 0.00
(2, 1563) 40.65 0.00
Welch F-test* (2, 1031.8)
56.50 0.00
(2, 1035.99) 50.44 0.00
(2, 1033.19) 42.28 0.00

APPENDIX F Ratio Analysis Statistics (Test of Equality)
[F-2]
ACIT TEST RATIO 2014
Method df Value Probability
Anova F-test (2, 1563) 63.69 0.00
Welch F-test* (2, 1005.18) 69.40 0.00
o Asset Turnover Ratio (Mean and St. Deviations)
Medium SME Small SME Micro SME Mean Std.Dev. Mean Std.Dev. Mean Std.Dev.
2008 0.71 0.81 0.89 0.77 1.11 0.66
2009 0.68 0.79 0.81 0.72 1.00 0.65
2010 0.64 0.71 0.74 0.61 0.94 0.61
2011 0.64 0.72 0.75 0.69 0.89 0.60
2012 0.63 0.74 0.74 0.73 0.87 0.62
2013 0.65 0.77 0.70 0.61 0.89 0.65
2014 0.64 0.74 0.73 0.64 0.92 0.71
ASSET
TURNOVER
2008
2009
2010
Method df Value Probability
df Value Probability
df Value Probability
Anova F-test
(2, 1563) 36.78 0.00
(2, 1563) 25.25 0.00
(2, 1563) 28.88 0.00
Welch F-test* (2, 1032.97) 38.87 0.00
(2,
1035.47)
25.94 0.00
(2, 1037.62) 28.66 0.00
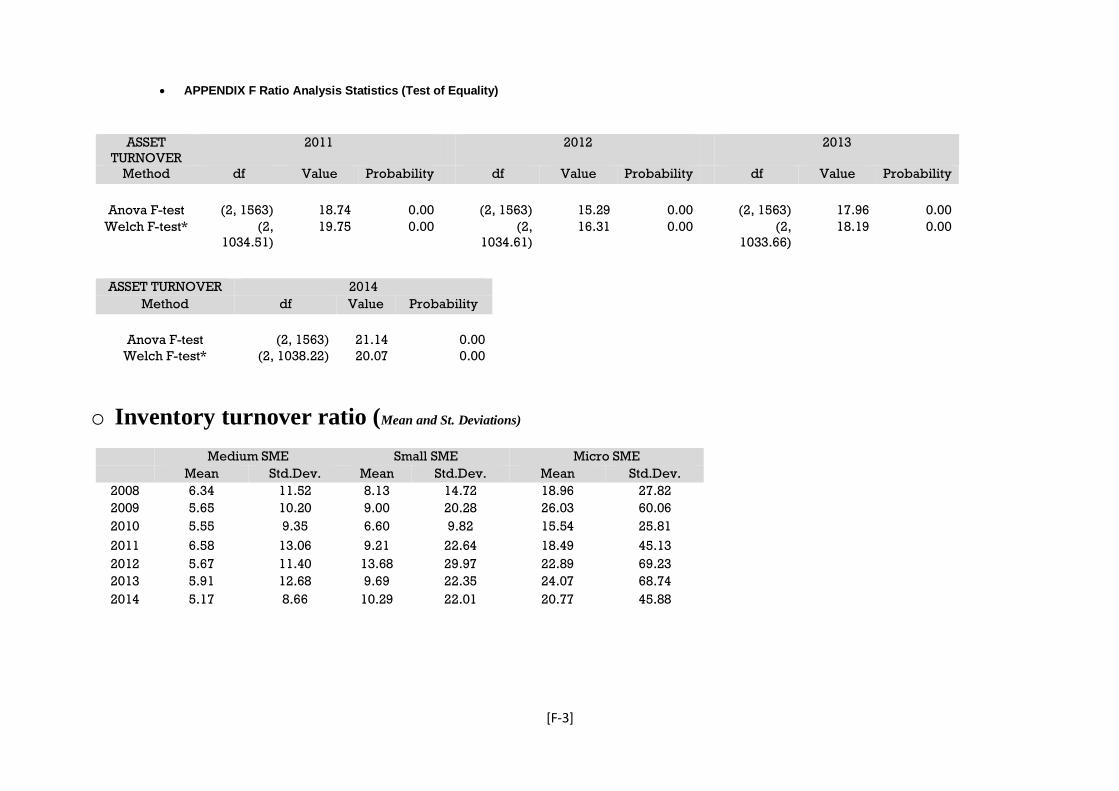
APPENDIX F Ratio Analysis Statistics (Test of Equality)
[F-3]
ASSET
TURNOVER
2011
2012
2013
Method df Value Probability
df Value Probability
df Value Probability
Anova F-test (2, 1563) 18.74 0.00
(2, 1563) 15.29 0.00
(2, 1563) 17.96 0.00
Welch F-test* (2,
1034.51)
19.75 0.00
(2,
1034.61)
16.31 0.00
(2,
1033.66)
18.19 0.00
ASSET TURNOVER 2014
Method df Value Probability
Anova F-test (2, 1563) 21.14 0.00
Welch F-test* (2, 1038.22) 20.07 0.00
o Inventory turnover ratio (Mean and St. Deviations)
Medium SME Small SME Micro SME Mean Std.Dev. Mean Std.Dev. Mean Std.Dev.
2008 6.34 11.52 8.13 14.72 18.96 27.82
2009 5.65 10.20 9.00 20.28 26.03 60.06
2010 5.55 9.35 6.60 9.82 15.54 25.81
2011 6.58 13.06 9.21 22.64 18.49 45.13
2012 5.67 11.40 13.68 29.97 22.89 69.23
2013 5.91 12.68 9.69 22.35 24.07 68.74
2014 5.17 8.66 10.29 22.01 20.77 45.88
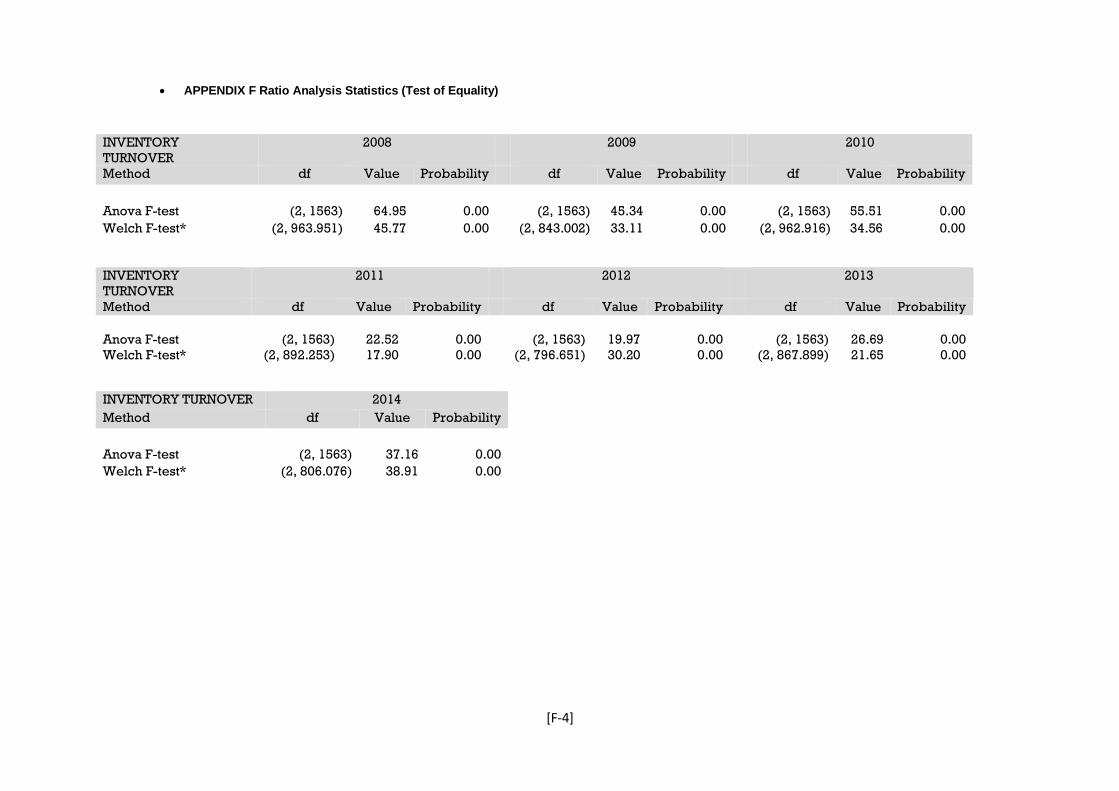
APPENDIX F Ratio Analysis Statistics (Test of Equality)
[F-4]
INVENTORY
TURNOVER
2008
2009
2010
Method df Value Probability
df Value Probability
df Value Probability
Anova F-test (2, 1563) 64.95 0.00
(2, 1563) 45.34 0.00
(2, 1563) 55.51 0.00
Welch F-test* (2, 963.951) 45.77 0.00
(2, 843.002) 33.11 0.00
(2, 962.916) 34.56 0.00
INVENTORY
TURNOVER
2011
2012
2013
Method df Value Probability
df Value Probability
df Value Probability
Anova F-test (2, 1563) 22.52 0.00
(2, 1563) 19.97 0.00
(2, 1563) 26.69 0.00
Welch F-test* (2, 892.253) 17.90 0.00
(2, 796.651) 30.20 0.00
(2, 867.899) 21.65 0.00
INVENTORY TURNOVER 2014
Method df Value Probability
Anova F-test (2, 1563) 37.16 0.00
Welch F-test* (2, 806.076) 38.91 0.00

APPENDIX F Ratio Analysis Statistics (Test of Equality)
[F-5]
o Receivable Turnover ratio (Mean and St. Deviations)
Medium SME Small SME Micro SME
Mean Std.Dev. Mean Std.Dev. Mean Std.Dev.
2008 1.84 2.17 2.22 2.05 3.16 2.94
2009 1.74 2.09 2.09 2.01 2.68 2.12
2010 1.72 2.10 1.81 1.54 2.71 2.64
2011 1.79 2.32 1.82 1.60 2.65 2.57
2012 1.72 2.14 1.92 1.80 2.64 2.36
2013 1.78 2.17 2.08 2.19 2.78 2.60
2014 1.88 2.29 1.99 1.76 2.88 2.76
RECEIVABLE TURNOVER 2008
2009
2010
Method df Value Probability
df Value Probability
df Value Probability
Anova F-test (2,
1563)
40.72 0.00
(2, 1563) 27.11 0.00
(2, 1563) 34.24 0.00
Welch F-test* (2,
1022.1)
33.91 0.00
(2,
1041.44)
26.26 0.00
(2, 993.191) 26.94 0.00
RECEIVABLE TURNOVER 2011
2012
2013
Method df Value Probability
df Value Probability
df Value Probability
Anova F-test (2,
1563)
25.60 0.00
(2, 1563) 27.69 0.00
(2, 1563) 25.10 0.00
Welch F-test* (2,
994.724)
22.09 0.00
(2,
1028.22)
24.09 0.00
(2, 1035.9) 22.95 0.00

APPENDIX F Ratio Analysis Statistics (Test of Equality)
[F-6]
RECEIVABLE TURNOVER 2014
Method df Value Probability
Anova F-test (2, 1563) 29.34 0.00
Welch F-test* (2, 1006.86) 23.84 0.00
o Return on Assets (ROA) ratio (Mean and St. Deviations)
ROA 2008
2009
2010
Method df Value Probability
df Value Probability
df Value Probability
Anova F-test (2, 1563) 9.71 0.00
(2, 1563) 11.68 0.00
(2, 1563) 8.25 0.00
Welch F-test* (2, 1029) 8.60 0.00
(2, 1019) 12.27 0.00
(2, 1008) 10.81 0.00
Medium SME Small SME Micro SME
Mean Std.Dev. Mean Std.Dev. Mean Std.Dev.
2008 0.03 0.08 0.04 0.07 0.05 0.09
2009 0.02 0.04 0.03 0.05 0.04 0.06
2010 0.01 0.04 0.02 0.05 0.02 0.06
2011 0.01 0.04 0.00 0.05 0.02 0.06
2012 0.00 0.04 0.00 0.06 0.01 0.09
2013 0.01 0.05 0.01 0.07 0.02 0.09
2014 0.01 0.07 0.02 0.08 0.03 0.10

APPENDIX F Ratio Analysis Statistics (Test of Equality)
[F-7]
ROA 2011
2012
2013
Method df Value Probability
df Value Probability
df Value Probability
Anova F-test (2, 1563) 8.20 0.00
(2, 1563) 9.02 0.00
(2, 1563) 9.13 0.00
Welch F-test* (2, 1024) 7.19 0.00
(2, 971) 8.26 0.00
(2, 990) 9.16 0.00
ROA 2014
Method df Value Probability
Anova F-test (2, 1563) 4.87 0.01
Welch F-test* (2, 1019) 4.40 0.01
o Return on Equity (ROE) ratio (Mean and St. Deviations)
Medium SME Small SME Micro SME
Mean Std.Dev. Mean Std.Dev. Mean Std.Dev.
2008 0.10 0.21 0.14 0.23 0.18 0.28
2009 0.07 0.12 0.09 0.15 0.11 0.16
2010 0.03 0.21 0.08 0.19 0.06 0.23
2011 -0.01 0.26 0.02 0.22 0.05 0.22
2012 -0.06 0.39 -0.02 0.26 0.01 0.23
2013 0.02 0.14 -0.01 0.24 0.04 0.22
2014 -0.01 0.44 0.03 0.29 0.06 0.43
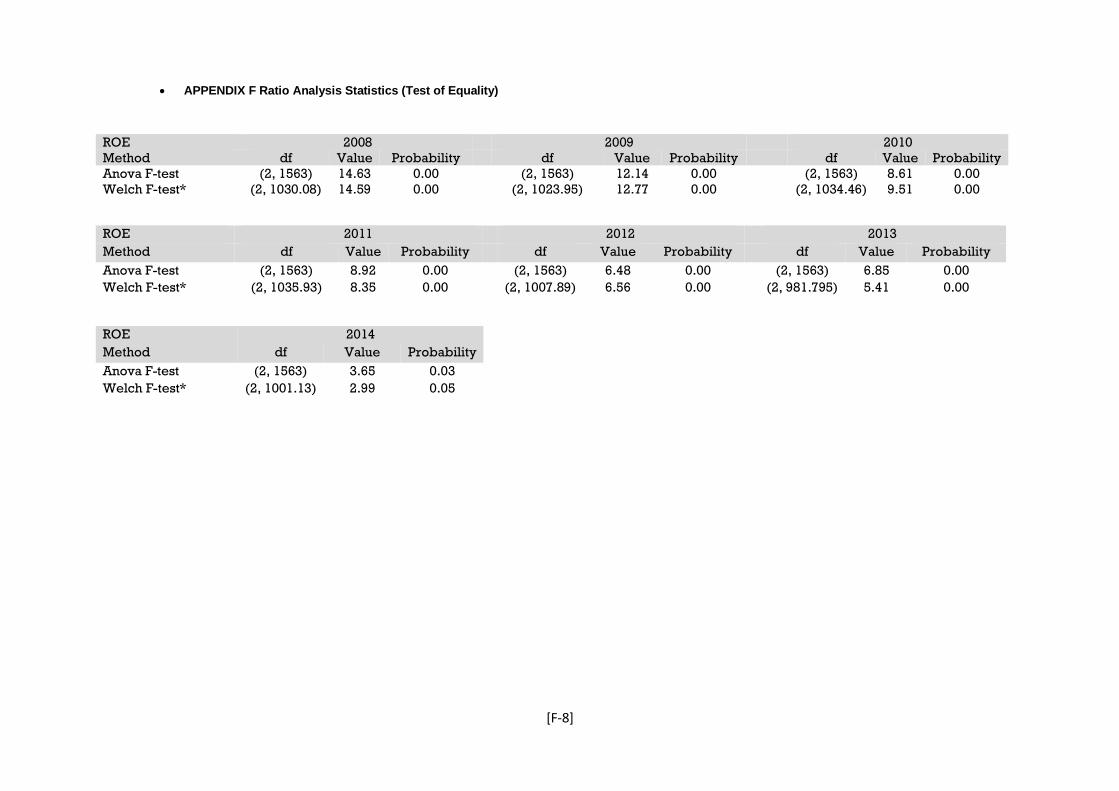
APPENDIX F Ratio Analysis Statistics (Test of Equality)
[F-8]
ROE 2008
2009
2010
Method df Value Probability
df Value Probability
df Value Probability
Anova F-test (2, 1563) 14.63 0.00
(2, 1563) 12.14 0.00
(2, 1563) 8.61 0.00
Welch F-test* (2, 1030.08) 14.59 0.00
(2, 1023.95) 12.77 0.00
(2, 1034.46) 9.51 0.00
ROE 2011
2012
2013
Method df Value Probability
df Value Probability
df Value Probability
Anova F-test (2, 1563) 8.92 0.00
(2, 1563) 6.48 0.00
(2, 1563) 6.85 0.00
Welch F-test* (2, 1035.93) 8.35 0.00
(2, 1007.89) 6.56 0.00
(2, 981.795) 5.41 0.00
ROE 2014
Method df Value Probability
Anova F-test (2, 1563) 3.65 0.03
Welch F-test* (2, 1001.13) 2.99 0.05

APPENDIX F Ratio Analysis Statistics (Test of Equality)
[F-9]
o Debt to Equity ratio (Mean and St. Deviations)
Medium SME Small SME Micro SME
Mean Std.Dev. Mean Std.Dev. Mean Std.Dev.
2008 1.45 2.11 2.38 3.24 3.21 4.38
2009 1.66 3.02 2.38 3.88 2.84 3.90
2010 1.57 2.89 2.18 4.63 2.95 4.81
2011 1.51 2.71 1.95 3.96 2.46 5.17
2012 1.67 4.00 1.75 3.79 2.05 4.49
2013 1.16 5.74 1.45 3.81 2.38 9.27
2014 1.36 6.55 1.39 7.77 2.20 7.11
DEBT TO
EQUITY
2008
2009
2010
Method df Value Probability
df Value Probability
df Value Probability
Anova F-test (2, 1563) 35.47 0.00
(2, 1563) 13.97 0.00
(2, 1563) 14.13 0.00
Welch F-test* (2, 957.905) 40.70 0.00
(2, 1025.2) 15.80 0.00
(2, 979.18) 16.29 0.00
DEBT TO
EQUITY
2011
2012
2013
Method df Value Probability
df Value Probability
df Value Probability
Anova F-test (2, 1563) 7.18 0.00
(2, 1563) 1.20 0.30
(2, 1563) 4.75 0.01 Welch F-test* (2, 973.975) 7.64 0.00
(2, 1037.19) 1.09 0.34
(2, 944.069) 3.27 0.04

APPENDIX F Ratio Analysis Statistics (Test of Equality)
[F-10]
DEBT TO EQUITY 2014
Method Df Value Probability
Anova F-test (2, 1563) 2.31 0.10
Welch F-test* (2, 1036.98) 2.37 0.09
o Altman’s Z-Score ratio (Mean and St. Deviations)
Z-SCORE 2008
2009
2010
Method df Value Probability
df Value Probability
df Value Probability
Anova F-test (2, 1563) 22.22 0.00
(2, 1563) 30.93 0.00
(2, 1563) 25.43 0.00
Welch F-test* (2,
1028.4)
19.05 0.00
(2,
1038.82)
28.91 0.00
(2,
1036.34)
22.97 0.00
Medium SME Small SME Micro SME
Mean Std.Dev. Mean Std.Dev. Mean Std.Dev.
2008 1.95 2.94 2.32 2.69 3.20 3.60
2009 1.92 2.83 2.43 2.75 3.32 3.15
2010 1.88 2.92 2.24 2.73 3.16 3.28
2011 2.01 3.42 2.41 3.59 3.63 4.11
2012 1.99 3.41 2.67 4.12 3.92 4.54
2013 2.04 3.76 2.78 4.10 3.87 4.54
2014 2.23 4.18 2.82 4.53 3.99 4.88

APPENDIX F Ratio Analysis Statistics (Test of Equality)
[F-11]
Z-SCORE 2011
2012
2013
Method df Value Probability
df Value Probability
df Value Probability
Anova F-test (2, 1563) 26.90 0.00
(2, 1563) 30.64 0.00
(2, 1563) 25.86 0.00
Welch F-test* (2, 1036.28) 24.86 0.00
(2, 1026.64) 30.28 0.00
(2, 1035.99) 25.25 0.00
Z-SCORE 2014
Method df Value Probability
Anova F-test (2, 1563) 20.15 0.00
Welch F-test* (2, 1037.89) 19.59 0.00
Appendix Ga
Financial Ratios
Trend Analysis
per size groups
Summary: Appendix Ga includes the results derived from the trend analysis
conducted on the financial ratios used on the per size group of the Greek ISO certified
SMEs for the population and the sample participated in the survey.

Appendix Ga’ Financial Ratios Trend Analysis per size groups
[Ga-1]
Section A’: Trend Analysis – All SMEs
Acid Ratio
Group 2008 2009 2010 2011 2012 2013 2014
Micro 1.29 1.45 1.39 1.58 1.63 1.71 1.69
Small 1.21 1.45 1.28 1.37 1.54 1.61 1.54
Medium 1.24 1.26 1.21 1.36 1.43 1.48 1.32
Asset Turnover
Group 2008 2009 2010 2011 2012 2013 2014
Micro 1.11 1.00 0.94 0.89 0.87 0.89 0.92
Small 1.15 1.04 0.95 0.96 0.95 0.89 0.93
Medium 1.18 1.13 1.06 1.05 1.04 1.08 1.06
Inventory Turnover
Group 2008 2009 2010 2011 2012 2013 2014
Micro 18.96 26.03 20.71 18.49 22.89 24.07 20.77
Small 10.42 11.55 8.47 11.82 17.54 12.43 13.19
Medium 10.51 9.36 9.19 10.90 9.40 9.79 8.57
Receivable Turnover
Group 2008 2009 2010 2011 2012 2013 2014
Micro 3.16 2.68 2.71 2.65 2.64 2.78 2.88
Small 2.85 2.67 2.32 2.34 2.46 2.67 2.56
Medium 3.05 2.89 2.84 2.97 2.85 2.95 3.11

Appendix Ga’ Financial Ratios Trend Analysis per size groups
[Ga-2]
Return-on-Equity
Group 2008 2009 2010 2011 2012 2013 2014
Micro 0.05 0.04 0.02 0.02 0.01 0.02 0.03
Small 0.06 0.04 0.03 0.00 0.00 0.02 0.02
Medium 0.05 0.03 0.02 0.02 -0.01 0.01 0.02
Return-on-Assets
Group 2008 2009 2010 2011 2012 2013 2014
Micro 0.18 0.11 0.06 0.05 0.01 0.04 0.06
Small 0.18 0.12 0.11 0.03 -0.03 -0.01 0.04
Medium 0.16 0.12 0.05 -0.02 -0.09 0.04 -0.01
Debt-to-Equity
Group 2008 2009 2010 2011 2012 2013 2014
Micro 3.21 2.84 2.95 2.46 2.05 2.38 2.20
Small 3.05 3.06 2.79 2.50 2.25 1.86 1.79
Medium 2.41 2.76 2.60 2.50 2.77 1.92 2.25
Z-Score
Group 2008 2009 2010 2011 2012 2013 2014
Micro 3.20 3.32 3.16 3.63 3.92 3.87 3.99
Small 2.97 3.11 2.87 3.09 3.42 3.57 3.62
Medium 3.24 3.18 3.12 3.33 3.30 3.37 3.70
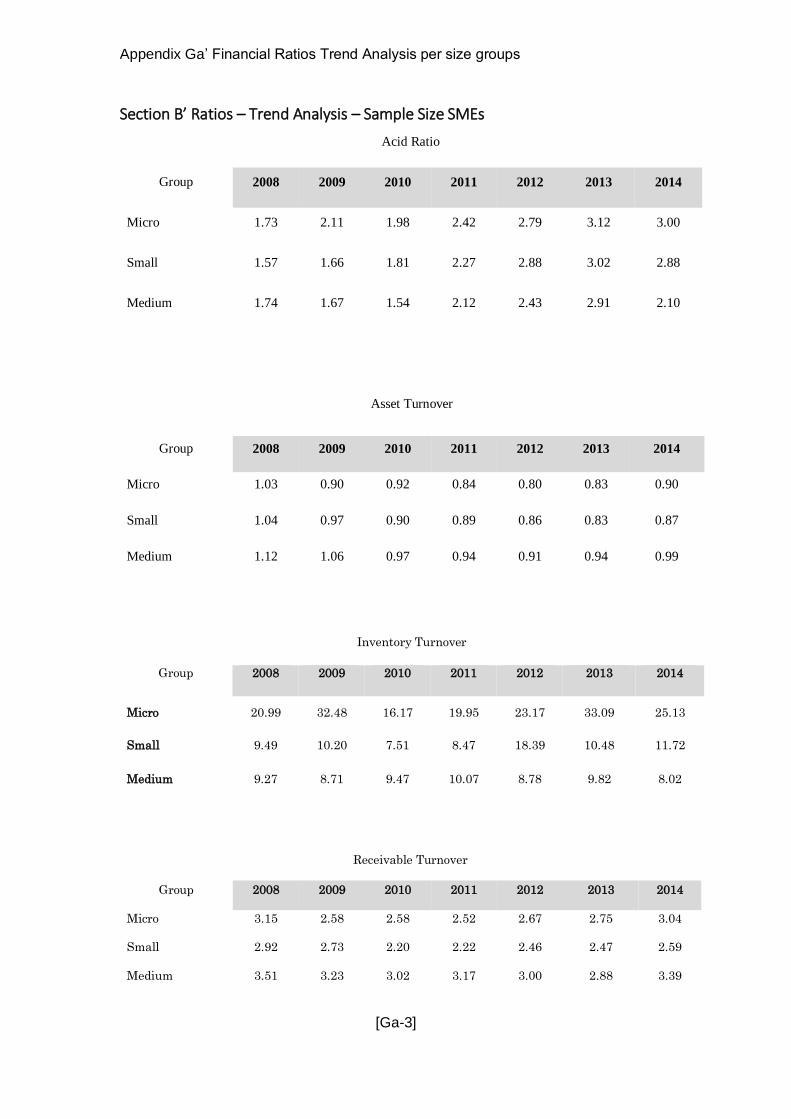
Appendix Ga’ Financial Ratios Trend Analysis per size groups
[Ga-3]
Section B’ Ratios – Trend Analysis – Sample Size SMEs
Asset Turnover
Group 2008 2009 2010 2011 2012 2013 2014
Micro 1.03 0.90 0.92 0.84 0.80 0.83 0.90
Small 1.04 0.97 0.90 0.89 0.86 0.83 0.87
Medium 1.12 1.06 0.97 0.94 0.91 0.94 0.99
Inventory Turnover
Group 2008 2009 2010 2011 2012 2013 2014
Micro 20.99 32.48 16.17 19.95 23.17 33.09 25.13
Small 9.49 10.20 7.51 8.47 18.39 10.48 11.72
Medium 9.27 8.71 9.47 10.07 8.78 9.82 8.02
Receivable Turnover
Group 2008 2009 2010 2011 2012 2013 2014
Micro 3.15 2.58 2.58 2.52 2.67 2.75 3.04
Small 2.92 2.73 2.20 2.22 2.46 2.47 2.59
Medium 3.51 3.23 3.02 3.17 3.00 2.88 3.39
Acid Ratio
Group 2008 2009 2010 2011 2012 2013 2014
Micro 1.73 2.11 1.98 2.42 2.79 3.12 3.00
Small 1.57 1.66 1.81 2.27 2.88 3.02 2.88
Medium 1.74 1.67 1.54 2.12 2.43 2.91 2.10

Appendix Ga’ Financial Ratios Trend Analysis per size groups
[Ga-4]
Return-on-Equity
Group 2008 2009 2010 2011 2012 2013 2014
Micro 0.08 0.05 0.04 0.04 0.05 0.07 0.07
Small 0.09 0.06 0.05 0.03 0.04 0.06 0.06
Medium 0.09 0.05 0.03 0.04 0.00 0.03 0.04
Return-on-Assets
Group 2008 2009 2010 2011 2012 2013 2014
Micro 0.19 0.12 0.11 0.08 0.06 0.08 0.11
Small 0.22 0.13 0.12 0.09 0.05 0.08 0.08
Medium 0.16 0.12 0.07 0.04 -0.01 0.06 0.05
Z-Score
Group 2008 2009 2010 2011 2012 2013 2014
Micro 5.45 5.92 6.05 7.42 8.48 8.59 8.99
Small 4.98 5.56 5.57 7.27 8.65 8.83 9.94
Medium 5.79 5.81 5.98 7.14 7.20 8.55 9.77
Debt-to-Equity
Group 2008 2009 2010 2011 2012 2013 2014
Micro 1.62 1.20 1.60 0.84 0.71 0.78 0.57
Small 1.43 1.24 1.06 0.96 0.83 0.49 0.38
Medium 1.38 1.36 0.83 0.96 1.08 0.68 -0.20

Appendix Gb
Financial Ratios
Trend Analysis
per Quality groups
Summary: Appendix Gb includes the results derived from the trend analysis
conducted on the financial ratios used on the per quality level implemented group of
the Greek ISO certified SMEs for the population and the sample participated in the
survey.

Appendix Gb: Financial Ratios Trend Analysis per Quality groups
[Gb-1]
Section A’: Trend Analysis – All SMEs Liquidity (Means)
Acid Ratio
Year Micro Small Medium
2008 2.23 1.79 2.64
2009 2.92 1.91 1.75
2010 2.73 2.38 1.41
2011 4.08 3.01 2.72
2012 3.82 4.92 3.23
2013 4.14 6.23 4.99
2014 5.66 3.98 1.88
Variability 1.15 1.66 1.21
Efficiency Ratios (Means)
Asset Turnover Inventory Turnover
Year Micro Small Medium Year Micro Small Medium
2008 0.91 0.96 0.99 2008 22.51 6.51 8.26
2009 0.71 0.91 0.89 2009 57.06 5.06 5.10
2010 0.78 0.86 0.81 2010 16.47 4.29 11.61
2011 0.74 0.76 0.79 2011 17.39 3.75 9.36
2012 0.65 0.72 0.78 2012 9.79 4.07 7.12
2013 0.61 0.65 0.94 2013 16.34 3.24 6.97
2014 0.71 0.65 1.06 2014 36.84 3.15 8.36
Variability 0.10 0.13 0.11
16.39 1.17 2.05
Efficiency Ratios (Cont.)
Account Receivable Turnover
Year Micro Small Medium
2008 2.96 2.07 3.04
2009 2.60 1.90 2.00
2010 2.99 1.86 1.81
2011 4.13 1.54 1.79
2012 4.06 1.70 1.76
2013 4.02 1.71 1.34
2014 5.36 2.01 2.63
Variability 0.95 0.19 0.58

Appendix Gb: Financial Ratios Trend Analysis per Quality groups
[Gb-2]
Profitability (Means)
ROA ROE
Year Micro Small Medium Year Micro Small Medium
2008 0.11 0.09 0.07 2008 0.16 0.24 0.04
2009 0.08 0.11 0.06 2009 0.10 0.16 0.09
2010 0.05 0.07 0.01 2010 0.07 0.13 0.04
2011 0.03 0.06 0.00 2011 0.04 0.10 -0.01
2012 0.03 0.07 -0.05 2012 0.03 0.08 -0.06
2013 0.03 0.04 -0.01 2013 0.04 0.05 -0.01
2014 0.03 0.04 -0.03 2014 0.03 0.05 -0.03
Variability 0.03 0.02 0.04
0.05 0.07 0.05
o Section B’: Ratios - Trend Analysis for ISO+ SMEs
Liquidity
Acid Ratio
Year Micro Small Medium
2008 1.82 1.69 1.72
2009 2.20 1.78 1.84
2010 2.09 1.90 1.75
2011 2.54 2.47 2.30
2012 3.06 3.02 2.65
2013 3.46 2.97 2.99
2014 3.20 3.16 2.50
Variability 0.62 0.64 0.50
Solvency/Leverage (Means)
Debt/Equity Z-Score
Year Micro Small Medium Year Micro Small Medium
2008 0.40 0.85 0.54 2008 8.82 6.79 8.64
2009 0.28 0.45 2.25 2009 10.13 8.36 8.83
2010 0.26 0.32 -1.06 2010 10.39 6.54 8.97
2011 0.17 0.25 -0.46 2011 12.50 11.79 12.02
2012 0.12 0.15 0.14 2012 14.68 16.21 9.63
2013 0.12 0.10 0.08 2013 15.99 15.34 14.08
2014 0.07 0.08 0.07 2014 20.81 22.10 21.69
Variability 0.12 0.27 1.03
4.18 5.77 4.73

Appendix Gb: Financial Ratios Trend Analysis per Quality groups
[Gb-3]
Efficiency
Asset Turnover Inventory Turnover
Year Micro Small Medium Year Micro Small Medium
2008 1.03 1.01 1.18 2008 21.80 9.54 6.66
2009 0.89 0.95 1.10 2009 29.09 10.71 7.52
2010 0.91 0.91 1.02 2010 14.89 7.33 6.97
2011 0.84 0.87 0.99 2011 18.26 8.77 8.26
2012 0.80 0.87 0.97 2012 22.29 20.55 6.63
2013 0.85 0.85 0.93 2013 27.69 10.21 7.00
2014 0.86 0.91 0.95 2014 23.02 11.68 5.85
Variability 0.07 0.06 0.09
4.95 4.33 0.76
Account Receivable Turnover
Year Micro Small Medium
2008 3.01 2.95 3.75
2009 2.54 2.72 3.61
2010 2.47 2.17 3.23
2011 2.35 2.28 3.53
2012 2.59 2.46 3.37
2013 2.64 2.48 3.16
2014 2.76 2.68 3.46
Variability 0.22 0.27 0.21
Profitability
ROA ROE
Year Micro Small Medium Year Micro Small Medium
2008 0.09 0.09 0.12 2008 0.21 0.22 0.21
2009 0.05 0.06 0.05 2009 0.12 0.14 0.13
2010 0.05 0.06 0.04 2010 0.13 0.13 0.09
2011 0.05 0.03 0.05 2011 0.08 0.10 0.08
2012 0.05 0.04 0.02 2012 0.08 0.08 0.07
2013 0.08 0.07 0.04 2013 0.12 0.10 0.08
2014 0.09 0.08 0.06 2014 0.13 0.11 0.09
Variability 0.02 0.02 0.03
0.04 0.05 0.05

Appendix Gb: Financial Ratios Trend Analysis per Quality groups
[Gb-4]
Solvency/Leverage
Debt/Equity Z-Score
Year Micro Small Medium Year Micro Small Medium
2008 1.37 1.10 1.02 2008 5.92 5.42 6.23
2009 0.93 0.93 0.76 2009 6.27 6.00 6.16
2010 1.39 0.72 0.67 2010 6.46 6.28 6.45
2011 0.56 0.58 0.52 2011 8.07 7.90 7.54
2012 0.42 0.39 0.36 2012 9.24 9.08 8.22
2013 0.37 0.36 0.28 2013 9.28 9.43 9.24
2014 0.34 0.31 0.29 2014 9.58 9.99 9.32
Variability 0.46 0.31 0.28
1.59 1.84 1.37
o Section C’: Ratios - Trend Analysis for ISO SMEs
Liquidity
Acid Ratio
Year Micro Small Medium
2008 1.18 1.00 1.10
2009 1.47 1.04 1.04
2010 1.26 1.04 0.97
2011 1.36 1.02 1.03
2012 1.37 1.03 1.09
2013 1.40 1.16 1.04
2014 1.26 1.12 0.96
Variability 0.10 0.06 0.06
Efficiency
Asset Turnover Inventory Turnover
Year Micro Small Medium Year Micro Small Medium
2008 1.09 1.22 1.05 2008 17.25 11.22 18.44
2009 1.03 1.06 1.05 2009 36.66 11.53 15.47
2010 1.00 0.90 0.92 2010 21.08 10.38 16.01
2011 0.91 1.03 0.89 2011 27.51 10.37 16.58
2012 0.87 0.95 0.85 2012 31.62 19.37 17.16
2013 0.84 0.87 1.00 2013 60.28 16.17 21.30
2014 1.10 0.86 1.08 2014 29.01 17.37 14.89
Variability 0.10 0.13 0.09
14.07 3.76 2.18

Appendix Gb: Financial Ratios Trend Analysis per Quality groups
[Gb-5]
Efficiency
Account Receivable Turnover
Year Micro Small Medium
2008 3.76 3.37 3.12
2009 2.71 3.25 2.92
2010 2.88 2.52 3.31
2011 2.62 2.43 3.05
2012 2.46 2.95 2.79
2013 2.73 2.94 3.16
2014 3.26 2.60 3.73
0.45 0.37 0.30
Profitability
ROA ROE
Year Micro Small Medium Year Micro Small Medium
2008 0.05 0.05 0.02 2008 0.13 0.18 0.11
2009 0.05 0.02 0.04 2009 0.13 0.07 0.13
2010 0.03 0.03 0.02 2010 0.05 0.09 0.04
2011 0.02 0.00 0.01 2011 0.09 0.02 -0.04
2012 0.02 0.01 -0.01 2012 0.00 -0.07 -0.24
2013 0.02 0.01 0.02 2013 -0.05 0.01 0.06
2014 0.01 0.00 0.01 2014 0.03 -0.06 0.02
Variability 0.01 0.02 0.02
0.07 0.09 0.12
Solvency/Leverage
Debt/Equity Z-Score
Year Micro Small Medium Year Micro Small Medium
2008 3.04 2.97 3.18 2008 2.40 2.22 2.14
2009 2.61 2.90 2.67 2009 2.99 2.12 2.31
2010 2.95 2.88 2.84 2010 2.83 2.08 2.06
2011 2.21 2.85 3.51 2011 3.02 1.97 1.99
2012 2.05 2.97 4.19 2012 3.18 2.21 1.92
2013 2.62 1.21 2.43 2013 3.17 2.39 1.94
2014 1.66 0.81 -2.00 2014 2.30 1.95 1.91
Variability 0.50 0.94 2.03
0.36 0.15 0.15

APPENDIX H
Ratio Analysis
(Post Hoc Analysis)
Summary: Appendix H’ includes the results derived from the post hoc analysis conducted
on the financial ratios used from the population and the sample of the Greek ISO certified
SMEs participated in the survey.

APPENDIX H: Ratio Analysis – Post Hoc Analysis
[H-1]
Section A’: RESULTS BY SIZE (ALL REGISTERED SMEs)
For the Acid test Ratio the Post-Hoc is shown below:
Acid Ratio 2008 2009
Medium Small Micro Medium Small Micro
Groups Mean
Difference (I-J)
Sig. Mean
Difference (I-J)
Sig. Mean
Difference (I-J)
Sig. Mean
Difference (I-J)
Sig. Mean
Difference (I-J)
Sig. Mean
Difference (I-J)
Sig.
Medium
Small -0,030 0,654 0,020 0,778
Micro 0,047 0,455 0,077 0,189 .1989* 0,003 .1788* 0,004
Acid Ratio 2010 2011
Medium Small Micro Medium Small Micro
Groups Mean
Difference (I-J)
Sig. Mean
Difference (I-J)
Sig. Mean
Difference (I-J)
Sig. Mean
Difference (I-J)
Sig. Mean
Difference (I-J)
Sig. Mean
Difference (I-J)
Sig.
Medium
Small 0,078 0,212 0,016 0,846
Micro .1828* 0,002 0,104 0,059 .2205* 0,006 .2041* 0,006
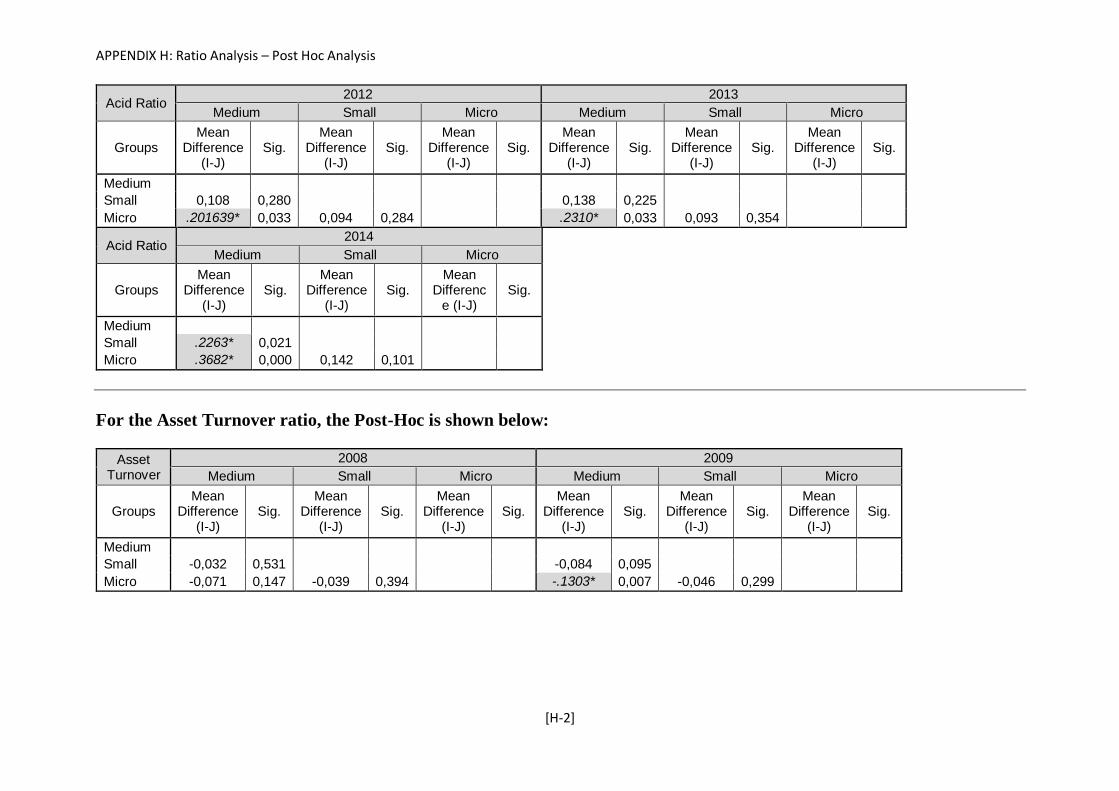
APPENDIX H: Ratio Analysis – Post Hoc Analysis
[H-2]
Acid Ratio 2012 2013
Medium Small Micro Medium Small Micro
Groups Mean
Difference (I-J)
Sig. Mean
Difference (I-J)
Sig. Mean
Difference (I-J)
Sig. Mean
Difference (I-J)
Sig. Mean
Difference (I-J)
Sig. Mean
Difference (I-J)
Sig.
Medium
Small 0,108 0,280 0,138 0,225
Micro .201639* 0,033 0,094 0,284 .2310* 0,033 0,093 0,354
Acid Ratio 2014
Medium Small Micro
Groups Mean
Difference (I-J)
Sig. Mean
Difference (I-J)
Sig. Mean
Difference (I-J)
Sig.
Medium
Small .2263* 0,021
Micro .3682* 0,000 0,142 0,101
For the Asset Turnover ratio, the Post-Hoc is shown below:
Asset Turnover
2008 2009
Medium Small Micro Medium Small Micro
Groups Mean
Difference (I-J)
Sig. Mean
Difference (I-J)
Sig. Mean
Difference (I-J)
Sig. Mean
Difference (I-J)
Sig. Mean
Difference (I-J)
Sig. Mean
Difference (I-J)
Sig.
Medium
Small -0,032 0,531 -0,084 0,095
Micro -0,071 0,147 -0,039 0,394 -.1303* 0,007 -0,046 0,299

APPENDIX H: Ratio Analysis – Post Hoc Analysis
[H-3]
Asset Turnover
2010 2011
Medium Small Micro Medium Small Micro
Groups Mean
Difference (I-J)
Sig. Mean
Difference (I-J)
Sig. Mean
Difference (I-J)
Sig. Mean
Difference (I-J)
Sig. Mean
Difference (I-J)
Sig. Mean
Difference (I-J)
Sig.
Medium
Small -.1105* 0,013 -0,088 0,060
Micro -.1212* 0,004 -0,011 0,782 -.1627* 0,000 -0,074 0,073
Asset Turnover
2012 2013
Medium Small Micro Medium Small Micro
Groups Mean
Difference (I-J)
Sig. Mean
Difference (I-J)
Sig. Mean
Difference (I-J)
Sig. Mean
Difference (I-J)
Sig. Mean
Difference (I-J)
Sig. Mean
Difference (I-J)
Sig.
Medium
Small -0,088 0,076 -.1822* 0,000
Micro -.174480* 0,000 -.086195* 0,049 -.1884* 0,000 -0,006 0,884
Asset Turnover
2014
Medium Small Micro
Groups Mean
Difference (I-J)
Sig. Mean
Difference (I-J)
Sig. Mean
Difference (I-J)
Sig.
Medium
Small -.1319*
Micro -.1472* 0,002 -0,015 0,727

APPENDIX H: Ratio Analysis – Post Hoc Analysis
[H-4]
For the Inventory Turnover ratio, the Post-Hoc is shown below:
Inventory Turnover
2008 2009
Medium Small Micro Medium Small Micro
Groups Mean
Difference (I-J)
Sig. Mean
Difference (I-J)
Sig. Mean
Difference (I-J)
Sig. Mean
Difference (I-J)
Sig. Mean
Difference (I-J)
Sig. Mean
Difference (I-J)
Sig.
Medium
Small -0,090 0,955 2,185 0,482
Micro 8.4445* 0,000 8.5341* 0,000 16.6625* 0,000 14.4773* 0,000
Inventory Turnover
2010 2011
Medium Small Micro Medium Small Micro
Groups Mean
Difference (I-J)
Sig. Mean
Difference (I-J)
Sig. Mean
Difference (I-J)
Sig. Mean
Difference (I-J)
Sig. Mean
Difference (I-J)
Sig. Mean
Difference (I-J)
Sig.
Medium
Small -0,723 0,603 0,917 0,715
Micro 6.3472* 0,000 7.0705* 0,000 7.5853* 0,002 6.6688* 0,003
Inventory Turnover
2012 2013
Medium Small Micro Medium Small Micro
Groups Mean
Difference (I-J)
Sig. Mean
Difference (I-J)
Sig. Mean
Difference (I-J)
Sig. Mean
Difference (I-J)
Sig. Mean
Difference (I-J)
Sig. Mean
Difference (I-J)
Sig.
Medium
Small 8.137435* 0,027 2,643 0,457
Micro 13.489057* 0,000 5,352 0,100 14.2794* 0,000 11.6364* 0,000
Inventory Turnover
2014
Medium Small Micro

APPENDIX H: Ratio Analysis – Post Hoc Analysis
[H-5]
Groups Mean
Difference (I-J)
Sig. Mean
Difference (I-J)
Sig. Mean
Difference (I-J)
Sig.
Medium
Small 4,620 0,064
Micro 12.1981* 0,000 7.5785* 0,001
For the Receivable Turnover ratio, the Post-Hoc is shown below:
Receivable Turnover
2008 2009
Medium Small Micro Medium Small Micro
Groups Mean
Difference (I-J)
Sig. Mean
Difference (I-J)
Sig. Mean
Difference (I-J)
Sig. Mean
Difference (I-J)
Sig. Mean
Difference (I-J)
Sig. Mean
Difference (I-J)
Sig.
Medium
Small -0,204 0,262 -0,211 0,164
Micro 0,104 0,548 0,308 0,055 -0,209 0,146 0,001 0,992
Receivable Turnover
2010 2011
Medium Small Micro Medium Small Micro
Groups Mean
Difference (I-J)
Sig. Mean
Difference (I-J)
Sig. Mean
Difference (I-J)
Sig. Mean
Difference (I-J)
Sig. Mean
Difference (I-J)
Sig. Mean
Difference (I-J)
Sig.
Medium
Small -.5261* 0,001 -.6350* 0,000
Micro -0,135 0,375 .3908* 0,006 -.3207* 0,041 .3143* 0,030

APPENDIX H: Ratio Analysis – Post Hoc Analysis
[H-6]
Receivable Turnover
2012 2013
Medium Small Micro Medium Small Micro
Groups Mean
Difference (I-J)
Sig. Mean
Difference (I-J)
Sig. Mean
Difference (I-J)
Sig. Mean
Difference (I-J)
Sig. Mean
Difference (I-J)
Sig. Mean
Difference (I-J)
Sig.
Medium
Small -.384493* 0,015 -0,283 0,107
Micro -0,202 0,176 0,182 0,188 -0,174 0,297 0,109 0,479
Receivable Turnover
2014
Medium Small Micro
Groups Mean
Difference (I-J)
Sig. Mean
Difference (I-J)
Sig. Mean
Difference (I-J)
Sig.
Medium
Small -.5522* 0,001
Micro -0,233 0,154 .3191* 0,035
For the Return on Assets (ROA) ratio, the Post-Hoc is shown below:
ROA 2008 2009
Medium Small Micro Medium Small Micro
Groups Mean
Difference (I-J)
Sig. Mean
Difference (I-J)
Sig. Mean
Difference (I-J)
Sig. Mean
Difference (I-J)
Sig. Mean
Difference (I-J)
Sig. Mean
Difference (I-J)
Sig.
Medium
Small 0,002 0,814 0,001 0,804
Micro 0,000 0,943 -0,001 0,849 0,002 0,674 0,001 0,863

APPENDIX H: Ratio Analysis – Post Hoc Analysis
[H-7]
ROA 2010 2011
Medium Small Micro Medium Small Micro
Groups Mean
Difference (I-J)
Sig. Mean
Difference (I-J)
Sig. Mean
Difference (I-J)
Sig. Mean
Difference (I-J)
Sig. Mean
Difference (I-J)
Sig. Mean
Difference (I-J)
Sig.
Medium
Small .0112* 0,006 -.0138* 0,002
Micro -0,003 0,507 -.0138* 0,000 -0,001 0,722 .0123* 0,002
ROA 2012 2013
Medium Small Micro Medium Small Micro
Groups Mean
Difference (I-J)
Sig. Mean
Difference (I-J)
Sig. Mean
Difference (I-J)
Sig. Mean
Difference (I-J)
Sig. Mean
Difference (I-J)
Sig. Mean
Difference (I-J)
Sig.
Medium
Small 0,009 0,129 0,007 0,214
Micro .020179* 0,000 .011389* 0,026 .0141* 0,011 0,007 0,183
ROA 2014
Medium Small Micro
Groups Mean
Difference (I-J)
Sig. Mean
Difference (I-J)
Sig. Mean
Difference (I-J)
Sig.
Medium Small 0,000 0,972 Micro 0,006 0,384 0,006 0,328

APPENDIX H: Ratio Analysis – Post Hoc Analysis
[H-8]
For the Return on Equity (ROE) ratio, the Post-Hoc is shown below:
ROE 2008 2009
Medium Small Micro Medium Small Micro
Groups Mean
Difference (I-J)
Sig. Mean
Difference (I-J)
Sig. Mean
Difference (I-J)
Sig. Mean
Difference (I-J)
Sig. Mean
Difference (I-J)
Sig. Mean
Difference (I-J)
Sig.
Medium
Small 0,019 0,344 -0,001 0,944
Micro 0,018 0,336 -0,001 0,971 -0,002 0,829 -0,002 0,878
ROE 2010 2011
Medium Small Micro Medium Small Micro
Groups Mean
Difference (I-J)
Sig. Mean
Difference (I-J)
Sig. Mean
Difference (I-J)
Sig. Mean
Difference (I-J)
Sig. Mean
Difference (I-J)
Sig. Mean
Difference (I-J)
Sig.
Medium
Small .0593* 0,001 .0491* 0,013
Micro 0,011 0,507 -.0481* 0,002 .0709* 0,000 0,022 0,211
ROE 2012 2013
Medium Small Micro Medium Small Micro
Groups Mean
Difference (I-J)
Sig. Mean
Difference (I-J)
Sig. Mean
Difference (I-J)
Sig. Mean
Difference (I-J)
Sig. Mean
Difference (I-J)
Sig. Mean
Difference (I-J)
Sig.
Medium
Small .060501* 0,017 -.0433* 0,013
Micro .103799* 0,000 0,043 0,053 0,005 0,753 .0485* 0,002

APPENDIX H: Ratio Analysis – Post Hoc Analysis
[H-9]
ROE 2014
Medium Small Micro
Groups Mean
Difference (I-J)
Sig. Mean
Difference (I-J)
Sig. Mean
Difference (I-J)
Sig.
Medium Small 0,051 0,125 Micro .0694* 0,027 0,019 0,523
For the Debt to Equity Ratio, the Post-Hoc is shown below:
Debt-to-Equity
2008 2009
Medium Small Micro Medium Small Micro
Groups Mean
Difference (I-J)
Sig. Mean
Difference (I-J)
Sig. Mean
Difference (I-J)
Sig. Mean
Difference (I-J)
Sig. Mean
Difference (I-J)
Sig. Mean
Difference (I-J)
Sig.
Medium
Small .6459* 0,017 0,296 0,310
Micro .8028* 0,002 0,157 0,512 0,082 0,767 -0,214 0,405
Debt-to-Equity
2010 2011
Medium Small Micro Medium Small Micro
Groups Mean
Difference (I-J)
Sig. Mean
Difference (I-J)
Sig. Mean
Difference (I-J)
Sig. Mean
Difference (I-J)
Sig. Mean
Difference (I-J)
Sig. Mean
Difference (I-J)
Sig.
Medium
Small 0,188 0,586 0,000 1,000
Micro 0,347 0,289 0,159 0,600 -0,037 0,906 -0,038 0,898
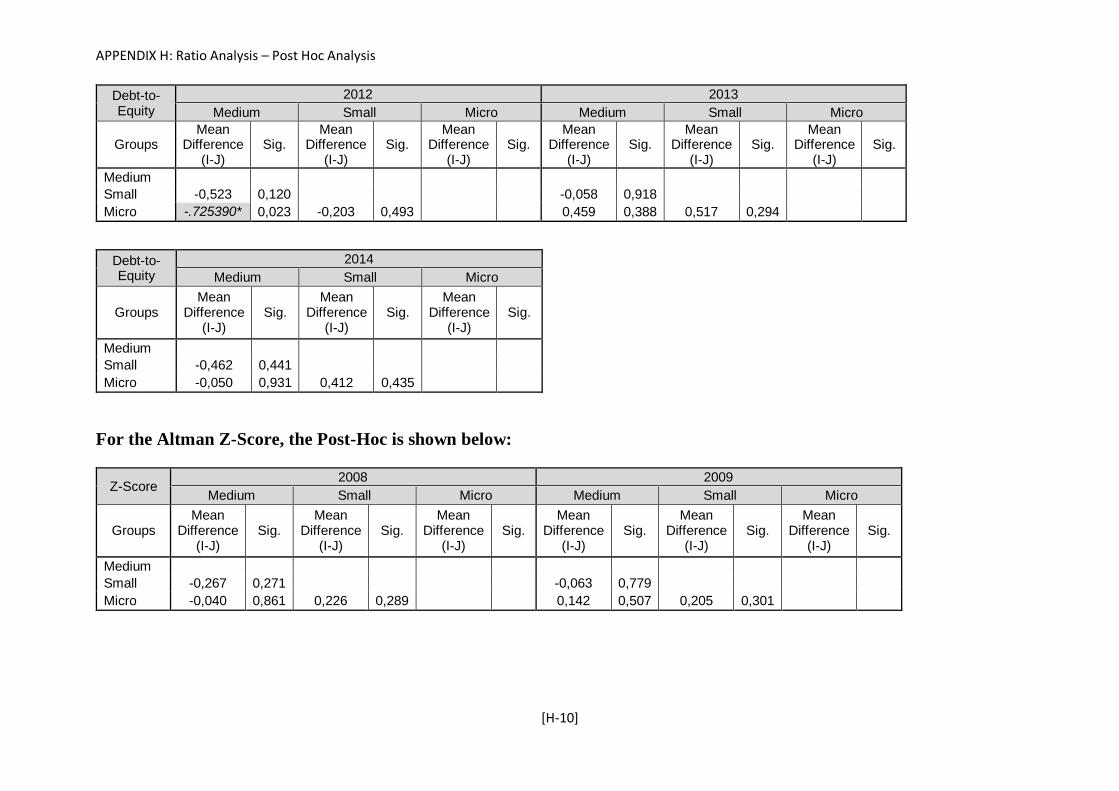
APPENDIX H: Ratio Analysis – Post Hoc Analysis
[H-10]
Debt-to-Equity
2012 2013
Medium Small Micro Medium Small Micro
Groups Mean
Difference (I-J)
Sig. Mean
Difference (I-J)
Sig. Mean
Difference (I-J)
Sig. Mean
Difference (I-J)
Sig. Mean
Difference (I-J)
Sig. Mean
Difference (I-J)
Sig.
Medium
Small -0,523 0,120 -0,058 0,918
Micro -.725390* 0,023 -0,203 0,493 0,459 0,388 0,517 0,294
Debt-to-Equity
2014
Medium Small Micro
Groups Mean
Difference (I-J)
Sig. Mean
Difference (I-J)
Sig. Mean
Difference (I-J)
Sig.
Medium
Small -0,462 0,441
Micro -0,050 0,931 0,412 0,435
For the Altman Z-Score, the Post-Hoc is shown below:
Z-Score 2008 2009
Medium Small Micro Medium Small Micro
Groups Mean
Difference (I-J)
Sig. Mean
Difference (I-J)
Sig. Mean
Difference (I-J)
Sig. Mean
Difference (I-J)
Sig. Mean
Difference (I-J)
Sig. Mean
Difference (I-J)
Sig.
Medium
Small -0,267 0,271 -0,063 0,779
Micro -0,040 0,861 0,226 0,289 0,142 0,507 0,205 0,301

APPENDIX H: Ratio Analysis – Post Hoc Analysis
[H-11]
Z-Score 2010 2011
Medium Small Micro Medium Small Micro
Groups Mean
Difference (I-J)
Sig. Mean
Difference (I-J)
Sig. Mean
Difference (I-J)
Sig. Mean
Difference (I-J)
Sig. Mean
Difference (I-J)
Sig. Mean
Difference (I-J)
Sig.
Medium
Small -0,252 0,280 -0,237 0,425
Micro 0,037 0,866 0,289 0,159 0,300 0,287 .5373* 0,040
Z-Score 2012 2013
Medium Small Micro Medium Small Micro
Groups Mean
Difference (I-J)
Sig. Mean
Difference (I-J)
Sig. Mean
Difference (I-J)
Sig. Mean
Difference (I-J)
Sig. Mean
Difference (I-J)
Sig. Mean
Difference (I-J)
Sig.
Medium
Small 0,126 0,697 0,191 0,565
Micro .626139* 0,043 0,500 0,081 0,496 0,116 0,305 0,298
Z-Score 2014
Medium Small Micro
Groups Mean
Difference (I-J)
Sig. Mean
Difference (I-J)
Sig. Mean
Difference (I-J)
Sig.
Medium
Small -0,081 0,824
Micro 0,285 0,412 0,366 0,256

APPENDIX H: Ratio Analysis – Post Hoc Analysis
[H-12]
Section B’: RESULTS BY SIZE (SURVEY’S SAMPLE SMEs)
Examining the sample of the survey the results derived are presented below:
For the Acid test Ratio the Post-Hoc is shown below:
Acid Ratio 2008 2009
Medium Small Micro Medium Small Micro
Groups
Mean
Difference
(I-J)
Sig.
Mean
Difference
(I-J)
Sig.
Mean
Difference
(I-J)
Sig.
Mean
Difference
(I-J)
Sig.
Mean
Difference
(I-J)
Sig.
Mean
Difference
(I-J)
Sig.
Medium
Small -0,154 0,241 -.4517* 0,002
Micro 0,014 0,931 0,168 0,324 -.4435* 0,014 0,008 0,965
Acid Ratio 2010 2011
Medium Small Micro Medium Small Micro
Groups
Mean
Difference
(I-J)
Sig.
Mean
Difference
(I-J)
Sig.
Mean
Difference
(I-J)
Sig.
Mean
Difference
(I-J)
Sig.
Mean
Difference
(I-J)
Sig.
Mean
Difference
(I-J)
Sig.
Medium
Small -0,176 0,123 -0,157 0,325
Micro -.441791* 0,002 -0,266 0,072 -0,309 0,118 -0,152 0,462
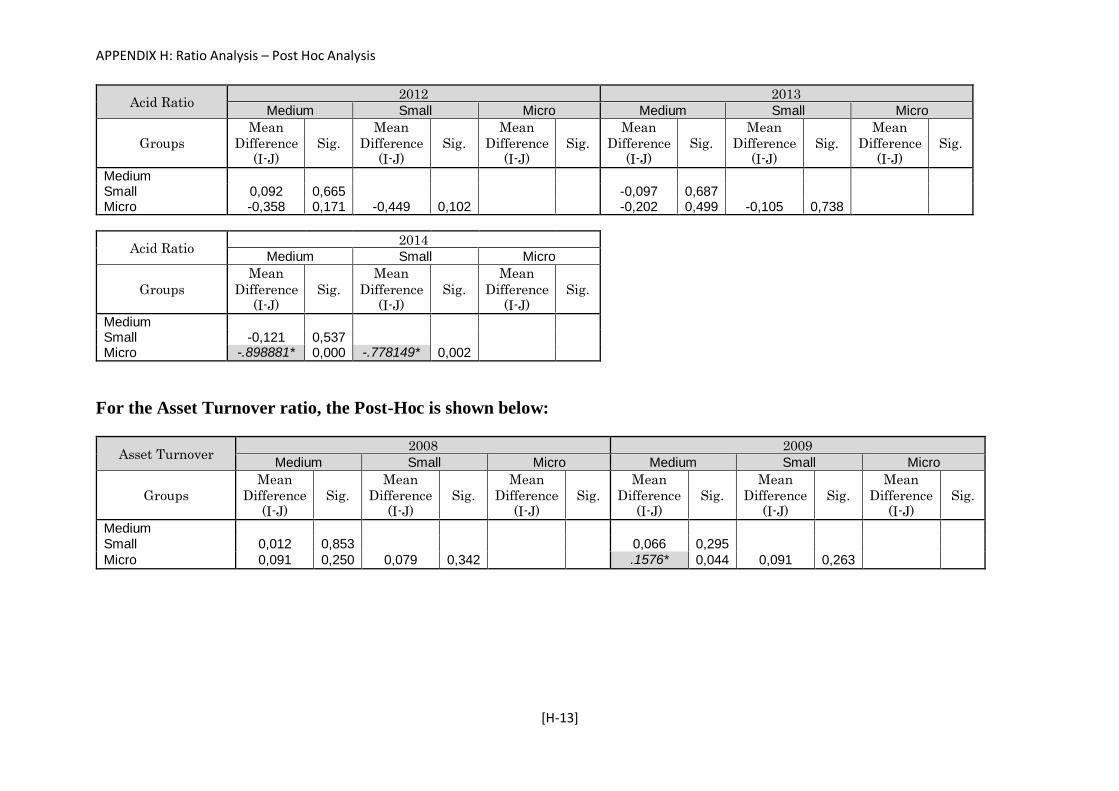
APPENDIX H: Ratio Analysis – Post Hoc Analysis
[H-13]
Acid Ratio 2012 2013
Medium Small Micro Medium Small Micro
Groups
Mean
Difference
(I-J)
Sig.
Mean
Difference
(I-J)
Sig.
Mean
Difference
(I-J)
Sig.
Mean
Difference
(I-J)
Sig.
Mean
Difference
(I-J)
Sig.
Mean
Difference
(I-J)
Sig.
Medium Small 0,092 0,665 -0,097 0,687 Micro -0,358 0,171 -0,449 0,102 -0,202 0,499 -0,105 0,738
Acid Ratio 2014
Medium Small Micro
Groups
Mean
Difference
(I-J)
Sig.
Mean
Difference
(I-J)
Sig.
Mean
Difference
(I-J)
Sig.
Medium
Small -0,121 0,537
Micro -.898881* 0,000 -.778149* 0,002
For the Asset Turnover ratio, the Post-Hoc is shown below:
Asset Turnover 2008 2009
Medium Small Micro Medium Small Micro
Groups
Mean
Difference
(I-J)
Sig.
Mean
Difference
(I-J)
Sig.
Mean
Difference
(I-J)
Sig.
Mean
Difference
(I-J)
Sig.
Mean
Difference
(I-J)
Sig.
Mean
Difference
(I-J)
Sig.
Medium Small 0,012 0,853 0,066 0,295
Micro 0,091 0,250 0,079 0,342 .1576* 0,044 0,091 0,263

APPENDIX H: Ratio Analysis – Post Hoc Analysis
[H-14]
Asset Turnover 2010 2011
Medium Small Micro Medium Small Micro
Groups
Mean
Difference
(I-J)
Sig.
Mean
Difference
(I-J)
Sig.
Mean
Difference
(I-J)
Sig.
Mean
Difference
(I-J)
Sig.
Mean
Difference
(I-J)
Sig.
Mean
Difference
(I-J)
Sig.
Medium
Small -0,015 0,781 0,041 0,495
Micro 0,047 0,495 0,062 0,387 0,096 0,197 0,055 0,481
Asset Turnover 2012 2013
Medium Small Micro Medium Small Micro
Groups
Mean
Difference
(I-J)
Sig.
Mean
Difference
(I-J)
Sig.
Mean
Difference
(I-J)
Sig.
Mean
Difference
(I-J)
Sig.
Mean
Difference
(I-J)
Sig.
Mean
Difference
(I-J)
Sig.
Medium
Small 0,064 0,267 -0,002 0,979
Micro 0,114 0,111 0,050 0,507 0,109 0,130 0,111 0,143
Asset Turnover 2014
Medium Small Micro
Groups
Mean
Difference
(I-J)
Sig.
Mean
Difference
(I-J)
Sig.
Mean
Difference
(I-J)
Sig.
Medium
Small -0,028 0,683
Micro 0,094 0,263 0,122 0,168

APPENDIX H: Ratio Analysis – Post Hoc Analysis
[H-15]
For the Inventory Turnover ratio, the Post-Hoc is shown below:
Inventory
Turnover
2008 2009
Medium Small Micro Medium Small Micro
Groups
Mean
Difference
(I-J)
Sig.
Mean
Difference
(I-J)
Sig.
Mean
Difference
(I-J)
Sig.
Mean
Difference
(I-J)
Sig.
Mean
Difference
(I-J)
Sig.
Mean
Difference
(I-J)
Sig.
Medium
Small -11.4964* 0,000 -22.2892* 0,000
Micro -11.7210* 0,000 -0,225 0,948 -23.7726* 0,001 -1,483 0,842
Inventory
Turnover
2010 2011
Medium Small Micro Medium Small Micro
Groups
Mean
Difference
(I-J)
Sig.
Mean
Difference
(I-J)
Sig.
Mean
Difference
(I-J)
Sig.
Mean
Difference
(I-J)
Sig.
Mean
Difference
(I-J)
Sig.
Mean
Difference
(I-J)
Sig.
Medium
Small -8.663145* 0,000 -11.476000* 0,005
Micro -6.702114* 0,009 1,961 0,462 -9.875606* 0,048 1,600 0,760
Inventory
Turnover
2012 2013
Medium Small Micro Medium Small Micro
Groups
Mean
Difference
(I-J)
Sig.
Mean
Difference
(I-J)
Sig.
Mean
Difference
(I-J)
Sig.
Mean
Difference
(I-J)
Sig.
Mean
Difference
(I-J)
Sig.
Mean
Difference
(I-J)
Sig.
Medium
Small -4,779 0,392 -22.606120* 0,004
Micro -
14.392380* 0,038 -9,614 0,185 -23.271338* 0,016 -0,665 0,947

APPENDIX H: Ratio Analysis – Post Hoc Analysis
[H-16]
Inventory Turnover 2014
Medium Small Micro
Groups
Mean
Difference
(I-J)
Sig.
Mean
Difference
(I-J)
Sig.
Mean
Difference
(I-J)
Sig.
Medium
Small -
13.405049* 0,004
Micro -
17.102775* 0,003 -3,698 0,534
For the Receivable Turnover ratio, the Post-Hoc is shown below:
Receivable
Turnover
2008 2009
Medium Small Micro Medium Small Micro
Groups
Mean
Difference
(I-J)
Sig.
Mean
Difference
(I-J)
Sig.
Mean
Difference
(I-J)
Sig.
Mean
Difference
(I-J)
Sig.
Mean
Difference
(I-J)
Sig.
Mean
Difference
(I-J)
Sig.
Medium Small -0,232 0,440 0,149 0,539 Micro 0,360 0,329 0,592 0,128 .6512* 0,031 0,502 0,112
Receivable
Turnover
2010 2011
Medium Small Micro Medium Small Micro
Groups
Mean
Difference
(I-J)
Sig.
Mean
Difference
(I-J)
Sig.
Mean
Difference
(I-J)
Sig.
Mean
Difference
(I-J)
Sig.
Mean
Difference
(I-J)
Sig.
Mean
Difference
(I-J)
Sig.
Medium Small -0,386 0,079 -0,300 0,227 Micro 0,439 0,105 .825555* 0,004 .642230* 0,037 .942174* 0,004
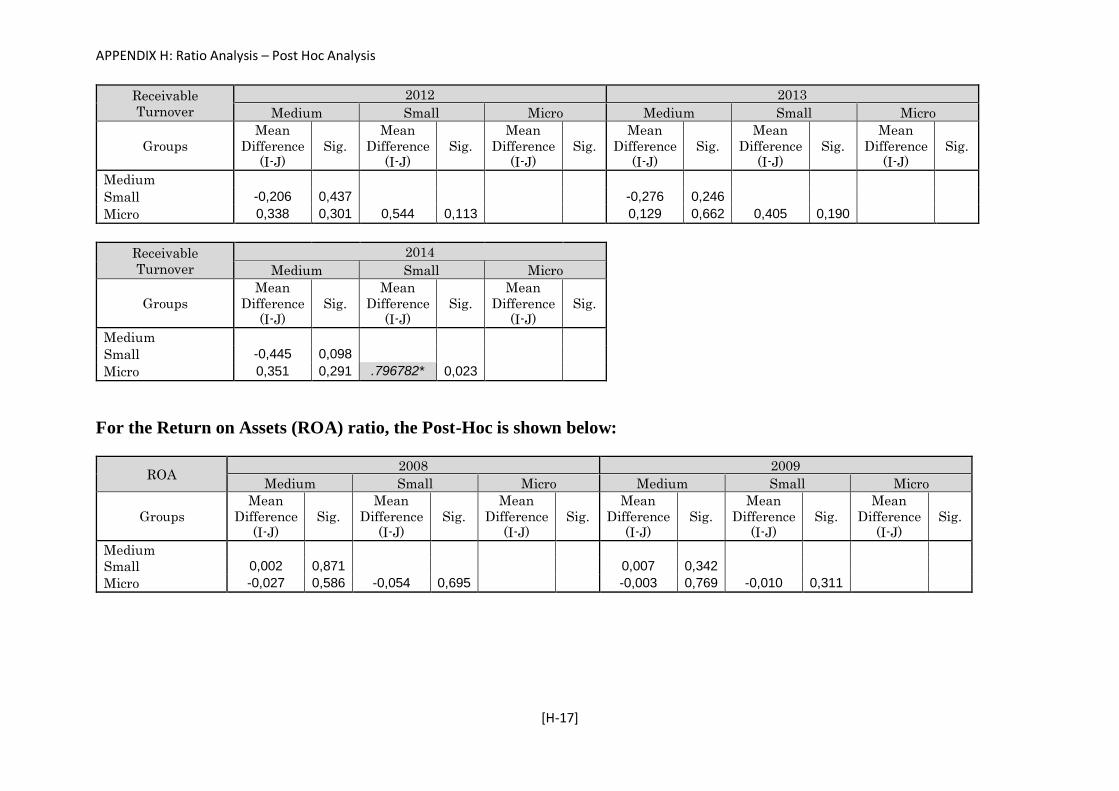
APPENDIX H: Ratio Analysis – Post Hoc Analysis
[H-17]
Receivable
Turnover
2012 2013
Medium Small Micro Medium Small Micro
Groups
Mean
Difference
(I-J)
Sig.
Mean
Difference
(I-J)
Sig.
Mean
Difference
(I-J)
Sig.
Mean
Difference
(I-J)
Sig.
Mean
Difference
(I-J)
Sig.
Mean
Difference
(I-J)
Sig.
Medium
Small -0,206 0,437 -0,276 0,246
Micro 0,338 0,301 0,544 0,113 0,129 0,662 0,405 0,190
Receivable
Turnover
2014
Medium Small Micro
Groups
Mean
Difference
(I-J)
Sig.
Mean
Difference
(I-J)
Sig.
Mean
Difference
(I-J)
Sig.
Medium
Small -0,445 0,098
Micro 0,351 0,291 .796782* 0,023
For the Return on Assets (ROA) ratio, the Post-Hoc is shown below:
ROA 2008 2009
Medium Small Micro Medium Small Micro
Groups
Mean
Difference
(I-J)
Sig.
Mean
Difference
(I-J)
Sig.
Mean
Difference
(I-J)
Sig.
Mean
Difference
(I-J)
Sig.
Mean
Difference
(I-J)
Sig.
Mean
Difference
(I-J)
Sig.
Medium
Small 0,002 0,871 0,007 0,342
Micro -0,027 0,586 -0,054 0,695 -0,003 0,769 -0,010 0,311

APPENDIX H: Ratio Analysis – Post Hoc Analysis
[H-18]
ROA 2010 2011
Medium Small Micro Medium Small Micro
Groups
Mean
Difference
(I-J)
Sig.
Mean
Difference
(I-J)
Sig.
Mean
Difference
(I-J)
Sig.
Mean
Difference
(I-J)
Sig.
Mean
Difference
(I-J)
Sig.
Mean
Difference
(I-J)
Sig.
Medium
Small 0,010 0,145 -0,014 0,059
Micro -0,010 0,267 -.020252* 0,029 -0,005 0,553 0,008 0,373
ROA 2012 2013
Medium Small Micro Medium Small Micro
Groups
Mean
Difference
(I-J)
Sig.
Mean
Difference
(I-J)
Sig.
Mean
Difference
(I-J)
Sig.
Mean
Difference
(I-J)
Sig.
Mean
Difference
(I-J)
Sig.
Mean
Difference
(I-J)
Sig.
Medium
Small -0,009 0,305 -0,011 0,234
Micro -.044710* 0,000 -.035221* 0,003 -.039757* 0,001 -.028450* 0,021
ROA 2014
Medium Small Micro
Groups
Mean
Difference
(I-J)
Sig.
Mean
Difference
(I-J)
Sig.
Mean
Difference
(I-J)
Sig.
Medium Small -0,009 0,387 Micro -.031707* 0,015 -0,023 0,098

APPENDIX H: Ratio Analysis – Post Hoc Analysis
[H-19]
For the Return on Equity (ROE) ratio, the Post-Hoc is shown below:
ROE 2008 2009
Medium Small Micro Medium Small Micro
Groups
Mean
Difference
(I-J)
Sig.
Mean
Difference
(I-J)
Sig.
Mean
Difference
(I-J)
Sig.
Mean
Difference
(I-J)
Sig.
Mean
Difference
(I-J)
Sig.
Mean
Difference
(I-J)
Sig.
Medium
Small -0,469 0,334 0,008 0,639
Micro 0,338 0,422 -0,054 0,132 -0,002 0,911 -0,010 0,639
ROE 2010 2011
Medium Small Micro Medium Small Micro
Groups
Mean
Difference
(I-J)
Sig.
Mean
Difference
(I-J)
Sig.
Mean
Difference
(I-J)
Sig.
Mean
Difference
(I-J)
Sig.
Mean
Difference
(I-J)
Sig.
Mean
Difference
(I-J)
Sig.
Medium
Small 0,014 0,509 0,004 0,860
Micro -0,038 0,151 -0,052 0,061 -0,040 0,110 -0,044 0,097
ROE 2012 2013
Medium Small Micro Medium Small Micro
Groups
Mean
Difference
(I-J)
Sig.
Mean
Difference
(I-J)
Sig.
Mean
Difference
(I-J)
Sig.
Mean
Difference
(I-J)
Sig.
Mean
Difference
(I-J)
Sig.
Mean
Difference
(I-J)
Sig.
Medium
Small -0,008 0,736 -0,006 0,766
Micro -.069587* 0,022 -0,061 0,055 -0,022 0,348 -0,016 0,505

APPENDIX H: Ratio Analysis – Post Hoc Analysis
[H-20]
ROE 2014
Medium Small Micro
Groups
Mean
Difference
(I-J)
Sig.
Mean
Difference
(I-J)
Sig.
Mean
Difference
(I-J)
Sig.
Medium
Small -0,031 0,165
Micro -0,051 0,064 -0,020 0,487
For the Debt to Equity Ratio, the Post-Hoc is shown below:
Debt-to-Equity 2008 2009
Medium Small Micro Medium Small Micro
Groups
Mean
Difference
(I-J)
Sig.
Mean
Difference
(I-J)
Sig.
Mean
Difference
(I-J)
Sig.
Mean
Difference
(I-J)
Sig.
Mean
Difference
(I-J)
Sig.
Mean
Difference
(I-J)
Sig.
Medium
Small -0,195 0,437 0,037 0,861
Micro -0,242 0,432 -0,048 0,883 0,165 0,531 0,128 0,644
Debt-to-Equity 2010 2011
Medium Small Micro Medium Small Micro
Groups
Mean
Difference
(I-J)
Sig.
Mean
Difference
(I-J)
Sig.
Mean
Difference
(I-J)
Sig.
Mean
Difference
(I-J)
Sig.
Mean
Difference
(I-J)
Sig.
Mean
Difference
(I-J)
Sig.
Medium
Small -0,545 0,093 0,110 0,524
Micro -0,772 0,054 -0,227 0,588 0,112 0,602 0,001 0,995

APPENDIX H: Ratio Analysis – Post Hoc Analysis
[H-21]
Debt-to-Equity 2012 2013
Medium Small Micro Medium Small Micro
Groups
Mean
Difference
(I-J)
Sig.
Mean
Difference
(I-J)
Sig.
Mean
Difference
(I-J)
Sig.
Mean
Difference
(I-J)
Sig.
Mean
Difference
(I-J)
Sig.
Mean
Difference
(I-J)
Sig.
Medium
Small 0,125 0,521 -0,293 0,190
Micro 0,374 0,122 0,248 0,327 -0,104 0,707 0,190 0,513
Debt-to-Equity 2014
Medium Small Micro
Groups
Mean
Difference
(I-J)
Sig.
Mean
Difference
(I-J)
Sig.
Mean
Difference
(I-J)
Sig.
Medium
Small -0,197 0,655
Micro -0,771 0,159 -0,573 0,317
For the Altman Z-Score, the Post-Hoc is shown below:
Z-Score 2008 2009
Medium Small Micro Medium Small Micro
Groups
Mean
Difference
(I-J)
Sig.
Mean
Difference
(I-J)
Sig.
Mean
Difference
(I-J)
Sig.
Mean
Difference
(I-J)
Sig.
Mean
Difference
(I-J)
Sig.
Mean
Difference
(I-J)
Sig.
Medium
Small -0,469 0,271 -0,354 0,387
Micro 0,338 0,519 0,807 0,145 -0,105 0,836 0,249 0,639
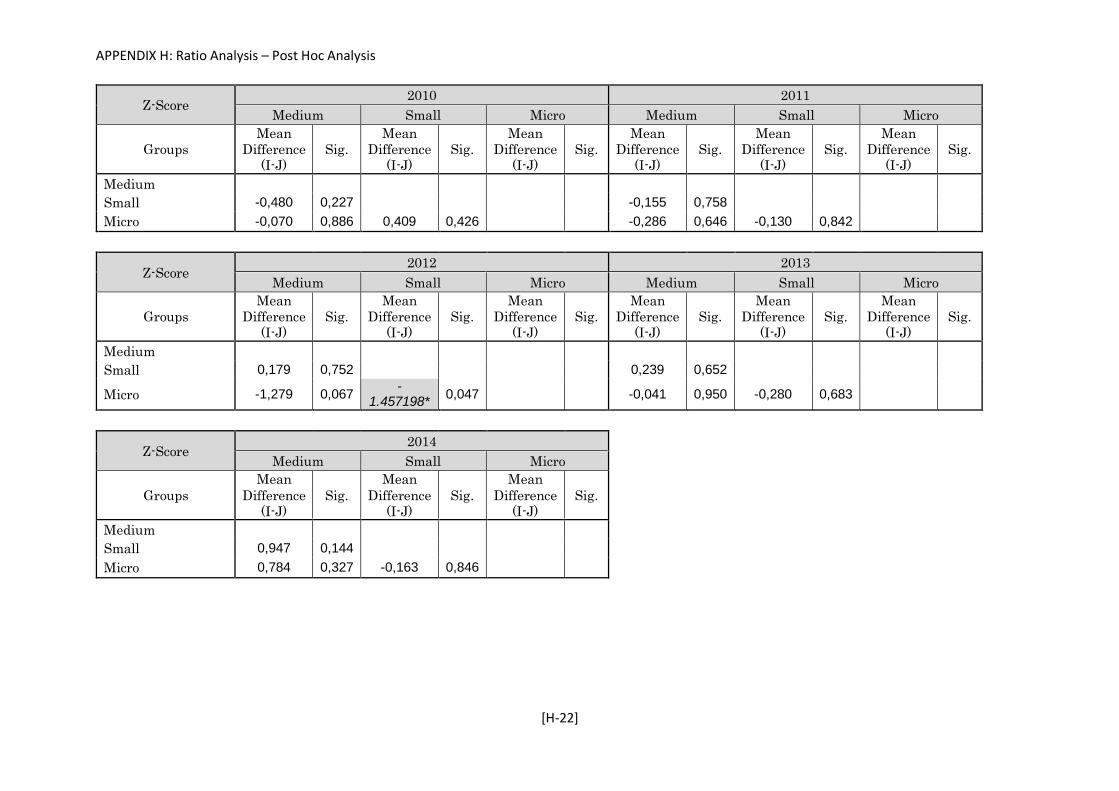
APPENDIX H: Ratio Analysis – Post Hoc Analysis
[H-22]
Z-Score 2010 2011
Medium Small Micro Medium Small Micro
Groups
Mean
Difference
(I-J)
Sig.
Mean
Difference
(I-J)
Sig.
Mean
Difference
(I-J)
Sig.
Mean
Difference
(I-J)
Sig.
Mean
Difference
(I-J)
Sig.
Mean
Difference
(I-J)
Sig.
Medium
Small -0,480 0,227 -0,155 0,758
Micro -0,070 0,886 0,409 0,426 -0,286 0,646 -0,130 0,842
Z-Score 2012 2013
Medium Small Micro Medium Small Micro
Groups
Mean
Difference
(I-J)
Sig.
Mean
Difference
(I-J)
Sig.
Mean
Difference
(I-J)
Sig.
Mean
Difference
(I-J)
Sig.
Mean
Difference
(I-J)
Sig.
Mean
Difference
(I-J)
Sig.
Medium
Small 0,179 0,752 0,239 0,652
Micro -1,279 0,067 -
1.457198* 0,047 -0,041 0,950 -0,280 0,683
Z-Score 2014
Medium Small Micro
Groups
Mean
Difference
(I-J)
Sig.
Mean
Difference
(I-J)
Sig.
Mean
Difference
(I-J)
Sig.
Medium
Small 0,947 0,144
Micro 0,784 0,327 -0,163 0,846
Appendix I’-Variate Statistics
(MANOVA)
Summary: Appendix I’ includes the results derived from the Multi-Variate analysis
(MANOVA) conducted on the financial ratios used from the population and the sample of
the Greek ISO certified SMEs that participated in the survey.

Appendices (Master)
[I-1]
o Section A’: Variance Analysis – Population of
SMEs – Results
Table 1: Pillai's trace test (Population of SMEs) MANOVA
Years Pillai's Trace Sagn. 2008 4.51 0.00 2009 3.68 0.00 2010 0.09 0.00 2011 7.01 0.00 2012 4.26 0.00 2013 5.07 0.00 2014 0.06 0.00
Table 2: Levene's Test Coefficients
Levene's Test 2008 2009 2010
Ratios
F Sign F Sign F Sign
ACID 0.306130 0.736347 4.441349 0.011968 4.157860 0.015859
ASS_TURN 0.344235 0.708830 1.817334 0.162890 2.182991 0.113137
D_E 14.047814 0.000001 1.589374 0.204468 3.650154 0.026267
INV_TURN 66.890056 0.000000 60.485154 0.000000 51.590697 0.000000
REC_TURN 5.370737 0.004759 0.748129 0.473465 13.464438 0.000002
ROA 3.306867 0.036954 2.401637 0.090990 2.303782 0.100307
ROE 1.458206 0.233052 3.683524 0.025409 0.143325 0.866487
Z_SCORE 3.869180 0.021128 0.523208 0.592747 2.531736 0.079931
Table 3: Levene's Test Coefficients
Levene's Test 2011 2012 2013
Ratios
F Sign F Sign F Sign
ACID 6.905884 0.001041 1.869004 0.154711 2.077436 0.125686
ASS_TURN 0.305342 0.736927 7.182561 0.000792 0.108447 0.897235
D_E 2.015019 0.133754 3.385040 0.034189 1.980787 0.138397
INV_TURN 17.125490 0.000000 29.786793 0.000000 20.285638 0.000000
REC_TURN 11.453270 0.000012 3.051009 0.047666 6.228560 0.002034
ROA 0.382314 0.682361 5.108211 0.006175 7.564615 0.000543
ROE 5.704690 0.003418 1.592110 0.203911 15.898425 0.000000
Z_SCORE 0.744573 0.475149 0.526239 0.590955 1.290325 0.275550
Table4: Levene's Test Coefficients
Levene's Test 2014
Ratios
F Sign
ACID 11.739088 0.000009
ASS_TURN 3.374124 0.034563
D_E 0.302638 0.738921
INV_TURN 40.123282 0.000000
REC_TURN 13.821663 0.000001
ROA 0.317293 0.728176
ROE 2.729775 0.065626
Z_SCORE 0.179516 0.835696
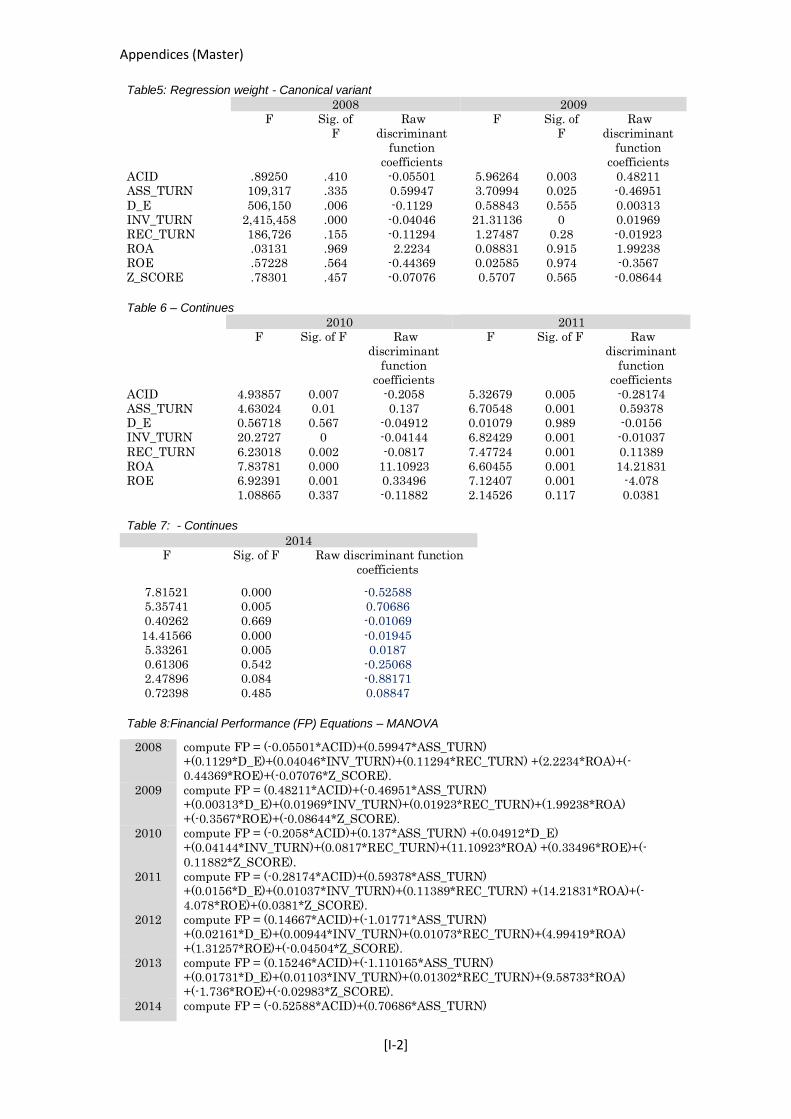
Appendices (Master)
[I-2]
Table5: Regression weight - Canonical variant 2008 2009
F Sig. of
F
Raw
discriminant
function
coefficients
F Sig. of
F
Raw
discriminant
function
coefficients
ACID .89250 .410 -0.05501 5.96264 0.003 0.48211
ASS_TURN 109,317 .335 0.59947 3.70994 0.025 -0.46951
D_E 506,150 .006 -0.1129 0.58843 0.555 0.00313
INV_TURN 2,415,458 .000 -0.04046 21.31136 0 0.01969
REC_TURN 186,726 .155 -0.11294 1.27487 0.28 -0.01923
ROA .03131 .969 2.2234 0.08831 0.915 1.99238
ROE .57228 .564 -0.44369 0.02585 0.974 -0.3567
Z_SCORE .78301 .457 -0.07076 0.5707 0.565 -0.08644
Table 6 – Continues
2010 2011
F Sig. of F Raw
discriminant
function
coefficients
F Sig. of F Raw
discriminant
function
coefficients
ACID 4.93857 0.007 -0.2058 5.32679 0.005 -0.28174
ASS_TURN 4.63024 0.01 0.137 6.70548 0.001 0.59378
D_E 0.56718 0.567 -0.04912 0.01079 0.989 -0.0156
INV_TURN 20.2727 0 -0.04144 6.82429 0.001 -0.01037
REC_TURN 6.23018 0.002 -0.0817 7.47724 0.001 0.11389
ROA 7.83781 0.000 11.10923 6.60455 0.001 14.21831
ROE 6.92391 0.001 0.33496 7.12407 0.001 -4.078
1.08865 0.337 -0.11882 2.14526 0.117 0.0381
Table 7: - Continues
2014
F Sig. of F Raw discriminant function
coefficients
7.81521 0.000 -0.52588
5.35741 0.005 0.70686
0.40262 0.669 -0.01069
14.41566 0.000 -0.01945
5.33261 0.005 0.0187
0.61306 0.542 -0.25068
2.47896 0.084 -0.88171
0.72398 0.485 0.08847
Table 8:Financial Performance (FP) Equations – MANOVA
2008 compute FP = (-0.05501*ACID)+(0.59947*ASS_TURN)
+(0.1129*D_E)+(0.04046*INV_TURN)+(0.11294*REC_TURN) +(2.2234*ROA)+(-
0.44369*ROE)+(-0.07076*Z_SCORE).
2009 compute FP = (0.48211*ACID)+(-0.46951*ASS_TURN)
+(0.00313*D_E)+(0.01969*INV_TURN)+(0.01923*REC_TURN)+(1.99238*ROA)
+(-0.3567*ROE)+(-0.08644*Z_SCORE).
2010 compute FP = (-0.2058*ACID)+(0.137*ASS_TURN) +(0.04912*D_E)
+(0.04144*INV_TURN)+(0.0817*REC_TURN)+(11.10923*ROA) +(0.33496*ROE)+(-
0.11882*Z_SCORE).
2011 compute FP = (-0.28174*ACID)+(0.59378*ASS_TURN)
+(0.0156*D_E)+(0.01037*INV_TURN)+(0.11389*REC_TURN) +(14.21831*ROA)+(-
4.078*ROE)+(0.0381*Z_SCORE).
2012 compute FP = (0.14667*ACID)+(-1.01771*ASS_TURN)
+(0.02161*D_E)+(0.00944*INV_TURN)+(0.01073*REC_TURN)+(4.99419*ROA)
+(1.31257*ROE)+(-0.04504*Z_SCORE).
2013 compute FP = (0.15246*ACID)+(-1.110165*ASS_TURN)
+(0.01731*D_E)+(0.01103*INV_TURN)+(0.01302*REC_TURN)+(9.58733*ROA)
+(-1.736*ROE)+(-0.02983*Z_SCORE).
2014 compute FP = (-0.52588*ACID)+(0.70686*ASS_TURN)

Appendices (Master)
[I-3]
+(-0.01069*D_E)+(-0.01945*INV_TURN)+(0.0187*REC_TURN)
+(-0.25068*ROA)+(-0.88171*ROE)+(0.08847*Z_SCORE).
Table 9: Financial Performance (FP)-Statistical significance
2008 2009 2010 2011 2012 2013 2014
Type III Sum of
Squares 65.9995 55.9501 16.0654 74.0029 61.3450 53.9168 65.2274
F 32.9962 27.9781 8.1248 37.0011 30.6736 26.9537 32.6079
Sig. 0.0000 0.0000 0.0000 0.0000 0.0000 0.0000 0.0000

Appendices (Master)
[I-4]
o Section B’: Variance Analysis –Sample of SMEs -
Results
Table 10: Pillai’s trace test (Survey’s Sample) MANOVA
Pillai's Trace SAGNIFICANCE
2008 2.406743 0.000199
2009 2.660139 0.000031
2010 3.355176 0.000000
2011 2.356509 0.000282
2012 1.991394 0.003336
2013 2.498086 0.000103
2014 2.860155 0.000007
Table 11: Levene's test (Own Sample)
Levene's Test 2008 2009 2010
F Sig F Sig F Sig
ACID 2.224037 0.109567 9.007678 0.000150 1.266948 0.282853
ASS_TURN 0.606292 0.545892 1.509066 0.222408 1.594818 0.204273
D_E 1.635530 0.196207 1.027039 0.359035 4.074246 0.017738
INV_TURN 33.256880 0.000000 28.184376 0.000000 23.033751 0.000000
REC_TURN 1.093088 0.336223 1.621479 0.198939 5.120219 0.006385
ROA 3.203503 0.041710 2.159837 0.116725 1.602697 0.202683
ROE 2.469899 0.085940 1.051275 0.350483 1.372813 0.254621
Z_SCORE 5.262150 0.005566 2.668331 0.070638 2.202890 0.111863
Table 12 – Continues
Levene's Test 2011 2012 2013
F Sig F Sig F Sig
ACID 0.563111 0.569898 1.592035 0.204834 0.095621 0.908830
ASS_TURN 1.607101 0.201796 2.542966 0.079939 4.368766 0.013296
D_E 2.489286 0.084290 5.241694 0.005671 0.024668 0.975635
INV_TURN 10.848951 0.000026 6.381159 0.001876 16.142786 0.000000
REC_TURN 4.284706 0.014434 3.652111 0.026830 3.432659 0.033285
ROA 0.728225 0.483422 3.926478 0.020499 6.207388 0.002220
ROE 0.521142 0.594256 0.792943 0.453241 4.864085 0.008196
Z_SCORE 0.090936 0.913096 0.907979 0.404192 1.348700 0.260792
Table 13 - Continues
Levene's Test 2014
F Sig
ACID 1.651270 0.193148
ASS_TURN 5.136123 0.006286
D_E 1.981718 0.139221
INV_TURN 17.719412 0.000000
REC_TURN 8.827807 0.000178
ROA 2.431384 0.089250
ROE 1.603347 0.202549
Z_SCORE 3.619815 0.027694

Appendices (Master)
[I-5]
Table 14: Regression weight - Canonical variant(Own Sample) 2008 2009
F Sig. of F Raw
discriminant
function
coefficients
F Sig. of F Raw
discriminant
function
coefficients
ACID 0.82245 0.44 0.14804 5.89657 0.003 0.61864
ASS_TURN 0.68742 0.503 -0.03272 2.12083 0.121 -0.25676
D_E 0.45733 0.633 -0.11974 0.19768 0.821 -0.05268
INV_TURN 11.91413 0 -0.04294 9.8859 0 0.01515
REC_TURN 1.16708 0.312 0.03848 2.3545 0.096 -0.1043
ROA 0.14908 0.862 0.75366 0.67119 0.512 -2.53215
ROE 1.19093 0.305 1.33852 0.15258 0.859 0.04684
Z_SCORE 1.19263 0.305 -0.10916 0.3795 0.684 -0.12895
Table 15 – Continues
2010 2011
F Sig. of F Raw
discriminant
function
coefficients
F Sig. of F Raw
discriminant
function
coefficients
ACID 5.06524 0.007 0.57447 1.34261 0.262 0.07697
ASS_TURN 0.38208 0.683 -0.23832 0.8686 0.42 -0.2231
D_E 2.46646 0.086 0.19858 0.25572 0.774 -0.02027
INV_TURN 9.67673 0 0.04217 4.62004 0.01 -0.0016
REC_TURN 4.34902 0.014 -0.06707 4.30884 0.014 -0.2819
ROA 2.54027 0.08 -3.03613 1.79084 0.168 -14.46648
ROE 1.79027 0.168 0.19708 1.58113 0.207 5.86745
Z_SCORE 0.77205 0.463 0.01949 0.11838 0.888 -0.02078
Table 16 – Continues
2012 2013
F Sig. of F Raw
discriminant
function
coefficients
F Sig. of F Raw
discriminant
function
coefficients
ACID 1.40076 0.248 -0.05375 0.24546 0.782 0.09025
ASS_TURN 1.45534 0.235 1.01777 1.32153 0.268 -0.91532
D_E 1.20773 0.3 0.21134 0.86531 0.422 -0.14671
INV_TURN 2.18947 0.113 -0.00811 5.41087 0.005 0.00585
REC_TURN 1.26345 0.284 0.05048 1.07047 0.344 0.02567
ROA 7.71489 0.001 -13.53931 5.74152 0.003 19.36351
ROE 2.74897 0.065 2.38955 0.44257 0.643 -6.94253
Z_SCORE 2.18742 0.114 0.00115 0.12869 0.879 -0.05774
Table 17 - Continues
2014
F Sig. of F Raw discriminant
function coefficients
ACID 7.16883 0.001 -0.43256
ASS_TURN 0.98252 0.375 0.50508
D_E 0.99855 0.369 -0.061
INV_TURN 6.59376 0.002 -0.01157
REC_TURN 2.87087 0.058 0.00819
ROA 2.97436 0.052 -4.30135
ROE 2.04355 0.131 -0.70304
Z_SCORE 1.20301 0.301 0.10293
Table 18: Financial Performance (FP) function - MANOVA (Own Sample)

Appendices (Master)
[I-6]
2008 compute FP = (0.14804*Acid)+(-0.03272*Ass_turn)+(-0.11974*D_e)
+(-0.04294*Inv_Turn)+(0.03848*Rec_Turn)+(0.75366*ROA)+(1.33852*ROE)+(-0.10916*Z_Score).
2009 compute FP = (0.61864*Acid)+(-0.25676*Ass_turn)+(-0.05268*D_e)+(0.01515*Inv_Turn)+(-
0.1043*Rec_Turn)+(-2.53215*ROA)+(0.04684*ROE)
+(-0.12895*Z_Score).
2010 compute extra_variable=(0.57447*Acid)+(-
0.23832*Ass_turn)+(0.19858*D_e)+(0.4217*Inv_Turn)+(0.06707*Rec_Turn)
+(-3.03613*ROA)+(0.19708*ROE)+(0.01949*Z_Score).
2011 compute FP = (0.07697*Acid)+(-0.2231*Ass_turn)+(-0.02027*D_e)
+(-0.0016*Inv_Turn)+(-0.2819*Rec_Turn)+(-14.46648*ROA)+(5.86745*ROE)
+(-0.02078*Z_Score).
2012 compute FP = (-0.05375*Acid)+(1.01777*Ass_turn)+(0.21134*D_e)
+(-0.00811*Inv_Turn)+(0.05048*Rec_Turn)+(-3.53931*ROA)+(2.38955*ROE)
+(0.00115*Z_Score).
2013 compute FP = 0.09025*Acid)+(-0.91532*Ass_turn)
+(-0.14671*D_e)+(0.00585*Inv_Turn)+(0.2567*Rec_Turn)+(19.36351*ROA)
+(-6.94253*ROE)+(-0.05774*Z_Score).
2014 compute FP = 0.43256*Acid)+(0.50508*Ass_turn)+(-0.061*D_e)
+(-0.01157*Inv_Turn)+(0.00819*Rec_Turn)+(-4.30135*ROA)+(-.70304*ROE) +(0.10293*Z_Score).
Table 8: Financial Performance (FP) - Results (Own Sample)
2008 2009 2010 2011 2012 2013 2014
Type III
Sum of
Squares
28.48401818 43.15136369 1338.748534 21.29805158 31.69990564 36.33441563 45.96243217
F 14.23935736 21.57522151 11.3668292 10.64888817 15.85249276 15.29022436 22.98188284
Sig. 0.0000 0.0000 0.0000 0.0000 0.0000 0.0000 0.0000

Appendix J Comparative Analysis
SMEs Transitions
Summary: Appendix J’ includes the results derived from the comparative analysis
conducted on the sample of the Greek ISO certified SMEs that participated in the
survey and their transitions from the ISO level to ISO+ or TQM levels or backwards.

Appendix J’: TQM and Financial Performance (Transfers)
[J-0]
o SME Quality level changes (Transfers)
Micro
SMEs
2009 2010 2011 2012 2013 2014
ISO ISO+ TQM ISO ISO+ TQM ISO ISO+ TQM ISO ISO+ TQM ISO ISO+ TQM ISO ISO+ TQM
ISO 17 2 9
16
ISO+
4
4 6
5
1
TQM 3 4
0 5 10 15 20
ISO+
TQM
ISO+
TQM
ISO+
TQM
ISO+
TQM
ISO+
TQM
ISO+
TQM
2009
2010
2011
2012
2013
20
14
No of Transitions
Yea
rsQ
ual
ity
Leve
l
ISO

Appendix J’: TQM and Financial Performance (Transfers)
[J-1]
0 1 2 3 4 5 6 7
ISO
ISO
ISO
ISO
ISO
ISO
2009
20
10
20
11
2012
2013
2014
Number of Transitions
Ye
ars
Qu
alit
y Le
vel
ISO+

Appendix J’: TQM and Financial Performance (Transfers)
[J-2]
Small
SMEs
2009 2010 2011 2012 2013 2014
ISO ISO+ TQM ISO ISO+ TQM ISO ISO+ TQM ISO ISO+ TQM ISO ISO+ TQM ISO ISO+ TQM
ISO 7 3 1
5
ISO+
4
7 4
1
6
TQM 8 4 3
0 1 2 3 4 5
ISOISO+
ISOISO+
ISOISO+
ISOISO+
ISOISO+
ISOISO+
2009
20
10
2011
2012
2013
2014
Number of Transitions
Ye
ars
Qu
alit
y Le
vel
TQM

Appendix J’: TQM and Financial Performance (Transfers)
[J-3]
0 1 2 3 4 5 6 7 8
ISO+
TQM
ISO+
TQM
ISO+
TQM
ISO+
TQM
ISO+
TQM
ISO+
TQM
2009
2010
20
11
2012
2013
20
14
Number of Transitions
Ye
ars
Qu
alit
y Le
vel
ISO
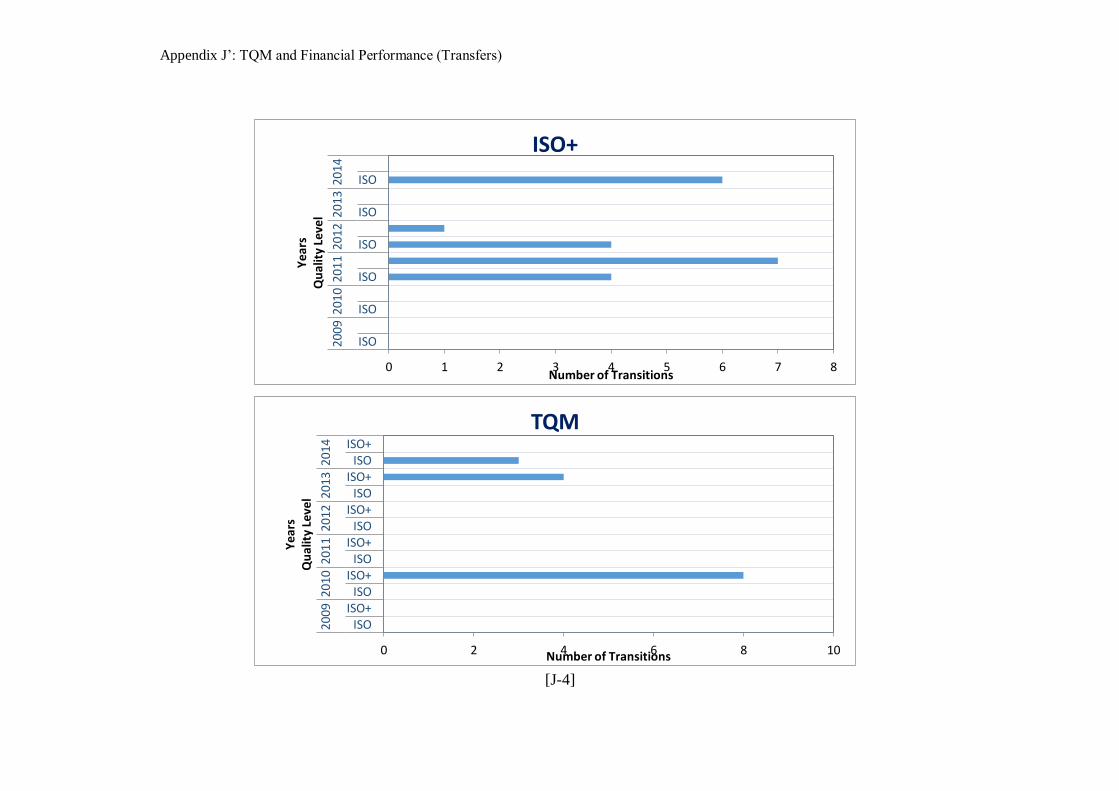
Appendix J’: TQM and Financial Performance (Transfers)
[J-4]
0 1 2 3 4 5 6 7 8
ISO
ISO
ISO
ISO
ISO
ISO
2009
2010
2011
2012
20
13
2014
Number of Transitions
Ye
ars
Qu
alit
y Le
vel
ISO+
0 2 4 6 8 10
ISOISO+
ISOISO+
ISOISO+
ISOISO+
ISOISO+
ISOISO+
2009
2010
2011
2012
2013
2014
Number of Transitions
Yea
rsQ
ual
ity
Leve
l
TQM

Appendix J’: TQM and Financial Performance (Transfers)
[J-5]
Medium 2009 2010 2011 2012 2013 2014
ISO ISO+ TQM ISO ISO+ TQM ISO ISO+ TQM ISO ISO+ TQM ISO ISO+ TQM ISO ISO+ TQM
ISO 5 2 1
11 1
ISO+
7
1
2 8
TQM 2 2 3
0 2 4 6 8 10 12
ISO+TQMISO+TQMISO+TQMISO+TQMISO+TQMISO+TQM
20
09
2010
2011
2012
2013
2014
Number of Transitions
Ye
ars
Qu
alit
y Le
vel
ISO

Appendix J’: TQM and Financial Performance (Transfers)
[J-6]
0 1 2 3 4 5 6 7 8 9
ISO
ISO
ISO
ISO
ISO
ISO
2009
2010
2011
2012
2013
2014
Number of Transitions
Ye
ars
Qu
alit
y Le
vel
ISO+
0 1 1 2 2 3 3 4
ISO
ISO
ISO
ISO
ISO
ISO
2009
2010
2011
20
12
2013
2014
Number of Transitions
Yea
rsQ
ual
ity
Leve
l
TQM

Appendix K Timetable of Political and Financial Events
(Greek Crisis)
Summary: Appendix K’ shows the timetable conducted with all the Political and Financial
events that characterized the Greek Financial Crisis from the year 2008 till 2015.

Appendix K: Timetable of Political and Financial Events (Greek Crisis)
[K-1]
2009PASOK wins
the Greek
legislative
elections
2009PASOK wins
the Greek
legislative
elections
2010
The First, Second
and Third austerity
package are
passed by the
Greek parliament.
2010
The First, Second
and Third austerity
package are
passed by the
Greek parliament.
2011
Fourth & Fifth austerity
package is passed by
the Greek Parliament
Coalition Government is
formed.
2011
Fourth & Fifth austerity
package is passed by
the Greek Parliament
Coalition Government is
formed.
2012 Sixth austerity
package is passed by the Greek Parliament
Elections (MP: A.Samaras)
2012 Sixth austerity
package is passed by the Greek Parliament
Elections (MP: A.Samaras)
2013Reforms are Approved.
2013Reforms are Approved.
2014Due to a non-win
Presidential elections the
Government Falls
2014Due to a non-win
Presidential elections the
Government Falls
2015 Syriza wins the Elections Greek bailout referendum
is held (61%) Three Bailout packages are
approved by the Parliament
2015 Syriza wins the Elections Greek bailout referendum
is held (61%) Three Bailout packages are
approved by the Parliament
2009 Deficit -12.5% of GDP Greece’s Downgrading
from the Big Three(A2)
2009 Deficit -12.5% of GDP Greece’s Downgrading
from the Big Three(A2)
2010 Yield Curve
surpasses the 300 base points
Further Downgrading
2010 Yield Curve
surpasses the 300 base points
Further Downgrading
2011 Further Downgrading ASE below 1000
points
2011 Further Downgrading ASE below 1000
points
PO
LITICA
LFIN
AN
CIA
L2012 Debt Restructuring (83.5%) ASE falls below 500 points
2012 Debt Restructuring (83.5%) ASE falls below 500 points
2013An Upgrade from
Moody’s
2013An Upgrade from
Moody’s
2014 Primary Budget Surplus (1.5%) An Upgrade from Fitch
2014 Primary Budget Surplus (1.5%) An Upgrade from Fitch
2015 Capital Controls are imposed Banks close for a Week ASE Reopens but influenced from
the Chinese Stock market crash
2015 Capital Controls are imposed Banks close for a Week ASE Reopens but influenced from
the Chinese Stock market crash