characteristics and performance of heat and mass flowrate in lpg
TRANSCRIPT

TC,in: inlet temperature of the cold fluid C
Tc,out: outlet temperature of the cold fluidC
U: overall heat transfer coefficient, W/(m2K)
A:area of surface across heat transfer occurs, m2
Cmin :min (CC, CH)
Smaller of the two heat capacity rates (cold and hot) (W/K)
Cmax :max (CC, CH)
– Larger of the two heat capacity rates (cold and hot) (W/K) ɛ :effectiveness
Liquefied Petroleum Gas (LPG), also known as propane, is a non-renewable gaseous fossil fuel. LPG, a
by-product of natural gas processing and oil refining, includes various mixtures of hydrocarbons. The
term liquefied petroleum gas (LPG) describes hydrocarbon mixtures in which the main components
International Journal of Advanced Scientific and Technical Research Issue 6 volume 2, March. –April. 2016
Available online on http://www.rspublication.com/ijst/index.html ISSN 2249-9954__________________________
©2016 RS Publication, [email protected] Page 148
_________________________
1. Introduction
Abstract
Liquefied Petroleum Gas (LPG) is a common fuel in several sectors. It is a mixture of variable content,
but it is primarily comprised of propane and butane. Like natural gas, LPG combustion can be
considered lower emissions combustion. The present work aimed to study the heat and mass transfer of
LPG recovery unit located in Alexandria Petroleum Company (APC). The study focused on the
characteristics and performance of one of the main counter flow shell and tube heat exchangers in the
LPG plant by studying the effect of changing the feed mass flow rate and the effect of changing inlet
pressure on the effectiveness, Number of transfer unit, performance and pressure drop in shell side and
tube side. The distillation column and the auxiliary heat exchangers were simulated by HYSYS
program. By using NTU method, the simulation results showed that increasing the load of the heat
exchanger will reduce the effectiveness and number of transfer unit of the heat exchanger. On the other
hand, it will increase the performance of the heat exchanger and the pressure drop in shell side and tube
side.
KEYWORDS: LPG, Shell and tube heat exchanger, HYSYS; effectiveness, NTU method.
Nomenclature
m : Mass flow rate of fluid, kg/s
Cp:specific heat of fluid, J/ (kgK)
T: temperature, C
iinlet o outlet
TH,in: inlet temperature of the hot fluid C
TH,out: outlet temperature of the hot fluid C
Characteristics and performance of heat and mass flowrate in LPG
recovery unit
Mohamed A. Kishk, Mohamed Elhelw, Abd ElHamid Attia
IJST
are propane, butane, Iso-butane, propene, and butenes (butylenes). Most commonly this term is
applied to mixtures of propane and butane. These components and mixtures thereof are gaseous at
normal temperature and pressure but can be liquefied by cooling, compression, or a combination of both
processes.
LPG is a low-carbon-emitting hydrocarbon fuel available in rural areas. Being a mixture of
propane and butane, LPG emits less carbon per joule than pure butane but more carbon per joule than
pure propane. As a low carbon and low-polluting fossil fuel, LPG is recognized by governments around
the world for its contribution in improving the indoor air quality and reduced greenhouse emissions.
LPG is widely available and can be used in various applications. It is also used alongside
renewable technologies in decentralized electricity generation to help in reducing carbon emissions on a
local level.
It can be produced in LPG unit by introducing light hydrocarbons (C1–C5) into different streams
obtained from atmospheric crude distillation, plat former, hydro cracker, and other catalytic processing
units. It is also produced in gas fractionation units charged by associated gas from oil reservoirs or gas
from gas reservoirs. However, any economically LPG stream must be routed to the LPG recovery unit.
The composition of LPG varies significantly, and is influenced by several factors. Globally,
approximately 60% of LPG comes from processing so-called conventional natural gas (Mustovic ,
2011). The remainder is mainly produced during the refining of crude oil.
LPG primarily contains paraffins when sourced from natural gas. These include propane and the
butanes, as well as smaller amounts of ethane and longer chain paraffins. LPG produced during oil
refining can also contain olefins, particularly propylene (propene) and the butylenes (butenes), which
originate from various processes. These olefins are sometimes separated and used as feedstocks for other
processes (Gary et al., 2007). However, due to the similar volatilities of propane , propylene, butanes
and butylenes, the separation of these constituents are relatively costly and often not undertaken
(Sadeghbeigi, 2012; Lamia et al., 2007; Rege and Yang, 2002). As a result, refinery-sourced LPG can
have significant olefin content, with up to 30% by volume reasonably common.
The production of gasoline also influences LPG’s butane content. The economic value of Iso-butane is
usually higher as an alkylation feedstock (Gary et al., 2007). This process produces a very desirable
gasoline blending stock. Therefore, generally only surplus amounts Iso-butane are directed into LPG
production streams. Similarly, N-butane can be blended directly into gasoline as a low-cost octane
improver, or to regulate the vapor pressure of the gasoline pool. The availability of N-butane for LPG
can therefore vary due to the seasonally and geographically varying Reid Vapor Pressure (RVP)
requirements for gasoline.
Given these different sources and processing methods, the composition of LPG is highly
variable. Whilst LPG content varies significantly across the globe, it is primarily a mixture of four
species: propane, propylene, iso-butane and n-butane. Whilst the ethane content can be up to 10 (% vol)
in some markets, it is a less significant component overall. The butylene content in LPG also appears to
be less significant, but is not widely reported.
Variations in the composition of LPG have a significant effect on its knock characteristics
(Falkiner, 2003). However, LPG fuel standards usually do not define compositional limits. Instead,
restrictions on a number of the fuel properties are generally specified. European automotive-grade LPG,
for example, must comply with the requirements of the EN 589 standard (European Committee for
Standardization, 2008). This standard specifies a minimum Motor octane number (MON) of 89.0, and a
minimum fuel vapor pressure that varies between 275 kPa and 950 kPa throughout the year, to account
for seasonal variations. The latter requirement is set at a national level, and therefore may still vary from
region to region during a given period.
International Journal of Advanced Scientific and Technical Research Issue 6 volume 2, March. –April. 2016
Available online on http://www.rspublication.com/ijst/index.html ISSN 2249-9954__________________________
©2016 RS Publication, [email protected] Page 149
_________________________
IJST

Hosseini et al. (2007) obtained Experimentally the heat transfer coefficient and pressure drop on the
shell side of a shell-and-tube heat exchanger for three different types of copper tubes (smooth,
corrugated and with micro-fins). Also, experimental data has been compared with theoretical data
available. Additionally Xie et al. (2007) Carried out an experimental system for investigation on
performance of shell-and-tube heat exchangers, and limited experimental data is obtained. Further
more José et al. 2009 Presented an approach based on genetic algorithms for optimum design of
shell and tube heat exchanger and for optimization major geometric parameters.
In the study of Hong et al.(2009) he found that effectiveness-NTU approach is adopted to predict
the thermodynamic behavior of the heat exchanger for the Joule-Thomson refrigerator. The study
showed the influences of mass flow rate and the supply pressure on the effectiveness of heat exchanger.
Also Patel et al. (2010) Explores the use of a no traditional optimization technique; called particles
warm optimization (PSO), for design optimization of shell-and-tube heat exchangers from
economic view point. Murugesan et al.(2012) studied the Effect of Mass Flow Rate on the Enhanced
Heat Transfer Characteristics in A Corrugated Plate Type Heat Exchanger. Also Asadi et al (2013)
studied Effects of mass flow rate in terms of pressure drop and heat transfer characteristics in a plate-fin
heat exchanger with Wavy fin. Finally Kulkarni et al.(2014) analyzed the heat transfer coefficient and
pressure drops in shell and tube heat exchangers for different mass flow rates and inlet and outlet
temperatures, using Kern, Bell and Bell Del aware methods.
Accordingly, Increase LPG production process efficiency is an important issue to be considered.
International Journal of Advanced Scientific and Technical Research Issue 6 volume 2, March. –April. 2016
Available online on http://www.rspublication.com/ijst/index.html ISSN 2249-9954__________________________
©2016 RS Publication, [email protected] Page 150
_________________________
This can be done by improving the efficiency of the heat exchangers and studying the factors affecting
the performance of the heat exchangers. Therefore, the present work aimed to study the heat and mass
transfer of an LPG recovery unit located in Alexandria Petroleum Company (APC) in Egypt. The study
focused on the characteristics and performance of one of the main counter flow shell and tube heat
exchangers in the LPG plant by studying the effect of changing the feed mass flow rate (unit load) and
the effect of changing inlet pressure on the effectiveness, Number of transfer unit, performance and
pressure drop in shell side and tube side.
2 Process description and modeling
The objective of the process shown in Fig. 1 is to recover LPG, with a fixed mass fraction of
methane, from the feed crude oil whose characteristics are shown in Table 1. As shown in the simulation
process flow diagram in Fig 1. simulated in Aspen Hysys software, the operation in the process is done
by preheating the crude oil in a preheat heat exchanger (E315) from 47°C to 102 °C and then is directed
to the fired heater (E316) to be heated to 143°C before flowing to main fractionation tower (C306). The
stream produced from the bottom of the tower (STAB. NAPHTA), is directed to heat exchanger E315 to
take the advantage of its high temperature (288.8°C) in order to heat the feed crude oil reaching a
temperature of 188 °C and then further cooled by the water cooler W319 to 47°C before being sent as a
second product from the process (Naphta pro.). On the other hand, the liquefied petroleum gas exits
from the top of the tower C306 with temperature 134°C and passes by Air cooler for being cooled to
70°C. After that the flow is further cooled by water coolers through two branches towards vessel. The
first branch includes two water coolers (W318A and W318B), and the second branch includes four heat
exchangers (W322A, W322B, W322C and W322D). In the vessel (V-101), the stream after being cooled
in water coolers to 38°C is separated into vapor (To dry vessel) and liquid (Stream 15). Stream 15 is
then branched to reflux stream (Back to tower) and LPG stream which is the main product. Pressure
IJST

drop in heat exchangers and distillation column is neglected for simplicity. The characteristics of the
products are illustrated in Table 1.
Figure 1 Principal process flow diagram for the studied LPG process.
Table 1 Feed crude oil, LPGD product and Naphtha product streams.
Feed crude
oil
LPG
product
Naphtha
product
Main properties
Pressure [Kpa] 1600 1373 1389
Temperature [°C] 47 38 47
Molar flow [Ton/h] 25 13.9 11.1
Composition [mass fraction]
Methane 0.0010 0.0066 0
Ethane 0.0027 0.0094 0
Propane 0.0684 0.1632 0
i-butane 0.0948 0.1716 0
n-butane 0.3335 0.6036 0
i-Pentane 0 0 0
n-Pentane 0 0 0
n-Hexane 0 0 0
C5+ 0.4996 0.0457 1
H2O 0 0 0
International Journal of Advanced Scientific and Technical Research Issue 6 volume 2, March. –April. 2016
Available online on http://www.rspublication.com/ijst/index.html ISSN 2249-9954__________________________
©2016 RS Publication, [email protected] Page 151
_________________________
IJST

2.2 Case study
The Hysys simulation was applied to predict the thermodynamic behavior of the heat exchanger
E315. The study shows the effect of changing mass flow rate under different feed inlet pressure keeping
the design dimensions constant on the heat exchanger performance, shell side pressure drop, tube side
pressure drop, Effectiveness and NTU. The heat exchanger specifications are illustrated in Table 2. In
this study, the inlet heat exchanger mass flow rate is changed from 10000 Kg/h to 25,000 Kg/h at
different inlet pressure ranged from 14to22 bar.
Table 2 Specifications of the studied heat exchanger E315.
Specifications
Tag number E315
Flow rate [Ton/h] 25000
Heat duty [kW] 940
Area [m2] 40
Tube side
No. of tubes 88
Length [mm] 6000
Inlet temperature [°C] 47
Outlet temperature [°C] 102
Pressure [kPa] 1600
Pressure loss (0) neglected
Shell side
Inner diameter (mm) 484
Inlet temperature [°C] 289
Outlet temperature [°C] 188
Pressure [kPa] 1389
Pressure loss (0) neglected
The (NTU) method is developed to simplify a number of heat exchanger design problems. The
heat exchanger effectiveness is defined as the ratio of the actual heat transfer rate to the maximum
possible heat transfer rate if there were infinite surface area. The heat exchanger effectiveness depends
upon whether the hot fluid or cold fluid is the minimum fluid, that has the smaller capacity coefficient C
= m˚ Cp. If the cold fluid is the minimum fluid then the effectiveness is defined as:
ɛ = 𝐶𝑚𝑎𝑥(𝑇𝐻,𝑖𝑛−𝑇𝐻,𝑜𝑢𝑡)
𝐶𝑚𝑖𝑛(𝑇𝐻,𝑖𝑛−𝑇𝐶,𝑖𝑛) (1)
Otherwise, if the hot fluid is the minimum fluid, then the effectiveness is defined as:
International Journal of Advanced Scientific and Technical Research Issue 6 volume 2, March. –April. 2016
Available online on http://www.rspublication.com/ijst/index.html ISSN 2249-9954__________________________
©2016 RS Publication, [email protected] Page 152
_________________________
IJST
ɛ = 𝐶𝑚𝑎𝑥(𝑇𝐶,𝑜𝑢𝑡−𝑇𝐶,𝑖𝑛)
𝐶𝑚𝑖𝑛(𝑇𝐻,𝑖𝑛−𝑇𝐶,𝑖𝑛) (2)
So the heat transfer rate as:
𝑄 = ɛ𝐶𝑚𝑖𝑛(𝑇𝐻,𝑖𝑛 − 𝑇𝐶,𝑖𝑛) (3)
Also the value of NTU is defined as:
𝑵𝑻𝑼 = 𝐔𝐀
𝑪𝒎𝒊𝒏 (4)
It is a simple matter to solve a heat exchanger problem when
ɛ = ƒ (𝑁𝑇𝑈, 𝐶𝑟) (5)
Where
𝐶𝑟 =𝐶𝑚𝑖𝑛
𝐶𝑚𝑎𝑥 (6)
Numerous expressions have been obtained which relate the heat exchanger effectiveness to the
number of transfer units. The hand-out summarizes a number of these solutions and the special cases
which may be derived from them. For convenience the ɛ − NTU relationships are given for a simple
double pipe heat exchanger for parallel flow which is the direction considered in the studied heat
exchanger E315. The equations for parallel flow can be seen as follows:
ɛ =1−exp⦋−NTU(1+𝐶𝑟)⦌
1+𝐶𝑟 (7)
Or
NTU =−ln⦋1−ɛ(1+𝐶𝑟)⦌
1+𝐶𝑟 (8)
Fig. 2 shows the variation of the effectiveness of the heat exchanger (E315) with different mass flow
rates at different inlet pressures. It is noted that the effectiveness of the heat exchanger decreases as the
International Journal of Advanced Scientific and Technical Research Issue 6 volume 2, March. –April. 2016
Available online on http://www.rspublication.com/ijst/index.html ISSN 2249-9954__________________________
©2016 RS Publication, [email protected] Page 153
_________________________
3. Results and discussion
The simulation results of the case study performed on the heat exchanger E315 is discussed in this
section. Five parameters are studied for the heat exchanger. They are effectiveness, Number of transfer
unit, heat exchanger performance and pressure drop in shell side and tube side with respect to changing
the feed mass flowrate.
3.1 Effectiveness
IJST
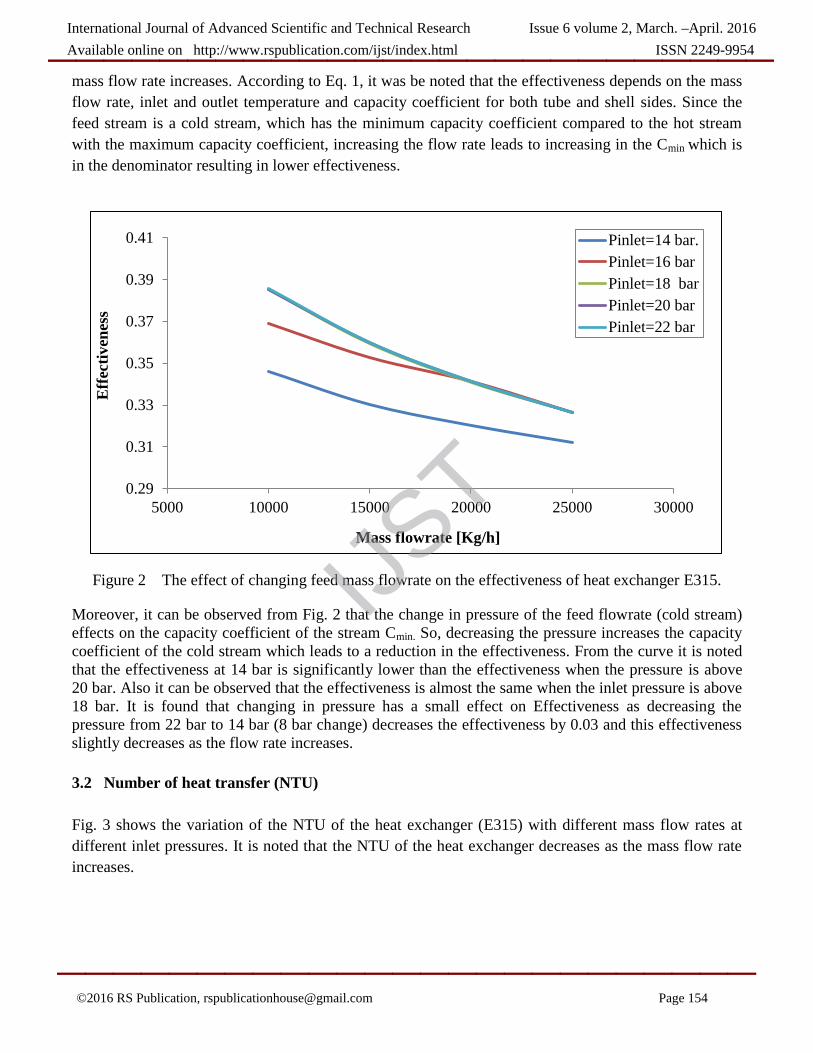
mass flow rate increases. According to Eq. 1, it was be noted that the effectiveness depends on the mass
flow rate, inlet and outlet temperature and capacity coefficient for both tube and shell sides. Since the
feed stream is a cold stream, which has the minimum capacity coefficient compared to the hot stream
with the maximum capacity coefficient, increasing the flow rate leads to increasing in the Cmin which is
in the denominator resulting in lower effectiveness.
Figure 2 The effect of changing feed mass flowrate on the effectiveness of heat exchanger E315.
Moreover, it can be observed from Fig. 2 that the change in pressure of the feed flowrate (cold stream)
effects on the capacity coefficient of the stream Cmin. So, decreasing the pressure increases the capacity
coefficient of the cold stream which leads to a reduction in the effectiveness. From the curve it is noted
that the effectiveness at 14 bar is significantly lower than the effectiveness when the pressure is above
20 bar. Also it can be observed that the effectiveness is almost the same when the inlet pressure is above
18 bar. It is found that changing in pressure has a small effect on Effectiveness as decreasing the
pressure from 22 bar to 14 bar (8 bar change) decreases the effectiveness by 0.03 and this effectiveness
slightly decreases as the flow rate increases.
3.2 Number of heat transfer (NTU)
Fig. 3 shows the variation of the NTU of the heat exchanger (E315) with different mass flow rates at
different inlet pressures. It is noted that the NTU of the heat exchanger decreases as the mass flow rate
increases.
0.29
0.31
0.33
0.35
0.37
0.39
0.41
5000 10000 15000 20000 25000 30000
Eff
ecti
ven
ess
Mass flowrate [Kg/h]
Pinlet=14 bar.
Pinlet=16 bar
Pinlet=18 bar
Pinlet=20 bar
Pinlet=22 bar
International Journal of Advanced Scientific and Technical Research Issue 6 volume 2, March. –April. 2016
Available online on http://www.rspublication.com/ijst/index.html ISSN 2249-9954__________________________
©2016 RS Publication, [email protected] Page 154
_________________________
IJST

Figure 3 The effect of changing feed mass flowrate on the NTU of heat exchanger E315.
According to Eq. 8, it is notified that the NTU depends on the mass flow rate, inlet and outlet
temperature and capacity coefficient for both tube and shell sides. Since there is a proportional
relationship between the effectiveness and NTU, and increasing the mass flow rate from the previous
study raises the effectiveness which leads to an increase in the NTU as well. Fig. 3 has been plotted
according to Eq. 8 as Cr <1 (Cmin/Cmax <1). The equation shows that NTU depends on the effectiveness
and the ratio between the minimum capacity coefficient and maximum capacity coefficient
(Cr=Cmin/Cmax). Also it can be observed that the change in pressure of the feed flow rate (cold stream)
effects on the capacity coefficient of the stream Cmin so that, decreasing the pressure increases the
capacity coefficient of the cold stream which leads to a reduction in the NTU.
3.3 Performance of heat exchanger (UA)
Fig. 4 shows the variation of the performance of the heat exchanger with respect to feed mass flow rate
at different inlet pressures. The Performance of the heat exchanger (UA) increases as the mass flow rate
the heat exchanger increases. As the mass flow rate increases, it leads to increase the area of the heat
transfer of the heat exchanger.
0.4
0.45
0.5
0.55
0.6
5000 10000 15000 20000 25000 30000
NT
U
Mass flow rate [Kg/h]
Pinlet=14 bar
Pinlet=16 bar
Pinlet=18 bar
Pinlet=20 bar
Pinlet=22 bar
International Journal of Advanced Scientific and Technical Research Issue 6 volume 2, March. –April. 2016
Available online on http://www.rspublication.com/ijst/index.html ISSN 2249-9954__________________________
©2016 RS Publication, [email protected] Page 155
_________________________
IJST

Figure 4 The effect of changing feed mass flowrate on the the performance (UA) of heat exchanger
E315.
3.4 Pressure drop in shell side
Fig. 4 shows the variation of pressure drop in shell side of the heat exchanger with changing in the feed
mass flow rate at different inlet pressures. It is obvious that the pressure drop increases as the mass flow
rate increases.as the mass flow rate increases in the heat exchanger, the friction losses also increases
which leads to higher friction losses. It is notified that while operating the study at range of pressure
from 14 bar to 22 bar, there is no change in pressure drop detected.
1000
6000
11000
16000
21000
26000
5000 10000 15000 20000 25000 30000
Cooli
ng c
ap
aci
ty [
kJ/h
]
Mass flow rate [Kg/h]
Pinlet=14 bar
Pinlet=16 bar
Pinlet=18 bar
Pinlet=20 bar
Pinlet =22 bar
International Journal of Advanced Scientific and Technical Research Issue 6 volume 2, March. –April. 2016
Available online on http://www.rspublication.com/ijst/index.html ISSN 2249-9954__________________________
©2016 RS Publication, [email protected] Page 156
_________________________
IJST

Figure 5 The effect of changing feed mass flowrate on the pressure drop in shell side of heat
exchanger E315.
3.5 Pressure drop in tube side
Fig. 6 shows the variation of pressure drop in tube side of the heat exchanger with changing in the feed
mass flow rate. It is obvious that the pressure drop increases as the mass flow rate increases.as the mass
flow rate increases in the heat exchanger, the friction losses also increases which leads to higher friction
losses. It is notified that while operating the study at range of pressure from 14 bar to 22 bar, there is a
slight change in comparison with shell side so, changing in inlet pressure effects on pressure drop in
tube side.
0
0.02
0.04
0.06
0.08
0.1
0.12
0.14
0.16
0.18
5000 10000 15000 20000 25000 30000
Pre
ssu
re d
rop
in
sh
ell
sid
e [k
pa]
Mass flow rate [Kg/h]
Pinlet=14 bar
Pinlet=16 bar
Pinlet=18 bar
Pinlet=20 bar
Pinlet=22 bar
International Journal of Advanced Scientific and Technical Research Issue 6 volume 2, March. –April. 2016
Available online on http://www.rspublication.com/ijst/index.html ISSN 2249-9954__________________________
©2016 RS Publication, [email protected] Page 157
_________________________
IJST

Figure 6 The effect of changing feed mass flowrate on the pressure drop in tube side of heat exchanger
E315.
The purpose of this thesis is to study the effect of changing the feed mass flow rate on
atmospheric distillation unit at Alexandria Petroleum Company (A.P.C) with the aid of Aspen Hysys
software to simulate the process of LPG Production. In addition, the heat exchanger (E315) has been
selected to study its performance and characteristics: effectiveness, number of transfer unit, performance
of the heat exchanger and pressure drop in shell side and tube side. The results show that increasing the
mass flow rate (unit load) entering the heat exchanger (E315) decreases the effectiveness(ɛ) and number
of transfer unit (NTU) of the heat exchanger while it increases the performance of the heat exchanger
(UA),and the pressure loss in both shell side and tube side.
0
0.5
1
1.5
2
2.5
3
3.5
4
5000 10000 15000 20000 25000 30000
Pre
ssu
re d
rop
in
sid
e tu
bes
[K
pa]
Mass flow rate [kg/h]
Pinlet =14 bar
Pinlet=16 bar
Pinlet=18 bar
Pinlet=20 bar
Pinlet = 22 bar
International Journal of Advanced Scientific and Technical Research Issue 6 volume 2, March. –April. 2016
Available online on http://www.rspublication.com/ijst/index.html ISSN 2249-9954__________________________
©2016 RS Publication, [email protected] Page 158
_________________________
4. CONCLUSION
IJST

1. Horst Baur,ed(1996).Automotive handbook (4th
ed.) Stuttgart : Robert Bosch Gmbh.
ISBN0837603331.
2. F. MUSTOVIC. AUTOGAS PROPULSION SYSTEMS FOR AUTOMOBILES. IBC ENGINEERING AND
PUBLISHING,SARAJEVO, BOSNIA AND HERZEGOVINA, 2011. ISBN 978-9958-9173-2-5.
3. J.H. GARY, G.E. HANDWERK, AND M.J. KAISER. PETROLEUM REFINING. CRC PRESS, BOCA
RATON, FL,FIFTH EDITION, 2007. ISBN 0-8493-7038-8
4. R. SADEGHBEIGI. FLUID CATALYTIC CRACKING HANDBOOK. BUTTERWORTH-HEINEMANN, THIRD
EDITION,2012. ISBN 978-0-12-386965-4. OXFORD, UK.
5. V.K. PATEL, R.V. RAO, “DESIGN OPTIMIZATION OF SHELL AND TUBE HEAT EXCHANGER USING
PARTICLE SWARM OPTIMIZATION TECHNIQUE”, APPLIED THERMAL ENGINEERING 30 (2010) 1417-
1425.
6. R. HOSSEINI, A. HOSSEINI-GHAFFAR, M. SOLTANI, “EXPERIMENTAL DETERMINATION OF
SHELL SIDE HEAT TRANSFER COEFFICIENT AND PRESSURE DROP FOR AN OIL COOLER SHELL
AND TUBE HEAT EXCHANGER WITH THREE DIFFERENT TUBE BUNDLES”, APPLIED THERMAL
ENGINEERING 27 (2007) 1001–1008.
7. G.N. XIE, Q.W. WANG , M. ZENG, L.Q. LUO, “HEAT TRANSFER ANALYSIS FOR SHELL AND TUBE
HEAT EXCHANGER WITH EXPERIMENTAL DATA BY ARTIFICIAL NEURAL NETWORKS APPROACH”,
APPLIED THERMAL ENGINEERING 27 (2007) 1096–1104.
8. JOSÉ M. PONCE-ORTEGA, MEDARDO SERNA-GONZÁLEZ, ARTURO JIMÉNEZ-GUTIÉRREZ, “USE
OF GENETIC ALGORITHMS FOR THE OPTIMAL DESIGN OF SHELL AND TUBE HEAT EXCHANGER”,
APPLIED THERMAL ENGINEERING 29 (2009) 203–209.
9. R.J. FALKINER. LIQUEFIED PETROLEUM GAS. IN: FUELS AND LUBRICANTS HANDBOOK, PAGES 31–
59. ASTMINTERNATIONAL, WEST CONSHOHOCKEN, PA, 2003. ISBN 9780803120969.
10. MURUGESAN M.P. AND BALASUBRAMANIAN R., “THE EFFECT OF MASS FLOW RATE ON THE
ENHANCED HEAT TRANSFER CHARACTRISTICS IN A CORRUGATED PLATE TYPE HEAT
EXCHANGER” ,RESEARCH JOURNAL OF ENGINEERING SCIENCES ISSN 2278 – 9472 VOL. 1(6), 22-
26, DECEMBER (2012).
11. YONG-JU HONG, SEONG-JE PARK, AND YOUNG-DON CHOI,CRYCOOLERS 15,EDITED BY S.D.
MILLER AND R.G ROSS JR,INTERNATIONAL CRYOCOOLER CONFERENCE,INC BOULDER,CO, 2009.
12. SHWETA Y KULKARNI , JAGADISH S B, MANJUNATH M B, “ANALYSIS COMPARING
PERFORMANCE OF A CONVENTIONAL SHELL AND TUBE HEAT EXCHANGER USING
KERN, BELL AND BELL DE LAWARE METHOD”, IJRET: INTERNATIONAL JOURNAL OF
RESEARCH IN ENGINEERING AND TECHNOLOGY EISSN: 2319-1163 | PISSN: 2321-7308
International Journal of Advanced Scientific and Technical Research Issue 6 volume 2, March. –April. 2016
Available online on http://www.rspublication.com/ijst/index.html ISSN 2249-9954__________________________
©2016 RS Publication, [email protected] Page 159
_________________________
References
IJST