characteristics of porperties and landlords
TRANSCRIPT
Center on Urban Poverty and Community Development
Characteristics of Rental Properties and Landlords
in Cleveland:
Implications for Achieving Lead Safe Rental Housing
Claudia Coulton, April Urban, Francisca García-Cobián Richter, Michael Henderson, Michael Schramm,
Jeesoo Jeon, & Robert Fischer
Summary: By the time they enter kindergarten, it is estimated that 25% of Cleveland children have
at least one test showing an elevated blood lead level. To address this high rate of lead poisoning at
its source, Cleveland has committed to a lead safe housing strategy. The majority of families with
young children in Cleveland rent homes in the private rental market, making these properties and
their owners key elements in moving forward on a lead safe agenda. This report identifies the
universe of properties that make up this rental stock and profiles their ownership status, physical and
financial conditions. Single family and two family structures make up a preponderance of the existing
rental stock in Cleveland and many of these properties are vulnerable due to age, low values, and
signs of disrepair. Property owners are classified into types based on their business location,
corporate status, and the number, conditions and assessed market values of their properties. Type 1
landlords typically own a single family or double property that is in good condition and of average or
above average market value. Type 2 landlords also own few properties, but they are more often
doubles and in bad condition with very low market value. They are most likely to need subsidized
capital to carry out the repairs to bring their properties up to lead safety standards. Type 3 landlords
are larger operators, often corporate. Included in their portfolios are larger buildings as well as
singles and doubles. While some of their buildings are in bad condition, the experience and scale of
these landlords suggest they have the capacity to carry out the repairs that may be required.
Programs to support lead safe housing in Cleveland will need to be customized for these various
segments of the private rental market.
Acknowledgements We thank Director Ayonna Blue Donald, Michael Banks, and Dr. Timothy Kobie from the City of Cleve-
land Department of Building and Housing for their contributions to this work. This research was made possible through
funding from the Mt. Sinai Healthcare Foundation, Saint Luke's Foundation, George Gund Foundation, and the Eva L. and
Joseph M. Bruening Foundation.
September 2020
Center on Urban Poverty and Community Development
2
INTRODUCTION
Prevention of lead poisoning in young children requires action at the intersection of the health, housing,
and regulatory systems. The challenge is thus multifaceted because families with young children seeking housing
in the low-cost private rental market face limited choices and leverage when it comes to their selection of
housing units. Much of the affordable housing stock carries a significant risk of lead exposure due to its age,
deferred maintenance and low market value. Implementing a program to assure that housing units are lead safe
requires detailed information on the rental housing stock and the landlords that operate within the private
rental market.
On behalf of the Lead Safe Cleveland Coalition, the Center on Urban Poverty and Community
Development undertook a study of all rental properties in Cleveland. The purpose was to quantify the rental
housing stock with respect to structural, physical and market conditions, and ownership patterns. This report
focuses on the universe of residential properties in Cleveland that were used as rentals in 2018 and built before
1978, the year that lead paint was prohibited by law.
BACKGROUND
Lead poisoning rates among children in Cleveland have been high for many years. Exposure to lead dust is the primary source of elevated blood lead levels in children and the risk of exposure is greatest in low quality rental housing (Lanphear, Hornung, & Ho, 2005). Lead poisoning occurs in all Cleveland neighborhoods, but the rates are highest in areas where housing has been vacant or subject to disinvestment (Fischer, Steh & Chan, 2018). African American children are disproportionately exposed to lead in their homes, in large part due to historical patterns of redlining and discriminatory housing policy (Sampson & Winter, 2016; Rothstein, 2017). Prolonged disinvestment and lack of maintenance in the affordable housing stock are key factors that contribute to persistent racial and socio-economic disparities in lead poisoning among young children.
Less than one-quarter of low income families nationally live in public or subsidized housing units (Kingsley, 2017). In Cleveland, low- to moderate-income families face significant challenges finding affordable housing in the private market and their chances of acquiring lead safe housing are uncertain. The foreclosure crisis and subsequent recession further weakened the low-income housing market in Cleveland that for decades had experienced population and employment loss. Some properties in hard hit areas were vacant for prolonged periods and suffered considerable deterioration. Additionally, the housing market collapsed in some parts of the city, leaving owners of rental housing with low valued assets (Coulton, Schramm & Hirsh, 2008; Coulton, Chan, Mikelbank & Schramm, 2008) and little incentive or financial means for investing in repairs and maintenance of properties.
In older industrial cities, the affordable rental market tends to be dominated by small buildings owned by individual rather than corporate landlords (Garboden & Newman, 2012). While this is also the pattern in Cleveland, there is little systematic information about the inventory and segmentation of this market or the business models of the landlords in this space. Yet these properties and owners are key elements of a lead safe strategy for Cleveland. The aim of this study is to provide an overview of this sector as a guide to developing strategies to bring rental housing up to lead safe standards and ultimately eliminating the risk of lead poisoning among young children in Cleveland.
Center on Urban Poverty and Community Development
3
DATA SOURCES AND ANALYSIS
This study focuses on privately owned rental housing in Cleveland that, by virtue of being built before
1978 (the year when lead paint was outlawed), presents potential risk for lead exposure. The study also looks at
the owners of rental properties in Cleveland to determine the locations and characteristics of their holdings. In
this report, we focus our analysis on those properties and landlords that were active in the rental market during
2018.
The research utilizes a variety of public records to identify the rental properties and describe their physi-
cal and market conditions. To optimize the coverage and accuracy of this research, we undertook an elaborate
process of acquiring public records, linking them together by property and owner identifiers, and evaluating data
quality (further details on the data elements and variables used in the report can be found in Appendix A). From
these records, we created two data files that are used in the analysis:
1. Longitudinal property file: We begin by building a longitudinal file that includes every residential par-
cel in Cleveland over a 3-year period. Parcels are geocoded so that they can be linked to other data records based on address or a geographic identifier (e.g. census tract). For each parcel we import owner name(s), tax mailing address, owner occupancy tax credit, property characteristics, assessed market value,1 recent sales, foreclosure and tax history, code violations, building permits, condition rating, rental registry date, vacancy spells, eviction filings, whether a Housing Choice Voucher has been used, lead test results at the property and more. Most of this information is time-dependent so we specify whether we are referring to a point in time record (e. g. assessed value in 3rd quarter of 2018) or if we refer to events occurring within a given timeframe (e. g. code violations in the previ-
ous 3 years). To identify those properties that are likely rentals, we utilize multiple criteria. A residen-
tial property is considered for inclusion in the rental universe if (a) it was in the city of Cleveland’s rental registry in 2018, (b) the property owner did not claim the owner occupancy tax credit in 2018, or (c) property records indicate that the parcel contains more than one housing unit (if a double or triple has owner occupancy tax credit, it is assumed that one of the units is occupied by the property owner). From this pool of potential rentals, we then exclude properties for several disqualifying rea-
sons: if records indicate a demolition in 2018, ownership by the Cuyahoga Land Bank, state forfei-ture, or long-term vacancy. We further restrict the file to properties built before 1978 and exclude publicly owned rental properties (e.g. Cuyahoga Metropolitan Housing Authority).
2. Landlord file: The focus here is on creating a database with information on the owners of rental properties. The first step in creating a file of landlords is to use text analysis methods to clean and standardize the owner names and tax mailing addresses as recorded in county records. Owners are initially classified as either organizations or persons based on the presence or absence of certain terms associated with non-human entities (e.g. LLC, company, agency) or recognizable person names. Once cleaned, the names are de-duplicated, and each owner is assigned an owner ID. The owner ID is attached to all of their properties. This allows variables from the property file to be used to produce computed variables for the landlord database. These variables include whether the own-
er is a person(s) or organization, located in Cleveland or elsewhere, the number and types of proper-
ties and units owned, the average conditions and market values of their properties, markers of finan-
cial vulnerability (e.g. tax delinquencies), and participation in the rental registry or Housing Choice Voucher programs.
1 We refer to the assessed market value in Cuyahoga County Fiscal Officer property tax records as market value or assessed market value.
Center on Urban Poverty and Community Development
4
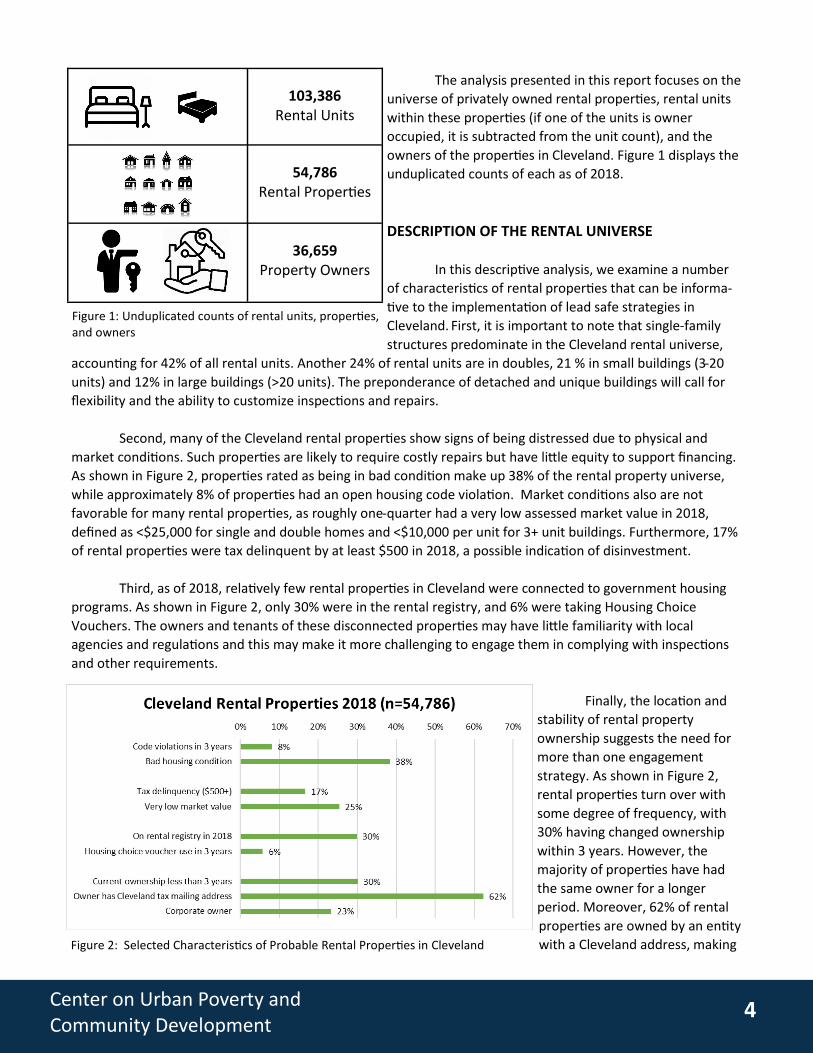
The analysis presented in this report focuses on the
universe of privately owned rental properties, rental units
within these properties (if one of the units is owner
occupied, it is subtracted from the unit count), and the
owners of the properties in Cleveland. Figure 1 displays the
unduplicated counts of each as of 2018.
DESCRIPTION OF THE RENTAL UNIVERSE
In this descriptive analysis, we examine a number
of characteristics of rental properties that can be informa-
tive to the implementation of lead safe strategies in
Cleveland. First, it is important to note that single-family
structures predominate in the Cleveland rental universe,
accounting for 42% of all rental units. Another 24% of rental units are in doubles, 21 % in small buildings (3-20
units) and 12% in large buildings (>20 units). The preponderance of detached and unique buildings will call for
flexibility and the ability to customize inspections and repairs.
Second, many of the Cleveland rental properties show signs of being distressed due to physical and
market conditions. Such properties are likely to require costly repairs but have little equity to support financing.
As shown in Figure 2, properties rated as being in bad condition make up 38% of the rental property universe,
while approximately 8% of properties had an open housing code violation. Market conditions also are not
favorable for many rental properties, as roughly one-quarter had a very low assessed market value in 2018,
defined as <$25,000 for single and double homes and <$10,000 per unit for 3+ unit buildings. Furthermore, 17%
of rental properties were tax delinquent by at least $500 in 2018, a possible indication of disinvestment.
Third, as of 2018, relatively few rental properties in Cleveland were connected to government housing
programs. As shown in Figure 2, only 30% were in the rental registry, and 6% were taking Housing Choice
Vouchers. The owners and tenants of these disconnected properties may have little familiarity with local
agencies and regulations and this may make it more challenging to engage them in complying with inspections
and other requirements.
Finally, the location and
stability of rental property
ownership suggests the need for
more than one engagement
strategy. As shown in Figure 2,
rental properties turn over with
some degree of frequency, with
30% having changed ownership
within 3 years. However, the
majority of properties have had
the same owner for a longer
period. Moreover, 62% of rental
properties are owned by an entity
with a Cleveland address, making
Figure 1: Unduplicated counts of rental units, properties, and owners
103,386
Rental Units
54,786
Rental Properties
36,659
Property Owners
Figure 2: Selected Characteristics of Probable Rental Properties in Cleveland

Center on Urban Poverty and Community Development
5
personal contact possible. The remainder mostly have addresses within Ohio, requiring other forms of contact.
Corporate entities (i.e. LLCs, LPs and other organizations or businesses), own 23% of Cleveland rental properties
while 77% are titled in the name of individuals, suggesting the need for differentiated approaches to these kinds
of owners.
CHARACTERISTICS OF CLEVELAND LANDLORDS
Another way of looking at the Cleveland rental landscape is to focus on the owners of the properties. If
there are some entities that own large numbers of properties, a strategy designed for them would affect a
significant portion of the rental universe. If the remainder of the universe is accounted for by many small
landlords, a different approach may be needed to bring them into the program. Moreover, landlords may differ
in their reasons for being in business, their capitalization, and practices. All of these dimensions are pertinent in
consideration of the strategies that will be needed to make rental housing lead safe.
Our analysis of landlords begins with a de-duplicated list of the owners of rental properties in 2018.
Owners are classified as “persons” if their property deeds contain names of individuals. They are classified as
corporate if their deeds have company or organizational names. Although numerous methods of cleaning and
standardization were applied to the name fields in the data, it is likely that some duplicates were missed. In
particular, some individuals may own properties in various unrelated names, including those of family members
or corporate entities. It was beyond the scope of this study to investigate interlocking ownership of LLCs or
business relationships not evident in the titling of the property.
Keeping these data limitations in mind, we estimate that there are 36,659 unique owners of Cleveland
rental properties (See Figure 3). Corporate entities account for 14 % of these owners. The other 86 % of owners
are classified as persons. Most landlords own only a single property in Cleveland, with only 18% owning two or
more, although they may own rental properties in other areas outside the region. The majority of owners of
Cleveland rental properties have a presence in Cuyahoga County based on the location of their tax mailing
address.
A notable portion of
Cleveland landlords own
properties that are distressed or
disinvested. Markers of distress
include having at least one
property in bad condition (43%),
very low assessed market value
(29%), or tax delinquent (20%).
Only a minority of owners have
any of their properties in the
rental registry (27%) or rent to
households with a Housing
Choice Voucher (7%).
Figure 3: Selected Characteristics of Cleveland Landlords 2018
Center on Urban Poverty and Community Development
6
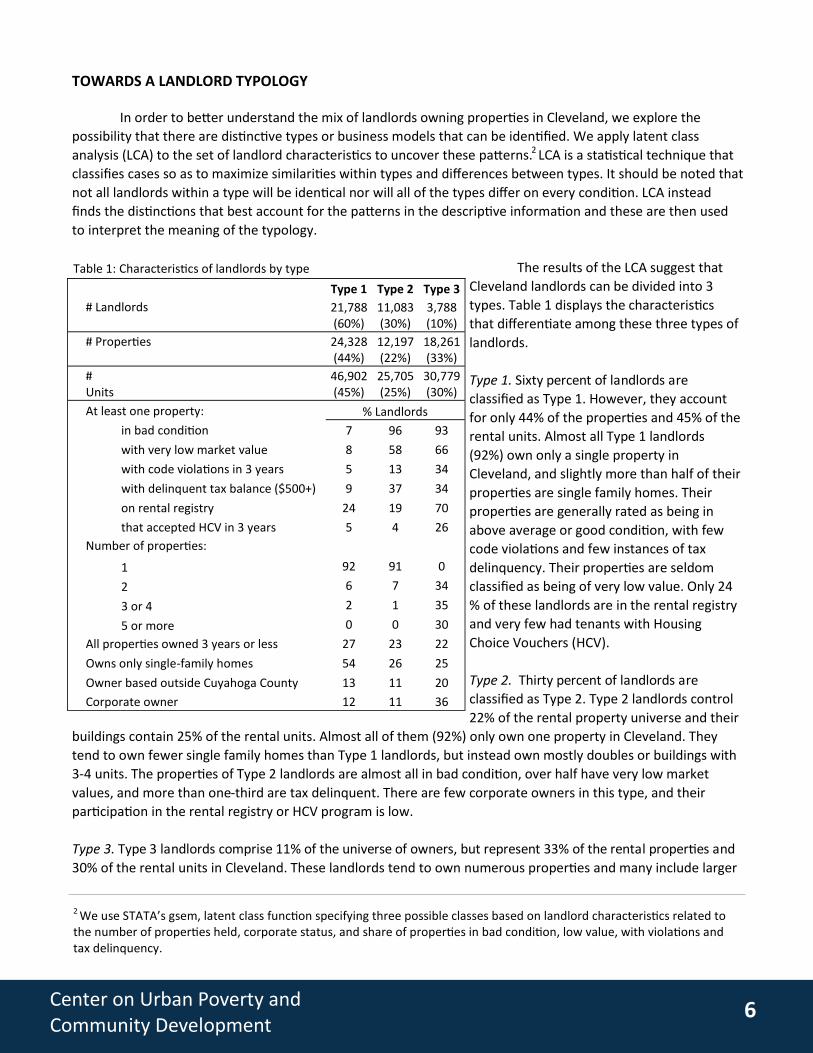
TOWARDS A LANDLORD TYPOLOGY
In order to better understand the mix of landlords owning properties in Cleveland, we explore the
possibility that there are distinctive types or business models that can be identified. We apply latent class
analysis (LCA) to the set of landlord characteristics to uncover these patterns.2 LCA is a statistical technique that
classifies cases so as to maximize similarities within types and differences between types. It should be noted that
not all landlords within a type will be identical nor will all of the types differ on every condition. LCA instead
finds the distinctions that best account for the patterns in the descriptive information and these are then used
to interpret the meaning of the typology.
The results of the LCA suggest that
Cleveland landlords can be divided into 3
types. Table 1 displays the characteristics
that differentiate among these three types of
landlords.
Type 1. Sixty percent of landlords are
classified as Type 1. However, they account
for only 44% of the properties and 45% of the
rental units. Almost all Type 1 landlords
(92%) own only a single property in
Cleveland, and slightly more than half of their
properties are single family homes. Their
properties are generally rated as being in
above average or good condition, with few
code violations and few instances of tax
delinquency. Their properties are seldom
classified as being of very low value. Only 24
% of these landlords are in the rental registry
and very few had tenants with Housing
Choice Vouchers (HCV).
Type 2. Thirty percent of landlords are
classified as Type 2. Type 2 landlords control
22% of the rental property universe and their
buildings contain 25% of the rental units. Almost all of them (92%) only own one property in Cleveland. They
tend to own fewer single family homes than Type 1 landlords, but instead own mostly doubles or buildings with
3-4 units. The properties of Type 2 landlords are almost all in bad condition, over half have very low market
values, and more than one-third are tax delinquent. There are few corporate owners in this type, and their
participation in the rental registry or HCV program is low.
Type 3. Type 3 landlords comprise 11% of the universe of owners, but represent 33% of the rental properties and
30% of the rental units in Cleveland. These landlords tend to own numerous properties and many include larger
2 We use STATA’s gsem, latent class function specifying three possible classes based on landlord characteristics related to the number of properties held, corporate status, and share of properties in bad condition, low value, with violations and tax delinquency.
Table 1: Characteristics of landlords by type
Type 1 Type 2 Type 3
# Landlords 21,788 (60%)
11,083 (30%)
3,788 (10%)
# Properties 24,328 (44%)
12,197 (22%)
18,261 (33%)
# Units
46,902 (45%)
25,705 (25%)
30,779 (30%)
At least one property: % Landlords
in bad condition 7 96 93
with very low market value 8 58 66
with code violations in 3 years 5 13 34
with delinquent tax balance ($500+) 9 37 34
on rental registry 24 19 70
that accepted HCV in 3 years 5 4 26
Number of properties:
1 92 91 0
2 6 7 34
3 or 4 2 1 35
5 or more 0 0 30
All properties owned 3 years or less 27 23 22
Owns only single-family homes 54 26 25
Owner based outside Cuyahoga County 13 11 20
Corporate owner 12 11 36

Center on Urban Poverty and Community Development
7
buildings in their portfolios. Most of these landlords have at least one of their properties rated as being in bad
condition (93%), and 34% have at least one property with code violations. Over one-third of Type 3 owners have
at least one property that is tax delinquent or of low market value. This landlord type includes more corporate
entities than the other two types and they are more likely to be based outside the county. These landlords have
comparatively high participation in the rental registry (70%) and HCV programs (26%).
These three types of landlords are likely to respond differently to requirements of Cleveland’s lead-safe
ordinance or need customized resources to assist them to come into compliance. Access to capital, likely return
on investment in repairs, scale of operation and managerial capacity are among the relevant variations among
the landlord types that can inform the planning for lead safe implementation.
For example, Type 2 landlords are particularly challenging because almost all of their properties are in
poor condition and in need of repair, but low market values limit access to conventional home improvement
loans. Also, as small owners, they are unlikely to be tapped into networks of suppliers or contractors, or be able
to achieve economies of scale for their property renovations. They will need access to various types of
subsidized capital such as grants and low-interest loans. Moreover, since they typically own only one property in
Cleveland and have low participation in the rental registry, outreach will be required to engage them in the
process and provide access to information and resources.
Type 3 landlords have the scale and size to overcome some of the limitations facing Type 2 landlords.
They also have more connections to regulatory processes and government programs as evidenced by their
higher participation in the rental registry or Housing Choice Voucher programs. Although they often have at
least one property in poor condition or at low market value, the fact that they have multiple properties suggests
greater capitalization and likely connections to construction services and financing.
Type 1 landlords, the most numerous type in Cleveland, generally hold single family properties in good
condition and solid market value. This suggests that many of these properties will meet lead-safe standards or
that the ratio of repair costs to property values will be favorable for conventional financing. However, as their
current level of participation in the rental registry is not high and their scale of operation is small, they are likely
to benefit from information about the lead safe ordinance, the rental registration process and how to access
qualified contractors or other resources if repairs are required.
Finally, it is important to note that landlords probably differ along a number of other dimensions that
could not be ascertained from the administrative records data used for this typology. Previous qualitative
research suggests that personal preferences, relationships, and connections to the community also matter,
especially for landlords doing business as individuals (Greif, 2018; Shiffer‐Sebba, D. 2020). As the lead safe
initiative unfolds, it will be important to gather the perceptions of landlords to gain a deeper understanding of
the landlord typology and its implications for lead-safe strategies across all areas of the city.
A NEIGHBORHOOD PERSPECTIVE
Thus far, the focus of this report has been on the properties and landlords in the entire Cleveland rental
market. However, there is considerable variation among neighborhoods in the rental housing stock and in the
types of landlords that are operating in these locations. To illustrate this neighborhood variation, we provide
two maps below showing the concentration of distressed rental properties (Figure 4) and Type 2 landlords
(Figure 5). The areas shown in yellow have the highest density of these properties and landlords, and reflect the
higher

Center on Urban Poverty and Community Development
8
amounts of resources that will be needed in those areas to bring the rental housing up to lead-safe standards.
As the lead safe initiative will be rolled out geographically, it will be strategically important to consider details
about the properties and landlords in each region. This neighborhood-specific information is vital to customizing
lead safe programs and approaches to fit the property conditions and landlord capacities in each area. Appendix
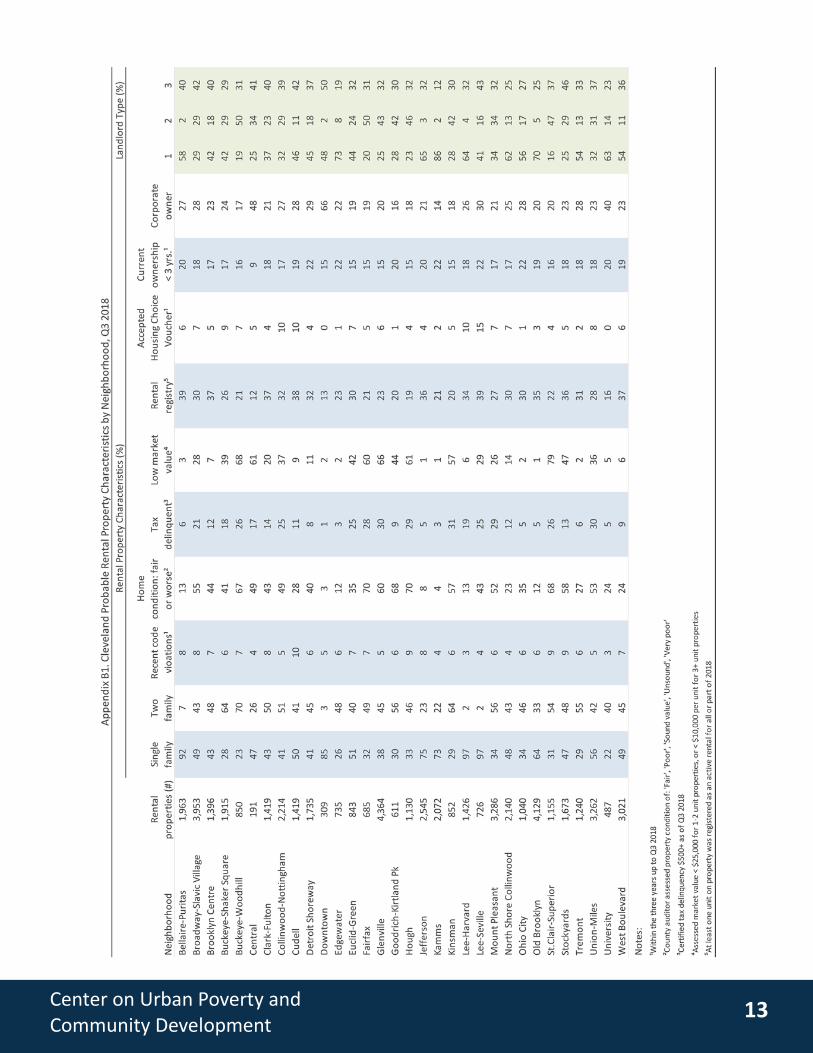
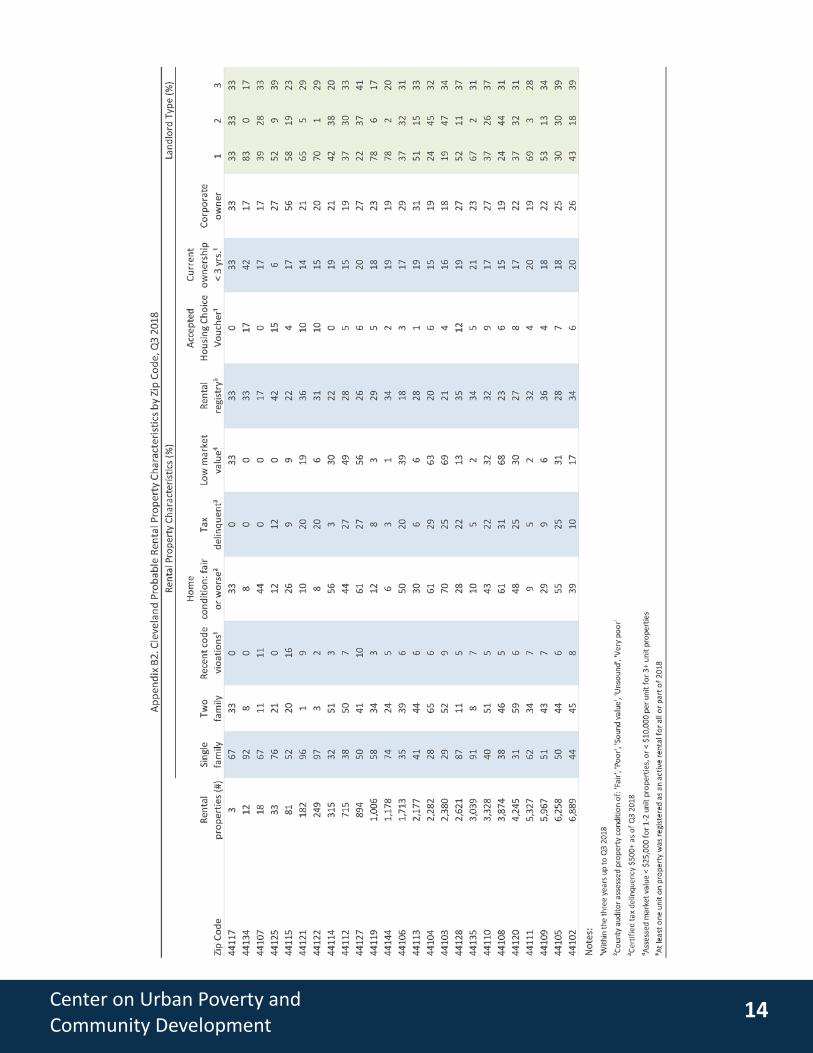
B provides breakouts of the data on housing conditions and landlords by zip code and SPA.
Figure 4: Spatial concentration of rental properties in bad condition and/or less than $25,000 assessed market value
Figure 5: Spatial concentration of properties owned by Type 2 landlords
Center on Urban Poverty and Community Development
9
CONCLUSIONS
The rental housing universe in Cleveland is dominated by single and two family homes owned by
individuals based in the region. The majority of Cleveland’s rental properties are maintained in above average or
good condition and have solid market values. Most of these units will meet lead safety standards or will require
modest repairs that can be adequately financed based on the underlying property values and rents involved.
The landlord typology, however, suggests substantial variability across landlords in regard to preparedness,
financial capacity, and motivation, and this requires a differentiated approach that responds to the
circumstances of these owners.
Of particular concern is that more than one-third of Cleveland’s rental properties have serious signs of
being deteriorated or in disrepair. Many of these distressed properties also have very low market value and
other signs of disinvestment. It will be imperative to bring these properties up to lead safe standards, but the
combination of high cost repairs and very low property values makes it challenging to finance the extent of the
renovations that are required.
Moreover, a significant portion of the landlords holding these distressed properties are individuals with
small scale operations rather than real estate companies or professional entities. Most of their properties are
not yet in the rental registry, nor are these owners participating in public programs such as Housing Choice
Vouchers. The low property values and deteriorated conditions of many of their properties suggest that they will
find it difficult to get conventional financing in the amount that will be required to upgrade their properties.
These small operators will need outreach, information, technical assistance, and other types of support to bring
their properties into the rental registry, complete their lead inspections and upgrade their properties to lead
safety standards. They will need to avail themselves of subsidized capital, including grants and low-interest
loans, to bring their properties up to lead safety standards.
Rental property owners are a key partner in the Lead Safe Cleveland Coalition’s objective to eliminate
lead risk in rental properties. The Coalition’s strategy has been developed based on early learning about the
needs and capacities of property owners, with attention to tactics that allow all owners to come into compliance
with the Lead Safe ordinance. This brief establishes a baseline assessment of the landscape of rental properties
in Cleveland, and will serve as a reference point as the Coalition’s work advances.
REFERENCES
Coulton, C.J., Schramm, M. & Hirsh, A. (2008). Beyond REO: Property Transfers at Extremely Distressed Prices,
Cuyahoga County, 2005-2008. Cleveland, Case Western Reserve University.
Coulton, C.J., Chan, T., Mikelbank, K. & Schramm, M. (2008). Foreclosure and Beyond. Cleveland, Case Western
Reserve University.
Fischer, R., Steh, S., & Chan, T. (2018). Early Childhood Lead Exposure among Cleveland Kindergarteners by
Neighborhood and School Enrollment. Cleveland, Case Western Reserve University.
Garboden, P. M., & Newman, S. (2012). Is preserving small, low-end rental housing feasible? Housing Policy
Debate, 22(4), 507-526
Greif, M. (2018). Regulating landlords: Unintended consequences for poor tenants. City & Community, 17(3),
658-674.
Kingsley, T. (2017). Trends in Housing Problems and Federal Housing Assistance. Washington, D.C.
Center on Urban Poverty and Community Development
10
Lanphear, B. P., Hornung, R., & Ho, M. (2005). Screening housing to prevent lead toxicity in children. Public
health reports (Washington, D.C.), 120(3), 305–310.
Sampson, R. J., & Winter, A. S. (2016). The racial ecology of lead poisoning: Toxic inequality in Chicago neighbor-
hoods, 1995-2013. Du Bois Review: Social Science Research on Race, 13(2), 261-283.
Rothstein, R. (2017). The Color of Law: A forgotten history of how our government segregated America. Liveright
Publishing Corporation, New York.
Shiffer‐Sebba, D. (2020). Understanding the Divergent Logics of Landlords: Circumstantial versus Deliberate
Pathways. City & Community.
The Center on Urban Poverty and Community Development at Case Western Reserve University is committed to
high standards of data and research integrity. We carefully follow human subject research standards, which in-
cludes Institutional Review Board (IRB) oversight, and we are dedicated to providing critical data analysis as well
as nuanced presentation to protect against inaccuracies. However, even adherence to high standards of data
integrity has limitations. All administrative data has the potential for bias due to the proven history of over-
surveillance and unequal treatment of poor communities, particularly communities of color. We acknowledge
that these biases could impact the administrative data that we receive. Our Center is guided by these considera-
tions as we work to provide an ethical and accurate reflection of the communities with which we work.

Center on Urban Poverty and Community Development
11
APPENDIX A: Data notes and glossary of variables Pre-1978, private-market, probable rental properties (steps in defining rental universe). To determine the uni-
verse of probable rental properties, we use multiple administrative data sources covering a wide range of infor-
mation at the property level. We start with all properties in the City of Cleveland (roughly 191,000). We narrow
this universe of properties to those with a building value greater than $0, built before 1978, and with either a
"residential" property class and/or land use code, including, but not limited to, residential, commercial apart-
ment buildings, or a City of Cleveland rental registration record in 2018 (roughly 114,000 properties). We then
flag probable rental properties using three criteria, (1) the property has greater than 1 unit, (2) the property has
a City of Cleveland rental registration record in 2018, or (3) the property does not take the owner-occupancy tax
credit. In the case where a property has 0 or missing unit information, if the property has a City of Cleveland
rental registration record in 2018, the property is flagged as a probable rental. Roughly 61,000 properties are
flagged through these criteria. We use three additional criteria to remove properties that are unlikely to be in-
habited from universe of properties, excluding those that (1) have a demolition indicated by Cuyahoga County,
City of Cleveland, or Cuyahoga Land Bank records in 2018, (2) were owned by the Cuyahoga Land Bank for the
entirety of the calendar year, and (3) were recorded as vacant by the USPS all of 2015, 2016, and 2017. We also
exclude properties owned by the Cuyahoga Metropolitan Housing Authority to limit the universe to the private
rental market. We arrive at a total of 54,786 probable rental properties.
Code violations in last 3 years. Code violation information comes from the City of Cleveland Department of
Building and Housing violation records. Only non-elevator violations where a violation number has been issued
are utilized. Only violations filed between 7-1-2015 and 7-1-2018 included.
Bad housing condition. Property condition rating comes from Cuyahoga County Fiscal Officer property charac-
teristic records. Condition rating as of the third quarter of 2018 is used here. To determine housing in bad con-
dition, we used ratings indicative of poor housing condition, including "fair," "poor," "very poor," "sound value,"
and "unsound." Conversations with the Cuyahoga County Fiscal Office informed the groupings described. We
compared this classification with the Thriving Communities sidewalk property survey and found close corre-
spondence with their rankings on overall condition.
Tax delinquency ($500+). Property tax delinquency comes from the Cuyahoga County Fiscal Officer tax billing
files. Only certified tax delinquency greater than $500 is included here. Information is as of quarter 3, 2018.
Low market value. This comes from the assessed market value in Cuyahoga County Fiscal Officer property tax
records, as of the third quarter of 2018. For properties with 1 or 2 units, a market value of $25,000 or below is
considered very low market value. For properties with more than 2 units, a market value of $10,000 or below
per unit is considered very low.
On rental registry in 2018. This as ascertained from rental registration records provided by the City of Cleve-
land Department of Building and Housing. Active rental registrations in 2018 are defined as those that have a file
date before the first day of 2019, a status date after the last day of 2017, and a status other than "closed" or "no
renewal." The number of registered units associated with the rental registration record may or may not reflect
the number of units physically located at the property listed on the rental registration, as large-scale owners of
rental properties are able to register multiple properties under one registration record.
Housing Choice Voucher in last 3 years. Housing Choice Voucher (HCV) information is provided by Cuyahoga
Metropolitan Housing Authority for all recipients of HCVs. From this file, we create HCVs per unique address.
This is an underestimate of total HCV use for two reasons (1) we do not have information from other
Center on Urban Poverty and Community Development
12
authorities in surrounding counties/cities that administer HCVs that might be used to rent a Cleveland property
and (2) not all HCV addresses were able to be linked to this dataset. Approximately 17% of HCV addresses were
unable to be matched to a specific parcel in Cleveland.
Current ownership less than 3 years. Ownership information is from the Cuyahoga County Fiscal Officer deed
transfer records. Here we include any deed transfer between 7-1-2015 and 7-1-2018.
Owner has Cleveland tax mailing address. The location of the owner of record of the property, third quarter,
2018, as reflected in the Cuyahoga County Fiscal Officer tax billing file, tax mailing address. Tax mailing
addresses are cleaned and geo-located to the categories reflected in the tables (in Cleveland, based outside of
county).
Corporate owner. The name of the owner of the property, third quarter, 2018, is reflected in the Cuyahoga
County Fiscal Officer tax billing file, property ownership information. Property owner names are cleaned and
processed to categorize owners as "person" owners, where the listed name reflects an individual person, or
corporate owners, where the listed name reflects a corporate entity.
Center on Urban Poverty and Community Development
13
Center on Urban Poverty and Community Development
14