characteristics of the carg-srf binding context in mammalian genomes
TRANSCRIPT

Characteristics of the CArG-SRF binding context in mammaliangenomes
Wenwu Wu • Xia Shen • Shiheng Tao
Received: 15 September 2009 / Accepted: 11 November 2009 / Published online: 3 December 2009
� Springer Science+Business Media, LLC 2009
Abstract Serum response factor (SRF), a member of the
MADS family, binds a 10-bp cis element known as the
CArG box. However, despite our extensive knowledge of
SRF and the CArG box, limited information is available on
the CArG-SRF binding context or how CArG flanking
sequences are defined. We used statistical tests and com-
puter simulation to find characteristics of the CArG-SRF
binding context. Based on the combination of published
literature and a search of DBTSS, 150 and 136 functional
CArG boxes together with 10 bp flanking on each side
were found in mouse and human genomes, respectively. By
statistical analysis of the 30 positions we found some new
conserved positions of interest (P \ 0.005) such as -15,
-8, and ?8, in addition to the ten highly conserved posi-
tions of the CArG box. Intriguingly, studies comparing the
flanking positions between consensus CArG boxes and
CArG-like boxes showed that there are more conserved
positions in the latter. Moreover, CpG content within the
CArG-SRF binding context is much higher than that within
introns. Collectively, these results suggest that there are
some special pre-existing features in the flanking sequen-
ces of functional CArG boxes probably contributing to SRF
selectively recognizing and binding to the functional CArG
from millions of functionless CArG boxes in mammalian
genomes. This is a significant step toward understanding
the mechanism of transcriptional regulation of SRF-depen-
dent genes.
Introduction
Serum response factor (SRF) as a 62-67 kDa protein first
purified from the HeLa nucleus (Prywes and Roeder 1987;
Treisman 1987) is a highly conserved, widely expressed,
and versatile transcription factor in mammals (De Folter
and Angenent 2006; Miano 2003; Shore and Sharrocks
1995). By binding to the CArG box, SRF can orchestrate
disparate programs of gene expression linked to mesoderm
formation (Arsenian et al. 1998), cardiac development and
maintenance (Miano et al. 2004; Parlakian et al. 2005), and
cell motility (Alberti et al. 2005; Fleige et al. 2007). SRF-
null mouse embryos (Niu et al. 2005), for example, failed
to gastrulate and form mesoderm, indicating that SRF is an
obligatory factor for mesoderm development. Moreover,
SRF has been linked to an increasing number of diseases,
including cancer (Bell et al. 2009; Koegel et al. 2009; Petit
et al. 2008; Zhang et al. 2005). For example, in the mouse,
cardiac SRF transgenesis (Chai and Tarnawski 2002)
showed that overexpression of SRF resulted in hypertro-
phic cardiomyopathy, indicating a link between the level of
SRF expression and heart disease.
Given the essential roles of SRF throughout the body,
elucidating the SRF binding site provides key information
for understanding the transcriptional regulation mechanism
of SRF-dependent genes. Over the last 20 years, hundreds
of genes have been shown to be transcriptionally regulated
by SRF and the regulatory regions of these genes have a
common 10-bp cis element called the CArG box (Miano
2003; Sun et al. 2006; Treisman 1992), which is directly
Electronic supplementary material The online version of thisarticle (doi:10.1007/s00335-009-9238-x) contains supplementarymaterial, which is available to authorized users.
W. Wu � X. Shen � S. Tao (&)
College of Life Science, Northwest A&F University,
712100 Yangling, Shaanxi, China
e-mail: [email protected]
W. Wu � X. Shen � S. Tao
Bioinformatics Center, Northwest A&F University,
Yangling, Shaanxi, China
123
Mamm Genome (2010) 21:104–113
DOI 10.1007/s00335-009-9238-x
bound by SRF. Subsequently, Miano’s group (Miano et al.
2007; Sun et al. 2006) proposed a theoretical definition of a
functional CArG box in which the 10-bp consensus can
deviate by no more than 1 bp, yielding 1216 potential
sequences that could be bound by SRF. According to the
statistical frequency of CArG boxes, there would be more
than 3 million CArG boxes in the mouse genome (Sun
et al. 2006). However, so far fewer than 200 CArG boxes
have been experimentally verified functional (Miano 2008;
Sun et al. 2006). Thus, we want to answer the basic
question: what kind of factors discriminate the functional
CArG boxes from millions of functionless boxes and urge
SRF binding to the functional boxes?
Although in past years the CArG box per se (De Folter
and Angenent 2006; Hendrix et al. 2005; Huet et al. 2005;
Leung and Miyamoto 1989; Stepanek et al. 2007; Sun et al.
2006) and the distribution of its position in relation to
transcriptional start sites (TSS) (Shen et al. 2009; Sun et al.
2006) and SRF and its cofactors (Cooper et al. 2007; Miano
et al. 2007; Sun et al. 2006) have been studied extensively,
much less information is available on the properties of
CArG flanking sequences. To our knowledge, the experi-
ment (Pellegrini et al. 1995) showed that the 5-methyl
group of T?8 downstream of the CArG box has hydro-
phobic contact with Thr159 and Ser162 of SRF, and certain
point mutations in CArG flanking sequences (Leung and
Miyamoto 1989; Mack et al. 2000) would reduce, enhance,
or not influence SRF binding to the box. Thus, for at least
some adjacent positions of functional CArG boxes, we
assume that the function of binding to SRF constrains the
flanking sequences surrounding the box. In particular, the
flanking 10 bp on each side of the functional CArG box
would provide a suitable biochemical environment to be
recognized by SRF, before the core CArG box eventually
binds to the factor uniquely.
In this study, using the v2 test and computer simulation
we identified some new conserved positions (-15, -8, ?7,
and ?8) and found high CpG content in the CArG-SRF
binding context. In addition, we confirmed the conserved
positions in the flanking positions of the CArG-like boxes
but also identified some new conserved positions (-12, -7,
and -6). Together, our studies revealed the characteristics
of the CArG-SRF binding context in mammalian genomes,
a new perspective to understanding the importance of the
flanking sequences surrounding the functional CArG boxes.
Materials and methods
Isolation of target fragments
The primary strategy for isolating target fragments, which
include functional CArG boxes and their flanking
sequences, was generalized as follows: First, SRF target
genes in mouse and human genomes were collected from
the published literature (Cooper et al. 2007; Sun et al.
2006). In most cases these genes were accompanied by
CArG sequences and their positions with respect to TSS.
Subsequently, the promoters of these genes were retrieved
using transcript IDs against DBTSS (Wakaguri et al. 2008),
and then a Perl script was developed to capture CArG-SRF
binding context through CArG sequences and their corre-
sponding positions to TSS. Finally, 150 and 136 target
fragments (30 nucleotides long), including functional
CArG boxes, were found in mouse and human genomes,
respectively (see Supplementary Material).
Statistical analysis
Tables 1 and 2 present the status of each position within
the 30-nucleotide-long fragments in mammalian genomes
obtained using the v2 goodness-of-fit test. v2 was calculated
using the following equation:
v2 ¼XA;T;G;C
i¼A
ðOi � EiÞ2
Ei
where Oi is the observed frequency of base i and Ei is the
expected frequency of base i, determined by the frequen-
cies of the four nucleotides (A, T, G, and C) in CArG
flanking sequences. By computer simulation, p values were
obtained as the proportion of the 10,000 replications in
which the simulated v2 values exceeded the v2 values
calculated from the real data.
Using the v2 test for stochastic independence, Table 3A
and B presents dinucleotide distributions in CArG flanking
sequences and in the intron fragments randomly chosen
from the Exon–Intron Database (EID) (Shepelev and Fe-
dorov 2006). v2 was calculated using the following
equation:
v2ij ¼ðOij � EijÞ2
Eij
where Oij is the observed dinucleotide (ij) counts, Eij is the
expected dinucleotide (ij) counts calculated from the
mononucleotide counts, and the ratio between them was
calculated as R = Oij/Eij. Table 4A presents the associations
of four consecutive positions in the middle of functional
CArG boxes with only A or T taken into account. In
Table 4A, v2 was calculated using the following equation:
v2ijkn ¼
ðOijkn � EijknÞ2
Eijkn
where Oijkn is the observed tetranucleotide (ijkn) counts,
Eijkn is the expected tetranucleotide (ijkn) counts calculated
from the four mononucleotide counts, and Yates’
W. Wu et al.: Implication of CArG-SRF binding context 105
123
correction (Yates 1934) was used when necessary
(Eijkn \ 5). The p value for each tetranucleotide (ijkn) was
obtained using the computer simulation strategy as above.
Results
Based on the published literature (Cooper et al. 2007; Sun
et al. 2006) and the Database of Transcription Start Sites
(DBTSS, version 6.0) (Wakaguri et al. 2008), we found 150
and 136 functional CArG boxes with 10-nucleotide-long
fragments flanking each side in the mouse and human
genomes, respectively (see Materials and methods). The 20
adjacent positions, which refer to 10 bp upstream and 10 bp
downstream of the CArG box, can be regarded as CArG-
SRF binding context (CSBC), and we focused our analysis
mainly on the CSBC of the 286 functional CArG boxes in
mammalian genomes (see Supplementary Material).
Conservation status of CSBC in mammalian genomes
Using a v2 goodness-of-fit test and computer simulation
(see Materials and methods), we obtained the frequencies
of nucleotides A, T, G, and C; v2 and the P value at each
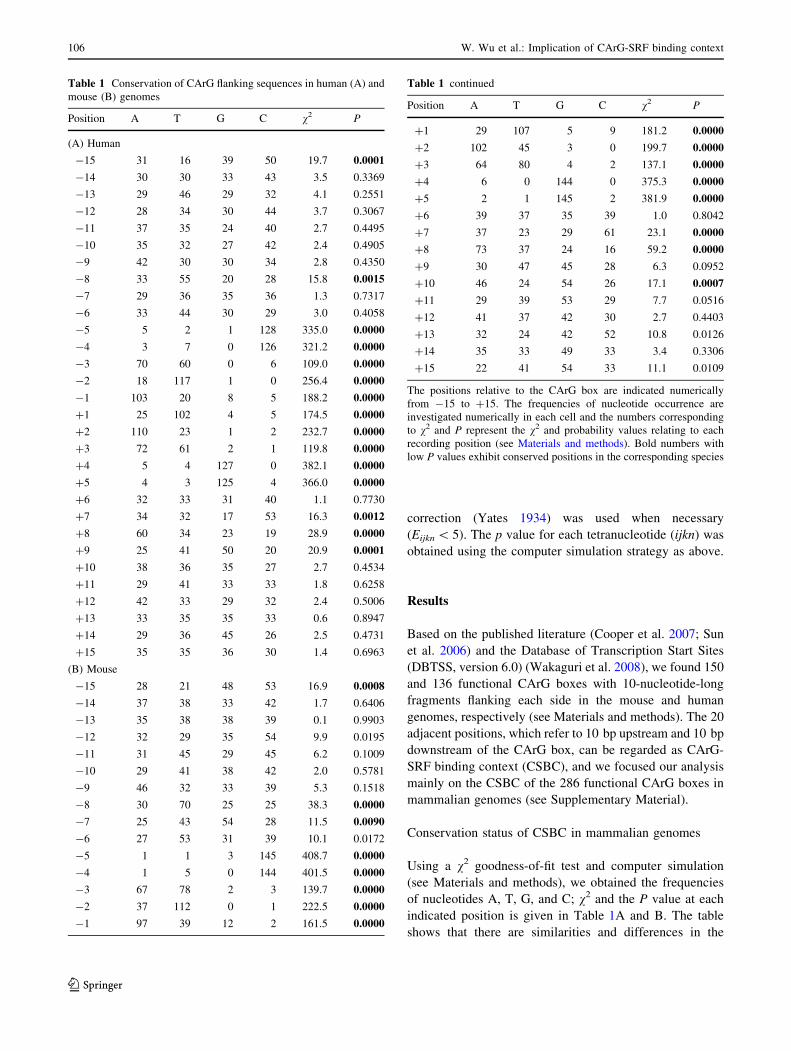
indicated position is given in Table 1A and B. The table
shows that there are similarities and differences in the
Table 1 Conservation of CArG flanking sequences in human (A) and
mouse (B) genomes
Position A T G C v2 P
(A) Human
-15 31 16 39 50 19.7 0.0001
-14 30 30 33 43 3.5 0.3369
-13 29 46 29 32 4.1 0.2551
-12 28 34 30 44 3.7 0.3067
-11 37 35 24 40 2.7 0.4495
-10 35 32 27 42 2.4 0.4905
-9 42 30 30 34 2.8 0.4350
-8 33 55 20 28 15.8 0.0015
-7 29 36 35 36 1.3 0.7317
-6 33 44 30 29 3.0 0.4058
-5 5 2 1 128 335.0 0.0000
-4 3 7 0 126 321.2 0.0000
-3 70 60 0 6 109.0 0.0000
-2 18 117 1 0 256.4 0.0000
-1 103 20 8 5 188.2 0.0000
?1 25 102 4 5 174.5 0.0000
?2 110 23 1 2 232.7 0.0000
?3 72 61 2 1 119.8 0.0000
?4 5 4 127 0 382.1 0.0000
?5 4 3 125 4 366.0 0.0000
?6 32 33 31 40 1.1 0.7730
?7 34 32 17 53 16.3 0.0012
?8 60 34 23 19 28.9 0.0000
?9 25 41 50 20 20.9 0.0001
?10 38 36 35 27 2.7 0.4534
?11 29 41 33 33 1.8 0.6258
?12 42 33 29 32 2.4 0.5006
?13 33 35 35 33 0.6 0.8947
?14 29 36 45 26 2.5 0.4731
?15 35 35 36 30 1.4 0.6963
(B) Mouse
-15 28 21 48 53 16.9 0.0008
-14 37 38 33 42 1.7 0.6406
-13 35 38 38 39 0.1 0.9903
-12 32 29 35 54 9.9 0.0195
-11 31 45 29 45 6.2 0.1009
-10 29 41 38 42 2.0 0.5781
-9 46 32 33 39 5.3 0.1518
-8 30 70 25 25 38.3 0.0000
-7 25 43 54 28 11.5 0.0090
-6 27 53 31 39 10.1 0.0172
-5 1 1 3 145 408.7 0.0000
-4 1 5 0 144 401.5 0.0000
-3 67 78 2 3 139.7 0.0000
-2 37 112 0 1 222.5 0.0000
-1 97 39 12 2 161.5 0.0000
Table 1 continued
Position A T G C v2 P
?1 29 107 5 9 181.2 0.0000
?2 102 45 3 0 199.7 0.0000
?3 64 80 4 2 137.1 0.0000
?4 6 0 144 0 375.3 0.0000
?5 2 1 145 2 381.9 0.0000
?6 39 37 35 39 1.0 0.8042
?7 37 23 29 61 23.1 0.0000
?8 73 37 24 16 59.2 0.0000
?9 30 47 45 28 6.3 0.0952
?10 46 24 54 26 17.1 0.0007
?11 29 39 53 29 7.7 0.0516
?12 41 37 42 30 2.7 0.4403
?13 32 24 42 52 10.8 0.0126
?14 35 33 49 33 3.4 0.3306
?15 22 41 54 33 11.1 0.0109
The positions relative to the CArG box are indicated numerically
from -15 to ?15. The frequencies of nucleotide occurrence are
investigated numerically in each cell and the numbers corresponding
to v2 and P represent the v2 and probability values relating to each
recording position (see Materials and methods). Bold numbers with
low P values exhibit conserved positions in the corresponding species
106 W. Wu et al.: Implication of CArG-SRF binding context
123
CArG boxes and their flanking sequences between human
and mouse genomes. First, the ten positions (from -5 to
?5) of the CArG box have significant p values almost
equal to 0, represented as highly conserved binding posi-
tions to SRF in mouse and human genomes. Also, there is a
preference for C at -5 and -4, G at ?4 and ?5, T at -2
and ?1, A at -1 and ?2, and W at -3 and ?3, which
seems to indicate that the CArG box has a reversible motif:
CCWTA/TAWGG. Second, some flanking positions (-15,
-8, ?7, and ?8) of interest, sharing a similar conservation
status in human and mouse genomes, are more conserved
(P \ 0.005) than other flanking positions. From these
conserved positions there is a bias for C or G at -15, T at
-8, C at ?7, and A at ?8. Third, there are still a few
different conserved positions between the human and
mouse genomes. These are -7 and ?10 conserved posi-
tions (P \ 0.01) in the mouse genome but not conserved in
the human genome, and ?9 conserved positions (P \ 0.01)
in the human genome but not conserved in the mouse
genome. Perhaps in line with the differences in CArG
flanking sequences between mouse and human genomes,
the differences in orthologous SRF proteins between mouse
and human are presented in Fig. 1. This figure shows that
orthologous SRF-core residues (amino acids 132-223) are
exactly the same in mouse and human. Nonetheless, a few
mismatches are still observed in the flanking sequences of
orthologous SRF-core regions (see Discussion).
In addition, we specifically performed analysis on -8
and ?8 positions that we have identified as conserved
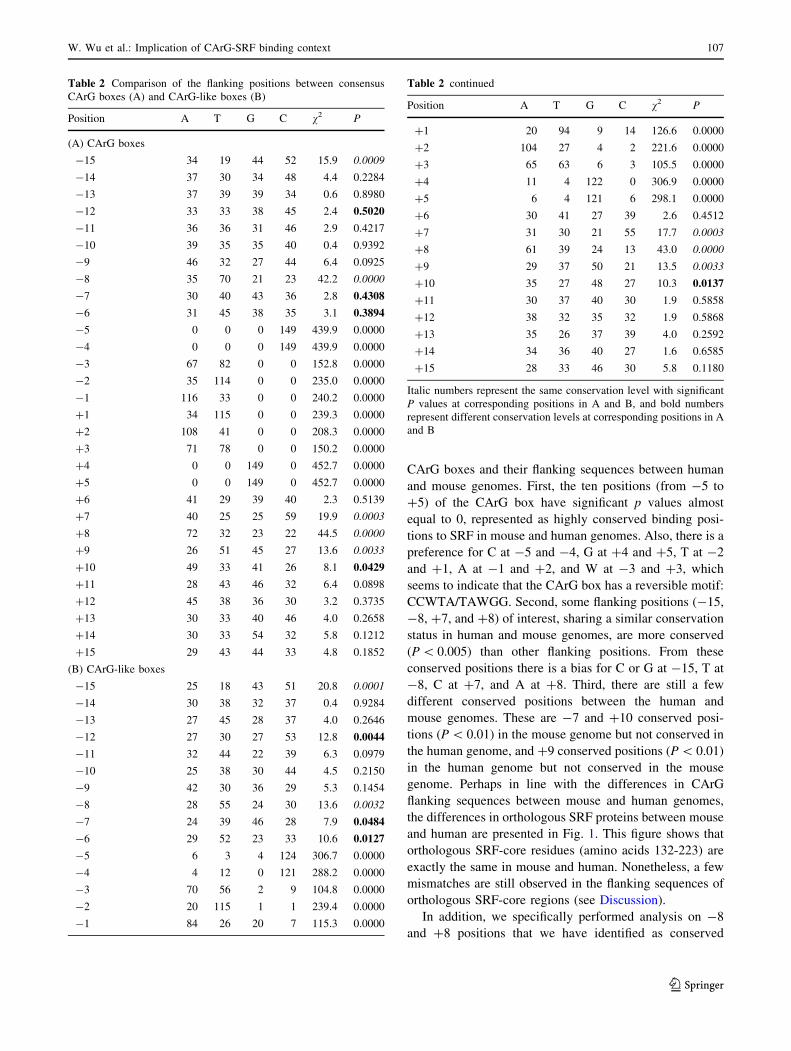
Table 2 Comparison of the flanking positions between consensus
CArG boxes (A) and CArG-like boxes (B)
Position A T G C v2 P
(A) CArG boxes
-15 34 19 44 52 15.9 0.0009
-14 37 30 34 48 4.4 0.2284
-13 37 39 39 34 0.6 0.8980
-12 33 33 38 45 2.4 0.5020
-11 36 36 31 46 2.9 0.4217
-10 39 35 35 40 0.4 0.9392
-9 46 32 27 44 6.4 0.0925
-8 35 70 21 23 42.2 0.0000
-7 30 40 43 36 2.8 0.4308
-6 31 45 38 35 3.1 0.3894
-5 0 0 0 149 439.9 0.0000
-4 0 0 0 149 439.9 0.0000
-3 67 82 0 0 152.8 0.0000
-2 35 114 0 0 235.0 0.0000
-1 116 33 0 0 240.2 0.0000
?1 34 115 0 0 239.3 0.0000
?2 108 41 0 0 208.3 0.0000
?3 71 78 0 0 150.2 0.0000
?4 0 0 149 0 452.7 0.0000
?5 0 0 149 0 452.7 0.0000
?6 41 29 39 40 2.3 0.5139
?7 40 25 25 59 19.9 0.0003
?8 72 32 23 22 44.5 0.0000
?9 26 51 45 27 13.6 0.0033
?10 49 33 41 26 8.1 0.0429
?11 28 43 46 32 6.4 0.0898
?12 45 38 36 30 3.2 0.3735
?13 30 33 40 46 4.0 0.2658
?14 30 33 54 32 5.8 0.1212
?15 29 43 44 33 4.8 0.1852
(B) CArG-like boxes
-15 25 18 43 51 20.8 0.0001
-14 30 38 32 37 0.4 0.9284
-13 27 45 28 37 4.0 0.2646
-12 27 30 27 53 12.8 0.0044
-11 32 44 22 39 6.3 0.0979
-10 25 38 30 44 4.5 0.2150
-9 42 30 36 29 5.3 0.1454
-8 28 55 24 30 13.6 0.0032
-7 24 39 46 28 7.9 0.0484
-6 29 52 23 33 10.6 0.0127
-5 6 3 4 124 306.7 0.0000
-4 4 12 0 121 288.2 0.0000
-3 70 56 2 9 104.8 0.0000
-2 20 115 1 1 239.4 0.0000
-1 84 26 20 7 115.3 0.0000
Table 2 continued
Position A T G C v2 P
?1 20 94 9 14 126.6 0.0000
?2 104 27 4 2 221.6 0.0000
?3 65 63 6 3 105.5 0.0000
?4 11 4 122 0 306.9 0.0000
?5 6 4 121 6 298.1 0.0000
?6 30 41 27 39 2.6 0.4512
?7 31 30 21 55 17.7 0.0003
?8 61 39 24 13 43.0 0.0000
?9 29 37 50 21 13.5 0.0033
?10 35 27 48 27 10.3 0.0137
?11 30 37 40 30 1.9 0.5858
?12 38 32 35 32 1.9 0.5868
?13 35 26 37 39 4.0 0.2592
?14 34 36 40 27 1.6 0.6585
?15 28 33 46 30 5.8 0.1180
Italic numbers represent the same conservation level with significant
P values at corresponding positions in A and B, and bold numbers
represent different conservation levels at corresponding positions in A
and B
W. Wu et al.: Implication of CArG-SRF binding context 107
123
positions in CArG flanking sequences. Of the 150 CArG
boxes in the mouse genome, nearly half (73) have nucle-
otides T or A at the two positions, which is approximately
twice as many as the expected value of 37.5.
Conservation status of CSBC between consensus
and CArG-like boxes
Based on Miano’s study on CArG boxes (Miano et al.
2007), we classified the 286 functional CArG boxes into
two categories: 149 consensus CArG boxes that are CC(A/
T)6GG with a high SRF-binding affinity, and 137 CArG-
like boxes that are a 1-bp deviation from consensus with a
much weaker SRF-binding affinity. We then compared the
characteristics of the flanking positions between the two
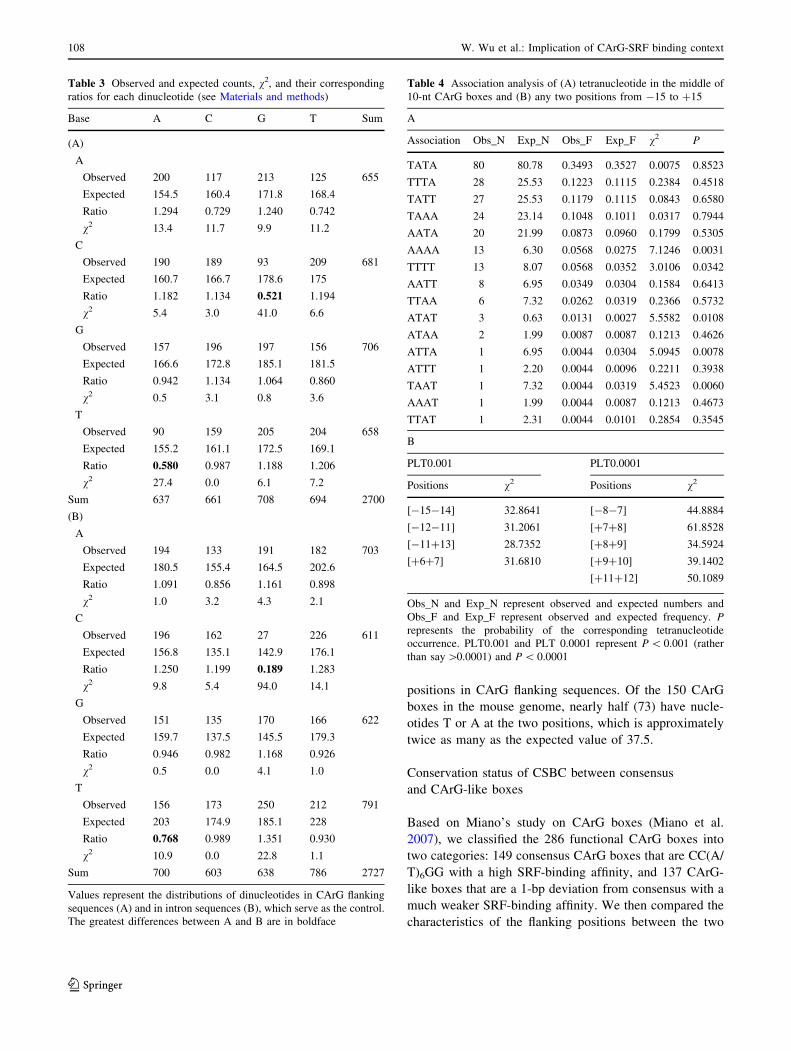
Table 3 Observed and expected counts, v2, and their corresponding
ratios for each dinucleotide (see Materials and methods)
Base A C G T Sum
(A)
A
Observed 200 117 213 125 655
Expected 154.5 160.4 171.8 168.4
Ratio 1.294 0.729 1.240 0.742
v2 13.4 11.7 9.9 11.2
C
Observed 190 189 93 209 681
Expected 160.7 166.7 178.6 175
Ratio 1.182 1.134 0.521 1.194
v2 5.4 3.0 41.0 6.6
G
Observed 157 196 197 156 706
Expected 166.6 172.8 185.1 181.5
Ratio 0.942 1.134 1.064 0.860
v2 0.5 3.1 0.8 3.6
T
Observed 90 159 205 204 658
Expected 155.2 161.1 172.5 169.1
Ratio 0.580 0.987 1.188 1.206
v2 27.4 0.0 6.1 7.2
Sum 637 661 708 694 2700
(B)
A
Observed 194 133 191 182 703
Expected 180.5 155.4 164.5 202.6
Ratio 1.091 0.856 1.161 0.898
v2 1.0 3.2 4.3 2.1
C
Observed 196 162 27 226 611
Expected 156.8 135.1 142.9 176.1
Ratio 1.250 1.199 0.189 1.283
v2 9.8 5.4 94.0 14.1
G
Observed 151 135 170 166 622
Expected 159.7 137.5 145.5 179.3
Ratio 0.946 0.982 1.168 0.926
v2 0.5 0.0 4.1 1.0
T
Observed 156 173 250 212 791
Expected 203 174.9 185.1 228
Ratio 0.768 0.989 1.351 0.930
v2 10.9 0.0 22.8 1.1
Sum 700 603 638 786 2727
Values represent the distributions of dinucleotides in CArG flanking
sequences (A) and in intron sequences (B), which serve as the control.
The greatest differences between A and B are in boldface
Table 4 Association analysis of (A) tetranucleotide in the middle of
10-nt CArG boxes and (B) any two positions from -15 to ?15
A
Association Obs_N Exp_N Obs_F Exp_F v2 P
TATA 80 80.78 0.3493 0.3527 0.0075 0.8523
TTTA 28 25.53 0.1223 0.1115 0.2384 0.4518
TATT 27 25.53 0.1179 0.1115 0.0843 0.6580
TAAA 24 23.14 0.1048 0.1011 0.0317 0.7944
AATA 20 21.99 0.0873 0.0960 0.1799 0.5305
AAAA 13 6.30 0.0568 0.0275 7.1246 0.0031
TTTT 13 8.07 0.0568 0.0352 3.0106 0.0342
AATT 8 6.95 0.0349 0.0304 0.1584 0.6413
TTAA 6 7.32 0.0262 0.0319 0.2366 0.5732
ATAT 3 0.63 0.0131 0.0027 5.5582 0.0108
ATAA 2 1.99 0.0087 0.0087 0.1213 0.4626
ATTA 1 6.95 0.0044 0.0304 5.0945 0.0078
ATTT 1 2.20 0.0044 0.0096 0.2211 0.3938
TAAT 1 7.32 0.0044 0.0319 5.4523 0.0060
AAAT 1 1.99 0.0044 0.0087 0.1213 0.4673
TTAT 1 2.31 0.0044 0.0101 0.2854 0.3545
B
PLT0.001 PLT0.0001
Positions v2 Positions v2
[-15-14] 32.8641 [-8-7] 44.8884
[-12-11] 31.2061 [?7?8] 61.8528
[-11?13] 28.7352 [?8?9] 34.5924
[?6?7] 31.6810 [?9?10] 39.1402
[?11?12] 50.1089
Obs_N and Exp_N represent observed and expected numbers and
Obs_F and Exp_F represent observed and expected frequency. Prepresents the probability of the corresponding tetranucleotide
occurrence. PLT0.001 and PLT 0.0001 represent P \ 0.001 (rather
than say [0.0001) and P \ 0.0001
108 W. Wu et al.: Implication of CArG-SRF binding context
123
categories in Table 2A and B. The table shows some
positions with different conservation status (-12, -7, -6,
and ?10) in the flanking sequences of the two categories,
in addition to the same conserved positions (-15, -8, ?7,
?8, and ?9). Upstream of the CArG-like boxes, -12, -7,
and -6 positions show statistically significant (P * 0.05)
results, whereas these positions of the consensus CArG
boxes show insignificant results. Similarly, downstream of
the CArG-like boxes, ?10 shows a little more significance
than the consensus boxes (see Discussion).
In addition, there is an incidental finding in the core
CArG boxes (Table 2B) that G is not observed at -4 and C
is not observed at ?4.
Distribution of dinucleotides in CSBC
High content of the dinucleotide CpG is generally associ-
ated with promoters in mammalian genomes (Antequera
2003; Rozenberg et al. 2008). Thus, we investigated the
contents of dinucleotides 10 bp upstream and 10 bp
downstream of the 150 CArG boxes in the mouse genome
(see Materials and methods) and compared them with the
contents of dinucleotides in intron sequences, which served
as the control (see Table 3A and B). In CArG flanking
sequences, the lowest ratios of observed to expected
dinucleotide counts are 0.521 for CpG and 0.580 for TpA,
followed by the ratios of ApC and ApT dinucleotides.
When compared to the control, CSBC has a far greater
ratio (0.521) for CpG and an apparently lower ratio (0.580)
for TpA. Besides, higher ratios for ApA, TpT, and GpC and
lower ratios for ApT and TpG in the CSBC compared with
those in the control also exhibit some pre-existing features
in CArG flanking sequences (see Discussion).
Association analysis of CArG boxes and CSBC
Statistical frequencies of nucleotides (see Tables 1 and 2)
showed that the CArG box is represented as the consensus
sequence C-5C-4W-3T-2A-1/T?1A?2W?3G?4G?5, which
probably demonstrates two points. First and obviously, the
CArG box is strongly biased and represented as a palin-
dromic sequence. Second, the C-5C-4W-3T-2A-1
sequence seems to be strongly linked to its complement,
T?1A?2W?3G?4G?5. To investigate whether this linkage
exists, we performed an association analysis on -2, -1,
?1, and ?2 positions in the middle of the CArG boxes in
Table 4A (see Materials and methods). The table surely
demonstrates that the observed number of T-2A-1/T?1A?2
is the most; however, surprisingly, T-2A-1 is not statisti-
cally significantly linked to its complement, T?1A?2, which
is roughly consistent with the small amount of mutual
information (see Fig. 2) between any two positions in the
functional CArG boxes produced from enoLOGOS online
(Workman et al. 2005). However, the tetranucleotides
A-2A-1A?1A?2, A-2T-1T?1A?2, and T-2A-1A?1T?2 are
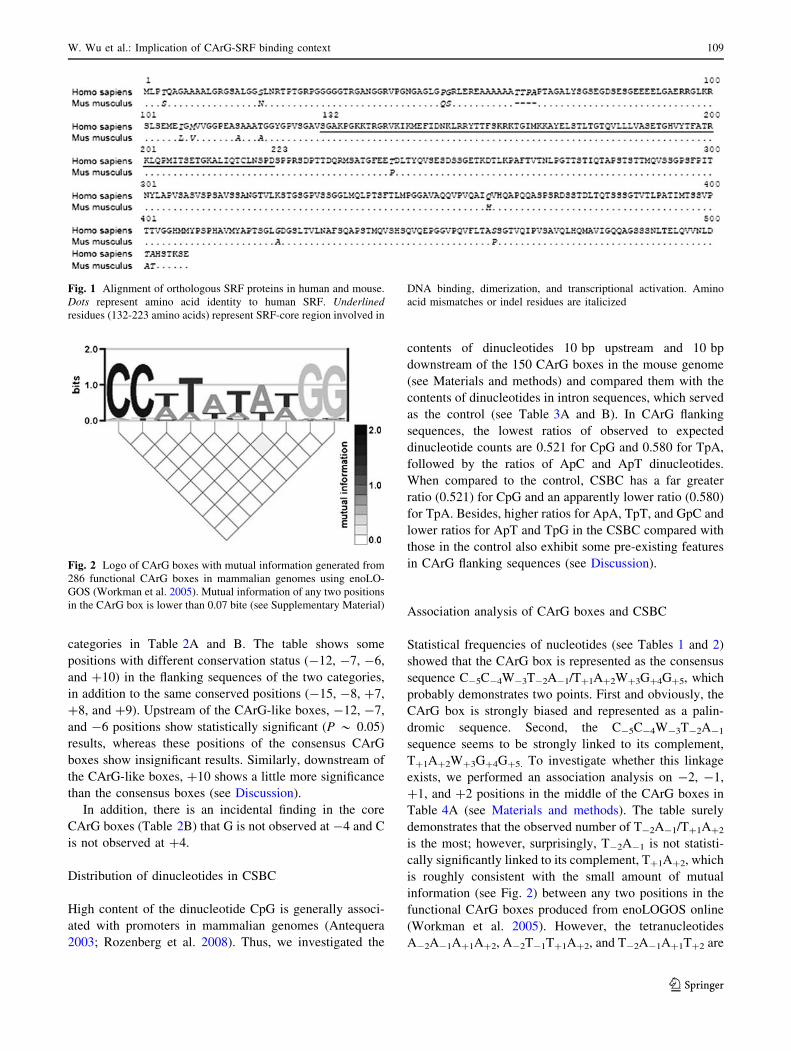
Fig. 1 Alignment of orthologous SRF proteins in human and mouse.
Dots represent amino acid identity to human SRF. Underlinedresidues (132-223 amino acids) represent SRF-core region involved in
DNA binding, dimerization, and transcriptional activation. Amino
acid mismatches or indel residues are italicized
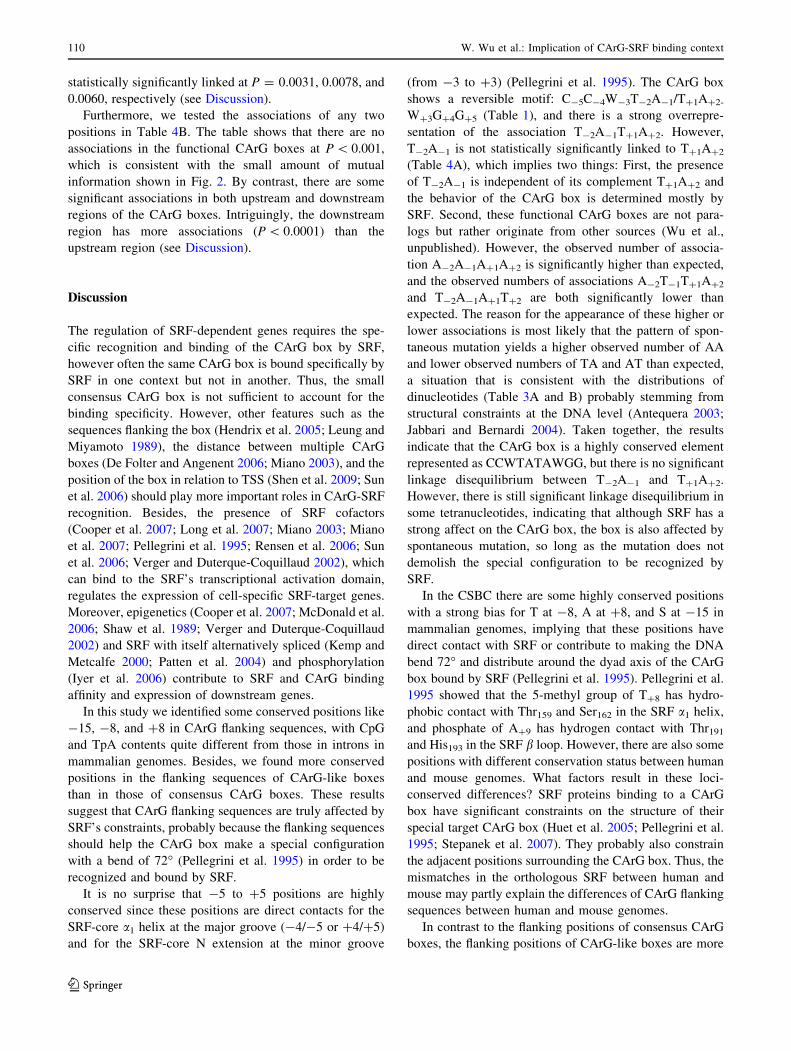
Fig. 2 Logo of CArG boxes with mutual information generated from
286 functional CArG boxes in mammalian genomes using enoLO-
GOS (Workman et al. 2005). Mutual information of any two positions
in the CArG box is lower than 0.07 bite (see Supplementary Material)
W. Wu et al.: Implication of CArG-SRF binding context 109
123
statistically significantly linked at P = 0.0031, 0.0078, and
0.0060, respectively (see Discussion).
Furthermore, we tested the associations of any two
positions in Table 4B. The table shows that there are no
associations in the functional CArG boxes at P \ 0.001,
which is consistent with the small amount of mutual
information shown in Fig. 2. By contrast, there are some
significant associations in both upstream and downstream
regions of the CArG boxes. Intriguingly, the downstream
region has more associations (P \ 0.0001) than the
upstream region (see Discussion).
Discussion
The regulation of SRF-dependent genes requires the spe-
cific recognition and binding of the CArG box by SRF,
however often the same CArG box is bound specifically by
SRF in one context but not in another. Thus, the small
consensus CArG box is not sufficient to account for the
binding specificity. However, other features such as the
sequences flanking the box (Hendrix et al. 2005; Leung and
Miyamoto 1989), the distance between multiple CArG
boxes (De Folter and Angenent 2006; Miano 2003), and the
position of the box in relation to TSS (Shen et al. 2009; Sun
et al. 2006) should play more important roles in CArG-SRF
recognition. Besides, the presence of SRF cofactors
(Cooper et al. 2007; Long et al. 2007; Miano 2003; Miano
et al. 2007; Pellegrini et al. 1995; Rensen et al. 2006; Sun
et al. 2006; Verger and Duterque-Coquillaud 2002), which
can bind to the SRF’s transcriptional activation domain,
regulates the expression of cell-specific SRF-target genes.
Moreover, epigenetics (Cooper et al. 2007; McDonald et al.
2006; Shaw et al. 1989; Verger and Duterque-Coquillaud
2002) and SRF with itself alternatively spliced (Kemp and
Metcalfe 2000; Patten et al. 2004) and phosphorylation
(Iyer et al. 2006) contribute to SRF and CArG binding
affinity and expression of downstream genes.
In this study we identified some conserved positions like
-15, -8, and ?8 in CArG flanking sequences, with CpG
and TpA contents quite different from those in introns in
mammalian genomes. Besides, we found more conserved
positions in the flanking sequences of CArG-like boxes
than in those of consensus CArG boxes. These results
suggest that CArG flanking sequences are truly affected by
SRF’s constraints, probably because the flanking sequences
should help the CArG box make a special configuration
with a bend of 72� (Pellegrini et al. 1995) in order to be
recognized and bound by SRF.
It is no surprise that -5 to ?5 positions are highly
conserved since these positions are direct contacts for the
SRF-core a1 helix at the major groove (-4/-5 or ?4/?5)
and for the SRF-core N extension at the minor groove
(from -3 to ?3) (Pellegrini et al. 1995). The CArG box
shows a reversible motif: C-5C-4W-3T-2A-1/T?1A?2-
W?3G?4G?5 (Table 1), and there is a strong overrepre-
sentation of the association T-2A-1T?1A?2. However,
T-2A-1 is not statistically significantly linked to T?1A?2
(Table 4A), which implies two things: First, the presence
of T-2A-1 is independent of its complement T?1A?2 and
the behavior of the CArG box is determined mostly by
SRF. Second, these functional CArG boxes are not para-
logs but rather originate from other sources (Wu et al.,
unpublished). However, the observed number of associa-
tion A-2A-1A?1A?2 is significantly higher than expected,
and the observed numbers of associations A-2T-1T?1A?2
and T-2A-1A?1T?2 are both significantly lower than
expected. The reason for the appearance of these higher or
lower associations is most likely that the pattern of spon-
taneous mutation yields a higher observed number of AA
and lower observed numbers of TA and AT than expected,
a situation that is consistent with the distributions of
dinucleotides (Table 3A and B) probably stemming from
structural constraints at the DNA level (Antequera 2003;
Jabbari and Bernardi 2004). Taken together, the results
indicate that the CArG box is a highly conserved element
represented as CCWTATAWGG, but there is no significant
linkage disequilibrium between T-2A-1 and T?1A?2.
However, there is still significant linkage disequilibrium in
some tetranucleotides, indicating that although SRF has a
strong affect on the CArG box, the box is also affected by
spontaneous mutation, so long as the mutation does not
demolish the special configuration to be recognized by
SRF.
In the CSBC there are some highly conserved positions
with a strong bias for T at -8, A at ?8, and S at -15 in
mammalian genomes, implying that these positions have
direct contact with SRF or contribute to making the DNA
bend 72� and distribute around the dyad axis of the CArG
box bound by SRF (Pellegrini et al. 1995). Pellegrini et al.
1995 showed that the 5-methyl group of T?8 has hydro-
phobic contact with Thr159 and Ser162 in the SRF a1 helix,
and phosphate of A?9 has hydrogen contact with Thr191
and His193 in the SRF b loop. However, there are also some
positions with different conservation status between human
and mouse genomes. What factors result in these loci-
conserved differences? SRF proteins binding to a CArG
box have significant constraints on the structure of their
special target CArG box (Huet et al. 2005; Pellegrini et al.
1995; Stepanek et al. 2007). They probably also constrain
the adjacent positions surrounding the CArG box. Thus, the
mismatches in the orthologous SRF between human and
mouse may partly explain the differences of CArG flanking
sequences between human and mouse genomes.
In contrast to the flanking positions of consensus CArG
boxes, the flanking positions of CArG-like boxes are more
110 W. Wu et al.: Implication of CArG-SRF binding context
123
conserved, suggesting that given a low affinity of CArG-
like box binding with SRF, the flanking positions of the
CArG-like box would contribute more to SRF recognizing
and binding to the CArG-like box than those of the con-
sensus CArG box. In other words, the requirements are
more stringent on the flanking positions of the CArG-like
box than on those of the consensus CArG box, and there
should be some reasonable compensation in the flanking
positions for the CArG-like box binding with SRF, if the
consensus mutates 1 bp across the CArG box. Thus, we can
infer that the effect of natural selection is stronger on the
flanking sequences of the CArG-like box than on those of
the consensus CArG box. Besides, the functional CArG-
like box at regulatory regions in SRF target genes (Cooper
et al. 2007; Sun et al. 2006) often appears associated with
the occurrence of another CArG box or SRF cofactor
binding site, leading to an increase in the stability of the
CArG-like box binding with SRF when a third or even
fourth factor interacts to form a higher-order complex (De
Folter and Angenent 2006). This suggests that given a low
binding affinity of the CArG-like box with SRF, other SRF
or its cofactor could contribute to increasing the stability
and the flanking sequences. In addition, in these CArG-like
boxes, G is not observed at -4 and C is not observed at ?4.
Although there has been no direct experimental evidence
indicating that C-4 cannot mutate to G-4 or G?4 to
C?4, indirect evidence (Huet et al. 2005; Stepanek et al.
2007) has shown that the mutations C-5 ? G-5 or
C-5C-4 ? G-5G-4 can significantly alter the binding
stoichiometry of core-SRF, which leads us to conclude that
the CpG doublet at -4-5 or ?4?5 is prone to demolish
the curvature of 72� bound by SRF.
Interestingly, there are more significant associations (see
Table 4B) and more conserved positions (Table 1) down-
stream than upstream of the CArG boxes. A classical
experiment (Pellegrini et al. 1995) showed that the CArG
box is bent around the SRF by 72�, with the curvature
nonuniformly distributed around the dyad axis of the box,
implying that there are some different requirements for the
downstream region than for the upstream region. Besides,
given that the downstream region is closer to the TATA
box or TSS than the upstream region, the downstream
region should contribute more to making SRF interact
directly with the TFIIF of the RNA polymerase II holo-
enzyme (Joliot et al. 1995; Zhu et al. 1994). Taken toge-
ther, we suggest that the downstream region plays a
stronger role in mediating the regulation and expression of
SRF target genes.
Under the hypothesis of neutral mutation, the distribu-
tion of universal dinucleotides in intron sequences is
approximately equal to that in the CSBC. Differences
between the two distributions probably have been due to
factors related to natural selection, linkage, or spontaneous
mutation locus (Nachman and Crowell 2000; Walser et al.
2008). By DNA methyltransferase, most CpGs are meth-
ylated on the C residue and prone to spontaneous deami-
nation to T, then CpG contents should decrease with
evolutionary time, whereas TpG (or CpA) contents should
increase in negative correction (Bird 1980; Coulondre et al.
1978; Ehrlich and Wang 1981; Walser et al. 2008). In this
regard, it is no surprise that Table 3 shows these sequences
to have low CpG, high TpG, and CpA contents in common.
However, the ratio for CpG in CArG flanking sequences is
far greater than that in introns. To our knowledge, in
mammals, approximately 60% of all promoters contain
CpG islands that have a higher CpG content than the
genome average (Antequera 2003). This could account for
the higher CpG content in CArG flanking sequences than
that in introns. Together, the result shows that natural
selection constrains spontaneous mutation in CArG flank-
ing sequences, demonstrating again that CArG-SRF bind-
ing has a relationship with the adjacent positions
surrounding the CArG box.
In addition, sometimes the flanking sequences of the
CArG box not only help SRF recognize and bind to the
CArG box, they also contribute to the SRF cofactor’s
recognizing and binding to their corresponding DNA
binding sites adjacent to the CArG box. For example, the
ETS binding site (GGAT) is located 2 bp proximal to a
CArG box that is bound by SRF in the c-fos promoter
(Treisman 1986). Another example is that TCF binding site
is adjacent to a CArG box in the SM22 promoter (Cen et al.
2004). Both examples indicate that the expression of
CArG-containing genes is affected not only by SRF bind-
ing sites, but some, at least, are affected by their flanking
sequences and SRF cofactor’s binding site.
In summary, we characterized functional CArG boxes
and, in particular, their flanking sequences. We suggest that
these pre-existing features of CSBC contribute to helping a
CArG box form a characteristic spatial structure to be
recognized and bound by SRF. Furthermore, the study
would be an important step toward developing a reliable
method to predict an SRF binding site and improve
experimental analysis of SRF-mediated CArG-containing
gene transcription. Finally, what is more intriguing and
significant is that this study gives us a hint that the flanking
sequences of other transcriptional factor binding sites, such
as the Ets-binding site, the GATA binding site (EBS), and
the MyoD binding sites, would also have some special
features to be recognized correctly by their cognate tran-
scriptional factors.
Acknowledgments We are grateful to Zhuoran Huang, Mingjing
Zhang, Xiaoqian Jiang, and Hongxia Pang at the Bioinformatics
Center of Northwest A&F University for many useful discussions. We
also thank Professor Zhao Xu at the College of Science of Northwest
A&F University for his suggestions on the v2 test. We are also
W. Wu et al.: Implication of CArG-SRF binding context 111
123
grateful to Donna Elizabeth at the Department of Foreign Languages
of Northwest A&F University and Associate Professor Mengjun Liu
at the College of Agronomy of Northwest A&F University for cor-
recting the English version of the manuscript. Finally, we thank the
anonymous reviewers for their insightful suggestions and criticisms.
References
Alberti S, Krause SM, Kretz O, Philippar U, Lemberger T et al (2005)
Neuronal migration in the murine rostral migratory stream
requires serum response factor. Proc Natl Acad Sci USA
102:6148–6153
Antequera F (2003) Structure, function and evolution of CpG island
promoters. Cell Mol Life Sci 60:1647–1658
Arsenian S, Weinhold B, Oelgeschlager M, Ruther U, Nordheim A
(1998) Serum response factor is essential for mesoderm forma-
tion during mouse embryogenesis. EMBO J 17:6289–6299
Bell RD, Deane R, Chow N, Long X, Sagare A et al (2009) SRF and
myocardin regulate LRP-mediated amyloid-beta clearance in
brain vascular cells. Nat Cell Biol 11:143–153
Bird AP (1980) DNA methylation and the frequency of CpG in
animal DNA. Nucleic Acids Res 8:1499–1504
Cen B, Selvaraj A, Prywes R (2004) Myocardin/MKL family of SRF
coactivators: key regulators of immediate early and muscle
specific gene expression. J Cell Biochem 93:74–82
Chai J, Tarnawski AS (2002) Serum response factor: discovery,
biochemistry, biological roles and implications for tissue injury
healing. J Physiol Pharmacol 53:147–157
Cooper SJ, Trinklein ND, Nguyen L, Myers RM (2007) Serum
response factor binding sites differ in three human cell types.
Genome Res 17:136–144
Coulondre C, Miller JH, Farabaugh PJ, Gilbert W (1978) Molecular
basis of base substitution hotspots in Escherichia coli. Nature
274:775–780
De Folter S, Angenent GC (2006) trans meets cis in MADS science.
Trends Plant Sci 11:224–231
Ehrlich M, Wang RY (1981) 5-Methylcytosine in eukaryotic DNA.
Science 212:1350–1357
Fleige A, Alberti S, Grobe L, Frischmann U, Geffers R et al (2007)
Serum response factor contributes selectively to lymphocyte
development. J Biol Chem 282:24320–24328
Hendrix JA, Wamhoff BR, McDonald OG, Sinha S, Yoshida T et al
(2005) 50 CArG degeneracy in smooth muscle alpha-actin is
required for injury-induced gene suppression in vivo. J Clin
Invest 115:418–427
Huet A, Parlakian A, Arnaud MC, Glandieres JM, Valat P et al (2005)
Mechanism of binding of serum response factor to serum
response element. FEBS J 272:3105–3119
Iyer D, Chang D, Marx J, Wei L, Olson EN et al (2006) Serum
response factor MADS box serine-162 phosphorylation switches
proliferation and myogenic gene programs. Proc Natl Acad Sci
USA 103:4516–4521
Jabbari K, Bernardi G (2004) Cytosine methylation and CpG, TpG
(CpA) and TpA frequencies. Gene 333:143–149
Joliot V, Demma M, Prywes R (1995) Interaction with RAP74
subunit of TFIIF is required for transcriptional activation by
serum response factor. Nature 373:632–635
Kemp PR, Metcalfe JC (2000) Four isoforms of serum response factor
that increase or inhibit smooth-muscle-specific promoter activ-
ity. Biochem J 345(Pt 3):445–451
Koegel H, von Tobel L, Schafer M, Alberti S, Kremmer E et al (2009)
Loss of serum response factor in keratinocytes results in
hyperproliferative skin disease in mice. J Clin Invest 119:899–
910
Leung S, Miyamoto NG (1989) Point mutational analysis of the
human c-fos serum response factor binding site. Nucleic Acids
Res 17:1177–1195
Long X, Creemers EE, Wang DZ, Olson EN, Miano JM (2007)
Myocardin is a bifunctional switch for smooth versus skeletal
muscle differentiation. Proc Natl Acad Sci USA 104:16570–
16575
Mack CP, Thompson MM, Lawrenz-Smith S, Owens GK (2000)
Smooth muscle alpha-actin CArG elements coordinate formation
of a smooth muscle cell-selective, serum response factor-
containing activation complex. Circ Res 86:221–232
McDonald OG, Wamhoff BR, Hoofnagle MH, Owens GK (2006)
Control of SRF binding to CArG box chromatin regulates
smooth muscle gene expression in vivo. J Clin Invest 116:36–48
Miano JM (2003) Serum response factor: toggling between disparate
programs of gene expression. J Mol Cell Cardiol 35:577–593
Miano JM (2008) Deck of CArGs. Circ Res 103:13–15
Miano JM, Ramanan N, Georger MA, de Mesy Bentley KL, Emerson
RL et al (2004) Restricted inactivation of serum response factor
to the cardiovascular system. Proc Natl Acad Sci USA
101:17132–17137
Miano JM, Long X, Fujiwara K (2007) Serum response factor: master
regulator of the actin cytoskeleton and contractile apparatus. Am
J Physiol Cell Physiol 292:C70–C81
Nachman MW, Crowell SL (2000) Estimate of the mutation rate per
nucleotide in humans. Genetics 156:297–304
Niu Z, Yu W, Zhang SX, Barron M, Belaguli NS et al (2005)
Conditional mutagenesis of the murine serum response factor
gene blocks cardiogenesis and the transcription of downstream
gene targets. J Biol Chem 280:32531–32538
Parlakian A, Charvet C, Escoubet B, Mericskay M, Molkentin JD
et al (2005) Temporally controlled onset of dilated cardiomy-
opathy through disruption of the SRF gene in adult heart.
Circulation 112:2930–2939
Patten LC, Belaguli NS, Baek MJ, Fagan SP, Awad SS et al (2004)
Serum response factor is alternatively spliced in human colon
cancer. J Surg Res 121:92–100
Pellegrini L, Tan S, Richmond TJ (1995) Structure of serum response
factor core bound to DNA. Nature 376:490–498
Petit MM, Lindskog H, Larsson E, Wasteson P, Athley E et al (2008)
Smooth muscle expression of lipoma preferred partner is
mediated by an alternative intronic promoter that is regulated
by serum response factor/myocardin. Circ Res 103:61–69
Prywes R, Roeder RG (1987) Purification of the c-fos enhancer-
binding protein. Mol Cell Biol 7:3482–3489
Rensen SS, Niessen PM, Long X, Doevendans PA, Miano JM et al
(2006) Contribution of serum response factor and myocardin to
transcriptional regulation of smoothelins. Cardiovasc Res
70:136–145
Rozenberg JM, Shlyakhtenko A, Glass K, Rishi V, Myakishev MV
et al (2008) All and only CpG containing sequences are enriched
in promoters abundantly bound by RNA polymerase II in
multiple tissues. BMC Genomics 9:67
Shaw PE, Schroter H, Nordheim A (1989) The ability of a ternary
complex to form over the serum response element correlates
with serum inducibility of the human c-fos promoter. Cell
56:563–572
Shen X, Walsh B, Li JJ, Pang HX, Wang WJ et al (2009) The
correlations of the function and positional distribution of the cis-
elements CArG around the TSS in the genes of Mus musculus.
Genome 52:217–221
Shepelev V, Fedorov A (2006) Advances in the Exon-Intron Database
(EID). Brief Bioinform 7:178–185
112 W. Wu et al.: Implication of CArG-SRF binding context
123
Shore P, Sharrocks AD (1995) The MADS-box family of transcrip-
tion factors. Eur J Biochem 229:1–13
Stepanek J, Vincent M, Turpin PY, Paulin D, Fermandjian S et al
(2007) C ? G base mutations in the CArG box of c-fos serum
response element alter its bending flexibility. Consequences for
core-SRF recognition. FEBS J 274:2333–2348
Sun Q, Chen G, Streb JW, Long X, Yang Y et al (2006) Defining the
mammalian CArGome. Genome Res 16:197–207
Treisman R (1986) Identification of a protein-binding site that
mediates transcriptional response of the c-fos gene to serum
factors. Cell 46:567–574
Treisman R (1987) Identification and purification of a polypeptide
that binds to the c-fos serum response element. EMBO J 6:2711–
2717
Treisman R (1992) The serum response element. Trends Biochem Sci
17:423–426
Verger A, Duterque-Coquillaud M (2002) When Ets transcription
factors meet their partners. Bioessays 24:362–370
Wakaguri H, Yamashita R, Suzuki Y, Sugano S, Nakai K (2008)
DBTSS: database of transcription start sites, progress report
2008. Nucleic Acids Res 36:D97–D101
Walser JC, Ponger L, Furano AV (2008) CpG dinucleotides and the
mutation rate of non-CpG DNA. Genome Res 18:1403–1414
Workman CT, Yin Y, Corcoran DL, Ideker T, Stormo GD et al (2005)
enoLOGOS: a versatile web tool for energy normalized sequence
logos. Nucleic Acids Res 33:W389–W392
Yates F (1934) Contingency tables involving small numbers and the
v2 test. J R Stat Soc 1:217–235
Zhang SX, Garcia-Gras E, Wycuff DR, Marriot SJ, Kadeer N et al
(2005) Identification of direct serum-response factor gene targets
during Me2SO-induced P19 cardiac cell differentiation. J Biol
Chem 280:19115–19126
Zhu H, Joliot V, Prywes R (1994) Role of transcription factor TFIIF
in serum response factor-activated transcription. J Biol Chem
269:3489–3497
W. Wu et al.: Implication of CArG-SRF binding context 113
123