characteristics of the medical devices industry
TRANSCRIPT
2.Characteristics of the
Medical Devices Industry
An initial invention, however dramatic, needs many refinements before itis of widespread use. In the commercialisation of technology, the tortoiseswho carry out these refinements often beat the hares.
—The Economist

Contents
PageIntroduction . . . . . . . . . . . . . . . . . . . . . . . . . . . . . . . . . . . . . . . . . . . . . . . . . . . . . . . . . . 17Growth in the Medical Devices Industry . . . . . . . . . . . . . . . . . . . . . . . . . . . . . . . . . 17Diversity in Products.. . . . . . . . . . . . . . . . . . . . . . . . . . . . . . . . . . . . . . . . . . . . . . 22Characteristics of Medical Devices Manufacturers. . . . . . . . . . . . . . . . . . . . . . . . 25Concentration in the Medical Devices Industry . . . . . . . . . . . . . . . . . . . . . . . . . . . 28Innovation in Medical Devices .............. . . . . . . . . . . . . . . . . . . . . . . . . . . . 31International Competitiveness of U.S. Medical Devices . . . . . . . . . . . . . . . . . . . . 35Conclusions . . . . . . . . . . . . . . . . . . . . . . . . . . . . . . . . . . . . . . . . . . . . . . . . . . . . . . . . . . . 37
LIST OF TABLESTable No. Page
1. Current Dollar Value of Shipments of Medical Devices by SIC Code,Selected Years 1958-83 . . . . . . . . . . . . . . . . . . . . . . . . . . . . . . . . . . . . . . . . . . . . . . . 18
2. Real (1972) Dollar Value of Shipments of Medical Devicesby SIC Code, Selected Years 1958-83 . . . . . . . . . . . . . . . . . . . . . . . . . . . . . . . . 19
3. Growth in Medical Device Companies, Establishments, and Employmentby SIC Code, Selected Years 1963-82 . . . . . . . . . . . . . . . . . . . . . . . . . . . . . . 20
4. Number of Employees in the Medical Devices Industryby SIC Code, Selected Years 1958-83 . . . . . . . . . . . . . . . . . . . . . . . . . . . . . . . . 21
5. Percent Return on Assets for Medical Devices and Selected Industriesby IRS Category, Selected Years 1963-80. . . . . . . . . . . . . . . . . . . . . . . . . . . . . . 22
6. Growth in the Output and Employment of Selected Industries, 1963-82 .,.. 227. Products in the Medical Devices Industry by SIC Code . . . . . . . . . . . . . . . . . . 238. Sales of Selected Medical Devices to Hospitals by SIC Code, 1982 . . . . . . . . 259. Medical Devices in an Internist’s Office . . . . . . . . . . . . . . . . . . . . . . . . . . . . . . 26
10. Size of Employment in Medical Devices Establishmentsby SIC Code, 1977 . . . . . . . . . . . . . . . . . . . . . . . . . . . . . . . . . . . . . . . . . . . . . . . . 27
11. Market Share of Value of Medical Devices Shipmentsby Establishment Size, 1977, 1972, and 1963.. . . . . . . . . . . . . . . . . . . . . . . . . 27
12. Price-Cost Margins of Medical Devices Establishmentsby Employee Size, 1977 . . . . . . . . . . . . . . . . . . . . . . . . . . . . . . . . . . . . . . . . . . . . 28
13. Market Share of Value of Medical Devices Shipmentsby Leading Companies, 1977 and 1963.... . . . . . . . . . . . . . . . . . . . . . . . . . . . . 29
14, Leading Companies’ Market Share of Hospital Salesof Medical Devices, 1982 . . . . . . . . . . . . . . . . . . . . . . . . . . . . . . . . . . . . . . . . . . . . 30
15. Eight Leading Companies in Hospital Sales of Medical Devices in Threeor More Product Categories, 1982 . . . . . . . . . . . . . . . . . . . . . . . . . . . . . . . . . . . . 30
16. U.S. and Foreign Medical Devices Patents Granted by U.S. Patent Officeby Application Date, 1968-79 . . . . . . . . . . . . . . . . . . . . . . . . . . . . . . . . . . . . . . . 34
17. U.S. and Foreign Medical Devices Patents Granted by U.S. Patent Officeby Source and Selected Categories, 1968-79. . . . . . . . . . . . . . . . . . . . . . . . . . . . 35
18. U.S. Exports and Imports of Medical Devices by SIC Code, 1979-83. . . . . . . 36

2.Characteristics of the
Medical Devices Industry
INTRODUCTIONIn recent decades, the industry that manufac-
tures medical devices has experienced continuousgrowth and change. As increased health insurancecoverage has expanded purchasing power formedical care, the market for medical devices hasgrown correspondingly. Growth has occurred notonly in the number of companies and employeesworking in the field, but also in the range of prod-ucts developed and marketed. Throughout all fac-ets of medical care—from diagnostic imaging andsurgery to dentistry and optometry-devices un-known a generation or even a decade ago are nowpart of routine practice.
This chapter presents the most notable featuresof the medical devices industry. Besides the dy -
namic nature of the field, several themes emerge.One is great diversity, both in the medical devicesthat are marketed and in the companies that makethem. Underlying the diversity in products is thehigh level of innovation. Another theme is that,more than in many other U.S. industries, smallfirms are particularly important in developing andproducing medical devices. U.S. medical devicesappear to be quite competitive internationally.Despite the diversity in companies and products,however, the concentration of production in med-ical devices is about the same as it is in a typicalindustry, i.e., a relatively small number of com-panies account for a sizable share of the market.
GROWTH IN THE MEDICAL DEVICES INDUSTRYDuring the past 25 years, sales (value of ship-
ments) of products in the five Standard IndustrialClassification (SIC) codes representing medicaldevices have grown from less than $1 billion tomore than $17 billion, an annual increase of morethan 12 percent (table 1). The growth has beenenormous, even when expressed in real dollars,which are intended to take account of price changesl
(table 2). By 1982, sales in real dollars had reachedsix times the 1958 level, having risen at an aver-age annual rate of 8 percent.
Growth in sales appears to have acceleratedafter 1963, a period which coincided with the earlyyears after implementation of the Medicare and
1Like most price indexes, those of the Department of Commercemeasure annual price changes in a market basket of devices thatwere specified in 1972 (369). A common problem with such indexesis their inability to take into account price changes associated withthe introduction of new products and with changes in productquality. This problem is particularly acute for medical devices, whichhave experienced constant and dramatic change.
Medicaid programs in 1966. From 1966 to 1982,total U.S. expenditures on personal health carein real dollars grew at an average annual rate of5 percent, and those of the Medicare programalone at 18.5 percent.
Although the start of Medicare and Medicaidwas the most notable change, both private andpublic third parties have accounted for an increas-ing share of the growing expenditures on personalhealth care—from 35 percent in 1950 (12 percentprivate, 12 percent State and local, 10 percent Fed-eral) to 51 percent in 1966 (25 percent private, 12percent State and local, 13 percent Federal) and69 percent in 1982 (28 percent private, 11 percentState and local, 29 percent Federal) (128). Al-though the exact relationship has not been doc-umented, growth in health care expenditures ex-panded the market for products such as medicaldevices that are used in the course of deliveringthat care (see ch. 3).
17

Table I.—Current Dollar Value of Shipments of Medical Devices by SIC Code, Selected Years 1958-83a
Current dollar value of shipments (in millions) Annual percentage changeb
X-ray and Surgical Surgical Dentalelectro- and appliances equipment X-ray and Surgical Surgical Dentalmedical medical and and Ophthalmic electro- and appliances equipment
equipment instruments supplies supplies goods medical medical and and OphthalmicYear (Sic 3693) (Sic 3841) (Sic 3842) (Sic 3843) (SIC 3851) Total equipment instruments supplies supplies goods Total
1983 c . . . . $5,500 $4,590 $6,140 $1,180 N Ad
$17,410e 21% 12% 90/0 70/ 0 — 13%e
1982 . . . . . 4,557 4,114 5,642 1,107 $1,358 16,778 42 30 19 -16 8 231981 . . . . . 3,203 3,158 4,734 1,314 1,263 13,672 27 17 23 5 4 181980 . . . . . 2,527 2,697 3,861 1,252 1,212 11,549 10 14 14 17 8 131977 . . . . . 1,885 1,833 2,597 787 972 8,074 34 14 12 14 11 161972 ..., . 444 962 1,454 409 568 3,8371967 . . . . .
14 15 12 13 6 12233 475 838 221 426 2,193 13 14 9 11 12 11
1 9 6 3 . . 144 284 597 148 273 1,446 9 17 5 5 7 81958 . . . . . 95 130 462 116 194 997 – — — — — —
aFor a Iwtlng of products In the Standard industrial Classification (SIC) codes used, see table 7‘For Inconsecutwe years, the compound annual growth rate, the annual rate of growth that makes the present value compound forward to equal a speclfled future value, was calculated.
‘AA = [( FVIPV)l IN – 1] 100, where O/OA = compound annual growth rateFV = future value (the value at the end of N compounding periods)PV = present valueN = total number of compounding periods
cPreliminary estimates.dNA Indicates information not available.‘Total does not include shipments of ophthalmic goods.
SOURCES: U.S. Department of Commerce, Bureau of Industrial Economics, Capital, Energy, and Productivity Studies Division, Washington, DC, unpublished data, January 1984; P. Marcus, U.S. Department of Commerce,Washin ton, DC, personal communication, Janua
8~ 1984; U.S. De partment of Commerce, Bureau of the Census, 7982 Census of kfamfacwres, Preliminary Report Industry Series, MC82-I-38F-3(P),
MC82-I- 8B-l(P), MC82-I-38B-2(P), MC82-I-38B-3(P), M 82-I-38 B-4(P), 1984; and E. Arakaki, U.S. Department of Commerce, Washington, DC, personal communication, August 1984.

Table 2.–Real (1972) Dollar Value of Shipments of Medical Devices by SIC Codea, Selected Years 1958=83
Real (1972) dollar value of shipments (in millions) Annual percentage changeb
X-ray and Surgical Surgical Dentalelectro- and appliances equipment X-ray and Surgical Surgical Dentalmedical medical and and Ophthalmic electro- and appliances equipment
equipment instruments supplies supplies goods medical medical and and OphthalmicYear (SIC 3693) (sic 3841) (Sic 3842) (Sic 3843) (SIC 3851) Total equipment instruments supplies supplies goods Total
1983C . . . . $2,145 $2,050 $2,975 $540 N Ad
$7,710’ 150% 70% 70% 20% 9%e
1982 . . . . . 1,858 1,915 2,790 528 $757 7,848 35 21 19 -20 8 181981 . . . . . 1,374 1,587 2,337 659 704 6,661 14 6 16 -4 -4 91980 . . . . . 1,210 1,494 2,007 685 735 6,131 -1.7 5 7 7 1 41977 . . . . . 1,274 1,273 1,649 564 707 5,467 23 6 3 7 4 71972 . . . . . 444 962 1,454 409 568 3,837 11 10 12 3 91967 . . . . . 311 568 920 234 479 2,512 9 11 7 10 11 91963. 217 377 705 160 312 1,771 8 15 5 4 6 71958 . . . . . 150 184 549 130 231 1,244 — — — — — —aFor a listing of products in the SIC categories used, see table 7“For inconsecutive years the compound annual growth rate, the annua! rate of growth that makes the present value compound forward to equal a specified future value. was calculated
0/0 J = [( FVIPV)l ‘N – 1 ] 100 where O/OA = compound annual growth rateFV = future value (the value at the end of N compounding periods)PV = present value
N = total number of compounding periods
cPreiiminary estimates.dNA indicates information not available.‘Total does not include shipments of ophthalmic goods.
SOURCES: U.S Department of Commerce, Bureau of Industrial Economics, Capital, Energy, and Productivity Studies Division, Washin ton, DC, unpublished data, January 1984; P. Marcus, U.S. Department of Commerce,Washington, DC, personal communication, January 1%34; M. Pavliscak, U.S. Department of Commerce, Washington, DC, persona communication, June 19S4; and E. Arakakl, U.S. Department of Commerce, Washington,fDC, personal communication, August 19S4.

20 ● Federal Policies and the Medical Devices Industry
All segments of the medical devices industryhave benefited from this growth, some more thanothers (tables 1 and 2). Most medical devices fallinto one of five SIC codes of the Department ofCommerce: 3693, X-ray, electromedical, andelectrotherapeutics equipment; 3841, surgical andmedical instruments; 3842, orthopedic, prosthetic,and surgical appliances and supplies; 3843, den-tal equipment and supplies; and 3851, ophthal-mic goods.2
2The most comprehensive statistics on the medical devices industrycome from the Census of Manufactures, which is conducted by theBureau of the Census in the Department of Commerce. The datarelate to domestic production by U.S. and foreign companies oper-ating in the United States. A complete census is conducted every
5 years and an Annual Survey of a sample in intervening years. Prod-ucts are categorized by Standard Industrial Classification (SIC) codes.Establishments are assigned to SIC “industries” on the basis of theirprimary line of business. A 1980 sample of 1,891 manufacturingestablishments registered with the Bureau of Medical Devices in theFood and Drug Administration (FDA) fell into 162 SIC codes: 47percent into the 5 major medical devices codes, which included anaverage of 177 establishments per code; 37 percent into 25 otherSIC codes, each with 10 or more establishments; and 16 percent into132 other SIC codes, each with fewer than 10 establishments (393).It can therefore be inferred that the establishments in the five medi-cal devices codes account for a greater volume of medical devicesproduction than those in other codes. Nevertheless, data by estab-lishment from the five medical devices SIC codes exclude someestablishments and perhaps some devices of multiproduct establish-ments whose primary products fall into other categories.
In addition, the FDA sample lists 47 establishments in SIC 2831,biological (393). Diagnostic substances and other biological rep-resent about 45 percent of all shipments in SIC 2831 (363), but thedata are not sufficiently detailed to permit separation of these med-ical devices products from other biologics, such as blood andvaccines.
SIC data on product shipments, however, include shipments ofall medical devices, both those produced by establishments classifiedin the five medical devices codes and those classified in other codes(393).
In both current and real dollars, sales of prod-ucts in SIC codes 3693, 3841, and 3842 are muchgreater than sales of dental equipment and sup-plies and ophthalmic goods. Not only are salesin these three codes the largest in absolute terms,but they have also experienced the highest ratesof increase, especially since 1980. SIC 3842 (sur-gical appliances and supplies), the category withthe greatest sales, has had the highest growthrates, followed closely by SIC 3693 (X-ray, elec-tromedical, and electrotherapeutics equipment).The tremendous growth in SIC 3693 from 1972to 1977 may be somewhat overstated; in 1977,products misclassified in other SIC codes, mainly3841, were assigned to 3693 (393).
Increases in the number of companies (firms)and establishments (plants) have paralleled the in-creases in sales (see table 3). From 1963 to 1982,SIC 3693 (X-ray and electromedical equipment),with annual rates of about 7 and 8 percent respec-tively, experienced the greatest rate of increase incompanies and establishments. During this period,the other four SIC codes had annual increasesranging from about 2 to 6 percent. In all five med-ical devices codes, firms entering a field have thusexceeded those exiting.
By 1982, employment in the establishments inthe SIC medical devices codes had exceeded200,000, a 68-percent increase over the 129,500employed in 1972 (see table 4). SIC 3693 (X-rayand electromedical equipment) again had thegreatest rates of increase, reflecting the hugegrowth in production and facilities during thedecade.
Table 3.–Growth in Medical Device Companies, Establishments, and Employment by SIC Codea, 1963-82
1982 levels (number) 1963-1982 compound annual growth rate
EmploymentSIC industry segment Companies Establishments (thousands) Companies Establishments Employment
Total . . . . . . . . . . . . . . . . . . . . . . 2,986 3,361 217.5 4.4% 4.0% 5.6%SIC 3693: X-ray and
electromedicalequipment . . . . . . . . . . . . . . . 205 260 49.2 7.1 8.2 11.5
SIC 3841: Surgical andmedical instruments . . . . . . 767 858 57.4 5.9 5.8 7.3
SIC 3842: Surgical appliancesand supplies . . . . . . . . . . . . . 1,212 1,365 68.6 4.5 3.5 4.8
SIC 3843: Dental equipmentand supplies . . . . . . . . . . . . . 435 474 15.4 2.6 2.2 3.5
SIC 3851: Ophthalmicgoods . . . . . . . . . . . . . . . . . . . 367 404 26.9 3.0 3.0 1.5
at=or a listing of products in the SIC categories used, see table 7.
SOURCES: U.S. Department of Commerce, Bureau of the Census, 1$%3 Census of Manufactures, Industry Series, MC63-I-36E and MC634-38A, 7982 Census of Marrufac-tures, Preliminary Report Industry Series (Washington, DC: U.S. Government Printing Office, 1966 and 1984).
Ch. 2—Characteristics of the Medical Devices Industry ● 2 1
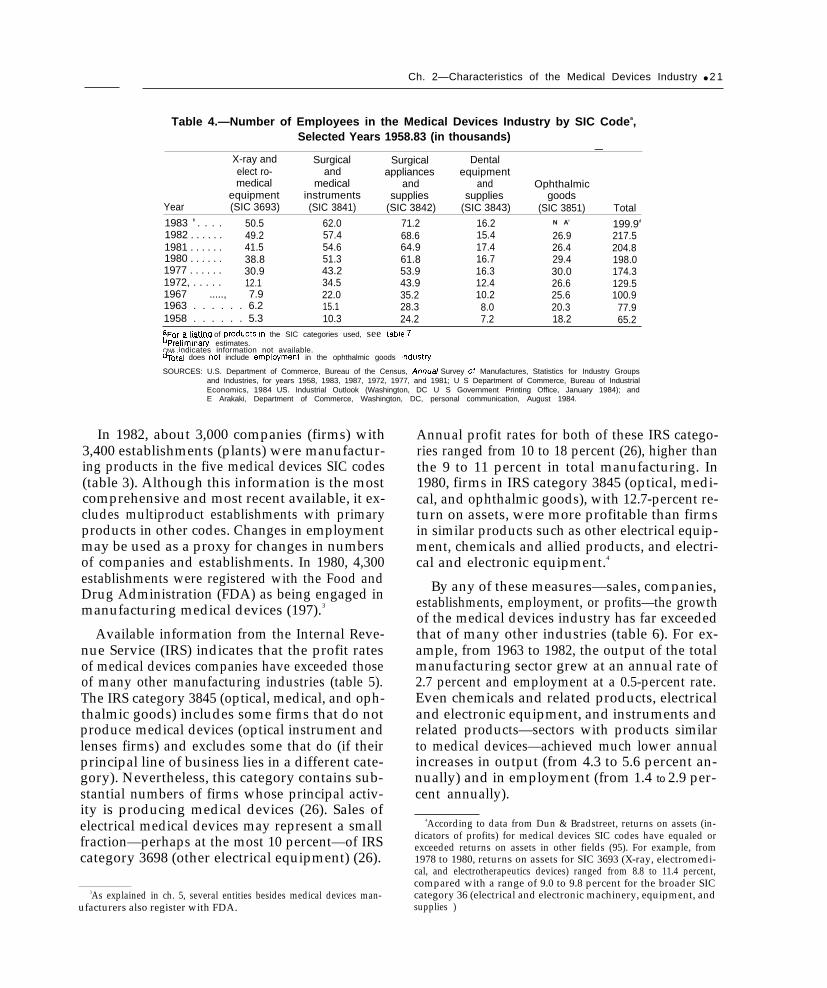
Table 4.—Number of Employees in the Medical Devices Industry by SIC Codea,Selected Years 1958.83 (in thousands)
X-ray and Surgical—
Surgical Dentalelect ro- and appliances equipmentmedical medical and and Ophthalmic
equipment instruments supplies supplies goodsYear (SIC 3693) (SIC 3841) (SIC 3842) (SIC 3843) (SIC 3851) Total1983 b . . . . 50.5 62.0 71.2 16.2 N Ac 199.9d
1982 . . . . . . 49.2 57.4 68.6 15.4 26.9 217.51981 . . . . . . 41.5 54.6 64.9 17.4 26.4 204.81980 . . . . . . 38.8 51.3 61.8 16.7 29.4 198.01977 . . . . . . 30.9 43.2 53.9 16.3 30.0 174.31972, . . . . . 12.1 34.5 43.9 12.4 26.6 129.51967 ....., 7.9 22.0 35.2 10.2 25.6 100.91963 . . . . . . 6.2 15.1 28.3 8.0 20.3 77.91958 . . . . . . 5.3 10.3 24.2 7.2 18.2 65.2aFor a listing of proctucts In the SIC categories used, see table 7bPreliminary estimates.CNA indicates information not available.dTotal does not include employment in the ophthalmic goods Industry.
SOURCES: U.S. Department of Commerce, Bureau of the Census, Annual Survey of Manufactures, Statistics for Industry Groupsand Industries, for years 1958, 1983, 1987, 1972, 1977, and 1981; U S Department of Commerce, Bureau of IndustrialEconomics, 1984 US. Industrial Outlook (Washington, DC U S Government Printing Office, January 1984); andE Arakaki, Department of Commerce, Washington, DC, personal communication, August 1984.
In 1982, about 3,000 companies (firms) with3,400 establishments (plants) were manufactur-ing products in the five medical devices SIC codes(table 3). Although this information is the mostcomprehensive and most recent available, it ex-cludes multiproduct establishments with primaryproducts in other codes. Changes in employmentmay be used as a proxy for changes in numbersof companies and establishments. In 1980, 4,300establishments were registered with the Food andDrug Administration (FDA) as being engaged inmanufacturing medical devices (197).3
Available information from the Internal Reve-nue Service (IRS) indicates that the profit ratesof medical devices companies have exceeded thoseof many other manufacturing industries (table 5).The IRS category 3845 (optical, medical, and oph-thalmic goods) includes some firms that do notproduce medical devices (optical instrument andlenses firms) and excludes some that do (if theirprincipal line of business lies in a different cate-gory). Nevertheless, this category contains sub-stantial numbers of firms whose principal activ-ity is producing medical devices (26). Sales ofelectrical medical devices may represent a smallfraction—perhaps at the most 10 percent—of IRScategory 3698 (other electrical equipment) (26).
3As explained in ch. 5, several entities besides medical devices man-ufacturers also register with FDA.
Annual profit rates for both of these IRS catego-ries ranged from 10 to 18 percent (26), higher thanthe 9 to 11 percent in total manufacturing. In1980, firms in IRS category 3845 (optical, medi-cal, and ophthalmic goods), with 12.7-percent re-turn on assets, were more profitable than firmsin similar products such as other electrical equip-ment, chemicals and allied products, and electri-cal and electronic equipment.4
By any of these measures—sales, companies,establishments, employment, or profits—the growthof the medical devices industry has far exceededthat of many other industries (table 6). For ex-ample, from 1963 to 1982, the output of the totalmanufacturing sector grew at an annual rate of2.7 percent and employment at a 0.5-percent rate.Even chemicals and related products, electricaland electronic equipment, and instruments andrelated products—sectors with products similarto medical devices—achieved much lower annualincreases in output (from 4.3 to 5.6 percent an-nually) and in employment (from 1.4 to 2.9 per-cent annually).
4According to data from Dun & Bradstreet, returns on assets (in-dicators of profits) for medical devices SIC codes have equaled orexceeded returns on assets in other fields (95). For example, from1978 to 1980, returns on assets for SIC 3693 (X-ray, electromedi-cal, and electrotherapeutics devices) ranged from 8.8 to 11.4 percent,compared with a range of 9.0 to 9.8 percent for the broader SICcategory 36 (electrical and electronic machinery, equipment, andsupplies )

22 . Federal Policies and the Medical Devices Industry— — . — . .
Table 5.—Percent Return on Assetsa for Medical Devicesand Selected Industries by IRS Category, Selected Years 1963-80
Optical, medical Other Chemicals Electricaland ophthalmic electrical Total and allied and electronic
goods b equipment manufacturing products equipmentYear (IRS 3845) (IRS 3698) (IRS 40) (IRS 17) (IRS 25)
1980 . . . . . . 12.70/o 11 .0%0 10.50/0 11.29’0 9.6%1977 . . . . . . 14.5 11.2 10.6 12.5 10.51972 . . . . . . 13.1 9.6 8.8 11.3 7.71967 . . . . . . 17.9 13.6 10.2 12.8 11.41963 . . . . . . 12.1 12.9 10.2 14,0 9.5
aPercent return on assets =Net income (less deficit) + interest paid
Total assetsNet income (less deficit) equals “total receipts less total deductions” less “Interest on State and local Government obligations”
Ius “constructive taxable income from related forei n corporations:’~he IRS minor industry 3845 (optical, medical and op%halmic goods) includes firms that would declassified in SICcategories383 0 tical instruments and lenses), 364 (surgical, medical, and dental instruments and supplies), and 365 (ophthalmic goods).
cThe\F&minorindustry 3698 (other electrical equipment) includes firms that would declassified in SICcategories 361 (electrictransmission and distribution equipment), 362 (electrical industrial apparatus), 364 (electric lighting and wiring equipment), and369 (miscellaneous electrical machinery, equipment, and supplies).
SOURCES: U.S. Department of the Treasury, Internal Revenue Service, Sourcebook of Statistics of hmorne, for years 1963, 1967,1972, 1977, and 19~; Corporation Income T= Returns, statistics of income, for years 1963, 1967, 1972, 1977, and 1960;A General Description of the Corporation Source Book, publication 647, revised June 1983.
Table 6.—Growth in the Output and Employment ofSelected Industries, 1963=82
1963-82 compoundannual growth rate
Industrial sector Output Employment
Total manufacturing . . . . . . 2.7% 0.5%Chemicals and
allied products . . . . . . . . 4.3 1.4Electrical and
electronic equipment . . . 5.6 1.5Instruments and
related products . . . . . . . 5.6 2.9
SOURCES: U.S. Department of Commerce, Bureau of Industrial Economics, 1984U.S. /ndustria/ Outlook (Washington, DC: U.S. Government PrintingOffice, January 1984); and V. Kettering, U.S. Department of Com-merce, Bureau of Industrial Economics, Washington, DC, personalcommunication, February 1984.
DIVERSITY IN PRODUCTSThe devices included in the five major SIC
codes illustrate the wide range of products, notonly across codes but within each code as well(table 7). SIC 3842 encompasses disposable sup-plies such as surgical drapes and adult diapers aswell as wheelchairs and prostheses. And togetherthe different codes include pacemakers, hospitalfurniture, and materials for dentures.
Table 8 presents 1982 sales of selected medicaldevices to U.S. hospitals. These data are nationalestimates that IMS America, Ltd., has compiled
The Department of Commerce has ranked sev-eral of the medical devices SIC codes in the top50 codes whose growth in 1984 is predicted to ex-ceed their 1972-81 peak: 3842, orthopedic, pros-thetic, and surgical appliances and supplies, as9th; 3693, X-ray, electromedical, and electrothera-peutic equipment, as 11th; 3841, surgical andmedical instruments, as 13th; 2831, biologicalproducts, as 24th; and 3843, dental equipment andsupplies, as 47th (369).
for OTA from the purchases of a sample of hos-pitals. Because the IMS data include only devicesthat are purchased frequently enough to permitstatistical estimation, many expensive devices thatare rarely purchased by individual hospitals, suchas computed tomography (CT) scanners, do notappear.
Almost half of personal health care expendi-tures in the United States relate to hospital care(128), and hospitals-use devices more intensivelythan other health care settings. Thus, the data intable 8 give some indication of the size of the mar-

Ch. 2—Characteristics of the Medical Devices Industry ● 2 3
Table 7.—Products in the Medical Devices Industry by SIC Codea
SIC code/products SIC code/products
3693—X-ray, electromedical, and electrotherapeuticsapparatus
Irradiation (ionizing radiation) equipment, including X-ray,beta ray, gamma ray, and nuclear (medical, dental,industrial, and scientific)Medical X-ray equipment:
DiagnosticTherapeutic
Dental X-ray equipmentIndustrial and scientific X-ray equipment, excluding
gamma and beta ray equipmentX-ray equipment accessoriesX-ray tubes (sold separately)Parts for X-ray equipment (sold separately)All other ionizing radiation equipment, including
gamma and beta ray equipment, excludingaccelerators, cyclotrons, etc.
Irradiation (ionizing radiation) equipment, including X-ray, beta ray, gamma ray, and nuclear (medical,dental, industrial, and scientific), n.s.k.
Electromedical equipment, including diagnostic,therapeutic, and patient monitoring, but excludingionizing radiation equipmentDiagnostic:
Electrocardiograph (ECG)Electroencephalograph (EEG)Electromyograph (EMC)Ultrasonic scanning devicesAutomated blood and body fluid analyzersAudiological equipmentEndoscopic equipment (bronchoscope, cystoscope,
proctosigmoidoscope, colonoscope, etc.)Respiratory analysis equipmentAll other diagnostic equipment
Therapeutic:PacemakersDefibrilIatorsElectrosurgical equipmentDiathermy apparatus (short wave and microwave)DialyzersUltrasonic therapeutic equipmentAll other therapeutic equipment
Patient monitoring:Intensive care/coronary care units, including
component modules such as temperature, bloodpressure, and pulse
Perinatal monitoringRespiratory monitoringAll other patient monitoring equipment
Surgical support systems:Heart-lung machines, excluding iron lungsBlood-flow systemsAll other surgical support systems
Parts and accessories for diagnostic, therapeutic,monitoring, and surgical support systems (soldseparately)
Electromedical equipment, including diagnostic,therapeutic, and patient monitoring, but excludingionizing radiation equipment, n.s.k.
X-ray, electromedical and electrotherapeutics apparatus,n.s.k., typically for establishments with more than 5employees
X-ray, electromedical and electrotherapeutics apparatus,n.s.k., typically for establishments with less than 5employees
3641-Surgical and medical instruments and apparatusSurgical instruments, including suture needles, and eye, ear,
nose, and throat instrumentsOrthopedic instruments, such as bone drills and bone
plates, excluding eye, ear, nose, and throat instrumentsDiagnostic apparatus:
Metabolism and blood pressureOptical diagnosticOther
Syringes:Other than hypodermicHypodermic:
Uniquely designed for prebillingOther
Hypodermic needlesAnesthesia apparatus, instruments, and partsOxygen tentsVeterinary instrumentsBlood transfusion and intravenous equipmentBlood donor kitsMechanical therapy appliances and parts thereofOther surgical and medical instrumentsSurgical and medical instruments, n.s.k.
Hospital furniture, excluding beds and chairsOperating room furniture, including tables, cases,
cabinets, etc.Patient room furniture, including cabinets, overbed tables,
desks, dressers, etc., but excluding beds and chairsOther hospital furniture, excluding operating and patient
room furniture, beds, and instruments, but includingcases, tables, bassinets, chart racks, backrests, etc.
Hospital furniture, n.s.k.Surgical and medical instruments, n.s.k. typically for
establishments with 5 employees or moreSurgical and medical instruments, n.s.k., typically for
establishments with less than 5 employees
3642-Surgical appliances and suppliesSurgical, orthopedic, and prosthetic appliances and supplies
Orthopedic appliances (braces), including partsSterilizers (hospital and surgical), excluding dental
sterilizersSurgical dressings:
Bandages, elasticBandages, other, including muslin, plaster of paris, etc.
but excluding self-adhering bandagesAdhesive plaster, medicated and nonmedicated,
including self-adhering bandagesGauze (absorbent and packing)Cotton, including cotton balls (sterile and nonsterile)Other surgical dressings, including sponges,
compresses, pads, etc.Disposable surgical drapes, including O/B and O/R packsDisposable incontinent pads, bed pads, and adult diapersSterile surgical sutures:
AbsorbableNonabsorbable
Artificial limbs (prosthetic), including partsElastic stockings

24 • Federal Policies and the Medical Devices Industry
Table 7.—Products in the Medical Devices Industry by SIC Code—continued
SIC code/products SIC code/products
Elastic braces, suspensories, and other elastic supportsArch supports and other foot appliancesCorn remover pads, bunion pads, etc.Breathing devices, excluding anesthetic apparatus but
including incubators, respirators, resuscitators,inhalators, etc.
Surgical corsetsCrutches, canes, and other walking assistance devicesSplints and trussesWheel chairsOther surgical orthopedic, and prosthetic appliances and
suppliesSurgical, orthopedic, and prosthetic appliances and
supplies, n.s.k.Personal industrial safety devices
Respiratory protection equipment, including gas masks,abrasive masks, canister masks, etc.
Eye and face protection devices, including face shields,hoods, and welding helmets and masks, but excludingindustrial goggles and eye protectors
Protective clothing, except shoesFirst aid snake bite and burn kits, both household and
industrial typesOther personal safety devicesPersonal industrial safety devices, n.s.k.
Hearing aids, electronic:Hearing aids, electronic
Surgical appliances and supplies, n.s.k., typically forestablishments with 5 employees or more
Surgical appliances and supplies, n.s.k., typically forestablishments with less than 5 employees
3843-Dental equipment and suppliesDental metals:
PreciousNonprecious
Dental alloys for amalgamsTeeth, excluding dentures:
PorcelainOther, including resinous and plastic
Denture-base materialsDental chairsInstrument delivery systems (dental units)Dental hand piecesOther dental professional equipment, except X-rayDental laboratory equipment, including furnaces, casting
machines, lathes, benches, polishing units, flasks,blowpipes, presses, etc.
Dental hand instruments (forceps and pliers, brosches,cutting instruments, etc.)
Burs, diamond points, abrasive points, wheels, disks, andsimilar tools for use with hand pieces
Dental cements and other non-metallic filling materialsWaxes, dental gypsums, and other consumable suppliesOther dental products including sterilizers, but excluding X-
ray equipmentDental equipment and supplies, n.s.k., typically for
establishments with 5 employees or moreDental equipment and supplies, n.s.k., typically for
establishments with less than 5 employees
3851-Ophthalmic goodsOphthalmic fronts and temples
Fronts, finished (with or without decoration), and temples:Gold filled fronts (full rimmed, semirimless, or rimless)Aluminum and other base metal frontsPlastic frontsCombination fronts
Temples, all typesOphthalmic fronts and temples, n.s.k.
Glass ophthalmic focus lensesSingle vision lenses (ground and polished and moulded
blanks)Multifocal lenses:
BifocalsTrifocals and double segments
Glass ophthalmic focus lenses, n.s.k.Plastic ophthalmic focus lenses
Single vision lensesMultifocal lensesPlastic ophthalmic focus lenses, n.s.k.
Contact lensesConventional (hard)softContact lenses, n.s.k.
Other ophthalmic goods, n.e.c.Centers, oxfords, parts, trims, etc.Ophthalmic spectacles and eyeglasses (frames and
mountings of all types when sold with correctivelenses inserted, with or without decoration)
Industrial goggles, eye protectors, welding circles andplates, mountings, and parts
Sun or glare glasses and sungoggles, ready-madeNonfocus fashion tinted lenses, plastic and glassOther ophthalmic goods and accessories (sunglass
frames, single readers and magnifiers, holders,gas mask inserts, etc.)
All other ophthalmic goods, n.s.k.Ophthalmic goods, n.s.k., typically for establishments with 5
employees or moreOphthalmic goods, n.s.k., typically for establishments with
less than 5 employees
an,e,c,—Not elsewhere classified.n,s.k.—Not specified In kind.
SOURCE: U.S. Department of Commerce, Bureau of the Census, Annual Survey of Manufactures, Statistics for Industry Groups and Industries, 1977,

Ch. 2—Characteristics of the Medical Devices Industry • 25
Table 8.–Sales of Selected Medical Devices to Hospitals by SIC Code, 1982
Sales to Sales tohospitals hospitals(thousands (thousands
SIC code/product of dollars) SIC code/product of dollars)
X-ray and electromedical equipment(SIC 3693)X-ray supplies . . . . . . . . . . . . . . . . . . . . . . . .Radiological catheters and
guide wire. . . . . . . . . . . . . . . . . . . . . . . . . .Pacemakers and other
cardiovascular products. . . . . . . . . . . . . .Electrosurgical supplies . . . . . . . . . . . . . . .
Surgical and medical instruments (SIC 3841)Surgeons’ needles . . . . . . . . . . . . . . . . . . . .Blood collection supplies . . . . . . . . . . . . . .Thermometers . . . . . . . . . . . . . . . . . . . . . . . .Surgical instruments . . . . . . . . . . . . . . . . . .Syringes and needles . . . . . . . . . . . . . . . . .Catheters, tubes, and allied products . . . .Diagnostic instruments . . . . . . . . . . . . . . . .
Surgical appliances and supplies (SIC 3842)
Ostomy products ..........................................Surgical packs and parts . . . . . . . . . . . . . . .Maternity products . . . . . . . . . . . . . . . . . . . .Dialysis supplies . . . . . . . . . . . . . . . . . . . . . .Cardiopulmonary supplies. . . . . . . . . . . . . .Sponges . . . . . . . . . . . . . . . . . . . . . . . . . . . . .
$ 777,366
135,878
499,99948,552
4,31057,84531,426
294,284331,054235,44569,549
286,63513,842
174,12326,86997,67771,176
174,768
Bandages, dressings and elastic . . . . . . . .Orthopedic supplies . . . . . . . . . . . . . . . . . . .Parenteral supplies . . . . . . . . . . . . . . . . . . . .Urological products . . . . . . . . . . . . . . . . . . .Sterilizer supplies . . . . . . . . . . . . . . . . . . . . .Cast room supplies . . . . . . . . . . . . . . . . . . .Disposable kits and trays ... , . . . . . . . . . .Respiratory therapy. . . . . . . . . . . . . . . . . . . .Garments, textiles, and gloves . . . . . . . . . .
172,303302,283701,106198,97088,84639,836
258,317245,890592,254
Ophthalmic goods (SIC 3851)Ophthalmic-related products. . . . . . . . . . . . 83,649
OtherSolutions . . . . . . . . . . . . . . . . . . . . . . . . . . . .Medical supplies . . . . . . . . . . . . . . . . . . . . . .Chemicals and soaps . . . . . . . . . . . . . . . . . .Paper products . . . . . . . . . . . . . . . . . . . . . . .Gases . . . . . . . . . . . . . . . . . . . . . . . . . . . . . . .Underpads . . . . . . . . . . . . . . . . . . . . . . . . . . .Identification supplies . . . . . . . . . . . . . . . . .Elastic goods . . . . . . . . . . . . . . . . . . . . . . . . .Rubber goods . . . . . . . . . . . . . . . . . . . . . . . .
Total. . . . . . . . . . . . . . . . . . . . . . . . . . . . . . . .
872,985420,702153,946113,738109,93355,25931,51724,932
7,281$7,804,545
SOURCE: IMS America, Ltd. Rockville, MD, unpublished data, 1983.
ket for different devices. The highest sales to hos- Nondurable products are even more prominentpitals are of disposable or nondurable items, such among the medical devices in a physician’s office.as X-ray supplies and garments, textiles, and Table 9 lists the medical devices in an office ofgloves. For many of the devices with high sales two internists practicing in an urban setting. Al-volumes, hospitals account for only a portion of though the office contains basic medical furniturethe overall market. For example, parenteral sup- and equipment, most of the products predisposedplies (for feeding through the bloodstream rather of after one use.than the alimentary canal) are increasingly usedin home health care (see ch. 3) and X-ray suppliesare also purchased by independent diagnosticcenters and private offices.
CHARACTERISTICS OF MEDICAL DEVICES MANUFACTURERSAs indicated by table 3, the number of device are likely to have multiple plants. This pattern
companies is almost as large as the number of appears to be similiar to that in other industries.establishments, with an average of 1.13 establish- For industries in which the four leading firms ac-ments per company. This relationship implies that counted for between 40 and 64 percent of mar-the mode in the medical devices industry is a com- ket sales, a situation similar to that in the medi-pany with one plant, although larger companies cal devices industry, the four leaders in 1963
25-406 0 - 84 - 3

26 • Federal Policies and the Medical Devices Industry
Table 9.—Medical Devices in an Internist’s Office
Medical fixtures:(examining tables and other fixtures used for medical
purposes)Examination rooms (2)
2 exam tables with stirrups and storage drawers2 scales1 treatment cabinet (large)1 instrument cabinet (small)1 eyechart
Laboratory1 X-ray view box1 test tube rack1 sedimentation tube rack
Medical office supplies:1 hanging medical record cabinet (7 tiers)Manila chart foldersPrinted forms for chartsPrescription blanksColor-coded medical record stickers
Diagnostic supplies:Cover slidesUrinalysis plastic cupsWipes for urinalysis clean catchTable paperDrapesPaper tapeBili lab stix (dip-urinalysis)K-Y jellyPregnancy test kit (urinary chorionic gonadotrophins
(UCG)-Beta slide)Sedimentation tubes, cotton plugStains (Gran’s iodine-safranin, etc.)Throat culture plates (oxblood 5%0)Discs for throat cultures (Taxo A)UricultsHemoccult slides (single and triple)Electrocardiograph (EKG) -mounting paper, electro pads &
electrode creamSani vaginal specs size (S)Sani vaginal specs size (M)AnoscopesCards for tuberculosis test
SOURCE: R. Berenson, Washington, DC, personal communication, January 1984.
averaged 4.7 establishments per company and thenext four, 2.4 establishments per company; butthe remaining firms averaged only 1.08establishments per company (274).
In 1977, medical devices establishments aver-aged 54 employees, about the same as the 53employees per establishment for all manufactur-ing (362). Within the medical devices field, SIC3693 (X-ray and electromedical equipment) hadthe largest average size establishment with 127employees, and SIC 3843 (dental equipment) hadthe smallest with 30 employees (table 10).
Sclavotest purified protein derivative (PPD) tuberculosis testPatient gowns (cloth)Cloth tape measuresThermometersGonococcus culture platesBlood drawing tubesAlcohol wipesSterile swabsSwabsBaggiesCervi scrapesFixative spray for Pap slidesSlides (wet mount for Pap)Cardboard containers for Pap slidesCulturettesGloves (reed Tru-touch)Request slips for tests
Therapeutic supplies:GauzesSyringesPeroxideAlcoholBetadine scrubCidex 7 (long life)Drug samplesBandaids
Diagnostic equipment:Examination rooms (2)
2 wall model Baumanometer blood pressureinstruments (3 cuffs)
1 EKG machine2 Burton exam lamps2 otoscope/ophthalmoscope desk units
Laboratory1 centrifuge (provided on load by lab)1 microscope1 incubator
Therapeutic equipment:Instruments (minor surgical--i.e., scissors, scalpels,
tweezers, etc.)
Despite the growth that has occurred in medi-cal devices in recent years, there have not beenmajor increases in the average size of an estab-lishment. In fact, for all of the major medicaldevices SIC codes except X-ray and electromedi-cal equipment and dental equipment, averageemployee size fell from 1972 to 1977; for SIC 3693(X-ray and electromedical equipment), it rosefrom 116 to 127 employees per establishment, andfor SIC 3843 (dental equipment), it rose from 29to 30 employees per establishment (362). Fromthese statistics, one may infer that, with the pos-sible exception of X-ray and electromedical equip-
Ch. 2—Characteristics of the Medical Devices Industry ● 27
Table 10.–Size of Employment in Medical Devices Establishments by SIC Code, 1977
Number of establishments Percentage of all establishments Average numberby employee size by employee size of employees
SIC industry segment 1-19 20-99 100-499 > 500 1-19 20-99 100-499 >500 per estab l ishment
SIC 3693: X-ray and electromedical equipment . . . . . . . . . 117 55 55 16 4890 230/0 230/0 7% 127
SIC 3841: Surgical andmedical instruments. . . . . . . . 412 147 72 19 63 23 11 3 66
SIC 3842: Surgical appliancesand supplies . . . . . . . . . . . . . . 832 213 86 22 72 18 7 2 46
SIC 3843: Dental equipmentand supplies . . . . . . . . . . . . . . 431 85 30 4 78 15 5 1 30
SIC 3851: Ophthalmic goods . . 479 98 50 76 15 8 1 47Total . . . . . . . . . . . . . . . . . . . . . 2,271 598 293 68 70% 19% 9% 2% 54
SOURCE: U.S. Department of Commerce, Bureau of the Census, 1977 Census of Manufactures, Industry Series, MC 774-38B and MC 77-I-36F (Washington, DC: U.S.Government Printing Office, June 1980).
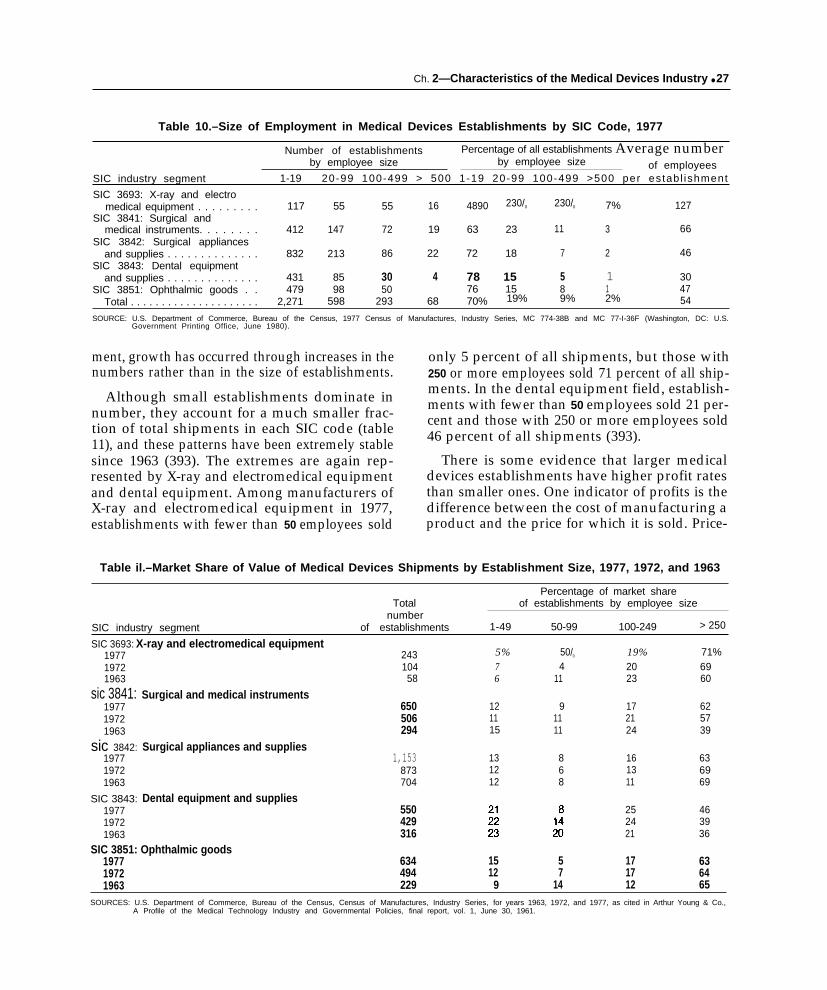
ment, growth has occurred through increases in thenumbers rather than in the size of establishments.
Although small establishments dominate innumber, they account for a much smaller frac-tion of total shipments in each SIC code (table11), and these patterns have been extremely stablesince 1963 (393). The extremes are again rep-resented by X-ray and electromedical equipmentand dental equipment. Among manufacturers ofX-ray and electromedical equipment in 1977,establishments with fewer than 50 employees sold
only 5 percent of all shipments, but those with250 or more employees sold 71 percent of all ship-ments. In the dental equipment field, establish-ments with fewer than 50 employees sold 21 per-cent and those with 250 or more employees sold46 percent of all shipments (393).
There is some evidence that larger medicaldevices establishments have higher profit ratesthan smaller ones. One indicator of profits is thedifference between the cost of manufacturing aproduct and the price for which it is sold. Price-
Table il.–Market Share of Value of Medical Devices Shipments by Establishment Size, 1977, 1972, and 1963
Percentage of market shareTotal of establishments by employee size
numberSIC industry segment of establishments 1-49 50-99 100-249 > 250
SIC 3693: X-ray and electromedical equipment197719721963
sic 3841:197719721963
sic 3842:197719721963
SIC 3843:197719721963
24310458
Surgical and medical instruments650506294
Surgical appliances and supplies1,153
873704
Dental equipment and supplies550429316
5%76
121115
131212
50/0
411
91111
868
19%2023
172124
161311
252421
71%6960
625739
636969
463936
SIC 3851: Ophthalmic goods1977 634 15 5 17 631972 494 12 7 17 641963 229 9 14 12 65
SOURCES: U.S. Department of Commerce, Bureau of the Census, Census of Manufactures, Industry Series, for years 1963, 1972, and 1977, as cited in Arthur Young & Co.,A Profile of the Medical Technology Industry and Governmental Policies, final report, vol. 1, June 30, 1961.

28 ● Federal Policies and the Medical Devices lndustry
cost margins have been calculated for medicaldevices establishments with data from the Censusof Manufactures (table 12). According to these1977 data, price-cost margins were highest for thelargest establishments. In only two of the fivecodes, however, did the smallest sized establish-ments have the lowest margins. A serious problemwith these figures is that they overstate profits be-cause they exclude costs such as research and de-velopment, advertising, and depreciation (18).
Small companies in the medical devices fieldhave a greater share of industry output than inmanufacturing generally (26). Companies withone establishment account for 21 percent of allsales of medical instruments and supplies and 31percent of optical and ophthalmic goods, but only16 percent of all manufacturing.5 Companies with
fewer than 250 employees account for 25 percentof all sales of medical instruments and suppliesand 32 percent of optical and ophthalmic goodsas compared with 18 percent of all manufacturing.
The role of small firms in medical instrumentsand supplies is comparable to that of those in elec-tronic components in terms of number of estab-lishments or total receipts. If firm size is definedby number of employees, small medical instru-ment and supply firms with fewer than 250 em-ployees account for a larger share of sales thanfirms of a similar size in the electronic componentsindustry.
‘These data are compiled on the basis of companies rather thanestablishments. The category optical and ophthalmic goods includesproducts such as telescopes and other optical equipment and henceis broader than medical devices (26).
Table 12.—Price-Cost Marginsa of Medical Devices Establishments by Employee Size, 1977
Margins of establishments by employee size
SIC industry segment Total 1-49 50-99 100-249 > 250
SIC 3693: X-ray and electromedicalequipment , . . . . . . . . . . . . . . . . . . . . . . . . . . . . . . . . . 0.406 0.374 0.275 0.398 0.422
SIC 3641: Surgical and medical instruments . . . . . . . . 0.394 0.326 0.360 0.368 0.420SIC 3842: Surgical appliances and supplies . . . . . . . . . 0.374 0.307 0.322 0.355 0.400SIC 3843: Dental equipment and supplies . . . . . . . . . . 0.325 0.283 0.360 0.274 0.366SIC 3851: Ophthalmic goods , . . . . . . . . . . . . . . . . . . . . 0.352 0.350 0.297 0.351 0.357aPrice-cost margins are calculated from Bureau of the Census data as follows:
P r i c e - c o s t m a r g i n = ‘atue a d d e d – ‘ayro’tValue of shipments
“Value added” is the value of shi ments minus materials, supplies, energy and certain other Input costs. It is defined by the Census on an establishment basis. Price-cost! ~~margins are just one measure o profltablllty; each different measure has advantages as well as disadvantages. Limitations of the price-cost margins are: 1) the mar ins
are overstated proxies of profitability since the Census does not provide directly comparable estimates of non-plant costs such as advertising, central office costs, F?&D,and plant depreciation, and 2) the margins are conceptually inadequate because they fail to account for the industry’s capital intensity.
SOURCE: U.S. Department of Commerce, Bureau of the Census, 1977 Census of Manufactures, /ndustry Series, as cited in Arthur Young & Co., A Profile of the MedicalTechnology /ndustry and Governrnenta/ Po/icies, final report, vol. 1, Washington, DC, June 30, 1981.
CONCENTRATION IN THE MEDICAL DEVICES INDUSTRY
The extent to which sales are concentrated to 45 percent of the sales in the medical devicesamong a few companies is a measure of the com- SIC codes (table 13). By comparison, in 43 per-petitiveness of an industry. Despite the large num- cent of all U.S. manufacturing industries duringber of companies, especially small ones, concen- 1972, the four leading firms had 40 percent ortration in the five medical devices SIC codes is more of the total market (274). In the five medi-similar to that in other manufacturing industries. cal devices codes, the share of the four or eightIn 1977, the four leading firms accounted for 32 leading firms has been continually declining since

Ch. 2—Characteristics of the Medical Devices Industry • 29
Table 13.–Market Share of Value of Medical Devices Shipments by Leading Companies, 1977 and 1963
Percentage of market share
Total number of 4 leading 8 leadingSIC industry segment companies companies companies
X-ray and electromedical equipment (SIC 3693)1977 . . . . . . . . . . . . . . . . . . . . . . . . . . . . . . . . . . . . . . . . . . . . . . . . . . . . . . . . . . 212 32% 51%1963 . . . . . . . . . . . . . . . . . . . . . . . . . . . . . . . . . . . . . . . . . . . . . . . . . . . . . . . . . . 56 67 79
Surgical and medical instruments (SlC 3841)1977 . . . . . . . . . . . . . . . . . . . . . . . . . . . . . . . . . . . . . . . . . . . . . . . . . . . . . . . . . . 575 32 481963 . . . . . . . . . . . . . . . . . . . . . . . . . . . . . . . . . . . . . . . . . . . . . . . . . . . . . . . . . 256 47 58
Surgical appliances and supplies (SIC 3842)1977 . . . . . . . . . . . . . . . . . . . . . . . . . . . . . . . . . . . . . . . . . . . . . . . . . . . . . . . . . . 1,017 38 491963 . . . . . . . . . . . . . . . . . . . . . . . . . . . . . . . . . . . . . . . . . . . . . . . . . . . . . . . . . . 525 49 58
Dental equipment and supplies (SIC 3843)1977 . . . . . . . . . . . . . . . . . . . . . . . . . . . . . . . . . . . . . . . . . . . . . . . . . . . . . . . . . . 507 33 461963 . . . . . . . . . . . . . . . . . . . . . . . . . . . . . . . . . . . . . . . . . . . . . . . . . . . . . . . . . . 267 37 50
Ophthalmic goods (SlC 3851)1977 . . . . . . . . . . . . . . . . . . . . . . . . . . . . . . . . . . . . . . . . . . . . . . . . . . . . . . . . . . 593 45 561963 . . . . . . . . . . . . . . . . . . . . . . . . . . . . . . . . . . . . . . . . . . . . . . . . . . . . . . . . . . . 211 53 62
SOURCES: U.S. Department of Commerce, Bureau of the Census, Certsus of Manufactures, /ndustry Series, foryears 1963 and 1977, ascitedin U.S. DepartmentofHealth and Human Services, Food andDru Administration, Office of Planning and Evaluation, Base/ine Data on the Avaflabflity ofMedica/ Devices and
f/n-Vitro Diagnostic Products, OPE Study 5 , Washington, DC, 1980.
1963, with the possible exception of SIC 3841(sur-gical and medical instruments), whose ratio in-creased slightly from 1972 to 1977.
As one would expect, the field appears to bemuch more concentrated at the level of more spe-cific products. The 1977 Census of Manufacturesreported the number of companies with shipmentsof $100,000 or more for each product line. SIC3693 (electromedical equipment) had four prod-uct types with only one manufacturer, and SIC3842 (surgical appliances and supplies) had oneproduct with a single manufacturer (393). Theproducts in the other SIC codes, which varied intheir level of detail, all had more than one man-ufacturer, although the numbers were sometimessmall.
Data from IMS America on sales to hospitalsindicate that a small number of companies havea large share of the market for specific devices(table 14). For sutures, the four leading companiesaccounted for 99.9 percent of all sales. Marketshares over 96 percent were also held by the fourleading firms in surgeons’ needles, blood collec-tion supplies, and ostomy products (for dischargeof intestinal contents or urine through an artifi-cial opening). The lowest market shares of thefour leaders, which were still substantial were 43percent for garments, textiles, and gloves and 45percent for respiratory therapy devices. Severalcompanies have large market shares across a rangeof products. As shown in table 15, American Hos-
pital Supply Corp. is one of eight leading firmsin 21 of the 28 product categories listed in table14, and Johnson &Johnson is one in 14.
Prices for products in SIC medical devices codeshave increased at rates comparable to those inother manufacturing industries. Available indexesmeasure price changes in a given market basketof products and do not incorporate new productsor changes in old ones, a serious deficiency forthe innovative medical devices field. From 1972to 1982, product prices rose at an annual rate of9.5 percent for SIC 3693 (X-ray and electromedi-cal equipment), 8 percent for SIC 3841 (surgicaland medical instruments), 7.3 percent for SIC3842 (surgical appliances and supplies), 7.7 per-cent for SIC 3843 (dental equipment and supplies),and 5.9 for SIC 3851 (ophthalmic goods) (369,375). During that time, product prices increasedat an annual rate of 9.2 percent for all manufac-turing industries and 6.7 percent for the electri-cal and electronic equipment industry.
The lower rate of price increase in ophthalmicgoods is consistent with the case of contact lenses.From 1971 to 1982, the list price of soft contactlenses fell 50 percent, a result of competitionamong fitters as well as among producers of thelenses (275). The mature hard lens sector, whichexhibits little evidence of economies of scale inproduction, has few dominant firms and has beenhighly price-competitive for several years. In the

30 ● Federal Policies and the Medical Devices Industry
Table 14.—Leading Companies’ Market Share of Hospital Sales of Medical Devices, 1982a
Percent market share
Sales to hospitals 4 leading 8 leadingSIC code/product (thousands of dollars) companies companies
X-ray and electromedical equipment (SIC 3693)X-ray supplies . . . . . . . . . . . . . . . . . . . . . . . . . . . . . . . . . . . . . . . . . . . . . . . $77,366 89.3% 98.2%Radiological catheters and guide wire . . . . . . . . . . . . . . . . . . . . . . . . . 135,878 85.3 92.8Pacemakers and other cardiovascular products . . . . . . . . . . . . . . . . . 499,999 73.7 88.9Electrosurgical supplies . . . . . . . . . . . . . . . . . . . . ., . . . . . . . . . . . . . . . . 48,552 58.9 82.6
Surgical and medical instruments (SIC 3841)Surgeons’ needles . . . . . . . . . . . . . . . . . . . . . . . . . . . . . . . . . . . . . . . . . . . 4,310 96.5 99.6Blood collection supplies . . . . . . . . . . . . . . . . . . . . . . . . . . . . . . . . . . . . 57,845 96.4 99.1Thermometers . . . . . . . . . . . . . . . . . . . . . . . . . . . . . . . . . . . . . . . . . . . . . . 31,426 78.8 92.3Surgical instruments . . . . . . . . . . . . . . . . . . . . . . . . . . . . . . . . . . . . . . . . . 294,284 68.1 81.2Syringes and needles . . . . . . . . . . . . . . . . . . . . . . . . . . . . . . . . . . . . . . . . 331,054 65.7 80.9Catheters, tubes and allied products . . . . . . . . . . . . . . . . . . . . . . . . . . . 235,445 60.8 81.6Diagnostic instruments . . . . . . . . . . . . . . . . . . . . . . . . . . . . . . . . . . . . . . 69,549 59.5 77.8
Surgical appliances and supplies (SIC 3842)Sutures . . . . . . . . . . . . . . . . . . . . . . . . . . . . . . . . . . . . . . . . . . . . . . . . . . . . 286,635 99.9 100.0Ostomy products . . . . . . . . . . . . . . . . . . . . . . . . . . . . . . . . . . . . . . . . . . . . 13,842 97.9 99.6Surgical packs and parts . . . . . . . . . . . . . . . . . . . . . . . . . . . . . . . . . . . . . 174,123 84.1 95.1Maternity products . . . . . . . . . . . . . . . . . . . . . . . . . . . . . . . . . . . . . . . . . . 26,869 82.3 91.8Dialysis supplies . . . . . . . . . . . . . . . . . . . . . . . . . . . . . . . . . . . . . . . . . . . . 97,677 81.5 93.3Cardiopulmonary supplies . . . . . . . . . . . . . . . . . . . . . . . . . . . . . . . . . . . . 71,176 79.4 98.0Sponges . . . . . . . . . . . . . . . . . . . . . . . . . . . . . . . . . . . . . . . . . . . . . . . . . . . 174,768 78.9 88.4Bandages, dressings and elastic 172,303 77.3 87.5Orthopedic supplies . . . . . . . . . . . . . . . . . . . . . . . . . . . . . . . . . . . . . . . . 302,283 74.5 83.8Parenteral supplies . . . . . . . . . . . . . . . . . . . . . . . . . . . . . . . . . . . . . . . . . . 701,106 72.6 91.9Urological products . . . . . . . . . . . . . . . . . . . . . . . . . . . . . . . . . . . . . . . . . 198,970 71.7 86,8Sterilizer supplies . . . . . . . . . . . . . . . . . . . . . . . . . . . . . . . . . . . . . . . . . . 88,846 71.4 83,5Cast room supplies . . . . . . . . . . . . . . . . . . . . . . . . . . . . . . . . . . . . . . . . . . 39,836 62,2 78.6Disposable kits and trays . . . . . . . . . . . . . . . . . . . . . . . . . . . . . . . . . . . . . 258,317 46.7 63.1Respiratory therapy . . . . . . . . . . . . . . . . . . . . . . . . . . . . . . . . . . . . . . . . . . 245,890 45.1 67.4Garments, textiles, and gloves . . . . . . . . . . . . . . . . . . . . . . . . . . . . . . . . 592,254 43.7 61.1
Ophthalmic goods (SIC 3851)Ophthalmic-related products . . . . . . . . . . . . . . . . . . . . . . . . . . . . . . . . . . 83,649 67.9 93.3
alMs AmeriCa’S l+ospital SIJ@Y index also has nifleothercategories that are not included here: elastic goods, identification SUpplif3S, SOIUtiOnS, chemicals andsoaps, gases, medical supplies, paper products, rubber goods, and underpads.
SOURCE: IMS America, Ltdv Rockville, MD, unpublished data, 1983.
Table 15.—Eight Leading Companies in Hospital Sales of Medical Devices in Threeor More Product Categories, 1982a
. Number of product categories Number of product categories
in which company is one ofCompany
in which company is one ofeight leading companies Company eight leading companies
American Hospital Brunswick Corp.. . . . . . . . . 4Supply Corp. . . . . . . . . . . 21 Lilly . . . . . . . . . . . . . . . . . . . . 4
Johnson & Johnson . . . . . 14 Cordis/Cordis Dow.. . . . . . 3Colgate-Palmolive . . . . . . . 8 Dart Industries . . . . . . . . . . 3Baxter-Travenol . . . . . . . . . 7 Independent Lab . . . . . . . . 3Bard, C.R. . . . . . . . . . . . . . . 6 Kimberly-Clark . . . . . . . . . . 3Pfizer . . . . . . . . . . . . . . . . . . 6 Professional Med. P...... 3Abbott . . . . . . . . . . . . . . . . . 5 Squibb . . . . . . . . . . . . . . . . . 3Bristol-Myers . . . . . . . . . . . . 5 Terumo-America Inc. . . . . . 3Minnesota 3M Labs . . . . . . 5 Warner-Lambert . . . . . . . . . 3Becton Dickinson . . . . . . . 4
— — . . . . —aoutofthe zBprOduct categories listed in table 14.
SOURCE: IMS America, Ltd. Rockville, MD, unpublished data, 1983.

Box A.—Changes in the Clinical Laboratory
In the 1950s, I saw the marvelous technique of Folin-Wu, which was used in those days in order to determinethe patient’s blood glucose level, or as it is more colloquially known, the blood sugar. This entailed the mixing ofvarious chemicals in such a fashion as to cause after 45 minutes of smelly boiling, the development of a blue colorwhose intensity was an indication of the amount of sugar which was present in the patient’s blood. It should be remem-bered that prior to this test, presence of glucose in the patient’s urine was determined by tasting the urine and in fact,as is generally known, the term diabetes mellitus means sweet tasting and derives from the physician’s diagnosis ofexcess sugar in the patient’s system by the test of urine tasting. I suspect that in some parts of the world, Folin-Wusugars are still being performed because they are cheap, work, and require only a basic knowledge of chemistry andsimple laboratory equipment. This is in contrast to the methods which we now employ, which involve a sophisticatedenzymatic reduction method. . . . In days past, the determination of the Folin-Wu sugar on 10 patients would entaila full morning’s work for the skilled laboratory technologist in the pathology laboratory. Today, we can perform 150glucose tests in 1 hour using the skills of a well-trained and educated high school graduate. The cost per test now ison the order of a few pennies and the cost per test 20 years ago was considered to be inexpensive at $5.00 . . .
The clinical diagnostic laboratory or Department of Laboratory Medicine is routinely accepted today as a vitalcomponent of modern health care. As recently as 30 years ago, however, that was not the case. What is now calleda Department of Laboratory Medicine, or in some centers, clinical pathology, was then part and parcel of the Depart-ment of Pathology. There were no commercial clinical laboratories to speak of and you could count the number ofmanufacturers of capital laboratory goods on the fingers of one hand. If a physician wanted to know the quantityof sugar in the patient’s blood, the test required about an hour and a half of preparation, boiling, and manipulationbefore an approximation could be given of the amount of glucose in the patient’s blood—-and in fact, we weren’t meas-uring glucose; we measured reducing substances, that is, all of the sugar-like materials that were in the patient’s blood.For that matter, there were very few constituents that we were able to chemically approximate just 30 years ago, . . .
Diagnostic biochemistry really began to flower in the 1950s and early 1960s when various enzymatic methodswere discovered for the determination of specific sugars, such as glucose, and other determinations were developedfor uric acid, urea nitrogen rather than the gross determination of nonprotein nitrogen, total protein, calcium and phos-phorus, and other constituencies which appear to be useful in the daily management of patients who were ill and understress. . . .
In mid-1950, Dr. Skeggs at Western Reserve University had a rather ingenious idea, He automated, for the firsttime in the clinical Laboratory, the mixing, sampling and reading of the constituents in the patient’s blood when heautomated the blood sugar using the continuous-flow autoanalyzer. That first single-channel autoanalyzer was soldin 1957 by the Technicon Company. . . . With the invention and mass sale in the early 1960s of the single-channelautoanalyzer, it suddenly became possible to perform a series of tests virtually without regard for the cost of labor . . .
In 1965, I recall being a first-year resident in pathology and witnessing the chief of the department bringing backthe first SMA 12 in Pittsburgh to our hospital in his station wagon. We set it upon saw-horses. He and the administratoragreed that the instrument would not only provide 12 tests to the institution on every patient (at great savings) butwould also provide a charge to the institution in 1965 dollars of $20.00 per evaluation. That is comparable in 1984dollars to $65.34 .. .
It should also be pointed out that these instruments all used large quantities of reagants as did the continuousflow technology. This of course put the capital vendors into the reagent and parts business in a big way. In thosedays we did not have the microchemical procedures that later evolved in the mid-1970s, and have been extrapolatedin the past few years to virtually all of the automated equipment which is used in the laboratory. Even if the costof running these instruments was high and the purchase costs were large, when compared to the then available manualtesting methods that were in vogue, these new instruments were a quantum leap forward in efficiency, quality, andquantity of data base. . . .
Where we had in the mid-1950s and early 1960s the rare professional medical technologist performing reducingsubstances on the patient’s blood manually at the rate of six tests per hour, by 1983 we had one registered medicaltechnologist supervising the production of one machine which has the capability of performing 1,$00 individual testsper hour. Where them was virtually no capital equipment cost to do the few sugars in 1960, the capital equipmentcost in order to process the 2,300 samples per hour is on the order of $400,000.
%xcerpted from a paper prepawd for OTA by Lnpovieh (199).

Ch. 2—Characteristics of the Medical Devices Industry ● 3 1——. — . . .
younger soft lens sector, the four leading firmscontrol almost 70 percent of the market, but newfirms have entered and the concentration level hasdeclined steadily during the past 5 years.
There is some evidence that merger activity inthe medical devices field accelerated during thelatter part of the 1970s. Respondents to a surveyin 1981 said that only 4 percent of their companies
had been acquired by another firm, merged withanother firm, or acquired another firm from 1972to 1975, but 23 percent answered affirmatively for1976 to 1980 (197). By 1982, 100 of the 140 firmsbelonging to the Pharmaceutical ManufacturersAssociation produced diagnostic products andother medical devices, accounting for an estimated60 percent of all such sales (244).
INNOVATION IN MEDICAL DEVICES
A hallmark of the medical devices field has beenthe introduction of new products and the refine-ment of old ones. Some innovations affect or-dinary devices that are used frequently, such asassembled surgical trays for operating rooms (2).Others represent the application of sophisticatedtechnology to medical uses, such as nuclear mag-netic resonance imaging. 6 This rapid innovationin medical devices has certainly underlain muchof the growth in firms and sales in recent decades.
Although innovation in medical devices has notbeen precisely documented, striking evidence isprovided by the changes in medical practice thathave resulted from new medical devices. In boxesA and B, respectively, a pathologist and an oph-thalmologist relate certain changes in clinical lab-oratories and ophthalmology that have been linkedto innovations in devices. Innovative devices havebeen the basis for tremendous changes in clinicallaboratory procedures. Compared to a generationago, clinical laboratory tests can now be per-formed more accurately and quickly as well aswith fewer, less skilled personnel and at lowercost .
The pace of innovation in ophthalmology de-scribed in box B is greater than one might expectfrom the relative growth of the SIC code 3851(ophthalmic goods). However, many of the newor refined medical devices used in ophthalmologyare surgical instruments or electromedical equip-ment, which appear in other SIC codes. Similarinnovations have taken place in other areas ofmedicine, such as digital subtraction angiography
6See the separately published OTA case study on nuclear magneticresonance imaging by Steinberg and Cohen (291).
and CT scanning in diagnostic imaging and pace-makers and materials for hip joints in surgery.
Patents are frequently used as a measure of in-novative activity in an industry. Such data havelimitations since not all inventions are patented,several patents may pertain to a single invention,and the propensity to patent is greater in somefields than in others.
The number of patents granted by the U.S. Pat-ent Office grew modestly through the 1970s. From1968 to 1979, almost 22,000 applications werefiled for medical devices patents that were subse-quently issued (table 16), representing 2 percentof all patents (381). Compared with all U.S.patents over the same period of time (see app. D,table D-2): 1) while all patents have remainedessentially constant, medical devices patents in-creased moderately; and 2) while foreign-originmedical devices patents as a percent of total med-ical devices patents increased from 20 to 30 per-cent over the 1970s, foreign-origin patents for allU.S.-issued patents increased from about 30 to 40percent. Individuals owned 37 percent of the med-ical devices patents, compared with 22 percent ofall patents, an observation suggesting the impor-tant role of individuals in the medical devicesfield. Table 17 provides information on patentingactivity in specific medical device fields (see app.D for further information on patents). Electricalsystems and diagnostic equipment using radiation,for example, accounted for about 6 percent of allmedical devices patents. Strength in this area isconsistent with the rapid growth in sales, firms,and employment that has characterized the relatedsegment of the medical devices industry (X-ray,

Box B.—How Ophthalmology Has Changed During My Career1
Ophthalmology is practiced mostly in private offices, the majority of the work being primary carewith attendant high-volume, low-disease rates, and the remainder at a tertiary level with great technicalsophistication and high-risk, high-reward surgery. Here is a description of ophthalmological technologywhen I began my residency in 1956, and how it then changed. . . .
Measuring the refractive state of the eye is usually accomplished in two stages: objective and sub-jective. When I entered ophthalmology, the objective phase was almost invariably performed by thepractitioner’s using a small hand instrument called a retinoscope. In a darkened room, with the patientgazing at a distant small light source that would not encourage accommodation, the examiner peeringthrough a sight-hole of the instrument along the axis of a light beam entering the patient’s pupil, is ableto gauge the nature of the optical system of the eye by the character of the small amount of light reflect-ing back from the patient’s retina. . . .
Objective testing has changed significantly during my career. There are now nearly 20 optical-electronic devices commercially available for performing retinoscopy or some other very closely alliedobjective test. These can all be operated by technicians who need not have any skills in the traditionalmethods of refraction. . . .
Early in the 1950s, most sharp cutting instruments were still made of nonstainless steel, were hand-sharpened, and were used repeatedly. The cornea is extremely tough tissue to cut, and instruments foropening the cornea to begin cataract surgery presented a particularly difficult problem. If the point ofsuch an instrument is only slightly dull, the surgeon must push it harder, and then it is likely to enterthe eye in a rush. A great improvement has been made in recent years with the introduction of disposableblades. Each of these blades is very sharp, but, more important, they are predictable. The amount offorce required to use them is always the same, and the surgeon knows what to expect.
Another important advance in ophthalmic instrumentation for surgery has been the developmentof better needles for suturing the ocular tissues. In the early 1950s, the needles were hand-honed, usedrepeatedly, and had eyes that required threading, like ordinary sewing needles. Placing sutures in thecornea with these needles did not allow great precision in apposition of the wound edges. Disposableneedles swaged onto the ends of the suture made a great advance. By the late 1950s, the new generationof very sharp disposable swaged-on needles made placement of sutures a qualitatively different pro-cedure. . . .
The next great changes in cataract surgery came about as the result of increased we of magnifica-tion. During the 1950s and 1960s, the operating microscope was a feature of every well-equipped oph-thalmic operating room. However, the instrument was used primarily for corneal transplants, wherea higher level of precision of technique was clearly advantageous. The microscope improved in responseto the demands of the surgeons, and with improvements in the operating microscope the surgeonsdemanded finer and finer needles and sutures. . . . During the decade of the 1970s, the operatingmicroscope became the standard for modern corneal and cataract surgery, and today it would be diffi-cult to defend this type of surgery without the use of a first-class operating microscope. A good operat-ing microscope today costs from $30,000 to $60,000 or $70,000, and with photographic and other op-tional attachments the price can go significantly higher. . . .
The first truly successful intraocular lens (IOL) implants were made of one rigid piece of plastic(methyl methacrylate) placed in the anterior chamber of the eye, under the vault of the cornea, andin front of the iris. . . . These lenses are still in use, but are falling into disfavor because the pressureof the lens against the tissues holding it causes disturbances that can be serious. . . . There was a greatwave of enthusiasm for iris-supported lenses, but this began to wane about 2 or 3 years ago, when thereports of bad long-term results began to accumulate. . . . The next shift in IOL implants has been towardplacing the IOL in the posterior chamber, the place behind the iris from which the patient’s own naturallens has been removed . . . surgeons’ choosing to put IOLs in the posterior chamber has revived theextracapsular operation, which leaves the posterior capsule in place to support the IOL.

34 . Federal Policies and the Medical Devices Industry.——-——. — —. . . — —.- — —. . . . . . —.—.——.—-.
Table 16.—U.S. and Foreign Medical Devices Patents Granted byU.S. Patent Office by Application Date, 1968-79
— ---- —..Number Annual percentage change— — ——— —. — . —
United UnitedYear Total States Foreign Total States Foreign— — — . — ——— — ..- ———.1979a 2,142 1,488 . -,. 654 5.3% 2.0% 13.5%1978a : 2,035 1,459 676 -4.8 - 7 0 141 9 7 7 2,137 1,569 568 3.8 1.6 1071976 2,058 1,545 ‘: 1 3.2 0.1 13,71975 1,994 1,543 451 --0.5 1.8 -5.81 9 7 4 1,995 1,516 479, 6.6 4.0 15,71 9 7 3 1,871 1,457 414 9 4 8.1 14,01 9 7 2 1,711 1,348 363 4.0 -1.0 28,31 9 7 1 1,645 1,362 283 6.1 8.2 -2.71 9 7 0 1,550 1,259 291 9.1 9.2 8.61 9 6 9 1,421 1,153 268 12,7 9.9 26.41968 1,261 1,049 212 --- -- -.
—.——-Total . . . . . 21,820 16,748 5072— ..- ————-. . — - --. .—.—.— -—————.—.——
aThe average pendenc Y (1 P the delay between the flllng of a pat, t il I(II c il I(>I and I IS subsequent Issuance as a patent)IS currently longer than 2 y ~ars I t Is estimated that 2 to 5 percent I I , I ‘I 7 ) ~pl I lcat Ions and 1 pel’cent of the 1978 appl lcatlons were still pend~ng I . Ijnc 1983
SOURCE U S Department 1 ‘~eall~ and Human Services Food an,~ I J. ~, “Irr II lustr!itlor Of f!ce of Economic Analysts, Roc~vllleMD comt Itat I II b I ibi I shed data frnm the I.J S P ?t{ I ie~. lark 3ffice C)ecernher 1983

Ch. 2-Characteristics of the Medical Devices Industry ● 3 5
Table 17.—U.S. and Foreign Medical Devices Patents Granted byU.S. Patent Office by Source and Selected Categories, 1968-79
—-— .Total number — -—–. . . . . Percentage of totalb
of U.S. and U s .Category foreign patents’ Corporations Government Universities Individuals
Diagnostic equipment . . . . . . . . . . . . 3,037 5 6 % 4% 30/0 37%Respiratory methods . . . . . . . . . . . . . 1,042 55 2 c 43Electrical systems . . . . . . . . . . . . . . . . . . 723 68 1 2 29Implantable artificial
body members . . . . . . . . . . . . . . . . . 1,236 48 4 4 44Dia lys is and b lood f i l te rs . . . . . . 440 68 4 2 26Kinesitherapy equipment . . . . . . . . . . 1,015 32 1 1 66Orthopedic devices . . . . . . . . . . . . . . . 590 21 1 1 76Bandages and trusses. . . . . . . . . . . 1,880 46 1 1 52Mediators. .......,. . . . . . . . . . . . . 2,502 61 1 1 37Instruments . . . . . . . . . . . . . . . . . . . . . . . . 2,290 49 1 1 49Dental equipment . . . . . . . . . . . . . . . ... . . . . 1,509 33 c 1 66Ophthalmic equipment . . . . . . . . . . . . . . . 1,110 59 1 1 39Miscellaneous, including incubators,
hearing aids, receptors, and baths . . . . . . 2,525 58 2 1 39
al”~lud~~ ~at~nt~ ~rant~d (as of J“n~ 1983) on applications filed from 1 g68_79, The average pendency (i.e., the delay between the filing Of a patent application andits subsequent issuance as a patent) is currently longer than 2 years. It is estimated that 2 to 5 percent of the 1979 applications and 1 percent of the 1978 applicationswere still pending in June 1983. One patent may be included i n more than one categol y
b percen ta g e s may not add up to 100 percent because of roundingcLess than 1 percent.
SOURCE: U.S. Department of Health and Human Services, Food and Drug Adminlstratior, Off Ice of Economic Analysis, compilation of unpublished data from theU.S. Patent and Trademark Office, December 1983
electromedical, and electrotherapeutics equipment,SIC code 3693). Considerable activity also oc-curred in dialysis and blood filters, whose use hasbeen covered by Medicare since 1972 (see ch. 3),and in diagnostic and implantable cardiovasculardevices (see ch. 5).
Both large and small firms play a role in theinnovation of medical devices, as they do in othersectors of the U.S. economy (274). There is noexact information, however, on the dynamic rela-
tionship between large and small medical devicecompanies. It has been suggested that small firmsintroduce innovative devices and, after provingtheir commercial potential, merge or are acquiredby larger, more stable companies (18). It is alsopossible that larger companies and establishmentsbenefit from economies of scale, while the smallerones specialize in products or functions that arenot so dependent on scale (393).
INTERNATIONAL COMPETITIVENESS OF U.S. MEDICAL DEVICES
The United States has commanded a strongposition in the foreign trade of medical devices.During the past decade, the surplus of U.S. med-ical devices exports over imports grew steadily un-til 1982. In 1983, the surplus fell from over $1 bil-lion in 1982 to about $800 million (table 18). The$2.3 billion of medical devices exported in 1982represented 17 percent of total sales (22,368). From1978 to 1981, U.S. exports of medical devices grewabout 19 percent a year, a substantial amount
even though it does not allow for the 9 percentU.S. inflation rate at that time (219).7
U.S. foreign trade in medical devices contrastswith U.S. total merchandise trade, which has runa deficit (imports exceeded exports) for all but 2years (1975 and 1976) since 1973 (358). The U.S.
See app. H on consensus standards related to international tradeand app. I on governmental regulation of foreign trade in medicaldevices by six countries.

36 • Federal Policies and the Medical Devices lndustry— . — — — — . . —
Table 18.–U.S. Exports and Imports of Medical Devices by SIC Code, 1979-83
Millions of dollars Percent change
SIC code 1979 1980 1981 1982 1983a 1982-83
X-ray and electromedical equipment (SIC 3693)Exports . . . . . . . . . . . . . . . . . . . . . . . . . . . . . . .Imports . . . . . . . . . . . . . . . . . . . . . . . . . . . . . . .Surplus (deficit) . . . . . . . . . . . . . . . . . . . . . . . . .
Surgical and medical instruments (SIC 3841)Exports . . . . . . . . . . . . . . . . . . . . . . . . . . . . . . .Imports . . . . . . . . . . . . . . . . . . . . . . . . . . . . . . . .Surplus (deficit) . . . . . . . . . . . . . . . . . . . . . . . . .
Surgical appliances and supplies (SIC 3842)Exports . . . . . . . . . . . . . . . . . . . . . . . . . . . . . . . .Imports . . . . . . . . . . . . . . . . . . . . . . . . . . . . . . . .Surplus (deficit) . . . . . . . . . . . . . . . . . . . . . . . . .
Dental equipment and supplies (SIC 3843)Exports . . . . . . . . . . . . . . . . . . . . . . . . . . . . . . .Imports . . . . . . . . . . . . . . . . . . . . . . . . . . . . . . . .Surplus (deficit) . . . . . . . . . . . . . . . . . . . . . . . .
Ophthalmic goods (SIC 3851)Exports . . . . . . . . . . . . . . . . . . . . . . . . . . . . . . . .Imports . . . . . . . . . . . . . . . . . . . . . . . . . . . . . . . .Surplus (deficit) . . . . . . . . . . . . . . . . . . . . . . . . .
Total five SIC sectorsExports . . . . . . . . . . . . . . . . . . . . . . . . . . . . . . . .Imports . . . . . . . . . . . . . . . . . . . . . . . . . . . . . . . .Surplus (deficit) . . . . . . . . . . . . . . . . . . . . . . . . .
$ 717275442
$ 839312527
$1,006388618
$1,026487539
$1,065670395
3.8%37.6—
410146264
485174311
566195371
605222383
585255330
-3.314.9—
258105153
30994
215
1274186
35695
261
375108267
395110285
5.31.9—
1014259
1405090
1435093
15555
100
8.410.0—
99245
(146)
114278
(164)
123300
(177)
113342
(299)
110452
(342)
-2.732.2
—
$1,585$ 813$ 772
$1,874$ 899$ 975—.——
$2,191$1,028$1,163
$2,262$1,209$1,053
$2,310$1,542$ 768
2.1%27.5%—
aEstimated
SOURCES: W.C. Bandy, U.S. Departmentof Commerce, Bureau oflndustrial Economics, Washington, DC, personal communication, January 1983; E. Arakak~ U.S.Department of Commerce, Washington, DC, personal communication, February 1984; U.S. Department of Commerce, Bureau of Industrial Economics,1984 U.S. /rrdustria/ Out/ook, Washington, DC, January 1984.
position in medical devices is especially note-worthy because the growing strength of the dollarduring the last decade increased the relative priceof U.S. exports as it decreased the price of U.S.imports. That phenomenon did erode the U.S.surplus in 1983. The surplus in medical devicestrade has also persisted during the recent recession,despite the reduced buying power of our majortrading partners.
this category is heavily tied to export: 30 percentof electromedical equipment and 24 percent of X-ray equipment in 1983 were sold overseas (369).As a result, sales of these devices are more de-pendent on fluctuations in exchange rates.
Electromedical equipment, with exports thatgrew almost 25 percent annually from 1978 to1981, accounts for most of the trade surplus inSIC 3693 (219). Although it is common that theU.S. share of the world market for a product de-clines overtime as other countries enter the fieldand U.S. growth falls behind a faster growingworld market, this situation has not occurred withelectromedical equipment. The U.S. share of theworld market increased from 35 percent in 1975to 47 percent in 1979 (219). Patient monitoringsystems and other diagnostic electromedical appa-ratus have accounted for the majority of these ex-ports (371,372). In 1981, Japan, Canada, theNetherlands, West Germany, and France purchasedalmost half of U.S. exports in this subcategory.
Trade in X-ray products has been less favorable.In1982, exports only slightly exceeded imports.A deficit of $175 million was expected for 1983,
In 1983, the European Economic Communitywas the outlet for 37 percent of U.S. exports ofmedical devices, but Canada (14 percent) and Ja-pan (10 percent) were the major individual pur-chasers. 8 The European Economic Communityalso provided more than half of U.S. imports,with West Germany (32 percent) and Japan (18percent) the largest single sources (369).
Although U.S. production is greater in othercategories of medical devices, SIC 3693 (X-ray andelectromedical equipment) leads exports, with $1billion or almost 50 percent of all U.S. foreignsales of medical devices. Domestic production in
8These figures relate to SIC codes 3841, 3842, 3843, and 3693 butexclude SIC code 3851 (ophthalmic goods),

Ch. 2—Characteristics of the Medical Devices Industry ● 3 7.
with imports accounting for 33 percent of U.S.consumption of all X-ray products (369). About40 percent of all X-ray products imported during1981 and 1982 were X-ray apparatus and partsfrom West Germany (373,374).
Although SIC 3841 (surgical and medical instru-ments) showed a trade surplus in 1983, its posi-tion deteriorated from 1982: exports fell 3 percentand imports grew 15 percent. About 15 percentof the surgical and medical instruments producedin the United States during 1983 were exported,but only 7 percent of U.S. consumption camefrom imports. Exports of surgical and medical in-struments indicate the untapped potential of mar-kets other than our traditional trading partners.From 1978 to 1981, exports to Canada (17 per-cent) and the European Economic Communitygrew about 12 percent per annum. Exports to theMiddle East (10 percent) and Latin America (18percent), however, grew nearly 30 percent per an-num (219,371).
SIC 3842 (surgical appliances and supplies), thelargest medical devices category in sales, has theleast relative involvement in foreign trade: only7 percent of production is exported, and 2 per-cent of U.S. consumption is imported (369). From
CONCLUSIONSThe medical devices industry can be charac-
terized as a field that has undergone enormousgrowth in companies, establishments, employ-ment, new products, and foreign trade. By all ofthese measures, the experience of the medicaldevices industry has exceeded that of manufac-turing as a whole and of similar manufacturingsectors. Growth in medical devices has apparentlyoccurred more by the addition of new companiesthan by the expansion of old ones, an indicationthat any barriers to entering the industry are notprohibitive. Both small and large firms have im-portant positions in this industry. Small com-panies are responsible for a greater percentage ofsales in the medical devices industry than in otherindustries. But large companies have accountedfor the majority of sales, and a small number of
1982 to 1983, exports experienced a 5-percent in-crease, and imports rose almost 2 percent. BothWest Germany and Japan had sizable increasesin their exports to the United States.
Exports of devices in SIC 3843 (dental equip-ment and supplies), representing 12 percent ofproduction, increased 8 percent from 1982 to1983. Imports, only about 5 percent of U.S. con-sumption, came mainly from West Germany andJapan (369).
SIC 3851 (ophthalmic goods) is the only medi-cal devices code that has had a persistent tradedeficit. Half of the imports consist of frames andmountings for eyeglasses, which are supplied pri-marily by France, Italy, Japan, and Hong Kong.Sunglasses, 38 percent of ophthalmic imports in1981, came mainly from Japan and Hong Kong(373). Unlike most products in the other medicaldevices codes, ophthalmic goods are usually cho-sen and used by consumers rather than by medi-cal providers. To the extent that use is discre-tionary or postponable, sales would be expectedto be more sensitive to changes in price and gen-eral economic conditions. That reduced exportsin sunglasses accounted for most of the fall in ex-ports from 1981 to 1982 fits this pattern.
firms have a considerable share of the market,especially in specific product lines.
There are, however, disquieting aspects to thesituation. This phenomenal growth has occurredin a market where there is a consensus that tech-nology, including medical devices, has sometimesbeen used excessively (168,266,346). Policy ini-tiatives, both public and private, are now underway to improve the situation, chiefly by chang-ing the way that medical providers are paid. Inaddition, Federal policy regarding premarket ap-proval of devices is under review. It is thereforetimely to analyze the likely effects on the medi-cal devices industry of these and other policies,a task that is undertaken in the remainder of thisreport.