characterization and comparison of mesoporous …cdn.intechopen.com/pdfs/46137.pdf ·...
TRANSCRIPT

Characterization and Comparison of Mesoporous Silica Particles for Optimized Drug Delivery Regular Paper
Xinyue Huang1, Neil P Young2 and Helen E Townley1,* 1 Department of Engineering Science, Oxford University, Parks Road, Oxford 2 Department of Materials, Oxford University, Parks Road, Oxford * Corresponding author E-mail: [email protected] Received 10 October 2013; Accepted 20 December 2013 DOI: 10.5772/58290 © 2014 The Author(s). Licensee InTech. This is an open access article distributed under the terms of the Creative Commons Attribution License (http://creativecommons.org/licenses/by/3.0), which permits unrestricted use, distribution, and reproduction in any medium, provided the original work is properly cited.
Abstract In this study we have investigated the suitability of a number of different mesoporous silica nanoparticle structures for carrying a drug cargo. We have fully characterized the nanoparticles in terms of their physical parameters; size, surface area, internal pore size and structure. These data are all required if we are to make an informed judgement on the suitability of the structure for drug delivery in vivo. With these parameters in mind, we investigated the loading/ unloading profile of a model therapeutic into the pore structure of the nanoparticles. We demonstrate that the release can be controlled by capping the pores on the nanoparticles to achieve temporal control of the unloading. We have also examined the rate and mechanism of the degradation of the nanoparticles over an extended period of time. The eventual dissolution of the nanoparticles after cargo release is a desirable property for a drug delivery system. Keywords Nanoparticle, Silica, Mesoporous, Morphology, Cargo, Degradation
1. Introduction Mesoporous silica nanoparticles (MSNPs) are receiving increasing interest from the scientific community for their potential as drug delivery systems both in vitro and invivo (see [1], references 1–17). MSNPs typically have particle diameters in the 50-300 nm range and narrow pore size distributions of the order 2-6 nm. Their structure and morphology are controllable at both the nanometre and micrometre scale, yielding high surface area and pore volumes of the MSNPs and enabling a high cargo carrying capacity. (For an excellent review of the synthesis methods of MSNPS see [2]). The silica surface has a high density of silanol groups which can be modified with a wide range of organic functional groups [3], allowing for modification with targeting agents such as peptides, antibodies or folic acid, or biocompatible polymers such as polyethylene glycol (PEG) to minimize opsonization which would lead to the rapid clearance of the nanoparticles [4]. In addition, the ability of silica to decompose into relatively harmless silicic acid by-products presents fewer challenges for long-term use
Xinyue Huang, Neil P Young and Helen E Townley: Characterisation and Comparison of Mesoporous Silica Particles for Optimised Drug Delivery
1
ARTICLE
Nanomater Nanotechnol, 2014, 4:2 | doi: 10.5772/58290
Nanomaterials and Nanotechnology
than, for example, carbon nanotubes or gold nanoparticles which are not metabolized [5]. The capacity of MSNPs to carry cargo has been demonstrated with a number of different drugs, including ibuprofen [6-9], diflunisal [10], naproxen [10], captopril [11], aspirin [12], gentamycin [13], erythromycin [14], and amoxicillin [15]. The internalization of the cargo is important since new drugs are often insoluble in water, and it has been estimated that around 95 % of all new potential therapeutics have poor pharmacokinetics and biopharmaceutical properties [16]. In terms of drug delivery, the external diameter of the nanoparticles is of particular importance for drug delivery. The circulation of nanoparticles and their uptake by different tissues varies widely, and uptake by diseased tissue differs from healthy tissue. The tight junctions of the blood-brain-barrier only permit the passage of particles below 1 nm whereas continuous capillaries such as those found in the muscles, skin and lungs are permeable by up to approximately 6 nm. Larger particles of up to 50-60 nm are able to exit the fenestrated capillaries of the kidney, intestine, and some endocrine/exocrine glands. The largest particles, of up to 600 nm, will be able to accumulate in the liver, spleen and bone marrow [17]. However, it has been shown that the bio-distribution of nanoparticles is altered in animal models bearing tumours compared to control animals. The microvasculature surrounding tumours is highly permeable and leaky, and tumours have less efficient efflux mechanisms (the EPR effect) which will influence the overall bio-distribution. This means that nanoparticles of the right size will likely passively accumulate at the tumour site. At the cellular level, particle internalization is also dependent on the size, shape and surface chemistry of the nanoparticles. Small particles are internalized by endocytosis [18], and the uptake rate depends on the competition between the bending energy and stretching energy of the membrane which is related to both its size and shape [19]. Generally, particles with a positive charge have been seen to be endocytosed more rapidly since they may be expected to bind to the negatively charged cell surface [20]. However, there are reports of a higher uptake of negatively charged particles, e.g., in HEK cells [21], and neutrally charged particles have demonstrated much lower opsonization rates than charged particles [22, 23]. In this study we have assessed engineered mesoporous silica nanostructures for their suitability as potential drug delivery vehicles. We have evaluated the nanoparticles in terms of their physical and nanostructural attributes, interaction with model-drug molecules, and time-dependent behaviour in conditions that mimic those of the human body.
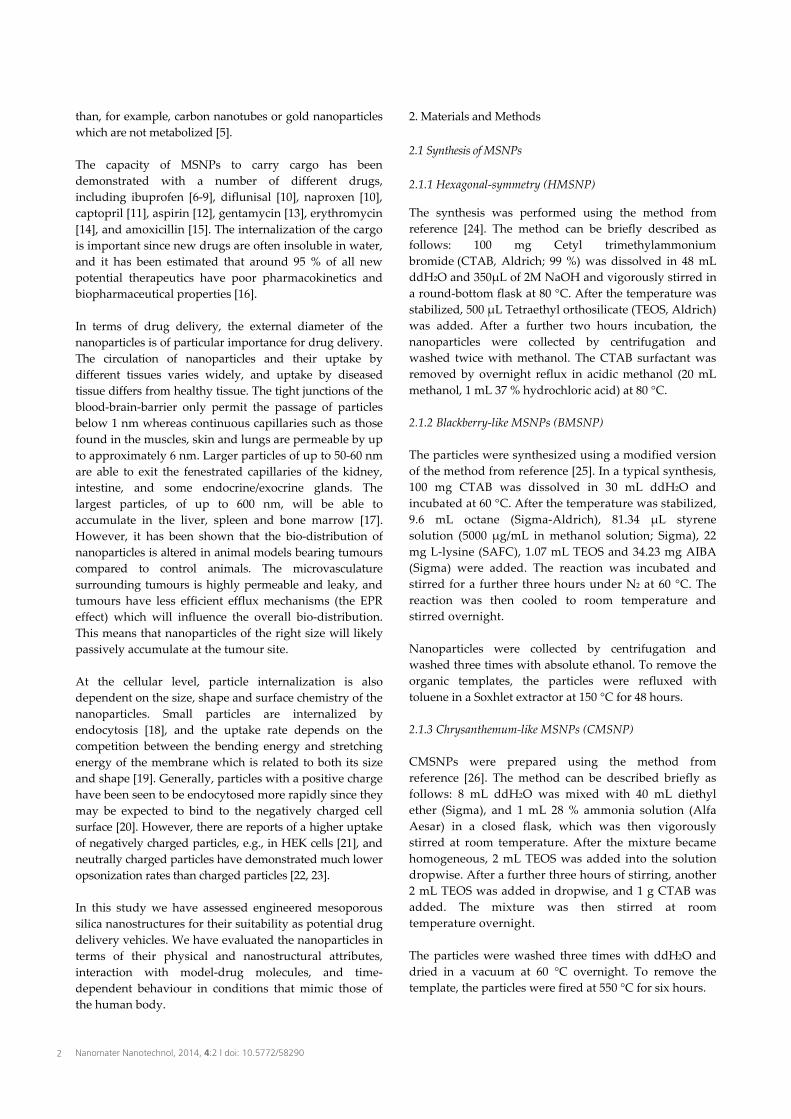
2. Materials and Methods 2.1 Synthesis of MSNPs 2.1.1 Hexagonal-symmetry (HMSNP)
The synthesis was performed using the method from reference [24]. The method can be briefly described as follows: 100 mg Cetyl trimethylammonium bromide (CTAB, Aldrich; 99 %) was dissolved in 48 mL ddH2O and 350µL of 2M NaOH and vigorously stirred in a round-bottom flask at 80 °C. After the temperature was stabilized, 500 µL Tetraethyl orthosilicate (TEOS, Aldrich) was added. After a further two hours incubation, the nanoparticles were collected by centrifugation and washed twice with methanol. The CTAB surfactant was removed by overnight reflux in acidic methanol (20 mL methanol, 1 mL 37 % hydrochloric acid) at 80 °C. 2.1.2 Blackberry-like MSNPs (BMSNP) The particles were synthesized using a modified version of the method from reference [25]. In a typical synthesis, 100 mg CTAB was dissolved in 30 mL ddH2O and incubated at 60 °C. After the temperature was stabilized, 9.6 mL octane (Sigma-Aldrich), 81.34 µL styrene solution (5000 µg/mL in methanol solution; Sigma), 22 mg L-lysine (SAFC), 1.07 mL TEOS and 34.23 mg AIBA (Sigma) were added. The reaction was incubated and stirred for a further three hours under N2 at 60 °C. The reaction was then cooled to room temperature and stirred overnight. Nanoparticles were collected by centrifugation and washed three times with absolute ethanol. To remove the organic templates, the particles were refluxed with toluene in a Soxhlet extractor at 150 °C for 48 hours. 2.1.3 Chrysanthemum-like MSNPs (CMSNP) CMSNPs were prepared using the method from reference [26]. The method can be described briefly as follows: 8 mL ddH2O was mixed with 40 mL diethyl ether (Sigma), and 1 mL 28 % ammonia solution (Alfa Aesar) in a closed flask, which was then vigorously stirred at room temperature. After the mixture became homogeneous, 2 mL TEOS was added into the solution dropwise. After a further three hours of stirring, another 2 mL TEOS was added in dropwise, and 1 g CTAB was added. The mixture was then stirred at room temperature overnight. The particles were washed three times with ddH2O and dried in a vacuum at 60 °C overnight. To remove the template, the particles were fired at 550 °C for six hours.
Nanomater Nanotechnol, 2014, 4:2 | doi: 10.5772/582902
2.1.4 Amorphous silica The synthesis was performed using the method from reference [27]. 36.8 mL absolute ethanol was mixed with 20.25 mL ddH2O in a flask in a sonicating water bath at room temperature. After 10 minutes, 0.5 mL TEOS was added in. The mixture was sonicated for a further 20 minutes before the 54.44 mL 28% ammonia solution was added dropwise. The reaction was continued for another hour with sonication. The particles were collected by centrifugation and washed twice with ddH2O. 2.2 Electron Microscopy Specimens for transmission electron microscopy (TEM) analysis were made by drop-casting particles onto holey carbon coated TEM grids (Agar). Bright field imaging and high-resolution (HRTEM) imaging were performed using a JEOL JEM-2010 microscope operating at 200 kV. A high-angle annular dark field scanning transmission electron microscopy (HAADF-STEM) was conducted using a JEOL JEM-3000F microscope operating at 300 kV. Tilt-series imaging was facilitated by mounting specimens in a specialist tomography holder (Fischione Instruments Inc.). Specimens were also analysed with scanning electron microscopy (SEM), with backscattered electron images being obtained from a JEOL JSM-840A instrument operating at a primary energy of 10 kV. An analysis of the electron microscopy data was performed using the DigitalMicrograph™ (Gatan Inc.) software. 2.3 External size analysis The hydrodynamic particle size distributions were measured using a Disc Centrifuge (DC 18000; CPS instrument). A sucrose gradient was prepared, and the machine operated at 24,000 rpm. PVC calibration standard (0.377 µm) was applied. All the particles were measured in triplicate. The main peak, standard deviation and polydispersity index were collected. 2.4 Surface analysis 2.4.1 BET The surface area was evaluated with nitrogen adsorption-desorption isotherm measurements on a Gemini VI (Micromeritics Corp. Atlanta, GA) surface analyser at -196 oC. The nanoparticles were degassed at 50 °C
overnight before analysis. The surface areas were calculated with Brunauer-Emmett-Teller (BET) [28] theory using isotherm adsorption data at P/P0 from 0.05 to 0.30.
SABET = �������������������������
Where SABET is the BET surface area (m2/g); CSA is the analysis gas molecular cross-sectional area (0.162 nm2 for N2); NA is the Avogadro constant 6.023 × 10²³; S is the slope (g/cm3); YINT is the Y-intercept (g/cm3). 2.4.2 BJH The pore volume and pore size distributions were obtained from an adsorption branch by using the Barrett, Joyner and Halenda (BJH) method [29].
rp = ����������� �
+ 3.54 ×( ����� ����
)0.333
Where rp is pore radius (Å). 2.4.3 Calculated surface characteristics The outer surface area of the nanoparticles was calculated using the following formula: The outer surface area of one MSNP:
Ssingle = πd2
Where ‘d’ is the outer dimension of one MSNP. Total outer surface area of one MSNP:
Souter = N·Ssingle
Where ‘N’ is the number of nanoparticles. In every one gram of MSNP, set N = 1 g/msingle where msingle is the mass of one HMSNP. msingle = ρ·Vsingle, where ‘ρ’ is the equivalent density of mesoporous silica material and Vsingle is the overall volume of one MSNP, which is equal to 1/6 πd3
ρ = ����������
= ���������������
= ����
��������������
Here ρsilica is the density of the silica; Vpores is the volume of the pores in MSNPs. Therefore:
Souter = N·Ssingle = ���������
· Ssingle
= ��������
· Ssingle
= ����
����������������
������ · πd2
Xinyue Huang, Neil P Young and Helen E Townley: Characterisation and Comparison of Mesoporous Silica Particles for Optimised Drug Delivery
3

Here, ‘d’ is measured using TEM and the values for Vpores are determined experimentally (section 2.3), while the other parameters are constants. (Surface area of pores, Spores = SBET - Souter) 2.5 MSNP Adsorption/ Desorption of cargo The fluorescent dyes calcein (Ex. 495, Em. 515 nm) and Rhodamine B were used as model drugs to examine the loading and unloading of the nanoparticles. The MSNPs were resuspended in water. Calcein was suspended in dimethylformamide (DMF) and added to the nanoparticle suspension at a final concentration of 3 mg/mL. The particles were incubated at room temperature, with constant stirring for 24 hours. The particles were collected by centrifugation and washed with methanol: H2O (1:1 v/v) three times. To determine the dye release, the MSNPs were re-suspended in PBS at a concentration of 10 mg/mL. Calcein, released from uncoated or eight layers of PAH/PSS coated HMSNPs, was tracked using an Infinite 200 plate reader (Tecan) over 60 hours at 10 minute intervals (see also section 2.6). The filter sets used for Calcein were Excitation 465(35), Emission 510(10), and for Rhodamine B Excitation 544(25), and Emission 612(10). 2.6 MSNPs capped with polyelectrolyte The MSNPs were capped with a repeating sandwich layer of the polycation, poly-allylamine hydrochloride (PAH; Sigma-Aldrich) and the polyanion, poly-sodium 4-styrene sulfonate (PSS; Sigma). 200 mg MSNP was added to 20 mL Capping Buffer (20 mM Tris, 20 mM NaCl, pH 8.5) and resuspended by sonication for three minutes. PAH or PSS was resuspended in a Capping Buffer at 20mg/mL. 0.5 mL PAH solution was added to the MSNP suspension and incubated and stirred for 30 minutes at room temperature. The PAH capped particles were then collected by centrifugation and washed three times with ddH2O. Alternate PAH/PSS layers were added to the particles, until the desired number of layers had been achieved. 2.7 Degradation of MSNPs The MSNPs were suspended in a physiological buffer; Dulbecco’s Phosphate Buffered Saline without Calcium chloride or Magnesium chloride (8 g Sodium Chloride, 0.2 g Potassium Phosphate, monobasic, 1.15 g Sodium Phosphate, dibasic, and 0.2 g Potassium Chloride per litre; Sigma). The particles were sonicated for 15 minutes in a sonicating water bath to ensure their complete resuspension. The MSNPs were subsequently incubated at 37 °C and samples were periodically removed for TEM imaging.
3. Results and Discussion 3.1 Size and morphology of nanoparticles The nanoparticle’s morphology and external diameter, in addition to their surface area and pore architecture are all key parameters in determining the utility of synthesized nanoparticles for in vivo nanoparticulate drug delivery applications. Mesoporous silica nanoparticles are attractive candidates for drug delivery and, consequently, our current study compares three different particle morphologies all synthesized with an aspect ratio of approximately 1:1.
Figure 1. Characterization of three families of synthesized mesoporous silica nanoparticles via electron microscopy. (a) and (b) show scanning electron and transmission electron micrographs of HMSNPs, respectively (c) and (d) show SEM and TEM micrographs of BMSNPs, and (e) and (f) show SEM and TEM micrographs of CMSNPs. In each case, the SEM micrograph shows an aggregate of particles, while the higher-resolution TEM imaging reveals further information regarding the extent and internal structure of individual nanoparticles. Figure 1 shows the general morphology of each set of nanoparticles described in this article, characterized withboth SEM and TEM. This combination of techniques enables us to visualize individual nanoparticles and associated particle-aggregate morphologies, in addition to the detailed internal structure of particles. Figure 1a and 1b show SEM and TEM micrographs of Hexagonal-
Nanomater Nanotechnol, 2014, 4:2 | doi: 10.5772/582904
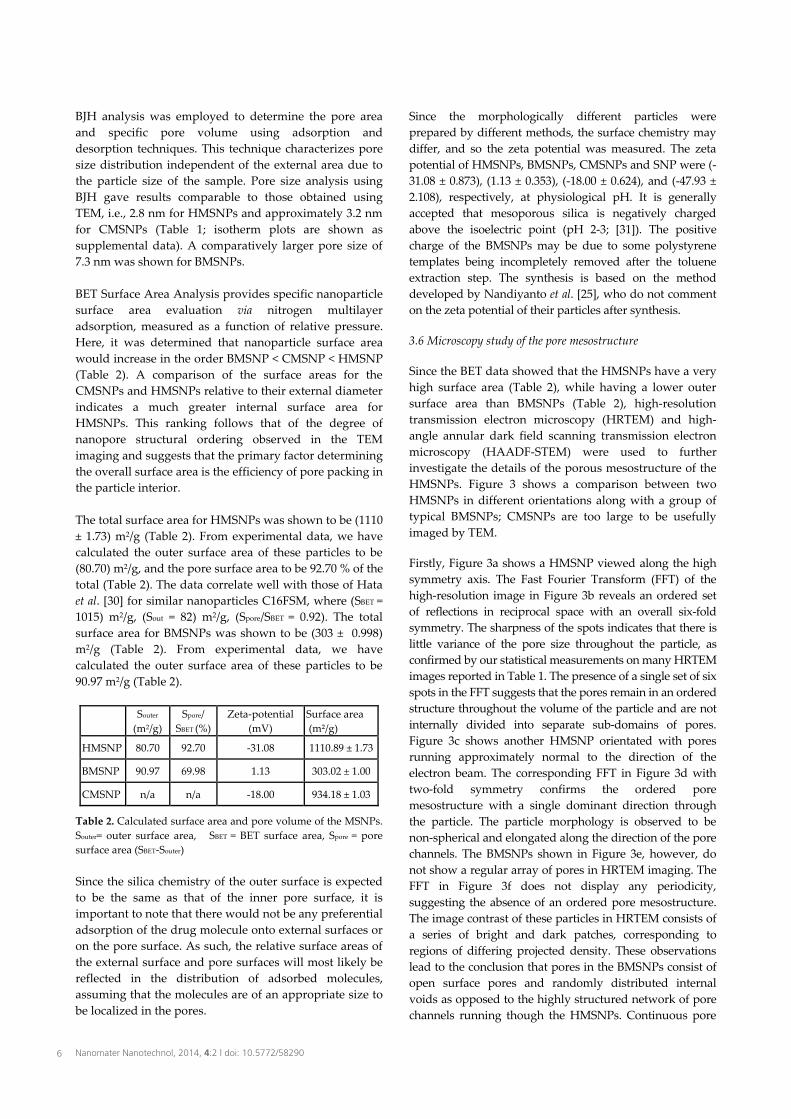
Particle Size (nm) Pore size (nm) TEM CPS TEM BJH
Size No. measured Size PDI Size
No. meas-ured Adsorption Desorption
HMSNP 105.66 ± 23.11 431 98.77 1.32 2.13±0.21 544 2.87 2.89 BMSNP 63.82 ± 7.39 47 57.47 1.90 Not measurable 7.30 6.09 CMSNP 754.75 ± 313.69 7 998.81 3.20 2.03±1.22 83 3.28 3.22
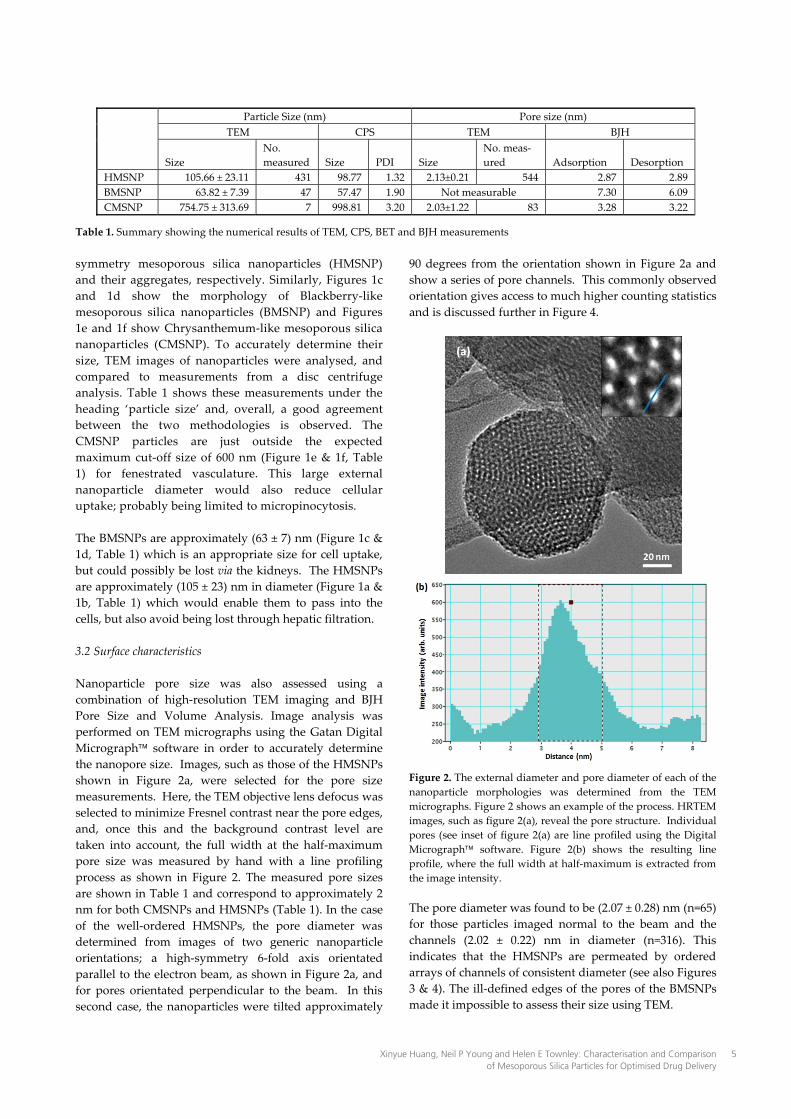
Table 1. Summary showing the numerical results of TEM, CPS, BET and BJH measurements symmetry mesoporous silica nanoparticles (HMSNP) and their aggregates, respectively. Similarly, Figures 1c and 1d show the morphology of Blackberry-like mesoporous silica nanoparticles (BMSNP) and Figures 1e and 1f show Chrysanthemum-like mesoporous silica nanoparticles (CMSNP). To accurately determine their size, TEM images of nanoparticles were analysed, and compared to measurements from a disc centrifuge analysis. Table 1 shows these measurements under the heading ‘particle size’ and, overall, a good agreement between the two methodologies is observed. The CMSNP particles are just outside the expected maximum cut-off size of 600 nm (Figure 1e & 1f, Table 1) for fenestrated vasculature. This large external nanoparticle diameter would also reduce cellular uptake; probably being limited to micropinocytosis. The BMSNPs are approximately (63 ± 7) nm (Figure 1c & 1d, Table 1) which is an appropriate size for cell uptake, but could possibly be lost via the kidneys. The HMSNPs are approximately (105 ± 23) nm in diameter (Figure 1a & 1b, Table 1) which would enable them to pass into the cells, but also avoid being lost through hepatic filtration. 3.2 Surface characteristics Nanoparticle pore size was also assessed using a combination of high-resolution TEM imaging and BJH Pore Size and Volume Analysis. Image analysis was performed on TEM micrographs using the Gatan Digital Micrograph software in order to accurately determine the nanopore size. Images, such as those of the HMSNPs shown in Figure 2a, were selected for the pore size measurements. Here, the TEM objective lens defocus was selected to minimize Fresnel contrast near the pore edges, and, once this and the background contrast level are taken into account, the full width at the half-maximum pore size was measured by hand with a line profiling process as shown in Figure 2. The measured pore sizes are shown in Table 1 and correspond to approximately 2 nm for both CMSNPs and HMSNPs (Table 1). In the case of the well-ordered HMSNPs, the pore diameter was determined from images of two generic nanoparticle orientations; a high-symmetry 6-fold axis orientated parallel to the electron beam, as shown in Figure 2a, and for pores orientated perpendicular to the beam. In this second case, the nanoparticles were tilted approximately
90 degrees from the orientation shown in Figure 2a and show a series of pore channels. This commonly observed orientation gives access to much higher counting statistics and is discussed further in Figure 4.
Figure 2. The external diameter and pore diameter of each of the nanoparticle morphologies was determined from the TEM micrographs. Figure 2 shows an example of the process. HRTEM images, such as figure 2(a), reveal the pore structure. Individual pores (see inset of figure 2(a) are line profiled using the Digital Micrograph software. Figure 2(b) shows the resulting line profile, where the full width at half-maximum is extracted from the image intensity. The pore diameter was found to be (2.07 ± 0.28) nm (n=65) for those particles imaged normal to the beam and the channels (2.02 ± 0.22) nm in diameter (n=316). This indicates that the HMSNPs are permeated by ordered arrays of channels of consistent diameter (see also Figures 3 & 4). The ill-defined edges of the pores of the BMSNPs made it impossible to assess their size using TEM.
Xinyue Huang, Neil P Young and Helen E Townley: Characterisation and Comparison of Mesoporous Silica Particles for Optimised Drug Delivery
5
BJH analysis was employed to determine the pore area and specific pore volume using adsorption and desorption techniques. This technique characterizes pore size distribution independent of the external area due to the particle size of the sample. Pore size analysis using BJH gave results comparable to those obtained usingTEM, i.e., 2.8 nm for HMSNPs and approximately 3.2 nm for CMSNPs (Table 1; isotherm plots are shown as supplemental data). A comparatively larger pore size of 7.3 nm was shown for BMSNPs. BET Surface Area Analysis provides specific nanoparticle surface area evaluation via nitrogen multilayer adsorption, measured as a function of relative pressure. Here, it was determined that nanoparticle surface area would increase in the order BMSNP < CMSNP < HMSNP (Table 2). A comparison of the surface areas for the CMSNPs and HMSNPs relative to their external diameter indicates a much greater internal surface area for HMSNPs. This ranking follows that of the degree of nanopore structural ordering observed in the TEM imaging and suggests that the primary factor determining the overall surface area is the efficiency of pore packing in the particle interior. The total surface area for HMSNPs was shown to be (1110 ± 1.73) m2/g (Table 2). From experimental data, we have calculated the outer surface area of these particles to be (80.70) m2/g, and the pore surface area to be 92.70 % of the total (Table 2). The data correlate well with those of Hataet al. [30] for similar nanoparticles C16FSM, where (SBET = 1015) m2/g, (Sout = 82) m2/g, (Spore/SBET = 0.92). The total surface area for BMSNPs was shown to be (303 ± 0.998) m2/g (Table 2). From experimental data, we have calculated the outer surface area of these particles to be 90.97 m2/g (Table 2).
Souter
(m2/g) Spore/
SBET (%) Zeta-potential
(mV) Surface area (m²/g)
HMSNP 80.70 92.70 -31.08 1110.89 ± 1.73
BMSNP 90.97 69.98 1.13 303.02 ± 1.00
CMSNP n/a n/a -18.00 934.18 ± 1.03
Table 2. Calculated surface area and pore volume of the MSNPs. Souter= outer surface area, SBET = BET surface area, Spore = pore surface area (SBET-Souter) Since the silica chemistry of the outer surface is expected to be the same as that of the inner pore surface, it is important to note that there would not be any preferential adsorption of the drug molecule onto external surfaces or on the pore surface. As such, the relative surface areas of the external surface and pore surfaces will most likely be reflected in the distribution of adsorbed molecules, assuming that the molecules are of an appropriate size to be localized in the pores.
Since the morphologically different particles were prepared by different methods, the surface chemistry may differ, and so the zeta potential was measured. The zeta potential of HMSNPs, BMSNPs, CMSNPs and SNP were (-31.08 ± 0.873), (1.13 ± 0.353), (-18.00 ± 0.624), and (-47.93 ± 2.108), respectively, at physiological pH. It is generally accepted that mesoporous silica is negatively charged above the isoelectric point (pH 2-3; [31]). The positive charge of the BMSNPs may be due to some polystyrene templates being incompletely removed after the toluene extraction step. The synthesis is based on the method developed by Nandiyanto et al. [25], who do not comment on the zeta potential of their particles after synthesis. 3.6 Microscopy study of the pore mesostructure
Since the BET data showed that the HMSNPs have a very high surface area (Table 2), while having a lower outer surface area than BMSNPs (Table 2), high-resolution transmission electron microscopy (HRTEM) and high-angle annular dark field scanning transmission electron microscopy (HAADF-STEM) were used to further investigate the details of the porous mesostructure of the HMSNPs. Figure 3 shows a comparison between two HMSNPs in different orientations along with a group of typical BMSNPs; CMSNPs are too large to be usefully imaged by TEM. Firstly, Figure 3a shows a HMSNP viewed along the high symmetry axis. The Fast Fourier Transform (FFT) of the high-resolution image in Figure 3b reveals an ordered set of reflections in reciprocal space with an overall six-fold symmetry. The sharpness of the spots indicates that there is little variance of the pore size throughout the particle, as confirmed by our statistical measurements on many HRTEM images reported in Table 1. The presence of a single set of six spots in the FFT suggests that the pores remain in an ordered structure throughout the volume of the particle and are not internally divided into separate sub-domains of pores. Figure 3c shows another HMSNP orientated with pores running approximately normal to the direction of the electron beam. The corresponding FFT in Figure 3d with two-fold symmetry confirms the ordered pore mesostructure with a single dominant direction through the particle. The particle morphology is observed to be non-spherical and elongated along the direction of the pore channels. The BMSNPs shown in Figure 3e, however, do not show a regular array of pores in HRTEM imaging. The FFT in Figure 3f does not display any periodicity, suggesting the absence of an ordered pore mesostructure. The image contrast of these particles in HRTEM consists of a series of bright and dark patches, corresponding to regions of differing projected density. These observations lead to the conclusion that pores in the BMSNPs consist of open surface pores and randomly distributed internal voids as opposed to the highly structured network of pore channels running though the HMSNPs. Continuous pore
Nanomater Nanotechnol, 2014, 4:2 | doi: 10.5772/582906
channels running through the interior of HMSNPs would account for the high surface area of these particles and also their desirable degradation characteristics. Here liquid would be able to penetrate the interior of the particle, allowing structural degradation to occur simultaneously from the exterior and core of the particle.
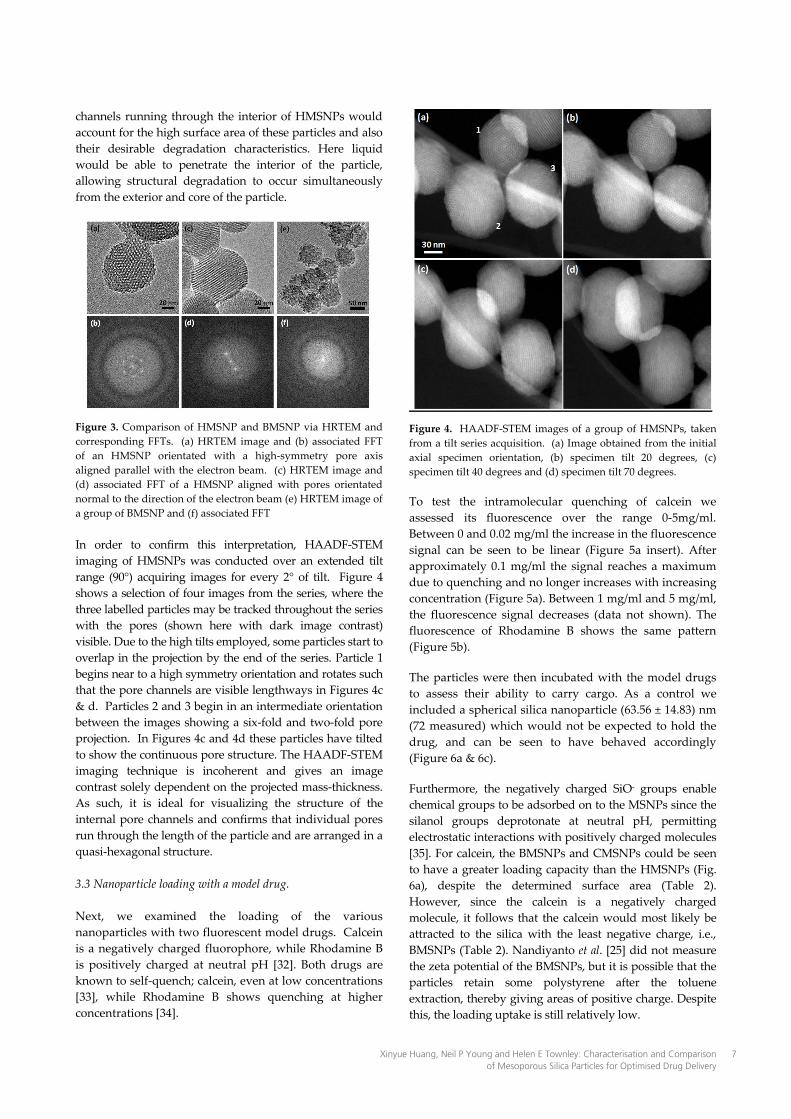
Figure 3. Comparison of HMSNP and BMSNP via HRTEM and corresponding FFTs. (a) HRTEM image and (b) associated FFT of an HMSNP orientated with a high-symmetry pore axis aligned parallel with the electron beam. (c) HRTEM image and (d) associated FFT of a HMSNP aligned with pores orientated normal to the direction of the electron beam (e) HRTEM image of a group of BMSNP and (f) associated FFT In order to confirm this interpretation, HAADF-STEM imaging of HMSNPs was conducted over an extended tilt range (90°) acquiring images for every 2° of tilt. Figure 4 shows a selection of four images from the series, where the three labelled particles may be tracked throughout the series with the pores (shown here with dark image contrast) visible. Due to the high tilts employed, some particles start to overlap in the projection by the end of the series. Particle 1 begins near to a high symmetry orientation and rotates such that the pore channels are visible lengthways in Figures 4c & d. Particles 2 and 3 begin in an intermediate orientation between the images showing a six-fold and two-fold pore projection. In Figures 4c and 4d these particles have tilted to show the continuous pore structure. The HAADF-STEM imaging technique is incoherent and gives an image contrast solely dependent on the projected mass-thickness. As such, it is ideal for visualizing the structure of the internal pore channels and confirms that individual pores run through the length of the particle and are arranged in a quasi-hexagonal structure. 3.3 Nanoparticle loading with a model drug. Next, we examined the loading of the various nanoparticles with two fluorescent model drugs. Calcein is a negatively charged fluorophore, while Rhodamine B is positively charged at neutral pH [32]. Both drugs are known to self-quench; calcein, even at low concentrations [33], while Rhodamine B shows quenching at higher concentrations [34].
Figure 4. HAADF-STEM images of a group of HMSNPs, taken from a tilt series acquisition. (a) Image obtained from the initial axial specimen orientation, (b) specimen tilt 20 degrees, (c) specimen tilt 40 degrees and (d) specimen tilt 70 degrees. To test the intramolecular quenching of calcein we assessed its fluorescence over the range 0-5mg/ml. Between 0 and 0.02 mg/ml the increase in the fluorescence signal can be seen to be linear (Figure 5a insert). After approximately 0.1 mg/ml the signal reaches a maximum due to quenching and no longer increases with increasing concentration (Figure 5a). Between 1 mg/ml and 5 mg/ml, the fluorescence signal decreases (data not shown). The fluorescence of Rhodamine B shows the same pattern (Figure 5b). The particles were then incubated with the model drugs to assess their ability to carry cargo. As a control we included a spherical silica nanoparticle (63.56 ± 14.83) nm (72 measured) which would not be expected to hold the drug, and can be seen to have behaved accordingly (Figure 6a & 6c). Furthermore, the negatively charged SiO- groups enable chemical groups to be adsorbed on to the MSNPs since the silanol groups deprotonate at neutral pH, permitting electrostatic interactions with positively charged molecules [35]. For calcein, the BMSNPs and CMSNPs could be seen to have a greater loading capacity than the HMSNPs (Fig. 6a), despite the determined surface area (Table 2). However, since the calcein is a negatively charged molecule, it follows that the calcein would most likely be attracted to the silica with the least negative charge, i.e., BMSNPs (Table 2). Nandiyanto et al. [25] did not measure the zeta potential of the BMSNPs, but it is possible that the particles retain some polystyrene after the toluene extraction, thereby giving areas of positive charge. Despite this, the loading uptake is still relatively low.
Xinyue Huang, Neil P Young and Helen E Townley: Characterisation and Comparison of Mesoporous Silica Particles for Optimised Drug Delivery
7
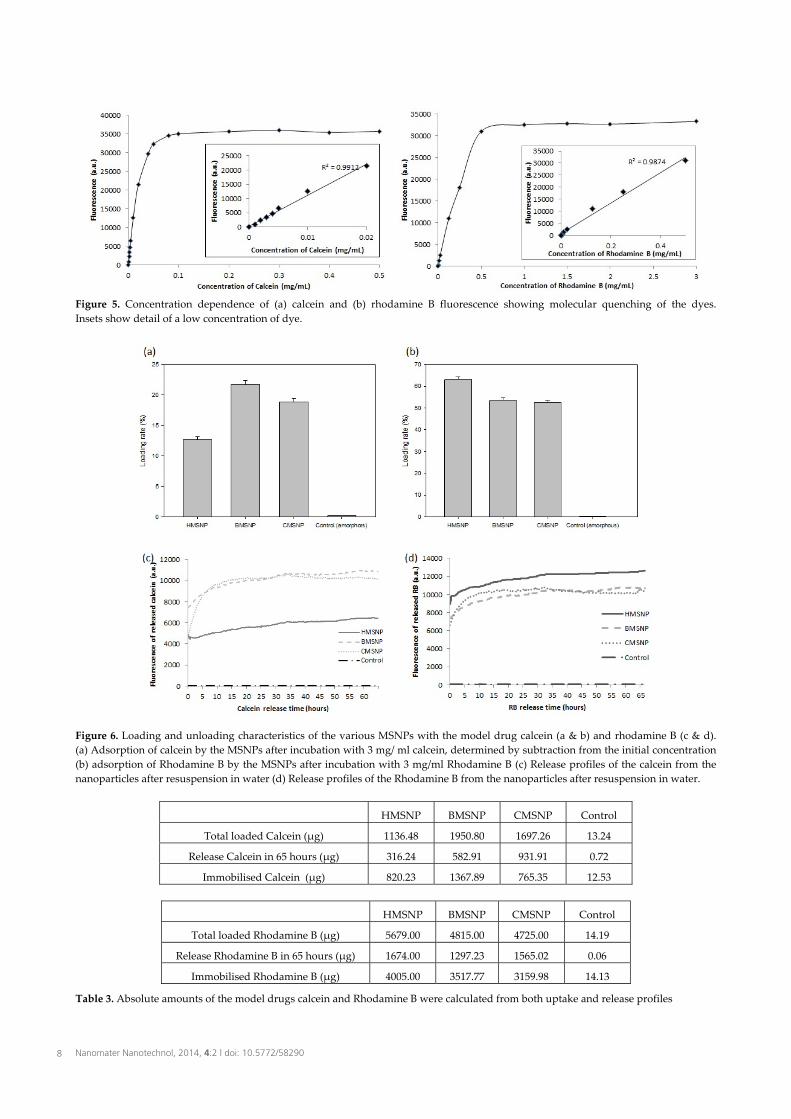
Figure 5. Concentration dependence of (a) calcein and (b) rhodamine B fluorescence showing molecular quenching of the dyes. Insets show detail of a low concentration of dye.
Figure 6. Loading and unloading characteristics of the various MSNPs with the model drug calcein (a & b) and rhodamine B (c & d). (a) Adsorption of calcein by the MSNPs after incubation with 3 mg/ ml calcein, determined by subtraction from the initial concentration (b) adsorption of Rhodamine B by the MSNPs after incubation with 3 mg/ml Rhodamine B (c) Release profiles of the calcein from the nanoparticles after resuspension in water (d) Release profiles of the Rhodamine B from the nanoparticles after resuspension in water.
HMSNP BMSNP CMSNP Control
Total loaded Calcein (µg) 1136.48 1950.80 1697.26 13.24
Release Calcein in 65 hours (µg) 316.24 582.91 931.91 0.72
Immobilised Calcein (µg) 820.23 1367.89 765.35 12.53
HMSNP BMSNP CMSNP Control
Total loaded Rhodamine B (µg) 5679.00 4815.00 4725.00 14.19
Release Rhodamine B in 65 hours (µg) 1674.00 1297.23 1565.02 0.06
Immobilised Rhodamine B (µg) 4005.00 3517.77 3159.98 14.13
Table 3. Absolute amounts of the model drugs calcein and Rhodamine B were calculated from both uptake and release profiles
Nanomater Nanotechnol, 2014, 4:2 | doi: 10.5772/582908
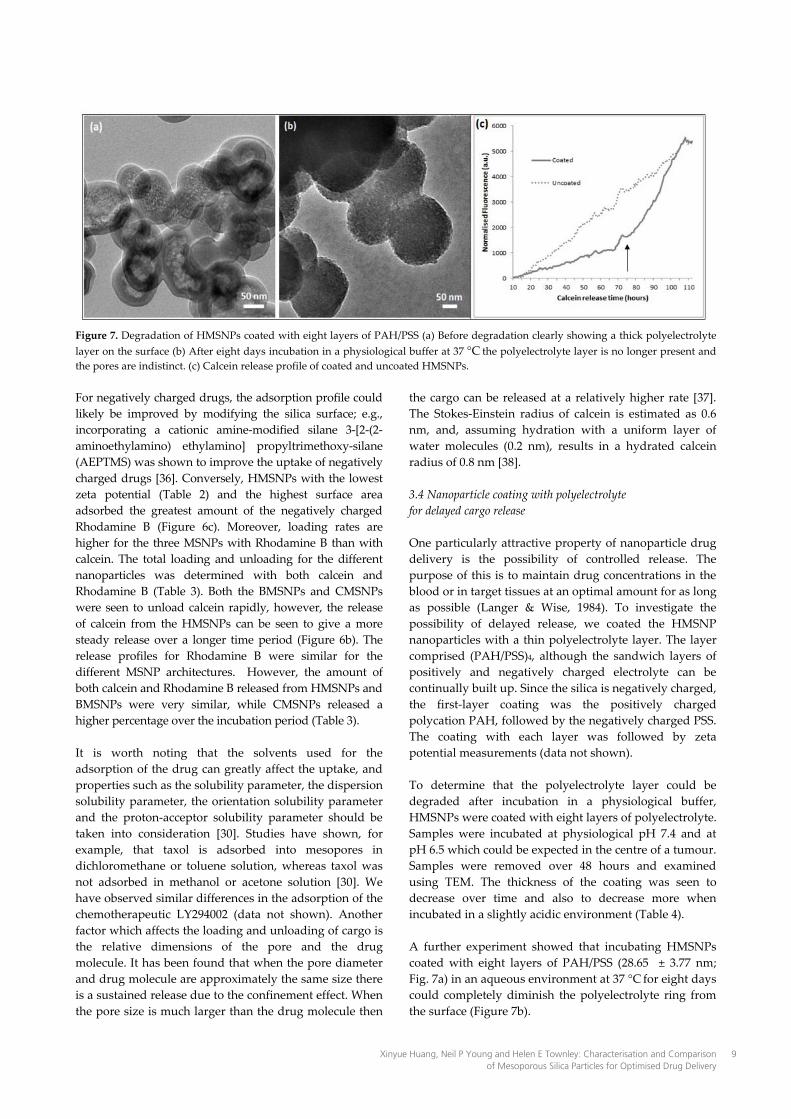
Figure 7. Degradation of HMSNPs coated with eight layers of PAH/PSS (a) Before degradation clearly showing a thick polyelectrolyte layer on the surface (b) After eight days incubation in a physiological buffer at 37 °C the polyelectrolyte layer is no longer present and the pores are indistinct. (c) Calcein release profile of coated and uncoated HMSNPs. For negatively charged drugs, the adsorption profile could likely be improved by modifying the silica surface; e.g., incorporating a cationic amine-modified silane 3-[2-(2-aminoethylamino) ethylamino] propyltrimethoxy-silane (AEPTMS) was shown to improve the uptake of negatively charged drugs [36]. Conversely, HMSNPs with the lowest zeta potential (Table 2) and the highest surface area adsorbed the greatest amount of the negatively charged Rhodamine B (Figure 6c). Moreover, loading rates are higher for the three MSNPs with Rhodamine B than with calcein. The total loading and unloading for the different nanoparticles was determined with both calcein and Rhodamine B (Table 3). Both the BMSNPs and CMSNPs were seen to unload calcein rapidly, however, the release of calcein from the HMSNPs can be seen to give a more steady release over a longer time period (Figure 6b). The release profiles for Rhodamine B were similar for the different MSNP architectures. However, the amount of both calcein and Rhodamine B released from HMSNPs and BMSNPs were very similar, while CMSNPs released a higher percentage over the incubation period (Table 3). It is worth noting that the solvents used for the adsorption of the drug can greatly affect the uptake, and properties such as the solubility parameter, the dispersion solubility parameter, the orientation solubility parameter and the proton-acceptor solubility parameter should be taken into consideration [30]. Studies have shown, for example, that taxol is adsorbed into mesopores in dichloromethane or toluene solution, whereas taxol was not adsorbed in methanol or acetone solution [30]. We have observed similar differences in the adsorption of the chemotherapeutic LY294002 (data not shown). Another factor which affects the loading and unloading of cargo is the relative dimensions of the pore and the drug molecule. It has been found that when the pore diameter and drug molecule are approximately the same size there is a sustained release due to the confinement effect. When the pore size is much larger than the drug molecule then
the cargo can be released at a relatively higher rate [37]. The Stokes-Einstein radius of calcein is estimated as 0.6 nm, and, assuming hydration with a uniform layer of water molecules (0.2 nm), results in a hydrated calcein radius of 0.8 nm [38].
3.4 Nanoparticle coating with polyelectrolyte for delayed cargo release
One particularly attractive property of nanoparticle drug delivery is the possibility of controlled release. The purpose of this is to maintain drug concentrations in the blood or in target tissues at an optimal amount for as long as possible (Langer & Wise, 1984). To investigate the possibility of delayed release, we coated the HMSNP nanoparticles with a thin polyelectrolyte layer. The layer comprised (PAH/PSS)4, although the sandwich layers of positively and negatively charged electrolyte can be continually built up. Since the silica is negatively charged, the first-layer coating was the positively charged polycation PAH, followed by the negatively charged PSS. The coating with each layer was followed by zeta potential measurements (data not shown). To determine that the polyelectrolyte layer could be degraded after incubation in a physiological buffer, HMSNPs were coated with eight layers of polyelectrolyte. Samples were incubated at physiological pH 7.4 and at pH 6.5 which could be expected in the centre of a tumour. Samples were removed over 48 hours and examined using TEM. The thickness of the coating was seen to decrease over time and also to decrease more when incubated in a slightly acidic environment (Table 4). A further experiment showed that incubating HMSNPs coated with eight layers of PAH/PSS (28.65 ± 3.77 nm; Fig. 7a) in an aqueous environment at 37 °C for eight days could completely diminish the polyelectrolyte ring from the surface (Figure 7b).
Xinyue Huang, Neil P Young and Helen E Townley: Characterisation and Comparison of Mesoporous Silica Particles for Optimised Drug Delivery
9
0hrs 24hrs, pH 7.4 24hrs, pH 6.5 48hrs, pH 7.4 48hrs, pH 6.5
Average thickness 24.45 20.12 19.21 18.08 13.18
Standard Deviation 2.35 2.38 2.58 2.2 3.25
Number measured 40 39 34 56 12
Table 4. Thickness of polyelectrolyte coating after incubation in a physiological buffer at either pH 6.5 or pH 7.4, as determined from TEM images.
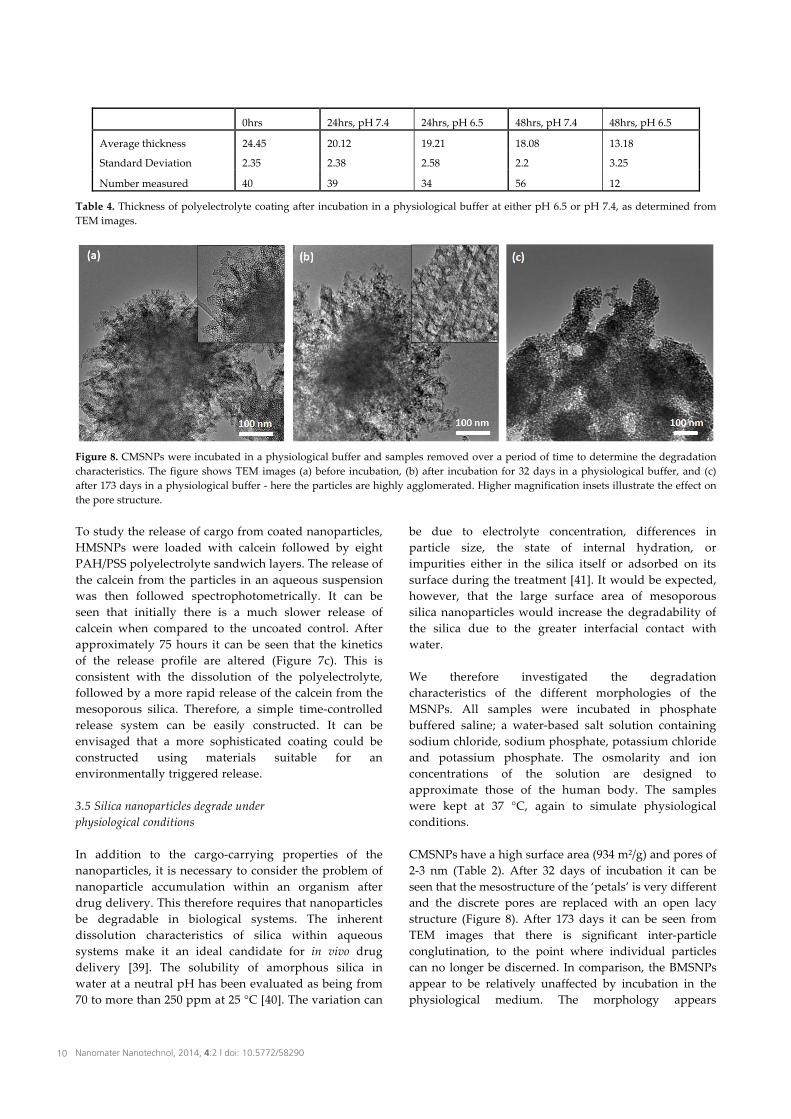
Figure 8. CMSNPs were incubated in a physiological buffer and samples removed over a period of time to determine the degradation characteristics. The figure shows TEM images (a) before incubation, (b) after incubation for 32 days in a physiological buffer, and (c) after 173 days in a physiological buffer - here the particles are highly agglomerated. Higher magnification insets illustrate the effect on the pore structure. To study the release of cargo from coated nanoparticles, HMSNPs were loaded with calcein followed by eight PAH/PSS polyelectrolyte sandwich layers. The release of the calcein from the particles in an aqueous suspension was then followed spectrophotometrically. It can be seen that initially there is a much slower release of calcein when compared to the uncoated control. After approximately 75 hours it can be seen that the kinetics of the release profile are altered (Figure 7c). This is consistent with the dissolution of the polyelectrolyte, followed by a more rapid release of the calcein from the mesoporous silica. Therefore, a simple time-controlled release system can be easily constructed. It can be envisaged that a more sophisticated coating could be constructed using materials suitable for an environmentally triggered release. 3.5 Silica nanoparticles degrade under physiological conditions In addition to the cargo-carrying properties of the nanoparticles, it is necessary to consider the problem of nanoparticle accumulation within an organism after drug delivery. This therefore requires that nanoparticles be degradable in biological systems. The inherent dissolution characteristics of silica within aqueous systems make it an ideal candidate for in vivo drug delivery [39]. The solubility of amorphous silica in water at a neutral pH has been evaluated as being from 70 to more than 250 ppm at 25 °C [40]. The variation can
be due to electrolyte concentration, differences in particle size, the state of internal hydration, or impurities either in the silica itself or adsorbed on its surface during the treatment [41]. It would be expected, however, that the large surface area of mesoporous silica nanoparticles would increase the degradability of the silica due to the greater interfacial contact with water. We therefore investigated the degradation characteristics of the different morphologies of the MSNPs. All samples were incubated in phosphate buffered saline; a water-based salt solution containing sodium chloride, sodium phosphate, potassium chloride and potassium phosphate. The osmolarity and ion concentrations of the solution are designed to approximate those of the human body. The samples were kept at 37 °C, again to simulate physiological conditions. CMSNPs have a high surface area (934 m2/g) and pores of 2-3 nm (Table 2). After 32 days of incubation it can be seen that the mesostructure of the ‘petals’ is very different and the discrete pores are replaced with an open lacy structure (Figure 8). After 173 days it can be seen from TEM images that there is significant inter-particle conglutination, to the point where individual particles can no longer be discerned. In comparison, the BMSNPs appear to be relatively unaffected by incubation in the physiological medium. The morphology appears
Nanomater Nanotechnol, 2014, 4:2 | doi: 10.5772/5829010
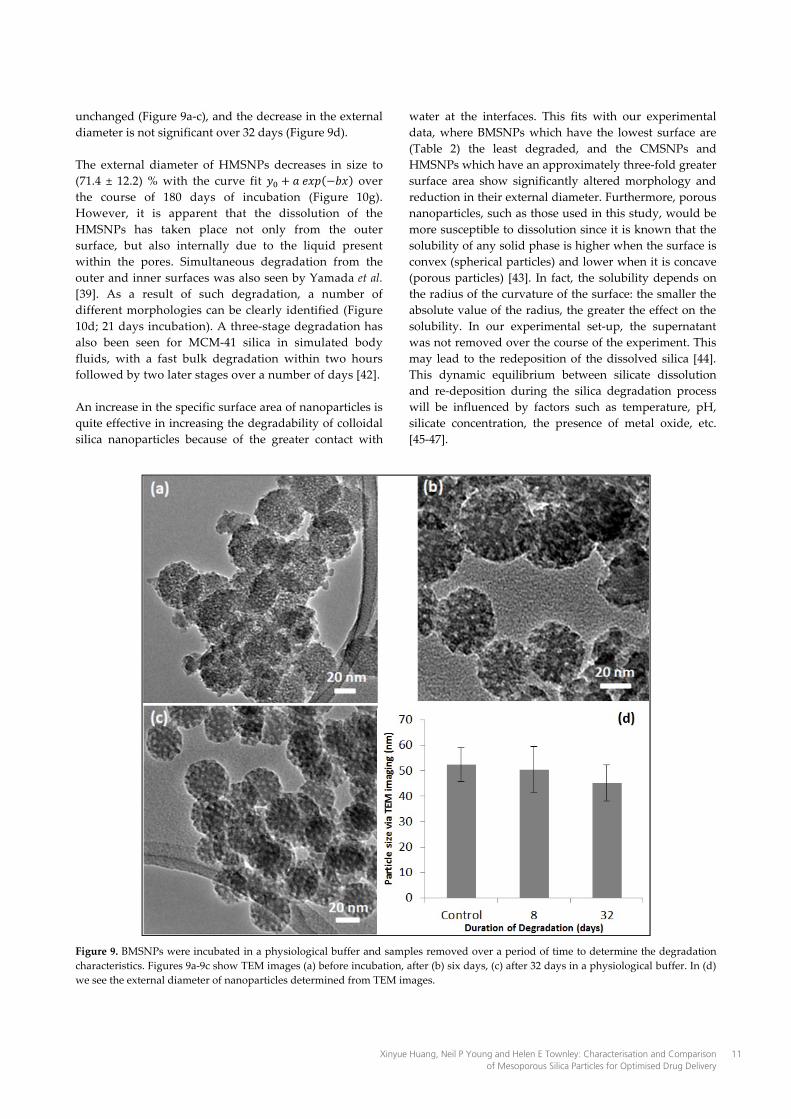
unchanged (Figure 9a-c), and the decrease in the external diameter is not significant over 32 days (Figure 9d). The external diameter of HMSNPs decreases in size to (71.4 ± 12.2) % with the curve fit over the course of 180 days of incubation (Figure 10g). However, it is apparent that the dissolution of the HMSNPs has taken place not only from the outer surface, but also internally due to the liquid present within the pores. Simultaneous degradation from the outer and inner surfaces was also seen by Yamada et al. [39]. As a result of such degradation, a number of different morphologies can be clearly identified (Figure 10d; 21 days incubation). A three-stage degradation has also been seen for MCM-41 silica in simulated body fluids, with a fast bulk degradation within two hours followed by two later stages over a number of days [42]. An increase in the specific surface area of nanoparticles is quite effective in increasing the degradability of colloidal silica nanoparticles because of the greater contact with
water at the interfaces. This fits with our experimental data, where BMSNPs which have the lowest surface are (Table 2) the least degraded, and the CMSNPs and HMSNPs which have an approximately three-fold greater surface area show significantly altered morphology and reduction in their external diameter. Furthermore, porous nanoparticles, such as those used in this study, would be more susceptible to dissolution since it is known that the solubility of any solid phase is higher when the surface is convex (spherical particles) and lower when it is concave (porous particles) [43]. In fact, the solubility depends on the radius of the curvature of the surface: the smaller the absolute value of the radius, the greater the effect on the solubility. In our experimental set-up, the supernatant was not removed over the course of the experiment. This may lead to the redeposition of the dissolved silica [44]. This dynamic equilibrium between silicate dissolution and re-deposition during the silica degradation process will be influenced by factors such as temperature, pH, silicate concentration, the presence of metal oxide, etc. [45-47].
Figure 9. BMSNPs were incubated in a physiological buffer and samples removed over a period of time to determine the degradation characteristics. Figures 9a-9c show TEM images (a) before incubation, after (b) six days, (c) after 32 days in a physiological buffer. In (d) we see the external diameter of nanoparticles determined from TEM images.
Xinyue Huang, Neil P Young and Helen E Townley: Characterisation and Comparison of Mesoporous Silica Particles for Optimised Drug Delivery
11
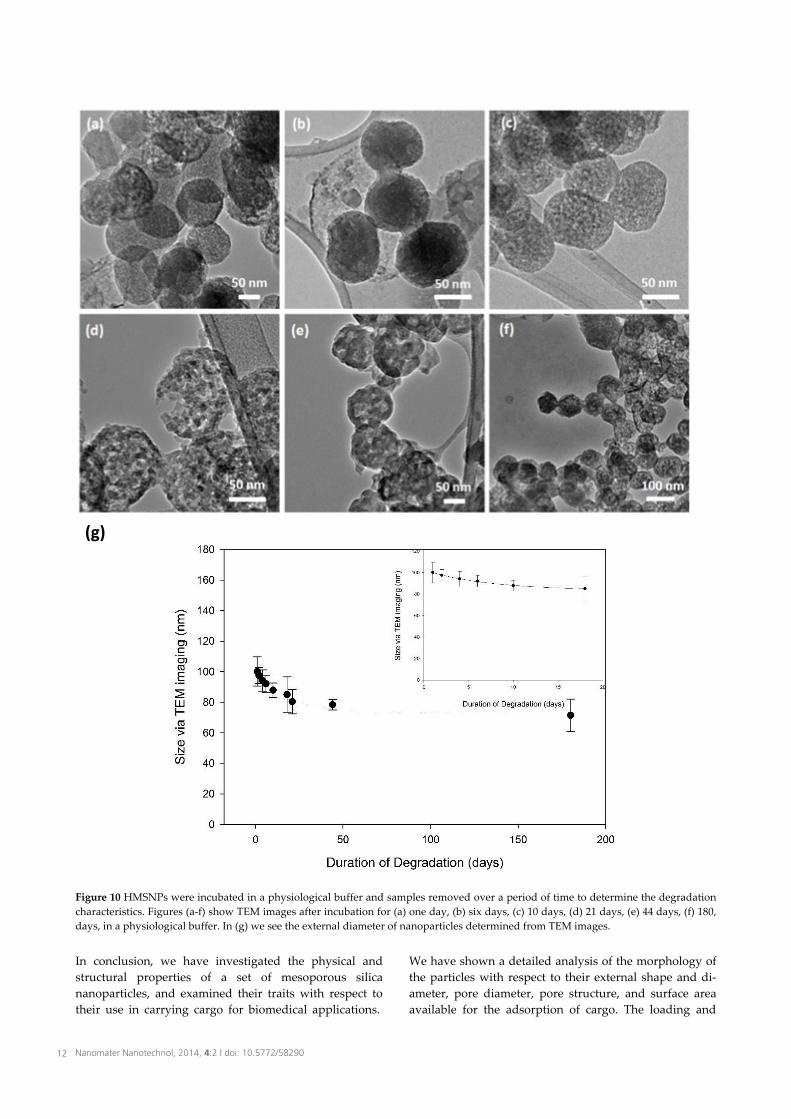
Figure 10 HMSNPs were incubated in a physiological buffer and samples removed over a period of time to determine the degradation characteristics. Figures (a-f) show TEM images after incubation for (a) one day, (b) six days, (c) 10 days, (d) 21 days, (e) 44 days, (f) 180, days, in a physiological buffer. In (g) we see the external diameter of nanoparticles determined from TEM images.
In conclusion, we have investigated the physical and structural properties of a set of mesoporous silica nanoparticles, and examined their traits with respect to their use in carrying cargo for biomedical applications.
We have shown a detailed analysis of the morphology of the particles with respect to their external shape and di-ameter, pore diameter, pore structure, and surface area available for the adsorption of cargo. The loading and
(g)
Nanomater Nanotechnol, 2014, 4:2 | doi: 10.5772/5829012
unloading characteristics of both positively and nega-tively charged model drugs were investigated. The selec-tion of the nanoparticles will largely depend upon the drug to be delivered, however, for many molecules, the HMSNPs will provide an ideal platform; these nanoparti-cles have a very high surface area, a pore size which is likely to be appropriate for containing the drug, and an external diameter suitable for extravasation from the blood stream and retention in the tumour. It has been demonstrated that a controlled release of the cargo is possible by modifying the surface of the particles with a polyelectrolyte; which also illustrates the scope for more sophisticated release mechanisms. Furthermore, we have investigated the degradation characteristics of the par-ticles under physiological conditions; which is important for determining the likely fate of the nanoparticles in vivo. From the data shown, it can be appreciated that careful pre-selection of the nanoparticle attributes will play a large part in the success of the delivery of pharmaceuti-cals to a site of interest, with controlled release, and con-sequent limited systemic toxicity. 4. Acknowledgments The authors would like to thank Rachel Morrison for the SEM images, and Begbroke Nano for access to material characterization equipment. HET would like to acknowledge Cancer Research UK for their support. 5. References [1] Colilla, M., B. Gonzalez, and M. Vallet-Regi (2013)
Mesoporous silica nanoparticles for the design of smart delivery nanodevices. Biomaterials Science, 1(2): p. 114-134.
[2] Tang, F., L. Li, and D. Chen (2012) Mesoporous Silica Nanoparticles: Synthesis, Biocompatibility and Drug Delivery. Advanced Materials, 24(12): p. 1504-1534.
[3] Huh, S., J.W. Wiench, B.G. Trewyn, S. Song, M. Pruski, et al. (2003) Tuning of particle morphology and pore properties in mesoporous silicas with multiple organic functional groups. Chemical Communications, 18: p. 2364-2365.
[4] Owens, D.E., and N.A. Peppas (2006) Opsonization, biodistribution, and pharmacokinetics of polymeric nanoparticles. International Journal of Pharmaceutics, 307(1): p. 93-102.
[5] Diaconu, M., A. Tache, S.A.-M.V. Eremia, F. Gatea, S. Litescu, et al., Structural Characterization of Chitosan Coated Silicon Nanoparticles – A FTIR Approach. UPB Scientific Bulletin. 72 (3). 2010.
[6] Muñoz, B., A. Rámila, J. Pérez-Pariente, I. Díaz, and Vallet-Regí, M. (2002) MCM-41 Organic Modification as Drug Delivery Rate Regulator. Chemistry of Materials, 15(2): p. 500-503.
[7] Song, S.W., K. Hidajat, and S. Kawi (2005) Functionalized SBA-15 Materials as Carriers for Controlled Drug Delivery: Influence of Surface Properties on Matrix−Drug Interactions. Langmuir, 21(21): p. 9568-9575.
[8] Vallet-Regi, M., A. Rámila, R.P. del Real, and J. Pérez-Pariente (2000) A New Property of MCM-41: Drug Delivery System. Chemistry of Materials, 13(2): p. 308-311.
[9] Zhu, Y., J. Shi, W. Shen, H. Chen, X. Dong, et al. (2005) Preparation of novel hollow mesoporous silica spheres and their sustained-release property. Nanotechnology, 16(11): p. 2633.
[10] Cavallaro, G., P. Pierro, F.S. Palumbo, F. Testa, L. Pasqua, et al. (2004) Drug Delivery Devices Based on Mesoporous Silicate. Drug Delivery, 11(1): p. 41-46.
[11] Qu, F., G. Zhu, S. Huang, S. Li, and S. Qiu (2006) Effective Controlled Release of Captopril by Silylation of Mesoporous MCM-41. ChemPhysChem, 7(2): p. 400-406.
[12] Zeng, W., X.-F. Qian, Y.-B. Zhang, J. Yin, and Z.-K. Zhu (2005) Organic modified mesoporous MCM-41 through solvothermal process as drug delivery system. Materials Research Bulletin, 40(5): p. 766-772.
[13] Doadrio, A.L., E.M.B. Sousa, J.C. Doadrio, J. Pérez Pariente, I. Izquierdo-Barba, et al. (2004) Mesoporous SBA-15 HPLC evaluation for controlled gentamicin drug delivery. Journal of Controlled Release, 97(1): p. 125-132.
[14] Doadrio, J.C., E.M.B. Sousa, I. Izquierdo-Barba, A.L. Doadrio, J. Perez-Pariente, et al. (2006) Functionalization of mesoporous materials with long alkyl chains as a strategy for controlling drug delivery pattern. Journal of Materials Chemistry, 16(5): p. 462-466.
[15] Vallet-Reg�́, M., J.C. Doadrio, A.L. Doadrio, I. Izquierdo-Barba, and J. Pérez-Pariente (2004) Hexagonal ordered mesoporous material as a matrix for the controlled release of amoxicillin. Solid State Ionics, 172(1–4): p. 435-439.
[16] Brayden, D.J. (2003) Controlled release technologies for drug delivery. Drug Discovery Today, 8(21): p. 976-978.
[17] Arruebo, M., R. Fernández-Pacheco, M.R. Ibarra, and J. Santamaría (2007) Magnetic nanoparticles for drug delivery. Nano Today, 2(3): p. 22-32.
[18] Petros, R.A., and J.M. DeSimone (2010) Strategies in the design of nanoparticles for therapeutic applications. Nat Rev Drug Discov, 9(8): p. 615-627.
[19] Xu, A., M. Yao, G. Xu, J. Ying, W. Ma, et al. (2012) A physical model for the size-dependent cellular uptake of nanoparticles modified with cationic surfactants. Int J Nanomedicine, 7: p. 3547–3554.
[20] Gratton, S.E.A., P.A. Ropp, P.D. Pohlhaus, J.C. Luft, V.J. Madden, et al. (2008) The effect of particle design on cellular internalization pathways. Proceedings of the National Academy of Sciences, 105(33): p. 11613-11618.
Xinyue Huang, Neil P Young and Helen E Townley: Characterisation and Comparison of Mesoporous Silica Particles for Optimised Drug Delivery
13
[21] Yue, Z.-G., W. Wei, P.-P. Lv, H. Yue, L.-Y. Wang, et al. (2011) Surface Charge Affects Cellular Uptake and Intracellular Trafficking of Chitosan-Based Nanoparticles. Biomacromolecules, 12(7): p. 2440-2446.
[22] Roser, M., D. Fischer, and T. Kissel (1998) Surface-modified biodegradable albumin nano- and microspheres. II: effect of surface charges on in vitro phagocytosis and biodistribution in rats. European Journal of Pharmaceutics and Biopharmaceutics, 46(3): p. 255-263.
[23] Schwendener, R.A., P.A. Lagocki, and Y.E. Rahman (1984) The effects of charge and size on the interaction of unilamellar liposomes with macrophages. Biochimica et Biophysica Acta (BBA) - Biomembranes, 772(1): p. 93-101.
[24] Hom, C., J. Lu, M. Liong, H. Luo, Z. Li, et al. (2010) Mesoporous Silica Nanoparticles Facilitate Delivery of siRNA to Shutdown Signaling Pathways in Mammalian Cells. Small, 6(11): p. 1185-1190.
[25] Nandiyanto, A.B.D., S.-G. Kim, F. Iskandar, and K. Okuyama (2009) Synthesis of spherical mesoporous silica nanoparticles with nanometer-size controllable pores and outer diameters. Microporous and Mesoporous Materials, 120(3): p. 447-453.
[26] Zhang, H., Z. Li, P. Xu, R. Wu, and Z. Jiao (2010) A facile two step synthesis of novel chrysanthemum-like mesoporous silica nanoparticles for controlled pyrene release. Chemical Communications, 46(36): p. 6783-6785.
[27] Rao, K.S., K. El-Hami, T. Kodaki, K. Matsushige, and K. Makino (2005) A novel method for synthesis of silica nanoparticles. Journal of Colloid and Interface Science, 289(1): p. 125-131.
[28] Brunauer, S., P.H. Emmett, and E. Teller (1938) Adsorption of Gases in Multimolecular Layers. Journal of the American Chemical Society, 60(2): p. 309-319.
[29] Barrett, E.P., L.G. Joyner, and P.P. Halenda (1951) The Determination of Pore Volume and Area Distributions in Porous Substances. I. Computations from Nitrogen Isotherms. Journal of the American Chemical Society, 73(1): p. 373-380.
[30] Kosmulski, M. (2004) pH-dependent surface charging and points of zero charge II. Update. Journal of Colloid and Interface Science, 275(1): p. 214-224.
[31] Oh, Y.-J., T.C. Gamble, D. Leonhardt, C.-H. Chung, S.R.J. Brueck, et al. (2008) Monitoring FET flow control and wall adsorption of charged fluorescent dye molecules in nanochannels integrated into a multiple internal reflection infrared waveguide. Lab on a Chip, 8(2): p. 251-258.
[32] Patel, H., C. Tscheka, and H. Heerklotz (2009) Characterizing vesicle leakage by fluorescence lifetime measurements. Soft Matter, 5(15): p. 2849-2851.
[33] Setiawan, D., A. Kazaryan, M.A. Martoprawiro, and M. Filatov (2010) A first principles study of fluorescence quenching in rhodamine B dimers: how can quenching occur in dimeric species? Physical Chemistry Chemical Physics, 12(37): p. 11238-11244.
[34] Tarn, D., C.E. Ashley, M. Xue, E.C. Carnes, J.I. Zink,et al. (2013) Mesoporous Silica Nanoparticle Nanocarriers: Biofunctionality and Biocompatibility. Accounts of Chemical Research, 46(3): p. 792-801.
[35] Liu, J., X. Jiang, C. Ashley, and C.J. Brinker (2009) Electrostatically Mediated Liposome Fusion and Lipid Exchange with a Nanoparticle-Supported Bilayer for Control of Surface Charge, Drug Containment, and Delivery. Journal of the American Chemical Society, 131(22): p. 7567-7569.
[36] Hata, H., S. Saeki, T. Kimura, Y. Sugahara, and K. Kuroda (1999) Adsorption of Taxol into Ordered Mesoporous Silicas with Various Pore Diameters. Chemistry of Materials, 11(4): p. 1110-1119.
[37] He, Q., and J. Shi (2011) Mesoporous silica nanoparticle based nano drug delivery systems: synthesis, controlled drug release and delivery, pharmacokinetics and biocompatibility. Journal of Materials Chemistry, 21(16): p. 5845-5855.
[38] Edwards, D.A., M.R. Prausnitz, R. Langer, and J.C. Weaver (1995) Analysis of enhanced transdermal transport by skin electroporation. Journal of Controlled Release, 34(3): p. 211-221.
[39] Yamada, H., C. Urata, Y. Aoyama, S. Osada, Y. Yamauchi, et al. (2012) Preparation of Colloidal Mesoporous Silica Nanoparticles with Different Diameters and Their Unique Degradation Behavior in Static Aqueous Systems. Chemistry of Materials, 24(8): p. 1462-1471.
[40] Iler, R.K. (1979) The Chemistry of Silica: Solubility, Polymerization, Colloid and Surface Properties and Biochemistry of Silica. 1979, New York: Wiley-Interscience.
[41] Marshall, W.L., and C.-T.A. Chen (1982) Amorphous silica solubilities V. Predictions of solubility behavior in aqueous mixed electrolyte solutions to 300°C. Geochimica et Cosmochimica Acta, 46(2): p. 289-291.
[42] He, Q., J. Shi, M. Zhu, Y. Chen, and F. Chen (2010) The three-stage in vitro degradation behavior of mesoporous silica in simulated body fluid. Microporous and Mesoporous Materials, 131(1–3): p. 314-320.
[43] Finsy, R. (2004) On the critical radius in Ostwald ripening. Langmuir, 20(7): p. 2975-2976.
[44] Lin, Y.-S., N. Abadeer, and C.L. Haynes (2011) Stability of small mesoporous silica nanoparticles in biological media. Chemical Communications, 47(1): p. 532-534.
[45] Bass, J.D., D. Grosso, C. Boissiere, E. Belamie, T. Coradin, et al. (2007) Stability of Mesoporous Oxide and Mixed Metal Oxide Materials under Biologically
Nanomater Nanotechnol, 2014, 4:2 | doi: 10.5772/5829014
Relevant Conditions. Chemistry of Materials, 19(17): p. 4349-4356.
[46] Guthrie, C.P. and E.J. Reardon (2008) Metastability of MCM-41 and Al-MCM-41. The Journal of Physical Chemistry A, 112(15): p. 3386-3390.
[47] Landau, M.V., S.P. Varkey, M. Herskowitz, O. Regev, S. Pevzner, et al. (1999) Wetting stability of Si-MCM-41 mesoporous material in neutral, acidic and basic aqueous solutions. Microporous and Mesoporous Materials, 33(1-3): p. 149-163.
Supplementary figures
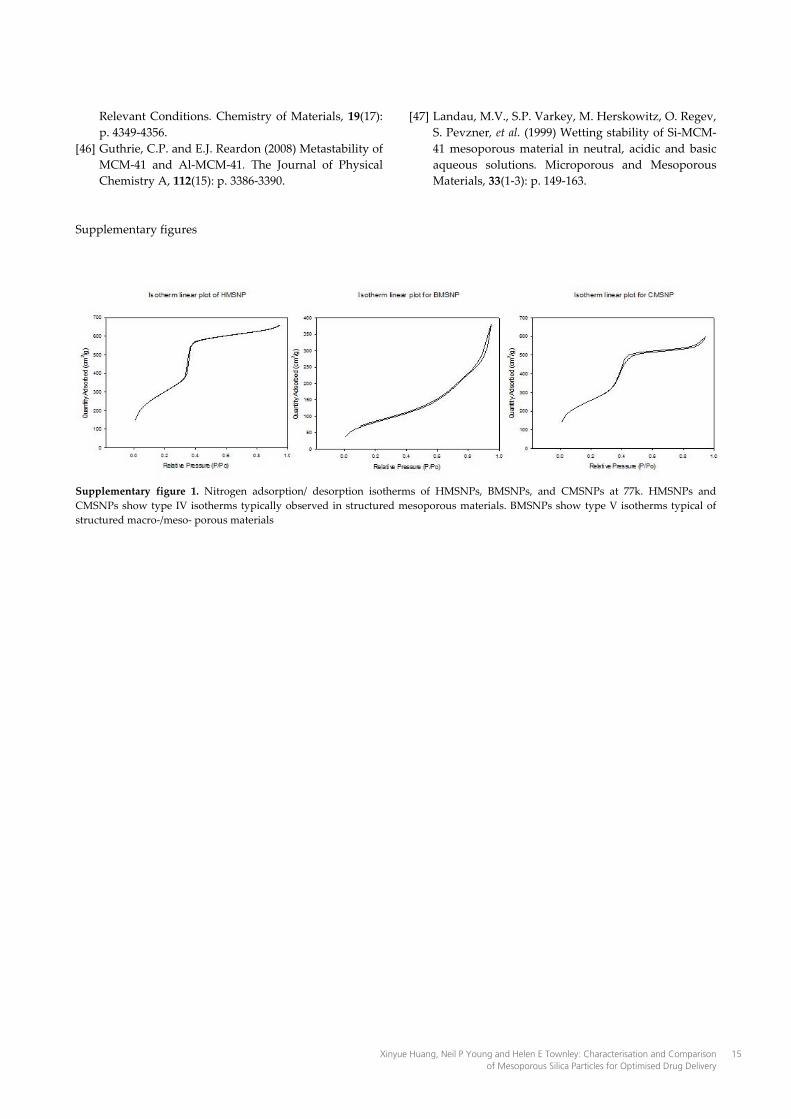
Supplementary figure 1. Nitrogen adsorption/ desorption isotherms of HMSNPs, BMSNPs, and CMSNPs at 77k. HMSNPs and CMSNPs show type IV isotherms typically observed in structured mesoporous materials. BMSNPs show type V isotherms typical of structured macro-/meso- porous materials
Xinyue Huang, Neil P Young and Helen E Townley: Characterisation and Comparison of Mesoporous Silica Particles for Optimised Drug Delivery
15