characterization and source apportionment of pm2.5 in an ... · characterization and source...
TRANSCRIPT
Aerosol and Air Quality Research, 13: 574–583, 2013 Copyright © Taiwan Association for Aerosol Research ISSN: 1680-8584 print / 2071-1409 online doi: 10.4209/aaqr.2012.07.0192
Characterization and Source Apportionment of PM2.5 in an Urban Environment in Beijing Lingda Yu1,2, Guangfu Wang1,3*, Renjian Zhang2, Leiming Zhang2,4, Yu Song5, Bingbing Wu1, Xufang Li1, Kun An1, Junhan Chu1 1 Key Laboratory of Beam technology and Materials Modification of Ministry of Education, College of Nuclear Science and Technology, Beijing Normal University, Beijing 100875, China 2 Key Laboratory of Regional Climate-Environment Research for Temperate East Asia (RCE-TEA), Institute of Atmospheric Physics, Chinese Academy of Science, Beijing 100029, China 3 Beijing Radiation Center, Beijing 100875, China 4 Air Quality Research Division, Science and Technology Branch, Environment Canada, Toronto, Canada 5 Department of Environmental Sciences, Peking University, Beijing 100871, China
ABSTRACT
Daily 24-hour PM2.5 samples were collected continuously from January 1 to December 31, 2010. Elemental concentrations from Al to Pb were obtained using particle induced X-ray emission (PIXE) method. This was the first full year continuous daily PM2.5 elemental composition dataset in Beijing. Source apportionment analysis was conducted on this dataset using the positive matrix factorization method. Seven sources and their contributions to the total PM2.5 mass were identified and quantified. These include secondary sulphur– 13.8 μg/m3, 26.5%; vehicle exhaust– 8.9 μg/m3, 17.1%; fossil fuel combustion– 8.3 μg/m3, 16%; road dust– 6.6 μg/m3, 12.7%; biomass burning– 5.8 μg/m3, 11.2%; soil dust– 5.4 μg/m3, 10.4%; and metal processing– 3.1 μg/m3, 6.0%. Fugitive dusts (including soil dust and road dust) showed the highest contribution of 20.7 μg/m3 in the spring, doubling those in other seasons. On the contrary, contributions of the combustion source types (including biomass burning and fossil fuel combustion) were significantly higher in the fall (14.2 μg/m3) and in the winter (24.5 μg/m3) compared to those in the spring and summer (9.6 and 8.0 μg/m3, respectively). Secondary sulphur contributed the most in the summer while vehicle exhaust and metal processing sources did not show any clear seasonal pattern. The different seasonal highs and lows from different sources compensated each other. This explains the very small seasonal variations (< 20%) in the total PM2.5. Keywords: Aerosol emission sources; Elemental composition; Particle induced X-ray emission; Positive matrix factorization. INTRODUCTION
Atmospheric particulate matters (PM) can affect the visibility of the atmosphere and play important roles in the formation of acid rain, climate change, and human health (Wang et al., 2001; Zhang et al., 2003; Ianniello et al., 2011). Particles smaller than 2.5 μm (PM2.5) have been paid special attention due to their adverse effects on human health since they can readily penetrate into human lungs (Rupp, 2009). To design effective PM2.5 reduction strategies, major sources of PM2.5 and contributions from each source need to be understood thoroughly (Gu et al., 2011). Source apportionment methods have thus been developed for this * Corresponding author. Tel.: +86 10 62208271; Fax: +86 10 62208271 E-mail address: [email protected]
purpose. These methods include positive matrix factorization (PMF) (Oh et al., 2011; Gugamsetty et al., 2012), principal component analysis (PCA) (Lee and Hieu, 2011), chemical mass balance (CMB) (Ni et al., 2012), UNMIX (Murillo et al., 2012), etc. Among these methods, PMF is a powerful and widely used multivariate method that can resolve the dominant positive factors without prior knowledge of sources (Cohen et al., 2010; Mooibroek et al., 2011). PMF can provide not only source profiles but also time series of source contributions.
PM pollution is a serious issue in Beijing, China. A recent study by the World Health Organization (WHO) investigating air pollutants in 1100 cities around the world showed that Beijing is one of the ten dirtiest capitals in the world (WHO, 2011). The current routine monitoring program in Beijing only measures PM10. There was no systematic record of PM2.5 concentrations in Beijing, partly because air quality standard for PM2.5 has not been established in China. This situation will be changed since a new PM2.5 air
Yu et al., Aerosol and Air Quality Research, 13: 574–583, 2013 575
quality standard will be implemented in 2016 (BJEPB, 2012). Thus, there is an urgent need in understanding the PM2.5 sources and contributions from each source in Beijing in order to develop emission policy controls for reducing PM2.5 levels.
Several studies have investigated PM2.5 characterization and sources in Beijing in the past few years (Song et al., 2007; Xu et al., 2007; Zhang et al., 2007; Wang et al., 2008, 2009). These studies identified six to eight potential source profiles. However, the time series of source contributions was not identified in any of these studies due to the limited number of samples, short durations of sampling, or discontinuous sampling. The concentrations and chemical composition of PM2.5 change rapidly on hourly and daily basis. A long period (e.g., full year) of daily PM2.5 data is needed in order to obtain a precise source identification
(Tamoaki et al., 2004). The present study was designed to fill this gap.
Elemental composition and characterization in PM2.5 can provide important information on the sources of PM2.5, despite that these trace elements only constitute a small portion of the total PM mass. Because large amounts of carbon, ionic components, and major crustal elements are included in most of the common sources, the sources of PM2.5 can be distinguished using specific trace elements (Lim et al., 2010). This study reports for the first time a full year (2010) continuous daily PM2.5 elemental composition measurements in Beijing. The PMF method is used to determine the source profiles and source contributions to the total PM2.5 based on the knowledge of the variation of the elemental concentrations, their periodicity, correlation with other elements and meteorological parameters. The application of a full year continuous data could not only improve the efficiency of PMF analysis, but also help to assess the impudence of various sources by using time series analysis. METHODS Aerosol Sampling
The aerosol sampling took place on top of a 6-m height
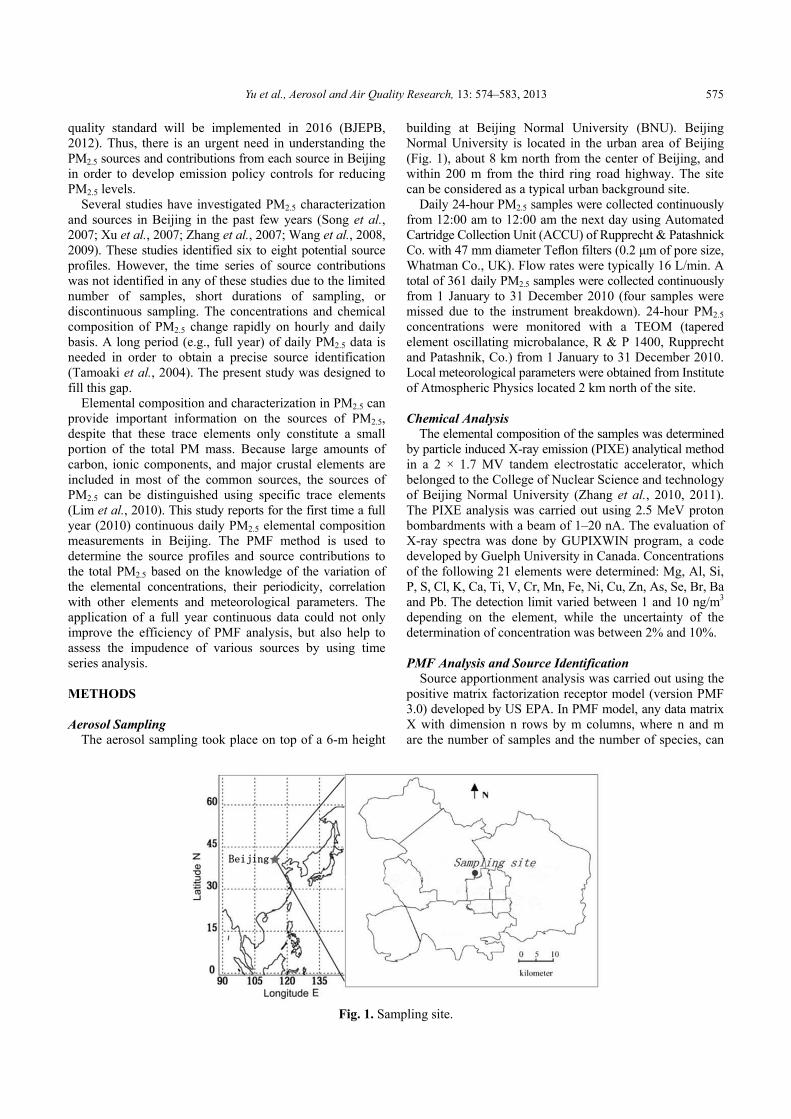
building at Beijing Normal University (BNU). Beijing Normal University is located in the urban area of Beijing (Fig. 1), about 8 km north from the center of Beijing, and within 200 m from the third ring road highway. The site can be considered as a typical urban background site.
Daily 24-hour PM2.5 samples were collected continuously from 12:00 am to 12:00 am the next day using Automated Cartridge Collection Unit (ACCU) of Rupprecht & Patashnick Co. with 47 mm diameter Teflon filters (0.2 μm of pore size, Whatman Co., UK). Flow rates were typically 16 L/min. A total of 361 daily PM2.5 samples were collected continuously from 1 January to 31 December 2010 (four samples were missed due to the instrument breakdown). 24-hour PM2.5 concentrations were monitored with a TEOM (tapered element oscillating microbalance, R & P 1400, Rupprecht and Patashnik, Co.) from 1 January to 31 December 2010. Local meteorological parameters were obtained from Institute of Atmospheric Physics located 2 km north of the site. Chemical Analysis
The elemental composition of the samples was determined by particle induced X-ray emission (PIXE) analytical method in a 2 × 1.7 MV tandem electrostatic accelerator, which belonged to the College of Nuclear Science and technology of Beijing Normal University (Zhang et al., 2010, 2011). The PIXE analysis was carried out using 2.5 MeV proton bombardments with a beam of 1–20 nA. The evaluation of X-ray spectra was done by GUPIXWIN program, a code developed by Guelph University in Canada. Concentrations of the following 21 elements were determined: Mg, Al, Si, P, S, Cl, K, Ca, Ti, V, Cr, Mn, Fe, Ni, Cu, Zn, As, Se, Br, Ba and Pb. The detection limit varied between 1 and 10 ng/m3 depending on the element, while the uncertainty of the determination of concentration was between 2% and 10%. PMF Analysis and Source Identification
Source apportionment analysis was carried out using the positive matrix factorization receptor model (version PMF 3.0) developed by US EPA. In PMF model, any data matrix X with dimension n rows by m columns, where n and m are the number of samples and the number of species, can
Fig. 1. Sampling site.
Yu et al., Aerosol and Air Quality Research, 13: 574–583, 2013 576
be factorized into two matrices, namely G (n × p) and F (p × m), and the residual matrix, E, where p is the number of factors or sources extracted. X = GF + E (1)
or , , , ,1
p
i j i k k j i jk
x g f e
(2)
2,
21 1 ,
Qn m
i j
i j i j
e
s
(3)
The product of G and F can explain the systematic
variations in X. If a p-factor model is being considered, G is an n × p matrix of source contributions, describing the temporal variation of the source strengths. The matrix F is a p × m matrix of source chemical compositions, or source profiles. The main process of the PMF is minimizing the Q-value which is defined in the Eq. (3) as the sum of square of the residuals (ei,j) weighted inversely with error estimates (si,j) of the data point.
It requires two inputs to run PMF, namely concentration and its uncertainty. In the present work, if the concentration is less than or equal to the method detection limit (MDL) provided, the uncertainty is calculated using the following equation (Polissar et al., 1998; Reff et al., 2007; Norris et al., 2009)
5Unc
6MDL (4)
If the concentration is greater than the MDL provided,
the uncertainty is then calculated according to
2 2Unc ( ) ( )Error Fraction concentration MDL (5)
Missing data were substituted with the median value and
their uncertainties were replaced by four times the median value. We included the PM2.5 mass concentrations as a total variable (weak species) (Lee et al., 2011), and all the species were categorized as ‘strong’ (signal-to-noise ratio ≥ 2), ‘weak’ (0.2 ≤ signal-to-noise ratio ≤ 2), or ‘bad’ (signal-to-noise ratio < 0.2) species. The ‘weak’ species were down-weighted by tripling the uncertainty. Since there was no species with signal-to-noise ratio < 0.2 in this study, no species was categorized as ‘bad’. An extra modeling uncertainty was set as 5% as suggested by Norris et al. (2009). Before applying the PMF model, the data screening was applied to remove extremely high values (Norris et al., 2009). After the data screen, total 6 samples were excluded from the PMF analysis and a data matrix with a dimension of 355 × 22 (355 samples by 22 species) was prepared.
The optimal number of factors was identified after analyzing the goodness-of-fit Q-values for the entire run, the scaled residual matrices, G-space plots, and physical meaningfulness of the factor profiles and contributions (Lee et al., 1999). The model was run 20 times with seven
factors and a seed of 25 (in order to replicate the results). All runs converged and a global minimum was found. The Q-robust of the present study was found to be equal to the Q-true, indicating no outliers impacting the Q value. After a reasonable solution was found, the uncertainties in the modeled solution were estimated using a bootstrapping technique. A total of 100 bootstrap runs were performed with a minimum r2-value of 0.6. Of the 100 runs, all the 7-factors were mapped to a base factor in every run indicating a stable result. Residuals were also found to be between 3 and –3 for all the species. An overall correlation between the reconstructed PM2.5 mass from all the sources (Y) and the observed PM2.5 mass concentrations (X) showed Y = 0.92X (R2 = 0.78). In general, the performance of PMF on the source apportionment of PM2.5 at the study site was found to be satisfactory.
In this study, the identification of sources was conducted using major marker species that can be estimated according to a number of references. The sources are mainly confirmed based on the percentage of the species for the source. Moreover, analysis on source contributions in relation to seasonal or meteorological conditions helps to understand the source characteristics. RESULTS AND DISCUSSION Overview of PM2.5 Concentrations
Statistics of annual and seasonal PM2.5 generated from daily samples are shown in Table 1. In 2010, daily PM2.5 concentration ranged from 9.8 to 219 μg/m3 with an annual average (± standard deviation) of 55.4 ± 40.2 μg/m3. The annual average in Beijing was comparable with that in Guangzhou (53.7 μg/m3, Tao et al., 2012), but substantially higher than those in Taipei (30 μg/m3, Chang et al., 2010) and Seoul (43.5 μg/m3, Heo et al., 2009). The annual average was almost four times higher than the US EPA annual PM2.5 standard of 15 μg/m3. In this particular year, 229 days had daily PM2.5 exceeded the US EPA 24 h PM2.5 standard of 35 μg/m3.
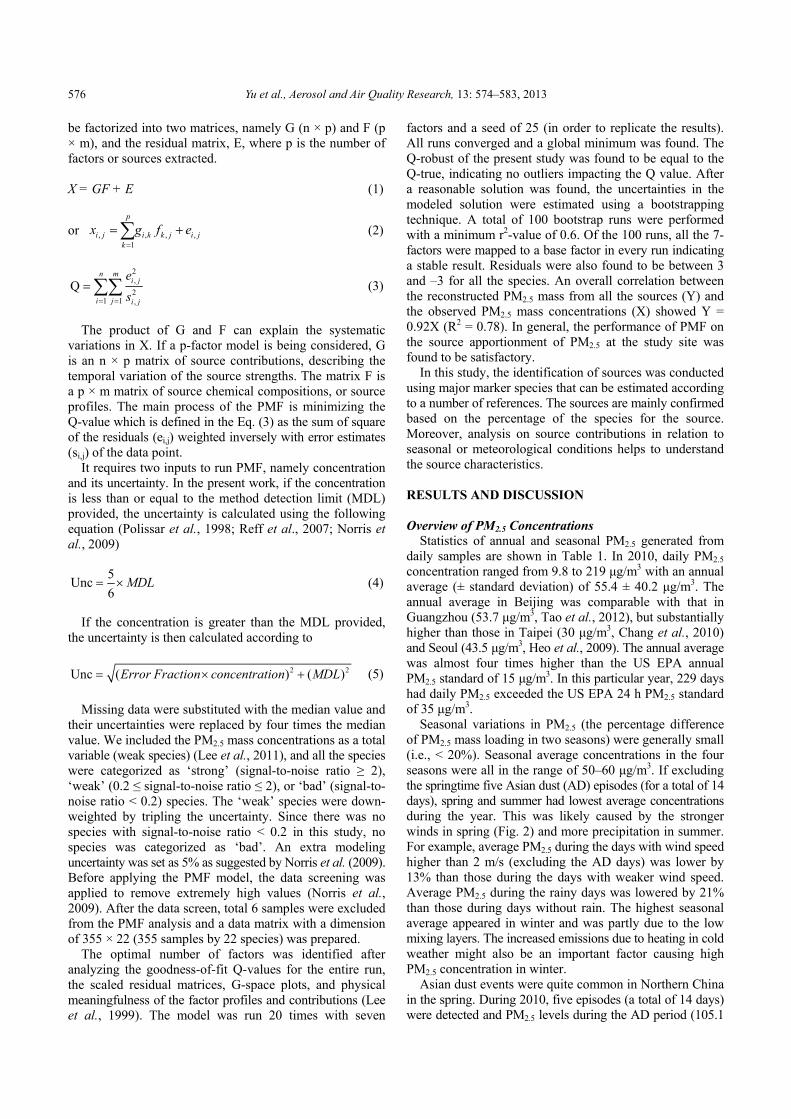
Seasonal variations in PM2.5 (the percentage difference of PM2.5 mass loading in two seasons) were generally small (i.e., < 20%). Seasonal average concentrations in the four seasons were all in the range of 50–60 μg/m3. If excluding the springtime five Asian dust (AD) episodes (for a total of 14 days), spring and summer had lowest average concentrations during the year. This was likely caused by the stronger winds in spring (Fig. 2) and more precipitation in summer. For example, average PM2.5 during the days with wind speed higher than 2 m/s (excluding the AD days) was lower by 13% than those during the days with weaker wind speed. Average PM2.5 during the rainy days was lowered by 21% than those during days without rain. The highest seasonal average appeared in winter and was partly due to the low mixing layers. The increased emissions due to heating in cold weather might also be an important factor causing high PM2.5 concentration in winter.
Asian dust events were quite common in Northern China in the spring. During 2010, five episodes (a total of 14 days) were detected and PM2.5 levels during the AD period (105.1
Yu et al., Aerosol and Air Quality Research, 13: 574–583, 2013 577
Table 1. Brief summary of annual and seasonal PM2.5 concentrations (μg/m3).
Mean SD Min Max Number Wintera 57.5 45.6 11.6 219 92 Spring with AD 59.1 39.1 15.8 203.7 91
without AD 51.7 31.1 15.8 119.2 77 AD period 105.1 46.7 60.5 203.7 14
Summer 51.2 28.2 9.8 112.5 91 Fall 54.3 47.1 10.1 191.6 91 Annual 2010 55.5 40.2 9.8 219 365
a (Spring: March–May; Summer: June–August; Fall: September–November; Winter: January, February and December).
Fig. 2. Related meteorological variables during sampling time, including the wind direction (WD), wind speed (WS), relative humidity (RH) and temperature (T).
± 46.7 μg/m3) doubled those during general days (Table 1). Thus, if including the AD period, spring average PM2.5 became the highest among the four seasons. Overview of Selected Trace Elements
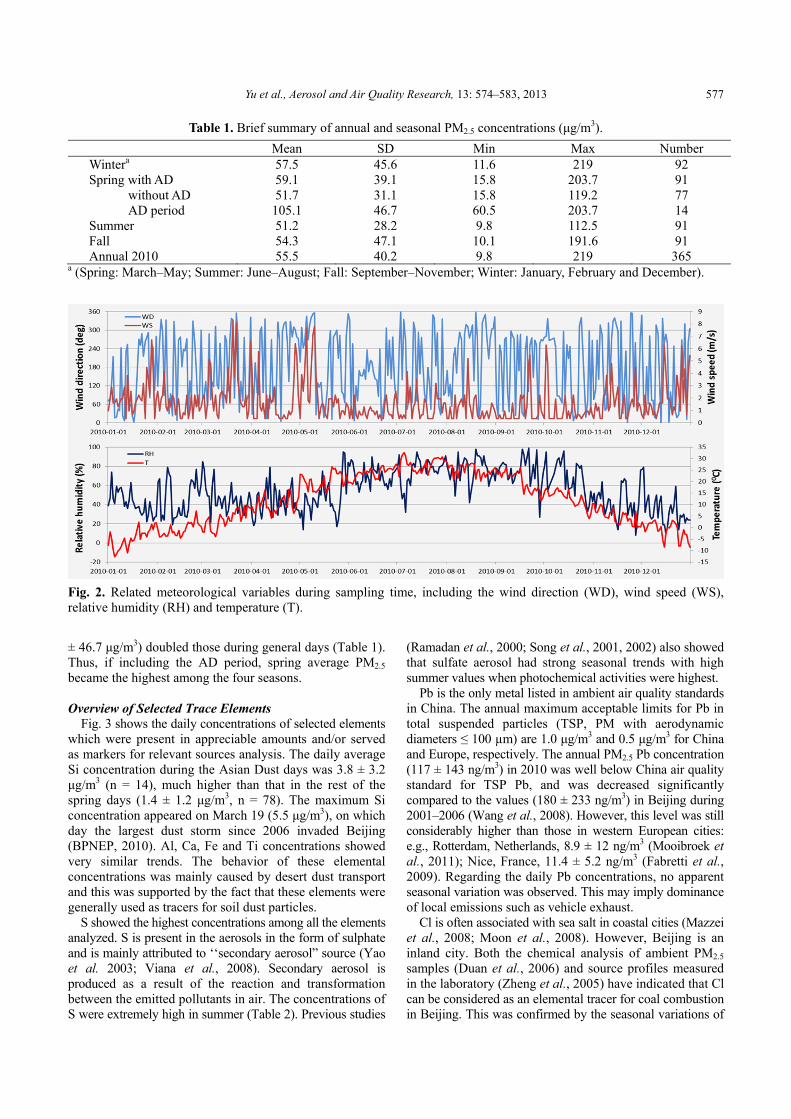
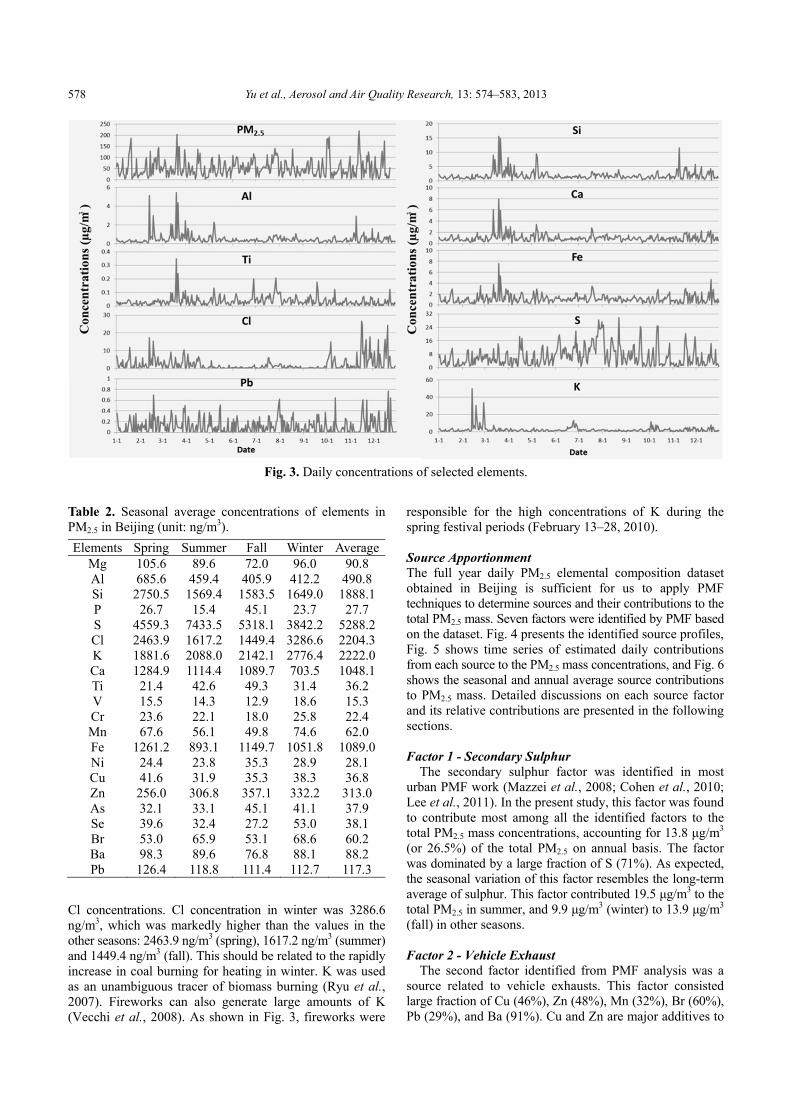
Fig. 3 shows the daily concentrations of selected elements which were present in appreciable amounts and/or served as markers for relevant sources analysis. The daily average Si concentration during the Asian Dust days was 3.8 ± 3.2 μg/m3 (n = 14), much higher than that in the rest of the spring days (1.4 ± 1.2 μg/m3, n = 78). The maximum Si concentration appeared on March 19 (5.5 μg/m3), on which day the largest dust storm since 2006 invaded Beijing (BPNEP, 2010). Al, Ca, Fe and Ti concentrations showed very similar trends. The behavior of these elemental concentrations was mainly caused by desert dust transport and this was supported by the fact that these elements were generally used as tracers for soil dust particles.
S showed the highest concentrations among all the elements analyzed. S is present in the aerosols in the form of sulphate and is mainly attributed to ‘‘secondary aerosol” source (Yao et al. 2003; Viana et al., 2008). Secondary aerosol is produced as a result of the reaction and transformation between the emitted pollutants in air. The concentrations of S were extremely high in summer (Table 2). Previous studies
(Ramadan et al., 2000; Song et al., 2001, 2002) also showed that sulfate aerosol had strong seasonal trends with high summer values when photochemical activities were highest.
Pb is the only metal listed in ambient air quality standards in China. The annual maximum acceptable limits for Pb in total suspended particles (TSP, PM with aerodynamic diameters ≤ 100 µm) are 1.0 μg/m3 and 0.5 μg/m3 for China and Europe, respectively. The annual PM2.5 Pb concentration (117 ± 143 ng/m3) in 2010 was well below China air quality standard for TSP Pb, and was decreased significantly compared to the values (180 ± 233 ng/m3) in Beijing during 2001–2006 (Wang et al., 2008). However, this level was still considerably higher than those in western European cities: e.g., Rotterdam, Netherlands, 8.9 ± 12 ng/m3 (Mooibroek et al., 2011); Nice, France, 11.4 ± 5.2 ng/m3 (Fabretti et al., 2009). Regarding the daily Pb concentrations, no apparent seasonal variation was observed. This may imply dominance of local emissions such as vehicle exhaust.
Cl is often associated with sea salt in coastal cities (Mazzei et al., 2008; Moon et al., 2008). However, Beijing is an inland city. Both the chemical analysis of ambient PM2.5 samples (Duan et al., 2006) and source profiles measured in the laboratory (Zheng et al., 2005) have indicated that Cl can be considered as an elemental tracer for coal combustion in Beijing. This was confirmed by the seasonal variations of
Yu et al., Aerosol and Air Quality Research, 13: 574–583, 2013 578
Fig. 3. Daily concentrations of selected elements.
Table 2. Seasonal average concentrations of elements in PM2.5 in Beijing (unit: ng/m3).
Elements Spring Summer Fall Winter AverageMg 105.6 89.6 72.0 96.0 90.8 Al 685.6 459.4 405.9 412.2 490.8 Si 2750.5 1569.4 1583.5 1649.0 1888.1P 26.7 15.4 45.1 23.7 27.7 S 4559.3 7433.5 5318.1 3842.2 5288.2Cl 2463.9 1617.2 1449.4 3286.6 2204.3K 1881.6 2088.0 2142.1 2776.4 2222.0Ca 1284.9 1114.4 1089.7 703.5 1048.1Ti 21.4 42.6 49.3 31.4 36.2 V 15.5 14.3 12.9 18.6 15.3 Cr 23.6 22.1 18.0 25.8 22.4 Mn 67.6 56.1 49.8 74.6 62.0 Fe 1261.2 893.1 1149.7 1051.8 1089.0Ni 24.4 23.8 35.3 28.9 28.1 Cu 41.6 31.9 35.3 38.3 36.8 Zn 256.0 306.8 357.1 332.2 313.0 As 32.1 33.1 45.1 41.1 37.9 Se 39.6 32.4 27.2 53.0 38.1 Br 53.0 65.9 53.1 68.6 60.2 Ba 98.3 89.6 76.8 88.1 88.2 Pb 126.4 118.8 111.4 112.7 117.3
Cl concentrations. Cl concentration in winter was 3286.6 ng/m3, which was markedly higher than the values in the other seasons: 2463.9 ng/m3 (spring), 1617.2 ng/m3 (summer) and 1449.4 ng/m3 (fall). This should be related to the rapidly increase in coal burning for heating in winter. K was used as an unambiguous tracer of biomass burning (Ryu et al., 2007). Fireworks can also generate large amounts of K (Vecchi et al., 2008). As shown in Fig. 3, fireworks were
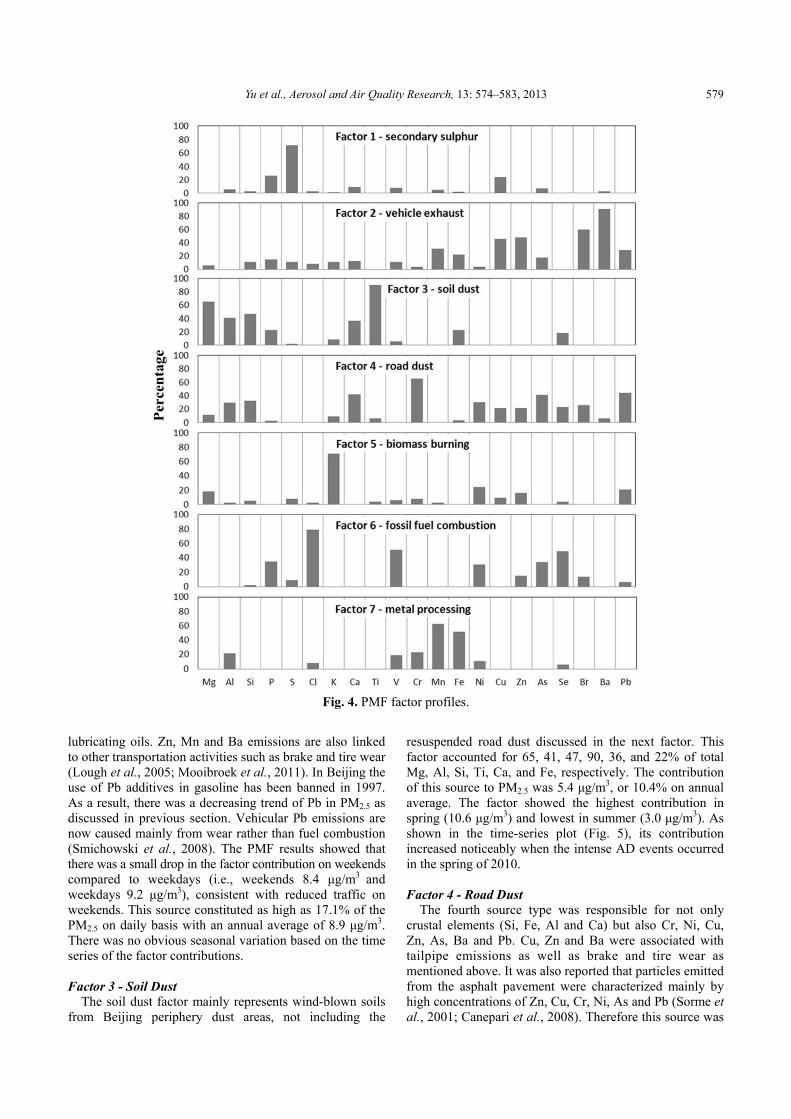
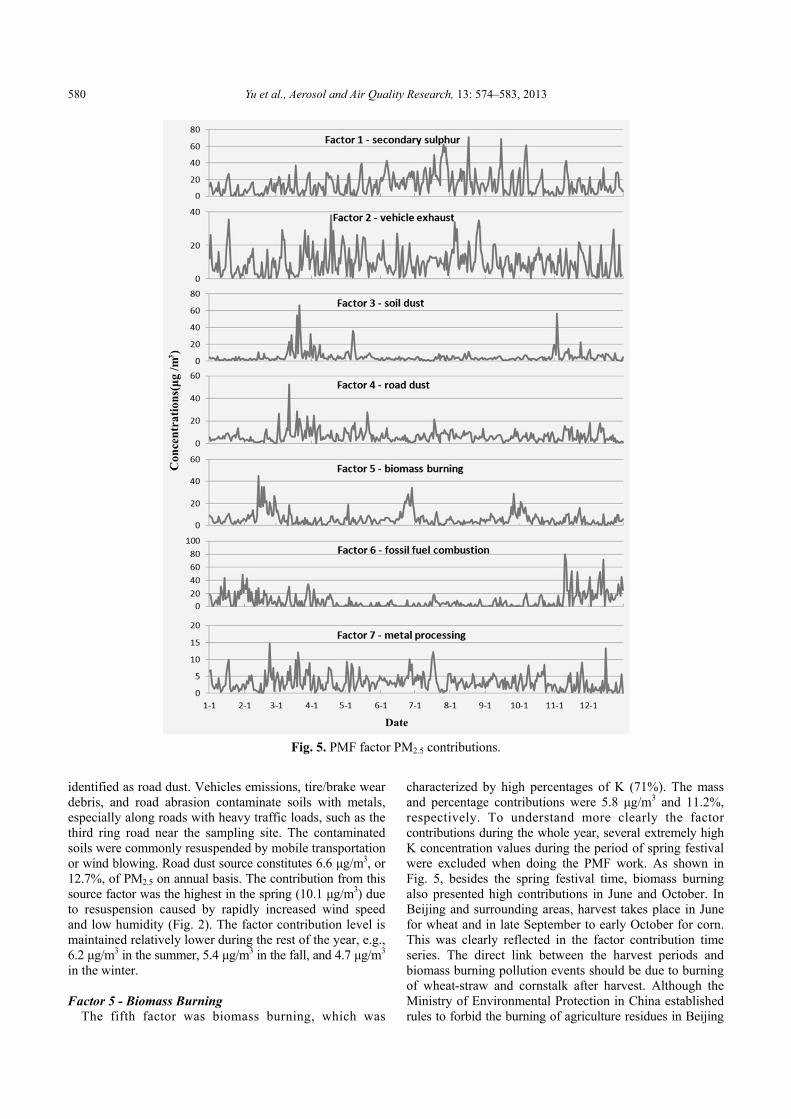
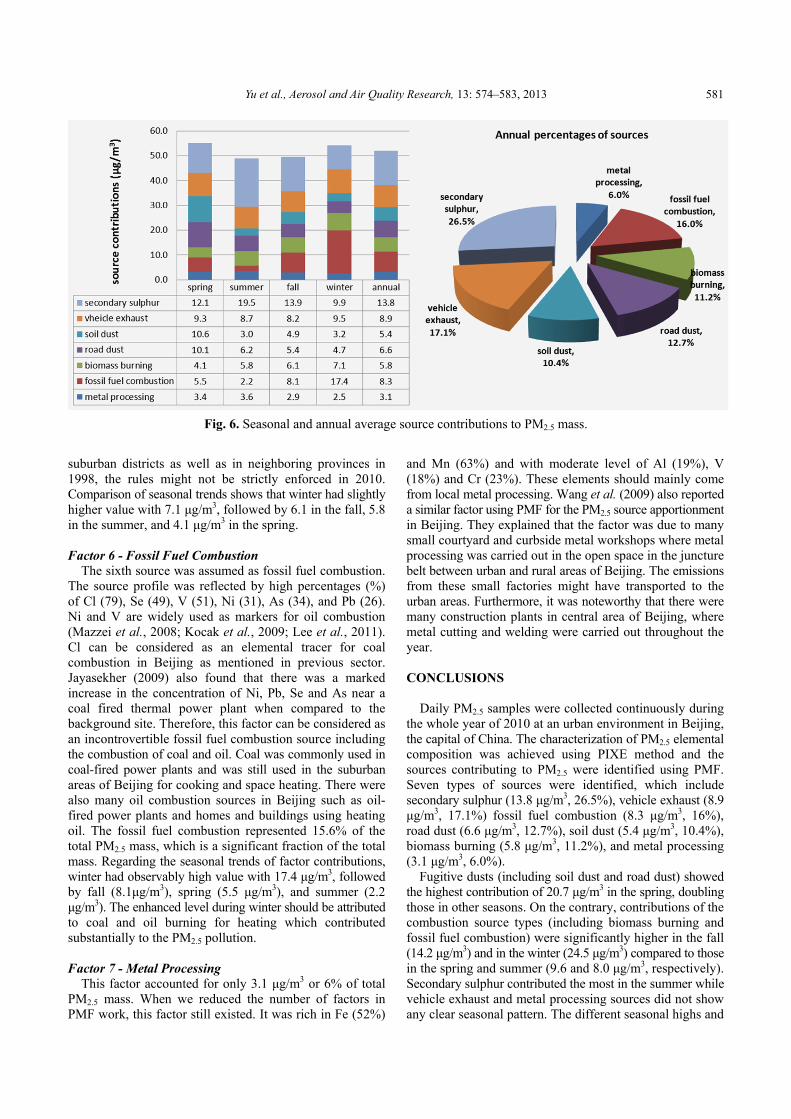
responsible for the high concentrations of K during the spring festival periods (February 13–28, 2010). Source Apportionment The full year daily PM2.5 elemental composition dataset obtained in Beijing is sufficient for us to apply PMF techniques to determine sources and their contributions to the total PM2.5 mass. Seven factors were identified by PMF based on the dataset. Fig. 4 presents the identified source profiles, Fig. 5 shows time series of estimated daily contributions from each source to the PM2.5 mass concentrations, and Fig. 6 shows the seasonal and annual average source contributions to PM2.5 mass. Detailed discussions on each source factor and its relative contributions are presented in the following sections.
Factor 1 - Secondary Sulphur
The secondary sulphur factor was identified in most urban PMF work (Mazzei et al., 2008; Cohen et al., 2010; Lee et al., 2011). In the present study, this factor was found to contribute most among all the identified factors to the total PM2.5 mass concentrations, accounting for 13.8 μg/m3 (or 26.5%) of the total PM2.5 on annual basis. The factor was dominated by a large fraction of S (71%). As expected, the seasonal variation of this factor resembles the long-term average of sulphur. This factor contributed 19.5 μg/m3 to the total PM2.5 in summer, and 9.9 μg/m3 (winter) to 13.9 μg/m3 (fall) in other seasons.
Factor 2 - Vehicle Exhaust
The second factor identified from PMF analysis was a source related to vehicle exhausts. This factor consisted large fraction of Cu (46%), Zn (48%), Mn (32%), Br (60%), Pb (29%), and Ba (91%). Cu and Zn are major additives to
Yu et al., Aerosol and Air Quality Research, 13: 574–583, 2013 579
Fig. 4. PMF factor profiles.
lubricating oils. Zn, Mn and Ba emissions are also linked to other transportation activities such as brake and tire wear (Lough et al., 2005; Mooibroek et al., 2011). In Beijing the use of Pb additives in gasoline has been banned in 1997. As a result, there was a decreasing trend of Pb in PM2.5 as discussed in previous section. Vehicular Pb emissions are now caused mainly from wear rather than fuel combustion (Smichowski et al., 2008). The PMF results showed that there was a small drop in the factor contribution on weekends compared to weekdays (i.e., weekends 8.4 μg/m3 and weekdays 9.2 μg/m3), consistent with reduced traffic on weekends. This source constituted as high as 17.1% of the PM2.5 on daily basis with an annual average of 8.9 μg/m3. There was no obvious seasonal variation based on the time series of the factor contributions. Factor 3 - Soil Dust
The soil dust factor mainly represents wind-blown soils from Beijing periphery dust areas, not including the
resuspended road dust discussed in the next factor. This factor accounted for 65, 41, 47, 90, 36, and 22% of total Mg, Al, Si, Ti, Ca, and Fe, respectively. The contribution of this source to PM2.5 was 5.4 μg/m3, or 10.4% on annual average. The factor showed the highest contribution in spring (10.6 μg/m3) and lowest in summer (3.0 μg/m3). As shown in the time-series plot (Fig. 5), its contribution increased noticeably when the intense AD events occurred in the spring of 2010. Factor 4 - Road Dust
The fourth source type was responsible for not only crustal elements (Si, Fe, Al and Ca) but also Cr, Ni, Cu, Zn, As, Ba and Pb. Cu, Zn and Ba were associated with tailpipe emissions as well as brake and tire wear as mentioned above. It was also reported that particles emitted from the asphalt pavement were characterized mainly by high concentrations of Zn, Cu, Cr, Ni, As and Pb (Sorme et al., 2001; Canepari et al., 2008). Therefore this source was
Yu et al., Aerosol and Air Quality Research, 13: 574–583, 2013 580
Fig. 5. PMF factor PM2.5 contributions.
identified as road dust. Vehicles emissions, tire/brake wear debris, and road abrasion contaminate soils with metals, especially along roads with heavy traffic loads, such as the third ring road near the sampling site. The contaminated soils were commonly resuspended by mobile transportation or wind blowing. Road dust source constitutes 6.6 μg/m3, or 12.7%, of PM2.5 on annual basis. The contribution from this source factor was the highest in the spring (10.1 μg/m3) due to resuspension caused by rapidly increased wind speed and low humidity (Fig. 2). The factor contribution level is maintained relatively lower during the rest of the year, e.g., 6.2 μg/m3 in the summer, 5.4 μg/m3 in the fall, and 4.7 μg/m3 in the winter. Factor 5 - Biomass Burning
The fifth factor was biomass burning, which was
characterized by high percentages of K (71%). The mass and percentage contributions were 5.8 μg/m3 and 11.2%, respectively. To understand more clearly the factor contributions during the whole year, several extremely high K concentration values during the period of spring festival were excluded when doing the PMF work. As shown in Fig. 5, besides the spring festival time, biomass burning also presented high contributions in June and October. In Beijing and surrounding areas, harvest takes place in June for wheat and in late September to early October for corn. This was clearly reflected in the factor contribution time series. The direct link between the harvest periods and biomass burning pollution events should be due to burning of wheat-straw and cornstalk after harvest. Although the Ministry of Environmental Protection in China established rules to forbid the burning of agriculture residues in Beijing
Yu et al., Aerosol and Air Quality Research, 13: 574–583, 2013 581
Fig. 6. Seasonal and annual average source contributions to PM2.5 mass.
suburban districts as well as in neighboring provinces in 1998, the rules might not be strictly enforced in 2010. Comparison of seasonal trends shows that winter had slightly higher value with 7.1 μg/m3, followed by 6.1 in the fall, 5.8 in the summer, and 4.1 μg/m3 in the spring. Factor 6 - Fossil Fuel Combustion
The sixth source was assumed as fossil fuel combustion. The source profile was reflected by high percentages (%) of Cl (79), Se (49), V (51), Ni (31), As (34), and Pb (26). Ni and V are widely used as markers for oil combustion (Mazzei et al., 2008; Kocak et al., 2009; Lee et al., 2011). Cl can be considered as an elemental tracer for coal combustion in Beijing as mentioned in previous sector. Jayasekher (2009) also found that there was a marked increase in the concentration of Ni, Pb, Se and As near a coal fired thermal power plant when compared to the background site. Therefore, this factor can be considered as an incontrovertible fossil fuel combustion source including the combustion of coal and oil. Coal was commonly used in coal-fired power plants and was still used in the suburban areas of Beijing for cooking and space heating. There were also many oil combustion sources in Beijing such as oil-fired power plants and homes and buildings using heating oil. The fossil fuel combustion represented 15.6% of the total PM2.5 mass, which is a significant fraction of the total mass. Regarding the seasonal trends of factor contributions, winter had observably high value with 17.4 μg/m3, followed by fall (8.1μg/m3), spring (5.5 μg/m3), and summer (2.2 μg/m3). The enhanced level during winter should be attributed to coal and oil burning for heating which contributed substantially to the PM2.5 pollution. Factor 7 - Metal Processing
This factor accounted for only 3.1 μg/m3 or 6% of total PM2.5 mass. When we reduced the number of factors in PMF work, this factor still existed. It was rich in Fe (52%)
and Mn (63%) and with moderate level of Al (19%), V (18%) and Cr (23%). These elements should mainly come from local metal processing. Wang et al. (2009) also reported a similar factor using PMF for the PM2.5 source apportionment in Beijing. They explained that the factor was due to many small courtyard and curbside metal workshops where metal processing was carried out in the open space in the juncture belt between urban and rural areas of Beijing. The emissions from these small factories might have transported to the urban areas. Furthermore, it was noteworthy that there were many construction plants in central area of Beijing, where metal cutting and welding were carried out throughout the year. CONCLUSIONS
Daily PM2.5 samples were collected continuously during the whole year of 2010 at an urban environment in Beijing, the capital of China. The characterization of PM2.5 elemental composition was achieved using PIXE method and the sources contributing to PM2.5 were identified using PMF. Seven types of sources were identified, which include secondary sulphur (13.8 μg/m3, 26.5%), vehicle exhaust (8.9 μg/m3, 17.1%) fossil fuel combustion (8.3 μg/m3, 16%), road dust (6.6 μg/m3, 12.7%), soil dust (5.4 μg/m3, 10.4%), biomass burning (5.8 μg/m3, 11.2%), and metal processing (3.1 μg/m3, 6.0%).
Fugitive dusts (including soil dust and road dust) showed the highest contribution of 20.7 μg/m3 in the spring, doubling those in other seasons. On the contrary, contributions of the combustion source types (including biomass burning and fossil fuel combustion) were significantly higher in the fall (14.2 μg/m3) and in the winter (24.5 μg/m3) compared to those in the spring and summer (9.6 and 8.0 μg/m3, respectively). Secondary sulphur contributed the most in the summer while vehicle exhaust and metal processing sources did not show any clear seasonal pattern. The different seasonal highs and
Yu et al., Aerosol and Air Quality Research, 13: 574–583, 2013 582
lows from different sources compensated each other and resulted in a much smaller seasonal variation in the total PM2.5 mass concentrations.
The application of PMF to the one year continuous daily data provided a general understanding of the sources and their strengths to the formation of PM2.5 in an urban environment. It demonstrated the usefulness of certain elemental species as tracers for specific activities or source types. The sampling of PM2.5 is still ongoing aiming to provide a long-term continuous PM2.5 composition record, which will contribute to a better understanding of the characteristics and sources of urban PM2.5 in Beijing. ACKNOWLEDGMENTS
This research is supported by the “Fundamental Research Funds for the Central Universities” and the National Natural Science Foundation of China (No.41175131). REFERENCES Beijing Environmental Protection Bureau (BJEPB) (2012).
http://www.bjepb.gov.cn. Beijing Public Net for Environmental Protection (BPNEP)
(2010). http://www.bjee.org.cn. Canepari, S., Perrino, C., Olivieri, F. and Astolfi, M.L.
(2008). Characterisation of the Traffic Sources of PM through Size-segregated Sampling, Sequential Leaching and ICP Analysis. Atmos. Environ. 42: 8161–8817.
Chang, S.C., Chou, C.C., Chan, C.C. and Lee, C.T. (2010). Temporal Characteristics from Continuous Measurements of PM2.5 and Speciation at the Taipei Aerosol Supersite from 2002 to 2008. Atmos. Environ. 44: 1088–1096.
Cohen, D.D., Crawford, J., Stelcer, E. and Bac, V.T. (2010). Characterization and Source Apportionment of fine Particulate Sources at Hanoi from 2001 to 2008. Atmos. Environ. 44: 320–328.
Duan, F.K., He, K.B., Yang, F.M., Yu, X.C., Cadle, S.H. and Chan, T. (2006). Concentrations and Chemical Characteristics of PM2.5 in Beijing, China: 2001–2002. Sci. Total Environ. 355: 264–275.
Fabretti, J.F., Sauret, N., Gal, J.F., Maria, P.C. and Scharer, U. (2009). Elemental Characterization and Source Identification of PM2.5 Using Positive Matrix Factorization: The Malraux Road Tunnel, Nice, France. Atmos. Res. 94: 320–329.
Gu, J.W., Pitz M., Schnelle-Kreis, J., Diemer, J., Reller, A. and Zimmermann, R. (2011). Source Apportionment of Ambient Particles: Comparison of Positive Matrix Factorization Analysis Applied to Particle Size Distribution and Chemical Composition data. Atmos. Environ. 45: 1849–1857.
Gugamsetty, B., Wei, H., Liu, C.N., Awasthi A., Hsu, S.C., Tsai, C.J., Roam, G.D., Wu, Y.C. and Chen, C.F. (2012). Source Characterization and apportionment of PM10, PM2.5 and PM0.1 by using Positive Matrix Factorization. Aerosol Air Qual. Res. 12: 476–491.
Heo, J.B., Hopke, P.K. and Yi, S.M. (2009). Source Apportionment of PM2.5 in Seoul, Korea. Atmos. Chem.
Phys. 9: 4957–4971. Ianniello, A., Spataro, F., Esposito, G., Allegrini, I., Hu,
M., and Zhu, T. (2011). Chemical Characteristics of Inorganic Ammonium Salts in PM2.5 in the Atmosphere of Beijing (China). Atmos. Chem. Phys. 11: 10803–10822
Jayasekher, T. (2009). Aerosols near by a Coal fired Thermal Power Plant: Chemical Composition and Toxic Evaluation. Chemosphere 75: 1525–1530
Kocak, M., Mihalopoulos, N. and Kubilay, N. (2009). Origin and Source Regions of PM10 in the Eastern Mediterranean Atmosphere. Atmos. Res. 92: 464–474.
Lee, B.K. and Hieu, N.T. (2011). Seasonal Variation and Sources of Heavy Metals in Atmospheric Aerosols in a Residential Area of Ulsan, Korea. Aerosol Air Qual. Res. 11: 679–688.
Lee, E., Chan, C.K. and Paatero, P. (1999). Application of Positive Matrix Factorization in Source Apportionment of Particulate Pollutants in Hong Kong. Atmos. Environ. 33: 3201–3212.
Lee, H.J., Gent, J.F., Leaderer, B.P. and Koutrakis, P. (2011). Spatial and Temporal Variability of Fine Particle Composition and Source Types in Five Cities of Connecticut and Massachusetts. Sci. Total Environ. 409: 2133–2142.
Lim, J.M., Lee, J.H., Moon, J.H. and Chung, Y.S. (2010). Source Apportionment of PM10 at a Small Industrial Area Using Positive Matrix Factorization. Atmos. Res. 95: 88–100.
Lough, G.C., Schauer, J.J., Park, J.S., Shafer, M.M., Deminter, J.T. and Weinstein, J.P. (2005). Emissions of Metals Associated with Motor Vehicle Roadways. Environ. Sci. Technol. 39: 826–836.
Mazzei, F., Alessandrob, A.D., Lucarelli, F., Navac, S., Prati, P., Valli, G. and Vecchi, R. (2008). Characterization of Particulate Matter Sources in an Urban Environment. Sci. Total Environ. 401: 81–89.
Mooibroek, D., Schaap, M., Weijers, E.P. and Hoogerbrugge, R. (2011). Source Apportionment and Spatial Variability of PM2.5 Using Measurements at Five Sites in the Netherlands. Atmos. Environ. 45: 4180–4191.
Moon, K.J., Han, J.S., Ghim, Y.S. and Kim, Y.J. (2008). Source Apportionment of Fine Carbonaceous Particles by Positive Matrix Factorization at Gosan Background Site in East Asia. Environ. Int. 34: 654–664.
Murillo, M.J., Ramos, A.C., Carcia, F.A., Jimenez, S.B., Cardenas, B. and Mizohata, A. (2012). Chemical Composition of PM2.5 Particles in Salamanca, Guanajuato Mexico: Source Apportionment with Receptor Models. Atmos. Res. 107: 31–41.
Ni, T., Han, B. and Bai, Z.P. (2012). Source Apportionment of PM10 in Four Cities of Northeastern China. Aerosol Air Qual. Res. 12: 571–582.
Norris, G., Vedantham, R., Wade, K., Brown, S., Prouty, J. and Foley, C. (2009). EPA Positive Matrix Factorization (PMF) 3.0 Fundamentals & User Guide.
Oh, M.S., Lee, T.J. and Kim D.S. (2011). Quantitative Source Apportionment of Size-segregated Particulate Matter at Urbanized Local Site in Korea. Aerosol Air Qual. Res. 11: 247–264.
Yu et al., Aerosol and Air Quality Research, 13: 574–583, 2013 583
Polissar, A.V., Hopke, P.K., Paatero, P., Malm, W.C. and Sisler, J.F. (1998). Atmospheric Aerosol over Alaska 2. Elemental Composition and Sources. J. Geophys. Res. 103: 19045–19057.
Ramadan, Z., Song, X.H. and Hopke, P.K. (2000). Identification of Sources of Phoenix Aerosol by Positive Matrix Factorization. J. Air Waste Manage. Assoc. 50: 1308–1320.
Reff, A., Eberly, S.I. and Bhave, P.V. (2007). Receptor Modeling of Ambient Particulate Matter Data Using Positive Matrix Factorization: Review of Existing Methods. J. Air Waste Manage. Assoc. 57: 146–154.
Rupp, G. (2009). Aerosol Dynamics and Health: Strategies to Reduce Exposure and Harm Foreword. Biomarkers 14: 3–4.
Ryu, S.Y., Kwona, B.G., Kima, Y.J., Kimb, H.H. and Chunb, K.J. (2007). Characteristics of Biomass Burning Aerosol and Its Impact on Regional Air Quality in the Summer of 2003 at Gwangju, Korea. Atmos. Res. 84: 362–373.
Smichowski, P., Gomez, D., Frazzoli, C. and Caroli, S. (2008). Traffic-related Elements in Airborne Particulate Matter. Appl. Spectrosc. Rev. 43: 23–49.
Song, X.H, Polissar, A.V. and Hopke, P.K. (2001). Source of Fine Particle Composition in the Northeastern US. Atmos. Environ. 35: 5277–5286.
Song, Y. Tang, X.Y., Zhang Y.H., Hu M., Fang C., Zen L.M. and Wang W. (2002). Effects on Fine Particles by the Continued High Temperature Weather in Beijing. Environ. Sci. 23: 33–36.
Song, Y., Tang, X.Y., Xie, S.D., Zhang, Y.H. and Wei, Y.J. (2007). Source Apportionment of PM2.5 in Beijing in 2004. J. Hazard. Mater. 146: 124–130.
Sorme, L., Bergback, B. and Lohm, U. (2001). Goods in the Anthroposphere as a Metal Emission Source A Case Study of Stockholm, Sweden. Water Air Soil Pollut. Focus 1: 213–227.
Tao, J., Cheng, T.T., and Zhang R.J. (2012). Chemical Composition of Summertime PM2.5 and Its Relationship to Aerosol Optical Properties in Guangzhou, China. Atmos. Ocean. Sci. Lett. 5: 88–94.
Tomoaki, O., Jun, K., Junya, M., Masaki, T., Yusuke, S., Shigeru, T., Kebin, H., Ma, Y.L., Yang, F.M., Yu, C.X. and Duan, F.K. (2004). Daily Concentrations of Trace Metals in Aerosols in Beijing, China, Determined by Using Inductively Coupled Plasma Mass Spectrometry Equipped with Laser Ablation Analysis, and Source Identification of Aerosols. Sci. Total Environ. 330: 145–158.
Vecchi, R., Bernardoni, V., Cricchio, D., Allessandro, A.D., Fermo, P., Lucarelli, F., Nava, S., Piazzalunga, A. and Valli, G. (2008). The Impact of Fireworks on Airborne Particles. Atmos. Environ. 42: 1121–1132.
Viana, M., Kuhlbusch, T.A.J. and Querol, X. (2008). Source apportionment of Particulate Matter in Eurpoe: A Review of Methods and Results. J. Aerosol Sci. 39: 827–849.
Viana, M., Pandolfi, M., Minguillon, M.C., Querol, X.,
Alastuey, A., Monfort, E. and Celades, I. (2008). Inter-comparison of Receptor Models for PM Source Apportionment: Case Study in an Industrial Area. Atmos. Environ. 42: 3820–3832.
Wang, H.L., Zhuang, Y.H., Wang, Y., Sun, Y.L., Yuan, H., Zhuang, G.S. and Hao, Z.P. (2008). Long-term Monitoring and Source Apportionment of PM2.5/PM10 in Beijing, China. J. Environ. Sci. 20: 1323–1327.
Wang, H.L., Zhou, Y.M., Zhuang, Y.H., Wang, X.K. and Hao, Z.P. (2009). Characterization of PM2.5/PM2.5–10 and Source Tracking in the Juncture Belt between Urban and Rural Areas of Beijing. Chin. Sci. Bull. 54: 2506–2515.
Wang, M.X., Zhang R.J. and Pu Y.F. (2001). Recent Researches on Aerosol in China. Adv. Atmos. Sci. 18: 576–586.
World Health Organization (WHO) (2011). http://www.who.int.
Xu, H.M., Cao, J.J., Ho, K.F., Ding, H., Han, Y.M., Wang, G.H., Chow, J.C., Watson, J.G., Khol, S.D., Qiang, J. and Li, W.T. (2012). Lead Concentrations in Fine Particulate Matter after the Phasing Out of Leaded Gasoline in Xi’an, China. Atmos. Environ. 46: 217–224.
Xu, J., Ding, G.A., Yan, P., Wang, S.F., Meng, Z.Y., Zhang, Y.M., Liu, Y.C., Zhang, X.L. and Xu, X.D. (2007). Componential Characteristics and Sources Identification of PM2.5 in Beijing. J. Appl. Meteorol. Sci. 18: 645–654 (in Chinese with English Abstract).
Yao, X., Lau, A.P.S., Fang, M., Chan C.K. and Hu, M. (2003). Size Distributions and Formation of Ionic Species in Atmospheric Particulate Pollutants in Beijing, China: 1–Inorganic Ions. Atmos. Environ. 37: 2991–3000.
Zhang, R.J., Wang, M.X., Zhang X.Y. and Zhu G.H. (2003). Analysis on the Chemical and Physical Properties of Particles in a Dust Storm in Spring in Beijing. Powder Technol. 137: 77–82.
Zhang, R.J., Shen, Z.X., Cheng, T.T., Zhang, M.G. and Liu, Y.J. (2010). The Elemental Composition of Atmospheric Particles at Beijing during Asian Dust Events in Spring 2004. Aerosol Air Qual. Res. 10: 67–75.
Zhang, R.J., Shen, Z.X., Zhang, L.M., Zhang, M.G., Wang, X. and Zhang, K. (2011). Elemental Composition of Atmospheric Particles during Periods with and without Traffic Restriction in Beijing: The Effectiveness of Traffic Restriction measure. SOLA 7: 061–064.
Zhang, W., Guo, J.H., Sun, Y.L., Yuan, H., Zhuang, G.S., Zhuang, Y.H. and Hao, Z.P. (2007). Source Apportionment for Urban PM10 and PM2.5 in the Beijing Area. Chin. Sci. Bull. 52: 608–615.
Zheng, M., Salmon, L.G., Schauer, J.J., Zeng, L., Kiang, C.S. and Zhang, Y. (2005). Seasonal Trends in PM2.5 Source Contributions in Beijing, China. Atmos. Environ. 39: 3967–3976.
Received for review, July 23, 2012 Accepted, November 1, 2012