characterization for dynamic recrystallization kinetics...
TRANSCRIPT

Chapter 2
Characterization for Dynamic Recrystallization KineticsBased on Stress-Strain Curves
Quan Guo-Zheng
Additional information is available at the end of the chapter
http://dx.doi.org/10.5772/54285
1. Introduction
Most metals and alloys have become increasingly important in a variety of applications. Themost important of these properties are ease of high strength, relatively good ductility, andgood corrosion resistance. One of the ways of acquiring the best combination of these prop‐erties is to select the microstructure, which in turn depends on thermo-mechanical history aswell as on chemical composition [1]. An optimization of the thermo-mechanical process canbe achieved through an understanding of the entire forming process and the metallurgicalvariables affecting the micro-structural features occurring during deformation operationscarried out during deformation operations carried out at high temperatures. Most applicationsof these alloys are in the chemical process equipment, petrochemical, aerospace industry, andmedical tools. The understanding of metals and alloys behavior at hot deformation conditionhas a great importance for designers of hot metal forming processes (hot rolling, forging andextrusion) because of its effective role on metal flow pattern, and the constitutive relationshipsare often used to describe the plastic flow properties of metals and alloys in a form that can beused in computer code to model the forging response of mechanical part members under theprevailing loading conditions [2].
During hot forming process alloy is liable to undergo work hardening (WH), dynamic recovery(DRV) and dynamic recrystallization (DRX), three metallurgical phenomena for controllingmicrostructure and mechanical properties [3]. The relay of softening mechanism from strain-hardening and dynamic recovery to DRX is the reason the term discontinuous has been earned.At a microstructural level DRX begins when strain hardening plus recovery can no longer storemore immobile dislocations. When the critical strain is reached, on face centered cubic (fcc)metals of medium to low stacking fault energy, strain-hardening and dynamic recovery ceaseto be the principle mechanisms responsible of the stress-strain response, DRX accompanies
© 2013 Guo-Zheng; licensee InTech. This is an open access article distributed under the terms of the CreativeCommons Attribution License (http://creativecommons.org/licenses/by/3.0), which permits unrestricted use,distribution, and reproduction in any medium, provided the original work is properly cited.

the process. However, DRX is not a phenomenon restricted to fcc metals, it has been describedon ice, some minerals, and even high purity α–Fe (bcc metal) [4-6]. In the deformed materialDRX would affect the crystallographic texture and thus, material anisotropy. For example,DRX would eliminate some crystal defects, such as part of dislocations resulting from workhardening, which will improve hot plasticity, refine microstructure, and reduce the deforma‐tion resistance [7]. High stacking fault energy (SFE) metals, such as aluminium alloys, alphatitanium alloys, and ferritic steels, undergo continuous dynamic recrystallization (CDRX)rather than discontinuous dynamic recrystallization (DDRX) during high temperaturedeformation. In particular, due to the high efficiency of dynamic recovery, new grains are notformed by a classical nucleation mechanism; the recrystallized microstructure developsinstead by the progressive transformation of subgrains into new grains, within the deformedoriginal grains. Dislocations produced by strain hardening accumulate progressively in low-angle (subgrain) boundaries (LABs), leading to the increase of their misorientation angle andthe formation of high-angle (grain) boundaries (HABs), when a critical value of the misorien‐tation angle is reached. The microstructure is thus intermediate between a subgrain and a grainstructure: while grains and subgrains are entirely delimited by HABs and LABs, respectively,it will be referred to as an aggregate of crystallites, which are bounded partly by LABs andpartly by HABs. On the contrary, low stacking fault energy (SFE) metals, such as magnesiumalloys, austenitic steels, and beta titanium alloys, undergo discontinuous dynamic recrystal‐lization (DDRX) rather than continuous dynamic recrystallization (CDRX) during hightemperature deformation [8].
2. Description of softening flow behavior coupling with DRX
Hot working behavior of alloys is generally reflected on flow curves which are a directconsequence of microstructural changes: the generation of dislocations, work hardening, WH,the rearrangement of dislocations, their self-annihilation, and their absorption by grainboundaries, DRV, the nucleation and growth of new grains, DRX. The latter is one of the mostimportant softening mechanisms at high temperatures. This is a characteristic of low andmedium stacking fault energy, SFE, materials e.g., γ-iron, the austenitic stainless steels, andcopper. The most significant changes in the structure-sensitive properties occur during theprimary recrystallization stage. In this stage the deformed lattice is completely replaced by anew unstrained one by means of a nucleation and growth process, in which practically stress-free grains grow from nuclei formed in the deformed matrix. The orientation of the new grainsdiffers considerably from that of the crystals they consume, so that the growth process mustbe regarded as incoherent, i.e. it takes place by the advance of large-angle boundaries sepa‐rating the new crystals from the strained matrix [1].
DRX occurs during straining of metals at high temperature, characterized by a nucleation rateof low dislocation density grains and a posterior growth rate that can produce a homogeneousgrain size when equilibrium is reached. The process of recrystallization may be pictured asfollows. After deformation, polygonization of the bent lattice regions on a fine scale occursand this results in the formation of several regions in the lattice where the strain energy is
Recent Developments in the Study of Recrystallization62
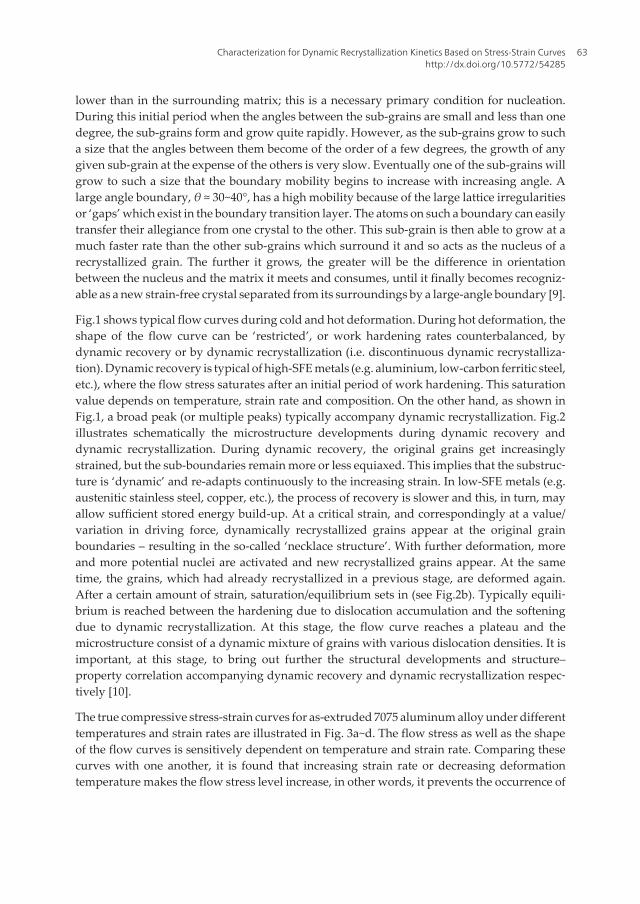
lower than in the surrounding matrix; this is a necessary primary condition for nucleation.During this initial period when the angles between the sub-grains are small and less than onedegree, the sub-grains form and grow quite rapidly. However, as the sub-grains grow to sucha size that the angles between them become of the order of a few degrees, the growth of anygiven sub-grain at the expense of the others is very slow. Eventually one of the sub-grains willgrow to such a size that the boundary mobility begins to increase with increasing angle. Alarge angle boundary, θ ≈ 30~40°, has a high mobility because of the large lattice irregularitiesor ‘gaps’ which exist in the boundary transition layer. The atoms on such a boundary can easilytransfer their allegiance from one crystal to the other. This sub-grain is then able to grow at amuch faster rate than the other sub-grains which surround it and so acts as the nucleus of arecrystallized grain. The further it grows, the greater will be the difference in orientationbetween the nucleus and the matrix it meets and consumes, until it finally becomes recogniz‐able as a new strain-free crystal separated from its surroundings by a large-angle boundary [9].
Fig.1 shows typical flow curves during cold and hot deformation. During hot deformation, theshape of the flow curve can be ‘restricted’, or work hardening rates counterbalanced, bydynamic recovery or by dynamic recrystallization (i.e. discontinuous dynamic recrystalliza‐tion). Dynamic recovery is typical of high-SFE metals (e.g. aluminium, low-carbon ferritic steel,etc.), where the flow stress saturates after an initial period of work hardening. This saturationvalue depends on temperature, strain rate and composition. On the other hand, as shown inFig.1, a broad peak (or multiple peaks) typically accompany dynamic recrystallization. Fig.2illustrates schematically the microstructure developments during dynamic recovery anddynamic recrystallization. During dynamic recovery, the original grains get increasinglystrained, but the sub-boundaries remain more or less equiaxed. This implies that the substruc‐ture is ‘dynamic’ and re-adapts continuously to the increasing strain. In low-SFE metals (e.g.austenitic stainless steel, copper, etc.), the process of recovery is slower and this, in turn, mayallow sufficient stored energy build-up. At a critical strain, and correspondingly at a value/variation in driving force, dynamically recrystallized grains appear at the original grainboundaries – resulting in the so-called ‘necklace structure’. With further deformation, moreand more potential nuclei are activated and new recrystallized grains appear. At the sametime, the grains, which had already recrystallized in a previous stage, are deformed again.After a certain amount of strain, saturation/equilibrium sets in (see Fig.2b). Typically equili‐brium is reached between the hardening due to dislocation accumulation and the softeningdue to dynamic recrystallization. At this stage, the flow curve reaches a plateau and themicrostructure consist of a dynamic mixture of grains with various dislocation densities. It isimportant, at this stage, to bring out further the structural developments and structure–property correlation accompanying dynamic recovery and dynamic recrystallization respec‐tively [10].
The true compressive stress-strain curves for as-extruded 7075 aluminum alloy under differenttemperatures and strain rates are illustrated in Fig. 3a~d. The flow stress as well as the shapeof the flow curves is sensitively dependent on temperature and strain rate. Comparing thesecurves with one another, it is found that increasing strain rate or decreasing deformationtemperature makes the flow stress level increase, in other words, it prevents the occurrence of
Characterization for Dynamic Recrystallization Kinetics Based on Stress-Strain Curveshttp://dx.doi.org/10.5772/54285
63

softening due to DRX and dynamic recovery (DRV) and makes the deformed metals exhibitwork hardening (WH). The cause lies in the fact that higher strain rate and lower temperatureprovide shorter time for the energy accumulation and lower mobilities at boundaries whichresult in the nucleation and growth of dynamically recrystallized grains and dislocationannihilation. For every curve, after a rapid increase in the stress to a peak value, the flow stressdecreases monotonically towards a steady state regime with a varying softening rate whichtypically indicates the onset of DRX. In further, from all the true stress-strain curves, it can besummarized that the stress evolution with strain exhibits three distinct stages. At the first stage
Figure 1. Typical flow curves during cold and hot deformation
(a) (b)
Figure 2. Evolution of the microstructure during (a) hot deformation of a material showing recovery and (b) continu‐ous dynamic recrystallization (CDRX).
Recent Developments in the Study of Recrystallization64

where work hardening (WH) predominates, flow stress exhibits a rapid increase to a criticalvalue. At the second stage, flow stress exhibits a smaller and smaller increase until a peak valueor an inflection of work-hardening rate, which shows that the thermal softening due to DRXand dynamic recovery (DRV) becomes more and more predominant, then it exceeds WH. Atthe third stage, two types of curve variation tendency can be generalized as following:decreasing gradually to a steady state with DRX softening (573~723 K & 0.01 s-1, 623~723 K &0.1 s-1, 623~723 K & 1 s-1, 723 K & 10 s-1), decreasing continuously with significant DRX softening(573 K & 0.1 s-1, 573 K & 1 s-1, 573~623 K & 10 s-1). Thus, it can be concluded that the typicalform of flow curve with DRX softening, including a single peak followed by a steady state flowas a plateau, is more recognizable at higher temperatures and lower strain rates. That is becauseat lower strain rates and higher temperatures, the higher DRX softening rate slows down therate of work-hardening, and both the peak stress and the onset of steady state flow are thereforeshifted to lower strain levels [11].
0.0 -0.1 -0.2 -0.3 -0.4 -0.5 -0.6 -0.7 -0.8 -0.9 -1.00
-50
-100
-150
-200
-250
-300 -1s01.0
723 K
673 K
623 K
573 K
Tru
e St
ress
(M
pa)
True Strain
0.0 -0.1 -0.2 -0.3 -0.4 -0.5 -0.6 -0.7 -0.8 -0.9 -1.00
-50
-100
-150
-200
-250
-300 -1s1.0
Tru
e S
tres
s (M
pa)
True Strain
723 K
673 K
623 K
573 K
(a) (b)
0.0 -0.1 -0.2 -0.3 -0.4 -0.5 -0.6 -0.7 -0.8 -0.9 -1.00
-50
-100
-150
-200
-250
-300 -1s1
Tru
e St
ress
(M
pa)
True Strain
723 K673 K
623 K
573 K
0.0 -0.1 -0.2 -0.3 -0.4 -0.5 -0.6 -0.7 -0.8 -0.9 -1.00
-50
-100
-150
-200
-250
-300-1s10
Tru
e St
ress
(M
pa)
True Strain
723 K
673 K
623 K
573 K
(c) (d)
Fig.3 True stress-strain curves of as-extruded 7075 aluminum alloy at different strain rates
and temperatures. (a) 0.01 s-1, 573~723 K, (b) 0.1 s-1, 573~723 K, (c) 1 s-1, 573~723 K, (d) 10
s-1, 573~723 K.
The similar flow behavior of as-cast AZ80 magnesium alloy with as-extruded 7075
aluminum alloy is illustrated in Fig. 4a~d. Both deformation temperature and strain rate have
considerable influence on the flow stress of AZ80 magnesium alloy. From the true
stress-strain curves in Fig. 4a~d, it also can be seen that the stress evolution with strain
exhibits three distinct stages. At the first stage where work hardening (WH) predominates and
cause dislocations to polygonize into stable subgrains, flow stress exhibits a rapid increase to
Figure 3. True stress-strain curves of as-extruded 7075 aluminum alloy at different strain rates and temperatures. (a)0.01 s-1, 573~723 K, (b) 0.1 s-1, 573~723 K, (c) 1 s-1, 573~723 K, (d) 10 s-1, 573~723 K.
Characterization for Dynamic Recrystallization Kinetics Based on Stress-Strain Curveshttp://dx.doi.org/10.5772/54285
65

The similar flow behavior of as-cast AZ80 magnesium alloy with as-extruded 7075 aluminumalloy is illustrated in Fig. 4a~d. Both deformation temperature and strain rate have considerableinfluence on the flow stress of AZ80 magnesium alloy. From the true stress-strain curves inFig. 4a~d, it also can be seen that the stress evolution with strain exhibits three distinct stages.At the first stage where work hardening (WH) predominates and cause dislocations topolygonize into stable subgrains, flow stress exhibits a rapid increase to a critical value withincreasing strain, meanwhile the stored energy in the grain boundaries originates from a largedifference in dislocation density within subgrains or grains and grows rapidly to DRXactivation energy. When the critical driving force is attained, new grains are nucleated alongthe grain boundaries, deformation bands and dislocations, resulting in equiaxed DRX grains.At the second stage, flow stress exhibits a smaller and smaller increase until a peak value oran inflection of work-hardening rate, which shows that the thermal softening due to DRX anddynamic recovery (DRV) becomes more and more predominant, then it exceeds WH. At thethird stage, two types of curve variation tendency can be generalized as following: decreasinggradually to a steady state with DRX softening (573~673 K & 0.01 s-1, 623~673 K & 0.1 s-1, 573K & 1 s-1,, 673 K & 1 s-1), and decreasing continuously with significant DRX softening (523 K &0.01 s-1, 523~573 K & 0.1 s-1, 523 K & 1 s-1,, 623 K & 1 s-1, 523~673 K & 10 s-1) [12-14].
(a) (b)
(c) (d)
Figure 4. True stress-strain curves of as-cast AZ80 magnesium alloy obtained by Gleeble 1500 under different defor‐mation temperatures with strain rates (a) 0.01 s-1, (b) 0.1 s-1, (c) 1 s-1, (d) 10 s-1.
Recent Developments in the Study of Recrystallization66
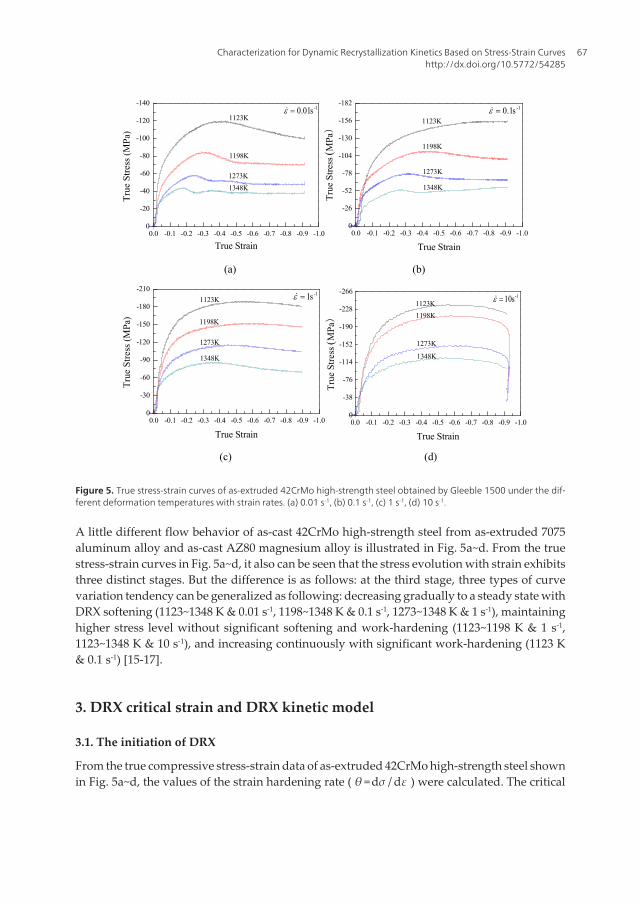
A little different flow behavior of as-cast 42CrMo high-strength steel from as-extruded 7075aluminum alloy and as-cast AZ80 magnesium alloy is illustrated in Fig. 5a~d. From the truestress-strain curves in Fig. 5a~d, it also can be seen that the stress evolution with strain exhibitsthree distinct stages. But the difference is as follows: at the third stage, three types of curvevariation tendency can be generalized as following: decreasing gradually to a steady state withDRX softening (1123~1348 K & 0.01 s-1, 1198~1348 K & 0.1 s-1, 1273~1348 K & 1 s-1), maintaininghigher stress level without significant softening and work-hardening (1123~1198 K & 1 s-1,1123~1348 K & 10 s-1), and increasing continuously with significant work-hardening (1123 K& 0.1 s-1) [15-17].
3. DRX critical strain and DRX kinetic model
3.1. The initiation of DRX
From the true compressive stress-strain data of as-extruded 42CrMo high-strength steel shownin Fig. 5a~d, the values of the strain hardening rate ( θ =dσ / dε ) were calculated. The critical
exhibits three distinct stages. But the difference is as follows: at the third stage, three types of
curve variation tendency can be generalized as following: decreasing gradually to a steady
state with DRX softening (1123~1348 K & 0.01 s-1, 1198~1348 K & 0.1 s-1, 1273~1348 K &
1 s-1), maintaining higher stress level without significant softening and work-hardening
(1123~1198 K & 1 s-1, 1123~1348 K & 10 s-1), and increasing continuously with significant
work-hardening (1123 K & 0.1 s-1) [15-17].
0.0 -0.1 -0.2 -0.3 -0.4 -0.5 -0.6 -0.7 -0.8 -0.9 -1.00
-20
-40
-60
-80
-100
-120
-140 -1s01.0
1198K
1123K
1273K
Tru
e S
tres
s (M
Pa)
True Strain
1348K
0.0 -0.1 -0.2 -0.3 -0.4 -0.5 -0.6 -0.7 -0.8 -0.9 -1.00
-26
-52
-78
-104
-130
-156
-182 -1s1.0
Tru
e S
tres
s M
Pa)
True Strain
1198K
1123K
1273K
1348K
(a) (b)
0.0 -0.1 -0.2 -0.3 -0.4 -0.5 -0.6 -0.7 -0.8 -0.9 -1.00
-30
-60
-90
-120
-150
-180
-210 -1s1
Tru
e St
ress
(M
Pa)
True Strain
1198K
1123K
1273K
1348K
0.0 -0.1 -0.2 -0.3 -0.4 -0.5 -0.6 -0.7 -0.8 -0.9 -1.00
-38
-76
-114
-152
-190
-228
-266-1s10
Tru
e St
ress
MP
a)
True Strain
1198K
1123K
1273K
1348K
(c) (d)
Fig. 5 True stress-strain curves of as-extruded 42CrMo high-strength steel obtained by
Gleeble 1500 under the different deformation temperatures with strain rates. (a) 0.01 s-1, (b)
0.1 s-1, (c) 1 s-1, (d) 10 s-1.
Figure 5. True stress-strain curves of as-extruded 42CrMo high-strength steel obtained by Gleeble 1500 under the dif‐ferent deformation temperatures with strain rates. (a) 0.01 s-1, (b) 0.1 s-1, (c) 1 s-1, (d) 10 s-1.
Characterization for Dynamic Recrystallization Kinetics Based on Stress-Strain Curveshttp://dx.doi.org/10.5772/54285
67

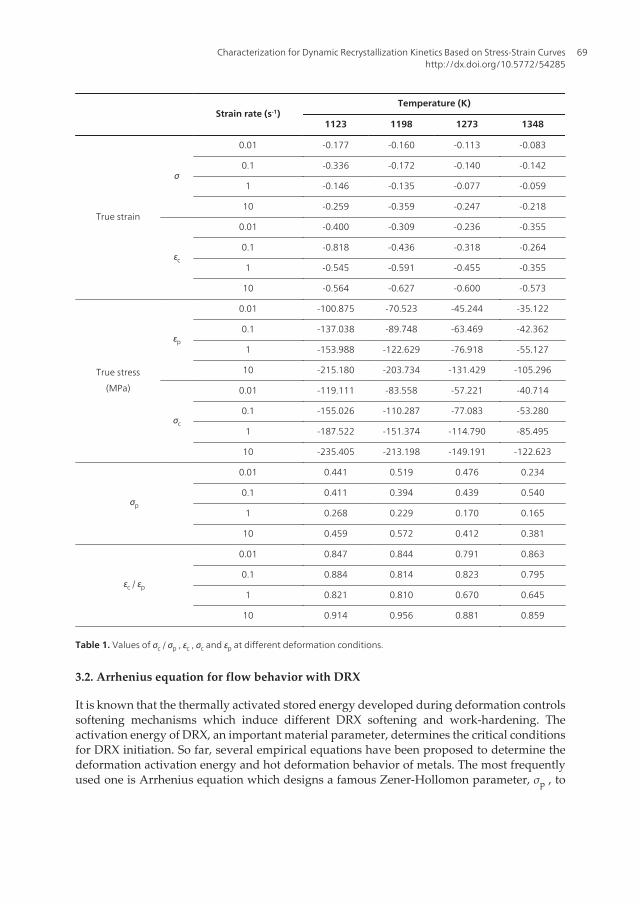
conditions for the onset of DRX can be attained when the value of | −dθ / dσ | , where strainhardening rate θ =dσ / dε , reaches the minimum which corresponds to an inflection of dσ / dεversus σ curve. In this study, analysis of inflections in the plot of dσ / dε versus σ up to thepeak point of the true stress-strain curve has been performed to reveal whether DRX occurs.Results confirm that the dσ / dε versus σ curves have characteristic inflections as shown in Fig.6a~d, which indicates that DRX is initiated at corresponding deformation conditions. Thecritical stress to initiation can be identified, and hence the corresponding critical strain toinitiation can be obtained from true stress-strain curve. As a result, the values of critical strainand peak stress at different deformation conditions were shown in Table.1, from which it canbe seen that the critical strain and critical stress depend on temperature and strain ratenonlinearly, and it is summarized that εc / εp =0.165~0.572 , σc / σp =0.645~0.956 [15].
0 -20 -40 -60 -80 -100 -1200
100
200
300
400
500
600
1348K 1273K 1198K
θ=dσ
/dε
(MP
a)
σ (MPa)
1123K
-1s01.0
0 -30 -60 -90 -120 -150 -1800
100
200
300
400
500
600 -1s1.0
θ=dσ
/dε
(MPa
)
σ (MPa)
1348K 1273K 1198K 1123K
(a) (b)
0 -35 -70 -105 -140 -175 -2100
200
400
600
800
1000
1200 -1s1
θ=dσ
/dε
(MPa
)
σ (MPa)
1348K 1273K 1198K 1123K
0 -40 -80 -120 -160 -200 -240 -2800
200
400
600
800
1000
1200 -1s10
θ=dσ
/dε
(MPa
)
σ (MPa)
1348K 1273K 1198K 1123K
(c) (d)
Fig. 6 dd versus plots up to the peak points of the true stress-strain curves under
different deformation temperatures with strain rates (a) 0.01 s-1, (b) 0.1 s-1, (c) 1 s-1, (d) 10 s-1.
Table 1 Values of c ,
c , p and
p at different deformation conditions.
Strain rate (s-1) Temperature (K)
1123 1198 1273 1348
True strain c 0.01 -0.177 -0.160 -0.113 -0.083
0.1 -0.336 -0.172 -0.140 -0.142
1 -0.146 -0.135 -0.077 -0.059
Figure 6. Formula: Eqn012.wmf>versus dσ / dε plots up to the peak points of the true stress-strain curves under differ‐ent deformation temperatures with strain rates (a) 0.01 s-1, (b) 0.1 s-1, (c) 1 s-1, (d) 10 s-1.
Recent Developments in the Study of Recrystallization68
Strain rate (s-1)Temperature (K)
1123 1198 1273 1348
True strain
σ
0.01 -0.177 -0.160 -0.113 -0.083
0.1 -0.336 -0.172 -0.140 -0.142
1 -0.146 -0.135 -0.077 -0.059
10 -0.259 -0.359 -0.247 -0.218
εc
0.01 -0.400 -0.309 -0.236 -0.355
0.1 -0.818 -0.436 -0.318 -0.264
1 -0.545 -0.591 -0.455 -0.355
10 -0.564 -0.627 -0.600 -0.573
True stress
(MPa)
εp
0.01 -100.875 -70.523 -45.244 -35.122
0.1 -137.038 -89.748 -63.469 -42.362
1 -153.988 -122.629 -76.918 -55.127
10 -215.180 -203.734 -131.429 -105.296
σc
0.01 -119.111 -83.558 -57.221 -40.714
0.1 -155.026 -110.287 -77.083 -53.280
1 -187.522 -151.374 -114.790 -85.495
10 -235.405 -213.198 -149.191 -122.623
σp
0.01 0.441 0.519 0.476 0.234
0.1 0.411 0.394 0.439 0.540
1 0.268 0.229 0.170 0.165
10 0.459 0.572 0.412 0.381
εc / εp
0.01 0.847 0.844 0.791 0.863
0.1 0.884 0.814 0.823 0.795
1 0.821 0.810 0.670 0.645
10 0.914 0.956 0.881 0.859
Table 1. Values of σc / σp , εc , σc and εp at different deformation conditions.
3.2. Arrhenius equation for flow behavior with DRX
It is known that the thermally activated stored energy developed during deformation controlssoftening mechanisms which induce different DRX softening and work-hardening. Theactivation energy of DRX, an important material parameter, determines the critical conditionsfor DRX initiation. So far, several empirical equations have been proposed to determine thedeformation activation energy and hot deformation behavior of metals. The most frequentlyused one is Arrhenius equation which designs a famous Zener-Hollomon parameter, σp , to
Characterization for Dynamic Recrystallization Kinetics Based on Stress-Strain Curveshttp://dx.doi.org/10.5772/54285
69
represent the effects of the temperatures and strain rate on the deformation behaviors, andthen uncovers the approximative hyperbolic law between Z parameter and flow stress [15].
exp( )Z Q RTe= & (1)
( )exp( )AF Q RTe s= -& (2)
Where,
where F (σ)= { |σ | n α |σ | <0.8exp(β |σ |) α |σ | >1.2
sinh(α |σ |) n for all σ is the strain rate (s-1), ε̇ is the universal gas constant (8.31
J mol-1 K-1), R is the absolute temperature (K), T is the activation energy of DRX (kJ mol-1), Qis the flow stress (MPa) for a given stain, σ , A and α are the material constants ( n ).
3.2.1. Calculation of material constant α = β / n
For the low stress level ( n ), substituting the power law of ασ <0.8 into Eq. (2) and takingnatural logarithms on both sides of Eq. (2) give
ln ln lnA n Q RTe s= + -& (3)
Then, lnε̇ = lnA + nln|σ | −Q / RT . In 2010, Quan et al. [17] plotted the relationships betweenthe true stress and true strain of 42CrMo high-strength steel in ln-ln scale under differenttemperatures and strain rates, and hence found a true strain range of -0.08~-0.18 including partof the first stage and the second stage described in the previous, in which all the stresses increasegradually with almost the same ratios. Therefore, this true strain range was accepted as a steadyWH stage corresponding to low stress level. In further, Quan et al. [17] fitted the relationshipsbetween the stress and the strain rate as the true strain was -0.14, and then found almost equallylinear relationships which revealed that the influence of temperature was very small. Thus, itcan be deduced that to evaluate the material constant n =dlnε̇ / dln|σ | of Arrhenius equation,the stress-strain data in the true strain range of -0.08~-0.18 contribute to the minimum calcu‐lation tolerance. Here true strain n was chose. Fig. 7 shows the relationships between ε = −0.1and ln|σ | for lnε̇ under different temperatures. The linear relationship is observed for eachtemperature and the slope rates are almost similar with each other. The mean value of all theslope rates is accepted as the inverse of material constant ε = −0.1 , thus n value is obtained as8.27780.
3.2.2. Calculation of material constant lnε̇
For the high stress level ( β ), substituting the exponential law of α |σ | >1.2 into Eq. (2) andtaking natural logarithms on both sides of Eq. (2) give
Recent Developments in the Study of Recrystallization70

ln ln A Q RTe b s= + -& (4)
Then, lnε̇ = lnA + β |σ | −Q / RT . The peak stresses at different temperatures and strain ratescan be identified for the target stresses with high level. The linear relationships betweenβ =dlnε̇ / |σ | and |σ | at different temperatures were fitted out as Fig. 8. The mean value ofall the slope rates is accepted as the inverse of material constant lnε̇ , thus β value is obtainedas 0.07558 MPa-1. Thus, another material constant β MPa-1.
3.2.3. Calculation of DRX activation energy lnε̇
For all the stress level (including low and high stress levels), Eq.(2) can be represented as thefollowing
0.02 0.14 1.00 7.3920.0
54.4
147.8
1.0-=e
1123K 1198K 1273K 1348K
e&ln
( s-1)
ln|σ|
(MPa
)
Figure 7. The relationships between n and lnσ .
0.02 0.14 1.00 7.390
50
100
150
200
250 1123K 1198K 1273K 1348K
True
stre
ss (M
Pa)
Strain rate in ln scale e&ln ( s-1)
|σ| (M
Pa)
Figure 8. The relationships between α=β /n= 0.00913 and |σ | .
Characterization for Dynamic Recrystallization Kinetics Based on Stress-Strain Curveshttp://dx.doi.org/10.5772/54285
71

ln ln lnsinh( )A n Q RTe a sé ù= + -ë û& (5)
If lnε̇ = lnA + n lnsinh(α |σ |) −Q / RT is constant, there is a linear relationship between ε̇and lnsinh(α |σ |) , and Eq. (5) can be rewritten as
{ }d lnsinh( ) d(1 / )Q Rn Ta sé ù= ë û (6)
The peak stresses at different temperatures and strain rates can be identified for the presenttarget stresses. The linear relationships between Q = Rn{d lnsinh(α |σ |) / d(1 / T )} andlnsinh(ασ) at different strain rates were fitted out as Fig. 9. The mean value of all the sloperates is accepted as 1 / T value, then Q / Rn is calculated as 599.73210 kJ mol-1. The activationenergy of DRX is a term defined as the energy that must be overcome in order for the nucleationand growth of new surface or grain boundary to occur. In 2008, Lin et al. found that theactivation energy of as-cast 42CrMo steel is not a constant but a variable 392~460 kJ mol-1 as afunction of strain, and the peak value of DRX energy corresponds to the peak stress [18, 19].In this investigate, the influence of strain on the variable activation energy was ignored tosimplify the following calculations, and only the peak value of DRX energy was accepted asthe activation energy of DRX. This simplification ensures the predicted occurrence of DRX bythe derived equations. Lin et al. also pointed that the average value of the activation energy ofas-cast 42CrMo steel is 438.865 kJ mol-1 [18, 19]. The average Q value of extruded 42CrMo steel,599.73210 kJ mol-1, is a little higher than that of as-cast 42CrMo steel adopted by Lin et al. Thedifference of two average Q values results from the different as-received statuses. In common,the higher deformation activation energy will be found in hot deformation of as-received steelswith higher yield strength. It is obvious that the true stress data of extruded rods in this workare higher than that of as-cast billets in the work of Lin et al. In addition, the difference ofexperiment projects involving strain rate between this work and the work of Lin et al is anotherimportant reason for the difference of calculation result.
0.00072 0.00076 0.00080 0.00084 0.00088 0.00092-2.4
-1.6
-0.8
0.0
0.8
1.6
2.4
0.01 s-1
0.1 s-1
1 s-1
10 s-1
lnsin
h (ασ
)
1/T ( K-1)
Figure 9. The relationships between Q and lnsinh(α |σ | ) .
Recent Developments in the Study of Recrystallization72

3.2.4. Construction of constitutive equation
Substituting 1 / T , α , n and four sets of Q , ε̇ and T into Eq. (5), the mean value of materialconstant σ is obtained as 2.44154×1025 s-1. Thus, the relationship between A , ε̇ and T can beexpressed as
25 8.27780 32.44154 10 sinh(0.00913 ) exp (599.73210 10 ) 8.31Te sé ù é ù= ´ - ´ë û ë û& (7)
Substituting ε̇ =2.44154×1025 sinh(0.00913|σ |)8.27780 exp − (599.73210×10³) / 8.31T into Eq.(7), thus, the the flow stress can be expressed as
{ }25 1/8.27780 25 2/8.27780 1/2109.52903ln [ / (2.44154 10 )] {[ / (2.44154 10 )] 1}Z Zs = ´ + ´ + (8)
3.3. DRX kinetic model
During thermoplastic deformation process, dislocations continually increase and accumulateto such an extent that at a critical strain, DRX nucleus would form and grow up near grainboundaries, twin boundaries and deformation bands. It is well known that the conflictingeffects coexist between the multiplication of dislocation due to continual hot deformation andthe annihilation of dislocation due to DRX. When work-hardening corresponding to the formerand DRX softening corresponding to the later are in dynamic balance, flow stress will keepconstant with increasing strain, meanwhile deformation comes to a steady stage in whichcomplete DRX grains have equiaxed shape and keep constant size. In common, the kinetics ofDRX can be described in terms of normal S-curves of the recrystallized volume expressed asa function of time. In a constant strain rate, time can be replaced by strain and recrystallizedvolume fraction can be expressed by modified Avrami equation. Thus, the kinetics of DRXevolution can be predicted by the following equation [20].
( ){ }DRX c1 exp *m
X e e eé ù= - - -ë û (9)
where XDRX =1−exp{− (ε −εc) / ε * m} is the volume fraction of dynamic recrystallized grainand XDRX is Avrami’s constant. This expression, which is modified from the Avrami’sequation, means that m depends on strain, strain rate and temperature.
The true stress-strain curve data after the peak stress point were adopted to calculate DRXsoftening rate ( XDRX versus θ =dσ / dε ) plots, and the results were shown as Fig. 10a~d. Themaximum softening rate corresponds to the negative peak of such plot. The strain for maxi‐mum softening rate, σ , identified from Fig. 10a~d, and the critical strain, ε * , identified fromFig. 10a~d can be considered with a power function of dimensionless parameter, εc (Fig. 11a~b).
Characterization for Dynamic Recrystallization Kinetics Based on Stress-Strain Curveshttp://dx.doi.org/10.5772/54285
73

The function expressions linearly fitted by the method of least squares are Z / A and
|ε * | =0.61822(Z /A)0.08207 .
softening rate ( dd versus ) plots, and the results were shown as Fig. 10a~d. The
maximum softening rate corresponds to the negative peak of such plot. The strain for
maximum softening rate, * , identified from Fig. 10a~d, and the critical strain, c ,
identified from Fig. 10a~d can be considered with a power function of dimensionless
parameter, AZ (Fig. 11a~b). The function expressions linearly fitted by the method of least
squares are 0.08207)/0.61822(* AZ and 0.06704c )/0.16707( AZ .
-20 -40 -60 -80 -100 -120 -140-100
-50
0
50
100
-0.210* -0.293*
-0.403*
-0.597*
1348K 1273K 1198K
θ=dσ
/dε
(MP
a)
σ (MPa)
1123K
-1s01.0-30 -60 -90 -120 -150 -180
-100
-50
0
50
100
-0.321* -0.403* -0.597*
-0.845*
-1s1.0
θ=dσ
/dε
(MP
a)
σ (MPa)
1348K 1273K 1198K 1123K
(a) (b)
-50 -75 -100 -125 -150 -175 -200-100
-50
0
50
100
-0.514* -0.624* -0.762* -0.872*
-1s1
θ=dσ
/dε
(MPa
)
σ (MPa)
1348K 1273K 1198K 1123K
-80 -110 -140 -170 -200 -230 -260-240
-180
-120
-60
0
60
120
-0.9*
-0.9* -0.9*
-0.9*
-1s10
θ=dσ
/dε
(MP
a)
σ (MPa)
1348K 1273K 1198K 1123K
(c) (d)
Fig. 10 dd versus plots after the peak points of the true stress-strain curves under
different deformation temperatures with strain rates (a) 0.01 s-1, (b) 0.1 s-1, (c) 1 s-1, (d) 10 s-1.
Figure 10. Formula: Eqn102.wmf>versus | εc | = 0.16707(Z/A)0.06704 plots after the peak points of the true stress-straincurves under different deformation temperatures with strain rates (a) 0.01 s-1, (b) 0.1 s-1, (c) 1 s-1, (d) 10 s-1.
Recent Developments in the Study of Recrystallization74

-12 -8 -4 0 4 8 12-3
-2
-1
0
1
2
0.08207)/0.61822(* AZ
ln|ε
* |
ln(Z/A)-12 -8 -4 0 4 8 12
-6
-4
-2
0
2
0.06704c )/0.16707( AZ
ln|ε
c|
ln(Z/A)
(a) (b)
Fig. 11 Relationships between the dimensionless parameter, Z/A, and (a) * , (b) c .
In order to solve the Avrami’s constant, m , it is essential to identify the deformation
conditions corresponding to 1DRX X meaning that the flow stress reaches a steady state in
which complete DRX grains have equiaxed shape and keep constant size. From the true
compressive stress-strain curves in Fig. 5a~d, and dd versus plots in Fig. 10a~d,
such the deformation conditions can be identified as shown in Table.2. Substituting these
deformation conditions corresponding to 1DRX X into Eq. (9), the mean value of the
Avrami’s constant m can be obtained as 3.85582. Thus, the kinetic model of DRX
calculated from true compressive stress-strain curves can be expressed as Table.3.
Table 2 The deformation strain corresponding to 1DRX X .
True strain Temperature (K) Strain rate (s-1)
-0.5~-0.9 1198 0.01
-0.4~-0.9 1273 0.01
-0.3~-0.9 1348 0.01
-0.6~-0.9 1273 0.1
-0.4~-0.9 1348 0.1
Table 3 The kinetic model of DRX calculated from true compressive stress-strain curves.
Figure 11. Relationships between the dimensionless parameter, Z/A, and (a) dσ / dε , (b) σ .
In order to solve the Avrami’s constant, ε * , it is essential to identify the deformation conditionscorresponding to εc meaning that the flow stress reaches a steady state in which complete DRXgrains have equiaxed shape and keep constant size. From the true compressive stress-straincurves in Fig. 5a~d, and m versus XDRX =1 plots in Fig. 10a~d, such the deformation conditionscan be identified as shown in Table.2. Substituting these deformation conditions correspond‐ing to dσ / dε into Eq. (9), the mean value of the Avrami’s constant σ can be obtained as 3.85582.Thus, the kinetic model of DRX calculated from true compressive stress-strain curves can beexpressed as Table.3.
True strain Temperature (K) Strain rate (s-1)
-0.5~-0.9 1198 0.01
-0.4~-0.9 1273 0.01
-0.3~-0.9 1348 0.01
-0.6~-0.9 1273 0.1
-0.4~-0.9 1348 0.1
Table 2. The deformation strain corresponding to XDRX = 1 .
Volume fractions of dynamic recrystallization Exponents
m XDRX = 1
XDRX = 1−exp{− (ε− εc) / ε * m}| ε * | = 0.61822(Z/A)0.08207
|εc | = 0.16707(Z/A)0.06704s-1
Characterization for Dynamic Recrystallization Kinetics Based on Stress-Strain Curveshttp://dx.doi.org/10.5772/54285
75

Volume fractions of dynamic recrystallization Exponents
Z = ε̇exp (599.73210 × 10³) / 8.31T
Table 3. The kinetic model of DRX calculated from true compressive stress-strain curves.
Based on the calculation results of this model, the effect of deformation temperature, strain andstrain rate on the recrystallized volume fraction is shown in Fig. 12a~d. These figures show thatas the strain’ absolute value increases, the DRX volume fraction increases and reaches a constantvalue of 1 meaning the completion of DRX process. Comparing these curves with one anoth‐er, it is found that, for a specific strain rate, the deformation strain required for the same amountof DRX volume fraction increases with decreasing deformation temperature, which means thatDRX is delayed to a longer time. In contrast, for a fixed temperature, the deformation strainrequired for the same amount of DRX volume fraction increases with increasing strain rate,which also means that DRX is delayed to a longer time. This effect can be attributed to de‐creased mobility of grain boundaries (growth kinetics) with increasing strain rate and decreas‐ing temperature. Thus, under higher strain rates and lower temperatures, the deformed metaltends to incomplete DRX, that is to say, the DRX volume fraction tends to be less than 1.
0.0 -0.1 -0.2 -0.3 -0.4 -0.5 -0.6 -0.7 -0.8 -0.90.0
0.2
0.4
0.6
0.8
1.0
1348 K 1273 K 1198 K 1123 K
-1s01.0
XD
RX
ε0.0 -0.1 -0.2 -0.3 -0.4 -0.5 -0.6 -0.7 -0.8 -0.9
0.0
0.2
0.4
0.6
0.8
1.0 -1s1.0
XD
RX
ε
1348 K 1273 K 1198 K 1123 K
(a) (b)
0.0 -0.1 -0.2 -0.3 -0.4 -0.5 -0.6 -0.7 -0.8 -0.90.0
0.2
0.4
0.6
0.8
1.0 -1s1
XD
RX
ε
1348 K 1273 K 1198 K 1123 K
0.0 -0.1 -0.2 -0.3 -0.4 -0.5 -0.6 -0.7 -0.8 -0.90.0
0.2
0.4
0.6
0.8
1.0-1s10
XD
RX
ε
1348 K 1273 K 1198 K 1123 K
(c) (d)
Fig. 12 Predicted volume fractions of dynamic recrystallization obtained under different
deformation temperatures with strain rates (a) 0.01 s-1, (b) 0.1 s-1, (c) 1 s-1, (d) 10 s-1.
6. Observation for Size and Fraction of DRX Grains
The microstructures on the section plane of specimen deformed to the true strain of -0.9
were examined and analyzed under the optical microscope. Fig. 13 shows the as-received
microstructure of as-extruded 42CrMo high-strength steel specimen with a single-phase FCC
structure and a homogeneous aggregate of rough equiaxed polygonal grains, while with
negligible volume fraction of inclusions or second-phase precipitates. The grain boundaries
are straight to gently curved and often intersect at ~120° triple junctions. Fig. 14a~d show the
Recent Developments in the Study of Recrystallization76

Figure 12. Predicted volume fractions of dynamic recrystallization obtained under different deformation tempera‐tures with strain rates (a) 0.01 s-1, (b) 0.1 s-1, (c) 1 s-1, (d) 10 s-1.
4. Observation for size and fraction of DRX grains
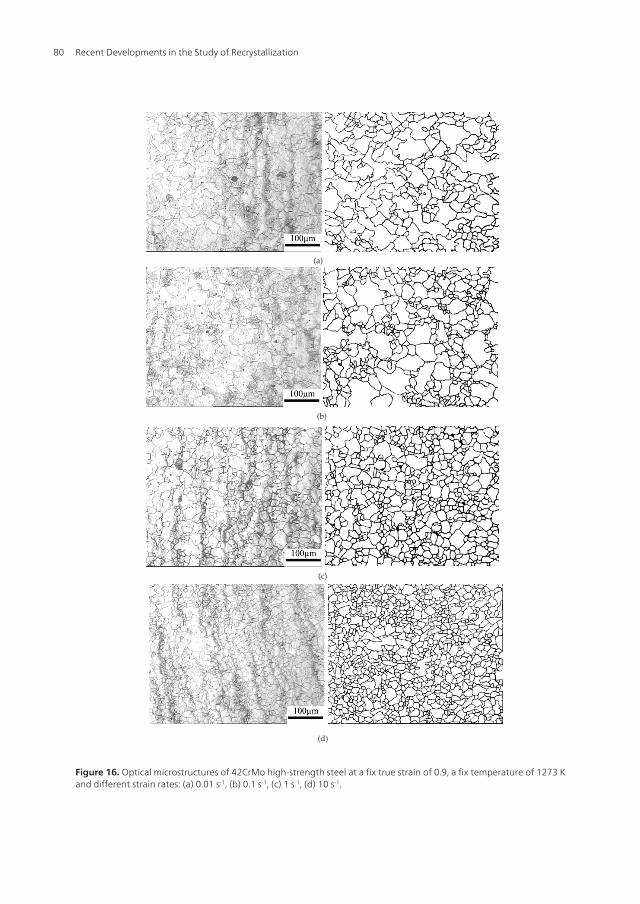
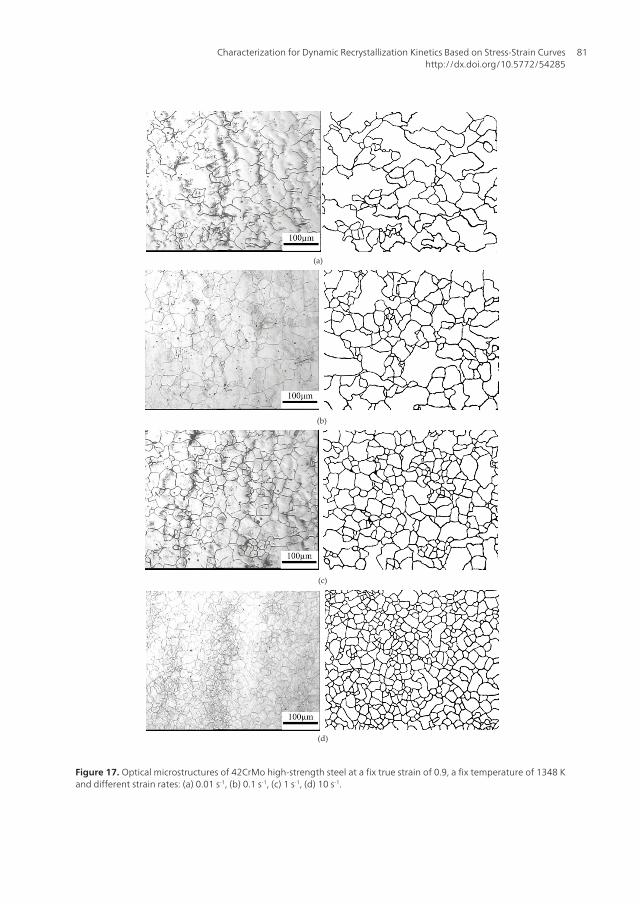
The microstructures on the section plane of specimen deformed to the true strain of -0.9 wereexamined and analyzed under the optical microscope. Fig. 13 shows the as-received micro‐structure of as-extruded 42CrMo high-strength steel specimen with a single-phase FCCstructure and a homogeneous aggregate of rough equiaxed polygonal grains, while withnegligible volume fraction of inclusions or second-phase precipitates. The grain boundariesare straight to gently curved and often intersect at ~120° triple junctions. Fig. 14a~d show thetypical microstructures of the specimens of as-extruded 42CrMo high-strength steel deformedto a strain of -0.9 at the temperature of 1123 K and at the strain rates of 0.01 s-1, 0.1 s-1, 1 s-1 and10 s-1, respectively. Fig. 15a~d show the typical microstructures of the specimens of as-extruded42CrMo high-strength steel deformed to a strain of -0.9 at the temperature of 1198 K and at thestrain rates of 0.01 s-1, 0.1 s-1, 1 s-1 and 10 s-1, respectively. Fig. 16a~d show the typical micro‐structures of the specimens of as-extruded 42CrMo high-strength steel deformed to a strain of-0.9 at the temperature of 1273 K and at the strain rates of 0.01 s-1, 0.1 s-1, 1 s-1 and 10 s-1,respectively. Fig. 17a~d show the typical microstructures of the specimens of as-extruded42CrMo high-strength steel deformed to a strain of -0.9 at the temperature of 1348 K and at thestrain rates of 0.01 s-1, 0.1 s-1, 1 s-1 and 10 s-1, respectively. At such deformation conditions therecrystallized grains with wavy or corrugated grain boundaries can be easily identified fromsubgrains by the misorientation between adjacent grains, i.e. subgrains are surrounded by lowangle boundaries while recrystallized grains have high angle boundaries. The deformed metalcompletely or partially transforms to a microstructure of approximately equiaxed defect-freegrains which are predominantly bounded by high angle boundaries (i.e. a recrystallizedmicrostructure) by relatively localized boundary migration.
Figure 13. Optical microstructures and average grain size of as-extruded 42CrMo high-strength steel undeformed(starting material)
Characterization for Dynamic Recrystallization Kinetics Based on Stress-Strain Curveshttp://dx.doi.org/10.5772/54285
77

(a)
(b)
(c)
(d)
Figure 14. Optical microstructures of 42CrMo high-strength steel at a fix true strain of 0.9, a fix temperature of 1123 Kand different strain rates: (a) 0.01 s-1, (b) 0.1 s-1, (c) 1 s-1, (d) 10 s-1.
Recent Developments in the Study of Recrystallization78

(a)
(b)
(c)
(d)
Figure 15. Optical microstructures of 42CrMo high-strength steel at a fix true strain of 0.9, a fix temperature of 1198 Kand different strain rates: (a) 0.01 s-1, (b) 0.1 s-1, (c) 1 s-1, (d) 10 s-1.
Characterization for Dynamic Recrystallization Kinetics Based on Stress-Strain Curveshttp://dx.doi.org/10.5772/54285
79
(a)
(b)
(c)
(d)
Figure 16. Optical microstructures of 42CrMo high-strength steel at a fix true strain of 0.9, a fix temperature of 1273 Kand different strain rates: (a) 0.01 s-1, (b) 0.1 s-1, (c) 1 s-1, (d) 10 s-1.
Recent Developments in the Study of Recrystallization80
(a)
(b)
(c)
(d)
Figure 17. Optical microstructures of 42CrMo high-strength steel at a fix true strain of 0.9, a fix temperature of 1348 Kand different strain rates: (a) 0.01 s-1, (b) 0.1 s-1, (c) 1 s-1, (d) 10 s-1.
Characterization for Dynamic Recrystallization Kinetics Based on Stress-Strain Curveshttp://dx.doi.org/10.5772/54285
81
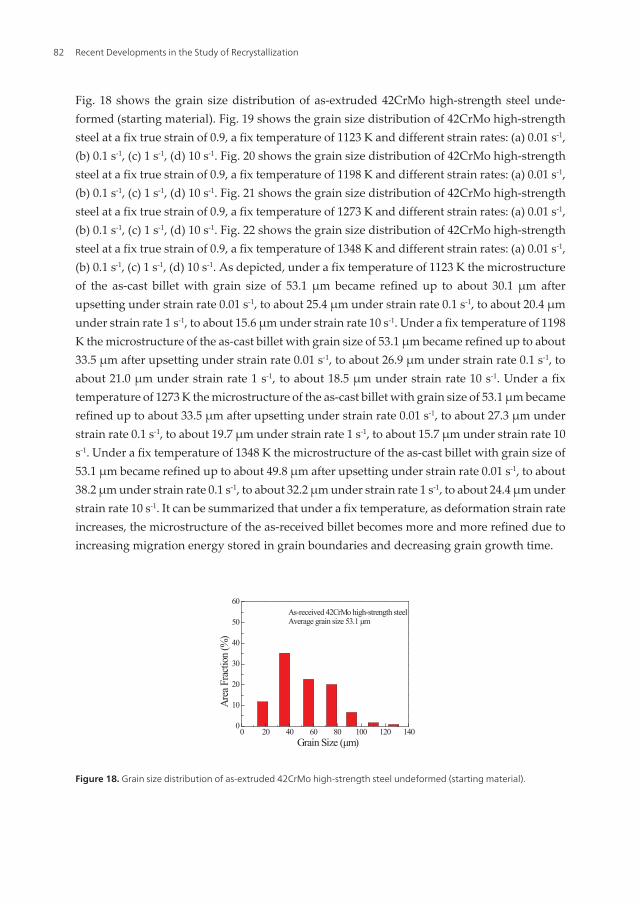
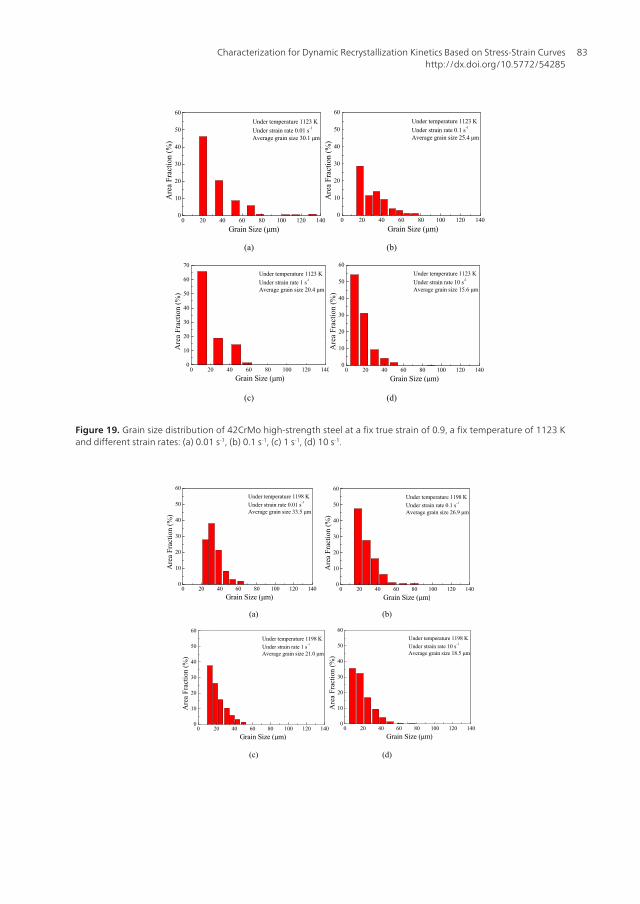
Fig. 18 shows the grain size distribution of as-extruded 42CrMo high-strength steel unde‐formed (starting material). Fig. 19 shows the grain size distribution of 42CrMo high-strengthsteel at a fix true strain of 0.9, a fix temperature of 1123 K and different strain rates: (a) 0.01 s-1,(b) 0.1 s-1, (c) 1 s-1, (d) 10 s-1. Fig. 20 shows the grain size distribution of 42CrMo high-strengthsteel at a fix true strain of 0.9, a fix temperature of 1198 K and different strain rates: (a) 0.01 s-1,(b) 0.1 s-1, (c) 1 s-1, (d) 10 s-1. Fig. 21 shows the grain size distribution of 42CrMo high-strengthsteel at a fix true strain of 0.9, a fix temperature of 1273 K and different strain rates: (a) 0.01 s-1,(b) 0.1 s-1, (c) 1 s-1, (d) 10 s-1. Fig. 22 shows the grain size distribution of 42CrMo high-strengthsteel at a fix true strain of 0.9, a fix temperature of 1348 K and different strain rates: (a) 0.01 s-1,(b) 0.1 s-1, (c) 1 s-1, (d) 10 s-1. As depicted, under a fix temperature of 1123 K the microstructureof the as-cast billet with grain size of 53.1 µm became refined up to about 30.1 µm afterupsetting under strain rate 0.01 s-1, to about 25.4 µm under strain rate 0.1 s-1, to about 20.4 µmunder strain rate 1 s-1, to about 15.6 µm under strain rate 10 s-1. Under a fix temperature of 1198K the microstructure of the as-cast billet with grain size of 53.1 µm became refined up to about33.5 µm after upsetting under strain rate 0.01 s-1, to about 26.9 µm under strain rate 0.1 s-1, toabout 21.0 µm under strain rate 1 s-1, to about 18.5 µm under strain rate 10 s-1. Under a fixtemperature of 1273 K the microstructure of the as-cast billet with grain size of 53.1 µm becamerefined up to about 33.5 µm after upsetting under strain rate 0.01 s-1, to about 27.3 µm understrain rate 0.1 s-1, to about 19.7 µm under strain rate 1 s-1, to about 15.7 µm under strain rate 10s-1. Under a fix temperature of 1348 K the microstructure of the as-cast billet with grain size of53.1 µm became refined up to about 49.8 µm after upsetting under strain rate 0.01 s-1, to about38.2 µm under strain rate 0.1 s-1, to about 32.2 µm under strain rate 1 s-1, to about 24.4 µm understrain rate 10 s-1. It can be summarized that under a fix temperature, as deformation strain rateincreases, the microstructure of the as-received billet becomes more and more refined due toincreasing migration energy stored in grain boundaries and decreasing grain growth time.
0 20 40 60 80 100 120 1400
10
20
30
40
50
60As-received 42CrMo high-strength steel Average grain size 53.1 μm
Area
Fra
ction
(%)
Grain Size (μm)
Figure 18. Grain size distribution of as-extruded 42CrMo high-strength steel undeformed (starting material).
Recent Developments in the Study of Recrystallization82
0 20 40 60 80 100 120 140
0
10
20
30
40
50
60
Under temperature 1123 K
Under strain rate 0.01 s-1
Average grain size 30.1 μm
Are
a F
ract
ion
(%)
Grain Size (μm)0 20 40 60 80 100 120 140
0
10
20
30
40
50
60
Under temperature 1123 K
Under strain rate 0.1 s-1
Average grain size 25.4 μm
Grain Size (μm)
Are
a F
ract
ion
(%)
(a) (b)
0 20 40 60 80 100 120 1400
10
20
30
40
50
60
70
Under temperature 1123 K
Under strain rate 1 s-1
Average grain size 20.4 μm
Are
a F
ract
ion
(%)
Grain Size (μm)0 20 40 60 80 100 120 140
0
10
20
30
40
50
60
Under temperature 1123 K
Under strain rate 10 s-1
Average grain size 15.6 μm
Grain Size (μm)
Are
a F
ract
ion
(%)
(c) (d)
Fig.19 Grain size distribution of 42CrMo high-strength steel at a fix true strain of 0.9, a fix
temperature of 1123 K and different strain rates: (a) 0.01 s-1, (b) 0.1 s-1, (c) 1 s-1, (d) 10 s-1.
Figure 19. Grain size distribution of 42CrMo high-strength steel at a fix true strain of 0.9, a fix temperature of 1123 Kand different strain rates: (a) 0.01 s-1, (b) 0.1 s-1, (c) 1 s-1, (d) 10 s-1.
0 20 40 60 80 100 120 1400
10
20
30
40
50
60
Under temperature 1198 K
Under strain rate 0.01 s-1
Average grain size 33.5 μm
Are
a Fr
acti
on (
%)
Grain Size (μm) 0 20 40 60 80 100 120 140
0
10
20
30
40
50
60
Under temperature 1198 K
Under strain rate 0.1 s-1
Average grain size 26.9 μm
Grain Size (μm)
Are
a F
ract
ion
(%)
(a) (b)
0 20 40 60 80 100 120 1400
10
20
30
40
50
60
Under temperature 1198 K
Under strain rate 1 s-1
Average grain size 21.0 μm
Are
a F
ract
ion
(%)
Grain Size (μm)0 20 40 60 80 100 120 140
0
10
20
30
40
50
60
Under temperature 1198 K
Under strain rate 10 s-1
Average grain size 18.5 μm
Grain Size (μm)
Are
a F
ract
ion
(%)
(c) (d)
Fig.20 Grain size distribution of 42CrMo high-strength steel at a fix true strain of 0.9, a fix
temperature of 1198 K and different strain rates: (a) 0.01 s-1, (b) 0.1 s-1, (c) 1 s-1, (d) 10 s-1.
Characterization for Dynamic Recrystallization Kinetics Based on Stress-Strain Curveshttp://dx.doi.org/10.5772/54285
83
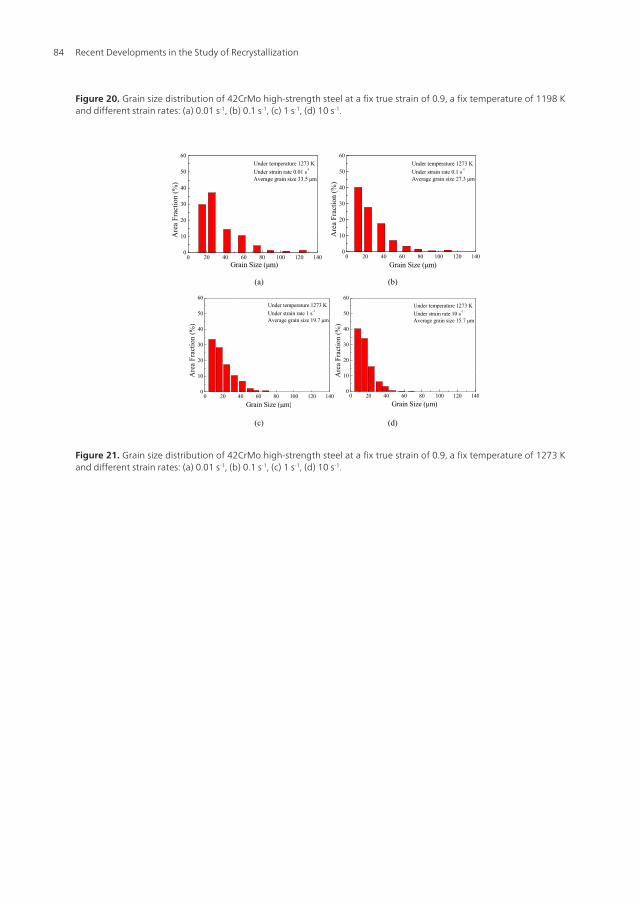
Figure 20. Grain size distribution of 42CrMo high-strength steel at a fix true strain of 0.9, a fix temperature of 1198 Kand different strain rates: (a) 0.01 s-1, (b) 0.1 s-1, (c) 1 s-1, (d) 10 s-1.
0 20 40 60 80 100 120 1400
10
20
30
40
50
60
Grain Size (μm)
Under temperature 1273 K
Under strain rate 0.01 s-1
Average grain size 33.5 μm
Are
a F
ract
ion
(%)
0 20 40 60 80 100 120 140
0
10
20
30
40
50
60
Under temperature 1273 K
Under strain rate 0.1 s-1
Average grain size 27.3 μm
Grain Size (μm)
Are
a F
ract
ion
(%)
(a) (b)
0 20 40 60 80 100 120 1400
10
20
30
40
50
60
Under temperature 1273 K
Under strain rate 1 s-1
Average grain size 19.7 μm
Grain Size (μm)
Are
a F
ract
ion
(%)
0 20 40 60 80 100 120 1400
10
20
30
40
50
60
Under temperature 1273 K
Under strain rate 10 s-1
Average grain size 15.7 μm
Grain Size (μm)
Are
a F
ract
ion
(%)
(c) (d)
Fig.21 Grain size distribution of 42CrMo high-strength steel at a fix true strain of 0.9, a fix
temperature of 1273 K and different strain rates: (a) 0.01 s-1, (b) 0.1 s-1, (c) 1 s-1, (d) 10 s-1.
Figure 21. Grain size distribution of 42CrMo high-strength steel at a fix true strain of 0.9, a fix temperature of 1273 Kand different strain rates: (a) 0.01 s-1, (b) 0.1 s-1, (c) 1 s-1, (d) 10 s-1.
Recent Developments in the Study of Recrystallization84

0 20 40 60 80 100 120 1400
10
20
30
40
50
60
Under temperature 1348 K
Under strain rate 0.01 s-1
Average grain size 49.8 μm
Are
a F
ract
ion
(%)
Grain Size (μm) 0 20 40 60 80 100 120 140
0
10
20
30
40
50
60
Under temperature 1348 K
Under strain rate 0.1 s-1
Average grain size 38.2 μm
Grain Size (μm)
Are
a F
ract
ion
(%)
(a) (b)
0 20 40 60 80 100 120 1400
10
20
30
40
50
60
Under temperature 1348 K
Under strain rate 1 s-1
Average grain size 32.2 μm
Are
a F
ract
ion
(%)
Grain Size (μm)0 20 40 60 80 100 120 140
0
10
20
30
40
50
60
Under temperature 1348 K
Under strain rate 10 s-1
Average grain size 24.4 μm
Grain Size (μm)
Are
a Fr
acti
on (
%)
(c) (d)
Fig.22 Grain size distribution of 42CrMo high-strength steel at a fix true strain of 0.9, a fix
temperature of 1348 K and different strain rates: (a) 0.01 s-1, (b) 0.1 s-1, (c) 1 s-1, (d) 10 s-1.
7. Conclusions
In the deformed material DRX is one of the most important softening mechanisms at high
temperatures. DRX occurs during straining of metals at high temperature, characterized by a
nucleation rate of low dislocation density grains and a posterior growth rate that can produce
a homogeneous grain size when equilibrium is reached. This is a characteristic of low and
medium stacking fault energy, SFE, materials e.g., γ-iron, the austenitic stainless steels, and
Figure 22. Grain size distribution of 42CrMo high-strength steel at a fix true strain of 0.9, a fix temperature of 1348 Kand different strain rates: (a) 0.01 s-1, (b) 0.1 s-1, (c) 1 s-1, (d) 10 s-1.
5. Conclusions
In the deformed material DRX is one of the most important softening mechanisms at hightemperatures. DRX occurs during straining of metals at high temperature, characterized by anucleation rate of low dislocation density grains and a posterior growth rate that can producea homogeneous grain size when equilibrium is reached. This is a characteristic of low andmedium stacking fault energy, SFE, materials e.g., γ-iron, the austenitic stainless steels, andcopper. Hot working behavior of alloys is generally reflected on flow curves which are a directconsequence of microstructural changes: the nucleation and growth of new grains, DRX, thegeneration of dislocations, work hardening, WH, the rearrangement of dislocations, their self-annihilation, and their absorption by grain boundaries, DRV. By the in-depth analysis of thecoupling effect in DRX behavior and flow behavior the prediction of DRX evolution can beperformed.
The characteristics of softening flow behavior coupling with DRX for as-extruded 42CrMohigh-strength steel, as-cast AZ80 magnesium alloy and as-extruded 7075 aluminum alloyhave been discussed and summarized as follows: (1) increasing strain rate or decreasingdeformation temperature makes the flow stress level increase, in other words, it preventsthe occurrence of softening due to DRX and dynamic recovery (DRV) and makes the deformedmetals exhibit work hardening (WH); (2) for every curve, after a rapid increase in the stressto a peak value, the flow stress decreases monotonically towards a steady state regime (a
Characterization for Dynamic Recrystallization Kinetics Based on Stress-Strain Curveshttp://dx.doi.org/10.5772/54285
85

steady state flow as a plateau due to DRX softening is more recognizable at higher temper‐atures and lower strain rates) with a varying softening rate which typically indicates theonset of DRX, and the stress evolution with strain exhibits three distinct stages; (3) at lowerstrain rates and higher temperatures, the higher DRX softening rate slows down the rate ofwork-hardening, and both the peak stress and the onset of steady state flow are thereforeshifted to lower strain levels.
Three characteristic points (the critical strain for DRX initiation ( A=2.44154×1025 ), the strainfor peak stress ( m =3.85582 ), and the strain for maximum softening rate ( εc )) which indicatewhether the evolution of DRX can be characterized by the process variables need to beidentified from the conventional strain hardening rate curves. A modified Avrami equation,εp , has been introduced into this work to describe the kinetics of DRX, and then an integratedcalculation process has been presented as an example of as-extruded 42CrMo high-strengthsteel. By the regression analysis for conventional hyperbolic sine equation, the dependence offlow stress on temperature and strain rate was described, and what's more, the activationenergy of DRX ( ε * ) and a dimensionless parameter controlling the stored energy( XDRX =1−exp{− (ε −εc) / ε * m} ) were determined. In further, the strain for maximumsoftening rate, Q , and the critical strain, Z / A were described by the functions of ε * . Thus,the evolution of DRX volume fraction was characterized by the modified Avrami type equationincluding the above parameters. Based on the calculation results of this model, the effect ofdeformation temperature, strain and strain rate on the recrystallized volume fraction is asfollows: as the strain increases, the DRX volume fraction increases and reaches a constant valueof 1 meaning the completion of DRX process; for a specific strain rate, the deformation strainrequired for the same amount of DRX volume fraction increases with decreasing deformationtemperature, which means that DRX is delayed to a longer time; for a fixed temperature, thedeformation strain required for the same amount of DRX volume fraction increases withincreasing strain rate, which also means that DRX is delayed to a longer time.
The microstructures on the section planes of specimens deformed under different strain ratesand temperatures were examined and analyzed under the optical microscope. The evolu‐tion of grain boundaries and grain size were presented as an example of as-extruded 42CrMohigh-strength steel. It can be summarized that under a fix temperature, as deformation strainrate increases, the microstructure of the as-received billet becomes more and more refineddue to increasing migration energy stored in grain boundaries and decreasing grain growthtime.
Acknowledgements
This work was supported by National Key Technologies R & D Program of China (ZDZX-DFJGJ-08), Science and Technology Committee of Chongqing (cstc2009aa3012-1), Fundamen‐tal Research Funds for the Central Universities (Project No. CDJZR11130009).
Recent Developments in the Study of Recrystallization86

Author details
Quan Guo-Zheng
Department of Material Processing & Control Engineering, School of Material Science andEngineering, Chongqing University, P.R., China
References
[1] Shokuhfar, A, Abbasi, S. M, & Ehsani, N. Dynamic recrystallization under hot defor‐mation of a PH stainless steel. International Journal of ISSI, (2006).
[2] Quan Guo-zhengTong Ying, Luo Gang, Zhou Jie. A characterization for the flow be‐havior of 42CrMo steel. Computational Materials Science, (2010).
[3] Kentaro IharaYasuhiro Miura. Dynamic recrystallization in Al-Mg-Sc alloys. Materi‐als Science and Engineering: A, (2004).
[4] Tsuji, N, Matsubara, Y, & Saito, Y. Dyanamic recrystallization of ferrite in interstitialfree steel. Scripta Materialia, (1997).
[5] Glover, G, & Sellars, C. M. Static recrystallization after hot deformation of α-iron.Metallurgical Transactions, (1972).
[6] Glover, G, & Sellars, C. M. Recovery and recrystallization during high temperaturedeformation of α-Iron. Scripta Materialia, (1973).
[7] Hongyan WuLinxiu Du, Xianghua Liu. Dynamic recrystallization and precipitationbehavior of Mn-Cu-V weathering steel. Journal of Materials Science & Technology,(2011).
[8] Gourdet, S, & Montheillet, F. A model of continuous dynamic recrystallization. ActaMaterialia, (2003).
[9] Smallman, R. E, & Ngan, A. H. W. Physical Metallurgy and Advanced Materials(seventh edition), (2007). Elsevier Ltd., Burlington.
[10] Bert VerlindenJulian Driver, Indradev Samajdar, Roger D. Doherty. Thermo-Mechan‐ical Processing of Metallic Materials, Pergamon Materials Series), (2007). ElsevierLtd., New York., 11
[11] Guo-Zheng QuanYuan-ping Mao, Gui-sheng Li, Wen-quan Lv, Yang Wang, JieZhou. A characterization for the dynamic recrystallization kinetics of as-extruded7075 aluminum alloy based on true stress-strain curves. Computational Materials Sci‐ence, (2012).
Characterization for Dynamic Recrystallization Kinetics Based on Stress-Strain Curveshttp://dx.doi.org/10.5772/54285
87

[12] Guo-Zheng QuanYu Shi, Yi-Xin Wang, Beom-Soo Kang, Tae-Wan Ku, Woo-Jin Song.Constitutive modeling for the dynamic recrystallization evolution of AZ80 magnesi‐um alloy based on stress-strain data. Materials Science and Engineering: A, (2011).
[13] Guo-Zheng QuanTae-Wan Ku, Woo-Jin Song, Beom-Soo Kang. The workability eval‐uation of wrought AZ80 magnesium alloy in hot compression. Materials & Design,(2011).
[14] Quan Guo-zhengTong Ying, Zhou Jie. Dynamic softening behaviour of AZ80 magne‐sium alloy during upsetting at different temperatures and strain rates. Proceedingsof the Institution of Mechanical Engineers. Part B-Journal of Engineering Manufac‐ture, (2010).
[15] Quan GuozhengLi Guisheng, Chen Tao, Wang Yixin, Zhang Yanwei, Zhou Jie. Dy‐namic recrystallization kinetics of 42CrMo steel during compression at different tem‐peratures and strain rates. Materials Science and Engineering: A, (2010).
[16] Guo-zheng QuanLei Zhao, Tao Chen, Yang Wang, Yuan-ping Mao, Wen-quan Lv, JieZhou. Identification for the optimal working parameters of as-extruded 42CrMohigh-strength steel from a large range of strain, strain rate and temperature. Materi‐als Science and Engineering: A, (2012).
[17] Quan Guo-zhengTong Ying, Luo Gang, Zhou Jie. A characterization for the flow be‐havior of 42CrMo steel. Computational Materials Science, (2010).
[18] Lin, Y. C, & Chen, X. M. A critical review of experimental results and constitutive de‐scriptions for metals and alloys in hot working. Materials & Design, (2011).
[19] Lin, Y. C, Chen, X. M, & Zhong, J. Study of static recrystallization kinetics in a lowalloy steel. Computational Materials Science, (2008).
[20] Kim, S. I, & Yoo, Y. C. Dynamic recrystallization behavior of AISI 304 stainless steel.Materials Science and Engineering: A, (2001).
Recent Developments in the Study of Recrystallization88