characterization of a concentric-core fiber€¦ · otdr (max.scatter) 5.55± ......
TRANSCRIPT

NBSIR 82-1661NBS
PUBLICATIONS
NAT'L INST. OF STAND & TECH
III
A 11 ID 5 AbM^lE
CHARACTERIZATION OF A CONCENTRIC-CORE FIBER
A11101 1104bA
B. L. Danielson
D. L. Franzen
R. L GallawaE. M. KimM. Young
National Bureau of StandardsU.S. Department of CommerceBoulder, Colorado 80303
April 1982
h-oC^—100
. U66
02-1661
1002
I c. 2 .


NBSIR 82-1661
NATIONAL BUR8AUOF STANDARDS
library
MAY 2 5 1S82
- C,
Clc (Oo
CHARACTERIZATION OF A CONCENTRIC-/CORE FIBER
B. L. Danielson
D. L. Franzen
R. L. Gallawa
E. M. KimM. Young
Electromagnetic Technology Division
National Engineering Laboratory
National Bureau of Standards
U.S. Department of CommerceBoulder, Colorado 80303
April 1982
Sponsored by
Communications Systems Center
U.S. Army Communications R&D CommandFort Monmouth, New Jersey 07703
U.S. DEPARTMENT OF COMMERCE, Malcolm Baldrige, Secretary
NATIONAL BUREAU OF STANDARDS, Ernest Ambler, Director

. .j= UMQlt*.*-HXMiVSfiTi,
m 5 $ v -'
CONTENTSPage
1. Introduction 1
2. Attenuation 2
3. Radiation Patterns 6
4. Pulse Broadening 14
5.
' Index Profile 16
6. Optical Time Domain Ref lectometer Signatures 17
7. Capture Fraction 22
8. References 23

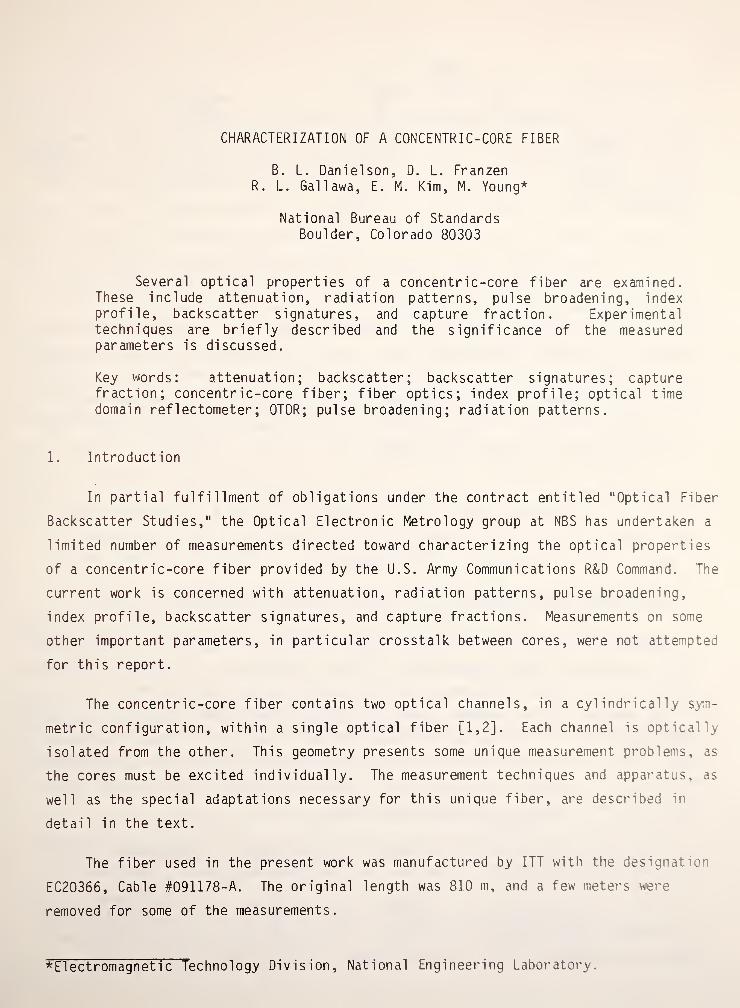
CHARACTERIZATION OF A CONCENTRIC-CORE FIBER
B. L. Danielson, D. L. FranzenR. L. Gallawa, E. M. Kim, M. Young*
National Bureau of StandardsBoulder, Colorado 80303
Several optical properties of a concentric-core fiber are examined.These include attenuation, radiation patterns, pulse broadening, indexprofile, backscatter signatures, and capture fraction. Experimentaltechniques are briefly described and the significance of the measuredparameters is discussed.
Key words: attenuation; backscatter; backscatter signatures; capturefraction; concentric-core fiber; fiber optics; index profile; optical timedomain ref lectometer
; OTDR; pulse broadening; radiation patterns.
1. Introduction
In partial fulfillment of obligations under the contract entitled "Optical Fiber
Backscatter Studies," the Optical Electronic Metrology group at NBS has undertaken a
limited number of measurements directed toward characterizing the optical properties
of a concentric-core fiber provided by the U.S. Army Communications R&D Command. The
current work is concerned with attenuation, radiation patterns, pulse broadening,
index profile, backscatter signatures, and capture fractions. Measurements on some
other important parameters, in particular crosstalk between cores, were not attempted
for this report.
The concentric-core fiber contains two optical channels, in a cylindrically sym-
metric configuration, within a single optical fiber [1,2]. Each channel is optically
isolated from the other. This geometry presents some unique measurement problems, as
the cores must be excited individually. The measurement techniques and apparatus, as
well as the special adaptations necessary for this unique fiber, are described in
detail in the text.
The fiber used in the present work was manufactured by ITT with the designation
EC20366, Cable #091178-A. The original length was 810 m, and a few meters were
removed for some of the measurements.
*Electromagnetic Technology Division, National Engineering Laboratory.
2 . Attenuation
In any electromagnetic waveguide, the attenuation of a mode is a function of mode
number. Thus, the characteri zation of a multimode telecommunication fiber is compli-
cated, because modal excitation efficiency is a function of launch conditions. Dif-
ferent laboratories, using different launch conditions, will therefore report differ-
ent values of measured attenuation for the same fiber, unless steps are taken to avoid
the vagaries inherent to a multimode fiber [3]. There are currently two ways of re-
stricting launched optical power to avoid exciting certain high-loss modes (which are
the source of capricious results): the beam optics, or limited phase space technique
[4,5], and the mode filter approach [6,7,8]. In the beam optics technique, which is
the one used here, the launch spot size and the launch numerical aperture are smaller
than the fiber core and the fiber numerical aperture, respectively. The Electronics
Industry Association (EIA) recommends a spot diameter that is 70 ± 5 percent of the
fiber core diameter and a launch numerical aperture that is 70 ± 5 percent of the
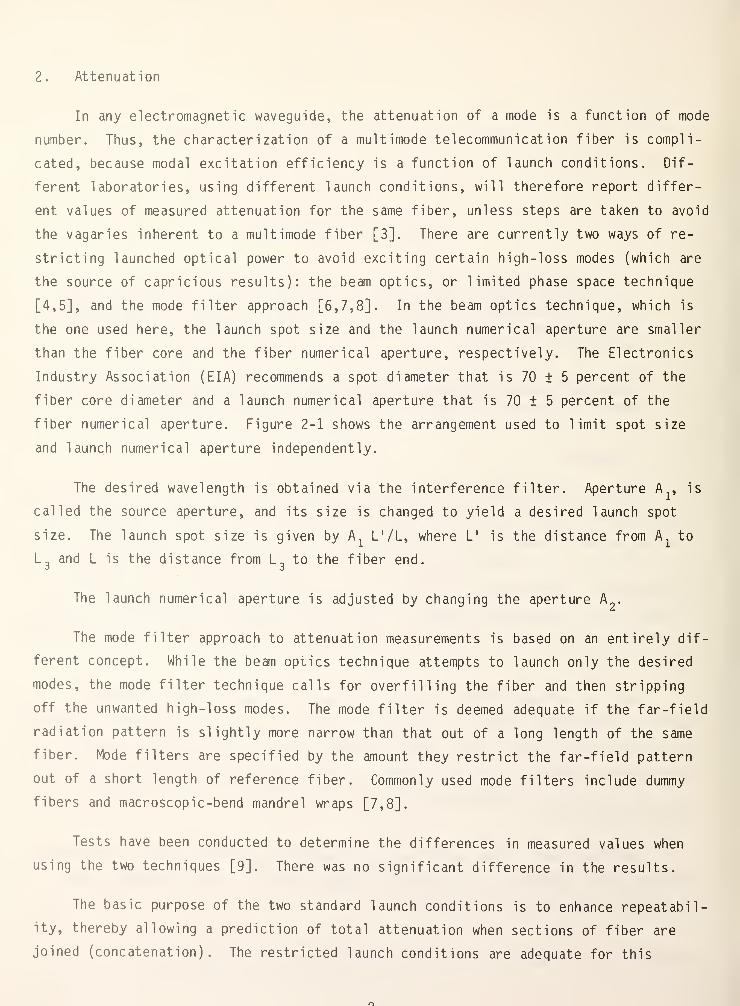
fiber numerical aperture. Figure 2-1 shows the arrangement used to limit spot size
and launch numerical aperture independently.
The desired wavelength is obtained via the interference filter. Aperture Ax, is
called the source aperture, and its size is changed to yield a desired launch spot
size. The launch spot size is given by L'/L, where L1
is the distance from A to
L3
and L is the distance from L3to the fiber end.
The launch numerical aperture is adjusted by changing the aperture A£
.
The mode filter approach to attenuation measurements is based on an entirely dif-
ferent concept. While the beam optics technique attempts to launch only the desired
modes, the mode filter technique calls for overfilling the fiber and then stripping
off the unwanted high-loss modes. The mode filter is deemed adequate if the far-field
radiation pattern is slightly more narrow than that out of a long length of the same
fiber. Mode filters are specified by the amount they restrict the far-field pattern
out of a short length of reference fiber. Commonly used mode filters include dummy
fibers and macroscopic-bend mandrel wraps [7,8].
Tests have been conducted to determine the differences in measured values when
using the two techniques [9]. There was no significant difference in the results.
The basic purpose of the two standard launch conditions is to enhance repeatabil-
ity, thereby allowing a prediction of total attenuation when sections of fiber are
joined (concatenation). The restricted launch conditions are adequate for this
POWERMONITOR
TUNGSTENSTRIP LAMP
INTERFERENCEFLTER
APERTURE'l
LIGHTCHOPPER
VIOICON
Figure 2-1. Experimental layout for attenuation measurements.
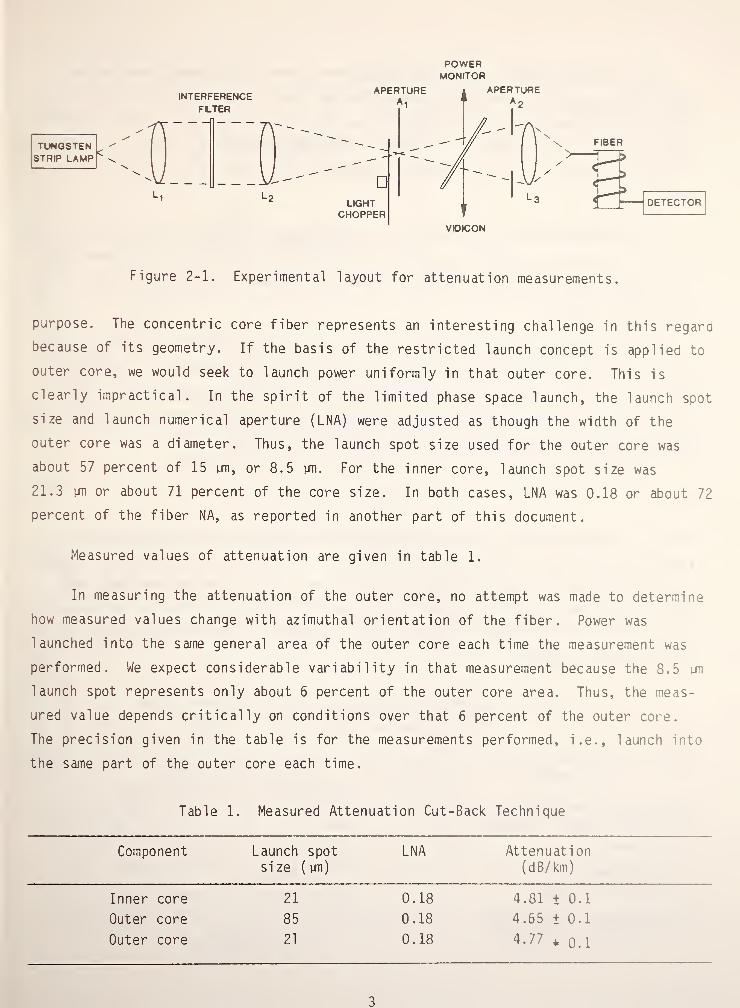
purpose. The concentric core fiber represents an interesting challenge in this regard
because of its geometry. If the basis of the restricted launch concept is applied to
outer core, we would seek to launch power uniformly in that outer core. This is
clearly impractical. In the spirit of the limited phase space launch, the launch spot
size and launch numerical aperture (LNA) were adjusted as though the width of the
outer core was a diameter. Thus, the launch spot size used for the outer core was
about 57 percent of 15 un, or 8.5 urn. For the inner core, launch spot size was
21.3 nn or about 71 percent of the core size. In both cases, LNA was 0.18 or about 72
percent of the fiber NA, as reported in another part of this document.
Measured values of attenuation are given in table 1.
In measuring the attenuation of the outer core, no attempt was made to determine
how measured values change with azimuthal orientation of the fiber. Power was
launched into the same general area of the outer core each time the measurement was
performed. We expect considerable variability in that measurement because the 8.5 un
launch spot represents only about 6 percent of the outer core area. Thus, the meas-
ured value depends critically on conditions over that 6 percent of the outer core.
The precision given in the table is for the measurements performed, i.e., launch into
the same part of the outer core each time.
Table 1. Measured Attenuation Cut-Back Technique
Component Launch spot
size (un)
LNA Attenuation(dB/km)
Inner core 21 0.18 4.81 + 0.1
Outer core 85 0.18 4.65 + 0.1
Outer core 21 0.18 4-77 * o.l
3
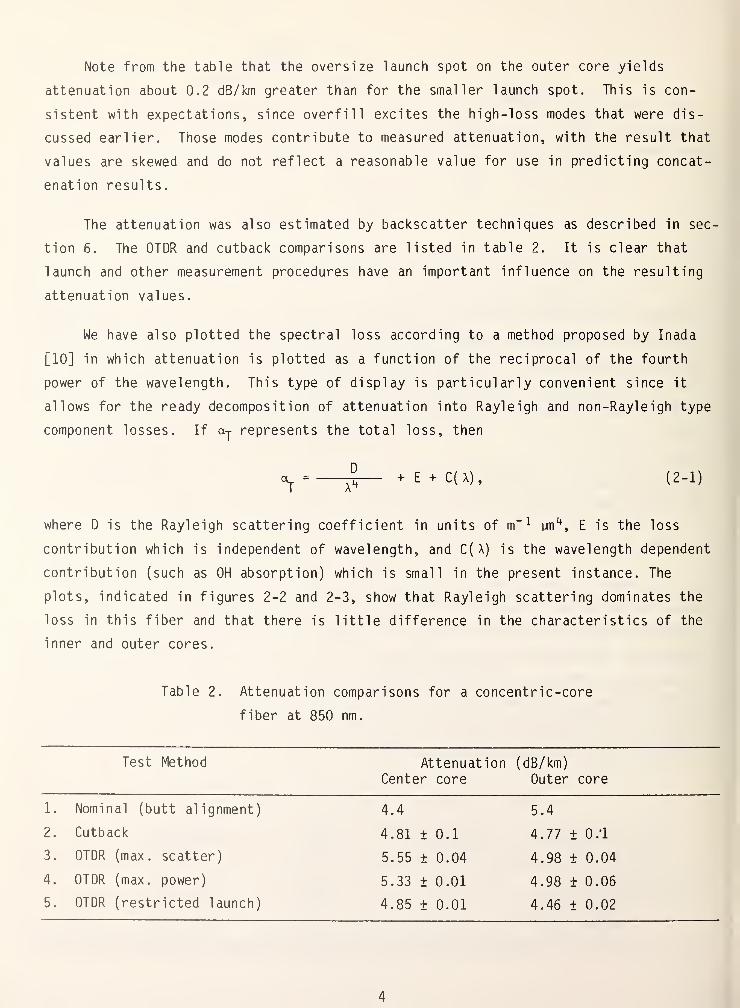
Note from the table that the oversize launch spot on the outer core yields
attenuation about 0.2 dB/km greater than for the smaller launch spot. This is con-
sistent with expectations, since overfill excites the high-loss modes that were dis-
cussed earlier. Those modes contribute to measured attenuation, with the result that
values are skewed and do not reflect a reasonable value for use in predicting concat-
enation results.
The attenuation was also estimated by backscatter techniques as described in sec-
tion 6. The OTDR and cutback comparisons are listed in table 2. It is clear that
launch and other measurement procedures have an important influence on the resulting
attenuation values.
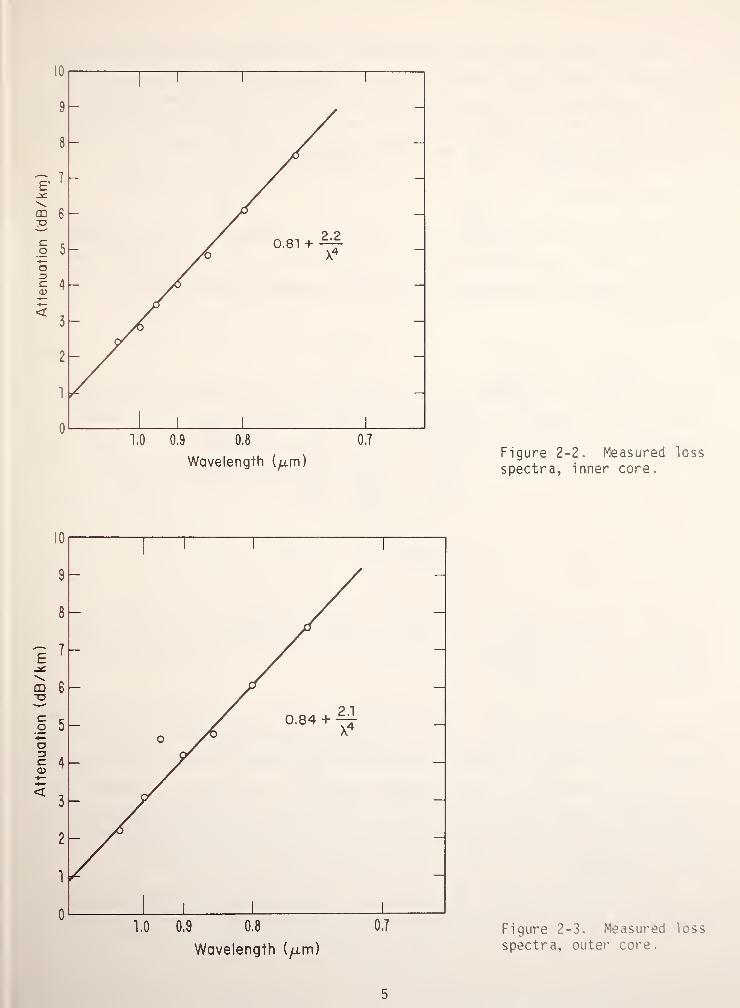
We have also plotted the spectral loss according to a method proposed by Inada
[10] in which attenuation is plotted as a function of the reciprocal of the fourth
power of the wavelength. This type of display is particularly convenient since it
allows for the ready decomposition of attenuation into Rayleigh and non-Rayleigh type
component losses. If ay represents the total loss, then
^ = £ + E + C( X) , (2-1)
where D is the Rayleigh scattering coefficient in units of m“ 1 un4
, E is the loss
contribution which is independent of wavelength, and C(A) is the wavelength dependent
contribution (such as OH absorption) which is small in the present instance. The
plots, indicated in figures 2-2 and 2-3, show that Rayleigh scattering dominates the
loss in this fiber and that there is little difference in the characteristics of the
inner and outer cores.
Table 2. Attenuation comparisons for a concentric-core
fiber at 850 nm.
Test Method Attenuation (dB/km)
Center core Outer core
1 . Nominal (butt alignment) 4.4 5.4
2. Cutback 4.81 ± 0.1 4.77 ± 0.1
3. OTDR (max. scatter) 5.55 ± 0.04 4.98 ± 0.04
4. OTDR (max. power) 5.33 ± 0.01 4.98 + 0.06
5. OTDR (restricted launch) 4.85 t 0.01 4.46 + 0.02
4
Attenuation
(dB/km)
Attenuation
(dB/km)
10
Wavelength (/xm)Figure 2-2. Measured loss
spectra, inner core.
Figure 2-3. Measured loss
spectra, outer core.
5
In the foregoing attenuation measurements we have not considered the possibility
of crosstalk, which is the transfer of optical energy from one of the cores to the
other. The manufacturer has specified crosstalk values in the present fiber at -22 dB
i nner-to-outer cores, and -26 dB outer-to-inner cores. At these levels we can safely
ignore crosstalk effects in the measurements described in this report.
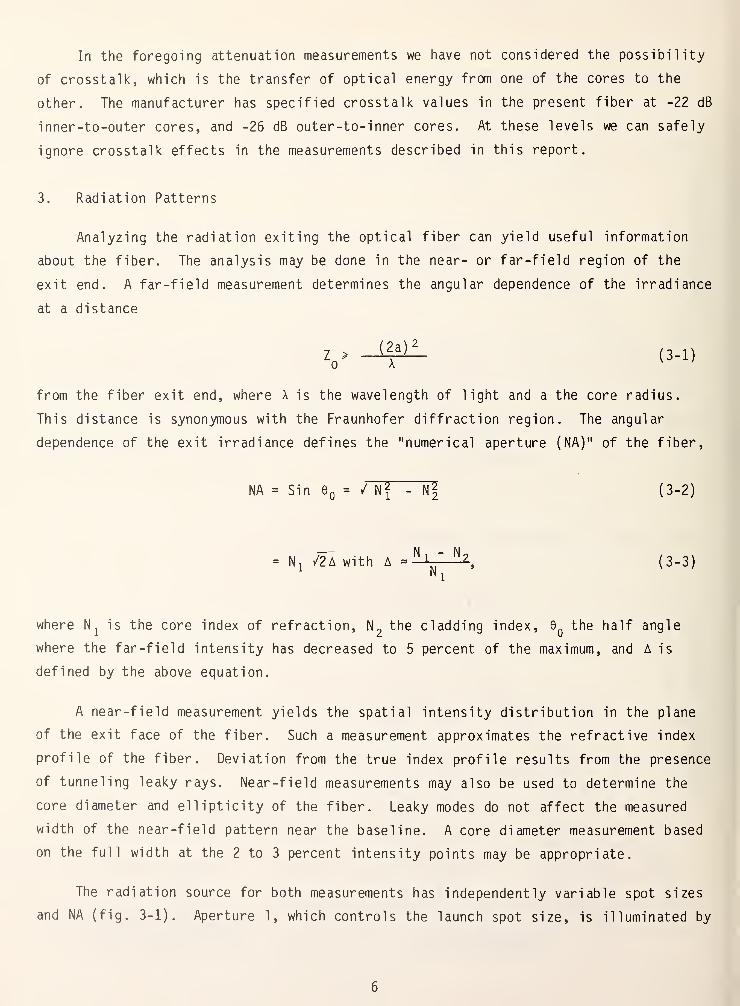
3. Radiation Patterns
Analyzing the radiation exiting the optical fiber can yield useful information
about the fiber. The analysis may be done in the near- or far -field region of the
exit end. A far -field measurement determines the angular dependence of the irradiance
at a distance
from the fiber exit end, where A is the wavelength of light and a the core radius.
This distance is synonymous with the Fraunhofer diffraction region. The angular
dependence of the exit irradiance defines the "numerical aperture (NA)" of the fiber,
na = sin e0
= - n| (3-2)
= N1/2a with A h. (3-3)
Nl
where Nx
is the core index of refraction, N2the cladding index, 0
Othe half angle
where the far -field intensity has decreased to 5 percent of the maximum, and A is
defined by the above equation.
A near -field measurement yields the spatial intensity distribution in the plane
of the exit face of the fiber. Such a measurement approximates the refractive index
profile of the fiber. Deviation from the true index profile results from the presence
of tunneling leaky rays. Near-field measurements may also be used to determine the
core diameter and el 1 ipticity of the fiber. Leaky modes do not affect the measured
width of the near-field pattern near the baseline. A core diameter measurement based
on the full width at the 2 to 3 percent intensity points may be appropriate.
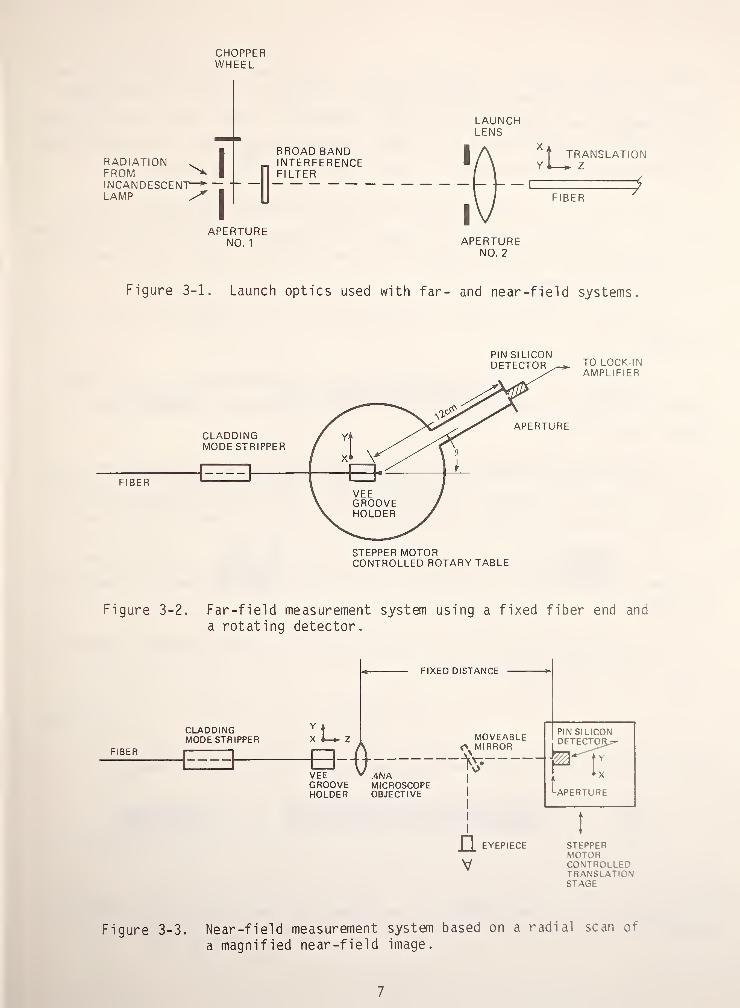
The radiation source for both measurements has independently variable spot sizes
and NA (fig. 3-1). Aperture 1, which controls the launch spot size, is illuminated by
6
CHOPPERWHEEL
RADIATIONFROMINCANDESCENLAMP
APERTURENO. 1 APERTURE
NO. 2
U'TRANSLATIONY 1— Z
FIBER1
Figure 3-1. Launch optics used with far- and near -field systems
.
PIN SILICONTO LOCK-INAMPLIFIER
Figure 3-2. Far-field measurement system using a fixed fiber end and
a rotating detector.
STAGE
Figure 3-3. Near-field measurement system based on a radial scan of
a magnified near -field image.
7
a quartz halogen lamp with an etched envelope. A broadband filter of 857 ± 43.5 nm
was used. The launch lens produces a demagnified image of aperture 1 on the fiber
end; a demagnification ratio of 22 was used. Aperture 2 controls the launch NA from a
maximum of 0.36 to a minimum of 0.03. When a single core of the concentric-core fiber
was illuminated the spot size of the source on the fiber was 18 vm.
The far -field was scanned using the fixed-fiber end-rotating detector method
(fig. 3-2). The fiber first passes through a cladding mode stripper consisting of two
10-cm-long pieces of felt pads wetted with index matching fluids. This strips the
light out of the cladding.
A vee-groove holds the fiber in place while the Si PIN detector is rotated in the
far field.
Accuracy of the far-field measurement system in determining the radiation-angle
measurement system is estimated to be better than 1.6 percent. The system has a
dynamic range of 22 dB.
The near-field system is shown in figure 3-3. A single microscope objective pro-
duces a 50X magnified image of the fiber end face. (The near-field intensity distri-
bution is obtained by scanning a Si PIN photodiode across a diameter of the image.)
The near-field system precision of 1.5 percent would apply to a core diameter
measurement based on the near -field full width close to the baseline on a short length
of fiber.
The resolution is approximately 2 un, consistent with the calculated resolution
Y, of a microscope objective with
where the NA is the collected numerical aperture (an NA of 0.2 is assumed).
The dynamic range of the near-field system is approximately 22 dB.
Measurements made with the near-and far-field systems are given in figures 3-4 to
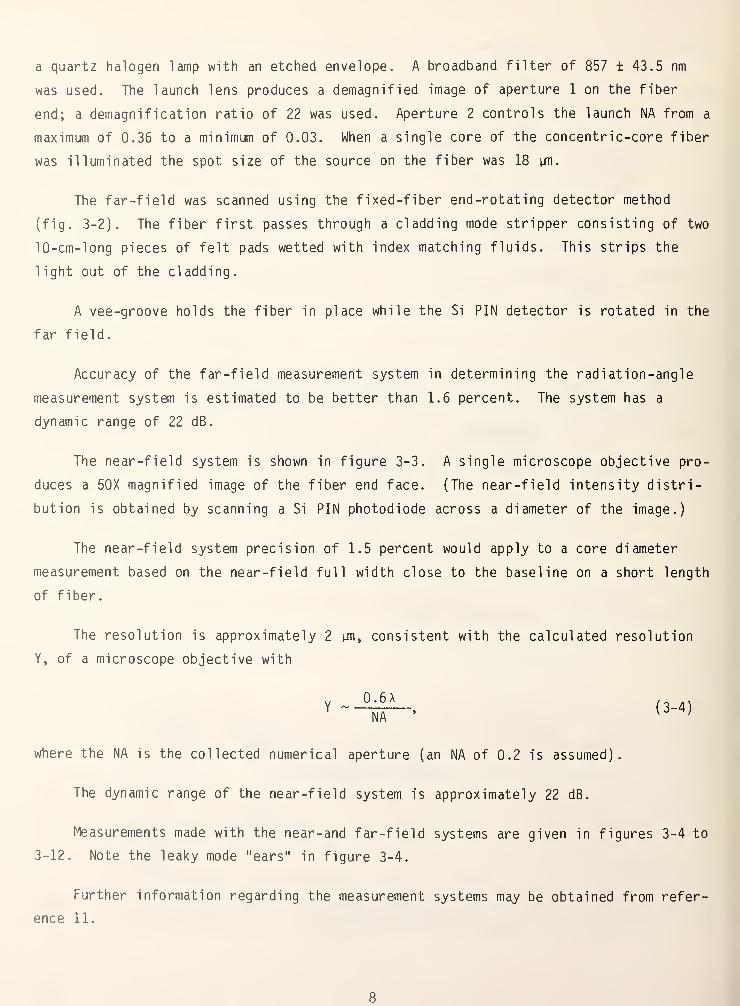
3-12. Note the leaky mode "ears" in figure 3-4.
Further information regarding the measurement systems may be obtained from refer-
ence 11.
8
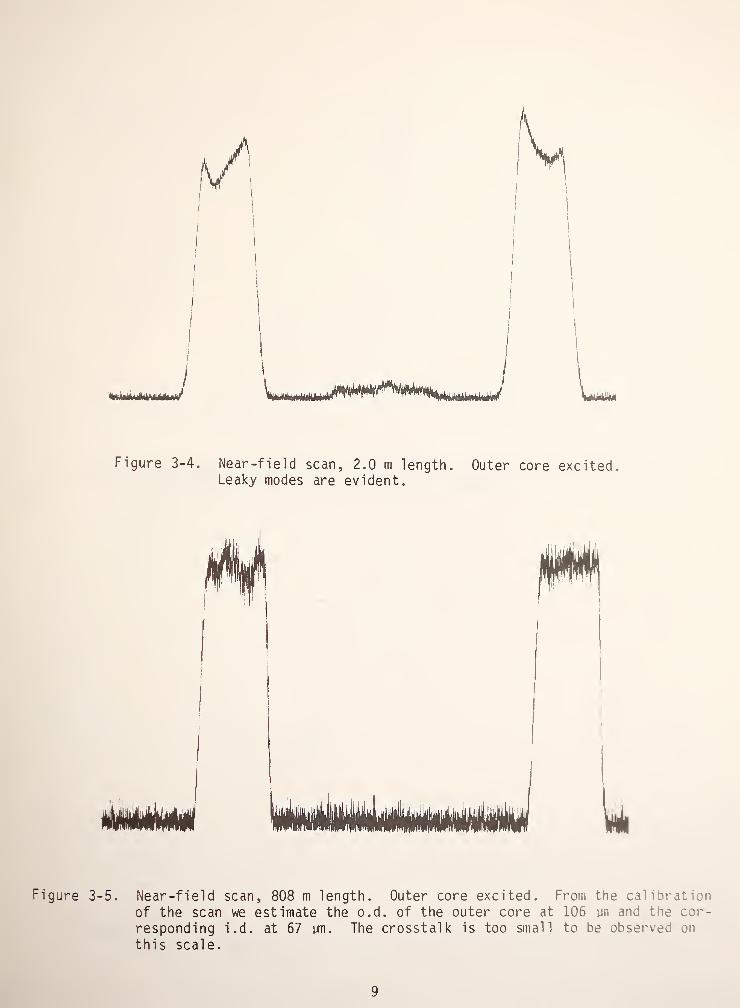
Figure 3-4. Near-field scan, 2.0 m length. Outer core excited.Leaky modes are evident.
Figure 3-5. Near-field scan, 808 m length. Outer core excited. From the calibrationof the scan we estimate the o.d. of the outer core at 106 un and the cor-
responding i.d. at 67 vm. The crosstalk is too small to be observed on
this scale.
9
/
1
/
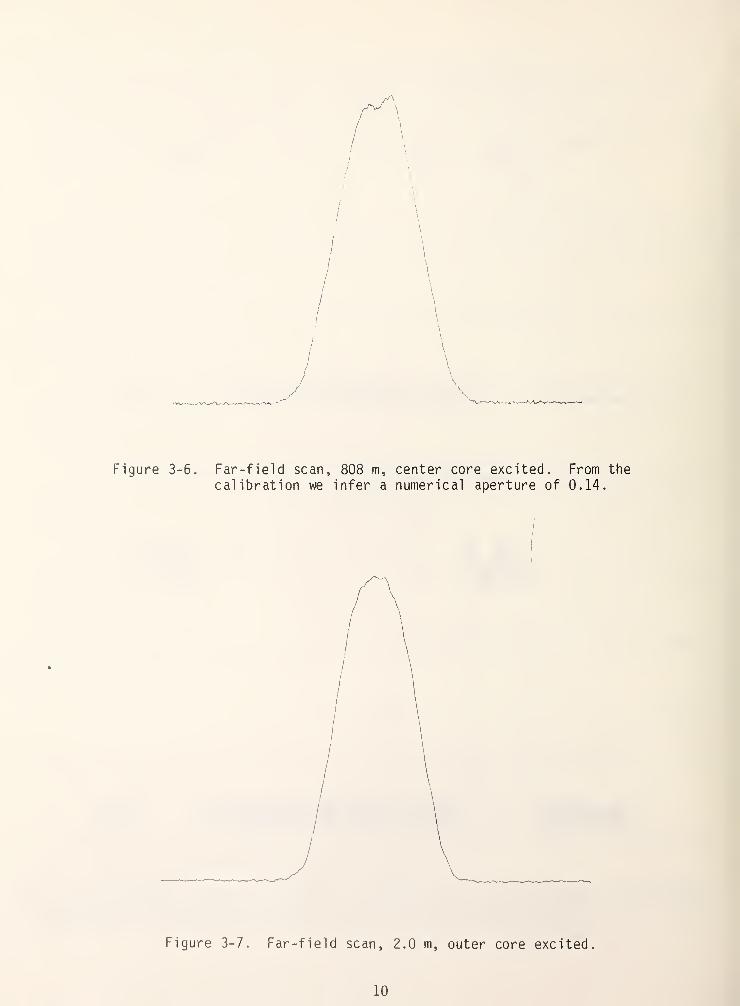
Figure 3-6. Far-field scan, 808 m, center core excited. From the
calibration we infer a numerical aperture of 0.14.
Figure 3-7. Far-field scan, 2.0 m, outer core excited.
10
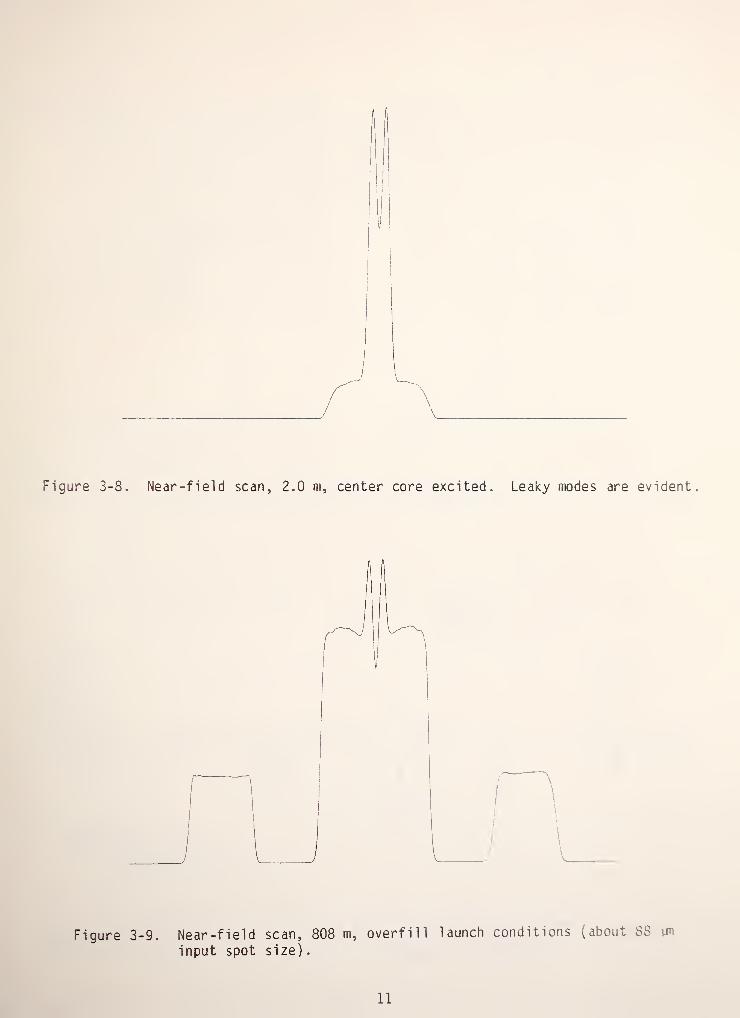
Figure 3-8. Near-field scan, 2.0 m, center core excited. Leaky modes are evident.
Figure 3-9. Near -field scan, 808 m, overfill launch conditions (about SS
input spot size).
11
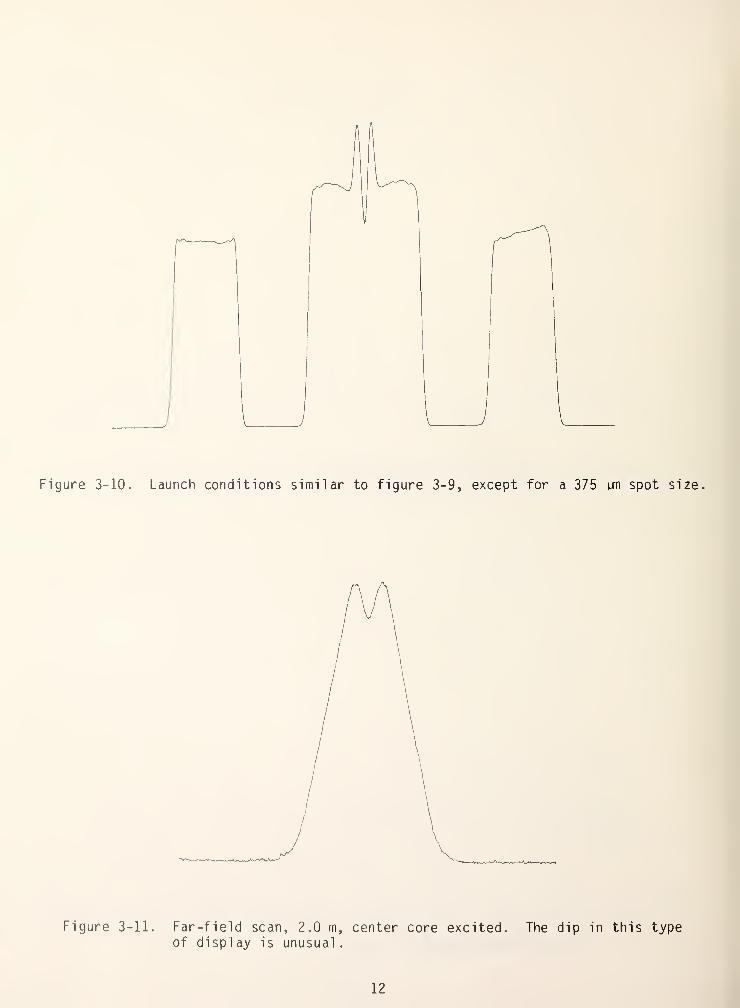
Figure 3-10. Launch conditions similar to figure 3-9, except for a 375 un spot size.
Figure 3-11. Far -field scan, 2.0 m, center core excited. The dip in this typeof display is unusual
.
12

Figure 3-12. Far-field scan, 808 m, both cores excited. From the scan calibrationwe measure a numerical aperture of 0.25.
APERTUREWHEEL
TEST
FIBER HOLDER& CLADDING MODESTRIPPER
Figure 4-1. Apparatus for pulse broadening measurements.
13
4. Pulse Broadening
Pulse broadening, or bandwidth, is the important quantity used in determining the
information carrying capacity of fibers. For a step-index fiber, the time delay
between an axial ray and a ray at the critical angle is
r ^( Nl -N2 ), (4-1)
where L is the fiber length, C the velocity of light, Nx
and N2
the refractive indices
of the core and cladding respectively. This equation can also be expressed in terms
of the fiber NA as
L (NA) 2
2N:C
* (4-2)
Thus, for an NA of 0.14 the pulse broadening would be approximately 22 ns/km.
Pulse broadening measurements were made on the concentric-core fiber using the
apparatus of figure 4-1. A translation stage allows one of three laser diodes to be
aligned in the system. These diodes are single, heterojunction, GaAlAs laser diodes
operated at 1 kHz in the short pulse mode. Pulse width is typically 300 ps full width
half maximum (FWHM) and peak power launched into a fiber is in the 100-300 mW range.
Figure 4-2(a) is a typical pulse shape representing the input to the fiber under
test. Light from the laser diode is launched into a mode scrambler fiber consisting
of a step index fiber with macroscopic serpentine bends. The mode scrambler converts
the spatial radiation pattern from the diode into a unform spot which can be
relaunched into the fiber under test. For the concentric core measurements, the
launched spot was approximately 25 pn and could preferentially excite either inner or
outer core. For more details on the bandwidth measurement system, the reader is
referred to NBS Technical Note 1019 [12].
Output pulse shapes from the 810 m length concentric core fiber at a wavelength
of 825 um are shown in figures 4-2(b) and 4-2(c) (inner core) and figure 4-2 ( d )(outer
core). The output pulse from the inner core has an approximate FWHM of 25 ns with a
considerable amount of fine structure. This fine structure is a sequence of spikes
(figure 4-2(c) is on expanded time base) with approximately 25-30 partially resolved
pulses. We have measured a similar response from a step index fiber on only one
other occasion. One possible explanation is based on the index profile, figure 5-1.
The near-field scans indicate that the refractive index fluctuates near the on-axis
dip. It is possible that this effect could produce another waveguide within the nomi-
nal core, and then figures 4-2 ( b )and 4-2(c) would indicate the differential delay of
14
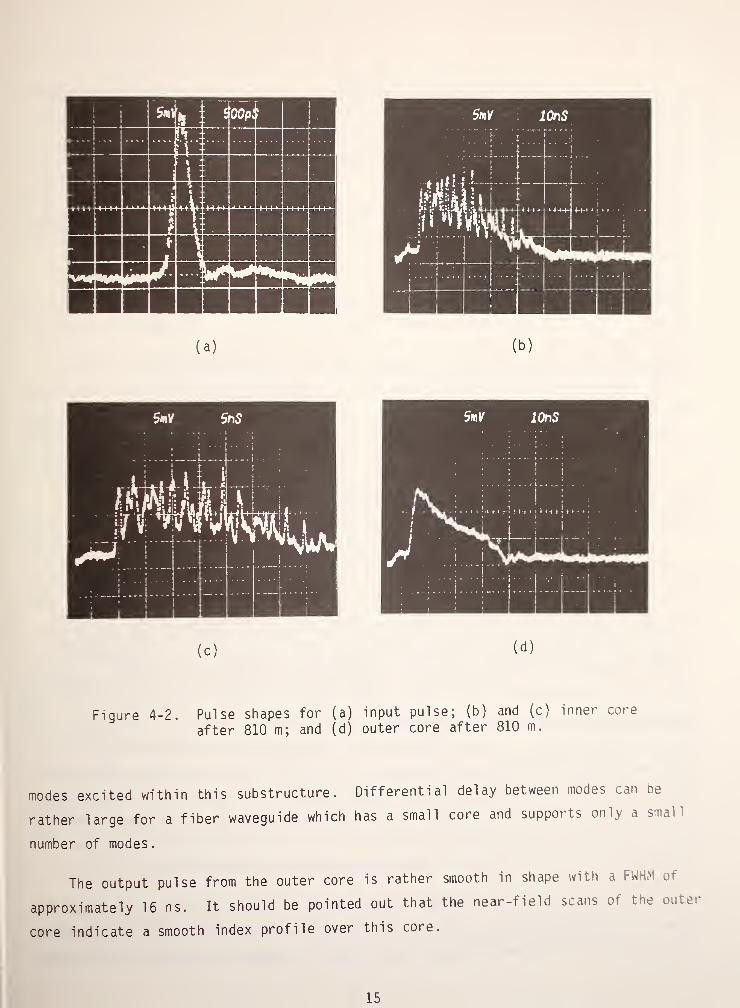
(c) (d)
Figure 4-2. Pulse shapes for (a) input pulse; (b) and (c) inner core
after 810 m; and (d) outer core after 810 m.
modes excited within this substructure . Differential delay between modes can be
rather large for a fiber waveguide which has a small core and supports only a s al
number of modes.
The output pulse from the outer core is rather smooth in shape with a FWHM of
approximately 16 ns. It should be pointed out that the near-field scans of the outer
core indicate a smooth index profile over this core.
15
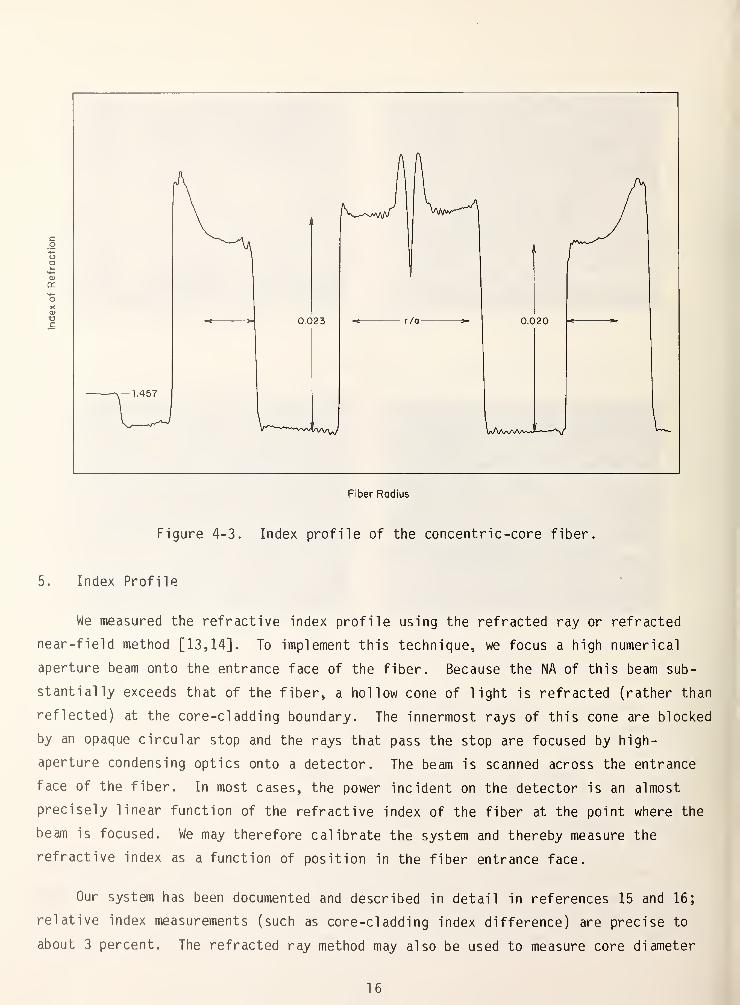
Figure 4-3. Index profile of the concentric-core fiber.
5. Index Profile
We measured the refractive index profile using the refracted ray or refracted
near-field method [13,14]. To implement this technique, we focus a high numerical
aperture beam onto the entrance face of the fiber. Because the NA of this beam sub-
stantially exceeds that of the fiber, a hollow cone of light is refracted (rather than
reflected) at the core-cladding boundary. The innermost rays of this cone are blocked
by an opaque circular stop and the rays that pass the stop are focused by high-
aperture condensing optics onto a detector. The beam is scanned across the entrance
face of the fiber. In most cases, the power incident on the detector is an almost
precisely linear function of the refractive index of the fiber at the point where the
beam is focused. We may therefore calibrate the system and thereby measure the
refractive index as a function of position in the fiber entrance face.
Our system has been documented and described in detail in references 15 and 16;
relative index measurements (such as core-cladding index difference) are precise to
about 3 percent. The refracted ray method may also be used to measure core diameter
16
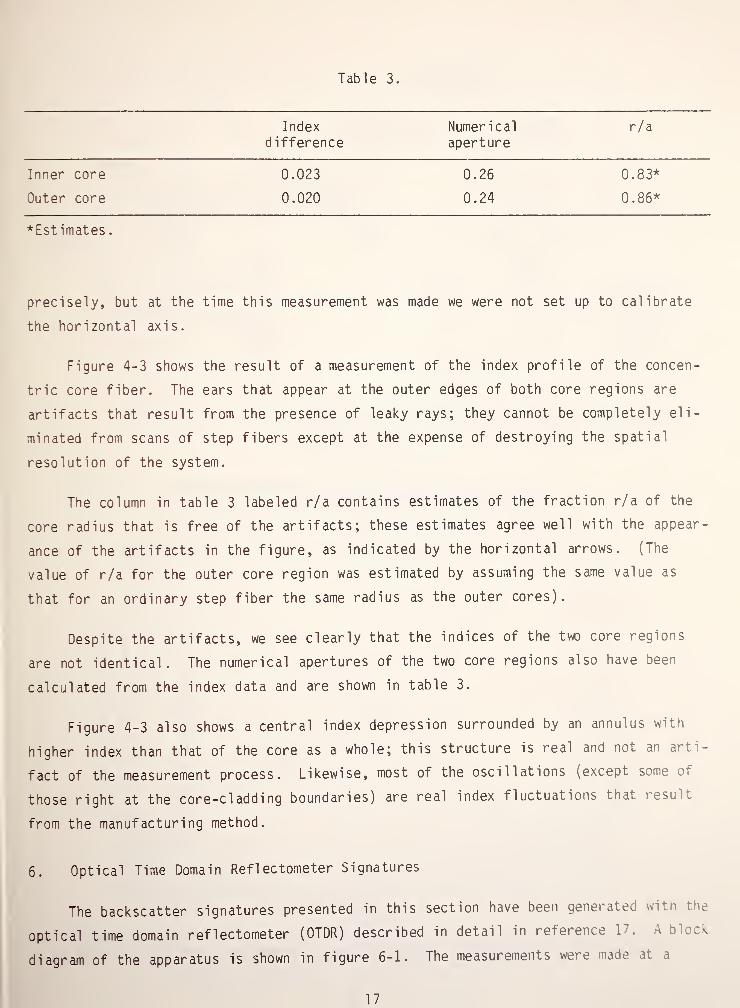
Table 3.
Index Numerical r/adifference aperture
Inner core 0.023 0.26 0.83*
Outer core 0.020 0.24 0.86*
Estimates
.
precisely, but at the time this measurement was made we were not set up to calibrate
the horizontal axis.
Figure 4-3 shows the result of a measurement of the index profile of the concen-
tric core fiber. The ears that appear at the outer edges of both core regions are
artifacts that result from the presence of leaky rays; they cannot be completely eli-
minated from scans of step fibers except at the expense of destroying the spatial
resolution of the system.
The column in table 3 labeled r/a contains estimates of the fraction r/a of the
core radius that is free of the artifacts; these estimates agree well with the appear-
ance of the artifacts in the figure, as indicated by the horizontal arrows. (The
value of r/a for the outer core region was estimated by assuming the same value as
that for an ordinary step fiber the same radius as the outer cores).
Despite the artifacts, we see clearly that the indices of the two core regions
are not identical. The numerical apertures of the two core regions also have been
calculated from the index data and are shown in table 3.
Figure 4-3 also shows a central index depression surrounded by an annulus with
higher index than that of the core as a whole; this structure is real and not an arti-
fact of the measurement process. Likewise, most of the oscillations (except some or
those right at the core-cladding boundaries) are real index fluctuations that result
from the manufacturing method.
6. Optical Time Domain Refl ectometer Signatures
The backscatter signatures presented in this section have been generated w'tn toe
optical time domain reflectometer (OTDR) described in detail in reference 1 . 4 bloc\
diagram of the apparatus is shown in figure 6-1. The measurements were made at a
17

Figure 6-1. Block diagram of the OTDR system.
Figure 6-2. Center core concentric-core fiber, linear display. Launch
conditions adjusted for maximum power transmission.
18
LOG
BACKSCATTER
POWER
CdB?
LOG
BACKSCATTER
POWER
CdB>
6-3. Center core concentric-core fiber, logarithmic display. Launchconditions adjusted for maximum backscatter signal
.
Figure 6-4. Center core concentric-core fiber, logarithmic display. Launch
conditions adjusted for maximum power transmission.
19
LOG
BACKSCATTER
POWER
CdB}
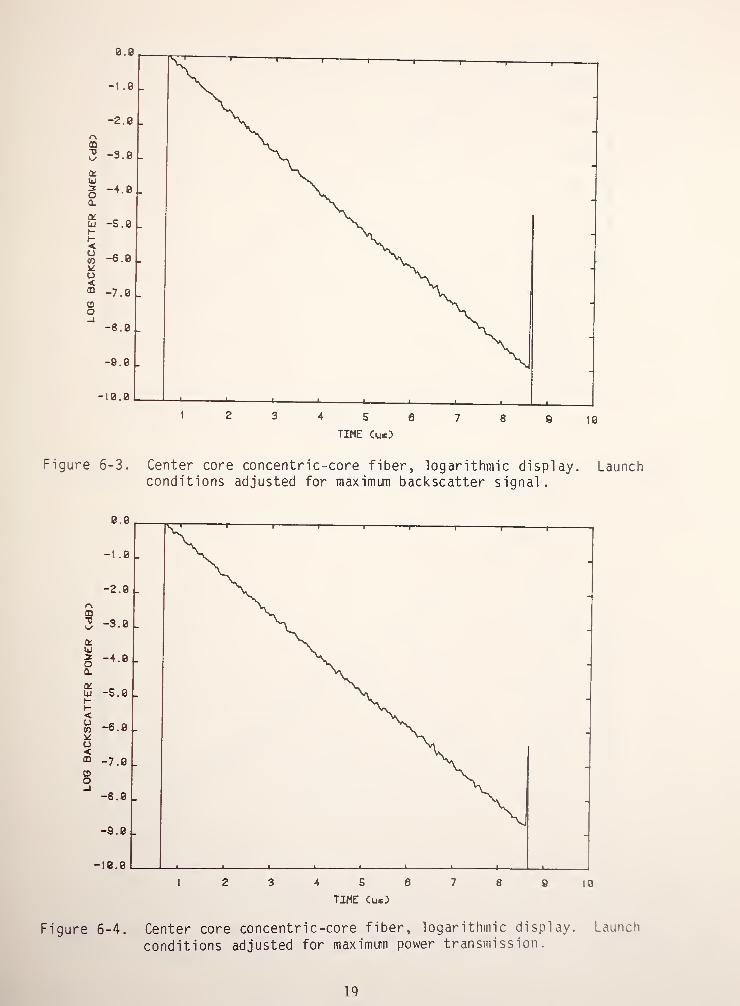
Figure 6-5. Center core concentric-core fiber, logarithmic display. Restrictedlaunch conditions.
Figure 6-6. Outer core concentric-core fiber, logarithmic display. Launch
conditions adjusted for maximum backscatter signal.
20
LOG
BACKSCATTER
POWER
CdB?
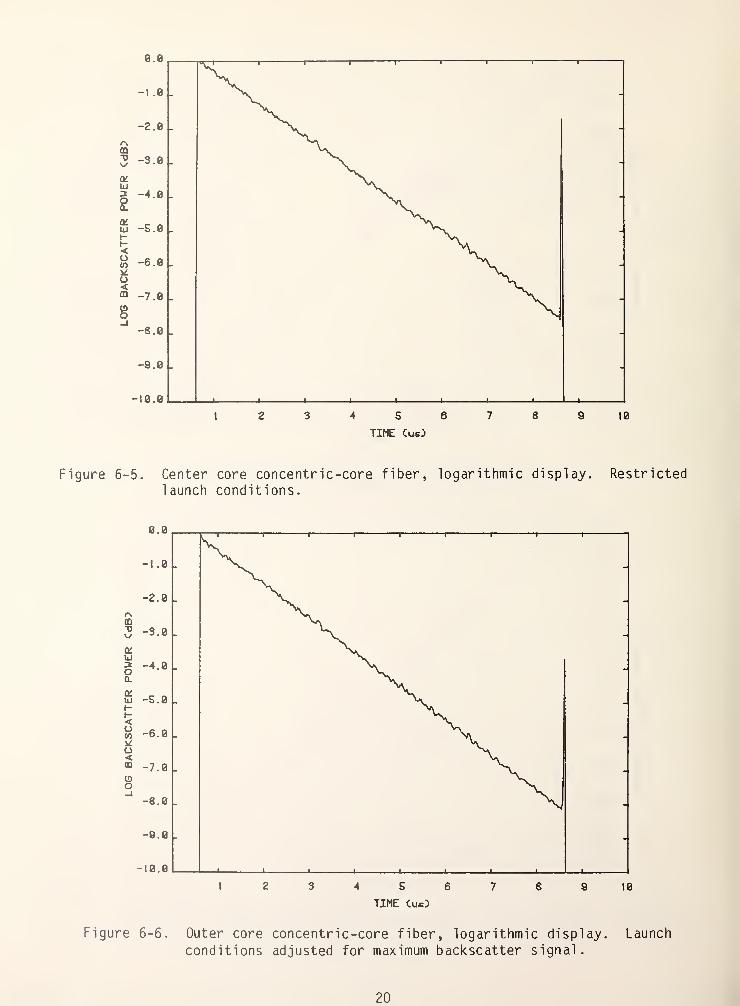
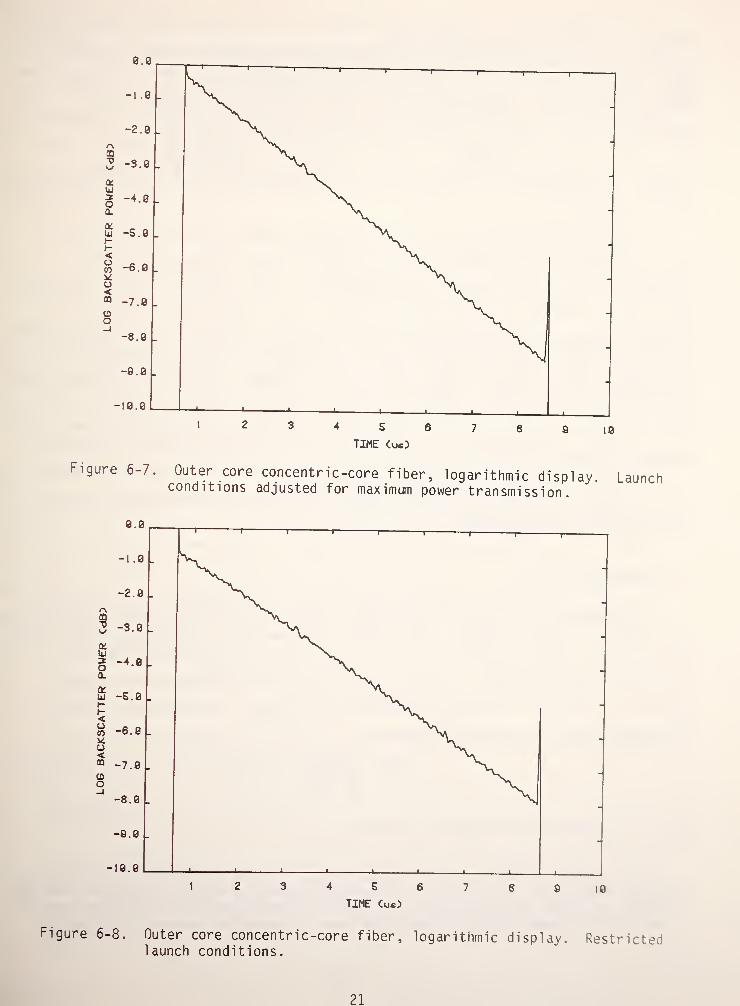
Figure 6-7. Outer core concentric-core fiber, logarithmic display. Launchconditions adjusted for maximum power transmission.
Figure 6-8. Outer core concentric-core fiber, logarithmic display. Restrictedlaunch conditions.
21
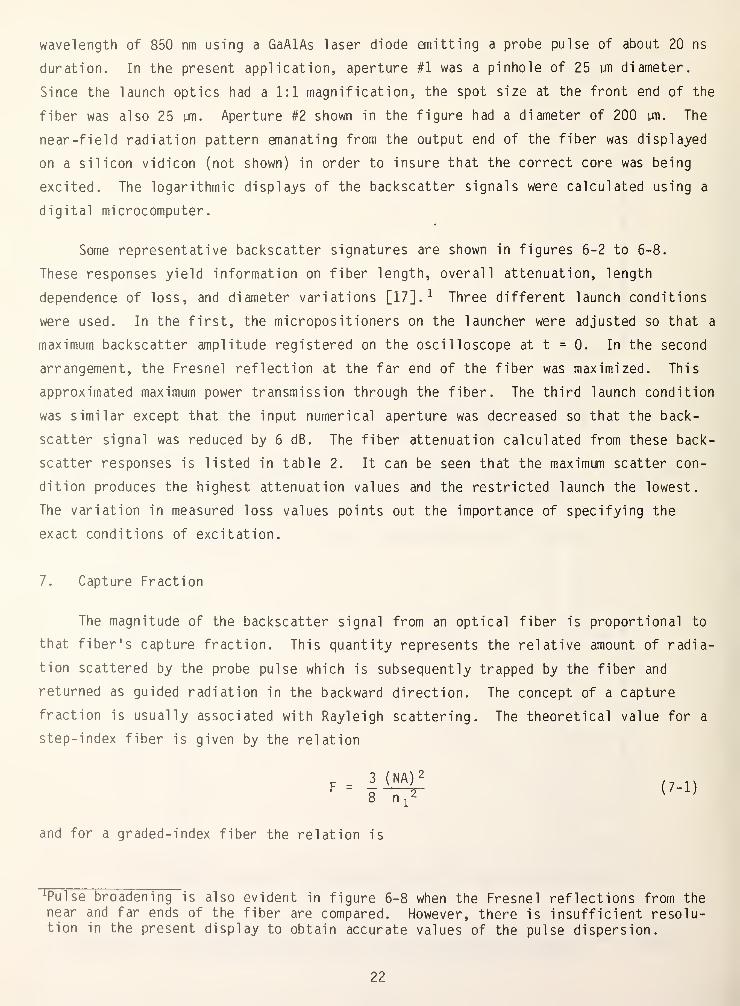
wavelength of 850 nm using a GaAlAs laser diode emitting a probe pulse of about 20 ns
duration. In the present application, aperture #1 was a pinhole of 25 un diameter.
Since the launch optics had a 1:1 magnification, the spot size at the front end of the
fiber was also 25 un. Aperture #2 shown in the figure had a diameter of 200 un. The
near -field radiation pattern emanating from the output end of the fiber was displayed
on a silicon vidicon (not shown) in order to insure that the correct core was being
excited. The logarithmic displays of the backscatter signals were calculated using a
digital microcomputer.
Some representative backscatter signatures are shown in figures 6-2 to 6-8.
These responses yield information on fiber length, overall attenuation, length
dependence of loss, and diameter variations [17]. 1 Three different launch conditions
were used. In the first, the micropositioners on the launcher were adjusted so that a
maximum backscatter amplitude registered on the oscilloscope at t = 0. In the second
arrangement, the Fresnel reflection at the far end of the fiber was maximized. This
approximated maximum power transmission through the fiber. The third launch condition
was similar except that the input numerical aperture was decreased so that the back-
scatter signal was reduced by 6 dB. The fiber attenuation calculated from these back-
scatter responses is listed in table 2. It can be seen that the maximum scatter con-
dition produces the highest attenuation values and the restricted launch the lowest.
The variation in measured loss values points out the importance of specifying the
exact conditions of excitation.
7. Capture Fraction
The magnitude of the backscatter signal from an optical fiber is proportional to
that fiber's capture fraction. This quantity represents the relative amount of radia-
tion scattered by the probe pulse which is subsequently trapped by the fiber and
returned as guided radiation in the backward direction. The concept of a capture
fraction is usually associated with Rayleigh scattering. The theoretical value for a
step-index fiber is given by the relation
r.|«!
and for a graded-index fiber the relation is
^ulse broadening is also evident in figure 6-8 when the Fresnel reflections from thenear and far ends of the fiber are compared. However, there is insufficient resolu-tion in the present display to obtain accurate values of the pulse dispersion.
22
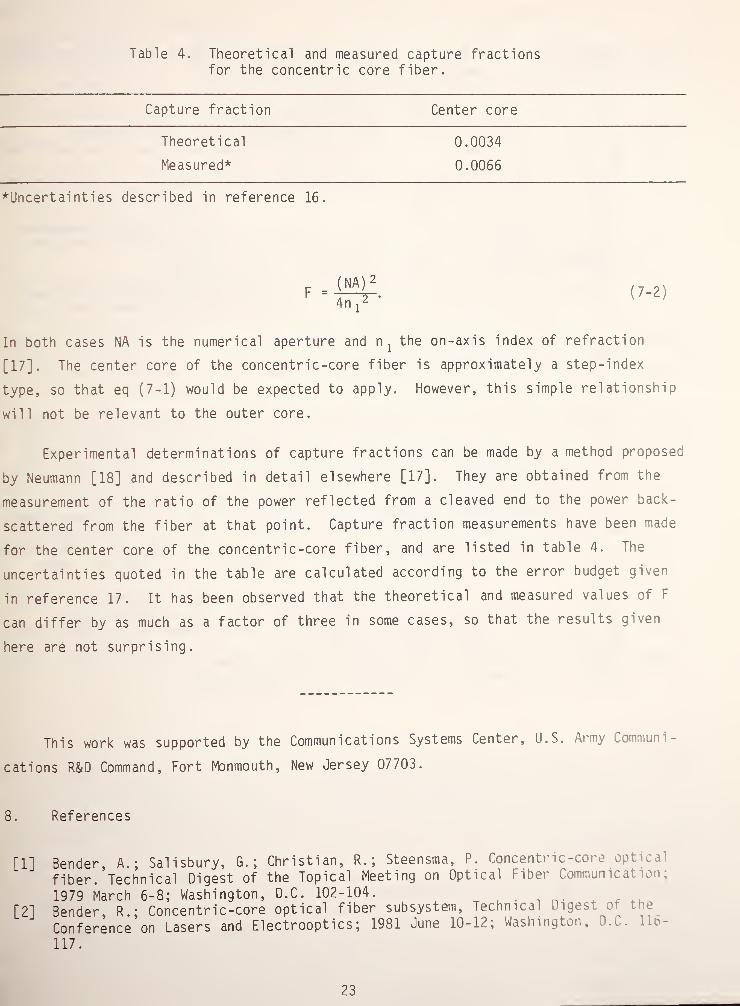
Table 4. Theoretical and measured capture fractionsfor the concentric core fiber.
Capture fraction Center core
Theoretical
Measured*
0.0034
0.0066
Uncertainties described in reference 16.
(NA) 2
4n ,
2(7-2)
In both cases NA is the numerical aperture and n:
the on-axis index of refraction
[17]. The center core of the concentric-core fiber is approximately a step-index
type, so that eq (7-1) would be expected to apply. However, this simple relationship
will not be relevant to the outer core.
Experimental determinations of capture fractions can be made by a method proposed
by Neumann [18] and described in detail elsewhere [17]. They are obtained from the
measurement of the ratio of the power reflected from a cleaved end to the power back-
scattered from the fiber at that point. Capture fraction measurements have been made
for the center core of the concentric-core fiber, and are listed in table 4. The
uncertainties quoted in the table are calculated according to the error budget given
in reference 17. It has been observed that the theoretical and measured values of F
can differ by as much as a factor of three in some cases, so that the results given
here are not surprising.
This work was supported by the Communications Systems Center, U.S. Army Communi-
cations R&D Command, Fort Monmouth, New Jersey 07703.
8. References
[1] Bender, A.; Salisbury, G. ;Christian, R.; Steensma, P. Concentric-core optical
fiber. Technical Digest of the Topical Meeting on Optical Fiber Communication;
1979 March 6-8; Washington, D.C. 102-104.. . , .
[2] Bender, R.; Concentric-core optical fiber subsystem. Technical Digest ot tne
Conference on Lasers and Electrooptics; 1981 June 10-12; Washington, D.«. . l^o-
117.
23
[3] Franzen, D.L.; G.W. Day; R.L. Gallawa; Standardizing test conditions for charac-terizing fibers; Laser Focus 17(8): 103-105 ; 1981 August.
[4] Reitz, Paul R. Measuring optical waveguide attenuation: The LPS method.
Optical Spectral 15(8) : 48-52 ; 1981 August.
[5] Holmes, G. T. and R. M. Hawk. Limited phase-space attenuation measurements of
low-loss optical waveguides. Optics Letters 6(2): 55-5 7 ; 1981 February.
[6] Cherin, A. H.; Gardner, W. Fiber measurement standards. Laser Focus 16(8) : 60-
65; 1980 August.
[7] Kaiser, P. Low measurements of graded-index fibers: accuracy vs. convenience.Technical Digest, Symposium on Optical Fiber Measurements, Nat. Bur. Stand.
(U.S.) Spec. Publ . 597; 1980.
[8] Cherin, A. H.; E. D. Head. A fiber concatenation experiment using a standard-ized loss measurement method. Technical Digest, Symposium on Optical FiberMeasurements, Nat. Bur. Stand. (U.S.) Spec. Publ. 597; 1980.
[9] Franzen, D. L.; Day, G. W.; Danielson, B. L.; Chamberlain, G. E.; Kim, E. M.
Interlaboratory measurement comparison to determine the attenuation and band-width of graded-index optical fibers. Appl. Opt. 20(14) :2412-2419; 1981 July15.
[10] Inada, K. A new graphical method relating to optical fiber attenuation. Opt.
Commun. 19( 3 ) : 437-439; 1976 December.
[11] Kim, E. M.; Franzen, D. L. Measurement of far-field and near -field radiationpatterns from optical fibers. Nat. Bur. Stand. (U.S.) Tech. Note 1032; 1981February. 48 p.
[12] Franzen, D. L.; Day, G. W. Measurement of optical fiber bandwidth in the timedomain. Nat. Bur. Stand. (U.S) Tech. Note 1019; 1980 February. 72 p.
[13] White, K. I. Practical application of the refracted near-field technique for
the measurement of optical fiber refractive index profiles. Opt. Quantum Elec-tron. 11:185-188; 1979.
[14] Stewart, W. J. A new technique for measuring the refractive index profiles of
graded optical fibers. Technical Digest, I00C; 1977 July 18-20; Tokyo, Japan.1977 July. 395-398.
[15] Young, M. Refracted-ray scanning (refracted near-field scanning) for measuringindex profiles of optical fibers. Nat. Bur. Stand. (U.S.) Tech. Note 1038;1981.
[16] Young, M. Optical fiber index profiles by the refracted ray method (refractednear-field scanning). Appl. Opt. 20(19) :3415-3422; 1980 October 1.
[17] Danielson, B. L. Backscatter measurements on optical fibers. Nat. Bur. Stand.(U.S.) Tech. Note 1034; 1981 February. 52 p.
[18] Neumann, E...G. Analysis of the backscattering method for testing optical fibercables. AEU, Electron, and Commun. 34(4) : 1 57 -160 ; 1980.
24
NBS-114A REV. 2-80
U.S. DEPT. OF COMM.U.S. DEPT. OF COMM.
BIBLIOGRAPHIC DATA
1. PUBLICATION ORREPORT NO.
2. Performing Organ. Report No. 3. Publication Date
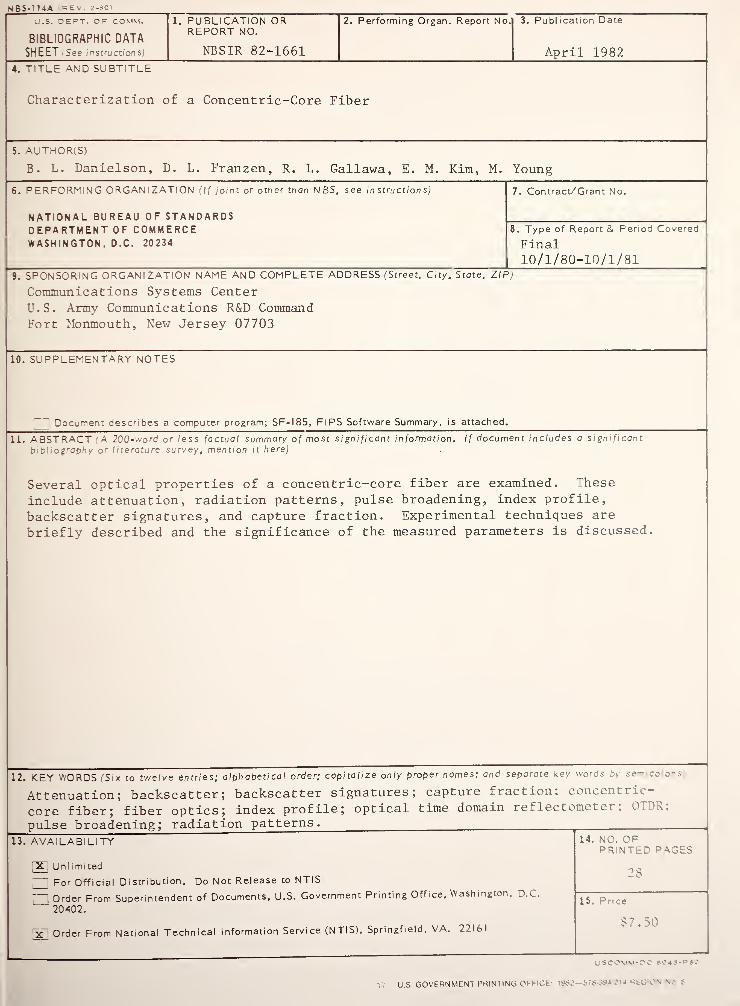
SHEET See instructions) NBSIR 82-1661 April 19824. TITLE AND SUBTITLE
Characterization of a Concentric-Core Fiber
5. AUTHOR(S)
B. L. Danielson, D. L. Franzen, R. L. Gallawa, E. M. Kim, M. Young
6. PERFORMING ORGANIZATION (If joint or other than NBS, see instructions) 7. Contract/Grant No.
national bureau of standardsDEPARTMENT OF COMMERCE 8. Type of Report & Period Covered
WASHINGTON, D.C. 20234 Final10/1/80-10/1/81
9. SPONSORING ORGANIZATION NAME AND COMPLETE ADDRESS (Street. City. State, ZIP)
Communications Systems Center
U.S. Army Communications R&D CommandFort Monmouth, New Jersey 07703
10. SUPPLEMENTARY NOTES
Document describes a computer program; SF-185, FlPS Software Summary, is attached.
11. ABSTRACT (A 200-word or less factual summary of most significant information. If document includes a significant
bi bl iography or literature survey, mention it here)
Several optical properties of a concentric-core fiber are examined. These
include attenuation, radiation patterns, pulse broadening, index profile,
backscatter signatures, and capture fraction. Experimental techniques are
briefly described and the significance of the measured parameters is discussed.
12. KEY WORDS (Six to twelve entries; alphabetical order; capitalize only proper names; and separate key words r. se~ cc c-s
Attenuation; backscatter; backscatter signatures; capture fraction, concent i ic
core fiber; fiber optics; index profile; optical time domain ref lectometei , 0 ^
>
pulse broadening; radiation patterns.
13. AVAILABILITY
X U n li m i ted
|—
|
For Official Distribution. Do Not Release to NTIS
1 Order From Superintendent of Documents, U.S. Government Printing Office, Washington. D.C.
20402.
X~ Order From National Technical Information Service (NTIS), Springfield, VA. 22161
14. NO. OFPRINTED PAGES
28
15. Price
$7.50
vjscomm-oc «04S-p*o
tv U.S. GOVERNMENT PRINTING OFFICh 1962 .'Y.W ."r RtV .'S V- .-