characterization of composites fabricated · pdf filecharacterization of composites fabricated...
TRANSCRIPT

CHARACTERIZATION OF COMPOSITES FABRICATED FROM DISCONTINUOUS RANDOM CARBON FIBER THERMOPLASTIC MATRIX SHEETS PRODUCED BY A
PAPER MAKING PROCESS
By
Martin Paul Ducote, Jr.
A THESIS
Submitted to Michigan State University
in partial fulfillment of the requirements for the degree of
Mechanical Engineering – Master of Science
2015

ABSTRACT
CHARACTERIZATION OF COMPOSITES FABRICATED FROM DISCONTINUOUS RANDOM CARBON FIBER THERMOPLASTIC MATRIX SHEETS PRODUCED BY A
PAPER MAKING PROCESS
By
Martin Paul Ducote, Jr.
In this thesis, a papermaking process was used to create two randomly oriented, high
performance composite material systems. The primary objective of this was to discover the
flexural properties of both composite systems and compare those to reported results from other
studies. In addition, the process was evaluated for producing quality, randomly oriented
composite panels.
Thermoplastic polymers have the toughness and necessary strength to be alternatives to
thermosets, but with the promise of lower cycle times and increased recyclability. The wet-lay
papermaking process used in this study produces a quality, randomly oriented thermoplastic
composite at low cycle times and simple production. The materials chosen represent high
performance thermoplastics and carbon fibers.
Short chopped carbon fiber filled Nylon 6,6 and PEEK composites were created at
varying fiber volume fractions. Ten nylon based panels and five PEEK based panels were
subjected to 4-point flexural testing. In several of the nylon-based panels, flexural testing was
done in multiple direction to verify the in-plane isotropy of the final composite.
The flexural strength performance of both systems showed promise when compared to
equivalent products currently available. The flexural modulus results were less than expected and
further research should be done into possibly causes. Overall, this research gives good insight
into two high performance engineering composites and should aid in continued work.

Copyright by MARTIN PAUL DUCOTE, JR.
2015

iv
ACKNOWLEDGMENTS
There were many people involved with this process and I am grateful to everyone who
helped. I would like to say thanks to Dr. Dahsin Liu and Dr. Mahmood Haq for serving on my
thesis committee. Mr. Timothy Hinds for allowing me to work as a teaching assistant and learn
from him. The department of mechanical engineering and everyone involved with my study
while at Michigan State University. I would like to say a special thanks to Tim Luchini and Steve
Sommerlot for always taking time to help me whenever I asked, Colby Woods for his endless
support, and finally Dr. Alfred Loos for being an excellent mentor and professor.

v
TABLE OF CONTENTS
LIST OF TABLES ........................................................................................................................ vii
LIST OF FIGURES ..................................................................................................................... viii
KEY TO SYMBOLS AND ABBREVIATIONS ........................................................................... x
Chapter 1. Introduction ................................................................................................................... 1
Chapter 2. Literature Review .......................................................................................................... 4 2.1. Thermoplastics ..................................................................................................................... 4 2.2. Common Thermoplastic Polymers ....................................................................................... 5
2.2.1 Nylon 6,6........................................................................................................................ 6 2.2.2 PEEK.............................................................................................................................. 6
2.3. Carbon Fiber Reinforcements .............................................................................................. 7 2.3.1 General Structure ........................................................................................................... 8 2.3.2 Manufacturing Carbon Fibers ........................................................................................ 8
2.4. Strength of Thermoplastics Based Composites .................................................................... 9 2.5. Manufacturing with Thermoplastics .................................................................................. 10
2.5.1 Pre-Melt Mixing ........................................................................................................... 11 2.5.2 Melt Mixing ................................................................................................................. 13 2.5.3 Low Viscosity Precursors ............................................................................................ 14
2.6. Compression Molding of Thermoplastic Composites ........................................................ 15 2.7. Tensile Strength versus Flexural Strength ......................................................................... 16 2.8. Nylon Composite Data from Literature ............................................................................. 17 2.9. PEEK Composite Data from Literature ............................................................................. 18 2.10. Other Comparable Composite Strengths ......................................................................... 20 2.11. Calculating Volume Fraction from Weight Fractions ..................................................... 20 2.12. Scanning Electron Microscopy ........................................................................................ 21
Chapter 3. Panels and Materials Tested ........................................................................................ 23
3.1. Panels Tested ..................................................................................................................... 23 3.2. Materials Used ................................................................................................................... 24
3.2.1 Reinforcing Fibers ....................................................................................................... 24 3.2.2 Thermoplastic Matrix ................................................................................................... 25 3.2.3 White Water ................................................................................................................. 25
3.2.3.1 Thickener .............................................................................................................. 25 3.2.3.2 Surfactant .............................................................................................................. 26 3.2.3.3 Anti-Foam ............................................................................................................. 26
3.2.4 Mold Release ............................................................................................................... 26

vi
Chapter 4. Production of Test Composite Plates .......................................................................... 28 4.1. White Water ....................................................................................................................... 28 4.2. Mixing ................................................................................................................................ 29 4.3. Water Removal ................................................................................................................... 30 4.4. Drying ................................................................................................................................ 32 4.5. Molding Preparation ......................................................................................................... 33 4.6. Compression Molding ........................................................................................................ 34
Chapter 5. Testing ......................................................................................................................... 37
5.1. Flexural Testing ................................................................................................................. 37 5.2. Adjusted Fiber Volume Fractions ...................................................................................... 38 5.3. Processing .......................................................................................................................... 39 5.4. Microscopy ......................................................................................................................... 40
Chapter 6. Results ......................................................................................................................... 41
6.1. Fiber volume fraction ........................................................................................................ 41 6.2. Flexural Strength ............................................................................................................... 42 6.3. Flexural Modulus ............................................................................................................... 44 6.4. Planar Isotropy .................................................................................................................. 47 6.5. Microscopy ......................................................................................................................... 48
Chapter 7. Discussion ................................................................................................................... 54
7.1. Fiber Volume Fraction ...................................................................................................... 54 7.2. Comparison of Flexural Strength ...................................................................................... 54 7.3. Comparison of Flexural Modulus ...................................................................................... 57 7.4. Planar Isotropy .................................................................................................................. 60 7.5. Microscopy ......................................................................................................................... 61 7.6. Manufacturing Process ...................................................................................................... 63
7.6.1 Surfactant in White Water ........................................................................................... 63 7.6.2 Separation of Carbon Fiber .......................................................................................... 64 7.6.3 Inconsistent Drying of Mats ......................................................................................... 65 7.6.4 Cutting testing coupons................................................................................................ 67
Chapter 8. Conclusion ................................................................................................................... 68
8.1. Conclusions ........................................................................................................................ 68 8.2. Future Work ....................................................................................................................... 69
APPENDICES .............................................................................................................................. 71
Appendix 1: Individual Sample Results from Flexural Testing ................................................ 72 Appendix 2: MATLAB code ...................................................................................................... 74
BIBLIOGRAPHY ......................................................................................................................... 79

vii
LIST OF TABLES
Table 2.1: Nylon based composite data from the literature .......................................................... 18
Table 2.2: PEEK based composite data from the literature .......................................................... 19
Table 3.1: Nylon based panels produced for testing ..................................................................... 24
Table 3.2: PEEK based panels produced for testing ..................................................................... 24
Table 4.1 Materials used for white water ...................................................................................... 29
Table 5.1: Specifications of flexural testing ................................................................................. 38
Table 5.2: Sample coupons used for SEM microscopy ................................................................ 40
Table 6.1: Predicted versus final calculated fiber volume fraction for nylon based panels ......... 41
Table 6.2: Target and adjusted fiber volume fractions for PEEK based plates ............................ 42
Table 6.3: Flexural strength results for nylon based panels .......................................................... 43
Table 6.4: Flexural strength results for PEEK based panels ......................................................... 44
Table 6.5: Flexural modulus results for nylon based panels ......................................................... 45
Table 6.6: Flexural modulus results for PEEK based panels ........................................................ 46
Table 6.7: Flexural testing results for panel 007 ........................................................................... 48
Table A.1: Flexural strength data for PEEK panels tested. All values are in MPa. ..................... 72
Table A.2: Flexural modulus data for nylon panels tested. All values in GPa. ............................ 72
Table A.3: Flexural strength data for nylon panels tested. All values are in MPa. ...................... 73
Table A.4: Flexural modulus data for nylon panels tested. All values in GPa. ............................ 73

viii
LIST OF FIGURES
Figure 4-1: Overview of production method used in panel production ........................................ 28
Figure 4-2: FORMAX maelstrom 8 L pulper ............................................................................... 30
Figure 4-3: Formax sheet former. Shown with deckle box and couching plate rotated up .......... 31
Figure 4-4: Thermoplastic and carbon fibers mixed with white water in deckle box .................. 32
Figure 4-5: Fibrous mat after couching step ................................................................................. 32
Figure 4-6: Steel compression mold ............................................................................................. 34
Figure 4-7: PHI press used in molding nylon based panels .......................................................... 35
Figure 4-8: TMP press used for molding PEEK based panels ...................................................... 36
Figure 6-1: Typical stress-strain curve from flexural testing. Diamonds and circles represent slope locations for modulus calculations. Stars represent peak strength. ................. 42
Figure 6-2: Flexural strength results for Nylon based panels ....................................................... 43
Figure 6-3: Flexural strength results for PEEK based panels ....................................................... 44
Figure 6-4: Flexural modulus results for nylon based panels ....................................................... 46
Figure 6-5: Flexural modulus results for PEEK based panels ...................................................... 47
Figure 6-6: Photomicrograph of panel 012 coupon 06 (Nylon). Surface pit circled in black. ..... 49
Figure 6-7: Photomicrograph of panel 13 coupon 1 (PEEK) ....................................................... 50
Figure 6-8: Photomicrograph of panel 007 coupon 1 (Nylon) ..................................................... 50
Figure 6-9: Photomicrograph of panel 007 coupon 1 (Nylon) ..................................................... 51
Figure 6-10: Photomicrograph of panel 023 coupon 02 (PEEK) ................................................. 52
Figure 6-11: Photomicrograph from panel 013 coupon 01 (PEEK) ............................................. 52
Figure 6-12: Photomicrograph of panel 007 coupon 01 (Nylon) ................................................. 53

ix
Figure 6-13: Photomicrograph of Panel 004 coupon 6 (Nylon). Shows failure surface (washed out scale bar reads 100 µm) ....................................................................................... 53
Figure 7-1: Comparison of Nylon based panel’s flexural strength in current study with literature
results. Source of information showed in brackets. Dotted line references current study. ......................................................................................................................... 55
Figure 7-2: Comparison of PEEK based panel’s flexural strength in current study with literature
results. Source of information showed in brackets. Dotted line references current study. ......................................................................................................................... 56
Figure 7-3: Flexural strength comparision of current study to previous work by Lu and Caba at
close fiber volume fraction. References are in brackets. ........................................... 57
Figure 7-4: Comparison of Nylon based panel’s flexural modulus in current study with literature results. Source of information showed in brackets. Dotted line references current study. ......................................................................................................................... 58
Figure 7-5: Comparison of PEEK based panel’s flexural modulus in current study with literature
results. Source of information showed in brackets. Dotted line references current study .......................................................................................................................... 59
Figure 7-6: Flexural Modulus comparision of current study to previous work by Lu and Caba at
close fiber volume fraction. References are in brackets. ........................................... 60
Figure 7-7: Flexural strength results from individual coupons of Panel 007 ............................... 61!
x
KEY TO SYMBOLS AND ABBREVIATIONS d Specimen Depth (Length)
D Deflection (Length)
b Specimen Width (Length)
M" Mass of Fibers (Mass)
P Load (Force)
S Support Span (Length)
V" Fiber Volume Fraction (Dimensionless)
V",% Adjusted Fiber Volume Fraction (Dimensionless)
W" Fiber Weight Fraction (Dimensionless)
ε" Flexural Strain (Length/Length)
ρ" Fiber Density (Mass/Length3)
ρ) Matrix Density (Mass/Length3)
σ" Flexural Stress (Force/Length2)

1
Chapter 1. Introduction
The concept of composite materials is by no means new to engineering. Throughout
history, there are numerous examples of combining materials to enhance the properties of one or
both of them. This has continued all the way through to the steel reinforced concrete used in
today’s bridges and structures. As a concept, the method of composite making is simple;
combine two or more materials in the correct quantity until the desired properties are
accomplished [1]. However, in today’s ever evolving and complex world, the subject of
composites continues to provide a substantial challenge for engineers.
A composite material can be defined as “The combination of a reinforcement material
(such as a particle or fiber) in a matrix or binder material [1].” It is also important to understand
that the matrix and binder materials remain identifiable on the macroscopic level and continue to
have their own unique properties. Although the matrix material and fibers can be made from an
infinite combination of materials, the focus of this research has been to observe fiber-reinforced
thermoplastics, a subset of polymers. Specifically, these will be composites made using carbon-
fiber reinforcement with a thermoplastic polymer matrix. The differences between thermoplastic
and thermosetting polymers produces the interest to perform this research.
The polymers used in composites can generally be separated into two broad categories:
Thermoplastics and Thermosets. These two categories are separated by a fundamental difference
in the curing process. Thermosets undergo a chemical cross-linking process while thermoplastics
do not. This leads to a number of differences with regards to storage, processing, and recycling.
The crosslinking reaction in thermosets is increased by the addition of heat, which leads to
refrigeration requirements for these polymers as well as limited shelf lives. In addition, the cross-

2
linking renders a chemically changed material that cannot be reversed. Thermosets are well
known to have good tensile, shear, and compressive strengths but are lacking in damage
tolerance and environmental stability [1–4].
The lack of a chemical curing step in thermoplastics gives them an unlimited shelf life,
inherently good toughness characteristics that reduce initial damage and resist crack propagation,
and the ability to be remolded after processing. In addition, high performance thermoplastics
have characteristically stiff aromatic chains that produce high glass transition temperatures. This
allows the use of thermoplastics in high temperature designs where thermosets would be
inappropriate [1, 3].
For the reasons stated above, thermoplastics as a matrix material in composites are
becoming more popular. The purpose of this thesis is to measure the flexural properties of a high
performance engineering composite materials made using a wet-lay paper making process. The
process was originally patented by James E. Geary, Jr. and Gregory P. Weeks in 1993 under the
name “Method of Making Fiber Reinforced Porous Sheets” (Patent # 5194106) [5]. This method
has been adapted for the equipment available and is explained thoroughly in Chapter 4. The
advantage of using a paper making process is the uniform porous mat of reinforcement and
thermoplastic fibers that are produced that can then be compression molded.
This process was first investigated by Lu [6] with carbon and glass filled polyethylene
terephthalate (PET) and polypropylene (PP), two common polymers. This thesis is a continuation
of that research, using higher performance thermoplastics with the same process. The matrix
materials used were Nylon 6,6 and PEEK, both of which are considered higher performance
thermoplastics [1-3]. In this study, 15 composite panels were created using the wet-lay and
compression molding techniques. These were then subjected to flexural testing to determine their

3
strength and modulus. Following that, selected tested samples were subjected to scanning
electron microscopy. The entire process was also critiqued for sources of error and future
recommendations for continued research.
The results showed promise for both the material systems and the process. The flexural
strengths found are competitive with products currently found on the market. However, the
flexural modulus values were found to be lower than expected and further research should be
done into possible causes and recommendations for future work have been given.
This thesis offers an in depth literature review, providing background information on
thermoplastics, carbon fibers, manufacturing methods and selected data from similar studies. A
detail of the materials used in this research as well as a list of composite panels follows. Chapters
4 and 5 detail the production and testing of the panels. Chapters 6 and 7 follow with results of
testing as well as a discussion. Finally, Chapter 8 gives a conclusion and summary of
recommendations future work.

4
Chapter 2. Literature Review
The purpose of this section is to give a background of the concepts used in this thesis.
This begins with an overview of thermoplastics and carbon fibers, the two materials used in these
composites. More detailed information is given on the two thermoplastics used in this research:
Nylon 6,6 and PEEK. An overview of common manufacturing techniques with thermoplastics is
provided following the introductions of the materials. This includes pre-melt mixing, melt
mixing, and low viscosity precursors. As the process detailed in this thesis belongs to the latter,
more focus is given to pre-melt mixing.
Sections 2.4 to 2.6 report recent research results that are of interest to the work done in
the current study. This includes flexural testing data from carbon-nylon and carbon-PEEK
composites as well as other appropriate composite systems. These results will be directly
compared in the discussion in Chapter 7. Finally, in order to understand the testing methods
being performed, brief introductions of flexural testing, fiber volume and weight fractions and
scanning electron microscopy are given. These sections introduce concepts that were used during
the testing phase of this research.
2.1. Thermoplastics
Thermoplastics differ with thermosets because they do not require a reactive cure step.
As opposed to thermosets, which have chemical crosslinking, there are no chemical bonds that
hold thermoplastic molecules together. Instead, secondary bonding, such as hydrogen bonds or
van der Waals bonds, is present. Secondary bonds are easily broken by the addition of heat,
allowing molecules to freely move around for a temporary amount of time. An in depth

5
discussion of this chemistry is outside the scope of this thesis. However, from a design and
manufacturing standpoint, the production and mechanical performance of thermoplastic
composites rely on the chemistry. In general, thermoplastics can be formed to suit whatever
structural shape is required [3, 7, 8, 9]. For that reason, thermoplastics have been gaining
popularity in the composites industry. As an example, in 2007, 35% of composites were being
produced with thermoplastics with the remaining still coming from thermosets [10].
2.2. Common Thermoplastic Polymers
Thermoplastic polymers are known for characteristically good toughness and
environmental resistance properties. There are 4 broad categories of thermoplastics: fully
polymerized amorphous polymers, liquid crystalline polymers, extendable polymers, and semi-
crystalline polymers. A background of common thermoplastic polymers is necessary because,
the thermoplastics used in this study, Nylon 6,6 and PEEK, are both semi-crystalline polymers.
As these semi-crystalline polymers are processed at elevated temperatures, some areas
solidify in repeated ordered units that are crystalline. Amorphous regions, or areas where the
polymer chains have a somewhat random arrangement, surround these pockets of crystallinity.
There are advantages and disadvantages to the presence of these crystalline regions, often called
crystallites [11, 12]. These regions can act as crosslinks between polymer chains; protecting the
polymer from solvents and increasing mechanical performance at elevated temperatures.
However, these crystalline areas can also limit the energy absorption of the polymer, causing it
to act more brittle. Generally, semi-crystalline thermoplastics can be 5% to 50% crystalline with
an optimum range being between 20% to 35% [3, 11].

6
2.2.1 Nylon 6,6
Nylon 6,6 is a matrix material that belongs to the polyamides family of thermoplastics.
Nylon 6,6, referred to as simply as nylon in remainder of this thesis, is one of the best known,
accounting for 70% of the polyamides used today. Polyamides are commonly combined to form
composites, with about 60% of them being filled with glass, carbon, or minerals [10]. Generally,
these nylon based composites are used for automotive parts in the transportation industry.
There are a few drawbacks that must be overcome when manufacturing with nylon. High
water absorption, as much as 1 – 3%, means that composite parts must be protected from weather
and humidity [10]. Meanwhile, geometric tolerancing is difficult due to high shrinkage after
molding and can lead to processing complications and costs associated with complex molds or
post processing. The high shrinkage is due to its semi-crystalline nature and the development of
the cryastallites during cooling. However, these drawbacks are manageable when the beneficial
material properties such as low strains at yield and high elongations at failure are required. Neat
nylon generally has a maximum density of 1.15 g/cm3, a maximum yield stress of 85 MPa and a
flexural modulus of 3.0 GPa [10].
2.2.2 PEEK
Polyether Ether Ketone (PEEK) is considered a high-performance engineering
thermoplastic belonging to the Polyarylketone family. PEEK is attractive in high temperature
applications because of a 335°C melting point and a 143°C glass transition temperature (Tg) [10].
Furthermore, PEEK has a continuous use temperature of 250°C. Moisture content is less of an
issue with PEEK when compared to some other thermoplastics because, it has low water
absorption at less than 0.5% and is resistant to most solvents with the exception of methylene

7
chloride. In 2007, the global consumption of PEEK was between 2000 and 4000 tons per year
with a majority being used in industry and automotive applications [10].
Also, as a semi-crystalline polymer, PEEK thermoplastics have a crystallinity between
30% to 35% when cooled at a normal rate, avoiding a rapid cool from an amorphous state.
However, with the introduction of fibers to PEEK resin systems, the crystallinity will tend to
increase. The fracture toughness of PEEK is about 50-100 times greater than standard
thermosetting epoxys [3]. PEEK can have a density between 1.27 to 1.32 g/cm3 and shrinkage of
1.1%. Drawbacks to working with PEEK include sensitivity to UV light and the excessive cost.
As an example to other thermoplastics, PEEK can cost as much as 20 times more than nylon
[10].
2.3. Carbon Fiber Reinforcements
Although composite materials can be made using a variety of fiber types and styles, carbon
fibers have been considered the most promising for high performance materials. Carbon fibers
can be produced from three different precursors: PAN (polyacrylonitrile), Pitch, or Rayon. The
different precursors, coupled with different manufacturing methods provide a wide variety of
carbon fibers and performances providing tensile moduli ranging from 207 GPa to 1035 GPa [3].
The most common precursor used is PAN due to its relatively low cost. The properties of Pitch
based fibers make it useful for applications with extreme temperature changes and harsh
environments. The least used precursor is Rayon, which is only used in ablative functions [13].

8
2.3.1 General Structure
The high tensile modulus of carbon fibers comes from the graphitic organization of their
carbon molecules. Carbon atoms are arranged in repeated hexagonal patterns that form planes.
The planes are aligned in the longitudinal direction of the fiber, providing the high tensile
strength. The interactions and arrangement of the carbon rings, which are connected through
weak van der Waals forces, govern the properties in the radial and circumferential directions.
Several common structural types arise from the orientations of these planes including
circumferential, radial, or random. The orientations as well as the purity of the graphitization are
all controlled by both the precursor and the manufacturing process used [3].
2.3.2 Manufacturing Carbon Fibers
Carbon fibers produced from PAN are the most commonly used and produced,
accounting for 90% of all commercial carbon or graphite fibers [13]. The process begins with
spinning a PAN solution into fibers. The fibers are then heated and stretched, aligning the
filament chains and creating PAN filaments. The alternative to PAN filaments would be creating
pitch filaments. Pitch is relatively low cost by-product of petroleum refining. However, the
purifying and processing of these fibers can make them more expensive when compared to the
PAN based fibers [13]. The pitch is heated to 300°C - 500°C and the hot spun into fibers and
then stabilized by a second heat treatment [3].
Once a filament of either pitch or PAN has been made, the next stage is carbonization.
This involves stretching the fibers while heating in an inert atmosphere to 1000°C - 2000°C. This
process removes the oxygen and nitrogen atoms, leaving only carbon atoms arranged in the
hexagonal plane patterns previously discussed. However, there is no order between parallel
9
planes, giving these fibers high strength, but relatively low-modulus, between 200 GPa and 300
GPa. The final stage for the fibers is to graphitize or order the planes. The fibers are heated
above 2000°C, increasing the tensile modulus to between 500 GPa and 600 GPa. Although this
graphitization lowers the strength of the fibers, some of the strength can be recovered by
stretching the fibers during the process, aligning the planes with the longitudinal axis of the
fibers. The overall purity of the fiber and crystallinity control the electrical and thermal
conductivity as well as the resistance to oxidation [3].
2.4. Strength of Thermoplastics Based Composites
From a strength aspect, thermoplastics are somewhat lacking when compared to the
conventional thermoset matrix composites. However, thermoplastics have the advantages of
damage tolerance and environmental stability, which led to a surge in research and use since the
early 1970s [8].
Thermoplastics can be roughly divided into two categories: conventional and high-
performance. Conventional thermoplastics have relatively good properties but generally lack
strength when compared to their engineered counterparts. Most conventional thermoplastics are
used extensively in everyday objects as neat plastics without fiber reinforcement. Some
examples include polyethylene, nylon, polystyrene, and polyester. For improved mechanical
properties, all of these can incorporate fibers or fillers. Normally glass fiber is added to enhance
certain aspects of a parts respective mechanical property for a relatively small cost [1, 3].
Originally, thermoplastic based composites were created using solvent impregnation with
amorphous polymers. However, other impregnation processes were used to develop PEEK and
PPS (Polyphenylene sulfide) [2]. These are two examples of what are considered high-

10
performance thermoplastics. Although more expensive than conventional thermoplastics, the
higher glass-transition temperature, Tg, allows for much higher mechanical properties at higher
operating temperatures. Also, an added benefit characteristic of these thermoplastics is increased
toughness.
2.5. Manufacturing with Thermoplastics
Thermoplastics can be classified as non-reactive solids or linear polymers at lower
temperature and pressures. The most evident outcome of this is that they are re-moldable and re-
formable. This has both advantages and disadvantages to cost and cycle times for manufacturing
[1, 2, 10]. Transporting and storing thermoplastics is much simpler than that for thermosets. This
is because they have, unless limited by some additive or other substance, an unlimited shelf life.
A decrease in cycle times also makes them more attractive since thermoplastics do not require an
extra mixing step or the long curing times of thermosets. In these cases, the cycle time is
determined by the time required to heat, disperse and cool the thermoplastic. Where a process
involving thermosets is dependent on the chemical crosslinking, the complication with
processing thermoplastics comes from controlling viscosity. This is due to the fact that
thermoplastics are fully polymerized and therefore have much higher molecular weights [8].
Typical injection viscosity of thermosets is less than 100 Pa-s, however, thermoplastics will
generally be 5 to 50 times greater [2]. This leads to manufacturing issues with full fiber wet out,
fiber movement, and consolidation rate. The literature [8, 14, 15] showed multiple, innovative
processes to effectively mix the fiber and resin to create a pre-impregnated material for either
immediate processing or for forming and then processing. These processes can be broken down
into three general practices: pre-melt mixing, melt mixing, and low viscosity precursors.
11
2.5.1 Pre-Melt Mixing
One possible solution to the high melt viscosity of thermoplastics is found by mixing the
solid thermoplastic material with the reinforcement material before melting and consolidation.
The advantage of this is that the distance the melted matrix must travel to coat the fiber is
lowered. The extension of this is what solid form should the thermoplastic resin take to minimize
the distance and give the best possible impregnation results.
Powder impregnation has been used as early as 1973 [14]. This method involves pulling
bundles of fibers in tows through a resevoir of thermpolastic powder. The powder can be either
dry or in an aqueous solution or slurry depending on the process. The advantage coating fibers
with powdered resin is that the flow of thermplastic will now be parallel to the fiber tows as
opposed to transverse, giving good impregnation results. This arises from the fact that
permeability is generally at a minimum one order of magnitude less in the transverse direction
when compared to the parallel fiber direction [14]. Another obvious advantage arises from the
fact that the viscosity of the melted resin is less of an issue during the impregnation process. This
allows higher temperature thermoplastics to be impregnated in the systems. BASF claimed in the
late 1980s to be able, by using powder impregnation methods, to create composites with PEEK
[2]. Some other possiblities that arise with powder impregenations is the option of multiple
thermopolastic polymers being used. Recent research has gone into finding cost-effective
methods of combining multiple polymer systems into one finished composite [15].
Some challenges involved with powder impregnation arise from fully impregnated the
fiber tows. This has been achieved, in some cases, by including several pin rollers in the
reservoir of resin powder. In the pin rolling process, fiber tows are drawn over the pins, opening

12
the fiber tows and allowing powder between the filaments as well as adding pressure to force the
resin between the fibers. Polymer particles diamaters should be smaller than the reinfocment
fibers. However, due to production costs associated with producing particles that small, this
option is normally not available. For example, it has been found that having the thermoplastic be
of the same diameter as the fibers could increase the production cost of resin by as much as 50%.
It has been generally found that using powders with 15 – 150 µm diameters have produced good
results [14]. Achieving the correct fiber volume fraction of during this process can also cause
problems for manufacturers, leading to research into the correct number of pins, tension of fibers
and form the powder takes, either dry, wet, or slurry.
The final step of powder impregnation is dependent on the desired performance or
production method of the composite. The impregnated fiber tows can be heated, allowing the
resin to melt and coat the fibers. The fiber tows are then dried and chopped to produce pellets of
pre-impregnated composite material for production. This creates a pelletized material that can be
more rapidly processed into structural components. Another option would be to form the fiber
and powder system before melting creating a powder coated tow or prepreg. This can be
problematic as well as the fibers have little strength in the transverse direction [14].
An alternative to coating the powder process would be a commingling of fibers. In this
process, the thermoplastic resin takes the form of fibers, either chopped or continuous. These
thermoplastic fibers are then twisted with the reinforcement filaments to create yarn. The yarn, of
both thermoplastic matrix and fiber reinforcement, can then be woven into fabrics as required
and then subjected to heat and pressure to produce the composite part. These fabrics are
generally drap-able and easy to handle for most geometry. A final advantage, as with the powder
process, is the distance that the thermoplastic must impregnate is minimized [8, 14].

13
One drawback to this is that the thermoplastic must first be in a fiber form before
commingling; sometimes adding to the cost of the thermoplastic manufacturing. There is also the
fear that the commingling, if not perfect, could create areas of excess resin or resin-dry areas
during the cure phase of the process. The heating and molding process must accommodate
release of air to avoid voids.
Film stacking is a final example of resin and reinforcement material before melting. The
process is easily described by its name, wherein alternating layers of resin films and
reinforcement plies are stacked to certain specifications. Once stacked, the layup is subjected to
heat and pressure to consolidate into a final prepreg sheet. The simplicity of this process makes it
attractive for laboratory use; however, long cycle times and simple geometries have kept this
from becoming a viable industrial process [14].
2.5.2 Melt Mixing
Melt mixing methods involve mixing the resin and reinforcement material above the melt
temperature of the thermoplastic. Naturally, the high viscosities of thermoplastic resins
previously discussed now become a great concern. Extrusion compounding is one of the most
common and most effective methods. The thermoplastic polymer is extruded using a single
barrel or twin screw extruder. while the reinforcement fibers are introduced. The final product is
cut to size for use in processes such as compression molding. Some drawbacks of this process
are potential damage to the fibers during extrusion, and limited fiber lengths. This restricts the
products of this process to granules or small pellets of fiber reinforced thermoplastics. These
later need to be melted for final forming [14].
14
The next evolution of the extrusion compounding process is continuous strand
impregnation. This process removes the limitations on fiber length that are caused by extrusion
processing. Resin is introduced under pressure into the reinforcement tows, which are being
drawn through a mold or die. The tows are then cooled and the final product is chopped or
possibly even wound for later processing.
The resin saturation is governed by the rate tows pass though the cross-head die or the
infusion time. However, the pressure from the extruders could also transfer into the fiber tows,
packing them and decreasing their permeability. This causes problems with fiber impregnation.
A natural progression of this limitation leads to the development of continuous strand
impregnation that is similar to a resin bath. This resin bath is generally designed with pin rollers.
Similar to aqueous or slurry powder impregnation, pin rollers flatten tows to separate filaments
and allow resin to impregnate before cooling [14].
2.5.3 Low Viscosity Precursors
As seen with melt mixing, the high viscosities of the thermoplastic resin require more
heat and pressure to fully impregnate the reinforcement fibers. This final option for mixing
thermoplastic resin and fibers removes the problem of high viscosities altogether, allowing for
conventional methods to be used with low viscosity materials.
Chain extension of thermoplastic polymers is an area researched for applying traditional
low viscosity production methods. In this case, a very low molecular weight thermoplastic resin
is used during the impregnation stage of manufacturing. The thermoplastic resin will have a
much lower viscosity, aiding in the impregnation, because of the low molecular weight. Once
impregnated, the molecular weight will be raised by the introduction of chain extensions through

15
a reagent. Low viscosity processing has been advanced by sizing the fibers with such a reagent
before impregnation [14].
Another method of lowering resin viscosity is introducing a solvent. This process of
impregnating fibers with the matrix material involves dissolving the thermoplastic into a solvent
solution. This lowers the viscosity of the resin/solvent solution, which aids in the impregnation
process. The solvent is then recovered in a later step. For example, the fibers can be dried by
leaving the fibers fully impregnated with the thermoplastic resin and degassing. Naturally,
matching a solvent with a particular thermoplastic becomes another issue. Higher performance
thermoplastics, PEEK, will generally be solvent resistant, due to its semi-crystalline structure,
rendering this process useless. However, for an amorphous thermoplastic that is easily dissolved
into a solvent, there remains the problem of completely removing the solvent from the final
system [2].
2.6. Compression Molding of Thermoplastic Composites
Compression molding is a common method of producing composite materials. The
addition of heat and pressure to a composite causes the matrix to flow, removing air and filling
the mold cavity. The process is relatively quick and can handle complex geometries, making it
especially good for the automotive industry where a quick process time is desired. However,
there are a number of factors that control the results of a compression molding process [16–18].
The heating and cooling rates of the mold are two major process parameters that must be
controlled. Time must be allowed for the mold to be brought to temperature so that the material
being processed is uniformly heated to the appropriate thermoplastic melt temperature. The
cooling rate can be even more critical to the final mechanical performance of the composite part

16
due to the formation of crystallites. Different cooling methods can be applied including air
cooling, air/water mist cooling, and dump water cooling.
The effects of pressure are also important to any composite compression molding process.
Pressure should be applied to the mold to consolidate the composite. However, a large increase
in pressure before the melt temperature could damage the mold and restrict proper flow of
materials. Pressure should also be held during the cooing cycle [16].
Anisotropy can become a problem in some thermoplastic molded parts. This is due to the
long chains of polymers becoming aligned at some point in the process and cooling too fast to
become entangled again. This problem is commonly seen in injection molding when the polymer
is aligned in the direction of injection. Movement of melting resin in compression mold can also
produce the same effect. This phenomena can cause variations in strength with preferred
directions performing better than on other angles [16]
Semi-crystalline polymers, such as Nylon and PEEK, have an added level of complexity
during compression molding cycles. As has been discussed, the advantage of compression
molding thermoplastics is the lower cycle times. However, due to the high temperatures that
these thermoplastics require to crystallize, the cooling time increases [16, 12]. These
thermoplastics are also susceptible to shrinkage, which means high pressure must be applied to
counteract this effect. It is important to have pressure applied at the moment that it transitions
back into a solid.
2.7. Tensile Strength versus Flexural Strength
Flexural testing is generally not accepted as a true test of failure strength for design
projects. This is because flexural testing generally produces higher strength results when
17
compared to standard tensile testing. This is thought to come from the stress gradient that occurs
in the flexure testing [19, 20]. However, there are a number of difficulties that arise from running
standard tensile testing on polymer composites. In order to ensure the failure occurs at the center
of the specimen in tensile testing, a dog bone coupon is generally required. This creates a
uniform stress in the center of the coupon, away from the grippers. For molded composites, this
would require a special mold and fiber preform or expensive post processing [19].
There have been attempts to predict tensile testing results from 3 and 4 point flexural
bending testing using a two-parameter Weibull model with some success [19, 21]. This requires
a large database and constructing one for these particular materials is outside the scope of this
research. For these reasons, only flexural test data will be taken into account and compared to
this work.
2.8. Nylon Composite Data from Literature
Although nylon has been used extensively for some time now, there was little direct results
from previous work that were exactly comparable to the type of composite produced in this
research. Some information could be found on aligned and discontinuous glass fiber reinforced
nylon, for example [22], but little of carbon reinforced. However, there were some examples of
flexural properties from products currently on the market, as well as, a few studies on those
products.
Fiberforge Corporation (Glenwood Springs, CO) creates aligned carbon fiber prepregs in
several polymers. A comparable product sold today by them is 65% fiber by weight and has a
quasi-isotropic layup. The strengths reported by Fiberforge show a flexural strength of 520 MPa
18
and modulus of 40 GPa [23]. As a reference, the unidirectional layup offered by Fiberforge has a
flexural strength of 1700 MPa and modulus of 190 GPa at 65% fiber by weight [24].
Another study by Thomason [25] was performed on randomly oriented glass fibers at
30% fiber by weight in nylon. The results showed a flexural strength of 286.5 MPa and flexural
modulus of 9.20 GPa. The glass used was E-type with a nominal fiber diameter of 10 microns.
The data from the literature has been compiled in Table 2.1 below.
Table 2.1: Nylon based composite data from the literature
Composite Tested Flexural Strength (MPa)
Flexural Modulus
(GPa) Fiber Forge Aligned at 65 % by weight carbon fibers [24] 1700 190
Fiber Forge Quasi-isotropic at 65 % by weight carbon fibers [23] 520 40
30 % by weight glass fibers [25] 286.5 9.2
2.9. PEEK Composite Data from Literature
The literature review showed a lack of good data from randomly oriented PEEK
composites. However, some information could be found for aligned carbon fiber PEEK
composites and laminate layups. A study published by McGrath et al. [18] indicated results for
standard, continuously reinforced PEEK composites at 68% fiber by weight. In addition to [0]16,
[0/90]4S, and [+45/90/-45/0]s laminate layups, a possible prepreg version of the PEEK composite
was tested. In this case, an aligned carbon fiber PEEK composite was ground to a specific
specification, using a “monomuncher”, two parallel shafts with teeth that rotate inward to tear
and shear the composite apart. The resulting, fragmented composite particles are then
compression molded. All samples were tested for flexural strength and modulus.

19
Although the continuously aligned laminates’ strengths and modulus values are much
higher than those thought to be attainable by the composite system produced in this thesis, the
[+45/90/-45/0]S , also known as a quasi-isotropic laminate, shows reasonably attainable values.
This system acts similarly to an isotropic material in the plane, which are the expected results
from a randomly oriented composite. The performance of the quasi-isotropic laminate should
still be higher than a randomly oriented composite because the laminate is produced from layers
of aligned fibers.
In another study by Kurokawa et al. [26], PEEK-carbon fiber extruded composites at
15% fiber by volume were tested for use in gears. As part of the work, flexural test specimens
were created and reported flexural strengths of 305 MPa and a flexural modulus of 14.3 GPa.
Naturally, at such a low volume fraction, the samples produced in this study should exceed these
values. All of these examples are summarized in Table 2.2.The flexural strength data is assumed
to be along the 0° orientation for the aligned fiber composites.
Table 2.2: PEEK based composite data from the literature
Composite Flexural Strength (MPa)
Flexural Modulus
(GPa)
UD Prepreg layup [0]16 [18] 1876 130
UD Prepreg layup [0/90]4s [18] 1163 68.8
UD Prepreg layup [+45/90/-45/0]s [18] 616 40.9
Ground UD - 3mm [18] 439 33.5
15% Carbon Fiber by Volume [26] 305 14.3

20
2.10. Other Comparable Composite Strengths
Sheet molding compounds (SMC) are a quick and cheap solution to cutting down
production times for thermosetting composites. Used often in the automotive industry, these are
thermosetting vinyl esters with either short glass or carbon fibers added. The mixture is then
placed in a mold and compressed with heat to form products. Quantum Composites (Bay City,
MI) has several products currently available at high carbon fiber weight percent. A 53% by
weight carbon fiber SMC product has a flexural strength of 421 MPa and flexural modulus of
26.2 GPa [27].
Lu [6] performed flexural testing on composites made with the same wet lay process
containing different polymers. In his research, carbon fiber filled PET at about 0.34 fiber volume
fraction had a flexural strength of 240 MPa and a flexural modulus of 22 GPa.
Caba [28] also performed similar studies with carbon fiber in PET and PP. The results
indicated that a carbon PP based composite at 0.36 fiber volume fraction produced a flexural
strength of 138.7 MPa and flexural modulus of 11.1 Gpa.
Finally, from unpublished data, the same papermaking process was used to create nylon
based composites but with reclaimed carbon fiber. In this case, an average flexural strength of
205 MPa and average flexural modulus of 17 GPa was reported at 0.347 fiber volume fraction.
2.11. Calculating Volume Fraction from Weight Fractions
In this thesis a fiber volume fraction will always be given for comparison. However,
during production, mass measurements are used to mix materials. Equation 2.1 below can be
used to convert between fiber volume fraction and fiber weight percent:

21
+, =./0∙023
./0∙0234(67./)∙02/ (2.1)
Where +, is volume fraction of fiber, 9, is weight fraction of fiber, :; is density of the
matrix material and :, is the density of the reinforcement fibers.
2.12. Scanning Electron Microscopy
Due to the ease of sample preparation, good resolution and high depth of field, scanning
electron microscopy (SEM) has become a very popular method of studying fracture surfaces. In
SEM, a focused electron beam is swept across a solid object, producing a number of responses.
One effect of this beam is the release of secondary electrons, coming from the inelastic excitation
of the electrons on the specimen’s surface. These secondary electrons have energies in the range
of 1-50 eV. Because electron movement is limited in air, the testing chamber is run under a
vacuum [29].
Failure in short-fiber reinforced semi-crystalline thermoplastics can be seen in several
examples in the literature. In the study, the failure of short fiber composites was shown to depend
on fiber orientation and environmental conditions. It was found in short glass fiber filled PET
composites that fibers are aligned parallel to fracture planes. This type of failure is attributed to
de-bonding between the fibers and matrix due to poor adhesion. This was indicated by clean
fiber surfaces in the case of poor adhesion and rough surfaces in cases with good adhesion. The
rough fiber surfaces were created by remains of matrix material on the fiber surface, indicating
that the failure was due to the matrix and not the fiber matrix interface. In the same composite
systems, but with loading transverse to the fracture plane, other mechanisms become responsible
22
for crack propagations. Shear loading can cause de-bonding of the fibers and matrix leading to
fiber pull out. Furthermore, high stress concentrations at fiber ends can also lead to crack
initiation and failure.
Roulin-Moloney et al. and Purslow et al. [29, 30] performed fracture surface investigations
for glass filled PEEK. Failures were seen around fiber ends at temperatures less than 90°C and
low loading rates. Failures occur following ductile matrix failure after fiber failures or from the
matrix crack growth around fiber ends. The same failure can be found following brittle matrix
failure with higher loading rates.
As these samples will be loaded in flexure at room temperature, there will be some
differences between the results found in this and other literature sources [30]. However, two
things should be observed on the fracture surfaces: fiber ends and matrix surfaces. Clean fiber
pullout with no cracking would indicate poor bonding between fibers and matrix material.
23
Chapter 3. Panels and Materials Tested
This section introduces the panels produced and the materials used in the production. The
panels tested, shown in Section 3.1, lists the number of panels used in flexural testing, not the
total number of panels produced. Section 3.2 follows with a full description of the materials used
in the production process.
3.1. Panels Tested
During this study, 15 panels were produced for testing and are listed in Table 3.1 and Table
3.2 below. The panel number field indicates the universal label of the panel, numbered
sequentially by time produced with no regard for material or specifications. The tables also
indicate the target fiber volume fraction and fiber weight fraction used in production. This
indicates the amount of reinforcement and matrix material used in the process outlined in the
following chapter. The tables have been ordered by target fiber volume fraction. These volume
fractions were chosen to represent a collection of the composites for a range of volume fractions.
Although there were more panels produced, not all were included in flexural testing and
have not been included in this thesis.

24
Table 3.1: Nylon based panels produced for testing
Panel # Material Target Fiber Volume Fraction
Target Fiber Weight Fraction
011 Nylon 0.312 0.417 021 Nylon 0.340 0.449 022 Nylon 0.358 0.468 008 Nylon 0.369 0.480 009 Nylon 0.369 0.480 006 Nylon 0.410 0.523 004 Nylon 0.410 0.523 003 Nylon 0.410 0.523 007 Nylon 0.410 0.523 012 Nylon 0.425 0.539
Table 3.2: PEEK based panels produced for testing
Panel Material Target Volume Fraction
Target Fiber Weight Fraction
025 PEEK 0.330 0.405 023 PEEK 0.341 0.417 013 PEEK 0.390 0.470 026 PEEK 0.410 0.490 010 PEEK 0.440 0.521
3.2. Materials Used
3.2.1 Reinforcing Fibers
The carbon fibers used in this study were Toray T700S-C-50-C. The fibers were chopped
to 25 mm and were provided by Crosslink Technologies (Nebraska) [31]. They were delivered
without modification to sizing or surface chemistry. The manufacturer’s data sheet for these
fibers claims a tensile strength of 4900 MPa and a tensile modulus of 230 MPa. The density was
reported as 1.80 g/cm3. The data sheet also noted that the general-purpose sizing used on these
fibers performs well for epoxy, phenolic, polyester, and vinyl ester resins.

25
3.2.2 Thermoplastic Matrix
The thermoplastic nylon used was supplied from Minifibers, Inc (Johnson City,
Tennessee). The Nylon 6,6 was described as regular tenacity nylon. It was roughly cut to 6.25
mm (0.25 inches) and was 3.0 dpf filament size. From the manufacture’s data sheet, the nylon
had a density of 1.14 g/cm3, a breaking tenacity of 2.3-6.0 gpd, and a melting temperature
between 244°C and 260°C [32].
The thermoplastic PEEK was supplied from Zyex Ltd. (United Kingdom). The information
came from both Zyex Ltd website [33] and through contact with company representatives. It was
cut form stretched, oriented multifilament yarn. The density was reported as 1.3 g/cm3. The glass
transition temperature was reported as 143°C with a melting temp of 343°C. The tensile strength
of the material was stated as 600 MPa.
3.2.3 White Water
The white water was a water-based solution with thickener, surfactant and anti-foam
added. The materials and properties are given in the sections below.
3.2.3.1 Thickener
The thickener used was Nalco 7590. The information sheet provided by Nalco Company
(Naperville, Illinois) indicated that this particular thickener could increase drainage, improve
formation of mats and showed good retention of sizing agents. The thickener was an opaque
white color and had a density of 1.03 - 1.07 g/cm3. This sometimes made it difficult weigh
properly.
26
3.2.3.2 Surfactant
Rhodameen VP-532/SPB was used as the surfactant and was provided, as a free sample,
from Rhodia. However, this company was purchased by Solvay who provided the second free
sample. Rhodameen is a mixture of 20-23 %wt Tallow Amine and 77-80%wt water. The mixture
is a viscous liquid, is water soluble and slightly yellow. The specific gravity is 1.01 at 25 C.
While the Rhodameen was unavailable, a solution of its componets was mixed in house.
The tallow ammine was ordered from Chem Service Inc. under the name POE (15) tallow amine
(CAS: 61791-26-2). The data sheet gave the density as 0.966 g/cm3. The tallow amine was
amber colored at room temperature and, due to it being only slightly soluble in water, was
difficult to mix properly to form the surfactant.
3.2.3.3 Anti-Foam
This chemical was also provided by Nalco and was called PP06-3586. The off-white liquid
had a mild odor and a density of 0.994 g/cm3. The information sheet indicated that it was
dispersible in water.
3.2.4 Mold Release
There were two mold release agents used depending on the thermoplastic being processed.
In both cases, the mold release was delivered as an aerosol and sprayed on the mold before
closing at room temperature. Due to the nature of the mold being used and the large volume of
the dry fibers before processing, it was impossible to apply the mold release to a heated mold.

27
The mold release used for the nylon based panels was MS-122AD from Miller-Stephenson
(Danbury, Connecticut). This was a PTFE based mold release that indicated good results in
previous work performed. The release agent sprayed on as a milky white liquid, slightly visible
on the mold surface. The density was given as 1.2 g/cm3.
Because of the toughness of the PEEK, an alternative mold release was ordered from Miller
Stephenson, MS-K1206A. This Boron Nitride release agent was slightly harder to handle,
spraying on as a white powder at room temperature. The density was given as 1.38 g/cc.
Although working marginally better than MS-122AD on PEEK panels, the mold release seemed
mostly ineffective, leaving PEEK residue on the surface of the mold.

28
Chapter 4. Production of Test Composite Plates
The production of composite plates was a multi-step process limited by equipment size and
availability. Due to these constraints, there was some unavoidable variation in the process from
panel to panel. However, special attention and care was taken to remove most of these small
changes and to produce panels using the same method every time. The overall process remains
the same for all panels apart from changes in processing temperature and mold release due to the
thermoplastic being used.
In all cases, the overall method can be seen in Figure 4-1.The specific fiber volume fraction
for each panel was used to calculate, using equation (2.1), the weight of matrix and
reinforcement fibers to be added during the mixing step. For this chapter, no specific amounts of
fibers are mentioned and the exact amounts of fibers used for each respective plate are included
in the Appendix.
Figure 4-1: Overview of production method used in panel production
4.1. White Water
For each 15.24 cm square panel produced, 20 L of white water were required. The pulper
used was a FORMAX Malestrom 8 L laboratory pulper, shown in Figure 4-2, from the
Adirondack Machine Corporation (Queensbury, NY). Due to the limited size of the pulper, the
white water was mixed in 5 L batches and stored in two, 10 L plastic buckets with lids. The
White!Water Mixing Water!Removal Drying Molding!
PreperationCompression!Molding

29
amount of materials used per 5 L batch by weight is given in Table 4.1. Each material batch was
mixed for 5 minutes at 600 rpm and then stored in one 10 L plastic bucket.
Table 4.1 Materials used for white water
Material Amount Thickener 1.25 g Surfactant 1.25 g Anti-Foam 0.49 g
For a given panel, all 20 L of white water was mixed continuously to ensure the same
consistency. As the thickener used appeared to be extremely hydrophobic, a batch of white water
was used within 2 days of mixing. This ensured the thickener was still properly mixed for the
fibrous mat production.
4.2. Mixing
Fibrous mats were produced using a semi-automatic sheet former. The FORMAX semi-
automatic sheet former was model number G-300W also from the Adirondack Machine
Corporation. Again, the number of batches was controlled by the size of the pulper. For all of the
mats produced, 4 L of white water were placed in the pulper and stirred for several seconds to
ensure no thickener had collected out of solution. The thermoplastic fiber was measured out and
added directly to the white water. The mixture was allowed to mix at 250 rpm until the
thermoplastic had dispersed throughout the solution.

30
Figure 4-2: FORMAX maelstrom 8 L pulper
In the same way, the carbon fiber was weighed and added to the mixture. The carbon fiber
immediately clumped together on the lower rpm setting. The mixing speed was then increased to
600 rpm and run for 10 minutes to allow the carbon fiber to properly disperse in the white water.
After 10 minutes, the mixture was collected and transferred to the sheet former. From
observations, white water that was lacking surfactant or that was improperly mixed resulted in
fiber agglomeration or fiber collection surface of the solution. This was noted specifically for
one panel and is discussed in the Chapter 7.
4.3. Water Removal
The sheet former, shown in Figure 4-3, allows for 5 batches of solution to be added at
once. Each successive batch of solution is poured over the next and allowed to sit while the
successive ones are being mixed. Once the 5 batches have been added, the remaining volume in

31
the deckle box is filled with tap water. The full deckle box can be seen in Figure 4-4. The
mixture is then agitated for 30 seconds. During this time, air is introduced at 12 points around the
base of the deckle box. The resulting air bubbles travel up through the solution, agitating the
fibers and attempting to disperse them evenly in the box. After 30 seconds of agitation, the
solution is allowed to sit for 3 seconds and then the drop leg valve was opened. Water is
removed through the drain while the fibers collect on the 30.45 cm square forming wire. Once
done, the deckle box is removed and the mat is couched using an air bladder to remove
additional moisture. Two blotter sheets are added between the mat and the bladder to absorb
further moisture.
Figure 4-3: Formax sheet former. Shown with deckle box and couching plate rotated up

32
Figure 4-4: Thermoplastic and carbon fibers mixed with white water in deckle box
Figure 4-5: Fibrous mat after couching step
This process results in a damp, fibrous mat of both carbon fibers and thermoplastic fibers, shown
in Figure 4-5. The mat is 30.54 cm square. It is then removed from the forming wire and blotter
sheets are placed above and below.
4.4. Drying
The mats were then removed from the sheet former and allowed to air dry on an open lab
table. In order to minimize the number of reinforcement and matrix fibers, the blotter sheets were

33
allowed to remain on the mats while they air-dried. The wet blotter sheets creased and yellowed,
allowing the fibers to easily pull away. The mats were deemed sufficiently dried when the blotter
sheets could be removed. In some circumstances, a heat gun was used to decrease the drying
time and aid in the removal of the blotter sheets from the damp mats. Once sufficiently dried, the
blotter sheets are easily removed, taking extra precaution to ensure no fibers are pulled away
from the mat.
At that point, only the fiber network loosely held the mat together. This made handling
the mat difficult as lightweight fibers are easily pulled from the surface. The mats were carefully
transferred to a large air-convection oven. Nylon based mats were placed on porous Teflon
sheets while PEEK based mats were placed on aluminum foil covered with a light layer of mold
release. The oven temperature was set to the respective thermoplastic melting temperature and
allowed to heat. Once the desired temperature was reached for 5 minutes, the oven was opened
and the mats were checked. Indications that the mat has properly dried include slight variations
in color, visible spheres of resin and a “stiffer” feel to the mat.
Some variation in this process was observed for all panels made. Hot spots in the oven
were found to create regions of some mats that would be over heated, indicated by large areas of
color change and brittle areas.
4.5. Molding Preparation
Once dried, the mats were quartered using a fabric cutter. The mats were cut on a
polyethylene surface. Moderate pressure was required to cut through the carbon fibers,
sometimes resulting in lose of fibers on the cutting surface. The resulting, 4 smaller mats are
34
each about 15.24 cm square. These are collected and placed in a plastic bag until mold assembly
is ready.
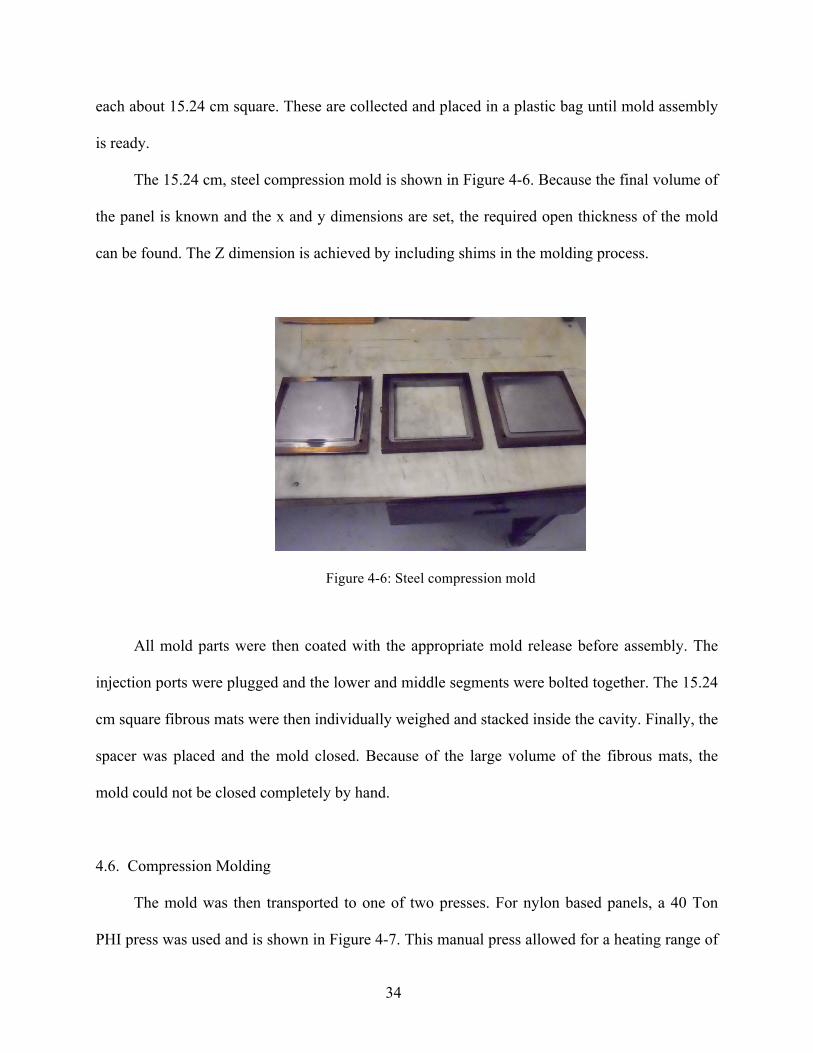
The 15.24 cm, steel compression mold is shown in Figure 4-6. Because the final volume of
the panel is known and the x and y dimensions are set, the required open thickness of the mold
can be found. The Z dimension is achieved by including shims in the molding process.
Figure 4-6: Steel compression mold
All mold parts were then coated with the appropriate mold release before assembly. The
injection ports were plugged and the lower and middle segments were bolted together. The 15.24
cm square fibrous mats were then individually weighed and stacked inside the cavity. Finally, the
spacer was placed and the mold closed. Because of the large volume of the fibrous mats, the
mold could not be closed completely by hand.
4.6. Compression Molding
The mold was then transported to one of two presses. For nylon based panels, a 40 Ton
PHI press was used and is shown in Figure 4-7. This manual press allowed for a heating range of

35
up to 315° C, well within the range for the materials used. For PEEK based panels, a large 140
Ton TMP press was used, allowing for temperatures of up to 427° C. This press is shown in
Figure 4-8.
For all materials, the mold is placed on the cold platen surface. The press is closed and a
force of 20 kN is applied. This ensures the mold is properly aligned and the material is contained
within. This pressure is held constant while the temperature is increased to the melting
temperature of the thermoplastic being used. The ramp rate is set at the maximum allowed or
possible by the press. A portable type-k thermocouple was placed on a small port on the mold to
indicate the temperature of the mold itself. This thermocouple was used as the driving
temperature of the process, not the platen temperature reading of the press itself.
Figure 4-7: PHI press used in molding nylon based panels

36
Figure 4-8: TMP press used for molding PEEK based panels
Once, the melting temperature of the material was reached, also indicated by a drop in force
as the material compressed, the press was set to 200-250 kN. The mold closed easily and was
allowed to sit under pressure at the melt temperature for 10 minutes. In the case of nylon based
panels, some nylon always leaked out of the mold.
Once the panel was processed at melting temperature and 250 kN of force for 10 minutes,
the heating was turned off and the mold allowed to cool under pressure. For both presses, forced
cooling was implemented. In the case of the manual PHI press, a large fan was placed in front of
the mold. The larger, TMP press included forced air cooling within the platens as well as
air/water mist cooling and flood water cooling at lower temperatures.

37
Chapter 5. Testing
5.1. Flexural Testing
The flexural testing was done according to ASTM 6272: Standard Test Method for
Flexural Properties of Unreinforced and Reinforced Plastics. For all panels, coupons were cut
using a diamond-tipped, circular wet saw mounted on a table. Coupons were cut according to the
ASTM standard with most being 60 mm x 12.8 mm. However, due to the inaccuracy of the wet
saw, the coupon widths varied by 0.50 mm.
After being cut, all coupons were dried using a paper towel or heat gun. The heat gun was
set to relatively high temperatures, between 400°F – 500°F. However, it was only used indirectly
on the coupons. The heat gun became necessary to dry the nylon samples, which the literature
review revealed absorb water. After being cut all coupons were allowed to dry for at least one
day before being tested. Special care was taken to label all coupons with the correct plate
number, coupon number, and in the case of same panels, the local material direction. The width
and depth measurements of all coupons were taken using electronic calipers and recorded.
Loading and support spans for the 4-point bending tests were calculated using the ASTM
standard. The support and loading spans are given in the Table 5.1 as well as the number of test
coupons. Once run, Equations 5.1 and 5.2 were used to convert the load – displacement curves to
stress-strain curves:
<, ==>?@ABC
(5.1)
D, =EFBGC
(5.2)

38
Where < is flexural stress, P is load, S is support span, b is with of test specimen, d is
depth of specimen and D is maximum deflection at center of the beam. The maximum flexural
stress could then be found as the highest stress value recorded before failure. The flexural
strength was found by finding the slope of the initial portion of the stress-strain curve.
Table 5.1: Specifications of flexural testing
Panel Support Span (mm)
Load Span (mm)
Load Rate (mm/min) Samples Tested
003 26.09 12.48 0.77 10* 004 25.4 12.7 0.70 10* 006 25.4 8.47 0.78 10* 007 25.4 8.47 0.78 10* 008 26.4 8.8 0.73 10* 009 25.4 8.47 0.74 10* 010 25.4 8.47 0.71 5 011 25.4 8.47 0.79 10* 012 25.4 8.47 0.77 10* 013 25.4 8.47 0.74 5 021 25.4 8.47 0.76 5 022 25.4 8.47 0.78 5 023 25.4 8.47 0.77 5 025 25.4 8.47 0.80 5 026 25.4 8.47 0.78 5
* starred panels included two sets of 5 coupons orthogonal to the other.
In order to consistently find the flexural strength and flexural modulus from the data, a
MATLAB code, given in the appendix, was written and implemented to process the raw data.
5.2. Adjusted Fiber Volume Fractions
Because carbon fibers were used as the reinforcement, no burn off tests were possible to
discover the actual fiber volume fraction. Acid digestion tests could have been implemented,

39
however, due to the cost and dangers associated, these tests were also ruled out. As a method to
discover the average “adjusted” fiber volume fraction of the panels, the final depth of the panel
sufficed. It was assumed that the only material loss during the compression-molding step would
be matrix. By using this assumption, the adjusted fiber volume fraction could be calculated by
using known fiber weight use in production and the final volume of the panel. The volume of the
panel was found by multiplying the know area, 232.3 cm2, by the measured thickness. The
adjusted fiber volume fraction can then be found by using the following equation:
+,,H =I/0×0B0
K6.M6K (5.3)
where Mf is the total mass in grams of carbon fiber in the plate and d is the depth in mm
of the final panel. The constant 41.814 comes from a collection of constants and conversions.
5.3. Processing
For all methods of production, extensive notes were kept to locate all sources of error and to
indicate the practicality of the production method. This included all materials mixed to create
white water and fibrous mats. The fibrous mats were weighed before the compression-molding
step. During the molding stage, regular time, temperature and pressure measurements were
recorded. These results will take the form of possibly sources of error during the production and
testing of these composite panels.

40
5.4. Microscopy
Selected coupons were observed using a high vacuum scanning electron microscope. These
were selected to give images of coupons with a range of materials, performance, or interesting
phenomena. Twelve coupons were studied under high magnification to gain insight from their
surfaces. This included looking for voids that may appear, bundles of aligned fibers, interesting
fracture areas, and bonding between reinforcement and matrix. The panels tested are listed in
Table 5.2.
Table 5.2: Sample coupons used for SEM microscopy
Panels Coupons 004 06 007 01, 03 012 06 010 03, 05 013 01, 02 023 02, 04

41
Chapter 6. Results
This chapter reports the results and observations of the production and testing of panels. The
volume fraction, flexural strength, flexural modulus, and microscopy results follow. A more
detailed discussion of the results follows in Chapter 7.
6.1. Fiber volume fraction
Through the production process, the fiber volume fraction tended to increase when
comparing the predicted versus final adjusted volume fraction values. The volume fraction
results for nylon and PEEK based panels can be seen in Table 6.1 and Table 6.2. The target
volume fraction indicates the material amounts that were used in the production of the panels.
The final depth was the measured depth before flexural testing and from that; the adjusted
average volume fraction calculated using the equation given in Chapter 5. The percent change is
the percentage increase or decrease between the target and final volume fraction.
Table 6.1: Predicted versus final calculated fiber volume fraction for nylon based panels
Panel Material Target Volume Fraction
Final Depth
Adjusted Average Volume Fraction
Percent Change
011 Nylon 0.312 0.51 0.325 0.042 021 Nylon 0.340 0.53 0.349 0.026 022 Nylon 0.358 0.54 0.365 0.020 008 Nylon 0.369 0.76 0.329 -0.108 009 Nylon 0.369 0.60 0.362 -0.019 006 Nylon 0.410 0.55 0.415 0.013 004 Nylon 0.410 0.57 0.410 - 003 Nylon 0.410 0.56 0.412 0.005 007 Nylon 0.410 0.56 0.412 0.005 012 Nylon 0.425 0.57 0.425 -
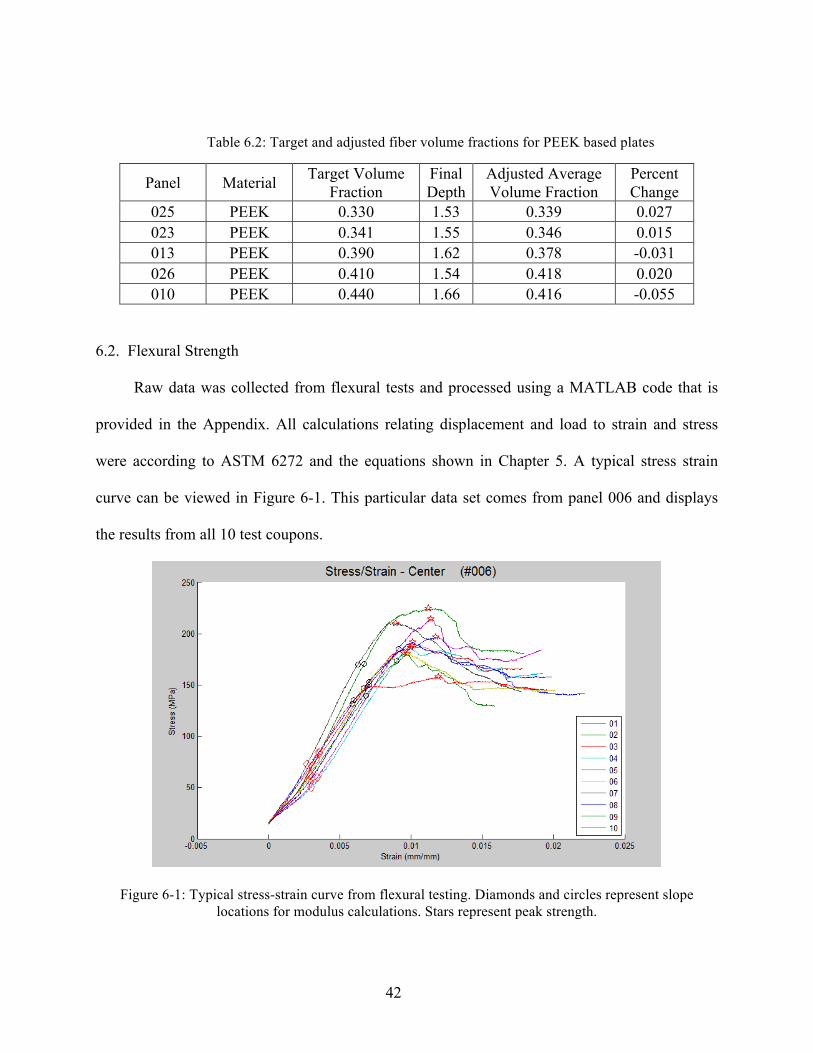
42
Table 6.2: Target and adjusted fiber volume fractions for PEEK based plates
Panel Material Target Volume Fraction
Final Depth
Adjusted Average Volume Fraction
Percent Change
025 PEEK 0.330 1.53 0.339 0.027 023 PEEK 0.341 1.55 0.346 0.015 013 PEEK 0.390 1.62 0.378 -0.031 026 PEEK 0.410 1.54 0.418 0.020 010 PEEK 0.440 1.66 0.416 -0.055
6.2. Flexural Strength
Raw data was collected from flexural tests and processed using a MATLAB code that is
provided in the Appendix. All calculations relating displacement and load to strain and stress
were according to ASTM 6272 and the equations shown in Chapter 5. A typical stress strain
curve can be viewed in Figure 6-1. This particular data set comes from panel 006 and displays
the results from all 10 test coupons.
Figure 6-1: Typical stress-strain curve from flexural testing. Diamonds and circles represent slope locations for modulus calculations. Stars represent peak strength.

43
The strengths and adjusted volume fractions of the nylon based panels are shown in Table
6.3 and Figure 6-2 with the standard deviations for each individual panel’s coupons. The
standard deviation represents the variation in data from the coupons tested for each panel.
Table 6.3: Flexural strength results for nylon based panels
Panel Adjusted Volume Fraction
Flexural Strength (MPa)
Std. Dev (MPa)
011 0.325 217.84 23.49 021 0.349 167.65 16.00 022 0.365 202.73 11.69 008 0.329 188.60 14.13 009 0.362 193.35 21.57 006 0.415 193.12 19.38 004 0.410 315.53 43.98 003 0.412 327.15 32.55 007 0.412 365.74 54.18 012 0.425 206.58 29.82
Figure 6-2: Flexural strength results for Nylon based panels
0
50
100
150
200
250
300
350
400
450
0.250 0.300 0.350 0.400 0.450 0.500
Flex
ural
Stre
ngth
(MPa
)
Adjusted Fiber Volume Fraction

44
The results for the PEEK based panels are shown in Table 6.4 and Figure 6-3 and are
presented in the same manner as the nylon based panel data.
Table 6.4: Flexural strength results for PEEK based panels
Panel Adjusted Volume Fraction
Flexural Strength (MPa)
Std. Dev (MPa)
025 0.339 532.82 34.77 023 0.346 640.39 53.51 013 0.378 553.63 66.04 026 0.418 542.39 37.39 010 0.416 619.72 82.34
Figure 6-3: Flexural strength results for PEEK based panels
6.3. Flexural Modulus
The same data from the flexural testing was again processed in a MATLAB code. A linear
curve fit was used on the initial increase of the stress-strain curve to determine the flexural
modulus. The curve fit was performed on each set of data multiple times to find the best fit. The
0
100
200
300
400
500
600
700
800
0.250 0.300 0.350 0.400 0.450 0.500
Flex
ural
Stre
ngth
(MPa
)
Adjusted Fiber Volume Fraction
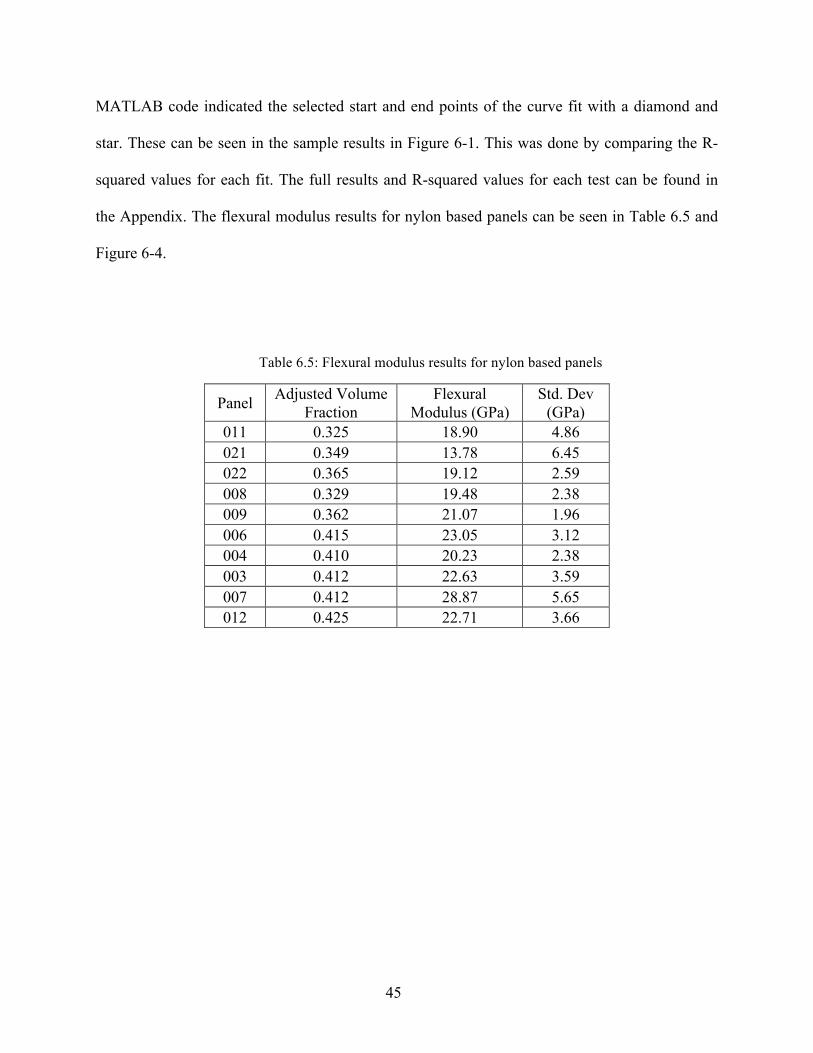
45
MATLAB code indicated the selected start and end points of the curve fit with a diamond and
star. These can be seen in the sample results in Figure 6-1. This was done by comparing the R-
squared values for each fit. The full results and R-squared values for each test can be found in
the Appendix. The flexural modulus results for nylon based panels can be seen in Table 6.5 and
Figure 6-4.
Table 6.5: Flexural modulus results for nylon based panels
Panel Adjusted Volume Fraction
Flexural Modulus (GPa)
Std. Dev (GPa)
011 0.325 18.90 4.86 021 0.349 13.78 6.45 022 0.365 19.12 2.59 008 0.329 19.48 2.38 009 0.362 21.07 1.96 006 0.415 23.05 3.12 004 0.410 20.23 2.38 003 0.412 22.63 3.59 007 0.412 28.87 5.65 012 0.425 22.71 3.66

46
Figure 6-4: Flexural modulus results for nylon based panels
The flexural modulus results for PEEK based panels can be seen below in Figure 6-5 and
Table 6.6 and are found and displayed in the same was as described for the nylon based panels.
Table 6.6: Flexural modulus results for PEEK based panels
Panel Adjusted Volume Fraction
Flexural Modulus (Gpa)
Std. Dev (GPa)
025 0.339 24.81 3.49 023 0.346 30.24 3.17 013 0.378 30.47 4.68 026 0.418 31.27 3.48 010 0.416 28.95 7.93
0.00
5.00
10.00
15.00
20.00
25.00
30.00
35.00
40.00
0.250 0.300 0.350 0.400 0.450 0.500
Flex
ural
Mod
ulus
(GPa
)
Adjusted Fiber Volume Fraction

47
Figure 6-5: Flexural modulus results for PEEK based panels
6.4. Planar Isotropy
As discussed in Chapter 5, this production method should result in in-plane isotropic
material properties. In an attempt to validate that this was indeed the case, several nylon based
panels were tested in two directions. In these cases, ten total flexural testing coupons were cut,
five being orthogonal to the remaining five. Comparison of all ten coupons could show
variations in the performance based on two directions.
Table 6.7 shows the flexural testing results for each coupon sample from panel 007, the only
panel that showed a strong directional dependence. In Table 6.7, the strengths and moduli are
given as two directions, 0° and 90°. These degree values should only be considered relative to
each other and not to the panel as a whole or connected to any part of the production method.
The data presented in Table 6.7 shows that the flexural strength in the 0° direction had an
average value of 410.21 MPa, 89 MPa higher than the average in the 90° direction at 321.26
0
5
10
15
20
25
30
35
40
0.250 0.300 0.350 0.400 0.450 0.500
Flex
ural
Mod
ulus
(GPa
)
Adjusted Fiber Volume Fraction

48
MPa. The flexural modulus also showed marginally better results in the 0° direction at 33.69
GPa compared to 24.04 GPa in the 90° direction.
Table 6.7: Flexural testing results for panel 007
Panel-Coupon Relative Orientation
Flexural Stress (MPa)
Flexural Modulus (GPa)
007-01 0° 416.65 36.26 007-02 0° 344.21 28.82 007-03 0° 433.66 35.02 007-04 0° 416.63 31.79 007-05 0° 439.92 36.57
007-06 90° 301.27 21.92 007-07 90° 325.55 25.83 007-08 90° 317.12 25.59 007-09 90° 323.12 23.40 007-10 90° 339.22 23.47
6.5. Microscopy
A scanning electron microscope was used at high vacuum to take micrographs of the
surface of selected sample coupons. No attempt was made to look at morphology or the degree
of crystallinity of the thermoplastics; however, some insights can be gained by looking at fiber
orientation and overall cracking. All test coupons were photographed after flexural testing had
been completed.
The first noticeable observation from the SEM images was to look for easily definably
layers from the manufacturing process. This can be seen in Figure 6-6, an edge view of a coupon
from panel 012, a nylon based panel. These layers appear to be vertical lines on the image. The
individual mats that are stacked and then consolidated probably caused this. The image also
shows good consolidation with no apparent voids. To the right of the image, a small pit can be

49
seen, and is indicated, on what would be the large face of the panel. This could be caused by
poor resin flow or a problem with the mold release on the surface of the mold.
Figure 6-6: Photomicrograph of panel 012 coupon 06 (Nylon). Surface pit circled in black.
Figure 6-7 shows another edge view of the surface of a test coupon, this one from panel
13, coupon 1, which was a PEEK based panel. Again, the consolidation looks good along with a
good randomization of fiber directions. Fibers appear to be covered well with thermoplastic with
no apparent voids visible. The glowing white areas in the images are polymer areas that are
becoming “charged.” This occurs in poorly conductive materials and represents a buildup of
negative charge.

50
Figure 6-7: Photomicrograph of panel 13 coupon 1 (PEEK)
Figure 6-8: Photomicrograph of panel 007 coupon 1 (Nylon)
Figure 6-8 again shows good consolidation but shows some collections of aligned fibers. This
image is from the nylon based panel 007, coupon 1. A detail of the cracking surface of the same

51
panel and coupon is shown in Figure 6-9. The crack was probably allowed to grow easily by the
alignment of the fibers near the surface of the panel.
Figure 6-9: Photomicrograph of panel 007 coupon 1 (Nylon)
The images below in Figure 6-10 and Figure 6-11 show both good and poor bonding of matrix to
fibers. Both of these panels 023 and 013 were both PEEK based panels. The crack shown in
Figure 6.10 shows fibers that still appear to be bonded with some thermoplastic. However, in
Figure 6-11, the carbon fibers appear to have pulled clean from the matrix material, clearly
causing a weak area in the composite.
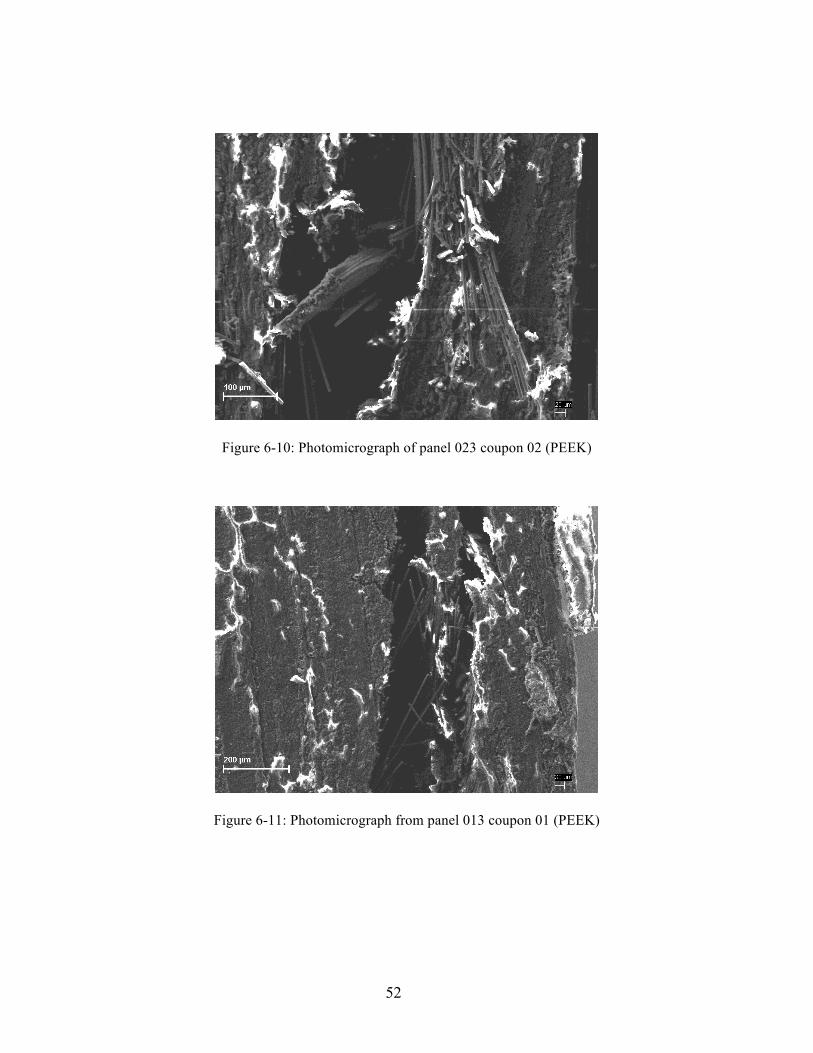
52
Figure 6-10: Photomicrograph of panel 023 coupon 02 (PEEK)
Figure 6-11: Photomicrograph from panel 013 coupon 01 (PEEK)

53
Figure 6-12: Photomicrograph of panel 007 coupon 01 (Nylon)
The image in Figure 6-12 shows repeated lines that are thought to be left from the cutting
process. Finally, in Figure 6-13, another failure surface can be seen with larger, unconnected
voids opening up through the thickness of the coupon.
Figure 6-13: Photomicrograph of Panel 004 coupon 6 (Nylon). Shows failure surface (washed out scale bar reads 100 µm)
54
Chapter 7. Discussion
7.1. Fiber Volume Fraction
Overall, a comparison of the target fiber volume fraction to the final calculated fractions
only shows slight increases in Table 6.1 and Table 6.2. This is good from a manufacturing
perspective, making it easy to attain a particular volume fraction through production. The slight
increases can be attributed to the shrinkage inherent in thermoplastics and which was mentioned
in Chapter 2. The slight shrinkage in volume increases the volume fraction of carbon fiber
present in the panels. Panels 008, 009, 010, and 013 all showed decreases in their respective fiber
volume fractions due to their large final depth measurements. This would indicate a lack of
consolidation during the molding process, however, there was no correlation between these
panels and lowered flexural properties.
7.2. Comparison of Flexural Strength
A direct comparison between the nylon and PEEK composites confirms the strength
benefits of the more expensive PEEK. The flexural strength results in Table 6.3 and Table 6.4
show that the PEEK flexural strength performance is easily 300 MPa greater than nylon.
Comparing the results of only the nylon panels, the data seems to move away from the
expected. From previous work, a peak value of flexural strength should be present somewhere in
the range of fiber volume fractions tested. However, Figure 6-2 does not show any particular
trend. There appears to be a maximum strength around 0.42 fiber volume fraction, or 0.53 fiber
weight fraction, at 365.7 MPa. However, panels 006 and 012, which are around the same volume
fraction as panels 004, 003, and 007, show much lower performance at closer to 200 MPa.

55
A performance comparison of the current study’s nylon based panels to those found in the
literature is shown in Figure 7-1. Clearly, the nylon and PEEK provides an increase in strength
over the PET of Lu’s research. However, the comparison to Fiber Forge’s quasi-isotropic layup
is somewhat disappointing, falling well below. However, a continuously aligned layup, even in a
quasi-isotropic layup would give a definite strength advantages over the truly randomly oriented
fiber alignment used in the current study, in this case over 155 MPa improved flexural strength.
Finally, the continuously aligned Fiberforge material was expected and did outperform the
current study, in this case by 4.5 times the flexural strength.
Figure 7-1: Comparison of Nylon based panel’s flexural strength in current study with literature results. Source of information showed in brackets. Dotted line references current study.
The PEEK panel’s flexural strength results also show no indication of a peak fiber volume
fraction in the range tested. The strength values displayed graphically in Figure 6-3 show
0
200
400
600
800
1000
1200
1400
1600
1800
65 % Weight Carbon Aligned - Nylon
[24]
65% Weight Carbon Quasi-isotropic - Nylon
[23]
30% Weight Glass Random - Nylon
[25]
53% Weight Carbon Random - Nylon
Current Study
Flex
ural
Stre
ngth
, MPa
Material System

56
relatively close results for the fiber volume fraction range, particularly when the standard
deviation is included.
The results of this study were compared directly to data from the literature in Figure 7-2
below. Again, this comparison shows first the limitations of using a randomly oriented
reinforcement. The aligned laminate is clearly over double the strength of the maximum strength
found in this study in the direction tested. However, the current study shows promise,
outperforming the quasi-isotropic laminate by 14 MPa.
Figure 7-2: Comparison of PEEK based panel’s flexural strength in current study with literature results. Source of information showed in brackets. Dotted line references current study.
0
200
400
600
800
1000
1200
1400
1600
1800
2000
68% Weight Carbon Aligned - PEEK
[18]
68 % Weight Carbon Quasi-isotropic
PEEK [18]
68% Weight Carbon Ground - PEEK
[18]
20% Weight Carbon Random - PEEK
[26]
42 % Weight Carbon Random - PEEK
Current Study
Flex
ural
Stre
ngth
, MPa
Material System

57
Figure 7-3: Flexural strength comparision of current study to previous work by Lu and Caba at close fiber volume fraction. References are in brackets.
As a final comparison of flexural strength, the strengths of several material systems from
Lu [6], Caba [28] and the current study are all compared in Figure 7-3. The obvious performance
of PEEK can be seen. However, there does not seem to be an increase in strength from the
carbon reclaim and nylon to the new carbon and nylon. This, again, could be a result of
processing techniques between the two studies.
7.3. Comparison of Flexural Modulus
A comparison of the flexural modulus data between the nylon and PEEK based panels was
much more similar than the strengths. Figure 6-4 and Figure 6-5 in Chapter 6 show that, for both
material systems, the flexural modulus values are around 18 GPa – 30 GPa. However, as with the
205 203
0
100
200
300
400
500
600
700
36% Volume Carbon Random -
PP [28]
34% Volume Carbon Random -
PET [6]
34.7% Volume Reclaim Carbon Random - Nylon
36.5% Volume Carbon Random -
Nylon Current Study
35.4% Volume Carbon Random -
PEEK Current Study
Flex
ural
Stre
ngth
, MPa
Material System

58
case of the flexural strength, no indication of a peak modulus can be found. There is instead, for
both material systems, a trend of increased stiffness with increasing fiber volume fraction.
The results of the nylon based panel’s show, between fiber volume fractions of 0.32 to
0.42, the flexural modulus increased by as much as 10 GPa. There were a few exceptions to the
trend, namely panel 021. However, this particular panel had a much larger standard deviation
indicating a wide range of values around the panel. A comparison to the flexural moduli found in
the literature for nylon based panels is compared to the current study. This showed the same
results as for the flexural strength. The stiff carbon fibers increased the modulus of the nylon
based composite. However, the current study again failed to attain, as was expected, the modulus
of the quasi-isotropic material created by fiber forge.
Figure 7-4: Comparison of Nylon based panel’s flexural modulus in current study with literature results. Source of information showed in brackets. Dotted line references current study.
0
20
40
60
80
100
120
140
160
180
200
65 % Weight Carbon Aligned - Nylon
[24]
65% Weight Carbon Quasi-isotropic - Nylon
[23]
30% Weight Glass Random - Nylon
[25]
53% Weight Carbon Random - Nylon
Current Study
Flex
ural
Mod
ulus
, GPa
Material System

59
The results for PEEK panels also showed a general increase with fiber volume fraction.
The best results, found at 0.35 fiber volume percent, produced a flexural modulus of 30.25 GPa,
which is comparable to the literature. A comparison of the literature results to the current study
can be found in Figure 7-5 below. Again, this shows the limitation of randomly oriented
composites.
Figure 7-5: Comparison of PEEK based panel’s flexural modulus in current study with literature results. Source of information showed in brackets. Dotted line references current study
Again, the results are compared with the previous work at approximately the same fiber
volume fraction in Figure 7-6. This shows again the similar performance of both the reclaimed
carbon fiber and new carbon fiber in nylon.
0
20
40
60
80
100
120
140
68% Weight Carbon Aligned - PEEK
[18]
68 % Weight Carbon Quasi-isotropic
PEEK [18]
68% Weight Carbon Ground - PEEK
[18]
20% Weight Carbon Random - PEEK
[26]
42 % Weight Carbon Random - PEEK
Current Study
Flex
ural
Mod
ulus
, GPa
Material System

60
Figure 7-6: Flexural Modulus comparision of current study to previous work by Lu and Caba at close fiber volume fraction. References are in brackets.
7.4. Planar Isotropy
All panels performed equally in two directions apart from panel 007. In this case an
marked decrease of properties was observed when the testing angle was changed by 90°. As
indicated by Table 6.7, the flexural strength decreased by almost 90 MPa in the 90° reference
direction. The results have also been shown graphically in Figure 7-7. From the literature and
knowledge of composites, an alignment of fibers in the 0° would give that direction an advantage
in strength. Some visible examples of this fiber alignment can also be seen in Figure 6-8.
0
5
10
15
20
25
30
35
36%!Volume!Carbon!Random!G PP!!!!!!!!!!!!!!!!!!!!!!!!!!!!!!!!!!!!!!!!
[28]
34%!Volume!Carbon!Random!G PET!!!!!!!!!!!!!!!!!!!!!!!!!!!!!!
[6]
34.7%!Volume!Reclaim!Carbon!Random!G Nylon
36.5%!Volume!Carbon!Random!G Nylon!!!!!!!!!!!!!!!!!!!!Current!Study
35.4%!Volume!Carbon!Random!G PEEK!!!!!!!!!!!!!!!!!Current!Study
Flex
ural
Mod
ulus
, GPa
Material System

61
Figure 7-7: Flexural strength results from individual coupons of Panel 007
7.5. Microscopy
The microscopy results showed several interesting insights into the micro-scale layers of
the composite panels. All panels showed good consolidation with few voids present. This points
toward good consolidation pressures and lack of excess moisture and air in processing.
Particularly, Figure 6-6 shows the entire edge of a test coupon, with little void content, no
apparent gaps in the matrix and fibers. One interesting image, shown in Figure 6-13, shows a
failure where voids might have been a possible cause. The fractured surface appears to be at
multiple, unconnected planes moving through the depth of the composite. It is possible that this
area of the panel did not reach the compaction necessary, leaving voids between the fibrous mat
layers. This allowed them to open during testing, causing failure. Other causes of these voids
200
250
300
350
400
450
500
01 02 03 04 05 06 07 08 09 10
Flex
ural
Stre
ngth
, MPa
Coupons Tested

62
could be from the sample preparation before testing. In Figure 6-13, the surface appears rough
where it was in contact with the wet-saw. Because no polishing was done before the SEM was
used, the effects of the cutting process can clearly be seen. This also becomes clear in Figure
6-12 with the repeated diagonal cut lines.
As was discussed in Chapter 4 and later in Section 7.6, special effort was taken to fully
separate the carbon fiber tows before being mixed in the white water. However, there are several
obvious indications where these methods were not fully successful. The image given in Figure
6-10 shows a large bundle of fibers, closely aligned with little matrix present coming out of a
fracture. These bundles could indicate areas tows that were not completely separated during the
mixing process, which should result in weaker areas of the panels. Indeed, in Figure 6-9 the
image shows the fracture of a particularly strong panel. The area deeper in the panel seems to
show a good randomization of fiber orientation, at least what can be seen from this surface. The
area around the fracture, however, shows two major fiber bundles, angled at different directions.
This could have been the cause of this particular failure spot.
Reinforcement and matrix bonding were also observed from the SEM micrographs. Two
contrasting images can be seen in Figure 6-10 and Figure 6-11. In the case of Figure 6-10, the
carbon fibers showing in the fracture surface appear to be covered in small amounts of resin,
indicating that it bonded well to carbon fiber surface. Contrasting that, the image in Figure 6-11
shows very clear, clean fibers that pulled out during fracture. This would indicate fibers that
never bonded well to the matrix and were able to pull out easily.

63
7.6. Manufacturing Process
This process was originally used in an automated machine where both high volume and
consistency could be achieved. This was reflected in the results Lu’s [6] results. Due to the
limiting sizes of the mixer/pulper and sheet former, the batch size was relatively small and
introduced small, unintended variations into the data. In addition, the processing parameter
differences between PEEK and Nylon also added complexity to the process. The following
sections attempt to report all observations during the production of panels as a method of
critiquing the production process.
There are also possible sources of error from the testing process. This comes from test
setup and the testing process itself. Attempts were made to minimize these, such as preloading
the specimens during flex testing to reduce movement and false readings.
7.6.1 Surfactant in White Water
Originally, Rhodameen VP-532/SPB was used as the surfactant in making the white
water for panel production. However, this product had been discontinued which lead to several
panels being created with an alternate surfactant. In these cases, the surfactant was made “in-
house” by mixing 20% by weight POE tallow ammine deionized water. For the nylon based
panels affected, there appeared to be no difference between the two surfactants. However, for the
PEEK fibers, which are considerably less dense, the concentration of POE tallow ammine
appeared to be too low. In these cases, the thermoplastic PEEK fibers floated to the surface of
the white water. A new batch of 20% by weight POE tallow ammine and deionized water was
mixed and gave better results. No cause for why this re-mixed solution worked better could be

64
found. This was used until Rhodameen VP-532/SPB was found and used. For all panels using
Rhodameen VP-532/SPB, the solution had passed its expiration date.
7.6.2 Separation of Carbon Fiber
As was previously introduced in Chapter 3, the chopped carbon fiber tows were separated
into smaller fibers before being added to the white water during the mixing step. As one of the
most time consuming and physically draining steps, the method used to separate carbon fiber
was altered several times.
The initial method used several panels was to simply hand separate the fibers directly into
the white water immediately after adding the thermoplastic fibers. This process would take 20-25
minutes per batch and led to inconsistencies in the quality of separation. This method required
the operator to hold their arms above the pulper for extended periods of time while squeezing
and twisting the chopped tows to pull them apart. As the carbon fiber was being separated above
white water, being mixed at low rpms, it was necessary to complete this step while wearing a
mask and standing. Because of fatigue this method introduced, the level of separation decreased
with each batch.
As a way to combat this time intensive step during the mixing stage, the weight of carbon
fiber for a particular panel could be pre-separated at an earlier date. This would allow the
operator to sit while separating for several hours which produced more uniform separation of
fibers. Unfortunately, there was no method of characterizing the amount of separation.
To test to effects of fiber separation, panel 003 was made with non-separated fibers,
while 004 was hand separated. The strength data through testing of panels 003 and 004 indicated
that there was no relationship between simply adding the chopped tows versus separating them

65
before. This increased the productivity of the process by removing the separation step. During
this step, carbon fiber tows were simply added to the white water after the thermoplastic. The
mixture was then pulped for 10 minutes at high rpms resulting in the separation of the carbon
fiber. Again, the only method used was a visual inspection of the effectiveness of this process
change. However, the strength results indicated that the properties remained the same.
A new hybrid method was also used where carbon fibers would be separated in the pulper
alone, in tap water. Generally, 30 grams of chopped carbon fiber tow were mixed with 2 liters of
tap water and mixed for 10 minutes at a high rpm. The mixture was then drained and the
resulting fibers were dried in an oven, 200°C for 10 minutes. This ensured all water was
removed and the appropriate fiber weight was correct. This pre-separated fiber could then be
added in the normal way immediately after the thermoplastic fiber. This hybrid method combines
the self-separation involved in the mixing step twice, allowing for full fiber separation before the
final product was created.
Some issues that could arise from the hybrid method are the possibility of washing off
fiber sizing. Additionally, the extra time in the pulper could break some fibers or create surface
damage that could lower the bonding properties in the composite resulting in decreased strength.
7.6.3 Inconsistent Drying of Mats
During the production of mats, a large TPS Blue M oven was used for the drying step.
Again, comparing back to previous work, which used a continuous heating system, some
inconsistencies were introduced in the process. Because of the large scale of the oven compared
with the smaller mats, it became difficult to achieve uniform heating and drying. In some cases,
this became so extreme that an individual mat would be one half over dried while the other side

66
seemed untouched. The large temperature gradient made it difficult to precisely flash dry the
mats which is dependent on introducing the mats to the thermoplastic melt temperature for a
specific amount of time.
Again, in order to combat this problem, the method was altered several times although
with less frequency than the fiber separation and mixing steps. In order to control and better
regulate the temperature gradient in the oven, the outer dampers were used to restrict airflow.
However, this sometimes resulted in fault from a pressure switch that removed heater power.
This problem became more acute when the oven was pushed to higher temperatures due to the
high melting temperature of thermoplastic PEEK.
Finally, the oven requires that the blower motor must not be turned off, which occurs when
the door is open, above 300°C. This introduced problems when drying the PEEK based mats,
whose melting temperature was 250°C. Because of this limitation, the correct drying time
became tedious to discover and achieve.
Possible variations in performance due to these issues could be large loss of fibers before
consolidation or from re-melting of some thermoplastic. The loss of fibers primarily comes from
under drying of the mat. The drying step is primarily to remove remaining water but also to
lightly melt the thermoplastic to bind all fiber together before stacking in the mold. By not
melting the matrix fibers, both reinforcement and matrix, are lost during transport, cutting and
placement in the mold. To combat this, all mats were weighed immediately before being placed
in the mold. Conversely, over drying the mat results in a lack of matrix material in some areas, as
the thermoplastic had a tendency to run toward the bottom of the mat during overheating. This
would also be indicated by a change in color after drying.
67
Both of these phenomenon sometimes occurred on the same mat, making it difficult to
control. As a best practice, this study finds that locating the mats toward the center-left of the
oven produced the most even results. Leaving space to increase airflow around the mats also
removed some of these problems. As these problems occurred in several of the mats, there was
no data to correlate these to strength results.
7.6.4 Cutting testing coupons
The diamond tipped wet saw used to cut panels made straight cuts difficult and also
introduced large volumes of water. The imprecise nature of cuts made measuring the coupons
difficult, and sizes are therefore averages of widths for a given coupon. The ASTM standard also
requires perfectly rectangular coupons. Although the coupons were towel dried immediately
cutting, some moisture absorption was suspected and could have altered strength characteristics
and results. In order to avoid this, coupons were allowed to air dry 24 hours before being tested.

68
Chapter 8. Conclusion
This thesis revealed some important insight into the wet-lay paper making process used with
thermoplastic nylon and PEEK. The goal of this thesis was to build off the work of Lu [6] by
branching into different matrix material systems: carbon-nylon and carbon-PEEK. Although the
results did not indicate the optimal fiber volume fractions of either material system, several other
conclusions have been found. In particular, this research has given unique insight into the
production process itself, including sources of error and possible ways to responding to them.
The flexural strengths and moduli of both nylon and PEEK based composites made with this
method have been obtained for a narrow band of fiber volume fractions and compared to the
literature.
8.1. Conclusions
The overall process produced quality panels with good in-plane isotropic behavior. Apart
from one panel, all those tested showed little variation in flexural properties measured
orthogonally. The process itself was limited by the size and availability of the equipment and
materials. However, this process could easily be automated to reduce cycle times and error
introduced in small batch processes. Only small percent changes in target fiber volume fractions
versus final fiber volume fractions are also encouraging for future research.
The nylon based panels show some promise with regards to flexural strength. When
compared to the literature results, the current study, which produced a flexural strength of 365
MPa in one case, performed only marginally less than some current market products. The
modulus results were less than satisfactory, attaining a maximum of only 28 GPa. This was

69
below the results found in research. Further study, with the comments made in Section 7.5, will
no doubt yield higher quality panels with better performance.
PEEK carbon fiber composites show great promise, both in the literature and in the results
of this thesis. Given the lack of a trend in flexural strength for the volume fractions produced,
more volume fractions tested. The flexural strength results were as high as 640 MPa. However,
as with the nylon based panels, the flexural modulus results were somewhat disappointing
attaining only 30 GPa.
The photomicrographs collected using the scanning electron microscope showed some
problem areas with bonding. Large bundles of aligned fibers around failure areas indicated that
fiber separation may be a problem. In addition, clean fiber pull outs could indicate poor bonding
between the carbon fibers and nylon. This could be linked to the mixing step and possible loss of
the fibers sizing or nylon absorbing water.
Finally, the overall process yielded good results. Through the progress of this thesis, several
problem causing manufacturing steps have been observed and solutions found. Due to the
availability of equipment, such as drying ovens and pulper size, some problems continued
throughout the research, possibly producing bias in results. However, from a manufacturing
perspective, this process could easily be automated and used in high volume composite
production.
8.2. Future Work
Overall, more work should be done on this process and materials. In order to remove many
sources of inconsistencies with panels, the whole process should be streamlined, or even
automated. Proper equipment, such as a smaller oven or larger pulper, would produce more
70
consistent mats and final composite panels. This would remove inconsistencies and make data
comparison more meaningful.
Another area of research that should be performed next would be morphology of the PEEK
and nylon composites. The research pointed toward large dependence of semi-crystalline
polymer composites’ performance depended on the structure formed while cooling. Due to the
nature of randomly oriented composites, research should be done to obtain the effects a random
orientation of fibers has on the morphology of these polymers. This could point to problems with
cooling rates in the production process.
Research should also be done into the effects of water absorption by these nylon systems.
The literature review revealed nylons strong water absorption. The data from this thesis also
indicated possible loss of flexural strength from water absorption during sample cutting.
Finally, the range of fiber volume fractions should be expanded to find an optimal fraction
for both strength and modulus performance. This process could also be aided by the addition of
tensile testing. This will add complications during testing but will make the data more
comparable with other research results.

71
APPENDICES
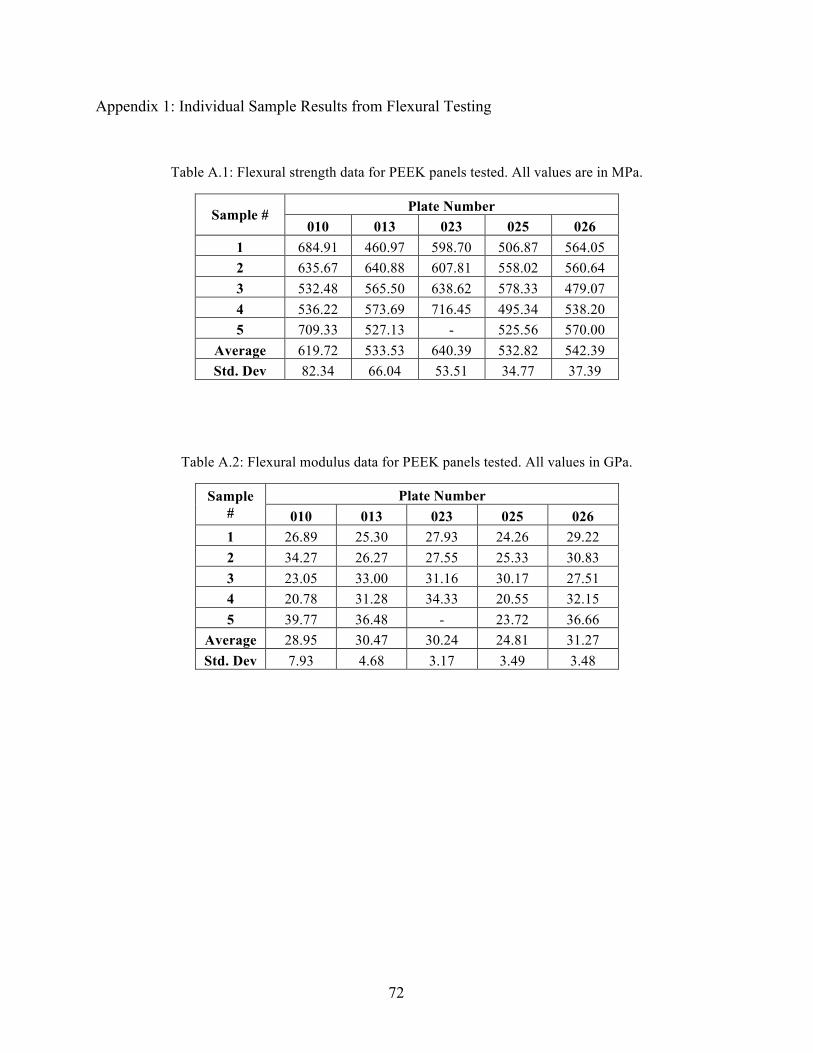
72
Appendix 1: Individual Sample Results from Flexural Testing
Table A.1: Flexural strength data for PEEK panels tested. All values are in MPa.
Sample # Plate Number 010 013 023 025 026
1 684.91 460.97 598.70 506.87 564.05 2 635.67 640.88 607.81 558.02 560.64 3 532.48 565.50 638.62 578.33 479.07 4 536.22 573.69 716.45 495.34 538.20 5 709.33 527.13 - 525.56 570.00
Average 619.72 533.53 640.39 532.82 542.39 Std. Dev 82.34 66.04 53.51 34.77 37.39
Table A.2: Flexural modulus data for PEEK panels tested. All values in GPa.
Sample #
Plate Number 010 013 023 025 026
1 26.89 25.30 27.93 24.26 29.22 2 34.27 26.27 27.55 25.33 30.83 3 23.05 33.00 31.16 30.17 27.51 4 20.78 31.28 34.33 20.55 32.15 5 39.77 36.48 - 23.72 36.66
Average 28.95 30.47 30.24 24.81 31.27 Std. Dev 7.93 4.68 3.17 3.49 3.48
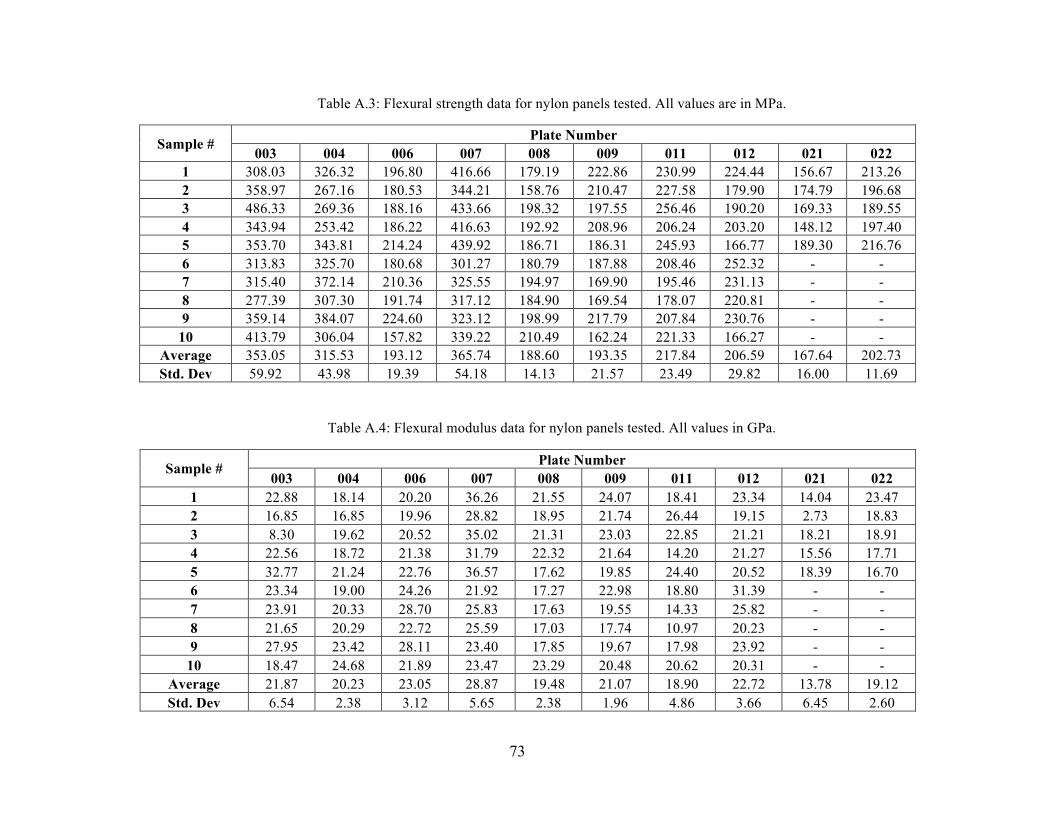
73
Table A.3: Flexural strength data for nylon panels tested. All values are in MPa.
Sample # Plate Number 003 004 006 007 008 009 011 012 021 022
1 308.03 326.32 196.80 416.66 179.19 222.86 230.99 224.44 156.67 213.26 2 358.97 267.16 180.53 344.21 158.76 210.47 227.58 179.90 174.79 196.68 3 486.33 269.36 188.16 433.66 198.32 197.55 256.46 190.20 169.33 189.55 4 343.94 253.42 186.22 416.63 192.92 208.96 206.24 203.20 148.12 197.40 5 353.70 343.81 214.24 439.92 186.71 186.31 245.93 166.77 189.30 216.76 6 313.83 325.70 180.68 301.27 180.79 187.88 208.46 252.32 - - 7 315.40 372.14 210.36 325.55 194.97 169.90 195.46 231.13 - - 8 277.39 307.30 191.74 317.12 184.90 169.54 178.07 220.81 - - 9 359.14 384.07 224.60 323.12 198.99 217.79 207.84 230.76 - -
10 413.79 306.04 157.82 339.22 210.49 162.24 221.33 166.27 - - Average 353.05 315.53 193.12 365.74 188.60 193.35 217.84 206.59 167.64 202.73 Std. Dev 59.92 43.98 19.39 54.18 14.13 21.57 23.49 29.82 16.00 11.69
Table A.4: Flexural modulus data for nylon panels tested. All values in GPa.
Sample # Plate Number 003 004 006 007 008 009 011 012 021 022
1 22.88 18.14 20.20 36.26 21.55 24.07 18.41 23.34 14.04 23.47 2 16.85 16.85 19.96 28.82 18.95 21.74 26.44 19.15 2.73 18.83 3 8.30 19.62 20.52 35.02 21.31 23.03 22.85 21.21 18.21 18.91 4 22.56 18.72 21.38 31.79 22.32 21.64 14.20 21.27 15.56 17.71 5 32.77 21.24 22.76 36.57 17.62 19.85 24.40 20.52 18.39 16.70 6 23.34 19.00 24.26 21.92 17.27 22.98 18.80 31.39 - - 7 23.91 20.33 28.70 25.83 17.63 19.55 14.33 25.82 - - 8 21.65 20.29 22.72 25.59 17.03 17.74 10.97 20.23 - - 9 27.95 23.42 28.11 23.40 17.85 19.67 17.98 23.92 - -
10 18.47 24.68 21.89 23.47 23.29 20.48 20.62 20.31 - - Average 21.87 20.23 23.05 28.87 19.48 21.07 18.90 22.72 13.78 19.12 Std. Dev 6.54 2.38 3.12 5.65 2.38 1.96 4.86 3.66 6.45 2.60

74
Appendix 2: MATLAB code

75

76

77
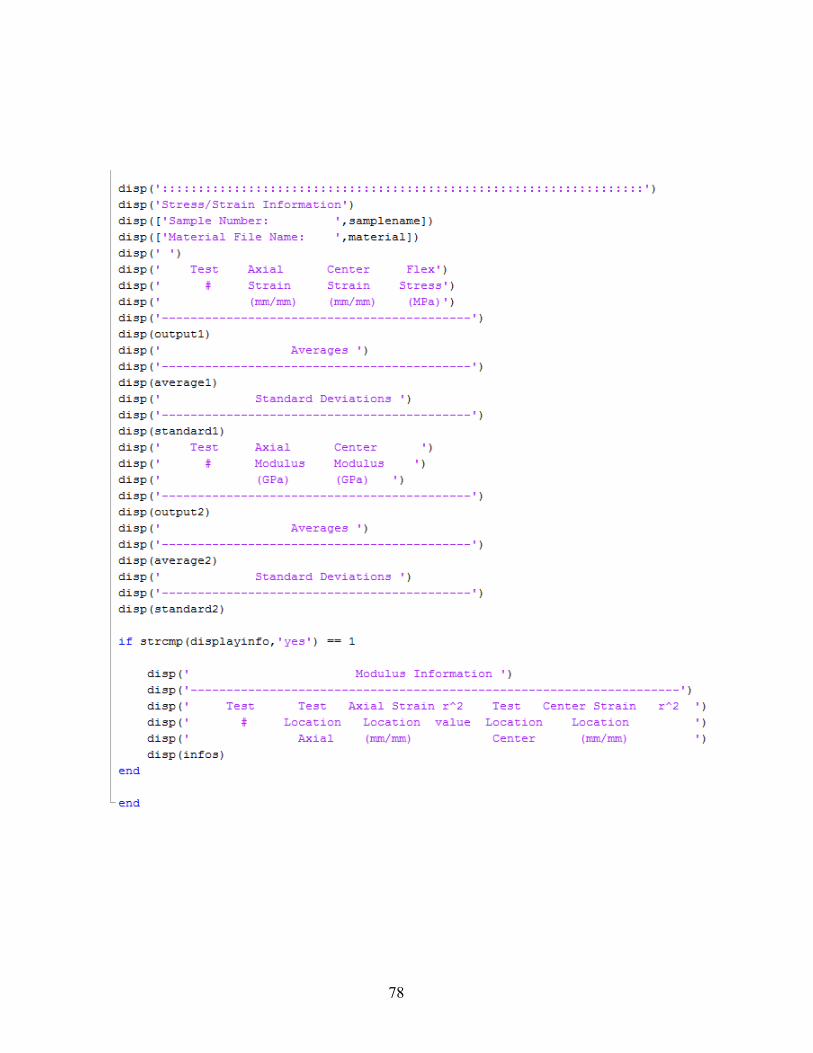
78

79
BIBLIOGRAPHY

80
BIBLIOGRAPHY
[1] A. B. Strong, Fundamentals of Composites Manufacturing: Materials, Methods, and Applications. Dearborn, MI: Society of Manufacturing Engineers, 1989.
[2] I. Y. Chang and J. K. Lees, “Recent Development in Thermoplastic Composites: A Review of Matrix Systems and Processing Methods,” J. Thermoplast. Compos. Mater., vol. 1, no. 3, pp. 277–296, Jul. 1988.
[3] P. K. Mallick, Fiber-Reinforced Composites: Materials, Manufacturing, and Design, Third. Boca Raton: CRC Press, 2008.
[4] G. R. Belbin, P. A. Staniland, M. Bhatt, and S. F. Bush, “Advanced Thermoplastics and their Composites [and Discussion],” Philos. Trans. R. Soc. Lond. Ser. Math. Phys. Sci., vol. 322, no. 1567, pp. 451–464, Jul. 1987.
[5] J. E. G. Jr and G. P. Weeks, “Method of making fiber reinforced porous sheets,” US5194106 A, 16-Mar-1993.
[6] Y. Lu, “Mechanical Properties of Random Discontinuous Fiber Composites Manufactured from Wetlay Process,” 22-Aug-2002. [Online]. Available: http://scholar.lib.vt.edu/theses/available/etd-08132002-163349/. [Accessed: 25-Jun-2015].
[7] C. Soutis, “Carbon fiber reinforced plastics in aircraft construction,” Mater. Sci. Eng. A, vol. 412, no. 1–2, pp. 171–176, Dec. 2005.
[8] M. Balasubramanian, Composite Materials and Processing. CRC Press, 2014.
[9] C. A. Mahieux, “Cost effective manufacturing process of thermoplastic matrix composites for the traditional industry: the example of a carbon-fiber reinforced thermoplastic flywheel,” Compos. Struct., vol. 52, no. 3–4, pp. 517–521, May 2001.
[10] M. Biron, Thermoplastics and Thermoplastic Composites. William Andrew, 2012.
[11] F. N. Cogswell, Thermoplastic Aromatic Polymer Composites: A Study of the Structure, Processing and Properties of Carbon Fibre Reinforced Polyetheretherketone and Related Materials. Elsevier, 1992.
[12] N. Klein, G. Marom, and E. Wachtel, “Microstructure of nylon 66 transcrystalline layers in carbon and aramid fibre reinforced composites,” Polymer, vol. 37, no. 24, pp. 5493–5498, Nov. 1996.
81
[13] M. S. A. Rahaman, A. F. Ismail, and A. Mustafa, “A review of heat treatment on polyacrylonitrile fiber,” Polym. Degrad. Stab., vol. 92, no. 8, pp. 1421–1432, Aug. 2007.
[14] A. G. Gibson and J.-A. Månson, “Impregnation technology for thermoplastic matrix composites,” Compos. Manuf., vol. 3, no. 4, pp. 223–233, 1992.
[15] P. Mitschang, M. Blinzler, and A. Wöginger, “Processing technologies for continuous fibre reinforced thermoplastics with novel polymer blends,” Compos. Sci. Technol., vol. 63, no. 14, pp. 2099–2110, Nov. 2003.
[16] B. A. Davis, P. J. Gramann, and A. C. Rios, Compression Molding. Henser, 2003.
[17] L. Ye, K. Friedrich, J. Kästel, and Y.-W. Mai, “Consolidation of unidirectional CF/PEEK composites from commingled yarn prepreg,” Compos. Sci. Technol., vol. 54, no. 4, pp. 349–358, 1995.
[18] G. C. McGrath, D. W. Clegg, and A. A. Coll Yer, “The mechanical properties of compression moulded reconstituted carbon fibre reinforced PEEK (APC-2),” Composites, vol. 19, no. 3, pp. 211–216, May 1988.
[19] J. M. Whitney and M. Knight, “The relationship between tensile strength and flexure strength in fiber-reinforced composites,” Exp. Mech., vol. 20, no. 6, pp. 211–216, Jun. 1980.
[20] C. Zweben, “The Flexural Strength of Aramid Fiber Composites,” J. Compos. Mater., vol. 12, no. 4, pp. 422–430, Dec. 1978.
[21] R. E. Bullock, “Strength Ratios of Composite Materials in Flexure and in Tension,” J. Compos. Mater., vol. 8, no. 2, pp. 200–206, Apr. 1974.
[22] W. H. Bowyer and M. G. Bader, “On the re-inforcement of thermoplastics by imperfectly aligned discontinuous fibres,” J. Mater. Sci., vol. 7, no. 11, pp. 1315–1321, Nov. 1972.
[23] Fiberforge, “Fiberforge Carbon/Nylon Quasi-Isotropic Blank Representative Material Data.” .
[24] Fiberforge, “Fiberforge Carbon/Nylon Unidirectional Blank Representative Material Data.”
[25] J. L. Thomason, “The influence of fibre properties of the performance of glass-fibre-reinforced polyamide 6,6,” Compos. Sci. Technol., vol. 59, no. 16, pp. 2315–2328, Dec. 1999.
[26] M. Kurokawa, Y. Uchiyama, and S. Nagai, “Performance of plastic gear made of carbon fiber reinforced poly-ether-ether-ketone: Part 2,” Tribol. Int., vol. 33, no. 10, pp. 715–721, Oct. 2000.

82
[27] Quantum Composites, “Quantum Composites Technical Data Sheet for AMC 8592,” Quantum Composites, 07-Sep-2013. [Online]. Available: http://www.quantumcomposites.com/pdf/datasheets/amc/Quantum-AMC-8592%20126-76-86.pdf.
[28] A. Caba, “Characterization of Carbon Mat Thermoplastic Composites: Flow and Mechanical Properties,” 14-Sept-2005,
[29] A. C. Roulin-Moloney, Ed., Fractography and Failure Mechanisms of Polymers and
Composites. Essex England: Elsevier Science Publishers LTD, 1989.
[30] D. Purslow, “Fractography of fibre-reinforced thermoplastics, Part 3. Tensile, compressive and flexural failures,” Composites, vol. 19, no. 5, pp. 358–366, Sep. 1988.
[31] Toray Carbon Fibers America, Inc, “TorayCA T700S Data Sheet.” .
[32] Minifibers, Inc., “MiniFibers, Inc. Technical Data Sheet,” MiniFibers, Inc. [Online]. Available: http://www.minifibers.com/techdata/TD-04_NYT66-0302RR.pdf.
[33] “Welcome to ZYEX World leader in PEEK fibres.” [Online]. Available: http://www.zyex.com/index.html#. [Accessed: 16-Jul-2015].