characterization of four type-c silica columns using
TRANSCRIPT

San Jose State University San Jose State University
SJSU ScholarWorks SJSU ScholarWorks
Master's Theses Master's Theses and Graduate Research
Summer 2018
Characterization of Four Type-C Silica Columns Using Resveratrol Characterization of Four Type-C Silica Columns Using Resveratrol
Analogues Analogues
Joshua Topete San Jose State University
Follow this and additional works at: https://scholarworks.sjsu.edu/etd_theses
Recommended Citation Recommended Citation Topete, Joshua, "Characterization of Four Type-C Silica Columns Using Resveratrol Analogues" (2018). Master's Theses. 4956. DOI: https://doi.org/10.31979/etd.33mq-3p59 https://scholarworks.sjsu.edu/etd_theses/4956
This Thesis is brought to you for free and open access by the Master's Theses and Graduate Research at SJSU ScholarWorks. It has been accepted for inclusion in Master's Theses by an authorized administrator of SJSU ScholarWorks. For more information, please contact [email protected].

CHARACTERIZATION OF FOUR TYPE-C SILICA COLUMNS USING RESVERATROL ANALOGUES
A Thesis
Presented to
The Faculty of the Department of Chemistry
San José State University
In Partial Fulfillment
of the Requirements for the Degree
Master of Science
by
Joshua Charles Topete
August 2018

© 2018
Joshua Charles Topete
ALL RIGHTS RESERVED

The Designated Thesis Committee Approves the Thesis Titled
CHARACTERIZATION OF FOUR TYPE-C SILICA COLUMNS USING RESVERATROL ANALOGUES
by
Joshua Charles Topete
APPROVED FOR THE DEPARTMENT OF CHEMISTRY
SAN JOSÉ STATE UNIVERSITY
August 2018
Joseph J. Pesek, Ph.D.
Department of Chemistry
Roger Terrill, Ph.D.
Department of Chemistry
Chester Simocko, Ph.D. Department of Chemistry

ABSTRACT
CHARACTERIZATION OF FOUR TYPE-C SILICA COLUMNS USING RESVERATROL ANALOGUES
by Joshua Charles Topete
High performance liquid chromatography (HPLC) is an analytical technique used
to separate, identify and quantify components in a solution based on the affinities
between analyte, mobile phase and stationary phase. The main goal of my research is
to characterize four Type-C silica columns by comparing the retention of resveratrol
analogues. The four columns included are functionalized with either Diamond
Bidentate C18 (DBC18), Bidentate C18 (BC18), phenyl hydride or diol groups.
Retention maps displaying mobile phase composition compared to compound
retention times were compared between columns. In addition to this, two organic
solvents (acetonitrile and methanol) were compared. Considering that the resveratrol
analogues are fairly nonpolar, this set of compounds were expected to have slightly
higher affinity for the DBC18 compared to the BC18. In comparison, the phenyl
hydride column was anticipated to interact more with unsaturated compounds while
the diol was likely to retain those with polar substituents. The data collected
supported some of the expected trends based on polarity but each column
demonstrated unique retention mechanisms for specific resveratrol analogues. The
results determined that the BC18 column gave the highest retention strength while the
phenyl hydride displayed the most selectivity for the resveratrol derivatives.

ⅴ
ACKNOWLEDGMENTS
First and foremost, I would like to thank Drs. Maria Matyska-Pesek and Joseph
Pesek for allowing me to work with and under them these many years. They have
served as great mentors, role models and even parent-like figures in my life. From
initial training, group meetings, presenting research and finally graduating this couple
has assisted me and watched me grow the entire way. I also want to thank my other
committee members Drs. Roger Terrill and Chester Simocko for being outstanding
teachers and for agreeing to oversee my thesis work. I want to thank Michael
Stephens, Akilu Kidane, Randy Kirchner and John Hawk for all the technical work
and waste disposal taken care of behind the scenes. I want to give a special thanks to
Sam Monroe and Stephen Cappelloni for all the service center assistance throughout
the years. Working for the stockroom under Sam and Steve was my initial stepping
stone into my chemistry career where I transitioned from being a complete delinquent
to a somewhat diligent student. I also would like to thank the rest of the Chemistry
Department and SAACS for all their help that tends to go unnoticed. Finally, I would
like to thank God, my girlfriend, family and friends for all the moral support and
advice throughout the years. My faith in God has kept me sane, my girlfriend has
been extremely patient with me, my family and friends have always motivated and
encouraged me and continue to do so. I am positive that everyone and anyone in my
life played or plays a role in my journey and I hope that I can do the same for you.
Thank you all, I cannot thank you all enough.

vi
TABLE OF CONTENTS
List of Tables............................................................................................................. ⅷ
List of Figures........................................................................................................... ⅸ
1. Introduction........................................................................................................... 1 1.1 Background................................................................................................... 1
1.1.1 History of Chromatography................................................................. 1 1.1.2 Types of Chromatography.................................................................... 2
1.1.2.1 Homogeneous vs. heterogeneous................................................ 2 1.1.2.2 Adsorption vs. partition............................................................... 2 1.1.2.3 Columnar vs. planar.................................................................... 3
1.1.3 Main Chromatographic Modes............................................................. 4 1.1.3.1 Normal phase............................................................................... 4 1.1.3.2 Hydrophilic interaction............................................................... 4 1.1.3.3 Reversed phase............................................................................ 5 1.1.3.4 Aqueous normal phase................................................................ 5 1.1.3.5 Other modes................................................................................ 7
1.2 High Performance Liquid Chromatography.................................................. 8 1.2.1 Applications in Modern HPLC............................................................ 9 1.2.2 Instrumental Components.................................................................... 10
1.2.2.1 Solvent manager.......................................................................... 10 1.2.2.2 Injector........................................................................................ 11 1.2.2.3 Column........................................................................................ 12 1.2.2.4 Detectors...................................................................................... 13 1.2.2.5 Computer and software............................................................... 16
1.3 HPLC Parameters.......................................................................................... 16 1.3.1 Resolution............................................................................................. 16
1.3.1.1 Retention Factor.......................................................................... 17 1.3.1.2 Selectivity.................................................................................... 17 1.3.1.3 Efficiency.................................................................................... 18
1.3.2 Van Deemter Equation......................................................................... 18 1.4 Stationary Phase - Silica................................................................................ 20
1.4.1 Advantages........................................................................................... 20 1.4.2 Evolution.............................................................................................. 20
1.5 Synthesis........................................................................................................ 22 1.5.1 Silanization........................................................................................... 22 1.5.2 Hydrosilation........................................................................................ 23
1.6 Research Aims and Goals............................................................................. 23

vii
2. Experimental and Methods.................................................................................... 25 2.1 Columns........................................................................................................ 25 2.2 Instruments.................................................................................................... 26 2.3 Chemicals and Compounds........................................................................... 29
2.3.1 HPLC Solvents..................................................................................... 29 2.3.2 Resveratrol Analogues......................................................................... 29 2.3.3 Acidic, Basic and Neutral Compounds................................................ 30
2.4 Methods......................................................................................................... 31 3. Results and Discussion.......................................................................................... 33
3.1 Data with Acetonitrile as Mobile Phase........................................................ 36 3.1.1 Resveratrol Analogues......................................................................... 36 3.1.2 Acidic, Basic and Neutral Compounds................................................ 47
3.2 Data with Methanol as Mobile Phase............................................................ 57 3.2.1 Resveratrol Analogues......................................................................... 57 3.2.2 Acidic, Basic and Neutral Compounds................................................ 68
4. Conclusions and Future Studies............................................................................ 77 5. References............................................................................................................. 80

viii
LIST OF TABLES
Table 1. Column Specifications............................................................................ 26
Table 2. Wavelength Parameter............................................................................ 32
Table 3. Retention trends of resveratrol analogues based on structure and polarity..................................................................................................................
35
Table 4. Diamond Bidentate C18 Capacity Factor “k” (ACN/Resveratrol) ........ 37
Table 5. Bidentate C18 Capacity Factor “k” (ACN/Resveratrol) ........................ 41
Table 6. Phenyl Hydride Capacity Factor “k” (ACN/Resveratrol) ...................... 41
Table 7. Diol Capacity Factor “k” (ACN/Resveratrol) ........................................ 46
Table 8. Retention trends of acidic/basic/neutral compounds based on structure and polarity ..........................................................................................................
49
Table 9. Diamond Bidentate C18 Capacity Factor “k” (ACN/ABN) .................. 49
Table 10. Bidentate C18 Capacity Factor “k” (ACN/ABN) ................................ 51
Table 11. Phenyl Hydride Capacity Factor “k” (ACN/ABN) .............................. 53
Table 12. Diol Capacity Factor “k” (ACN/ABN) ................................................ 55
Table 13. Diamond Bidentate C18 Capacity Factor “k” (MeOH/Resveratrol) ... 58
Table 14. Bidentate C18 Capacity Factor “k” (MeOH/Resveratrol) ................... 59
Table 15. Phenyl Hydride Capacity Factor “k” (MeOH/Resveratrol) ................. 59
Table 16. Diol Capacity Factor “k” (MeOH/Resveratrol) ................................... 60
Table 17. Diamond Bidentate C18 Capacity Factor “k” (MeOH/ABN) ............. 68
Table 18. Bidentate C18 Capacity Factor “k” (MeOH/ABN) ............................. 69
Table 19. Phenyl Hydride Capacity Factor “k” (MeOH/ABN) ........................... 69
Table 20. Diol Capacity Factor “k” (MeOH/ABN) ............................................. 69

ix
LIST OF FIGURES
Figure 1. Dual retention of an ANP compound and a RP compound................... 6
Figure 2. A “U” shaped retention map of a hybrid hydrophilic/hydrophobic compound using an ANP stationary phase...........................................................
7
Figure 3. Example of a Chromatogram................................................................. 13
Figure 4. Silica hydride synthesis......................................................................... 22
Figure 5. Functionalization of silica hydride by hydrosilation............................. 23
Figure 6. Tested Column Structures..................................................................... 25
Figure 7. Perkin Elmer Flexar UPLC................................................................... 27
Figure 8. Agilent 1200 Series HPLC ................................................................... 28
Figure 9. Resveratrol Analogues ......................................................................... 30
Figure 10. Acidic, Basic and Neutral Compounds .............................................. 31
Figure 11. Diamond C18 Retention Map (ACN/Resveratrol) ............................. 37
Figure 12. Diamond Bidentate C18 with Acetonitrile Mobile Phase Overlaid/Stacked Chromatograms (Resveratrol) ................................................
39
Figure 13. Bidentate C18 Retention Map (ACN/Resveratrol) ............................ 40
Figure 14. Bidentate C18 with Acetonitrile Mobile Phase Overlaid/Stacked Chromatograms (Resveratrol) .............................................................................
42
Figure 15. Phenyl Hydride Retention Map (ACN/Resveratrol) .......................... 44
Figure 16. Phenyl Hydride with Acetonitrile Mobile Phase Overlaid/Stacked Chromatograms (Resveratrol) .............................................................................
45
Figure 17. Diol Retention Map (ACN/Resveratrol) ............................................ 46
Figure 18. Diol with Acetonitrile Mobile Phase Overlaid/Stacked Chromatograms..................................................................................................... 48

x
Figure 19. Diamond C18 Retention Map (ACN/ABN) ....................................... 49
Figure 20. Diamond Bidentate C18 with Acetonitrile Mobile Phase Overlaid/Stacked Chromatograms .......................................................................
50
Figure 21. Bidentate C18 Retention Map (ACN/ABN) ....................................... 51
Figure 22. Bidentate C18 with Acetonitrile Mobile Phase Overlaid/Stacked Chromatograms ....................................................................................................
52
Figure 23. Phenyl Hydride Retention Map (ACN/ABN) .................................... 53
Figure 24. Phenyl Hydride with Acetonitrile Mobile Phase Overlaid/Stacked Chromatograms ....................................................................................................
54
Figure 25. Diol Retention Map (ACN/ABN) ...................................................... 55
Figure 26. Diol with Acetonitrile Mobile Phase Overlaid/Stacked Chromatograms.....................................................................................................
56
Figure 27. Diamond C18 Retention Map (MeOH/Resveratrol) .......................... 60
Figure 28. Diamond Bidentate C18 with Methanol Mobile Phase Overlaid/Stacked Chromatograms .......................................................................
61
Figure 29. Bidentate C18 Retention Map (MeOH/Resveratrol) .......................... 62
Figure 30. Bidentate C18 with Methanol Mobile Phase Overlaid/Stacked Chromatograms ....................................................................................................
63
Figure 31. Phenyl Hydride Retention Map (MeOH/Resveratrol) ........................ 64
Figure 32. Phenyl Hydride with Methanol Mobile Phase Overlaid/Stacked Chromatograms ....................................................................................................
65
Figure 33. Diol Retention Map (MeOH/Resveratrol) .......................................... 66
Figure 34. Diol with Methanol Mobile Phase Overlaid/Stacked Chromatograms.....................................................................................................
67
Figure 35. Diamond Bidentate C18 with Methanol Mobile Phase Overlaid/Stacked Chromatograms .................................................................................................... 70

xi
Figure 36. Bidentate C18 with Methanol Mobile Phase Overlaid/Stacked Chromatograms ....................................................................................................
71
Figure 37. Phenyl Hydride with Methanol Mobile Phase Overlaid/Stacked Chromatograms ....................................................................................................
73
Figure 38. Diol with Methanol Mobile Phase Overlaid/Stacked Chromatograms.....................................................................................................
74
Figure 39. Diamond C18 Retention Map (MeOH/ABN) ....................................
75
Figure 40. Bidentate C18 Retention Map (MeOH/ABN) .................................... 75
Figure 41. Phenyl Hydride Retention Map (MeOH/ABN) .................................. 76
Figure 42. Diol Retention Map (MeOH/ABN) .................................................... 76

1
Chapter 1: Introduction
1.1 Background
1.1.1 History of Chromatography
Chromatography is an analytical technique used to separate a mixture of components
in a mobile phase based on various molecular interactions between a stationary phase and
analytes of interest.1 This technique is mainly used qualitatively in the form of identifying
components but it can also be used in a quantitative manner for determining precise
amounts of each analyte. The use of chromatography dates back to the 1800s when Drs.
Friedlieb Runge, Friedrich Goppelsroeder and Lester Reed separated various colored
mixtures on paper and cloth.2,3 These three scientists are referred to as the pioneers of
chromatography while the majority of the scientific community consider Dr. Michael
Tswett as the father of the concept.
Michael Tswett was a Russian botanist who worked extensively with plant pigments
such as chlorophyll. During the pigment sample preparation, he utilized calcium
carbonate to prevent degradation and observed adsorption of all of the pigments except
for carotene.4 In the early 1900s, these findings motivated Dr. Tswett to develop an
analytical method for the separation of chlorophyll, xanthophyll and carotene. Tswett
utilized column chromatography in which calcium carbonate adsorbent was packed into a
glass column followed by the addition of petroleum ether chlorophyll solution as mobile
phase. As the mobile phase with chlorophyll passed through the adsorbent phase, the
pigments would separate based on their affinity to the calcium carbonate, generating a
chromatogram that showed distinct colored bands.

2
1.1.2 Types of Chromatography
1.1.2.1 Homogeneous vs. Heterogenous. Since the 1900s, the utilization and
popularity of chromatographic separations have grown and branched into different
categories. While there are numerous types of chromatography, the three mentioned here
depend on: (1) different physical states, (2) types of interaction between analyte and
mobile/stationary phase and (3) the shape of stationary phase.5 Chromatography
distinguished by physical states are homogenous (same phases) and heterogenous
(different phases) chromatography. Homogenous chromatography separates compounds
through solute distributions between two liquid phases, one mobile and the other
stationary. Affinity for each phase determines the solute distribution similar to the
concept of liquid-liquid extraction. Common heterogeneous forms of chromatography are
gas and liquid chromatographies (GC and LC) which both incorporate a solid stationary
phase. A column or capillary bed is packed with small solid particles and a gas or liquid
mobile phase is passed through the stationary phase. Analytes with varying polarity will
interact less or more strongly with the stationary phase where stronger interactions result
in longer retention times.
1.1.2.2 Adsorption vs. Partition. Chromatography can also be categorized according
to several types of interactions between the solute and mobile/stationary phase where
partitioning and adsorption are considered the most common. In liquid chromatography,
an immobilized liquid can act as a stationary phase, allowing for partitioning to occur.
For example, water can form hydrogen bonds with a silica support which forms an
immobilized liquid monolayer covering the stationary surface. As the mobile phase

3
carries analyte through the column or capillary, the analyte will tend to stay in the liquid
phase that shares a higher affinity. If the immobilized liquid is more polar than the mobile
phase, then polar analytes with retain longer during the run. The simplest example of
partitioning chromatography would be performing a liquid-liquid extraction where two
immiscible liquids are forcefully mixed to separate polar and nonpolar solutes. The polar
solutes would distribute in the aqueous phase while the nonpolar would distribute into the
organic phase based on their partition coefficient.
The concept of adsorption also depends on affinity and polarity similarly to
partitioning. The analytes in the mobile phase will interact with the solid stationary phase
strongly or weakly depending on the polarity of the solid support. If the solid stationary
phase is more polar than the mobile phase, then polar analytes will adsorb and be retained
longer than less polar analytes.6 Functionalization of the columns and capillaries with
moieties that vary in polarity will alter the partitioning and adsorption effects during
chromatographic separations. For example, carbon chains with increasing length will
decrease the polarity of the solid support while the addition of alcohols or carboxylic
acids will increase the polarity.
1.1.2.3 Columnar vs. Planar. Another way to distinguish types of chromatography is
based on the shape of the stationary phase. Columnar and planar chromatography are the
most commonly shaped solid supports. In column chromatography, the stationary phase
is cylindrically shaped and packed with adsorptive material. On the other hand, planar
chromatography utilizes flat stationary phases that are either entirely made up of
adsorbent or layered onto an inert flat surface. Examples of column chromatography are

4
GC and LC/high-performance LC (HPLC) while planar includes paper, thin-layer
chromatography (TLC) and high-performance TLC (HPTLC).7,8
1.1.3 Main Chromatographic Modes
As mentioned before, the stationary phase in chromatography can be modified to
establish control over the desired separation. This control allows scientists to operate
under different modes of retention. For the sake of this research project, the four main
modes that will be distinguished and discussed are: (1) normal phase (NP), (2)
hydrophilic interaction (HILIC), (3) reversed-phase (RP) and (4) aqueous-normal phase
(ANP) chromatography. Each mode can be distinguished by the type of stationary phase
and mobile phase used, along with their interaction with analytes of interest.
1.1.3.1 Normal Phase. NP chromatography incorporates a polar stationary phase and
a non-polar mobile phase in order to retain and separate polar compounds. Examples of
polar stationary phases would be bare silica (Si-OH) and functionalized solid support
with polar moieties such as alcohols, carboxylic acids, amino and cyano groups.
Examples of non-polar mobile phases used in NP mode would be hexane and
tetrahydrofuran (THF). The mobile phase may be mixed with other moderately non-polar
solvents such as chloroform, isopropanol and ethyl acetate to alter the retention of the
non-polar analytes. In this mode of chromatography, non-polar compounds would elute
first, followed by moderately non-polar and finally polar compounds.
1.1.3.2 Hydrophilic Interaction (HILIC). HILIC is named based on the hydrophilic or
“water loving” interaction between the analytes and the mobile/stationary phase. This
technique is used to separate polar and ionic species in a mixture. The HILIC

5
chromatographic mechanism operates in the same manner as NP mode where non-polar
compounds elute first followed by polar ones but differs in mobile phases. While HILIC
uses polar solid supports, similarly to NP chromatography, the mobile phase differs by
incorporating a mixture of organic and aqueous solvents. The organic mobile phases used
in HILIC are more polar than hexane, typically used in NP and are miscible with water.
Typical solvents used are methanol, acetonitrile and isopropanol. HILIC separations
differ from NP by utilizing partitioning effects to separate analytes in a mixture.
1.1.3.3 Reversed Phase. The next mode is referred to as reversed-phase
chromatography and is currently the most popular mode of separation. Named for
operating in an opposing manner to NP chromatography, this technique retains non-polar
compounds and elutes the polar ones. RP stationary phases typically incorporate
hydrocarbon chains and rings such as C8, C18 and phenyl. Increasing the length of the
carbon chain will increase the hydrophobicity of the column such that C18 columns
demonstrate more retention of non-polar solutes than C8 columns. The mobile phases
used in RP chromatography are like HILIC where water soluble organics are used, albeit
higher proportions of water is used to elute the polar compounds earlier during analysis.
1.1.3.4 Aqueous-Normal Phase. Last to be discussed is aqueous-normal phase
chromatography (ANP) which is unique to the former modes mentioned. ANP is a
technique that requires the use of a special variety of silica particle, known as Type-C.
The surface of Type-B silica particles is made up of Si-OH groups while Type-C silica
particles incorporate silica hydride (Si-H). More information regarding these particles
will be discussed in Section 4. The mobile phases used in ANP mode are similar to those

6
used in HILIC mode. While the mechanism of ANP has not been fully understood, this
type of chromatography has demonstrated both NP-like and RP modes of separation.9
Given two compounds, one with hydrophilic characteristics and the other with
hydrophobic ones, both can be retained and separated by altering the mobile phase
composition from high to low organic or vice versa. Figure 1 below shows a retention
map for an ANP compound and a RP compound on an ANP column. These stationary
materials allow for more flexible analysis of hydrophilic and hydrophobic mixtures
where at higher organic content non-polar solutes will elute first leaving polar solutes
last. The opposite occurs when higher aqueous solvent is used to elute polar compounds
before the non-polar ones. Another unique ability of the ANP mode is when a compound
has both hydrophilic and hydrophobic properties the retention map at varying mobile
phase compositions forms a “U” shape (Figure 2).
Figure 1. Dual retention of an ANP compound and a RP compound. The ANP compound retains as organic mobile phase composition increases while the RP compound retains at lower organic percentages.
0
10
20
30
40
50
60
70
0 10 20 30 40 50 60 70 80 90 100
% Organic In Mobile Phase
ANP Compound
RP Compound

7
Figure 2. A “U” shaped retention map of a hybrid hydrophilic/hydrophobic compound using an ANP stationary phase. This graph demonstrates the effect of ANP mode on compounds with hybrid hydrophobicity such as peptides. Retaining strongly at low organic, weakly at 50% and strongly again at high organic.
1.1.3.5 Other Modes of Separation. There are many other forms of chromatography
such as ion exchange (IEC) and size exclusion (SEC). The former focuses on separating
charged species while the latter is based on molecular size. Ion exchange can be
separated into three categories: 1. cation-exchange, 2. anion-exchange and 3.
zwitterionic-exchange. The concept of ion exchange is based on weakly bound ions in
solution trading places with stronger ionic species. Stationary phases for this
chromatography incorporate covalently bound polymers with ionic groups. Mobile
phases contain buffers dependent on the stationary phase used such that cation-exchange
supports will require cationic buffers. The cations in solution will bind to the covalently
bound anions and once a stronger cation approaches; coulombic forces will dictate the
exchange of ions. This same phenomenon will occur with anions and zwitterions
differing only with stationary and mobile phases used. The example below shows the
exchange between the weak ions (B+/-) and the strong ions (C+/-).
0
5
10
15
20
25
30
35
0 10 20 30 40 50 60 70 80 90 100
% Organic In Mobile Phase
Hydrophobic & Hydrophilic Compound

8
1. 𝑅𝑅 − 𝐴𝐴+/− − 𝐵𝐵+/− + 𝐶𝐶+/− (Before ion exchange occurs)
2. 𝑅𝑅 − 𝐴𝐴+/− − 𝐶𝐶+/− + 𝐵𝐵+/− (After ion exchange occurs)
(“R” is the polymer bound to solid support and “A+/-” is the permanent ion attached to the polymer.)
SEC has several different forms but the two most common in this field are gel
filtration (GFC) and gel permeation (GPC). This type of chromatography is typically
used for macromolecule separation. Both GFC and GPC operate in a similar manner
where the mobile phase, aqueous for GFC and organic for GPC, carries analytes of
various sizes through a column with porous particles. Analytes that are smaller than the
pores of the stationary phase will spend more time traversing through the numerous
pathways than larger molecules. Since the larger molecules bypass the pores, their overall
pathlength is shorter leading to earlier elution.
1.2 High Performance Liquid Chromatography
Liquid chromatography has undergone vast improvements since its discovery. In the
early 1940s, Drs. Martin and Synge proposed the idea that to increase efficiency of
separations smaller particles and higher pressures needed to be implemented.10 This idea
continued to gather support and lead to the birth of high pressure liquid chromatography.
The word “pressure” in the name of this technique was later changed to “performance” as
the first HPLC systems were commercialized in the late 1960s.11 To date, modern HPLC
has advanced to ultra-performance liquid chromatography (UPLC or UHPLC) which
allows stable analysis at pressures greater than 1000 bar.12 This analytical technique
offers advantages such as improved qualitative/quantitative analyses, reproducibility,
high sensitivity, high resolution of molecular mixtures and increased cost efficiency. The

9
rapid growth of HPLC has made it one of the most popularly used analytical techniques
and covers a wide range of applications.
1.2.1 Applications in Modern HPLC
Of many applications, five frequently utilize the efficiency and precision of HPLC.
The first are pharmaceutical and bioanalytical separations such as quality control (QC)
and compound purification. The advantages mentioned before, allow QC analysts to
separate and verify precise concentrations of compounds in compliance with FDA
guidelines and regulations. For example, separation of metabolites in medicinal plants is
necessary for Good Manufacturing Practices and requires robust separation techniques to
quantify specific compounds.13,14 Next is within the field of forensic science, where
HPLC’s specificity and sensitivity are used to solve a variety of criminal cases. Examples
of applications in forensics include detection of squalene from fingerprints,
distinguishing ballpoint pen ink and detection of illegal substances in biological fluids
such as narcotics and amphetamines.15,16
Food science is another popular area due to society’s interest in determining both
health beneficial and detrimental substances in consumable goods. HPLC allows food
scientists to quantify favorable compounds such as flavonoids, polyphenols, antioxidants,
minerals and amino acids rapidly and efficiently. On the other hand, they can also
monitor carcinogens, pesticides and steroids with extremely high sensitivity
(femtomoles).17-19 The fourth useful application of HPLC is in environmental analysis of
soil and water samples. Similar to the pharmaceutical and forensic fields, the sensitivity
of this analytical technique allows for proper regulation of neurotoxins, herbicides and

10
other environmental/ecological contaminants.20-22 Last but not least, is the utilization of
HPLC in research and development. Whether it be for qualitative or quantitative
information, HPLC is essential for most laboratories because of the precision, accuracy,
reproducibility and sensitivity that it boasts. Technological and engineering
advancements of the HPLC system and components has impacted the speed, efficiency
and cost of sample analysis worldwide.
1.2.2 Instrument Components
There are five major components to an HPLC system: 1. Solvent Manager, 2.
Injector, 3. Column/Column Oven, 4. Detectors and 5. Computer/Software.
1.2.2.1 Solvent Manager. The solvent manager consists of a solvent reservoir to hold
several reagent bottles and pumps to force mobile phase to flow from the bottles
throughout the system. Additionally, solvent managers may incorporate degassing to
remove dissolved oxygen, pulse dampeners to absorb pump pressure fluctuations and
solvent mixers allow the use of gradient methods. The most common solvents used in
HPLC are deionized water, acetonitrile, methanol, tetrahydrofuran, isopropanol and
ethanol. Factors to consider when choosing a particular solvent are the viscosity,
inertness and miscibility with other solvents. Highly viscous solvents require more
pressure to pass through the system which may lead to pump failure, system leaks,
column damage, inconsistent peak shape or false peaks. Inert solvents will not interact
with dissolved solutes preventing interference between them and the stationary phase.
Solvents that are miscible with each other allow for consistent elution during analysis.
Additionally, the ultraviolet (UV) cut off range is important because UV detectors

11
(mentioned later) are common in HPLC practice. The UV cutoff is important because
solvent that absorbs UV light will interfere with samples analyzed at specific
wavelengths. For example, the UV cut off for acetonitrile and methanol is 210 nm while
ethyl acetate’s is 260 nm making acetonitrile/methanol a better solvent choice when
analyzing compounds between 210-260 nm. The ideal solvent manager is capable of
delivering solvent at a variety of flow rates (0.1 – 5 mL/min), operating at high pressures
and generating a stable baseline.
1.2.2.2 Injector. The injector component incorporates a sample plate or tray, a fine
needle and an injection loop. An ideal injector unit is capable of picking up precise
amounts of sample and introducing that sample to the mobile phase in an accurate and
highly reproducible manner. Typical HPLC systems use sample plates or trays that hold
vials (removable) or wells (fixed) containing small volumes of sample solution. The
needle or syringe picks up a precise amount of solution from the vial/well, usually 1 to
100 uL, which is then transferred (manually or automated) to an injection loop that holds
the sample prior to introduction into the mobile phase. Two common types of injection
loops are fixed loops where an exact amount of sample completely fills the loop, and
partial loops hold a small amount of sample with the remaining volume consisting of the
mobile phase. The sample held in the loop is then introduced to the mobile phase as a
rectangular “plug” by a switching valve and flows in a laminar fashion. Ideal resolution
of the plug gives a perfect Gaussian profile; although viscosity of sample/solvent,
pressure variance and injection of large sample volumes may be detrimental to the peak
shape.

12
1.2.2.3 Column. A typical chromatographic column is made up of an outer cylindrical
tube, frits and solid packing material. The tube is made of inert material such as stainless
steel or chemically/physically strong plastic such as polyetheretherketone (PEEK).
Dimensions of an HPLC column range from 30 – 250 mm in length and 0.05 – 10 mm
for internal diameter. Analytical columns can be classified based on the size of internal
diameter from standard (3 – 4.6 mm) to nanoscale (0.05 - 0.2 mm). Modern HPLC
advancements are moving towards smaller columns due to the use of smaller packing
material. Reasons for developing smaller particles will be discussed in the parameters
section below. The column frits are small porous disks made with similar inert material
as the cylindrical tube but are positioned between the packing material and the entrance
and exit of the column. Frits are designed to allow mobile phase to pass through the
column and prevent the stationary phase from leaving. The most important part of the
column is the packing material which is often composed of small spherical and inert
particles (Si-OH, Si-H, Polymer). The two main physical features of these particles are
surface area and particle size which both contribute to the retention ability of the column.
There are two types of particles, porous and core-shell (solid core and porous outer layer)
which typically vary in size from 3 – 5 um. An active phase can be chemically or
physically bound to the bare particles generating a variety of columns such as the C8,
C18, phenyl, amino, etc. Different active phases will demonstrate varying stability,
chemical nature and surface reactivity making their effect on molecular separations
unique to each other. Additional components can be coupled to enhance or protect a

13
column such as a column oven (allowing temperature control) and guard columns (block
highly retaining particles).
1.2.2.4 Detectors. Sample detection is necessary in all fields of analytical chemistry
to exploit physical/chemical properties presenting qualitative and quantitative
information of analytes. Ideal detectors should be extremely sensitive, give reproducible
response, cause minimal peak broadening and maintain robust stability under
flow/pressure variance. Detectors used to measure analyte concentration in HPLC
convert an electrical signal into a chromatogram. The chromatogram below (Figure 3)
displays an intensity (arbitrary units) against time, resulting in a peak unique to the
analyte in question.
Figure 3. Example of a Chromatogram.
Area under the Gaussian curve is then calculated and compared to oscillating
electrical output, also known as a signal to noise ratio (acceptable when signal/noise > 3).
There are numerous detectors used in HPLC analysis but this paper will focus on UV-
visible and MS detectors. UV-vis detectors utilize a light source that produces
monochromatic light (200 – 600 nm) directed through a flow cell. The light is then split,
where one portion interacts with sample in solution and the second goes directly to a
-0.20
0.20.40.60.8
11.21.41.61.8
0 1 2 3 4 5 6 7 8 9 10
Sign
al (m
AU)
Retention Time (Min)

14
reference detector. Interaction between specific wavelengths (λ) of light and sample in
solution can be measured based on transmittance (T) and absorbance (A). Transmittance
is the relation between intensity of light passing through a blank solution (no analyte) vs.
intensity transmitted through a sample solution (Equation 1). Absorbance is the logarithm
(log10) of the inverse of transmittance (Equation 2) and is necessary to calculate the molar
concentration (χ) according to the Lambert-Beer law (Equation 3). By rearranging the
Lambert-Beer law and utilizing calibration and/or standard addition curves quantification
of light absorbing compounds is possible. Variable-wavelength detectors such as
photodiode array detectors (PDA) or diode array detectors (DAD) allow for analysis at
multiple wavelengths at one given time. PDA/DADs are extremely useful in determining
optimal wavelengths in unknown sample solutions but are considerably more costly than
single wavelength detectors.
Eq. 1. T = I1/I0
Eq. 2. A = log10(1/T)
Eq. 3. A = ελ[χ]L
Mass spectrometers are another form of detectors that continue to grow in popularity
and common practice due to their high sensitivity and selectivity. MS detectors are used
to distinguish molecules based on their mass to charge ratio (m/z) and do not necessarily
need to resolve a set of peaks to do so. By focusing on a precise m/z, one can differentiate
between compounds that coelute. The ionization of molecules is of utmost importance for
MS detection. In LC-MS, soft ionization techniques such as electrospray ionization (ESI)
and atmospheric pressure chemical ionization (APCI) are employed. Both techniques

15
seek to ionize molecules of interest while leaving solvent molecules uncharged but each
form ions differently. ESI incorporates an electrically charged (3-5 kV) capillary carrying
mobile phase and analyte which is nebulized into fine droplets. The droplets are then
vaporized by heated gas, evaporating most of the solvent and eventually ionic repulsion
leads to the formation of individual ions. APCI operates with a heated capillary which
vaporizes the mobile phase and analytes before inducing charge. The gas formed after
heating is then mixed with N2 or O2 gas and forced to pass a corona discharge
electrode/needle (3-5 kV). Charges on vaporized solvent and added N2/O2 migrate to the
analytes based on differences in polarity. The molecules can be positively or negatively
charged depending on their gas phased basicity (GPB) or acidity (GPA). The tendency
for molecules to gain a proton (amines) follows the GPB phenomenon and the tendency
to lose a proton (carboxylic acids, carbohydrates) coincides with GPA. These concepts
can be characterized by free enthalpy change where ΔG0GPB < ΔG0
GPA (most molecules)
and supports that positive ions form more easily in comparison to negative ones. The
individual ions are then funneled to a mass analyzer such as a quadrupole, ion trap or
time of flight (TOF). Resolution of m/z is lower with single mass analyzers because the
molecular ions formed do not tend to fragment. Coupling mass analyzers together allows
for tandem MS analysis (LC-MS/MS) where parent ions are first isolated, fragmented in
a collision cell and finally analyzed based on daughter ions. Various LC-MS/MS systems
demonstrate high resolving power also known as the ability to distinguish between two
peaks.

16
1.2.2.5 Computer and Software. The last component to be discussed is the computer
and software which convert the electric signal produced from the detector into a
chromatogram. The data is collected and saved for further analysis depending on the
needs of the chemist. Software is proprietary and usually distributed with similar branded
instrumentation but some software may be compatible with varying manufactured
instruments. Typical software allows an analyst to prepare methods and sequences, adjust
system parameters (temperature, flow rate, mobile phase composition, injection volume,
etc.) and analyze data. Data analysis generates information such as retention time, peak
width, peak height, peak area and S/N ratios. Modern programs offer auto-integration of
peak areas but also allow the user to manually integrate when necessary.
1.3 HPLC Parameters
1.3.1 Resolution
Of the many equations that are associated with HPLC, there are two main ones,
resolution (R) and the Van Deemter equation. The former calculates the ability to
distinguish between any two peaks during a run, while the latter accounts for peak
broadening. Resolution consists of three parameters which are: retention factor (k),
selectivity (α) and efficiency (N). Equation 4 shows the simplest way to define the
resolution where only retention time and peak width are taken into account while
Equation 5 incorporates retention factor, selectivity and efficiency. Good resolution is
associated with complete peak separation, where R > 1 and can be controlled by altering
the other parameters.
Eq. 4. 𝑅𝑅 = 2[𝑡𝑡𝑅𝑅(𝐴𝐴) − 𝑡𝑡𝑅𝑅(𝐵𝐵)]𝑊𝑊𝑏𝑏(𝐴𝐴)+ 𝑊𝑊𝑏𝑏(𝐵𝐵)

17
Eq. 5. 𝑅𝑅 = 14
(𝛼𝛼−1𝛼𝛼
)( 𝑘𝑘1+𝑘𝑘
)√𝑁𝑁
1.3.1.1 Retention Factor. The retention factor “k”, also known as capacity factor, is
needed to characterize specific peak retention and is independent of flow rates and
column dimensions. One way to describe the retention factor is as a ratio between
reduced retention time (tR – t0) and the dead time (t0), shown in Equation 6. The retention
time corresponds to the analyte of interest while the dead time refers to an analyte that
has no affinity for the stationary phase. For example, KNO3, a polar inorganic salt, will
not retain on nonpolar stationary phases such as C8 or C18 functionalized columns. Dead
time can also be related to dead volume which is described as the volume of mobile phase
that passes through a column from the beginning of an injection. Retention factors are
positioned between 2 and 10, where compounds that demonstrate a value less than 2
indicate poor retention and a value above 10 shows that the compound is too strongly
retained.
Eq. 6. 𝑘𝑘 = 𝑡𝑡𝑅𝑅−𝑡𝑡0𝑡𝑡0
1.3.1.2 Selectivity. The selectivity parameter “α” compares the retention of multiple
analytes in solution. Selectivity can be controlled by altering mobile and stationary
phases but is also specific to the nature of the solute. Consider two analytes A and B in
solution are injected into an HPLC system and separated by a chromatographic column.
The selectivity of these two analytes is dependent on the ratio of their retention times
where a higher α value indicates greater separation (Eq. 7 below). Since selectivity is
observed from the apex of peaks, regardless of how high α is determined to be, peak
broadening may be large enough to prevent full separation.

18
Eq. 7. 𝛼𝛼 = 𝑡𝑡𝑅𝑅𝐵𝐵𝑡𝑡𝑅𝑅𝐴𝐴
(Assumes tRB > tRA)
1.3.1.3 Efficiency. The last characteristic parameter in controlling resolution is
efficiency which can be expressed as a number of theoretical plates “N”. A theoretical
plate can be described as a fraction of column where an equilibration event occurs
between the mobile and stationary phases. N is directly related to peak broadening and is
used to determine a column’s efficiency where high values for N give narrower peaks.
The plate number is derived from the height equivalent of a theoretical plate (HETP)
which relates peak variance to the length of the analytical column. Two ways to solve for
N are shown below in association with column length or retention time.
Eq. 8. 𝑁𝑁 = 𝐿𝐿/𝐻𝐻 or 𝑁𝑁 = 16� 𝑡𝑡𝑅𝑅𝑊𝑊𝑏𝑏
1.3.2 Van Deemter Equation
Even though HPLC systems utilize high pressure pumps to push mobile phase
through the column at constant flow rates, diffusion and the kinetics related to the process
still transpire. The Van Deemter equation accounts for all possible forms of diffusion
occurring within the column and stationary phase, consisting of five types: longitudinal,
eddy, lateral movement due to convection, mass transfer in/out of the stationary and
stagnant mobile phase diffusions. Equation 9 below shows how each form of diffusion
contributes to the height of a theoretical plate.
Eq. 9. 𝐻𝐻 = 𝐻𝐻𝐿𝐿 + 𝐻𝐻𝐸𝐸 + 𝐻𝐻𝐶𝐶 + 𝐻𝐻𝑇𝑇 + 𝐻𝐻𝑆𝑆
The first and most common form in HPLC is longitudinal diffusion which occurs
when a concentrated region (in liquid or gas) disperses to equally fill the surrounding area

19
over time. Longitudinal diffusion through the column depends on several factors such as
particle obstruction (silica bed), the linear flow rate, the nature of solvent and the
dimensions of the column/packing material. Second, is eddy diffusion which takes place
due to the groups of molecules spreading out within the stationary phase and following
different paths. This type of diffusion is directly related to how well the column is packed
and how uniform the particles are. The main factors in determining the effects of eddy
diffusion on plate height are column packing and average particle diameter.
The next form is the first of three mass transfer diffusions and refers to the lateral
movement of material caused by convection of the mobile phase. The convection of
molecules in the mobile phase during HPLC analyses is directly related to particle
diameter, velocity of mobile phase and the diffusion coefficient. Fourth is the mass
transfer of solutes in and out of the stationary phase. The particular mass transfer depends
on adsorption/desorption kinetics between the solute and stationary, the morphology of
the packing material (i.e. shape, thickness) and the diffusion coefficient. Finally, the last
form of mass transfer diffusion needing to be considered is the transfer of solute in/out of
stagnant mobile phase within porous media. This method of diffusion is governed by the
particle shape, pore depth and the diffusion coefficient. Combining all the parameters
provides the Van Deemter equation, relating each type of diffusion with linear velocity
and HETP where constant “A” accounts for eddy, “B” for longitudinal and “C” for mass
transfers (combines convection, in/out of stationary and in/out of stagnant mobile
phase).23
Eq. 10. 𝐻𝐻 = 𝐴𝐴 + (𝐵𝐵 × 1𝑢𝑢
) + (𝐶𝐶 × 𝑢𝑢)

20
1.4 Stationary Phase - Silica
1.4.1 Advantages
Inorganic, polymer and hybrid materials have been researched for solid support
foundations in the synthesis of HPLC stationary phases. Of these materials, inorganic
particles such as silica, metal oxides, graphite and hydroxyapatite are most commonly
used in modern applications.24 Silica demonstrates characteristic advantages making
silica the most popular choice for adsorbent material. Three main advantages are
mechanical robustness, chemical/thermal stability and flexible control of surface area,
pore size and pore diameter. Mechanical strength is tested by increasing pressure and
observing any variance in flow rates due to uniformity change or particle damage. The
chemical and thermal stabilities are determined by exposing the materials to different pH
and temperature environments followed by efficiency testing. Lastly, the surface area,
pore size/diameter can be characterized with scanning electron microscopy (SEM),
transmission electron microscopy (TEM) and nitrogen adsorption studies.25 Even with
these beneficial characteristics, silica has been continuously improved over the years.
1.4.2 Evolution of Silica
The first silica particles (Si-OH) used as adsorbent material for HPLC were not made
uniformly and varied in size and shape. These “irregularly shaped silica” materials gave
little reproducible data and limited scientists to using NP chromatography. Another issue
with the irregular shape is the susceptibility to produce fines under mechanical stress.
Particle fines can accumulate and result in unstable packed beds and column/system
clogging. These issues lead to the production of spherical and uniformly dimensioned

21
silica via a sol-gel process, also referred to as type A. Type A silica provided evenly
packed beds which increased column lifetime and stability. Despite this advancement,
trace metals found in the silica framework prevented proper solute-silanol interaction
when solutes were ionized. The desire to decontaminate type A silica directed the
chromatographic community towards the high purity form, type B silica. Type A silica
was purified through acid treatments added to the sol-gel process. Type B silica
demonstrated improved peak shapes and further increased mechanical/chemical stability.
Even with the progression from irregularly shaped to high purity type B silica, the
residual silanol groups left analysts with several issues.
These free silanols may be detrimental for separations if they electrostatically interact
with solutes. Scientists have tried end-capping with methyl groups to reduce this issue but
in doing so limited the pH range for analysis (pH 5-8). Lower pH will lead to the
hydrolysis of these end caps and higher pH results in dissolution of the silica bed.
Another problem that arises during analysis using type-B silica is an accumulation of
adsorbed water. If water is present in the mobile phase, over the course of a run, a quasi-
liquid layer will form and grow with further hydrogen bonding resulting in partitioning
effects. The effects of partitioning are detrimental in gradient analyses (variation of
mobile phase composition with time) and equilibration times.26 The solution to these
issues was the development of Type-C silica which incorporates a Si-H particle surface
instead of Si-OH. Since there are minimal amounts of Si-OH groups (<5%) the
monolayer of adsorbed water is almost nonexistent. In addition to this improvement,
Type-C silica maintains the uniform shape and high purity that type-B has to offer

22
without needing end-capping to operate in standard pH ranges (2.5 – 7.5). Another
unique capability mentioned before in Figures 1 and 2, is the use of the ANP mode
(selective to Si-H stationary phases) for dual retention on a single column. Type-C silica
has numerous applications supporting its growth as the next generation of silica
materials.
1.5 Synthesis of Si-H
1.5.1 Silanization
For the synthesis of silica hydride materials, two silanization reactions were tested.
The first involves converting the silanols to Si-Cl by reacting with thionyl chloride.
Reduction from Si-Cl to Si-H is carried out with lithium aluminum hydride. One
constraint with this reaction is that it must be performed in a completely dry environment.
Since the Si-Cl moieties are unstable in the presence of water, they are likely to return to
their former Si-OH form. The second reaction is the condensation of the silanols to the
hydride form through interaction with triethoxysilane. Unlike the first reaction, this one is
not as sensitive to water and even utilizes an aqueous acid catalyst. A schematic of the
reaction is shown below in Figure 4.
Figure 4. Silica hydride synthesis. Silanization performed on Si-OH materials with triethoxysilane to yield Si-H materials.

23
1.5.2 Hydrosilation
Hydrosilation offers a wide array of attachment options outside of typical stationary
phase functionalization. The best example is the formation of doubly bound carbon when
an alkyne is used instead of an alkene. The carbon forms a single bond to two Si-H
neighbors giving high stability bidentate ligands on the stationary surface. Figure 5 shows
the basic reaction scheme for hydrosilation.27
Figure 5. Functionalization of silica hydride by hydrosilation. An alkene (or alkyne) is reacted with silica hydride materials in the presence of hexachloroplatinic acid catalyst giving a silicon-alkyl (two silicon-alkyl bonds if an alkyne was used) covalent bond.
1.6 Research Aims and Goals
This thesis project is aimed towards the characterization of four Type-C silica
columns through the analysis of retention maps based on resveratrol analogues.
Resveratrol, a phenolic compound commonly found in red wines, grape skin and other
berries has been associated with health beneficial effects such as fighting heart disease
and cancer.28-30 Although these benefits are attractive, resveratrol has limitations such as
solubility issues and poor bioavailability.31 Two solutions would be to derivatize
resveratrol or to use other analogues with similar health benefits.32,33 The latter solution is
most relevant to this research, in that the separation of the resveratrol analogues is
important for future work in characterizing them individually. In addition, compounds of

24
similar structure are more challenging to separate and by achieving separation allow for
more detailed analysis of each column’s retention capabilities.
The four columns (Diamond C18, Bidentate C18, phenyl and diol) share a silica
hydride surface yet are uniquely functionalized. The Diamond C18 and Bidentate C18
columns are expected to exhibit retention on all the non-polar compounds. The diol
column is expected to retain polar compounds while the phenyl functionalized column
should interact more with those compounds with higher degrees of unsaturation. The
resveratrol analogues were analyzed using UV detectors coupled to HPLC instruments;
observed wavelengths ranged from 220 nm to 335 nm. Solvents used were acetonitrile
with 0.1% formic acid, deionized water with 0.1% formic acid and methanol with 0.1%
formic acid (all solvents were at least HPLC grade). An additional study was performed
observing retention of a small set of acidic, basic and neutral compounds. Future studies
may include varying pH or temperature and analysis of folic acid derivatives.

25
Chapter 2: Experimental and Methods
2.1 Columns
Four Type-C silica columns were used for this project: Bidentate C18, Diamond C18,
phenyl hydride and diol (Figure 6).
Figure 6. Tested Column Structures.
The Bidentate C18 incorporates a chain of 18 carbons with two covalent bonds to two
neighboring silicon atoms, making the column extremely robust in comparison to other
C18 columns. In addition to RP mode, the Bidentate C18 can also be used in NP and/or
ANP when using higher percentages of organic mobile phase. The Diamond C18 is a
cross between the Bidentate C18 and Diamond Hydride columns where the surface has
both C18 moieties and shorter carbon chains. This column is still in the testing stages but
is expected to exhibit similar abilities as the Bidentate C18, albeit slightly stronger effects
on non-polar compounds.

26
The third column, phenyl hydride, employs short chained phenyl groups which have
high selectivity for aromatic compounds and those with high degrees of unsaturation.
Finally, the Diol column consists of short chain diol groups which have higher selectivity
for polar compounds and those susceptible to hydrogen bonding. None of the columns
mentioned require end capping and are all compatible with mass spectrometry. Table 1
below shows the various column specifications including pore size/volume, column
dimensions, pH ranges, maximum temperature, carbon loads and part/serial numbers.
Table 1. Column specifications. Includes column dimensions, particle dimensions, carbon load, pH ranges and maximum operating temperature.
2.2 Instruments
Three HPLC instruments used for this characterization project were a Perkin Elmer
(PE) Flexar UPLC and two Agilent 1200 Series HPLC units. The PE instrument was
equipped with both a UV-Vis detector and a single quadrupole MS detector (Figure 7).
Only the UV-Vis detector was used for this project. The other components include
solvent manager, autosampler (100 well plate), pumps/purging unit and Chromera

27
software. The PE Flexar UPLC was used to collect acetonitrile data for all four columns.
Software issues, instrumental failure and instrument location were detrimental for a
portion of the study and will be discussed further in the following chapter.
Figure 7. Perkin Elmer Flexar UPLC.
The Agilent 1200 Series HPLC units differed slightly in their respective components,
but overall, instrumentation was identical (Figure 8). The first unit used is equipped with
a G1322A Degasser, G1311A Quaternary Pump, G1315D DAD, G1316A Thermal
Column Compartment (TCC), G1367B HiP-ALS and G1330B FC/ALS Thermostat. The
second unit is equipped with a G1379B Degasser, G1312B Bin Pump SL, G1315C DAD
SL, G1316B TCC SL, G1367D HiP-ALS SL + and G1330B FC/ALS Thermostat. Both
instruments operate with ChemStation software. The main difference between the

28
degassing units is the vacuum chamber volume in that the G1322A is 12 mL versus the
G1379B is 0.5-1.0 mL. The G1379B saves solvent by wasting less during routine
flushing but has been associated with more failures than the former.34
Figure 8. Agilent 1200 Series HPLC
The pumps differ slightly in that the quaternary is capable of mixing up to four
solvents during a gradient while the binary is limited to two. In addition, the G1311A
model’s maximum operating pressure is 400 bar while the G1312B model can handle up
to 600 bar, allowing for UPLC analysis.35 The detectors are identical in all aspects except
that the G1315C can acquire data at a higher rate, 80 Hz compared to 20 Hz. TCC units
are identical but the G1316B delivers more stable temperatures and offers a maximum

29
temperature of 100℃. The difference between autosamplers is merely that the D model is
compatible with a higher pressure (600 bar). Finally, the thermostats are identical for
both instruments.
2.3 Chemicals and Compounds
2.3.1 HPLC Solvents
Methanol and acetonitrile were the main solvents used for the characterization of the
four Type-C columns. Formic acid was used as buffer in both methanol and acetonitrile
(0.1%). HPLC to MS grade solvent was used, and the solvent is devoid of air, small
particles and signal interferants. The solvents were acquired from Sigma-Aldrich,
Omnisolv and Fisher Scientific manufacturers.
2.3.2 Resveratrol Analogues
Resveratrol and similar compounds were provided by Monash University in
Melbourne, Australia. All compounds were of high purity, in powder form and delivered
in small amber vials (1-2 mg of each compound). Each compound was dissolved in
HPLC grade acetonitrile and vortexed/sonicated to give sample concentrations of 1
mg/mL. All standard samples of resveratrol and analogues were stored in amber vials and
refrigerated at -4 ℃. Injected samples were diluted 10-fold using 100uL polypropylene
vial inserts at a final concentration of 0.1mg/mL. Figure 9 below shows the structure of
each compound and their respective IUPAC names. All compounds were labeled from
MH 1 to MH 23 and will be referred to as such throughout this paper.

30
Figure 9. Resveratrol Analogues. Depicts the structures, IUPAC names and partition coefficients of the various resveratrol compounds. (ChemSketch Software and Molinspiration Property Engine)
2.3.3 Acidic, Basic and Neutral Compounds
The acidic, basic and neutral compounds were acquired from Sigma-Aldrich in high
purity. Two acidic compounds were used, ketoprofen and 2-nitrobenzoic acid.
Ketoprofen is a common non-steroidal anti-inflammatory drug while 2-nitrobenzoic acid
is an intermediate used to synthesize a variety of chemicals. The basic compounds
analyzed were amitriptyline and diphenhydramine. Amitriptyline is an

31
antipsychotic/antidepressant drug while diphenhydramine is a widely used sleep aid and
allergy medicine. The last compounds of this set are neutral: anisole, naphthalene and
ethylbenzene. All three are aromatic and serve as synthetic intermediates in a variety of
reactions. Figure 8 below shows the structures of the acidic, basic and neutral compounds
mentioned above.
Figure 10. Acidic, Basic and Neutral Compounds. Depicts the structure, name and partition coefficient of each compound. (ChemSketch Software and Molinspiration Property Engine)
2.4 Methods
All methods conducted for this project were carried out in the isocratic mode, where
the mobile phase composition and flow rate remained constant throughout each run. Each
set of standard samples were subjected to the same methods where the initial mobile
phase concentration was 90% organic mobile phase (acetonitrile or methanol) and 10%
deionized water. The flow rate was maintained at 0.4 mL/min and the injection volume

32
was set to 1 uL. Subsequent analyses demanded that the mobile phase composition be
reduced by 10% resulting in a range from 90% organic to 10% organic. Wavelengths
observed are depicted below in Table 2.
Table 2. Wavelength Parameter. Wavelengths were chosen based on literary values and collaborator suggestions. The switch to the Agilent 1200 Series instruments allowed for a more thorough investigation of optimal wavelengths.
Instrument Resveratrol Analogues
Acidic/Basic/Neutral Compounds
PE UPLC (UV-Vis)
254 and 308 nm N/A
Agilent 1200 (DAD) 1
220, 254, 280, 308 and 335 nm 254 nm
Agilent 1200 (DAD) 2
220, 254, 280, 308 and 335 nm 254 nm

33
Chapter 3: Results and Discussion
For the purpose of characterizing the four Type-C silica columns, two sets of
compounds were utilized, resveratrol analogues and acidic/basic/neutral compounds. The
resveratrol analogues are used to observe ANP/RP retention and to determine separation
capabilities while the acidic/basic/neutral set is used to characterize the columns based on
specific molecular interactions. Both groups were analyzed using acetonitrile and
methanol mobile phases (both with 0.1% formic acid), ranging from 90% organic to 10%
organic. Samples were prepared between 0.1 – 0.5 mg/mL prior to injection and were run
in triplicate. Tabulated data depict the averaged retention times of each compound and
specify the stationary phase used for the corresponding mobile phase compositions. The
first set of figures are retention plots showing the varying retention times (y-axis) of each
compound from 0 – 45 minutes across the mobile phase spectrum (x-axis). Data
collection was halted for compounds that were retained longer than 45 minutes or if peak
shape was too broad or poor. The second set of figures show stacked and overlaid
chromatograms of the compounds of interest. The chromatograms are separated between
resveratrol compounds and the acidic/basic/neutral set. The tables of data give precise
retention averages while the retention maps give visual understanding to retention trends
between the two groups of compounds. Finally, the stacked overlays show the theoretical
trends of resolution if the components were introduced as a mixture. All data collected
and analyzed were based solely on qualitative information.
The PE UPLC equipped with a UV-Vis detector was used initially for the analysis of
resveratrol compounds with acetonitrile as the mobile phase. Samples weighing between

34
1.0 mg to 2.8 mg were delivered to SJSU from Melbourne, Australia. Stock standards
were initially prepared in amber vials, in minimal light, at concentrations between 1.0 –
1.4 mg/mL using acetonitrile as diluent. A tenfold dilution was performed to give
standard samples concentrations ranging from 0.1 – 0.4 mg/mL prior to injection.
Methods and sequences prepared on Chromera software follow the previously mentioned
parameters. At first, all compounds were observed at 308 nm (recommended by Monash
University and comparable to literature wavelengths).36 Little to no signal was observed
at 308 nm for MH 11-19 and 22. Due to working with small amounts of sample, a UV-vis
spectrometer was not used to determine the optimal wavelength for these compounds.
The wavelength of 254 nm was tested for the aforementioned compounds and was
determined to give sufficient signal for qualitative data. Although the PE UPLC was
equipped with a temperature controlled autosampler (including insulated sample tray
cover), the temperature in the room could not be controlled well. Because of this, the
evaporation of solvent within the HPLC vials was inevitable. Constant refilling of solvent
and re-spiking sample vials significantly affected the concentration of each sample,
resulting in variation of absorbance.
According to the structures and partition coefficients shown in Figure 7, the
unsaturated resveratrol compounds (MH1, 2, 4 – 10) should exude higher retention than
the saturated versions (MH 3, 11-19) for the RP columns, Diamond Bidentate C18 and
Bidentate C18. The phenyl hydride should behave similarly to the previous RP columns
with additional pi stacking interactions. Finally, the diol column is expected to exhibit
ANP retention with more polar compounds. Considering that the resveratrol analogues

35
are considered nonpolar, with the exception of MH 21 (gallic acid), minimal retention is
assumed. Data were compared to the KNO3 dead time and Table 3 gives the expected
trends. Comparisons between the actual and expected trends will be discussed later. The
first and fourth trends are based on the transition from resveratrol to an imine/amine
(MH2/MH12) analogue and finally to an amide (MH3) version. The second and sixth
trends show the subsequent additions of hydroxide groups to stilbene (MH10) and
diphenyl ethane (MH19). Trends #3 and #5 compare the differences between having a
diol plus an unsubstituted benzene or two benzenes with single hydroxide attachment.
The seventh trend evaluates the effect of meta versus para position hydroxide place.
Finally, trend #8 compares resveratrol dimer, two flavonoids (MH22 and MH23) and
gallic acid.
Table 3. Retention trends of resveratrol and analogues based on structure and polarity.
Since the trends mentioned above only account for polarity, it is important to account
for other analyte to stationary phase interactions. The linear solvation energy relationship
(LSER) equation shown below (Eq. 11) gives several possible interactions other than
hydrophobicity that may explain why the expected trends are not absolute.
Eq. 11 log 𝑘𝑘 = log 𝑘𝑘0 + 𝜂𝜂′𝐻𝐻 + 𝜎𝜎′𝑆𝑆 + 𝛽𝛽′𝐴𝐴 + 𝛼𝛼′𝐵𝐵 + 𝜅𝜅′𝐶𝐶
Trend # Reversed Phase Aqueous Normal Phase1 MH1 > MH2 > MH3 MH3 > MH2 > MH 12 MH11 > MH12 > MH3 MH4 > MH1 > MH5 > MH7 > MH9 > MH103 MH8 > MH7 MH7 > MH84 MH16 > MH15 MH3 > MH12 > MH115 MH17 > MH18 MH15 > MH166 MH10 > MH9 > MH7 > MH5 > MH1 > MH4 MH13 > MH11 > MH14 > MH15 > MH17 > MH197 MH19 > MH17 > MH15 > MH14 > MH11 > MH13 MH18 > M178 MH20 > MH1 > MH23 > MH22 > MH21 MH21 > MH22 > MH23 > MH1 > MH20

36
The LSER equation relates retention factor k of various compounds with several
parameters and descriptors associated with the stationary phase.37 Parameters H, S, A, B
and C correspond to hydrophobicity, steric effects, hydrogen bond acidity/basicity and
electrostatic interactions.38 For the scope of this work, these parameters and descriptors
will not be discussed in great detail. However, it is important to account for these
potential interactions when comparing different stationary phases using the same set of
analytes and mobile phase compositions.39 Collaborators from Monash University will be
utilizing the data collected from this project and will calculate these parameters for more
precise characterization.
3.1 Data with Acetonitrile as Mobile Phase
3.1.1 Resveratrol Analogues
From the Diamond Bidentate C18 data shown in Table 4 and Figure 11, the typical
RP trend was observed. As acetonitrile was decreased from 90% to 30% compositions,
retention of all resveratrol analogues was increased. In comparison to KNO3 dead time,
significant retention (k > 2) was seen for 13 of the 22 compounds while the remainder
showed minimal retention (k < 2). When addressing the trends in Table 3, only Trend 1, 2
and 6 were coherent with the expected retention order.

37
Table 4. Diamond Bidentate C18 Capacity Factor “k” (ACN/Resveratrol). Average of in triplicate injections from 30% organic to 90% organic.
Figure 11. Diamond C18 Retention Map (ACN/Resveratrol). Compares capacity factor “k” (y-axis) to percentage acetonitrile mobile phase (x-axis).
30 40 50 60 70 80 90MH 1 2.92 0.71 0.25 0.1 0.02 -0.02 -0.06MH 2 0.54 0.21 0.1 0.05 0.01 0 -0.03MH 3 0.45 0.1 0.01 -0.02 -0.05 -0.05 -0.08MH 4 1.58 0.4 0.14 0.04 -0.01 -0.03 -0.07MH 5 13.29 2.28 0.84 0.42 0.21 0.1 0.03MH 7 3.8 1.3 0.62 0.3 0.15 0.06MH 8 2.76 0.97 0.45 0.21 0.1 0.02MH 9 15.73 4.82 2.16 1.08 0.59 0.29MH 10 24.67 10.07 4.69 2.41 1.1MH 11 0.74 0.29 0.11 0.04 -0.01 -0.03MH 12 0.54 0.37 0.27 0.2 0.27 0.15 0.14MH 13 0.52 1.29 0.41 0.15 0.02 -0.02 -0.05MH 14 15.56 4.03 1.54 0.65 0.12 0.04MH 15 14.25 4.1 1.67 0.86 0.52 0.34 0.24MH 16 10.51 3.23 1.38 0.73 0.44 0.3 0.21MH 17 15.5 4.94 2.22 1.11 0.6 0.3MH 18 16.03 4.97 2.23 1.12 0.59 0.29MH 19 25.85 10.28 4.76 2.39 1.09MH 20 1.84 0.61 0.29 0.17 0.09 0.07 0.06MH 21 0.11 0.12 0.08 0.07 0.07 0.08 0.08MH 22 0.25 0.17 0.1 0.08 0.07 0.07 0.07MH 23 6.3 0.62 0.24 0.1 0.02 -0.02 -0.05
Diamond Bidentate C18
Resveratrol AnaloguesMobile Phase Composition (% Acetonitrile)
Cap
acity
Fac
tor (
k)
-2.00
3.00
8.00
13.00
18.00
23.00
28.00
30 40 50 60 70 80 90
Capc
ity F
acto
r k
Mobile Phase Composition (% Acetonitrile)

38
MH8 has a slightly higher logP and differs from MH7 by having a single hydroxide
group on each benzene while MH7 contains a diol and a bare benzene ring. The structure
of MH7 is surfactant-like containing a hydrophobic tail (unsubstituted benzene) and
hydrophilic head (diol substituted) which may explain the difference in elution order with
MH8. When comparing MH16 to MH15 a similar conclusion is reached explaining the
higher retention for MH15 (surfactant structure). The higher retention that MH14 and
MH13 display over MH15 and MH11 is unclear but may be associated with more polar
heads forcing interaction with the less substituted benzene tail. The difference in polarity
of MH17 and MH18, meta vs. para hydroxide isomers, was negligible and the order of
retention not stressed upon. Complete separation of these structural isomers was not
observed but the DC18 column gave the second highest selectivity for them. Finally,
MH23 (logP = 1.88) exhibited significantly higher retention than MH20 (logP = 5.43)
despite being more polar. This may be due to steric hinderance associated with MH20’s
bulkiness. The overlaid/stacked chromatograms for the Diamond Bidentate C18 using the
PE UPLC and acetonitrile as mobile phase (Figure 12) showed that few compounds have
high enough selectivity to be fully resolved from one another. Even at 40% organic the
majority of compounds overlap from 2 – 10 minutes. Despite having unique retention
times, if introduced as a mixture, this particular set of compounds would be difficult to
separate using Diamond Bidentate C18 stationary and acetonitrile mobile phase. Potential
solutions would be gradient method development and reduced standard/sample
concentrations.

39
Figure 12. Diamond Bidentate C18 with Acetonitrile Mobile Phase Overlaid/Stacked Chromatograms (Resveratrol).

40
Similarly, to the Diamond C18, the Bidentate C18 shows the same RP trend as
organic mobile phase is reduced from 90% - 10% (Figure 13). When comparing retention
data between the two, the Bidentate C18 only displayed significant retention (at 30%
acetonitrile) for 11 compounds compared to 13 on the Diamond C18 (Table 5). This
information supports that the Diamond C18 is more powerful in retaining this set of
nonpolar compounds when using acetonitrile as mobile phase. When referring to the
trends in Table 3, the Bidentate C18 demonstrated comparable retention capabilities. The
same issues were seen for Trends 3, 5, 6, 7 and 8. In addition, the retention times for
MH17, 18 and 19 were questionably low in contrast to the Diamond C18. At this time,
the cause of this variance remains unclear. Figure 14 shows the overlaid/stacked
chromatograms and gives a similar assessment where the overlap observed would make
complete resolution difficult.
Figure 13. Bidentate C18 Retention Map (ACN/Resveratrol). Compares capacity factor “k” (y-axis) to percentage acetonitrile mobile phase (x-axis).
-5.00
0.00
5.00
10.00
15.00
20.00
25.00
0 10 20 30 40 50 60 70 80 90 100
Capa
city
Fac
tor (
k)
Mobile Phase Composition (% Acetonitrile)

41
Table 5. Bidentate C18 Capacity Factor “k” (ACN/Resveratrol). Average of in triplicate injections from 10% organic to 90% organic.
Table 6. Phenyl Hydride Capacity Factor “k” (ACN/Resveratrol). Average of in triplicate injections from 10% organic to 90% organic.
10 20 30 40 50 60 70MH 1 9.47 2.48 0.94 0.36 0.17 0.08MH 2 1.1 0.56 0.33 0.21 0.11 0.06MH 3 1.1 0.44 0.2 0.11 0.02 0MH 4 4.61 1.35 0.55 0.24 0.11 0.04MH 5 9.05 2.67 0.96 0.54 0.31MH 7 15.98 4.47 1.44 0.78 0.42MH 8 10.1 3.3 1.13 0.61 0.32MH 9 19.27 5.08 2.69 1.39
MH 10 22.96 12.54 5.98MH 11 1.25 0.78 0.63 0.91 0.57 0.4 0.26MH 12 3.88 1.34 0.72 0.48 0.33 0.25 0.19MH 13 0.62 0.35 0.08MH 14 7.17 1.89 0.81MH 15 16.97 4.84 1.93 0.97 0.55MH 16 12.77 3.86 1.61 0.82 0.48MH 17 0.77 0.64 0.56 0.53 0.4 0.67MH 18 0.79 0.64 0.55 0.51 0.4 0.67MH 19 0.78 0.64 0.54 0.5 0.4 0.32MH 20 13.47 2.29 0.77 0.35 0.18 0.1MH 21 0.62 0.28 0.18 0.15 0.13 0.1 0.08MH 22 4.11 0.74 0.35 0.23 0.15 0.11 0.08MH 23 9.57 2.14 0.76 0.36 0.15 0.06
Bidentate C18
Resveratrol AnaloguesMobile Phase Composition (% Acetonitrile)
Cap
acity
Fac
tor (
k)
10 20 30 40 50 60 70MH 1 63.83 12.08 3.35 1.33 0.69 0.32 0.12MH 2 1.46 0.68 0.35 0.2 0.12 0.02 0.09MH 3 3.7 1.01 0.35 0.13 0.04 -0.04 0.03MH 4 19.2 4.47 2.01 0.53 0.19 0.03 0.07MH 5 12.51 3.89 1.14 0.95 0.55MH 7 30.34 7.49 2.45 0.98 0.38 0.28MH 8 25.41 6.52 2.18 0.89 0.34 0.26MH 9 21.37 6.04 2.21 0.85 0.54
MH 10 16.54 5.33 1.93 1.08MH 11 24.5 5.77 1.87 0.75 0.33 0.1 0.12MH 12 0.67 0.36 0.21 0.12 0.02 0.09MH 13 20.17 4.44 0.62 0.31 0.13 0.13MH 14 36.81 9.06 2.86 0.95 0.53MH 15 21.46 6.22 2.19 0.91 0.35 0.27MH 16 18.9 5.52 2 0.84 0.33 0.26MH 17 18.05 5.5 2.07 0.8 0.52MH 18 17.98 5.58 2.1 0.81 0.52MH 19 15.72 5.11 1.84 1.02MH 20 2.47 0.68 0.21 0 0.04MH 21 0.19 -0.01 -0.05 -0.07 -0.06 -0.1 0MH 22 2.03 0.46 0.12 0.02 -0.03 -0.09 0MH 23 6.77 1.82 0.69 0.29 0.08 0.11
Phenyl Hydride
Resveratrol AnaloguesMobile Phase Composition (% Acetonitrile)
Cap
acity
Fac
tor (
k)

42
Figure 14. Bidentate C18 with Acetonitrile Mobile Phase Overlaid/Stacked Chromatograms (Resveratrol).

43
The Phenyl Hydride data shown was collected from the Agilent 1200 Series (1). The
dimensions of the Phenyl Hydride and the Diol were 2.1 x 100mm compared to 4.6 x 75mm
for the Diamond C18 and Bidentate C18. Since the flow rates (0.4 mL/min) and injection
volumes (1 uL) were maintained throughout the study, the capacity factor k of the Phenyl
Hydride and Diol columns can be theoretically compared to the Diamond C18 and
Bidentate C18 columns. Similar to the Diamond C18 and Bidentate C18 columns, the
Phenyl Hydride operates in a RP manner where retention is increased as percent organic is
decreased (Table 6). Of the unsaturated resveratrol analogues, MH4 and MH5 were the
only ones that gave less retention than their respective saturated versions (MH13 and
MH14). Unfortunately, no explanation for this incident has been determined. In reference
to the polarity tendencies, only Trends 7 and 8 were completely agreeable. In Trends 1 and
4, MH3 exhibited higher retention than MH2/MH12 despite having a low logP value. This
phenomenon could be attributed to the central keto group on MH3 but the associated
interactions are unclear.
In Trends 2, 3, 5 and 6 the surfactant-like properties of MH5, 7, 14 and 15
overshadowed the expected retention scheme. Figure 15 shows that significant retention
(k > 2) is observed for 19 of 22 resveratrol analogues. Figure 16 displays the progression
of separation across all mobile phase compositions. Significant selectivity is observed for
the majority of the compounds where the most difficult to separate were MH2/MH12 and
MH17/MH18. Overall, the Phenyl Hydride shows the highest potential in separating this
set of resveratrol compounds in acetonitrile. Furthermore, considering that full resolution

44
is achieved (≈ 1 mg/mL) at 10% acetonitrile, analysts can save on solvent expenses and
utilize gradient methods to optimize separations.
Figure 15. Phenyl Hydride Retention Map (ACN/Resveratrol). Compares capacity factor “k” (y-axis) to percentage acetonitrile mobile phase (x-axis).
The Diol data shown was collected from the Agilent 1200 Series (2). Compared to the
previous columns, the Diol is considered to be an ANP column. The resveratrol
compounds are considerably nonpolar and are expected to exhibit minimal retention with
Diol stationary phase. Indeed, from data shown in Table 7 and Figure 17, the majority of
the compounds (except MH9 and MH10) display little to no retention across the mobile
phase spectrum. Although only slightly, the Diol was the sole column that demonstrated
dual retention (ANP: 60-90%B, RP: 50-10%B) with MH2 (imine). Referencing the
expected polarity trends is more complex due to the presence of two modes of retention.
-10.00
0.00
10.00
20.00
30.00
40.00
50.00
60.00
70.00
0 10 20 30 40 50 60 70 80 90 100
Capa
city
Fac
tor (
k)
Mobile Phase Composition (% Acetonitrile)
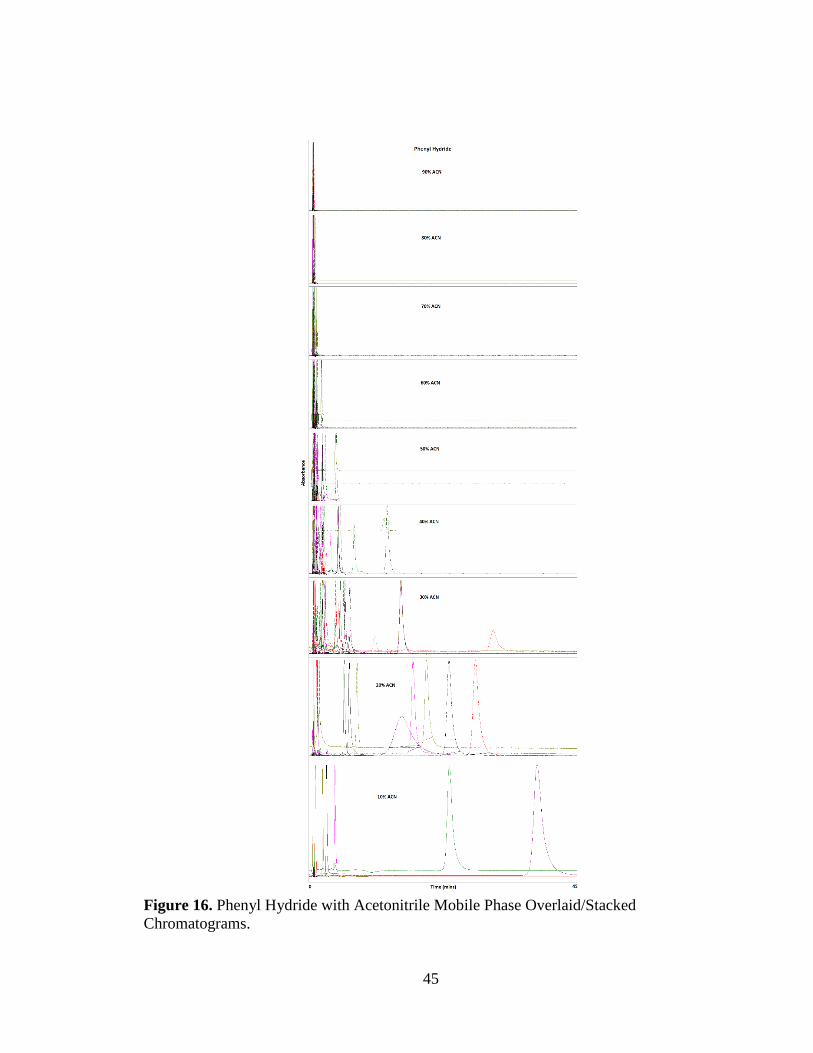
45
Figure 16. Phenyl Hydride with Acetonitrile Mobile Phase Overlaid/Stacked Chromatograms.

46
Table 7. Diol Capacity Factor “k” (ACN/Resveratrol). Average of in triplicate injections from 10% organic to 90% organic.
Figure 17. Diol Retention Map (ACN/Resveratrol). Compares capacity factor “k” (y-axis) to percentage acetonitrile mobile phase (x-axis).
10 20 30 40 50 60 70MH 1 1.12 0.31 0.13 0.07 0.01 -0.05 -0.12MH 2 0.2 0.15 0.13 0.1 0.18 0.24 0.32MH 3 0.28 0.16 0.11 0.08 0.04 -0.01 -0.08MH 4 0.44 0.3 0.15 0.08 0.02 -0.04 -0.11MH 5 1.35 0.46 0.2 0.07 0 -0.06 -0.12MH 7 2.67 0.57 0.19 0.07 0 -0.06 -0.13MH 8 2.21 0.48 0.17 0.07 0 -0.06 -0.14MH 9 7.48 1.28 0.3 0.09 0 -0.07 -0.15
MH 10 30.12 4.63 0.8 0.19 0.02 -0.07 -0.15MH 11 0.5 0.2 0.11 0.06 0.01 -0.05 -0.12MH 12 0.2 0.16 0.13 0.1 0.06 -0.01 -0.08MH 13 0.26 0.19 0.11 0.06 0 -0.05 -0.11MH 14 0.25 0.21 0.2 0.07 -0.01 -0.07 -0.13MH 15 1.41 0.36 0.15 0.07 0 -0.06 -0.13MH 16 1.21 0.32 0.14 0.06 0 -0.06 -0.13MH 17 4.68 0.91 0.24 0.08 0 -0.07 -0.15MH 18 4.62 0.9 0.24 0.08 0 -0.07 -0.15MH 19 4.06 0.72 0.17 0.01 -0.07 -0.15MH 20 4.13 0.38 0.1 0.04 -0.01 -0.06 -0.13MH 21 0.16 0.13 0.12 0.1 0.07 0.04 -0.02MH 22 0.22 0.15 0.11 0.08 0.05 0.01 -0.05MH 23 1.21 0.32 0.14 0.08 0.02 -0.04 -0.11
Diol
Resveratrol AnaloguesMobile Phase Composition (% Acetonitrile)
Cap
acity
Fac
tor (
k)
-5.00
0.00
5.00
10.00
15.00
20.00
25.00
30.00
35.00
0 10 20 30 40 50 60 70 80 90 100
Capa
city
Fac
tor (
k)
Mobile Phase Composition (% Acentonitrile)

47
Trends 2, 4, 6 and 8 were compliant for the ANP portion and Trends 2, 6, 7 and 8 for
the RP portion. When operating in ANP, MH7/MH8 and MH15/MH16 were inseparable
but in RP mode the surfactant displayed similar retention patterns as the aforementioned
columns. The “amide resveratrol” (MH3) still exhibited higher retention than the imine
(MH2) and amine (MH12) versions. This shows that MH3 is selectively retained on the
Phenyl and Diol columns compared to the Diamond and Bidentate C18 stationary phases
when using acetonitrile as mobile phase. From overlaid and stacked chromatograms
(Figure 18), the unique dual retention is shown more clearly. In the end, the Diol does not
supply adequate retention or resolution for any useful separations with these RP
compounds.
3.1.2 Acidic, Basic and Neutral Compounds
A small set of common acidic, basic and neutral compounds were employed for
additional characterization of the four columns using both Agilent 1200 HPLCs. Trends
shown in Table 8 correspond to the logP values for the proposed compounds. Table 9
shows that Trends 1 and 2 are followed except Trend 3 where anisole gave higher
retention than ethylbenzene. Anisole has a significantly lower logP value than
ethylbenzene (1.99 vs. 2.85) due to the presence of the methoxy group and the reason for
anisole’s higher retention is unclear. Amitriptyline and diphenhydramine were the only
two that displayed ANP retention from 90%B – 70%B, followed by a switch to RP mode
from 60% B – 10% B. The retention map below (Figure 19) shows that significant
retention can be achieved for all six compounds. Finally, the overlaid chromatograms
(Figure 20) display the Diamond C18’s successful resolution of each compound as

48
organic mobile phase is reduced. Since amitriptyline and diphenhydramine experience
band broadening at lower organic compositions gradient separations would need to be
used to achieve full resolution.
Figure 18. Diol with Acetonitrile Mobile Phase Overlaid/Stacked Chromatograms.

49
Table 8. Retention trends of acidic/basic/neutral compounds based on structure and polarity.
Table 9. Diamond Bidentate C18 Capacity Factor “k” (ACN/ABN). Average of in triplicate injections from 10% organic to 90% organic.
Figure 19. Diamond C18 Retention Map (ACN/ABN). Compares capacity factor “k” (y-axis) to percentage acetonitrile mobile phase (x-axis).
Trend # Reversed Phase Aqueous Normal Phase1 Ketoprofen > 2-Nitrobenzoic Acid 2-Nitrobenzoic Acid > Ketoprofen2 Amitriptyline > Diphenhydramine Diphenhydramine > Amitriptyline3 Naphthalene > Ethylbenzene > Anisole Anisole > Ethylbenzene > Naphthalene
30 40 50 60 70 80 90Ketoprofen 17.34 4.84 2.01 0.98 0.6 0.39 0.26
2-Nitrobenzoic Acid 1.33 0.78 0.49 0.31 0.26 0.17 0.13Amitriptyline 17.52 5.67 3.03 2.16 2.05 2.45 3.67
Diphenhydramine 5.91 2.48 1.55 1.23 1.27 1.68 2.73Anisole 13.68 6.46 3.44 1.92 1.23 0.82 0.53
Naphthalene 23.5 10.12 4.81 2.75 1.65 0.97Ethylbenzene 5.58 2.89 1.71 1.08 0.75 0.54 0.39
Diamond Bidentate C18
Acidic/Basic/NeutralMobile Phase Composition (% Acetonitrile)
Cap
acity
Fac
tor (
k)
0.00
5.00
10.00
15.00
20.00
25.00
25 35 45 55 65 75 85 95
Capa
city
Fac
tor (
k)
Mobile Phase Composition (% Acetonitrile)

50
Figure 20. Diamond Bidentate C18 with Acetonitrile Mobile Phase Overlaid/Stacked Chromatograms.

51
The Bidentate C18 column demonstrated the same retention patterns as the Diamond
C18. The main difference observed was that all the compounds were retained slightly
more on the Bidentate C18 than the hybrid column (Table 10). Selectivity and resolution
were also comparable as shown in Figure 22. The Bidentate C18 also showed higher
ANP properties for amitriptyline and diphenhydramine than the Diamond C18 (Figure
21).
Table 10. Bidentate C18 Capacity Factor “k” (ACN/ABN). Average of in triplicate injections from 10% to 90% organic.
Figure 21. Bidentate C18 Retention Map (ACN/ABN). Compares capacity factor “k” (y-axis) to percentage acetonitrile mobile phase (x-axis).
10 20 30 40 50 60 70Ketoprofen 21.65 5.79 2.43 1.14 0.66
2-Nitrobenzoic Acid 7.15 3.15 1.68 0.97 0.6 0.36 0.28Amitriptyline 20.41 6.67 3.83 3 2.49
Diphenhydramine 7.04 3.04 2.13 1.66 1.57Anisole 17.74 8.13 4.28 2.28 1.39
Naphthalene 12.43 5.58 3.11Ethylbenzene 18.32 7.64 3.88 2.26 1.34 0.9
Bidentate C18
Acidic/Basic/NeutralMobile Phase Composition (% Acetonitrile)
Cap
acity
Fac
tor (
k)
0.00
5.00
10.00
15.00
20.00
25.00
0 10 20 30 40 50 60 70 80 90 100
Capa
city
Fac
tor (
k)
Mobile Phase Composition (% Acetonitrile)

52
Figure 22. Bidentate C18 with Acetonitrile Mobile Phase Overlaid/Stacked Chromatograms.

53
The Phenyl Hydride demonstrated the same reversed phased retention as the
Diamond C18 and Bidentate C18. Similar to the other two, the Phenyl followed Trends 1
and 2 but still showed greater retention of anisole over ethylbenzene in Trend 3. The
main differences were that the retention power of the Phenyl Hydride was much lower for
these compounds (Table 11) but the peak shape for the compounds gave less peak
broadening that the other two reversed phase columns (Figure 24). In addition, the ANP
properties demonstrated by retention of amitriptyline and diphenhydramine were much
weaker than the Diamond C18 and Bidentate C18 stationary phases (Figure 23).
Table 11. Phenyl Hydride Capacity Factor “k” (ACN/ABN). Average of in triplicate injections from 10% to 90% organic.
Figure 23. Phenyl Hydride Retention Map (ACN/ABN). Compares capacity factor “k” (y-axis) to percentage acetonitrile mobile phase (x-axis).
10 20 30 40 50 60 70Ketoprofen 33.35 7.67 2.71 1.14 0.48 0.37
2-Nitrobenzoic Acid 2.83 1.89 1.17 0.73 0.44 0.22 0.23Amitriptyline 18.28 3.72 1.29 0.59 0.32 0.4
Diphenhydramine 26.26 5.63 1.57 0.62 0.33 0.18 0.29Anisole 13.65 8.13 4.35 2.33 1.25 0.61 0.49
Naphthalene 35.68 13.17 5.43 2.43 1.08 0.75Ethylbenzene 11.07 5.05 2.61 1.48 0.88 0.48 0.43
Phenyl Hydride
Acidic/Basic/NeutralMobile Phase Composition (% Acetonitrile)
Capa
city
Fac
tor (
k)
-5.00
0.00
5.00
10.00
15.00
20.00
25.00
30.00
35.00
40.00
0 10 20 30 40 50 60 70 80 90 100
Capa
city
Fac
tor (
k)
Mobile Phase Composition (% Acetonitrile)

54
Figure 24. Phenyl Hydride with Acetonitrile Mobile Phase Overlaid/Stacked Chromatograms.

55
Finally, the Diol column was the only column to follow all three expected trend
orders. The retention map (Table 12) shows typical RP retention from high to lower
organic for the acidic and neutral species but demonstrates both ANP and RP retention
for amitriptyline and diphenhydramine. The ANP properties are much more apparent for
the Diol stationary phase than the others but the retention power and selectivity are the
lowest of the four (Figure 25 and 26). The resveratrol compounds do not appear to have
enough affinity for the Diol column to be separated as a mixture.
Table 12. Diol Capacity Factor “k” (ACN/ABN). Average of in triplicate injections from 10% to 90% organic.
Figure 25. Diol Retention Map (ACN/ABN). Compares capacity factor “k” (y-axis) to percentage acetonitrile mobile phase (x-axis).
10 20 30 40 50 60 70Ketoprofen 1.92 0.29 0.08 -0.01 -0.07 -0.14 -0.21
2-Nitrobenzoic Acid 0.14 0.09 0.04 0 -0.04 -0.1 -0.18Amitriptyline 1.75 0.39 0.15 0.06 0.01 -0.02 -0.03
Diphenhydramine 0.74 0.25 0.11 0.06 0.01 -0.01 -0.01Anisole 0.47 0.23 0.1 0.02 -0.05 -0.11 -0.2
Naphthalene 2.14 0.69 0.22 0.04 -0.05 -0.14 -0.21Ethylbenzene 0.56 0.24 0.11 0.03 -0.03 -0.1 -0.18
Diol
Acidic/Basic/NeutralMobile Phase Composition (% Acetonitrile)
Cap
acity
Fac
tor (
k)
-1.00
-0.50
0.00
0.50
1.00
1.50
2.00
2.50
0 10 20 30 40 50 60 70 80 90 100Capa
city
Fac
tor (
k)
Mobile Phase Composition (% Acetonitrile)

56
Figure 26. Diol with Acetonitrile Mobile Phase Overlaid/Stacked Chromatograms

57
In terms of retention power when using acetonitrile as mobile phase, the Bidentate
C18 is the highest, followed by the Diamond C18, then the Phenyl Hydride and finally
the Diol. The Phenyl Hydride demonstrates the most selectivity and resolution compared
to the other three (Bidentate and Diamond C18 are comparable). The reason for this may
be due to the additional pi-pi interactions with the aromatics and phenolic aspects of the
resveratrol analogues.
3.2 Data with Methanol as Mobile Phase
3.2.1 Resveratrol Analogues
When comparing the mobile phases, the first expected difference is in retention. Since
methanol is a weaker organic than acetonitrile which supports that higher retention is
assumed when using methanol. This concept is fully supported for all four columns when
comparing the methanol retention maps to the acetonitrile ones for the resveratrol
analogues (Tables 13-16). When specifically observing the Diamond C18, three
differences between trend order are noted. The first difference was that Trends 1 and 2
(amide vs. imine/amine) showed the amide resveratrol retained longer than the imine and
amine versions while in acetonitrile this was not the case. The second change was seen
between the meta/para position resveratrol isomers (MH17 and 18) where in acetonitrile
MH18 displays greater retention than MH17 while in methanol the order is flipped.
Surprisingly, although retention is greater in methanol, selectivity for the meta/para
isomers is lower when compared to acetonitrile mobile phase. The third variation was
observed between MH14 and MH15 (1, 2, 3-triol and 1, 3-diol) where acetonitrile
promoted retention such that MH14 > MH15 while methanol supported the opposite

58
order. Reasons for this change are unclear at this time. When referring to retention power,
20 of the 22 compounds gave a capacity factor k > 2 supporting increased retention with
methanol. In terms of selectivity, Figures 27 and 28 confirm that methanol gives better
selectivity and resolution than acetonitrile for these resveratrol analogues.
Table 13. Diamond Bidentate C18 Capacity Factor “k” (MeOH/Resveratrol). Average of in triplicate injections from 10% to 90% organic.
10 20 30 40 50 60 70MH 1 16.62 4.41 1.25 0.42 0.16MH 2 6.54 2.6 1.31 0.66 0.32 0.1 0.07MH 3 1.89 0.67 0.25 0.1 0.03MH 4 7.02 2.13 0.67 0.12 0.01MH 5 6.38 2 0.76MH 7 10.96 2.8 1.05MH 8 8.07 2.15 0.8MH 9 12.56 4.41
MH 10 20.77MH 11 16.9 4.88 1.51 0.5 0.2MH 12 2.4 1.34 0.93 0.66 0.33 0.39 0.08MH 13 6.85 1.79 0.41 0.19MH 14 5.79 2.16 0.92MH 15 9.46 2.68 1.02MH 16 8.85 2.27 0.86MH 17 11.46 3.9MH 18 11.19 3.76MH 19 19.46MH 20 11.04 1.72 0.37 0.07 0MH 21 1.33 0.56 0.29 0.15 0.07 0.03 0.01MH 22 12.42 2.45 0.81 0.27 0.1 0.03 0MH 23 9 2.7 0.81 0.33
Diamond Bidentate C18
Resveratrol AnaloguesMobile Phase Composition (% Methanol)
Cap
acity
Fac
tor (
k)

59
Table 14. Bidentate C18 Capacity Factor “k” (MeOH/Resveratrol). Average of in triplicate injections from 10% to 90% organic.
Table 15. Phenyl Hydride Capacity Factor “k” (MeOH/Resveratrol). Average of in triplicate injections from 10% to 90% organic.
10 20 30 40 50 60 70MH 1 20.7 5.49 1.73 0.58 0.25MH 2 7.96 3.33 1.58 0.81 0.44 0.26 0.18MH 3 8.32 2.31 0.84 0.36 0.17 0.09MH 4 0.88 0.42 0.23MH 5 7.64 2.99 1.24MH 7 12.73 3.52 1.29MH 8 10 2.79 1.06MH 9 16.89 5.49MH 10 26.38MH 11 20.89 5.96 1.95 0.66 0.29MH 12 7.89 3.33 1.58 0.81 0.44 0.25 0.17MH 13 3.15 1.25 0.54 0.28MH 14 7.17 2.55 1.14MH 15 11.19 3.29 1.24MH 16 9.93 2.87 1.1MH 17 14.48 4.82MH 18 14.11 4.62MH 19 24.18MH 20 13.53 2.2 0.52 0.14 0.06MH 21 1.67 0.74 0.38 0.21 0.13 0.08 0.06MH 22 14.54 3.33 0.99 0.36 0.17 0.08 0.06MH 23 10.81 3.38 1.07 0.46
Bidentate C18
Resveratrol AnaloguesMobile Phase Composition (% Methanol)
Cap
acity
Fac
tor (
k)
10 20 30 40 50 60 70MH 1 24.55 7.26 2.12 0.3 -0.35 -0.43MH 2 1.73753 0.83 0.25 -0.08 -0.3 -0.47 -0.47MH 3 6.03448 2.24 0.63 0.01 -0.31 -0.49 -0.49MH 4 4.05 2.2 1.01 0.34 -0.08 -0.4 -0.44MH 5 29.02 5.64 1.66 0.21 -0.18MH 7 25.05 7.7 1.93 0.06 -0.3MH 8 23.58 7.11 1.72 0.01 -0.36MH 9 24.27 6.16 0.94 -0.18
MH 10 17.39 3.1 0.52MH 11 15.51 4.8 1.48 0.18 -0.35 -0.49MH 12 1.75 0.84 0.23 -0.09 -0.3 -0.47 -0.53MH 13 36.403 17.83 2.87 0.92 0.09 -0.33 -0.46MH 14 17.49 3.92 1.19 0.03 -0.31MH 15 16.1 5.41 1.42 -0.02 -0.37MH 16 16.45 5.41 1.36 -0.04 -0.42MH 17 18.8 5 0.76 -0.18MH 18 17.43 4.7 0.71 -0.19MH 19 15.22 2.76 0.34MH 20 22.64 3.95 0.39 -0.38 -0.56MH 21 0.22086 -0.04 -0.23 -0.35 -0.44 -0.53 -0.6MH 22 3.699 1.25 0.22 -0.18 -0.38 -0.52 -0.59MH 23 12.93 3.72 0.77 -0.2 -0.48
Phenyl Hydride
Resveratrol AnaloguesMobile Phase Composition (% Methanol)
Cap
acity
Fac
tor (
k)

60
Table 16. Diol Capacity Factor “k” (MeOH/Resveratrol). Average of in triplicate injections from 10% to 90% organic.
Figure 27. Diamond C18 Retention Map (MeOH/Resveratrol). Compares capacity factor “k” (y-axis) to percentage mobile phase (x-axis).
10 20 30 40 50 60 70MH 1 2.25 1.11 0.49 0.18 0.04 -0.03 -0.06MH 2 0.16 0.09 0.05 0.01 -0.01 -0.05 -0.06MH 3 0.33 0.18 0.09 0.03 0 -0.05 -0.06MH 4 0.08 0.05 0.03 -0.01 -0.04 -0.09 -0.1MH 5 1.6 0.71 0.3 0.12 0.04 -0.03 -0.05MH 7 5.92 2.3 0.89 0.31 0.09 -0.01 -0.05MH 8 4.68 1.91 0.76 0.27 0.08 -0.03 -0.05MH 9 15.91 5.58 1.92 0.62 0.19 0 -0.04
MH 10 20.49 6.47 1.83 0.52 0.08 -0.03MH 11 0.81 0.38 0.17 0.04 0 -0.05 -0.06MH 12 0.15 0.07 0.04 0 -0.01 -0.05 -0.08MH 13 0.28 0.12 0.05 0.01 -0.01 -0.05 -0.06MH 14 1.11 0.36 0.17 0.05 0.01 -0.04 -0.06MH 15 2.44 0.95 0.38 0.12 0.03 -0.04 -0.06MH 16 2.32 0.84 0.34 0.09 0.01 -0.04 -0.06MH 17 8.69 2.96 1.05 0.34 0.09 -0.03 -0.06MH 18 8.52 2.87 1.04 0.34 0.09 -0.03 -0.06MH 19 13.03 4.59 1.34 -0.03 0.03 -0.04MH 20 1.34 0.3 0.03 -0.05 -0.08MH 21 0.12 0.08 0.04 0.01 0 -0.04 -0.05MH 22 0.24 0.12 0.07 0.01 0 -0.04 -0.06MH 23 3 1.39 0.62 0.23 0.08 -0.03 -0.05
Diol
Resveratrol AnaloguesMobile Phase Composition (% Methanol)
Capa
city
Fac
tor (
k)
-1.00
4.00
9.00
14.00
19.00
0 10 20 30 40 50 60 70 80 90 100
Capa
city
Fac
tor (
k)
Mobile Phase Composition (% Methanol)

61
Figure 28. Diamond Bidentate C18 with Methanol Mobile Phase Overlaid/Stacked Chromatograms.

62
The Bidentate C18 followed similar RP trends as the Diamond C18 and also showed
significant retention of 20 out of the 22 compounds (k > 2). In terms of retention power,
the Bidentate C18 showed slightly higher retention for all the compounds than the
Diamond C18. Similar to the Diamond C18, the Bidentate showed more retention of
MH3 than MH2/MH12 (Trends 1 and 2) at higher water mobile phase compositions. The
second change was observed for Trend 7 where the expected trend was followed in
methanol but completely different in acetonitrile. No concrete explanation for this
phenomenon has been determined. The last difference found in methanol was the
retention order of MH1, MH20 and MH23 (Synthetic vs. Natural Derivatives). In
acetonitrile MH20 retained more than MH23 and MH1 while in methanol the order of
retention was MH23 > MH1 > MH20. Despite these differences in retention order, the
selectivity of the Bidentate C18 was comparable to the Diamond C18 (Figures 29 and 30)
but the Diamond C18 demonstrated higher selectivity of the unsaturated and saturated
forms of resveratrol.
Figure 29. Bidentate C18 Retention Map (MeOH/Resveratrol). Compares capacity factor “k” (y-axis) to percentage mobile phase (x-axis).
-1.00
4.00
9.00
14.00
19.00
24.00
29.00
0 10 20 30 40 50 60 70 80 90 100
Capa
city
Fac
tor (
k)
Mobile Phase Composition (% Methanol)

63
Figure 30. Bidentate C18 with Methanol Mobile Phase Overlaid/Stacked Chromatograms.

64
The Phenyl Hydride column gave comparable retention orders as the previous RP
columns and demonstrated the third highest retention of the four stationary phases.
Comparing retention between acetonitrile and methanol, both solvents gave significant
retention (k > 2) of 19 of the 22 compounds (Figure 31). In reference to the expected
retention trends, there were four variations with methanol as solvent. First, the Phenyl
column was the only one to follow Trend 4 when using methanol. The second and most
important was the selectivity for the meta/para hydroxides (MH17 and MH18). The
Phenyl Hydride demonstrated the highest selectivity for these isomers when using
methanol. The next difference observed was a higher selectivity for MH14 (triol) in
acetonitrile where MH14 > MH17 while in methanol MH17 > MH14 in terms of
retention. In both solvents retention of MH14 > MH15 (triol > diol). Lastly, in
acetonitrile the retention of MH1 > MH20 > MH23 while in methanol the order was
MH23 > MH1 > MH20. In terms of selectivity and resolution the Phenyl Hydride shows
the most potential (Figure 32).
Figure 31. Phenyl Hydride Retention Map (MeOH/Resveratrol). Compares capacity factor “k” (y-axis) to percentage mobile phase (x-axis).
-1.00
4.00
9.00
14.00
19.00
24.00
29.00
34.00
39.00
0 10 20 30 40 50 60 70 80 90 100
Capa
city
Fac
tor (
k)
Mobile Phase Composition (% Methanol)

65
Figure 32. Phenyl Hydride with Methanol Mobile Phase Overlaid/Stacked Chromatograms.

66
The Diol stationary phase still gave little to no retention for the majority of the
resveratrol analogues despite the use of methanol mobile phase (Figure 33). In
acetonitrile, eight of the 22 gave a k > 2 compared to 11 of 22 in methanol. Although the
selectivity was significant for half of the compounds, the selectivity was not high enough
to afford acceptable resolution (Figure 34). Between the expected and actual retention
trends only two differed between mobile phases. First, in acetonitrile the Diol followed
the expected order for Trend 6, while in methanol retention of MH1 > MH5. Secondly, in
acetonitrile the retention order for Trend 8 was actually MH11 > MH13 > MH14 whereas
in methanol the original order was maintained. In terms of retention, selectivity and
resolution the Diol stationary phase achieved little success. Interestingly, the ANP
retention of MH2 was only observed in acetonitrile but not in methanol. No solid
explanation can be given for these findings at this time.
Figure 33. Diol Retention Map (MeOH/Resveratrol). Compares capacity factor “k” (y-axis) to percentage mobile phase (x-axis).
-1.00
4.00
9.00
14.00
19.00
24.00
0 10 20 30 40 50 60 70 80 90 100
Capa
city
Fac
tor (
k)
Mobile Phase Composition (% Methanol)

67
Figure 34. Diol with Methanol Mobile Phase Overlaid/Stacked Chromatograms.

68
The retention strength of the columns only differed in methanol where the Bidentate
C18 > Diamond C18. The selectivity for the resveratrol compounds was the same as in
acetonitrile where Phenyl > Diamond C18 > Bidentate C18 > Diol. The main differences
in methanol were higher retention of all compounds and the ANP properties observed for
MH2 were only seen when acetonitrile was used as mobile phase. While there were
significant differences in the expected retention trends
3.2.2 Acidic, Basic and Neutral Compounds
Similar results were found for the acidic, basic and neutral compounds when
comparing the change in mobile phase solvent. Tables 17-20 support that methanol is a
weaker organic solvent in that higher retention is observed for all seven compounds in RP
mode with all four columns. The retention strength of the columns was the same as with
acetonitrile (BC18 > DC18 > Phenyl > Diol) and the selectivity was similar as well.
While the Diamond C18 and Bidentate C18 gave significant resolution, at lower organic
content the peaks for amitriptyline and diphenhydramine broadened considerably
(Figures 35 and 36).
Table 17. Diamond Bidentate C18 Capacity Factor “k” (MeOH/ABN). Average of in triplicate injections from 10% to 90% organic.
10 20 30 40 50 60 70 80 90Ketoprofen 14.71 3.89 1.37 0.45 0.14
2-Nitrobenzoic Acid 7.72 4.28 2.45 1.35 0.75 0.36 0.19 0.08 -0.03Amitriptyline 12.09 3.21 1.25 0.56 0.33
Diphenhydramine 3.32 1.1 0.51 0.28 0.15Anisole 9.32 4.12 2.09 0.91 0.46
Naphthalene 15.51 6.28 2.16 1.02Ethylbenzene 9.26 4.36 1.89 1.03 0.48 0.23
Acidic/Basic/Neutral
Cap
acity
Fac
tor (
k)
Diamond Bidentate C18
Mobile Phase Composition (% Methanol)

69
Table 18. Bidentate C18 Capacity Factor “k” (MeOH/ABN). Average of in triplicate injections from 10% to 90% organic.
Table 19. Phenyl Hydride Capacity Factor “k” (MeOH/ABN). Average of in triplicate injections from 10% to 90% organic.
Table 20. Diol Capacity Factor “k” (MeOH/ABN). Average of in triplicate injections from 10% to 90% organic.
10 20 30 40 50 60 70 80 90Ketoprofen 17.2 4.72 1.68 0.58 0.3
2-Nitrobenzoic Acid 8.99 5.01 2.84 1.58 0.86 0.46 0.27 0.14 0.08Amitriptyline 13.14 3.7 1.41 0.65 0.45
Diphenhydramine 3.82 1.29 0.57 0.32 0.24Anisole 24.01 11.4 5.15 2.58 1.16 0.72
Naphthalene 18.95 7.58 2.62 1.4Ethylbenzene 13.44 6.09 2.73 1.46 0.71 0.48
Acidic/Basic/Neutral
Cap
acity
Fac
tor (
k)Bidentate C18
Mobile Phase Composition (% Methanol)
10 20 30 40 50 60 70 80 90Ketoprofen 18.19 4.79 0.66 -0.17 -0.53 -0.75
2-Nitrobenzoic Acid 3.7 2.47 1.63 0.85 0.31 -0.14 -0.3 -0.5 -0.7Amitriptyline 17.29 3.65 0.59 -0.38 -0.6 -0.73 -0.84
Diphenhydramine 13.51 3.58 0.71 -0.15 -0.52 -0.65 -0.74 -0.85Anisole 13.08 7.91 4.53 2.19 0.83 -0.03 -0.36 -0.58 -0.76
Naphthalene 23.88 9.26 3.31 0.61 -0.15 -0.51 -0.75Ethylbenzene 20.83 9.84 4.75 2.03 0.73 -0.06 -0.36 -0.57 -0.76
Acidic/Basic/Neutral
Cap
acity
Fac
tor (
k)
Phenyl Hydride
Mobile Phase Composition (% Methanol)
10 20 30 40 50 60 70 80 90Ketoprofen 7.09 1.7 0.54 0.18 0.05 -0.03 -0.05 -0.13 -0.23
2-Nitrobenzoic Acid 0.24 0.16 0.12 0.06 0.04 0 -0.03 -0.08 -0.18Amitriptyline 5.6 1.62 0.64 0.25 0.09 0 -0.04 -0.12 -0.24
Diphenhydramine 2.16 0.72 0.33 0.12 0.06 -0.01 -0.04 -0.12 -0.23Anisole 0.73 0.41 0.25 0.13 0.05 -0.01 -0.04 -0.1 -0.21
Naphthalene 5.24 2.18 1.01 0.43 0.18 0.04 -0.01 -0.1 -0.22Ethylbenzene 2.23 0.79 0.37 0.17 0.08 0.01 -0.03 -0.1 -0.21
Acidic/Basic/Neutral
Cap
acity
Fac
tor (
k)
Diol
Mobile Phase Composition (% Methanol)

70
Figure 35. Diamond Bidentate C18 with Methanol Mobile Phase Overlaid/Stacked Chromatograms.

71
Figure 36. Bidentate C18 with Methanol Mobile Phase Overlaid/Stacked Chromatograms.

72
In comparison, the Phenyl Hydride was capable of achieving high resolution without
suffering from significant band broadening (Figure 37). Unfortunately, the Diol still does
not offer much in the areas of retention even when used with methanol (Figure 38). The
only notable difference between retention trends of these compounds was the Phenyl
Hydride displaying the expected retention order for Trend 3 (Naphthalene >
Ethylbenzene > Anisole) compared to acetonitrile supporting the retention of anisole over
ethylbenzene. The most interesting difference between the use of each mobile phase is
that the ANP properties are only observed when acetonitrile is used and not at all with
methanol (Figures 39 – 42). Although the reason for this result is uncertain, the fact that
acetonitrile is a stronger organic may assist in the competition between ANP retention
and RP retention.

73
Figure 37. Phenyl Hydride with Methanol Mobile Phase Overlaid/Stacked Chromatograms.

74
Figure 38. Diol with Methanol Mobile Phase Overlaid/Stacked Chromatogram.

75
Figure 39. Diamond C18 Retention Map (MeOH/ABN). Compares capacity factor “k” (y-axis) to percentage mobile phase (x-axis).
Figure 40. Bidentate C18 Retention Map (MeOH/ABN). Compares capacity factor “k” (y-axis) to percentage mobile phase (x-axis).
-2
0
2
4
6
8
10
12
14
16
18
0 10 20 30 40 50 60 70 80 90 100
Capa
city
Fac
tor (
k)
Mobile Phase Composition (% Methanol)
0
5
10
15
20
25
30
0 10 20 30 40 50 60 70 80 90 100
Capa
city
Fac
tor (
k)
Mobile Phase Composition (% Methanol)

76
Figure 41. Phenyl Hydride Retention Map (MeOH/ABN). Compares capacity factor “k” (y-axis) to percentage mobile phase (x-axis).
-1
4
9
14
19
24
29
0 10 20 30 40 50 60 70 80 90 100
Capa
city
Fac
tor (
k)
Mobile Phase Composition (% Methanol)
-1.00
0.00
1.00
2.00
3.00
4.00
5.00
6.00
7.00
8.00
0 10 20 30 40 50 60 70 80 90 100
Capa
city
Fac
tor (
k)
Mobile Phase Composition (% Methanol)

77
Figure 42. Diol Retention Map (MeOH/ABN). Compares capacity factor “k” (y-axis) to percentage mobile phase (x-axis).
Chapter 4: Conclusions and Future Studies
The main purpose for this project was to characterize the four Type-C silica
stationary phases by gathering retention data of resveratrol analogues and a small set of
acidic, basic and neutral compounds. Retention maps were created by comparing the
retention factor k and mobile phase compositions ranging from 90% organic (acetonitrile
vs. methanol) to 10% organic. Retention trends were organized based on the compound
structure and polarity (determined by calculated logP values). Finally, the overlaid and
stacked chromatograms were prepared to demonstrate each column’s theoretical ability to
resolve each peak if the compounds were introduced as a mixture. The information
collected gave valuable insight regarding the retention power, selectivity and resolution
of each column when specific mobile phase was used to analyze the two sets of
compounds.
To summarize, there were several key pieces of data that proved informative and
interesting. First, higher retention was observed using methanol compared to acetonitrile
which was expected due to methanol being a weaker organic. Between the stationary
phases the highest retention observed with acetonitrile was as follows: Diamond C18 >
Bidentate C18 > Phenyl Hydride > Diol. Compared to methanol, the order changed to:
Bidentate C18 > Diamond C18 > Phenyl Hydride > Diol. Secondly, the actual retention
trends showed selectivity for compounds apart from polarity. For example, the amide
resveratrol retained more than the amine/imine versions at higher aqueous mobile phase
compositions. Additionally, surfactant like properties were observed for compounds with
78
hydrophilic heads and hydrophobic tails such as MH4 > MH5 (triol/diol), MH7 > MH8
(unsaturated diols) and MH15 > MH16 (saturated diols). While selectivity did vary
between the four stationary phases and two mobile phases, the column that demonstrated
the most selectivity Phenyl Hydride. The Phenyl showed the highest selectivity for the
meta/para hydroxides (MH17 and MH18), unsaturated vs. saturated resveratrol and gave
high resolution for both compound sets at low organic content. Aside from methanol
demonstrating higher retention of the analytes compared to acetonitrile, methanol did not
appear to support ANP retention of MH2 (imine resveratrol), amitriptyline and
diphenhydramine. This is important to note that the use of a stronger organic mobile
phase may be necessary to promote ANP retention. Another interesting factor was that
only nitrogenous compounds where the nitrogen atom was only bound to carbon
demonstrated ANP properties. This is most evident when comparing imine, amine and
amide versions of resveratrol on the Diol because only the imine version shows ANP
retention. All the capacity factor data collected has been sent to collaborators from
Monash University for LSER analysis and zeta potential measurements.
Despite all the data gathered for this project future work can still be pursued. Other
forms of characterizing the columns may include pH studies where all other conditions
such as mobile phase composition, flow rate and injection volume remain constant while
varying the pH of the solvent (within the recommended limits of each column).
Controlling the pH may shed light on any ionic interactions that may occur depending on
whether the analytes are suppressed or not. Similarly, temperature studies can be
observed in the same fashion where the temperature of the column is controlled.

79
Temperature studies plays a role in the viscosity of solvent, kinetic and thermodynamics
which can change retention properties of the stationary phase. Other potential studies
may focus on the solvation effects of the mobile phase on the analytes. Since the
resveratrol compounds are polyphenols, the hydroxide groups may be susceptible to
being solvated by acetonitrile or methanol. One interesting thought provided by Drs.
Chester Simocko and Madalyn Radlauer was to derivatize the resveratrol compounds
with methoxymethyl acetal groups and compare the retention when methanol is used as
mobile phase. The idea is to mimic the proposed “solvation” effect when methanol is
used as mobile phase. If the derivatives show the same retention times on the RP columns
then the solvation effect may be responsible for some of the differences in retention order
mentioned previously.

80
References
1. Cassidy, H. G. The nature of chromatography. J. Chem. Educ. 1956, 33, 482.
2. Heines, S. V. Three who pioneered in chromatography. J. Chem. Educ. 1969, 46, 315.
3. Williams, K. R. Colored Bands: History of Chromatography. J. Chem. Educ. 2002, 79, 922.
4. Robinson, T. Michael Tswett. J. Chem. Educ. 1959, 36, 144.
5. Lee, M. L.; Bowerbank, C. R. Universal Chromatography for Fast Separations. In Unified ChromatographyAmerican Chemical Society: 1999; Vol. 748, pp 179-202.
6. Serban C. Moldoveanu, Victor David Essentials in Modern HPLC Separations; Elsevier: Waltham, MA, 2013; .
7. Ilbeigi, V.; Tabrizchi, M. Thin Layer Chromatography-Ion Mobility Spectrometry (TLC-IMS). Anal. Chem. 2015, 87, 464-469.
8. Costanzo, S. J. High performance thin layer chromatography. J. Chem. Educ. 1984, 61, 1015.
9. Pesek, J.; Matyska, M. T. A Comparison of Two Separation Modes: HILIC and Aqueous Normal Phase Chromatography. LCGC North America 2007, 25, 480.
10. Martin, J. P.; Synge, R. L. M. A New Form of Chromatogram Employing Two Liquid Phases. Biochem. J. 1941, 35.
11. Snyder, L. R. Modern Practice of Liquid Chromatography: Before and after 1971. J. Chem. Educ. 1997, 74, 37.
12. De Vos, J.; Broeckhoven, K.; Eeltink, S. Advances in Ultrahigh-Pressure Liquid Chromatography Technology and System Design. Anal. Chem. 2016, 88, 262-278.
13. Valentão, P.; andrade, P. B.; Areias, F.; Ferreres, F.; Seabra, R. M. Analysis of Vervain Flavonoids by HPLC/Diode Array Detector Method. Its Application to Quality Control. J. Agric. Food Chem. 1999, 47, 4579-4582.
14. Pesek, J. J.; Matyska, M. T. Amazon Bark Extract. 2015, 331.
15. Brettell, T. A.; Butler, J. M.; Almirall, J. R. Forensic Science. Anal. Chem. 2007, 79, 4365-4384.

81
16. Pesek, J. J.; Matyska, M. T. Codeine and Hydrocodone. 2014, 315.
17. McGorrin, R. J. One Hundred Years of Progress in Food Analysis. J. Agric. Food Chem. 2009, 57, 8076-8088.
18. Pesek, J. J.; Matyska, M. T. Oleuropein in Olive Leaves. 2013, 283.
19. Pesek, J. J.; Matyska, M. T. Analysis of Harmful Substances in Dietary Supplements. 2015, 337.
20. Qu, G.; Shi, J.; Wang, T.; Fu, J.; Li, Z.; Wang, P.; Ruan, T.; Jiang, G. Identification of Tetrabromobisphenol A Diallyl Ether as an Emerging Neurotoxicant in Environmental Samples by Bioassay-Directed Fractionation and HPLC-APCI-MS/MS. Environ. Sci. Technol. 2011, 45, 5009-5016.
21. Del Valle, P. L.; Muldoon, M. T.; Karns, J. S.; Nelson, J. O.; Mulbry, W. W. Development of Improved Immunoassay and HPLC Methods for the Analysis of Chlorodiamino-s-triazine in Environmental Samples. J. Agric. Food Chem. 1996, 44, 945-952.
22. Pesek, J. J.; Matyska, M. T. Analysis of Herbicides. 2014.
23. Moldoveanu, S. C.; David, V. Essentials In Modern HPLC Separations; Elsevier: MA, USA, 2013; .
24. Qiu, H.; Liang, X.; Sun, M.; Jiang, S. Development of silica-based stationary phases for high-performance liquid chromatography. Analytical and Bioanalytical Chemistry 2011, 399, 3307-3322.
25. Wyndham, K. D.; O'Gara, J. E.; Walter, T. H.; Glose, K. H.; Lawrence, N. L.; Alden, B. A.; Izzo, G. S.; Hudalla, C. J.; Iraneta, P. C. Characterization and Evaluation of C18 HPLC Stationary Phases Based on Ethyl-Bridged Hybrid Organic/Inorganic Particles. Anal. Chem. 2003, 75, 6781-6788.
26. Brown, L.; Ciccone, B.; Pesek, J. J.; Matyska, M. T. An Evolution in Separation Media for HPLC. American Laboratory 2003, 23.
27. Pesek, J. J.; Matyska, M. T.; Oliva, M.; Evanchic, M. Synthesis and characterization of bonded phases made via hydrosilation of alkynes on silica hydride surfaces. Elsevier 1998, 818, 145.
28. Pace-Asciak, C. R.; Hahn, S.; Diamandis, E. P.; Soleas, G.; Goldberg, D. M. The red wine phenolics trans-resveratrol and quercetin block human platelet aggregation and
82
eicosanoid synthesis: implications for protection against coronary heart disease. Clincal Chimica Acta 1995, 235, 207.
29. Frankel, E. N.; Waterhouse, A. L.; Kinsella, J. E. Inhibition of human LDL oxidation by resveratrol. Lancet 1993, 341, 1103.
30. Jang, M.; Cai, L.; Udeani, G. O.; Slowing, K. V.; Thomas, C. F.; Beecher, C. W. C. W.; et al. Cancer chemopreventive activity of resveratrol, a natural product derived from grapes. Science 1997, 275, 218.
31. Zhou, J.; Zhou, M.; Yang, F.; Liu, C.; Pan, R.; Chang, Q.; Liu, X.; Liao, Y. Involvement of the Inhibition of Intestinal Glucuronidation in Enhancing the Oral Bioavailability of Resveratrol by Labrasol Containing Nanoemulsions. Mol. Pharmaceutics 2015, 12, 1084-1095.
32. Azzolini, M.; Mattarei, A.; La Spina, M.; Marotta, E.; Zoratti, M.; Paradisi, C.; Biasutto, L. Synthesis and Evaluation as Prodrugs of Hydrophilic Carbamate Ester Analogues of Resveratrol. Mol. Pharmaceutics 2015, 12, 3441-3454.
33. Szekeres, T.; Fritzer-Szekeres, M.; Saiko, P.; Jager, W. Resveratrol and Resveratrol Analogues—Structure—Activity Relationship. Pharmaceutical Research 2010, 27, 1042.
34. Letter, W. Any advatages of Agilent G1379 1260 Micro Degasser towards 'normal' G1322 1200 or G1322A 1100 Degasser for analytical HPLC?? 2017.
35. Sanchez, C. A. agilent 1200 vs. 1100 binary pumps. 2011.
36. Singh, G.; Pai, R. S.; and Pandit, V. Development and validation of a HPLC method for the determination of trans-resveratrol in spiked human plasma. Journal of Advanced Pharmaceutical Technology and Research 2012, 3, 130.
37. Sadek, P. C.; Carr, P. W.; Doherty, R. M.; Kamlet, M. J.; Taft, R. W.; Abraham, M. H. Study of retention processes in reversed-phase high-performance liquid chromatography by the use of the solvatochromic comparison method. Anal. Chem. 1985, 57, 2971-2978.
38. Kulsing, C.; Yang, Y.; Sepehrifar, R.; Lim, M.; Toppete, J.; Matyska, M. T.; Pesek, J. J.; Boysen, R. I.; Hearn, M. T. W. Investigations into the separation behaviour of perfluorinated C8 and undecanoic acid modified silica hydride stationary phases. Anal. Chim. Acta 2016, 916, 102-111.

83
39. Wilson, N. S.; Nelson, M. D.; Dolan, J. W.; Snyder, L. R.; Wolcott, R. G.; Carr, P. W. Column selectivity in reversed-phase liquid chromatography: I. A generalquantitative relationship. Journal of Chromatography 2002, 961, 171.