characterization of fusarium proliferatum and fusarium ... a. najihah.pdf · characterization of...
TRANSCRIPT
Sains Malaysiana 46(12)(2017): 2425–2432 http://dx.doi.org/10.17576/jsm-2017-4612-18
Characterization of Fusarium proliferatum and Fusarium verticillioides based on Species-Specific Gene and Microsatellites Analysis
(Perincian Fusarium proliferatum dan Fusarium verticillioides Berdasarkan Gen Khusus Spesies dan Analisis Mikrosatelit)
A. NAJIHAH, M.Z. NUR AIN IZZATI*, S.Y.C. YONG & M.N. NIK MOHD IZHAM
ABSTRACT
Fusarium species are known to cause various diseases on plantations including fruits and vegetables. The most common Fusarium that can cause plant diseases are Fusarium proliferatum and Fusarium verticillioides. Ear rot disease on maize, wilt disease on cucurbits and fruit rot disease on tomato as well as banana are example of diseases caused by these two species. The objectives of this study were to identify F. proliferatum and F. verticillioides based on species-specific primers and polymerase chain reaction (PCR) amplification and to evaluate the genetic diversity of both species based on microsatellite markers. Fifty isolates of Fusarium species that were previously collected throughout Malaysia from different hosts were identified by using species-specific PCR amplification. Twenty-nine isolates were identified as F. proliferatum and 21 isolates were identified as F. verticillioides based on species-specific primer. The genetic diversity of all the fungal isolates was evaluated by using microsatellite analysis with six established primers. Five out of six primers amplified polymorphic bands with the most effective primer showing high polymorphism were (AG)7C and (TCC)5 meanwhile one primer (TTTC)4 gave negative result with no band amplified. The phylogenetic tree that was constructed showing two different clades distinguished between F. proliferatum and F. verticillioides.
Keywords: Fusarium proliferatum; Fusarium verticillioides; microsatellite; species-specific gene
ABSTRAK
Spesies Fusarium dikenali sebagai penyebab pelbagai penyakit terhadap tumbuhan termasuk buah-buahan dan sayur-sayuran. Antara spesies Fusarium yang paling kerap menyebabkan penyakit pokok adalah Fusarium proliferatum dan Fusarium verticillioides. Penyakit reput tongkol pada jagung, penyakit layu pada mentimun dan penyakit buah reput pada tomato dan pisang adalah contoh penyakit disebabkan oleh dua spesis ini. Objektif kajian ini adalah untuk mengenal pasti F. proliferatum dan F. verticillioides berdasarkan khusus spesies reaksi rantai polimerase dan untuk menilai kepelbagaian genetik kedua-dua spesies berdasarkan mikrosatelit. Lima puluh isolat spesies Fusarium yang terlebih dahulu dipencilkan daripada pelbagai perumah yang diperoleh dari serata Malaysia telah diuji dan dikenal pasti dengan menggunakan gen khusus spesies reaksi rantai polimerase. Dua puluh sembilan isolat telah dikenal pasti sebagai F. proliferatum dan dua puluh satu isolat telah dikenal pasti sebagai F. verticillioides berdasarkan primer gen khusus spesies. Setelah proses pengenalpastian dilakukan, kepelbagaian genetik telah dinilai dengan menggunakan analisis mikrosatelit menggunakan enam primer. Lima daripada enam primer menghasilkan band polimorfik dan primer yang paling tinggi kadar polimorfisme adalah (AG)7C dan (TCC)5 manakala satu primer (TTTC)4 memberikan hasil negatif dan tiada amplifikasi. Pohon filogenetik yang telah dihasilkan menunjukkan dua klad yang membezakan antara F. proliferatum dan F. verticillioides.
Kata kunci: Fusarium proliferatum; Fusarium verticillioides; gen khusus spesies; mikrosatelit
INTRODUCTION
Fusarium proliferatum and Fusarium verticillioides can cause various diseases and have become potential pathogens on maize causing Fusarium ear rot disease, on tomato causing fruit rot disease and on luffa and pumpkin causing wilt disease. In Malaysia, Fusarium species such as F. proliferatum, F. verticillioides, F. subglutinans, F. sacchari and F. fujikuroi have been found to infect agricultural crops such as maize, rice and sugarcane (Nur Ain Izzati et al. 2011; 2010; 2009). Another occurrence in Malaysia was F. proliferatum, F. oxysporum, F. nygamai,
F. semitectum, F. solani and F. verticillioides were successfully isolated from corn in four different states of Malaysia namely Perlis, Pulau Pinang, Sabah and Sarawak (Darnetty et al. 2008). Factors leading to contamination of Fusarium species might be influenced by environmental condition such as temperature and humidity, susceptibility of the species and cultural practices such as crop rotation (Reid et al. 2001). Identification of F. proliferatum and F. verticillioides only by morphological characteristics is very difficult due to their similar characteristics like mycelial pigmentation
2426
and shape of the conidia. Hence, development of molecular markers based on the Polymerase Chain Reaction (PCR) has become the most effective method for species identification and these species-specific primers will result in sensitive and rapid identification (Zheng & Ploetz 2002). Microsatellites or simple sequence repeats (SSRs) can be found abundantly and ubiquitous in all eukaryotic genome (Yogeshwar et al. 2010). Since it has high level of polymorphism, microsatellites have become genetic markers frequently used in population genetics and diversity studies (Ellegren 2000). Genetic studies by Ren et al. (2012) on F. verticillioides suggested that the population grouped by geographical area were genetically similar and have very low extent of genetic differentiation among the populations. Microsatellite analysis has become one of the most reliable genetic tools in population and conservation genetic studies. This technique can be used for analysis of phylogenetic relationship among populations and to detect the genetic variation. The objectives of this study were to identify F. proliferatum and F. verticillioides based on species-specific PCR assays and to evaluate the genetic diversity of both species based on microsatellite markers.
MATERIALS AND METHODS
FUNGAL PURIFICATION AND PRESERVATION
Fifty isolates of F. proliferatum and F. verticillioides were obtained from Mycology Laboratory, Department of Biology, Universiti Putra Malaysia and Mycology Laboratory, School of Biological Sciences, Universiti Sains Malaysia. All of the isolates were previously collected throughout Malaysia from different hosts. The isolates were re-purified on Potato Dextrose Agar (PDA), incubated for 5 days and then were transferred on Spezieller Nahrstoffarmer Agar (SNA) and filter paper for preservation. The isolates were incubated at room temperature (27 ± 2°C) for 7 days and then the filter papers were transferred into cryovial tube, dried using silica gels in a desiccator and kept in -20°C.
DNA EXTRACTION AND SPECIES-SPECIFIC PCR AMPLIFICATION
All isolates were cultured on PDA for 7 days and genomic DNA were extracted by using UltraClean® Microbial DNA
isolation kit (MO BIO, Carlsbad, CA, USA) according to the protocols provided by the manufacture. Species-specific PCR amplifications were carried out using primers ProF1 (5’-CTTTCCGCCAAGTTTCTTC-3’) and ProR1 (5’-TGTCAGTAACTCGACGTTGTTG-3’) for detection of F. proliferatum (Jahan Quazi et al. 2013); while VertF1 (5’-GTCAGAATCCATGCCAGAACG-3’) and VertR1 (5’-CACCCGCAGCAATCCATCAG-3’) for the detection of F. verticillioides (Patino et al. 2004). PCR reactions for both primer pairs performed in a final volume of 20 μl consisting of 1 PCR buffer, 0.5 μM primer, 0.2 mM of each deoxynucleotide triphosphate (dNTPs), 2.5 mM magnesium chloride (MgCl2), 0.125 U GoTaq DNA Polymerase, nuclease free water and 20 ng DNA template. PCR condition for species-specific identification of F. proliferatum follows Jahan Quazi et al. (2013); initial denaturation at 94°C for 2 min, 35 cycles of denaturation at 94°C for 1 min, annealing at 61°C for 30 s, extension at 72°C for 1 min and a single cycle of final extension at 72°C for 5 min while identification of F. verticillioides follows Patino et al. (2004); initial denaturation at 94°C for 1.25 min, 25 cycles of denaturation at 95°C for 35 s, annealing at 66°C for 30 s, extension at 72°C for 2 min and final extension at 72°C for 5 min. Gel electrophoresis was performed by using 1.5% agarose gel and immersed in 1X Tris Borate-acid EDTA (TBE) buffer amended with FloroSafe DNA stain according to manufacturer’s instructions (1st BASE, Asia). Approximately 5 μL for each DNA ladder 100 bp (Thermo Scientific) and PCR products were loaded and electrophoresed for 35 min at 90 V. The gel was viewed and analysed using Syngene software by a gel documentation system under UV light visualisation (Syngene, Germany).
MICROSATELLITE ANALYSIS
Six established microsatellite markers as listed in Table 1 were selected to perform the analysis on genetic diversity of F. proliferatum and F. verticillioides isolates. Standard PCR master mix for all reactions were each 20 μL comprises 1 PCR buffer, 0.5 μM primer, 0.2 mM of each deoxynucleotide triphosphate (dNTPs), 2.5 mM magnesium chloride (MgCl2), 0.125 U GoTaq polymerase, nuclease free water and 20 ng DNA. The following PCR amplification was followed as: initial denaturation at 94°C for 2 min, 39 cycles of denaturation at 94°C for 1 min, annealing as follow the optimal Tm for each primer
TABLE 1. Primers for microsatellite analysis
Nucleotide repeats Primer Tm (°C) GC content (%) Expected alleles size range (bp)
Di- (AG)7C(CA)7T
5052
53.346.7
200-2500300-1700
Tri- (CTG)5(TCC)5
5252
66.766.7
450-2000400-2000
Tetra- (TAGG)4(TTTC)4
5050
50.025.0
200-2000300-2000
2427
(Table 1) for 90 min, extension at 72°C for 2 min and a final extension at 72°C for 6 min (Bahkali et al. 2012).
Gel electrophoresis was performed by using 1.5% agarose gel and immersed in 1X Tris Borate-acid
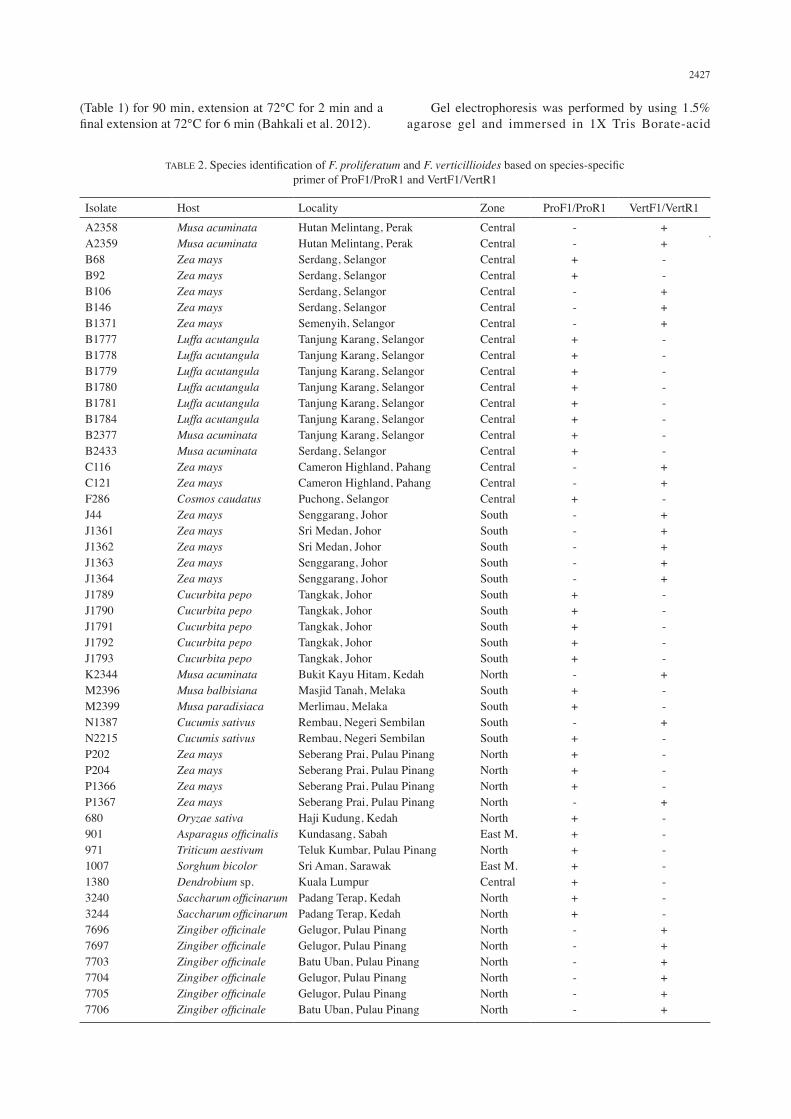
TABLE 2. Species identification of F. proliferatum and F. verticillioides based on species-specific primer of ProF1/ProR1 and VertF1/VertR1
Isolate Host Locality Zone ProF1/ProR1 VertF1/VertR1A2358A2359B68B92B106B146B1371B1777B1778B1779B1780B1781B1784B2377B2433C116C121F286J44J1361J1362J1363J1364J1789J1790J1791J1792J1793K2344M2396M2399N1387N2215P202P204P1366P13676809019711007138032403244769676977703770477057706
Musa acuminataMusa acuminataZea maysZea maysZea maysZea maysZea maysLuffa acutangulaLuffa acutangulaLuffa acutangulaLuffa acutangulaLuffa acutangulaLuffa acutangulaMusa acuminataMusa acuminataZea maysZea maysCosmos caudatusZea maysZea maysZea maysZea maysZea maysCucurbita pepoCucurbita pepoCucurbita pepoCucurbita pepoCucurbita pepoMusa acuminataMusa balbisianaMusa paradisiacaCucumis sativusCucumis sativusZea maysZea maysZea maysZea maysOryzae sativaAsparagus officinalisTriticum aestivumSorghum bicolorDendrobium sp.Saccharum officinarumSaccharum officinarumZingiber officinaleZingiber officinaleZingiber officinaleZingiber officinaleZingiber officinaleZingiber officinale
Hutan Melintang, PerakHutan Melintang, PerakSerdang, SelangorSerdang, SelangorSerdang, SelangorSerdang, SelangorSemenyih, SelangorTanjung Karang, SelangorTanjung Karang, SelangorTanjung Karang, SelangorTanjung Karang, SelangorTanjung Karang, SelangorTanjung Karang, SelangorTanjung Karang, SelangorSerdang, SelangorCameron Highland, PahangCameron Highland, PahangPuchong, SelangorSenggarang, JohorSri Medan, JohorSri Medan, JohorSenggarang, JohorSenggarang, JohorTangkak, JohorTangkak, JohorTangkak, JohorTangkak, JohorTangkak, JohorBukit Kayu Hitam, KedahMasjid Tanah, MelakaMerlimau, MelakaRembau, Negeri SembilanRembau, Negeri SembilanSeberang Prai, Pulau PinangSeberang Prai, Pulau PinangSeberang Prai, Pulau PinangSeberang Prai, Pulau PinangHaji Kudung, KedahKundasang, SabahTeluk Kumbar, Pulau PinangSri Aman, SarawakKuala LumpurPadang Terap, KedahPadang Terap, KedahGelugor, Pulau PinangGelugor, Pulau PinangBatu Uban, Pulau PinangGelugor, Pulau PinangGelugor, Pulau PinangBatu Uban, Pulau Pinang
CentralCentralCentralCentralCentralCentralCentralCentralCentralCentralCentralCentralCentralCentralCentralCentralCentralCentralSouthSouthSouthSouthSouthSouthSouthSouthSouthSouthNorthSouthSouthSouthSouthNorthNorthNorthNorthNorthEast M.NorthEast M.CentralNorthNorthNorthNorthNorthNorthNorthNorth
--++---++++++++--+-----+++++-++-++++-+++++++------
++--+++--------++-+++++-----+--+----+-------++++++
++--+++--------++-+++++-----+--+----+-------+++++
2428
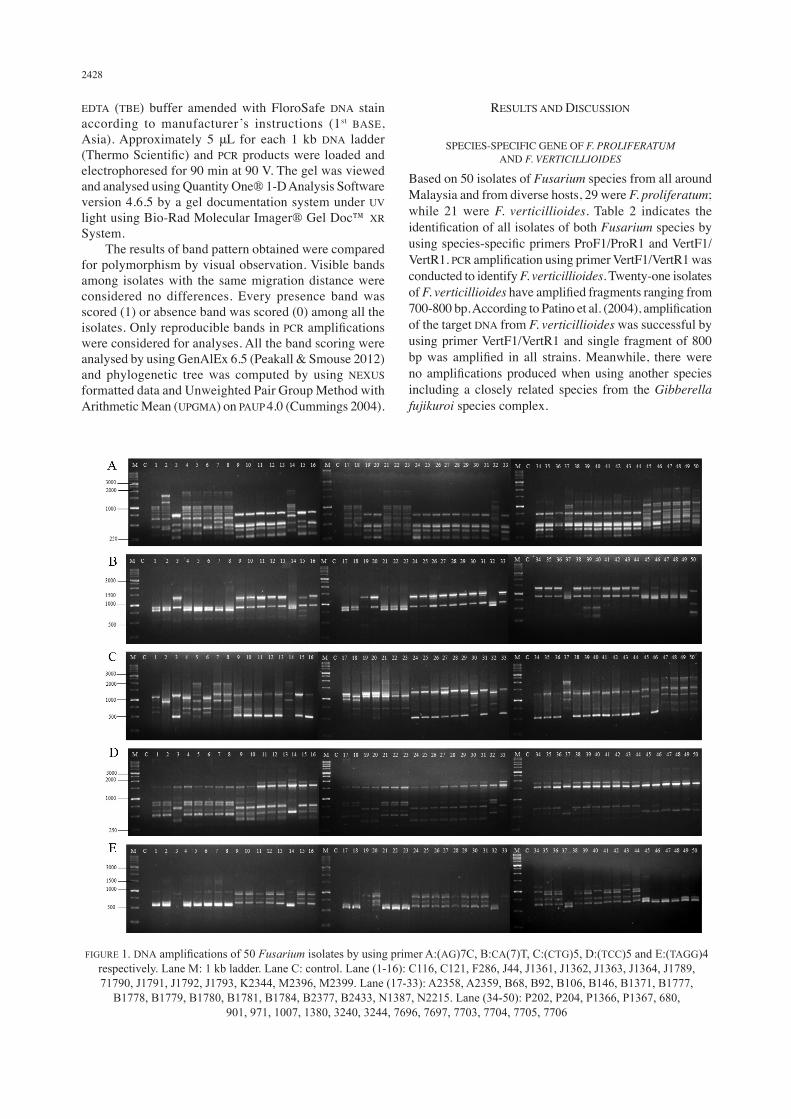
FIGURE 1. DNA amplifications of 50 Fusarium isolates by using primer A:(AG)7C, B:CA(7)T, C:(CTG)5, D:(TCC)5 and E:(TAGG)4 respectively. Lane M: 1 kb ladder. Lane C: control. Lane (1-16): C116, C121, F286, J44, J1361, J1362, J1363, J1364, J1789, 71790, J1791, J1792, J1793, K2344, M2396, M2399. Lane (17-33): A2358, A2359, B68, B92, B106, B146, B1371, B1777,
B1778, B1779, B1780, B1781, B1784, B2377, B2433, N1387, N2215. Lane (34-50): P202, P204, P1366, P1367, 680, 901, 971, 1007, 1380, 3240, 3244, 7696, 7697, 7703, 7704, 7705, 7706
EDTA (TBE) buffer amended with FloroSafe DNA stain according to manufacturer’s instructions (1st BASE, Asia). Approximately 5 μL for each 1 kb DNA ladder (Thermo Scientific) and PCR products were loaded and electrophoresed for 90 min at 90 V. The gel was viewed and analysed using Quantity One® 1-D Analysis Software version 4.6.5 by a gel documentation system under UV light using Bio-Rad Molecular Imager® Gel Doc™ XR System. The results of band pattern obtained were compared for polymorphism by visual observation. Visible bands among isolates with the same migration distance were considered no differences. Every presence band was scored (1) or absence band was scored (0) among all the isolates. Only reproducible bands in PCR amplifications were considered for analyses. All the band scoring were analysed by using GenAlEx 6.5 (Peakall & Smouse 2012) and phylogenetic tree was computed by using NEXUS formatted data and Unweighted Pair Group Method with Arithmetic Mean (UPGMA) on PAUP 4.0 (Cummings 2004).
RESULTS AND DISCUSSION
SPECIES-SPECIFIC GENE OF F. PROLIFERATUM AND F. VERTICILLIOIDES
Based on 50 isolates of Fusarium species from all around Malaysia and from diverse hosts, 29 were F. proliferatum; while 21 were F. verticillioides. Table 2 indicates the identification of all isolates of both Fusarium species by using species-specific primers ProF1/ProR1 and VertF1/VertR1. PCR amplification using primer VertF1/VertR1 was conducted to identify F. verticillioides. Twenty-one isolates of F. verticillioides have amplified fragments ranging from 700-800 bp. According to Patino et al. (2004), amplification of the target DNA from F. verticillioides was successful by using primer VertF1/VertR1 and single fragment of 800 bp was amplified in all strains. Meanwhile, there were no amplifications produced when using another species including a closely related species from the Gibberella fujikuroi species complex.
2429
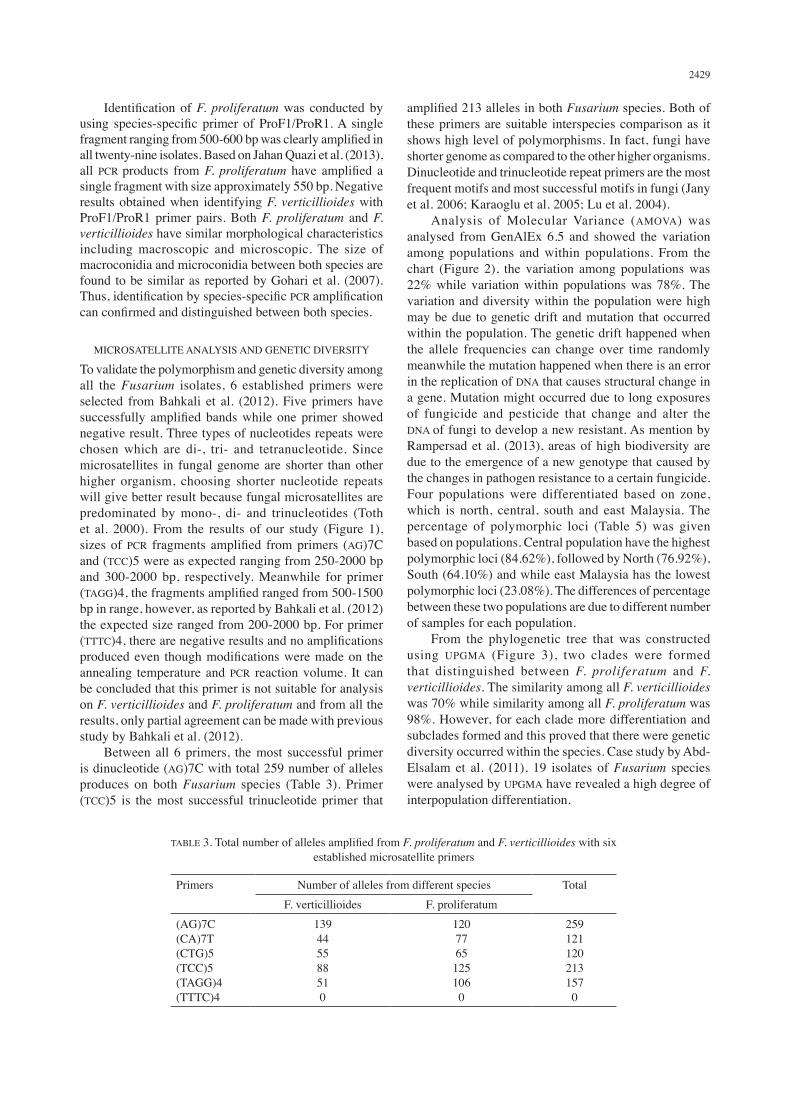
TABLE 3. Total number of alleles amplified from F. proliferatum and F. verticillioides with six established microsatellite primers
Primers Number of alleles from different species TotalF. verticillioides F. proliferatum
(AG)7C(CA)7T(CTG)5(TCC)5(TAGG)4(TTTC)4
139445588510
12077651251060
2591211202131570
Identification of F. proliferatum was conducted by using species-specific primer of ProF1/ProR1. A single fragment ranging from 500-600 bp was clearly amplified in all twenty-nine isolates. Based on Jahan Quazi et al. (2013), all PCR products from F. proliferatum have amplified a single fragment with size approximately 550 bp. Negative results obtained when identifying F. verticillioides with ProF1/ProR1 primer pairs. Both F. proliferatum and F. verticillioides have similar morphological characteristics including macroscopic and microscopic. The size of macroconidia and microconidia between both species are found to be similar as reported by Gohari et al. (2007). Thus, identification by species-specific PCR amplification can confirmed and distinguished between both species.
MICROSATELLITE ANALYSIS AND GENETIC DIVERSITY
To validate the polymorphism and genetic diversity among all the Fusarium isolates, 6 established primers were selected from Bahkali et al. (2012). Five primers have successfully amplified bands while one primer showed negative result. Three types of nucleotides repeats were chosen which are di-, tri- and tetranucleotide. Since microsatellites in fungal genome are shorter than other higher organism, choosing shorter nucleotide repeats will give better result because fungal microsatellites are predominated by mono-, di- and trinucleotides (Toth et al. 2000). From the results of our study (Figure 1), sizes of PCR fragments amplified from primers (AG)7C and (TCC)5 were as expected ranging from 250-2000 bp and 300-2000 bp, respectively. Meanwhile for primer (TAGG)4, the fragments amplified ranged from 500-1500 bp in range, however, as reported by Bahkali et al. (2012) the expected size ranged from 200-2000 bp. For primer (TTTC)4, there are negative results and no amplifications produced even though modifications were made on the annealing temperature and PCR reaction volume. It can be concluded that this primer is not suitable for analysis on F. verticillioides and F. proliferatum and from all the results, only partial agreement can be made with previous study by Bahkali et al. (2012). Between all 6 primers, the most successful primer is dinucleotide (AG)7C with total 259 number of alleles produces on both Fusarium species (Table 3). Primer (TCC)5 is the most successful trinucleotide primer that
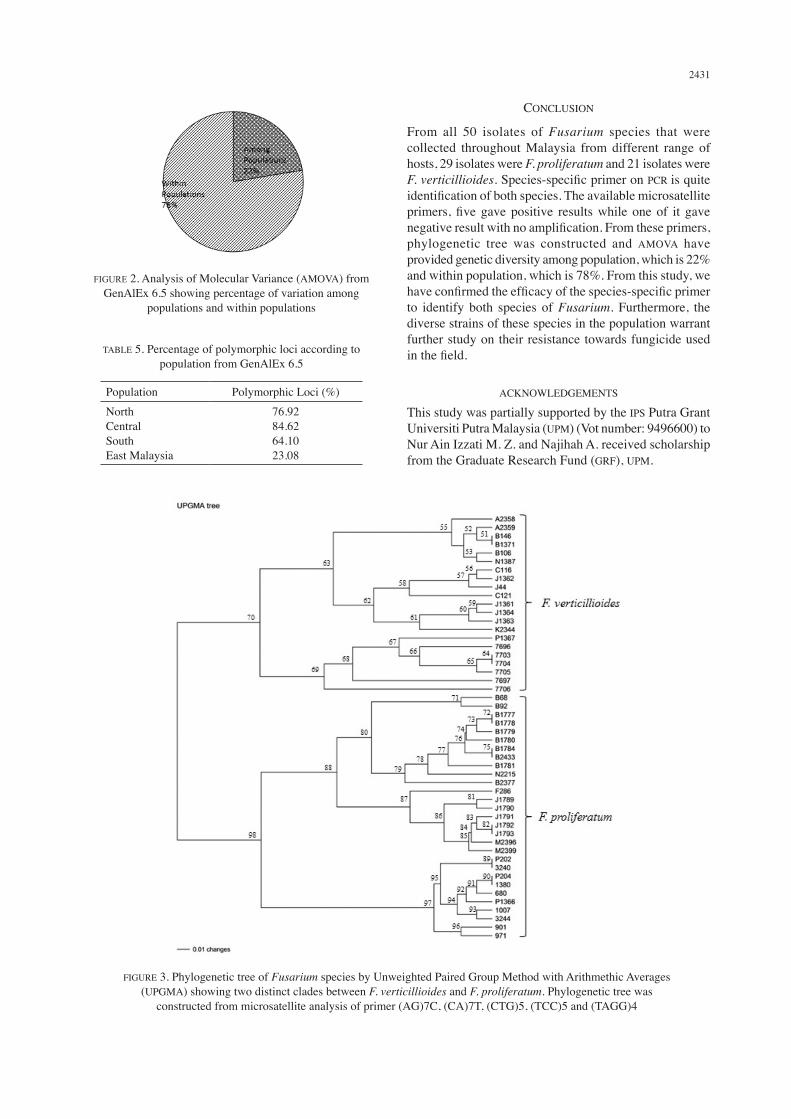
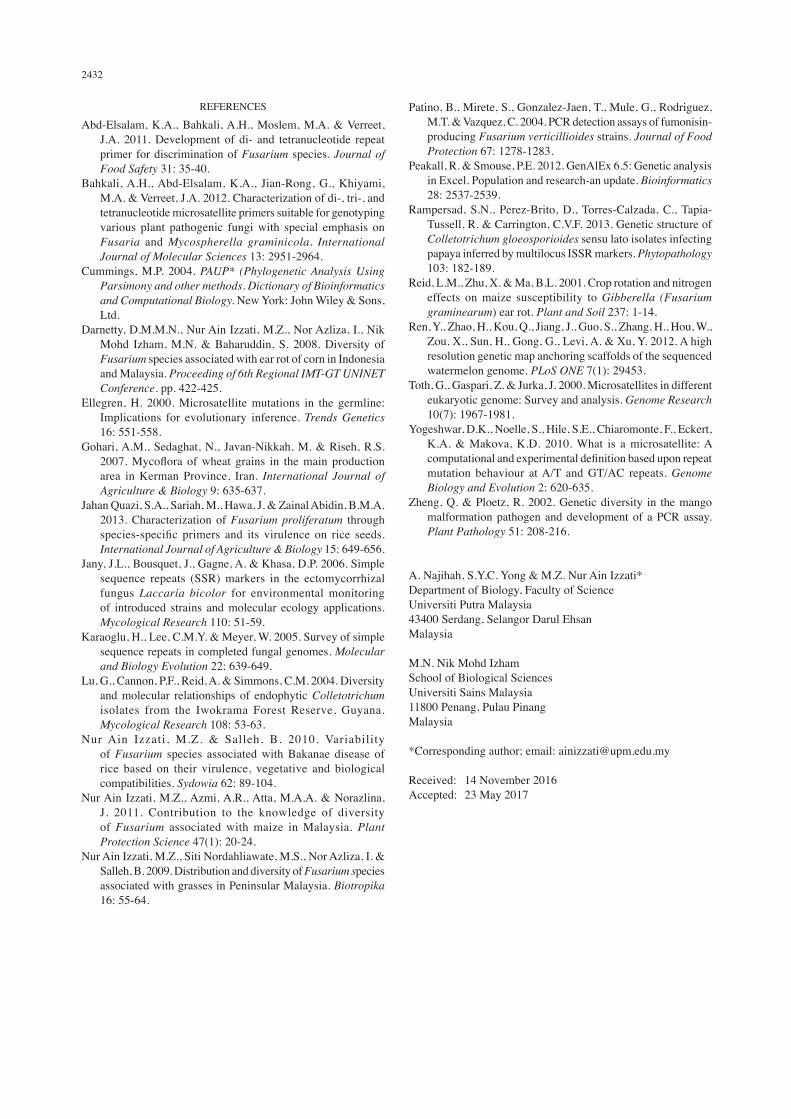
amplified 213 alleles in both Fusarium species. Both of these primers are suitable interspecies comparison as it shows high level of polymorphisms. In fact, fungi have shorter genome as compared to the other higher organisms. Dinucleotide and trinucleotide repeat primers are the most frequent motifs and most successful motifs in fungi (Jany et al. 2006; Karaoglu et al. 2005; Lu et al. 2004). Analysis of Molecular Variance (AMOVA) was analysed from GenAlEx 6.5 and showed the variation among populations and within populations. From the chart (Figure 2), the variation among populations was 22% while variation within populations was 78%. The variation and diversity within the population were high may be due to genetic drift and mutation that occurred within the population. The genetic drift happened when the allele frequencies can change over time randomly meanwhile the mutation happened when there is an error in the replication of DNA that causes structural change in a gene. Mutation might occurred due to long exposures of fungicide and pesticide that change and alter the DNA of fungi to develop a new resistant. As mention by Rampersad et al. (2013), areas of high biodiversity are due to the emergence of a new genotype that caused by the changes in pathogen resistance to a certain fungicide. Four populations were differentiated based on zone, which is north, central, south and east Malaysia. The percentage of polymorphic loci (Table 5) was given based on populations. Central population have the highest polymorphic loci (84.62%), followed by North (76.92%), South (64.10%) and while east Malaysia has the lowest polymorphic loci (23.08%). The differences of percentage between these two populations are due to different number of samples for each population. From the phylogenetic tree that was constructed using UPGMA (Figure 3), two clades were formed that distinguished between F. proliferatum and F. verticillioides. The similarity among all F. verticillioides was 70% while similarity among all F. proliferatum was 98%. However, for each clade more differentiation and subclades formed and this proved that there were genetic diversity occurred within the species. Case study by Abd-Elsalam et al. (2011), 19 isolates of Fusarium species were analysed by UPGMA have revealed a high degree of interpopulation differentiation.
2430
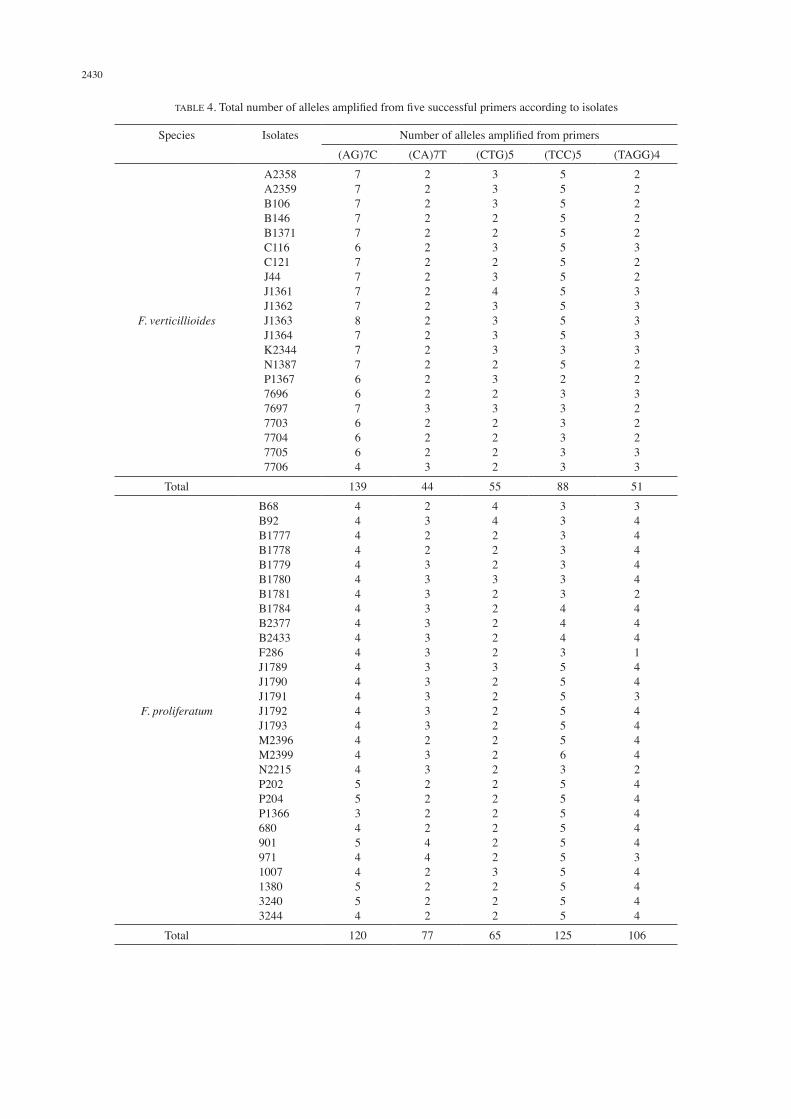
TABLE 4. Total number of alleles amplified from five successful primers according to isolates
Species Isolates Number of alleles amplified from primers(AG)7C (CA)7T (CTG)5 (TCC)5 (TAGG)4
F. verticillioides
A2358A2359B106B146B1371C116C121J44J1361J1362J1363J1364K2344N1387P1367769676977703770477057706
777776777787776676664
222222222222222232223
333223234333323232222
555555555555352333333
222223223333322322233
Total 139 44 55 88 51
F. proliferatum
B68B92B1777B1778B1779B1780B1781B1784B2377B2433F286J1789J1790J1791J1792J1793M2396M2399N2215P202P204P13666809019711007138032403244
44444444444444444445534544554
23223333333333332332222442222
44222322222322222222222223222
33333334443555555635555555555
34444424441443444424444434444
Total 120 77 65 125 106
2431
CONCLUSION
From all 50 isolates of Fusarium species that were collected throughout Malaysia from different range of hosts, 29 isolates were F. proliferatum and 21 isolates were F. verticillioides. Species-specific primer on PCR is quite identification of both species. The available microsatellite primers, five gave positive results while one of it gave negative result with no amplification. From these primers, phylogenetic tree was constructed and AMOVA have provided genetic diversity among population, which is 22% and within population, which is 78%. From this study, we have confirmed the efficacy of the species-specific primer to identify both species of Fusarium. Furthermore, the diverse strains of these species in the population warrant further study on their resistance towards fungicide used in the field.
ACKNOWLEDGEMENTS
This study was partially supported by the IPS Putra Grant Universiti Putra Malaysia (UPM) (Vot number: 9496600) to Nur Ain Izzati M. Z. and Najihah A. received scholarship from the Graduate Research Fund (GRF), UPM.
FIGURE 2. Analysis of Molecular Variance (AMOVA) from GenAlEx 6.5 showing percentage of variation among
populations and within populations
TABLE 5. Percentage of polymorphic loci according to population from GenAlEx 6.5
Population Polymorphic Loci (%)NorthCentralSouthEast Malaysia
76.9284.6264.1023.08
FIGURE 3. Phylogenetic tree of Fusarium species by Unweighted Paired Group Method with Arithmethic Averages (UPGMA) showing two distinct clades between F. verticillioides and F. proliferatum. Phylogenetic tree was
constructed from microsatellite analysis of primer (AG)7C, (CA)7T, (CTG)5, (TCC)5 and (TAGG)4
2432
REFERENCES
Abd-Elsalam, K.A., Bahkali, A.H., Moslem, M.A. & Verreet, J.A. 2011. Development of di- and tetranucleotide repeat primer for discrimination of Fusarium species. Journal of Food Safety 31: 35-40.
Bahkali, A.H., Abd-Elsalam, K.A., Jian-Rong, G., Khiyami, M.A. & Verreet, J.A. 2012. Characterization of di-, tri-, and tetranucleotide microsatellite primers suitable for genotyping various plant pathogenic fungi with special emphasis on Fusaria and Mycospherella graminicola. International Journal of Molecular Sciences 13: 2951-2964.
Cummings, M.P. 2004. PAUP* (Phylogenetic Analysis Using Parsimony and other methods. Dictionary of Bioinformatics and Computational Biology. New York: John Wiley & Sons, Ltd.
Darnetty, D.M.M.N., Nur Ain Izzati, M.Z., Nor Azliza, I., Nik Mohd Izham, M.N. & Baharuddin, S. 2008. Diversity of Fusarium species associated with ear rot of corn in Indonesia and Malaysia. Proceeding of 6th Regional IMT-GT UNINET Conference. pp. 422-425.
Ellegren, H. 2000. Microsatellite mutations in the germline: Implications for evolutionary inference. Trends Genetics 16: 551-558.
Gohari, A.M., Sedaghat, N., Javan-Nikkah, M. & Riseh, R.S. 2007. Mycoflora of wheat grains in the main production area in Kerman Province, Iran. International Journal of Agriculture & Biology 9: 635-637.
Jahan Quazi, S.A., Sariah, M., Hawa, J. & Zainal Abidin, B.M.A. 2013. Characterization of Fusarium proliferatum through species-specific primers and its virulence on rice seeds. International Journal of Agriculture & Biology 15: 649-656.
Jany, J.L., Bousquet, J., Gagne, A. & Khasa, D.P. 2006. Simple sequence repeats (SSR) markers in the ectomycorrhizal fungus Laccaria bicolor for environmental monitoring of introduced strains and molecular ecology applications. Mycological Research 110: 51-59.
Karaoglu, H., Lee, C.M.Y. & Meyer, W. 2005. Survey of simple sequence repeats in completed fungal genomes. Molecular and Biology Evolution 22: 639-649.
Lu, G., Cannon, P.F., Reid, A. & Simmons, C.M. 2004. Diversity and molecular relationships of endophytic Colletotrichum isolates from the Iwokrama Forest Reserve, Guyana. Mycological Research 108: 53-63.
Nur Ain Izzati, M.Z. & Salleh, B. 2010. Variability of Fusarium species associated with Bakanae disease of rice based on their virulence, vegetative and biological compatibilities. Sydowia 62: 89-104.
Nur Ain Izzati, M.Z., Azmi, A.R., Atta, M.A.A. & Norazlina, J. 2011. Contribution to the knowledge of diversity of Fusarium associated with maize in Malaysia. Plant Protection Science 47(1): 20-24.
Nur Ain Izzati, M.Z., Siti Nordahliawate, M.S., Nor Azliza, I. & Salleh, B. 2009. Distribution and diversity of Fusarium species associated with grasses in Peninsular Malaysia. Biotropika 16: 55-64.
Patino, B., Mirete, S., Gonzalez-Jaen, T., Mule, G., Rodriguez, M.T. & Vazquez, C. 2004. PCR detection assays of fumonisin-producing Fusarium verticillioides strains. Journal of Food Protection 67: 1278-1283.
Peakall, R. & Smouse, P.E. 2012. GenAlEx 6.5: Genetic analysis in Excel. Population and research-an update. Bioinformatics 28: 2537-2539.
Rampersad, S.N., Perez-Brito, D., Torres-Calzada, C., Tapia-Tussell, R. & Carrington, C.V.F. 2013. Genetic structure of Colletotrichum gloeosporioides sensu lato isolates infecting papaya inferred by multilocus ISSR markers. Phytopathology 103: 182-189.
Reid, L.M., Zhu, X. & Ma, B.L. 2001. Crop rotation and nitrogen effects on maize susceptibility to Gibberella (Fusarium graminearum) ear rot. Plant and Soil 237: 1-14.
Ren, Y., Zhao, H., Kou, Q., Jiang, J., Guo, S., Zhang, H., Hou, W., Zou, X., Sun, H., Gong, G., Levi, A. & Xu, Y. 2012. A high resolution genetic map anchoring scaffolds of the sequenced watermelon genome. PLoS ONE 7(1): 29453.
Toth, G., Gaspari, Z. & Jurka, J. 2000. Microsatellites in different eukaryotic genome: Survey and analysis. Genome Research 10(7): 1967-1981.
Yogeshwar, D.K., Noelle, S., Hile, S.E., Chiaromonte, F., Eckert, K.A. & Makova, K.D. 2010. What is a microsatellite: A computational and experimental definition based upon repeat mutation behaviour at A/T and GT/AC repeats. Genome Biology and Evolution 2: 620-635.
Zheng, Q. & Ploetz, R. 2002. Genetic diversity in the mango malformation pathogen and development of a PCR assay. Plant Pathology 51: 208-216.
A. Najihah, S.Y.C. Yong & M.Z. Nur Ain Izzati*Department of Biology, Faculty of ScienceUniversiti Putra Malaysia43400 Serdang, Selangor Darul EhsanMalaysia
M.N. Nik Mohd IzhamSchool of Biological SciencesUniversiti Sains Malaysia11800 Penang, Pulau PinangMalaysia
*Corresponding author; email: [email protected]
Received: 14 November 2016Accepted: 23 May 2017