characterization of healthy orthodontic patients on the
TRANSCRIPT

Loyola University Chicago Loyola University Chicago
Loyola eCommons Loyola eCommons
Master's Theses Theses and Dissertations
1981
Characterization of Healthy Orthodontic Patients on the Basis of Characterization of Healthy Orthodontic Patients on the Basis of
Metabolic Tests, as a Function of the Presence Or Absence of Metabolic Tests, as a Function of the Presence Or Absence of
Moderate to Severe Generalized Root Resorption Moderate to Severe Generalized Root Resorption
Stavros D. Papaconstantinou Loyola University Chicago
Follow this and additional works at: https://ecommons.luc.edu/luc_theses
Part of the Orthodontics and Orthodontology Commons
Recommended Citation Recommended Citation Papaconstantinou, Stavros D., "Characterization of Healthy Orthodontic Patients on the Basis of Metabolic Tests, as a Function of the Presence Or Absence of Moderate to Severe Generalized Root Resorption" (1981). Master's Theses. 3161. https://ecommons.luc.edu/luc_theses/3161
This Thesis is brought to you for free and open access by the Theses and Dissertations at Loyola eCommons. It has been accepted for inclusion in Master's Theses by an authorized administrator of Loyola eCommons. For more information, please contact [email protected].
This work is licensed under a Creative Commons Attribution-Noncommercial-No Derivative Works 3.0 License. Copyright © 1981 Stavros D. Papaconstantinou

. '
CHARACTERIZATION OF HEALTHY ORTHODONTIC PATIENTS ON THE
BASIS OF METABOLIC TESTS, AS A FUNCTION OF THE
PRESENCE OR ABSENCE OF MODERATE TO SEVERE
GENERALIZED ROOT RESORPTION
by
Stavros D. Papaconstantinou, D.D.S.
A Thesis Submitted to the Faculty of the Graduate School
of Loyola University in Partial Fulfillment
of the Requirements for the Degree of
Master of Science
July, 1981
• '• ·' I' - .... ' ... !1
. ~ . ~. J. '{' _._, __ ,}_~ .j - ..

DEDICATION
To my parents, who always managed to exceed my expectations, and to
whom I owe my being here
ii

To my uncle George and aunt Viola, my second mother
iii

To my associate in life and in orthodontics, Robin, with all my love
iv

ACKNOWLEDGEMENTS
I would like to express my sincere recognition to
all those who have helped in making this investigation
possible.
Dr. K. Hoerman, for his constructive criticism,
advice, and assistance through out the whole project.
Dr. L. Klapper, for his enthusiasm, encouragement,
and assistance.
Were it not for these two persons, the project would
had never been undertaken.
Dr. H. Spencer, for her help in the design of this
investigation.
Mr. P. Bricker, who contributed the most, by
handling the statistics within this thesis.
My wife, Robin, for proofreading the manuscript.
Ms. Bernie Ciamarichello, for giving a part of
herself in the typing of the manuscript and the only person
who could read my writing.
Dr. Bermes, of the Clinical Laboratories of Loyola
University, and Dr. Inkpen, of the Bioscience laboratories,
for providing the laboratory tests, free of charge.
v

This study was made possible by a grant given by the
Research Fund of Loyola University.
I would like to extend a special thank you to the
following persons:
Dr. R. Goshgarian, my teacher, whose strive for
excellency was a constant motivation for me during the past
three years.
My friend, Dr. E. Dagalakis, who contributed
significantly in my decision for specializing in
Orthodontics.
My friend, Dr. E. Marinakis, for sharing with me the
educational experience of the last three years.
Professor H. Haralabakis, for his encouragement and
recommendation for furthuring my education.
vi

VITA
The author of this thesis, Stavros Papaconstantinou,
was born on January 18, 1953, in the village of Liopessi,
Greece, the son of Dimitrios and Anna.
In 1970, he graduated from the French High School
"Lycee Leonin" and the same year he entered the Dental
School of Athens University. In November, 1975, he received
his D.D.S.
From November, 1975 to June, 1978, he worked as
Honorary Assistant at the Orthodontic Department of Athens
University where the Chairman was Dr. H. Haralabakis.
Parallel to that, he worked for his Doctorate Degree at the
Department of Pathology of the Medical School of Athens
University under the supervision of Professor Dr.
Papacharalampous and Dr. Davaris. The subject of his
research was "Regeneration Capacity of Salivary Glands in
Rats". He hopes to defend this thesis after his return to
Greece. During that period of time, he presented a paper at
the Cypress Dental Meeting (1978) and published in Greek
Dental Journals, three papers.
In July, 1978, he enrolled for a two year
post-graduate course in the Orthodontic Program of Loyola
vii

University, and in the graduate school leading to a Masters
of Science in Oral Biology. In July 1980, he received his
specialty certificate. From July, 1980 to the present time,
he has been an Assistant Professor on the faculty of the
Orthodontic Department of Loyola University.
In October, 1980, he presented together with Dr. L.
Klapper and Dr. E. Marinakis, a course on Cephalometries for
Oral Surgeons.
viii

TABLE OF CONTENTS
Page
ACKNOWLEDGEMENTS......................................... v
VITA ..................................................... vii
L I s T 0 F TABLEs • • . . • • • • . • • • . • • • • . . • • • . • • . • • • • • • . • • . • • • • • . • X
LIST OF FIGURES.......................................... xi
CONTENT OF APPENDIX ••••••..•••..•••.•..•••••••••••.••••. xiii
Chapter
I. INTRODUCTION............................. 1
II. REVIEW OF RELATED LITERATURE............. 3
III. MATERIALS AND METHODS ••••..•..••••.••.... 30
IV. RESULTS.................................. 37
V. DISCUSSION ••..••...••••.......•..•..••••. 69
VI. SUMMARY AND CONCLUSION •...•.•.••••.••••.• 75
REFERENCES. . • • . • • • . . • • . . . • • . . • • • . . • • • . • • • • • • . • • • . • • • • • • • . 77
Appendix A.. . . . . . . . . . . . . . . . . • . . . . . . . . . . . . . . . . . . . . . . . . . . . 83
ix

LIST OF TABLES
Table Page
I. Tabulation of the sample according to their sex, age and grouped according to root condition ........ 41
II. Results of serum and urine analyses of control patients........................................... 42
III. Results of serum and urine analyses of root resorption patients. . . . . . . . . . . . . . . . . . . . . . . . . . . . . . . . 43
IV. Means, standard deviations, t values and significance for between group comparisons of each variable. . . . . . . . . . . . . . . . . . . . . . . . . . . . . . . . . . . 44
V. Probability of classification of the sample in two groups on the basis of biochemical tests according to S.A.S. discriminant analysis .......... 45
X

LIST OF FIGURES
Figure Page
1. Ranges of laboratory tests interconnected one with another in a vertical dimension ................. 36
2. Graphic representation of the results of the biochemical tests of the control patient F.D ......... 46
3. Graphic representation of the results of the biochemical tests of the control patient F.S ......... 47
4. Graphic representation of the results of the biochemical tests of the control patient L.D ......... 48
5. Graphic representation of the results of the biochemical tests of the control patient F.G ......... 49
6. Graphic representation of the results of the biochemical tests of the control patient H.M ......... 50
7. Graphic representation of the results of the biochemical tests of the control patient K.J......... 51
8. Graphic representation of the results of the biochemical tests of the root resorption patient W.R.......................................... 52
9. Graphic representation of the results of the biochemical tests of the root resorption patient M. R. . . . . . . . . . . . . . . . . . . . . . . . . . . . . . . . . . . . . . . . . . 53
10. Graphic representation of the results of the biochemical tests of the root resorption patient S.K.......................................... 54
11. Graphic representation of the results of the biochemical tests of the root resorption patient V.L.......................................... S"i
xi

12. Graphic representation of the results of the biochemical tests of the root resorption patient M. M.......................................... 56
13. Graphic representation of the results of the biochemical tests of the root resorption patient D.M.......................................... 57
14. Histogram of the classification of the sample in two groups by the S.P.S.S. direct discriminant analysis............................................. 58
15. Histogram of the classification of the sample in two groups by the S.P.S.S. step-wise discriminant analysis. Step 1. . . . . . . . . . . . . . . . . . . . . . . . . . . . . . . . . . . . 59
16. Histogram of the classification of the sample in two groups by the S.P.S.S. step-wise discriminant analysis. Step 2 .••...••....•• .- ....•..•..•..•.•....• 60
17. Histogram of the classification of the sample in two groups by the S.P.S.S. step-wise discriminant analysis. Step 3.. . . . . . . . . . . . . . . . . . . . . . . . . . . . . . . . . . . 61
18. Histogram of the classification of the sample in two groups by the S.P.S.S. step-wise discriminant analysis. Step 4. . . . . . . . . . . . . . . . . . . . . . . . . . . . . . . . . . . . 62
19. Histogram of the classification of the sample in two groups by the S.P.S.S. step-wise discriminant analysis. Step 5. . . . . . . . . . . . . . . . . . . . . . . . . . . . . . . . . . . . 63
20. Histogram of the classification of the sample in two groups by the S.P.S.S. step-wise discriminant analysis. Step 6.. . . . . . . . . . . . . . . . . . . . . . . . . . . . . . . . . . . 64
21. Histogram of the classification of the sample in two groups by the S.P.S.S. step-wise discriminant analysis. Step 7. . . . . . . . . . . . . . . . . . . . . . . . . . . . . . . . . . . . 65
22. Histogram of the classification of the sample in two groups by the S.P.S.S. step-wise discriminant analysis. Step 8.. . . . . . . . . . . . . . . . . . . . . . . . . . . . . . . . . . . 66
23. Histogram of the classification of the sample in two groups by the S.P.S.S. step-wise discriminant analysis. Step 9. . . . . . . . . . . . . . . . . . . . . . . . . . . . . . . . . . . . ~7
24. Histogram of the classification of the sample in two groups by the S.P.S.S. step-wise discriminant analysis. Step 10................................... 68
xii

Appendix
A
CONTENTS FOR APPENDIX
Copy of consent form which patients were requested to sign, prior to
Page
participation in this study .............. 83
xiii

CHAPTER I
INTRODUCTION
Ketcham in 1927, reported a high incidence of root
resorption among his patients. The orthodontic profession
reacted with great concern. Numerous studies have been
performed since then, some of them attempting to elucidate
the mechanism by which root resorption takes place and some
of them striving to clarify the precise etiology.
The understanding of the problem today indicates
that orthodontic mechanics are capable of inducing root
resorption, particularly when excessive forces are used.
The mechanism by which root resorption occurs is quite
clear, at the present time. However, the severe generalized
incidence of root resorption, which appears in about 10% of
orthodontic patients, possesses no definite explanation, and
most clinicians "observe these changes, and in silence,
blame themselves and their mechanics" as Becks wrote, in
1936. Becks inferred then that the susceptibility to root
resorption is controlled by many coexisting factors. T~e
research on the topic indicates that there should be some
relationship between idiopathic root resorption and
1

metabolic and nutritional factors. Nevertheless, that
relationship has not yet been definitely shown, and
controversy still prevails.
2
The present investigation will seek to demonstrate
how healthy individuals undergoing orthodontic treatment can
be distinguished, one from another as a function of the
presence or absence of moderate to severe, generalized root
resorption. The basis of characterization are measured
values of various parameters of calcium and phosphorus
metabolism and of certain parameters of the hormonal status,
taken individually and collectively for each subject.
The results, seen in this study, if positive, might
form a ground upon which a prediction test of susceptibility
among orthodontic patients, in regard to root resorption,
may be based. This test could be used by clinicians in order
to view the problem prospectively, instead of
retrospectively.

CHAPTER II
REVIEW OF LITERATURE
The first reports regarding the resorption of the
roots of permanent teeth, as sited by Ketcham 23 , were made
by Bates in 1856, Chase in 1875, Harding 1878, and the first
study concerning apical root resorption with orthodontic
procedures was reported in the literature by Ottolengui in
1914. However, it was not until the reports on apical root
resorption presented by Ketcham in 1927 23 , 24 followed by a
subsequent report in 1929, 25 that the orthodontic
profession reacted with great concern. Ketcham reported
that, excluding gross pathological causes, only 1% of 1037
normal individuals x-rayed showed root resorption. This
finding is in accordance with the results of Hemley, 16 and
similar to the observations of Rudolph 55 , who reported a
5% incident of root resorption, perhaps because the gross
pathologic causes were not ruled out from his sample.
For patients who underwent orthodontic treatment,
the percentages of root resorption were completely
different. Ketcham's final report 25 covered over 385
cases treated by himself and other orthodontic specialists
3

4
in their private practices. He found that 21% of these
cases showed root resorption after treatment. At that time
Ketcham stated,"apical root loss was so startling, so potent
in danger to the orthodontic patient, so prolific of
recrimination to the orthodontist himself", that he "made
bold" to present his findings to the orthodontic world.
Ketcham•s 23 dramatic evaluations acted as a catalyst,
challenging every orthodontist to review his own experiences.
Becks 3 (1936) found that 20% of orthodontic cases
treated at the University of California showed root
resorption. Hemley 16 , 17 , studying 165 treated cases at
the New York University, found 21.5% revealing root
resorption. These investigators showed remarkable unanimity
in their studies. However, Rudolf of the University of
Minnesota reported on the work done at the undergraduate
clinic and published 55 , 56 these amazing results: "At the
end of the first year of treatment, 49% of the 439 patients
showed root resorption; and at the end of the two years of
treatment, 75% of the remaining 277 patients demonstrated "il)
root resorption." In a subseauent study Rudolf~ reported
that the longer the treatment was and the older the patient,
the higher the incidence of root resorption .
In 1951, Henry and Weinman 18 performed a
histologic study of the morphologic and physiologic
characteristics of the cementum in terms of number, size,
distribution and types of resorption areas in the permanent
5
teeth of 15 cadavers. Their findings disclosed that over
90% of the teeth showed evidence of root resorption. The
resorption areas were observed more often in the apical
third of the roots (76.8%), than in the middle (19%), or
gingival third (4%). There were also more instances of
resorption on the mesial and buccal surface, which indicated
that resorption occured more readily upon surfaces which are
facing toward the direction of physiologic drift. Age,
according to Henry and Weinman was a contributing factor in
the causation of resorption.
Massler and Malone 36 in 1954, studied 708 sets of
x-rays of complete dentitions of normal individuals 12 to 49
years of age and compared them to 81 sets of x-rays of
patients 12 to 19 years of age which had undergone
orthodontic treatment. It was found that over 80% of the
untreated group exhibited root resorption, while in the
orthodontic group that number increased to 93.3%. However,
the frequency of moderate degrees of root resorption rose
from 9.2% in the untreated group to 31.4% in the treated
group. The frequency of severe root resorption rose from
0.3% to 10.8% and of the very severe resorption, from .11%
to 3.4%. The percentage of teeth which exhibited slight
root resorption decreased from 71% to 54.7%.
Concerning the frequency and susceptibility of
different teeth to root resorption after orthodontic
treatment, there seem to be few disagreements in

6
epidemiologic studies. 3 ,l 7 , 36 Overall, there is an
agreement that the most susceptible teeth to root resorption
are the upper and lower incisors, followed by the upper
first molars, upper first and second premolars and canines,
while the lower canines, lower first and second premolarsand
first molars show less susceptibility. There is also
evidence 17 supporting the similarity in the order of
susceptibility between the treated and untreated
populations; the only difference is the severity of root
resorption displayed.
Sex was found not to be a variable related to root
resorption 16 , 44 . There seems to be some controversy
concerning the influence of the age of the patients which
underwent orthodontic treatment as well as the length of the
treatment. Rudolf 55 , 56 found a significant increase of
root resorption in older patients and high correlation
between root resorption and length of treatment. On the
other hand, Phillips 44 did not find any relationship
between root resorption and age of patients or length of
treatment. Phillips also refuted the observation of
Hemley 16 according to which root resorption is related to
the amount of movement of the apices of the teeth.
Thus, from these epidiomiologic studies, concerning
root resorption it is well
establishedlO,l 6,l 7 , 24 , 25 , 36 , 44 , 55 , 56 that the orthodontic
treatment can significantly increase both the severity and

7
the number of teeth which exhibit this defect.
Numerous studies have attempted to elucidate the
mechanism by which root resorption occurs and account for
changes in supporting structures of the teeth as they relate
to orthodontic tooth movements. Present knowledge on that
subject is based on experiments on dogs (Sandstedt 1904-05,
Gotlieb and Orban 1931, Schwartz 1931, Reitan and Skiellen
1940), on monkeys (Oppenheim 1911, 1933, 1934, 1935, 1936,
1944, Johnson et al 1926, Marshall 1932), on rats, Waldo
1953, Waldo and Rothblatt 1954, Macapanpan et al 1954, Zaki
and Van Heysen 1963, Crumley 1964, Kvam 1967, 1972 Azuma
1970, Baumrind and Buck 1970, Rygh and Selvig 1973, Rygh
1972, 1974, 1977 and on human (Herzberg 1932, Reitan 1951,
1971, 1974, Boyde and Lester 1967, Kvam 1972, Rygh 1973,
19 77) .
Sandstedt 61 , 62 was the first to experiment on
animals in order to study the mechanism of tooth movement,
in 1904 and 1905. Using heavy intermittent forces produced
by screws, activated daily, he retracted the anterior teeth
of adult dogs. Microscopic observation of the teeth and
supporting structures revealed the development of a cell
free zone in the periodontal ligament of the teeth at the
pressure sites. Sandstedt called these zones the
"hyalinization process".
Generally, the term hyaline degeneration refers to a
regressive cellular change in which the cytoplasm of the

cells takes on a homogenous, glossy eosinophilic
appearance. Although pathologists have objected to the
excessive use of the word "hyaline" to describe the
histologic appearance of a wide variety of unrelated
circumstances, the term hyalinization of the periodontal
ligament is used in the current literature. It describes
the cell free area of the periodontal ligament (P.D.L.)
which develops when an excessive force is applied on a
tooth. The area acquires a glassy like appearance in
hematoxylin and eosin stained histologic sections. 53
Sandstedt also described the undermining resorption
i.e. a resorption starting from the marrow spaces around a
compressed and hyalinized area of the P.D.L.
Johnson, et a1, 22 in 1926 induced labial movement
8
of juvenile monkey central incisors with partially formed
roots. They described a fulcrum of rotation to exist
somewhere in the root of the incisors, causing lingual
movement of the apices. This apical section was deformed in
comparison to the control side, leaving the tip in its
neutral position. They also described a resorption area in
the section of the root, where deformation had taken place.
During this period, Ketcham reported on a
radiographic investigation 23 , 24 , 25 of root resorption
among human subjects. His findings revealed that patients
treated with lingual appliances with finger springs attached
to them, exhibited less root resorption, than the patients

9
treated with the "pin and ligature appliance". This finding
caused discordance between clinicians and investigators,
since the first was considered to deliver light continous
forces while the latter intermittent forces.
Schwartz in 1931 and 193264 , 65 stated that
intermittent forces are dangerous since they produce the
phenomenon of "jiggling". This jiggling, which means a
repeated change in the direction and in the amount of
pressure applied within a short period of time is thought
responsible for extensive root resorption. According to
Schwartz , the most favorable treatment was that in which
forces were continuous and did not exceed the pressure of
the blood capillaries. This pressure in men, as well as in
most mammals, is 15-20 mm. Hg., and corresponds
approximately to 20-26 gr. per 1 cm2 of root surface.
This pressure is so intensive, that a continuous, rather
aggressive resorption takes place in the alveolar bone at
the pressure site.
Gottlieb's findings 14 from his experiments in dogs
support Schwartz's hypothesis. After creating a traumatic
occlusion, he found formation of osteoid tissue at the
pressure site of the P.D.L. This finding led him to the
conclusion that interruption in the application of forces
should be avoided during orthodontic treatment, because each
interuption caused the formation of a new alveolar wall at
the pressure site by deposition of newly uncalcified bone

10
(osteoid). He verified that osteoid tissue is more
resistant to resorption than the "old" calcified bone, and
therefore, if a force is applied again, resorption may
attack the tooth surface more easily. Gottlied demonstrated
that the teeth of young animals in comparison to adult
animals, exhibited considerable resistance to root
resorption.
Herzberg 19 in 1932 was the first to study human
subjects. He moved orthodontically the first premolar of a
patient and then extracted it together with its surrounding
supporting tissue in order to study histologically the
changes that occurred. He reported that the reaction of the
human alveolar bone was quite similar to that of
experimental animals.
One person who contributed significantly to our
knowledge and understanding on tooth movement was Albin
Oppenheim, an outstanding clinician and investigator. He
performed numerous experiments on dogs, 38
monkeys 39 , 40 , 41 , 43 and humans 42 .
Experimenting on young monkeys 39 , 40 , 41 Oppenheim
found that when a strong force was used to move a tooth,
tipping of the apex towards the opposite direction would
occur. The blood vessels and nerves entering the apical
foramen appeared to be distorted; a reaction of the bone was
lacking, while there appeared numerous resorptions of the
cementum. By experimenting with gentle intermittent forces,

11
he observed comparatively quick recovery of the P.D.L., due
to a rapid re-establishment of blood supply from the
application of pressure extending over a short period of
time. Even if the force was occasionally somewhat stronger,
it soon regained its ability to react biologically, to form
osteoclasts and to resorb bone. In addition, the cementum
quickly regained, through its rapidly re-established normal
blood supply, its orginal resistance against resorption.
Oppenheim stated that continuous forces can lead to a
compression of the blood vessels and anemia of the P.D.L.
more easily than can intermittent forces. This anemia
reduces the vitality of the P.D.L. and creates a situation
which is responsible, on one hand, for the lack of proper
bone reactions, and on the other, for the development of
root resorption. He realistically stated, "orthodontic
procedures, no matter the kind of forces used, are a
violence to nature. We must try to do only the least amount
of damage, for we cannot, by any means, avoid or evade some
damage". Studying human premolars in histologic sections
after being moved orthodontically with light intermittent
forces, 42 Oppenheim observed an abundance of large vessels
and capillaries close to cementum resorptions at the
pressure sites of the P.D.L .. According to his description,
these vascular changes suggested an angioma-like formation.
His explanation depicts this formation as a protective
measure of nature, a sort of cushion, which interposed

12
between the tooth and alveolar wall and which protects the
structures from increased pressure. While studying the
angioma-like formation, he observed that the endothelial
cells of the capillaries were lying very close to resorption
lacunae, on the cementum and on the alveolar wall. He
concluded that the endothelial cells of capillaries can
exercise osteoclastic or cementoclastic activity, working to
relieve pressure by gaining space. During this process,
osteoblasts could not be identified.
In a subsequent study 43 Oppenheim observed the
reaction of osteocytes to different degrees of force and
described three types of osteoclasts, the primary, secondary
and tertiary. This classification was based on the place
that they would appear, which would be determined by the
intensity of the force applied. Using light forces, he
described compression of the P.D.L. on one side and the
presence of "primary" osteoclasts resorbing the alveolar
wall, while the osteocytes were intact. On the tension
side, there was apposition of osteoid tissue in uniform
layers. Using heavier forces, he found hemorrhagic sites on
the pressure side, hyalinized areas, and "primary"
osteoclasts around the hyalinized areas. The osteocytes
showed signs of degeneration, and "secondary" osteoclasts
appeared in the bone marrow, causing undermining
resorption. On the tension side, many periodontal fibers
were disrupted, some vessels were torn, hemorrhages were

13
formed, and osteoid tissue was deposited in such a manner as
to form spicules. Using heavy forces, he described complete
hyalinization of the P.D.L. and disappearance of the
osteocytes on the pressure side. Numerous osteoclasts were
present in the bone marrow, resorbing the bone, which he
considered to be dead after the disappearance of the
osteocytes. On the tension side, most of the periodontal
fibers were ruptured, and hemorrhages were found
throughout. There was a trace of osteoid tissue formation,
while numerous tertiary osteoclasts were observed on the
tension side.
Reitan 48 discribed two zones of proliferating
cells on the tension side. The first was located parallel
to the root and close to the alveolar wall. The other zone
was located adjacent to the root. Mitotic cell division was
observed more often in the zone adjacent to the bone.
Concerning the pressure side, Reitan was the first to state
that there was great similarity between the nuclei of
surrounding fibroblasts and individual nuclei of the
osteoclasts. That observation was of prime importance,
since it was later verified that one type of multinucleate
osteoblast derived from fusion of undifferentiated
mesenchymal cells 60 .
In the early 1950's, several researchers 31 , 54 , 74 , 75
attempted to develop a new experimental model that would
allow study of tissue response to tooth movement in both

14
qualitative and quantitive ways. That experimental animal
was the rat, which being versatile for its size and
relatively cheap, allowed investigators to use a larger
number of experimental animals. The most important
advantage was that genetic and metabolic variations could be
overcome by using animals from previously developed pure
strains 74 . Tooth movement was usually induced by placing a
rubber band, or a piece of rubber dam between the upper
first and second molars. Using this type of experimental
model, Waldo and Rothbladt 73 found that the tissue
response to orthodontic tooth movement was similar to that
found in other animals. They found inital compression of
the P.D.L., followed by hyalinization and undermining
resorption which was obvious three days after the
application of the force. Small areas of root resorption
were observed in the teeth of the animals in which the
stress of the rubber band was allowed to act from five to
seven days. Accompanying this root resorption was usually
an area of hemorrhage and crushing of the periodontal
fibers, suggesting, according to the investigators, that
such resorption of cementum may result from excessive
stress, even in perfectly normal animals. Another
interesting finding was the histologic evidence of reaction
to applied stress, as a result of occlusal adjustment, in
the lower quadrant corresponding to the experimental side. ~4
In a subsequent study/ Waldo and Rothblatt found

that hypophysectomized animals as well as rats on lysine-
deficient diets exhibited extremely high osteoclastic and
cementoclastic activity, and mechanical stress seemed to
produce extreme loss of bone.
Macapanpan et a1, 31 in 1954, were the first to
attempt to quantify the tissue reaction following tooth
movement by measuring the mitotic activity of the
fibroblasts of the P.D.L. There findings showed that the
mitotic activity among the fibroblasts of the P.D.L. in the
experimentally induced tension area was three to four times
higher than that on the control side, and that periods of
maximal mitotic activity followed periods of maximum
15
displacement of teeth after 15 to 18 hour intervals. It was
concluded that not only osteoblasts and osteoclasts but also
fibroblasts play an important role in the repair following
tooth movement. It was speculated that the increased
mitotic activity of the fibroblasts was part of the process
by which the fiber bundles of the widened periodontal spaces
are repaired and re-adapted to the altered interface between
tooth and bone. Fibroblasts are capable of synthesizing and hq
degrading collagen ·.
On the pressure side, Zaki 77 found that where
hyalinization occured, hyperplastic mesenchymal tissues
entered and reorganized the non-vital tissue. This
mesenchymal tissue approached the hyalinized areas from
different directions: from the normal P.D.L., apical and

16
marginal to the hyalinized area and through the medullary
alveolar margin bone spaces opening into the P.D.L. This
proliferating young connective tissue can, and often does,
resorb the cementum of the root surface as well as the
alveolar bone margin in the vicinity of the hyalinized P.D.L.
Baumrind 1 in 1970 using radioisotopes tried to
quantify the metabolic activity of the cells of the P.D.L.
after inducing tooth movement. It was found that, on the
pressure side, cell replication rates increased at
statistically significant levels instead of displaying the
predicted decline in activity. On the tension side, cell
replication increased as predicted. General metabolic
activity appeared to increase but collagen synthesis
decreased, both being displayed in the tension and pressure
sides concomitently. This latter finding can be explained
as an initial drop in collagen production below a rather
high base line 9 since it is accepted as fact 9 ' 4 ' 6 that
the turnover of the collagen in the P.D.L. is high.
Several electron microscopy studies during the last
decade 26 , 27 , 28 , 57 , 58 , 59 , 60 on tissue changes following
tooth movement have given us a more accurate portrayal of
the situation.
The principal findings of those studies indicate
that, after application of force, initial dilation of blood
vessels and packing of erythrocytes developed, while
platelets and floccular material interspersed between the

cellular elements. The vessel walls appeared to be intact,
at this stage, and, although the erythrocytes had been
pressed against each other, an open lumen in these vessels
remained 58 . During the next stage, part of the
endothelial walls had disappeared along with the basement
lamina thus allowing communication between the lumen of the
blood vessels and the perivascular space 58 .
17
Crystalization of the erythrocytes developed in the P.D.L.
indicating a local degradation of the erythrocytes as a
result of pressure and hemostasis 59 . Cementoblasts,
fibroblasts, and osteoblasts showed no difference in
cellular reaction to the orthodontic force 57 and they all
exhibited various stages of disintegration, characterized by
intracellular swelling, advanced dilation of the endoplasmic
reticulum, moderate swelling of the mitochodria, rupture of
the cell membrane followed by separation of the nucleus from
the cytoplasm and decomposition of the nucleus 57 . This
process indicated that cell death occurs in the cytoplasm,
while the nucleus disintegrated later. Furthermore, it
demonstrated that the previous assumption which held that
the death of a cell is more prominent in the nucleus then in
the cytoplasm, due to the appearance of a pycnotic nucleus,
was not correct. This process would proceed until complete
hyalinization of the P.D.L. at the pressure sites had
occurred. Multinuclear large cells appeared then near the
cementum surface at some distance from the hyalinized

tissues. These cells resorb tooth substance. The
resorption of the cementum appeared under the E.M. as a
resorption from the rear 60 . Once the cementum is
resorbed, there is an indication that the resorption
continues in the dentin at a greater rate. In other words,
the cementum acts as a barrier so that resorption of the
entire root of the tooth does not take place. The P.D.L.
adjacent to the cementum being resorbed from the rear, was
rich in blood vessels and cells 60 . Hyalinized structures
disappeared concommitantly with an invasion of cells and
blood vessels from the neighboring P.D.L.
18
These finding are common both in animal and human
material 27 , 28 , 52 and indicate that the formation of
hyalinized zones on the P.D.L. due to force application lead
to root resorption which occurs during the invasion of new
cells from the healthy periodontium and the bone marrow.
It might be concluded that the mechanism by which
root resorption occurs is presently clear. However, the
sited literature does not contribute substantially to our
knowledge as to why individuals respond to orthodontic
treatment with varying amounts of root resorption.
The cementum can be considered a tissue having
similar morphologic characteristics to bone based on the
following facts. It is produced by cementoblasts cells very
similar to the osteoblasts and it is calcified the same way
bone is and is resorbed by large multinucleate cells which

first remove minerals and then the organic matrix.
Never-the-less it has some differences from bone and one
should to be aware of these differences in order to
19
understand why cementum is much more resistant to resorption
and why resorption can occur to cementum.
Most likely the reasons why cementum is more
resistant to resorption than bone, are: 1) Cementum has a
higher content of fluoride then bone, 2) Bony tissue has an
ample blood supply, whereas cementum is completely void of
vascular tissue, 3) The cementum is surrounded by older,
more mature collagen, which is more resistant to the actual
chemical changes than bone, 12 and 4) The cementum is
covered by a layer of unmineralized precementum, called the
cementoid, which like the osteoid, is considered as a
resorption resistant coating. 14 , 52
It is reasonable to consider that variations of the
above factors can greatly influence the resistance of
cementum to resorption, particularly when a local stimuli
changes the equilibrium of the P.D.L.
Since cementum is considered to be very closely
related to bone, it would be logical to speculate that the
mechanisms which induce cellular activity in order to form
or resorb bone would influence the latter in forming or
resorbing cementum.
Many observations have shown that bone is formed
from cells that proliferate from the vascular endothelium of

20
thin-walled sinusoid vessels 70 , 71 . Cells that form these
vessels are often called osteogenic precursor cells and they
are the same as those which some authors refer to as
undeferentiated mesenchymal cells. A variety of factors
operate to influence the proliferation of these cells, some
of which are common to all connective tissue cells and some
specific for bone.
Common to all these cells is the need for an
adequate supply of energy before cell division can take
place. 6 Since energy production is brought about by means
of oxidation of certain celluler high energy products, a
plentiful supply of oxygen is needed for cell proliferation
and activity.
In the P.D.L. the undeferentiated mesenchymal cells,
become osteoblasts, which lay down the bone matrix. If a
decreased oxygen supply occurs, the amount of osteoid matrix
produced decreases, or ceases altogether. Equally important
for cell division is the local concentration of carbon
dioxide. Too high or too low concentrations of carbon
dioxide inhibit cell proliferation. Since local
concentrations of oxygen and carbon dioxide are partly
regulated by the rate of blood flow, the latter should be an
important practical consideration.
Another regulating mechanism for cell division and
intercellular matrix production is the balance of anabolic
and catabolic hormones. 29

There are two types of osteoclasts described. Both
types are multinucleated cells, and secrete enzymes that
hydrolyze and degrade bone tissue, and thus, are able to
resorb bone.
One type of osteoclast is formed by the coalescence
of undeferentiated mesenchymal cells in the presence of
excess cortisol or corticosteroids. 30 Osteoclasts formed
in this manner, although showing considerable cytoplasmic
activity, remain in one place, still being attached to
neighboring cells.
21
The second type of osteoclast is freely-moving, and
is formed from macrophages. These cells are formed in the
bone marrow and have phagocytic capability. Before the
macrophages can coalesce, the cells enlarge. This is
prevented by cortisol or corticosteroids 11 so that these
catabolic agents inhibit the production of the freely-moving
osteoclast. The presence of parathyroid hormone is required
before macrophages can coalesce to form osteoclasts. 7
With an excessive amount of parathyroid hormone present,
these osteoclasts display a correspondingly exuberant
activity. The presence of thyroid hormones seems to be
necessary for parathyroid hormone activity. 29
When the rate of flow of the blood diminishes, as on
the pressure side of the P.O.L., the available oxygen is
decreased and at the same time, the rate of removal of
carbon dioxide is decreased. With a diminished blood flow,

therefore, fewer osteoblasts and less osseous tissue are
formed and, at the same time, the osteoclasts which are
formed from the undifferentiated mesenchymal cells are also
reduced in number. However, it has been demonstrated 29
that as the rate of flow of blood through bone is reduced,
22
macrophages increase in size and coalesce to form phagocytic
osteoclasts. This mode of osteoclastic activity and bone
removal is therefore enhanced.
The different hormones regulate bone metabolism in
order to maintain a constant level of extracellular
calcium. 46 , 76 Calcium is an important substance and is
required: 1) as calcium phosphate and calcium carbonate in
order to form the principal chemical constituents of bone,
cementum and enamel, 2) for the coagulation of blood
(clotting formation), and 3) for the regulation of neural
function by keeping the excitability of nerve endings at a
normal level.
It is believed 46 that the maintenance of a
constant extracellular calcium concentration depends mainly
on the dual reciprocal control of bone resorption by
parathyroid hormone (PTH) and calcitonin (CT). Other
important factors controling calcium homeostasis and bone
resorption are: the level of extracellularphosphorus
(P04 ), the presence of vitamin D, the thyroid hormones 7 (T 3 , T4 ), and the corticosteroids, while some
secondary factors are: sucrose, fatty acids, heparin, serum

proteins, male and female hormones, etc. 46
The PTH has both a regulatory and a permissive role
in bone resorption. The overall resorption rate is
maintained by continuous secretion of PTH, which can be
increased or decreased in response to calcium
concentration. 7 , 46 The hormone must also be present for
changes in bone resorption to occur locally in response to
immobilization. 7 The PTH raises the calcium blood level
by causing osteoclastic resorption of bone, and by
increasing the excretion of P04 from the kidneys causing
inhibition of reabsorption of P04 from the tubules and by
inhibiting calcification of newly formed bone.
Two types of hyperparathyroidism are distinguished.
23
The primary hyperparathyroidism is usually caused by a tumor
of the parathyroid gland and the secondary, which can be
caused by calcium deficient diets, vitamin D deficiency and
kidney insufficiency.
Experimentally, it was reported 46 that repeated
injections of phosphates can lead to one type of secondary
hyperparathyroidism, as the organism tries to increase the
excretion of phosphates through the kidneys.
Weinman and Sicher76 stated that latent
hyperparathroidism which is developed through moderate renal
insufficiency, causes sometimes localized and minute bone
changes in areas which have suffered a mechanical or
infectious injury. They hypothesized that these localized

changes were the response of the sensitized skeleton to a
localized injury.
Vitamin 0 deficiency primarily causes the reduction
of absorption of calcium and secondarily of the P04 , from
the intestinal tract. 76 This function occurs because
calcium in the gastrointestinal lumen combines with the
24
P04 to form insoluble ca 3 (P04 ) 2 . This results in a
secondary hyperparathyroidism in order to maintain the blood
level of calcium normal. The P04 deficiency is increased
by the hyperactivity of the parathyroids.
Vitamin 0 is found to be permissive for P.T.H.
stimulated bone resorption. 46 They are considered to be
physiologic synergists that act not at the same receptor
site in bone-resorbing cells, but at separate sites linked
so that the effects of one can enhance the response of the
other. When lack of vitamin 0 occurs, experimental animals
become unresponsive to all but extraordinarily large doses
of PTH, while large doses of vitamin 0 has hypercalcemic
effects. 4
Calcitonin together with the P04 blood
concentration are considered to be the two physiologic
inhibitors for bone resorption. These factors work
. t• 11 20 synerg1s 1ca y. Calcitonin mainly causes inhibition of
mineral resorption in vivo, while P04 concentration
primerily causes inhibition of matrix resorption by
increasing the deposition of mineral on collagen and

therefore blocking its resorption. Another way by which
P04 can inhibit bone resorption, is by enhancing increased
deposition of calcium minerals on bone surfaces which are
less mineralized. 13 In contrast to the parathyroid
hormone which causes bone resorption along with release of
calcium by stimulating collagenolytic and proteolytic
enzymatic activity, the calcitonin and P04 block calcium
release without inhibiting enzyme release. 73 This
indicates that while PTH acts directly on the cells, the CT
does not do so.
Thyroid hormones regulate calcium homeostasis by
controlling the renal secretion of calcium and phosphates.
Consequently, the changes in bones are expected to be a
response to depletion of calcium. Reduced bone apposition
and increased bone resorption in cases of hyperthyroidism
are to be understood as an attempt of the organism to
mobilize enough calcium and P04 to compensate for the
increase loss of these elements. 76 In addition to that,
25
thyroid hormones seem to be necessary so that PTH can act on
the cells. 28
The complicated interplay of hormones, which can be
influenced by local or generalized factors (primary
endocrine malfunction, diet, renal insufficiency,
gastointestinal problems, etc.), influences the cellular
activity in forming or resorbing bone. Based on the
similarity ofcementum and bone, it has been

assumed2,3,32,33,34,45,66 that these factors should
influence the resorption of the cementum.
26
Orthodontists have speculated for a number of years
about hormonal and dietetic influences on root resorption
and several researchers have attemmpted to study these
relationships. Marshall (1931, 32,33,34) 32 ,33 , 34 , 35
experimenting on monkeys, concluded that independent of the
type of appliance used, "absorption" on either the lateral
or apical aspect of the root occurred under conditions where
unusual force was applied. This process seemed to develop
more rapidly and procede farther when the diets of the
experimental animals were deficient in ingredients
containing vitamin A. Furthermore, when experimental
animals were maintained on diets adequate in protein,
vitamins, mineral salts, fats and carbohydrates, new tissue
was always found in the areas where slight absorption had
previously occured, thus restoring the original contour.
Becks and Weber, in 1931, 2 reported that diets
with normal salt mixtures, as well as those with low calcium
salt mixture, both being devoid of cod liver oil (vitamin D)
given to a series of twenty-five dogs for a period of seven
to twelve months, led to atrophic and dystrophic bone
changes of the active skeleton. These changes were
accompanied by marked root resorption.
In a subsequent study, in 1936, 3 Becks examined
100 patients who exhibited root resorption. Half of them

had undergone orthodontic treatment previously. Based on a
complete physical examination, urinalysis, differential
blood count, dietary survey, clinical and roentgenographic
examination of the teeth and jaws, determination of basal
metabolic rate and determination of the serum and saliva
calcium and P04 , it was reported that 60% of the
orthodontic group and 40% of the non-orthodontic group
exhibited a definite hypothyroidism. Hypothyroidism
together with other endocrinopathies accounted for another
20% in the orthodontic group and 26% in the non-orthodontic
group. Hyperpituitarism was also noted in his study and
correlated with root resorption as well as intestinal
problems, the latter causing disturbances in mineral
metabolism and therefore leading to pathologic bone
formation.
27
In 1951, Tager68 searched for medical evidences of
endocrine and metabolic disease in 100 children, presenting
special orthodontic problems, among them, root resorption.
Basal metabolic rate, calcium and P04 serum concentration,
sugar tolerance, protein bound iodine (P.B.I.) and serum
cholesterol were measured. It was concluded that only 10%
of the children revealed a "frank endocrinopathy". One case
presented hypopituitarism and the remainder of the 10 cases
were hypothyroid. The greatest proportion of these cases
revealed neither specific endocrine disease nor congential
anomalies. What did appear significant was evidence that

28
certain types of orthodontic defects, more specifically root
resorption and architectural abnormalities of the bone,
repeated themselves in a particular type of accelerated
growth pattern connected with puberty. This observation led
Tager to the notion of a "relative metabolic insufficiency",
meaning insufficiency of a hormone or nutrients in the bone,
not in an absolute sense, but insufficient in respect for
the greater demands made by the accelerated growth pattern.
Pinsker in 1962, 45 studied the influence of
hydrocortisone on the development of root resorption on
monkeys. His finding was that in the hypercorticosteroid
group, some of the animals exhibited mild root resorption.
Finally, Newman in 1975, 37 attempted to screen 47
orthodontic patients exhibiting moderate to severe root
resorption on a minimum of three teeth, from the genetic
endocrine and nutritional aspect. His conclusions
concerning the genetic aspect was, that no definite
relationship could be drawn, and the metabolic aspect was,
not at all related to root resorption.
In the sited literature, there are indications that
a probable relationship between metabolism and root
resorption, particularly in patients which exhibit tendency
towards generalized root resorption should exist.
Unfortunately, the research findings, to date, have not been
able to demonstrate that relationship in a convincing
manner. Therefore, additional research in the field is

needed in order to clearly demonstrate the relationship
between hormonal function, metabolic status and root
resorption.
29

CHAPTER III
MATERIALS AND METHODS
The subjects in this study consisted of 12
individuals, six of whom were undergoing root resorption
with the other six as control. The sample was selected from
the patients of the Orthodontic Department of Loyola
University, who were under active orthodontic treatment. Of
the patients undergoing root resorption, three were male and
three female, while of the control patients, four were male
and the rest female. All subjects appeared to be healthy
with essentially negative medical histories.
Three criteria for the selection of patients who
displayed root resorption were used: (1) The first was the
amount and degree of root resorption presented. All
patients had to exhibit roentgenographic evidence of
moderate to severe root shortening of the incisors, premolar
and canines in both upper and lower arch. A tooth was
considered "severely" shortened if the root loss was greater
than, or equal to, one third of the normal root length. A
"moderately" shortened root was designated if more than 2
mm., but less than one third, of the root was resorbed. In
30

31
order to evaluate the amount of root resorption exhibited,
recently exposed intraoral or panoramic radiographs were
reviewed from more than 500 patients who were currently
under orthodontic treatment. These radiographs were
compared to the ones taken prior to treatment and
determinations were made concerning the conditions of the
roots. These x-rays had been taken routinely from all
patients as a method of monitoring the progress of their
treatment. (2) The second was the age of the patients. The
patients selected were between 17 and 22 years of age in
order to secure a homogenous population in regard to their
metabolic status. (3) The third was the length of
treatment. One principal criterion of selection was that
patients exhibiting root resorption had to be in treatment
for less than 18 months. The control patients could be in
treatment for a longer time. Thus, it was attempted to
exclude patients whose root resorption could be readily
attributed to excessive and prolonged trauma of the
supporting tissues of the dentition. Sex was not considered
as a necessary criterion of case selection. Consent forms
were signed by each patient.
Blood specimens were drawn pre-prandially before
10:00 a.m. by venal puncture in non-heparinized vacu-tubes.
Approximately 15 ml. of blood was drawn and the serum was
immediately separated by centrifusion. Half of the serum
obtained was used for routine determination in SMAC, to

determine the levels of: (1) serum calcium (Ca), (2) serum
phosphorus (P04 ), (3) alkaline phosphatase, (4) serum
creatinine. The remaining portion of the serum was frozen
to be used later for the determination of certain hormones.
Using the double antibody radio-immuno assay method the
following assays were carried out; (1) triiodothyronine
(T 3 ), (2) tetraiodothyronine (T 4 ), (3) cortisol, (4)
parathyroid hormone (PTH),and (5) calcitonin (CT).
In addition, the patients were asked to collect
32
total volume urine samples over two separate 24 hour periods.
Special containers were furnished. These urine samples were
used for the determination of the 24 hour output of: (1)
calcium ( Ca) , ( 2) phosphorus (P04 ) and ( 3) creatinine.
Collectively for every patient, the following
clinical values were obtained:
1. serum Ca level,
2. serum P04 level,
3. 24 hour urine Ca,
4. 24 hour urine P04 ,
5 . tubular resorption of P04 ,
6. blood level of alkaline phospatese,
7. blood level of T3,
8 . blood leve 1 of T4,
9. blood level of cortisol,
10. blood level of PTH,
11. blood level of calcitonin.

The tubular resorption of P04 was determined using
the following mathematical formula:
TRP = 100 (1- urine P04 x serum creatinine serum P04 x urine creatinine
The T.R.P. value reveals the percentage of filtered
phosphate that is reabsorbed by the renal tubules. The
33
value is used as an aid for the determination of parathyroid
and renal function.
The blood level of alkaline phosphatase was observed
because it relates to the metabolic status of bones.
Alkaline phosphatase plays an important role in bone
formation, and it increases in ricketts, bone atrophy,
osteoporosis, while moderately increased values have been
found in hyperparathyroidism.
Based on these data, it would be possible to
investigate the relationship between these urine and serum
values, individually and collectively, and root resorption.
In order to investigate the significance between the
two groups, two-sample t tests will be run on each variable
by subject and group.
Further, the possible relationship of all the
variables, taken as a biochemical mosaic, to root
resorption, will be noted using direct and step-wise
discriminant statistical analysis.
The direct discriminant analysis weighs, and
linearly combines, the discriminating variables in such a

34
fashion, so that the groups are forced to be as
statistically distinct as possible. 66 The stepwise
discriminant analysis begins by selecting the best
discriminating variable. Subsequent variables are then
selected according to their ability to contribute to further
discrimination. 66 The significance of the separation of
these patients in two groups, as well as the combination of
each variable in achieving that separation can be
demonstrated by means of histograms, as will be shown
subsequently.
In addition to these analytical procedures, the
probability for each patient to belong in one or the other
group will be shown.
These statistical analyses are used widely in
medecine 15 for the classification of microorganisms and
mental disorders. Although it was not possible to find
applications of these analyses on human studies, it is
beleived 15 , that use of these analyses can healp the
classification of desease and the development of prediction
tests which will determine the predisposition of individuals
to them. The discriminant analyses used in this study can
be found under the S.A.s. 63 (Statistical Analysis System)
and the S.P.S.s. 66 (Statistical Package for the Social
Sciences).
In order to present each patient as a biochemical
composite, or mosaic, the ranges of each laboratory test,

35
furnished by the laboratory where the tests were performed,
will be interconnected, one with another as a function of
each test listed systematically in a vertical dimension.
The result of such a composite presentation is shown in Fig.
1. The actual observed biochemical values for each variable
will then be plotted with respect to the normal range and
interconnected in the same fashion as the normal range
pattern. Thus, each patient will possess a "fingerprint" to
be discriminated statistically and placed into a group of
his own kind.

FIGURE 1
Graphic representation of the norrr:al rangel of biochemical tests interconnected one with another in a vertical dimension.
''. , r·
±--;- ::c=~R : l
Serum Calcium~r:::::---~-.- . . • ----------------~~--!~~ ·-·-· ~--~~----_L
:::::::t...-...
I! ';. l + '
~"l~~
l-I-
T 3 _,_,_,_ I ! 8C),F•"' -------------~~-1:---t"-
Cortisol
*rrormal ranges were furnished by the clinical laboratories which performed the biochemical tests.
36

CHAPTER IV
RESULTS
Table I shows the initials of the name of each
patient, their corresponding sex and age, and the group in
which they were placed, according to the root condition.
Twelve patients participated in the study. The control
group consisted of four male and two female patients, with
an age range from 17 to 22 years. The root resorption group
consisted of three male and three female patients, with an
age range from 17 to 23 years.
The results of the laboratory tests for all the
control and root resorption patients are displayed in Tables
II and III. On the bottom of these charts, the mean and
standard deviation of all the variables and the normal range
of each was included. These normal ranges were furnished by
the clinical laboratories, which performed the tests.
Figures 2 to 13 display, graphically, the results of
the laboratory tests, for each patient separately, as they
relate to the normal ranges, given by the clinical
laboratories. These graphs are seoarated in two parts: the
upper one, which includes the results given by the S.M.A.C.
37

and the urinalyses, and the lower one, which includes the
results of the hormonal analyses. The continuous line,
which forms the periphery of the diagram, represents the
normal range of the variables, interconnected one with
another vertically. The dotted line, represents the result
of laboratory tests, also interconnected one with another.
With these diagrams an attempt was made to present each
patient as a separate biochemical unit and graphically
illustrate the results of the laboratory tests as they
relate one to another, and as they relate to their normal
ranges.
38
From the Tables II and III which display the raw
data and from the Figures 2 to 13 the following findings
could be demonstrated: (1) Within the control group, the
values of all the variables fell within their normal ranges,
with the only exception being the T.R.P. of patient L.D.,
which exhibited a low value of 64.6% and of patient F.G.,
which exhibited a low value of 76.1%. (2) Within the root
resorption group, only patient S.K. exhibited the values of
all the laboratory tests falling within their normal
ranges. The remaining five patients exhibited one or more
of their tests to fall outside their normal ranges. Patient
W.R. exhibited a high amount of P04 in his 24 hour urinary
collection. Patient M.R. exhibited low values of serum Ca,
24 hour urnine Ca, T.R.P. and high values of T3 and
cortisol. Patient V.L. showed low value of the 24 hour

urinary P04 , and low value of the T.R.P. Patient M.M.
displayed low value of the T.R.P., and high value of the
PTH. Patient D.M. displayed low value of T.R.P.
Table IV is a tabulation of the mean values and
standard deviations of all the variables of the control and
root resportion group. It also displays the t values and
the significance of the difference of each variable between
the two groups, as they resulted after two-sample t tests
were performed. No variable displayed any significant
difference at P = .10, between the control and root
resorption patients.
Figures 13 to 24, are the histograms displaying the
results of the S.P.S.S. discriminant analysis.
The application of the S.P.S.S. discriminant
analysis to the data, produced a set of coefficients which
determine a line. The best separation between the groups
occur when the values, which represent each patient are
plotted along this line 66 . In the histograms, the x-axis
39
is the line of best separation. Point zero is the point of
separation of the two groups, and lies midway between their
centroids, which are the average positions of all the
patients in a group. The position of each patient along the
x-axis is computed from the sum of the products of the
z-scores and the standard coefficients for each variable 66 .
The height of each bar indicates the number of patients in
that position.

40
Figure 14 is the histogram which displays the result
of the S.P.S.S. direct discriminant analysis when all the
variables, except CT, were used. Separation of the groups
is observed, without overlap. However, one of the control
cases is classified into the root resorption group.
The S.A.S. discriminant analysis (Table V) indicates
that with the exception of the control patient F.D., which
was classified as a root resorption patient with a
probability of 90%, all the patients were assigned to the
correct group with a probability ranging from 93% to 100%.
Figures 15 to 24 are histograms showing the
progressive separation achieved by the S.P.S.S. step-wise
discriminant analysis.
According to the S.P.S.S. step-wise discriminant
analysis, the best separating variable is the T3 . The
sequence by which the rest of the variables are added to the
T3 according to their significance in contributing to
further separation is: T4 , 24 hour urine Ca, serum P04 ,
T.R.P., Serum Ca, Alkaline Phosphatase, 24 hour urine P04 ,
P.T.H., and Cortisol.
Examining these histograms, we observe that a
minimum of four or five variables is required for the
visible separation of the groups.

TABLE I
Tabulations of the patients according to their sex, age, grouped according to root condition.
Patient Sex Age Group*
F.D. M 18 I
F.S. F 18 I
L .D. M 22 I
F.G. M 22 I
H.M. M 18 I
K.J. F 17 I
W.R. M 23 II
M.R. F 21 II
S.K. F 17 II
V. L. M 18 II
M.M. M 18 II
D.M. F 18 II
*Group I represents the control patients. Group II represents the root resorption patients.
41

TAELE II
Serum and urine analyses in patients without root resorption subsequent to orthodontic treatment (Group 1, Control).
Serum Pat. Serum 24 hour Urine T.R.P. Alkaline T3 T4 Cart. P.T.H. CT
Ca P04 Ca* P04* Phosph.
F.D. 9.5 3.5 261, 188 1.18, 1 82.4% 62 125 8.3 19 765 <so F.S. 9.2 3.3 25' 102 0.61, 1.1.5 80% 75 106 6.6 1.5 800 <so L.D. 9.5 2 170, 172 1.1, 1.2 64.6% 39 131+ 9.1 23 680 (50
F.G. 9.5 2.7 132, 185 1.17, 0.89 76.1% 83 118 6.9 25 755 <50
H.M. 9.7 3 318, 174 1.1, 1 79.9% 100 114 7.1 20 680 (so
K.J. 9.4 3.8 45, 90 0.68, 0.72 83.7% 105 116 8.2 11 1015 (so -
Mean 9.4 3.05 154.3 1 77.8% 77.3 118 7.7 18.8 782 <50 S.D. .19 . 64 77.8 .17 6.9 24.5 9.6 .9 5.1 123
Norm** Range 9-11 2.5-4.2 55-400 0.34-1.30 85%+S.4 30-110 80-160 5-12 6-25 430-1860 20-50
MG/DL MG/DL MG MG U/L NG/CL UG/CL UG/DL PG/ML PG/ML
*These numbers represent the values of two separate 24 hour urine collections. **Normal values were furnished by the clinical laboratories where the analyses were performed.
~ N

TABLE III
Serum and urine analyses in patients with root resorption subsequent to orthodontic treatment (Group 2, Root Resorption).
Serum Pat. Serum 24 hour Urine T.R.P. Alkaline T3 T4 Cart. P.T.H. CT
Ca P04 Ca* P04* Phosph.
W.R. 9.5 3.5 241, 372 l. 28' l. 52 81% 42 114 7.7 25 950 <so
M.R. 8.9 3.1 L+8, 56 0.6, 0.5 77.6% 42 168 10.5 37 915 (so
S.K. 10 3.3 170, 150 0.64, 0.52 84.4% 66 152 10.6 11 605 <so V.L. 9.5 3.1 353, 185 1.62' 1. 81 70.5% 105 llO 6.2 10 735 <so M.M. 9.9 3.3 157, 249 1.03, 1.13 75.5% 93 115 6.3 18 1970 (so
D.M. 9.1 3.4 87' 160 0. 73, 1.12 77.7% 79 124 6.3 12 715 <so -
Mean 9.48 3.28 185.5 1.04 77.7% 71 130.5 7.9 18.8 9Rl <so S.D. .43 .16 93.9 .45 4.7 26.1 23.8 2.1 10.5 501
--Norm** Range 9-11 2.5-4.2 55-400 0. 34-l. 30 85%+5.4 30-110 80-160 5-12 6-25 430-1860 20-50
MG/DL MG/DL tvG MG U/L NG/CL UG/DL UG/DL PG/ML PG/ML
*These numbers represent the values of two separate 24 hour urine collections. **Normal values were furnished by the clinical laboratories where the analyses were performed. .(:>-
'v-l

TABLE IV
Means, standard deviations, t values and level of significance for between group comparisons of each variable.
CONTROL GROUP
Variables Mean S.D.
Serum Ca 9.4 0.19
Serum P04 3.05 0.64
24 h. Urine Ca 154.3 77.8
24 h. Urine P04 1 0.17
T.R.P. 77.8% 6.9
Alkaline Phosph. 77.3 24.5
T3 118 9.6
T4 7.7 0.9
Cortisol 18.8 5.1
P.T.H. 782 123
ROOT RESORPTION GROUP
Mean S.D.
9.48 0.43
3.28 0.16
185.5 93.9
1.04 0.45
77.7% 4.7
71 26.1
130.5 23.8
7.9 2.1
18.8 10.5
981 501
t values
0.417
0.854
0.627
0.204
0.029
0.431
1.117
0.214
0
0.945
p
.10*
.10
.10
.10
.10
.10
.10
.10
.10
.10
Calcitonin was not included because no absolute values of that variable were furnished by the laboratory.
*The difference between the groups is not significant at P = 0.1
-1:::_J:::-

45
TABLE V
Probability of classification of the sample in two groups on the basis of biochemical results according to the S.A.S. discriminant analysis*.
Patient Group**
F.O. 1
F.S. 1
L.D. 1
F.G. 1
H.M. 1
K.J. 1
W.R. 2
M.R. 2
S.K. 2
V.L. 2
M.M. 2
D.M. 2
Probability of membership, according to the S.A.S. discriminant analysis in:
Group 1*** Group 2****
0.0928 0.9072
0.9998 0.0002
0.9994 0.0006
1.0000 0.0000
0.9996 0.0004
0.9999 0.0001
0.0620 0.9380
0.0002 0.9998
0.0038 0.9962
0.0005 0.9995
0.0001 0.9999
0.0003 0.9997
*All variables used, except calcitonin.
**Actual placement of the subjects according to root condition.
***Group 1: Control group
****Group 2: Root resorption group

46 FIGURE 2
Graphic representation of all variables, resulting from the biochemical tests, as they relate one to another, and to their normal ranges.(Dotted line represents the observed values connected to each other.)
Patient: F.D. Sex: M Age: 18 Control
'c.
y·
~~---------- '·~~(j#~r9J--Pr±=$ ,_,_j.~
1. The ranges used for the variables, viere furnished by the clinical laboratories, where these tests were performed.
2. Calcitonin was not included, because no absolute values of that variable were given by the clinical laboratory (reported as less than 50 PG/ML).

47 FIGURE 3
Graphic representation of all variables, resulting from the biochemical tests, as they relate one to another, and to their normal ranges. (Dotted line represents the observed values connected to each other.)
Patient: F.S. , Sex: F, Age:l8 Control
:~
~·
'
~a l-,
~~~I'
' g:+-::4~~·
+-i-+-
,~~~11:~~-e
-~~.:,,
i:t+ec""-' T3 -~~~ , ;/""'"~.,._,. , _____________ ..;...._ ' - -y_o:;::: ' ' ' ' "-: . ~reN~ s
1. The ranges used for the variables, >·rere furnished by the clinical laboratories, where these tests were performed.
2. Calcitonin was not included, because no absolute values of that variable were given by the clinical laboratory (reported as less than 50 PG/HL).

48
FIGURE 4
Graphic representation of all variables, resulting from the biochemical tests, as they relate one to another, and to their normal ranges.(Dotted line represents the observed values connected to each other.)
Patient: L.D. Sex: M , Age: 22
Serum Calcium --------------,-,-----~.-;_-..,..-~ :~ -~~--"'
:--: I i i i ,4_ Serum Phosptoru.s- . . . ; ' :..,· --------------~-"~-- ~ --~~
' /',• ~
Cor:trol
1. The ranges used for the variables, v1ere furnished by the clinical laboratories, where these tests were performed.
2. Calcitonin was not included, because no absolute values of that variable were given by the clinical laboratory (reported as less than 50 PG/ML}.

49
FIGURE 5
Graphic representation of all variables, resulting from the biochemical tests, as they relate one to another, and to their normal ranges.(Dotted line represents the observed values connected to each other.)
Patient: F.G .. , Sex: M, Age: 22 Control
:-~
Serum Calcium~ _ --------------:-=-----t--- ---:........,-~.../-·- - -
Serum Phospl:orus ~--- - i . I . . 1--- rh__;_,..,~§}ffi; -------------·--!""...,,...~-: . ~-:--T-2¥t / i i -I' i ·1
§~-~.:~::~::=-~a~c±~1l!l-""'"'"' -~=5~- · ~ . . ! . : : ~~ -/,--.-.-_ i l : ~P:~
~~-~.:-~:~~-:£::~P!:e:l3s -~ -~~ .-3~~ :1;;:3 ~- ·E·:. I
1. The ranges used for the variables, •rere furnished by the clinical laboratories, where these tests were performed.
2. Calcitonin was not included, because no absolute values of that variable were given by the clinical laboratory (reported as less than 50 PG/ML).

50
FIG'ti'RE 6
Graphic representation of all variables, resulting from the biochemical tests, as they relate one to another, and to their normal ranges.(Dotted line represents the observed values connected to each other.)
Patient: H.M. , Sex: M , Age: 18 Control
Serum Calcium -------------.....--~~~~-~ -._- ~--~~·~r-~ -,
T3 -------------·r~
', + ·~~:u'G~
T+r . c:::;j
1. The ranges used for the variables, were furnished by the clinical laboratories, where these tests were performed.
2. Calcitonin was not included, because no absolute values of that variable were given by the clinical laboratory (reported as less than 50 PG/r.1L}.

51 FIG1JP.! 7
Graphic representation of all variables, resulting from the biochemical tests, as they relate one to another, and to their normal ranges. (Dotted line represents the observed values connected to each other.)
Patient: K.J. , Sex: F , Age: 17
Serum Calcium~~-·-· - - --- '--------------- ~-~~~-
=~---------------,
;....-< ,.,. 7~
-~· ,,'
. r-b-:·
Control
~~~ l:J:;o-.:;:::U=rr~
~
1. The ranges used for the variables, were furnished by the clinical laboratories, where these tests were performed.
2. Calcitonin was not included, because no absolute values of that variable were given by the clinical laboratory (reported as less than 50 PG/HL).

52 FIGURE 8
Graphic representation of all variables, resulting from the biochemical tests, as they relate one to another, and to their normal ranges.(Dotted line represents the observed values connected to each other.)
Patient: '{ .R. , Sex: M , Age: 23 , Root Resorption
±:::tti::t:j Serum Calcium · · · _ -------------- ~~ -~----- -~~~ ~
·c
1. The ranges used for the variables, were furnished by the clinical laboratories, where these tests were performed.
2. Calcitonin was not included, because no absolute values of that variable were given by the clinical laboratory (reported as less than 50 PG/ML).

53
FIGURE 9
Graphic representation of all variables, resulting from the biochemical tests, as they relate one to another, and to their normal ranges.(Dotted line represents the observed values connected to each other.)
Patient: M.R. , Sex: F , Age: 21 , Root Resorption
~ Serum Calcium · ---------------~~~~-- ~~-~--~
24 h. Urine Phosphorus · · I ~4..i:J -------------~~~~-~-~~~~~·3~
+--.
T.R.P.
t:=£ Alk. Phosphatase -------------------
...
-------------"(~
---------------.~-
1. The ranges used for the variables, were furnished by the clinical laboratories, where these tests were performed.
2. Calcitonin was not included, because no absolute values of that variable were given by the clinical laboratory (reported as less than 50 PG/HL).

54
FIGURE 10
Graphic representation of all variables, resulting from the biochemical tests, as they relate one to another, and to their normal ranges.(Dotted line represents the observed·values connected to each other.)
Patient: S.K. , Sex: F , Age:l7 , Root Resorption
Serum Calcium
Cortisol
P.T.H.
1. The ranges used for the variables, vrere furnished by the clinical laboratories, where these tests were performed.
2. Calcitonin was not included, because no absolute values of that variable were given by the clinical laboratory (reported as less than 50 PG/ML).

FIGURE 11
Graphic representation of all variables, resulting from the biochemical tests, as they relate one to another, and to their normal ranges.(Dotted line represents the observed values connected to each other.)
Patient: V.L. , Sex: M , Age: 18 , Root Resorption
' ,,-,
•: ~ r- '
Serum Calcium _______ .......... _ --- "·-~---.._ ___ _
Serum Phospho~~ . . 1 ' -~ ----- --------~--- ·- -~ ~ . ....,;o______ ,'--" u - I I
T.R.P.
P.T.H.
1. The ranges used for the variables, vrere furnished by the clinical laboratories, where these tests were performed.
2. Calcitonin was not included, because no absolute values of that variable were given by the clinical laboratory (reported as less than 50 PG/ML}.

56
FIGURE 12
Graphic representation of all variables, resulting from the biochemical tests, as they relate one to another, and to their normal ranges.(Dotted line represents the observed values connected to each other.)
Patient: M.M. , Sex: M , Age: 18 , Root Resorption
Serum Calcium _ · _ . _ _._ · -'F ----------------~-~_ .... ______ ---~--- -·-,- -- ~~
Serum Phospho~-- . . . · '----------------.;.. . -;_..:..~=-. ... ____ .,;. 2::i=5;
c;::::: 1 I L
~·,
T3 ------------
-/~··' 72-5: fTGZ!} -X_. ~r.:-~ :-,_,_ ' '
• ·~~:~l~P,7t1:f/W:~
1. The ranges used for the variables, •rere furnished by the clinical laboratories, where these tests were performed.
2. Calcitonin was not included, because no absolute values of that variable were given by the clinical laboratory (reported as less than 50 PG/ML}.

57
FIGURE 13
Graphic representation of all variables, resulting from the biochemical tests, as they relate one to another, and to their normal ranges. (Dotted line represents the observed values connected to each other.)
Patient: D.M. , Sex: F , Age: 18 , Root Resorption
I r-- I
Serum Calcium --------------~~~~;;..-..;-_...:.. .... --·~ . -~~~. :.
T3 --------------r~
·~~----/..,.-'--- .
. --/~
+·
1. The ranges used for the variables, •1ere furnished by the clinical laboratories, where these tests were performed.
2. Calcitonin was not included, because no absolute values of that variable were given by the clinical laboratory (reported as less than 50 PG/HL).

FIGURE 14
Histogram of the classification of the sarr~le in two groups by the S.P.S.S. direct discriminant analysis (all variables included except Calcitonin).
4
Ul 3 ~ Q)
•rl +> ro 2 p,
ft; 0
~ 1
~ z i * ":"4
* i ! ":"3 -2
1' Centroid
of group 1
I X
I I I i I t H-+t
.-1 0 1 c.:lia 3
of group 2
. GROUP 1. I ·GROUP 2**---------~ ~
Symbol i represents: one root-resorption patient, as selected according to the root condition.
Symbol I represents: one control patient, as selected according to the root condition.
*Group 1: Control group **Group 2: Root resorption group
4
Ul CD

FIGURE 15
Histogram of the classification of the sample in two groups by the S.P.S.S. step-wise discriminant analysis (Step 1. Variable used: T
3)
4
Cll 3 +"
1=1 4l
•rl +" m 2 p.
L{ it I 1
* t ~ . * t tit i II I I I I I • • A (' ..---.-----.--.---------.
.-:-4 "":"3 -2 ... 1 i 0 i 1 2 3 4
Centroid Centroid of group 1 of group 2
~------------------GROUP 1* )I GROUP 2*·--------------------~
Symbol i Symbol I
*Group 1: **Group 2:
represents: one root-resorption patient, as selected according to the root condition.
represents: one control patient, aa selected according to the root condition.
Control group Root resorption group
\Jl \.{)

FIGURE 16
Histogram of the classification of the sample in two groups by the S.P.S.S. step-wise discriminant analysis (Step 2. Variables used: T3 , T4).
4
fll 3 ~ ~ CIJ
•rl ~ al 2 P<
L1 § t z .
-:-4 -:-3 -2
t I J ti
++ .-1 I 0
Centroid of group 1
I i· t
X
3t X :; r 1
Centroid of group 2
~ ~ ~
~
2 3
~---------GROUP 1* ")I ·GROUP 2*'*----------~
Symbol t Symbol I
*Group 1: **Group 2:
represents: one root-resorption patient, as selected according to the root condition.
represents: one control patient, as selected according to the root condition.
Control group Root resorption group
4
0\ 0

FIGURE 17
Histogram of the classification of the sample in two groups by the S.P.S.S. step-wise discriminant analysis (Step 3. Variables used: T3, T4, 24 hour urine Ca).
4
~ 3 Q Q)
•rl +> ~2
fr.i 0
~ 1
§ ~
t I X X
3E X X
* * • ..... J~HJ.J. ~ • ... • I
c:-3 -2 d 1' 0 ll 2
Centroid Centroid
c:-4 .-, -.--,-----...----.
3 4
of group 1 of group 2
~---------GROUP 1* ) I GROUP 2**---------~
Symbol t Symbol .I
*Group 1: **Group 2:
represents: one root-resorption patient, as selected according to the root condition.
represents: one control patient, as selected according to the root condition.
Control group Root resorption group
:J\ f-'
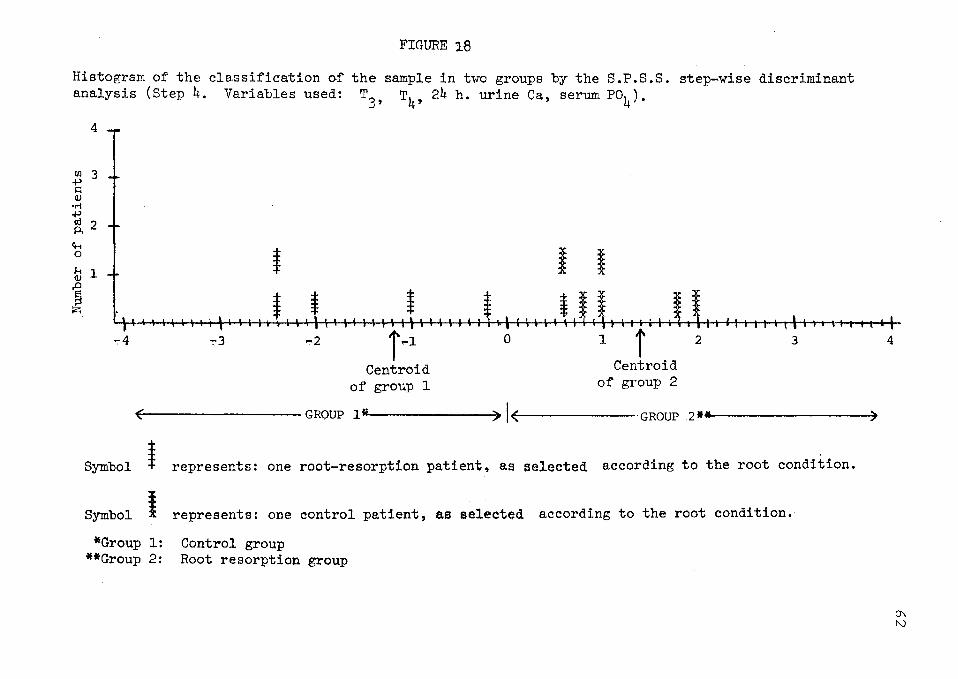
FIGURE 18
Histogram of the classification of the sample in two groups by the S.P.S.S. step-wise discriminant analysis (Step 4. Variables used: T
3, T4, 24 h. urine Ca, serum Po4).
4
Ill 3 +' ~ (1)
•rl +' al 2 Pi
ft.;
~ 1 1 t I I (1)
§ I. t t t i ~ •- • a a I I ~ I I ~~ \ ' I I I I I ~ .---.-----.--..-----r-
-:-4 ":"3 -2 r~l 0 1 T 2
Centroid Centroid
3
of group 1 of group 2
~---------GROUP 1* )I GROUP 2*·-----------_,
Symbol i Symbol I
*Group 1: **Group 2:
represents: one root-resorption patient, as selected according to the root condition.
represents: one control patient, as selected according to the root condition.
Control group Root resorption group
4
0\ N

FIGURE 19
Histogram of the classification of the sample in two groups by the S.P.S.S. step-wise discriminant analysis (Step 5. Variables used: T
3, T4, 24 h. urine Ca, serum Po4, T.R.P.).
4
Ul 3 t; CIJ
•ri .p al 2 Pi
4-< 0
~ 1
1 z
t
* ~4 -:-3 -2 r ~l Centroid
of group 1
~ X X
I t I I I ~ illlt\111111111\\ltllllti\
0 l i 2 3 4
Centroid of group 2
- GROUP 1* ) I GROUP 2**---------~ ~
Symbol t represents: one root-resorption patient, as selected according to the root condition.
Symbol I represents: one control patient, as selected according to the root condition.
*Group 1: Control group **Group 2: Root resorption group
0\ \.N

FIGURE 20
Histogram of the classification of the sample in two groups by the S.P.S.S. step-wise discriminant analysis (Step 6. Variables used: T T4 24 h. urine Ca, serum Po4, T.R.P., serum Ca).
3' ' 4
ttl 3 +> s:: Q)
•rl +> ro 2 p.
ft..< 0
~ 1
§ t2;
t
* *
I
* i I I I , ... 'I
':'4 -::-3 -2 1 .-l Centroid
of group 1
0 l i 2 Centroid
of group 2
3 .-..-.---..-,
4
r---------GROUP 1* ) I GROUP 2**----------7
Symbol i Symbol I
*Group 1: **Group 2:
represents: one root-resorption patient, as selected according to the root condition.
represents: one control patient, aa selected according to the root condition.
Control group Root resorption group
0\ .j::o-

FIGURE 21
Histogram of the classification of the sample in two groups by the S.P.S.S. step-wise discriminant analysis (Step 7. Variables used: T
3, T
4, 24 h. urine Ca, serum P0
4, T.B.P., serum Ca, Alk. Phosph.).
4
Ul 3 ~ (l)
•rl .p aj 2 A
fH 0
1i1 1
§ z
t
-:-4 ~3
i -2 i .. l
Centroid of group 1
5t X
~
t I ¥ i I I \111\liliillll,lllllllll\\•kllltll,
0 l i 2 3 4
Centroid of group 2
~---------GROUP 1* ) I GROUP 2*-----------~
Symbol i Symbol I
*Group 1: **Group 2:
represents: one root-resorption patient, as selected according to the root condition.
represents: one control patient, as selected according to the root condition.
Control group Root resorption group
0\ Vl

FIGURE 22
the sample in two groups by the S.P.S.S. step-wise discriminant Histogram of the classification of analysis (Step 8. Variables used: 24 h. urine P04).
T3
, T4, 24 h. uri.ne Ca, serum Po4, T.R.P., serum Ca, Alk. Pbosph.,
4
((J 3 ~ 4)
•r-i +> td 2 p.,
4-; 0
~ 1
§ :;::;
c4 c3
t i t t t
l' I I I" I I
-2j Centroid
of group 1
,..1 0 1
i I 2
¥
I 1' Centroid
of group 2
I ..... l I .--.-..-------.
3 4
, GROUP 1* ) I GROUP 2*----------? ~
Symbol i represents: one root-resorption patient, as selected according to the root condition.
Symbol I represents: one control patient, as selected according to the root condition.
*Group 1: Control group **Group 2: Root resorption group
0\ 0\

~IGURE 23
the sample in two groups by the S.P.S.S. step-wise discriminant ,Histogram of the classification of analysis (Step 9. Variables used: T3' T4, 24 h. urine Ca, serum P04, T.R.P., serum Ca, Alk. Phosph., 2~ h. urlne P04, PTH).
Ill 3 ~ Q)
•rl +' ro 2 p.
c.-. 0
~ 1
§ z
X
i * t t
t t t i l i I_ I 1
I II I I'
~4 -::-3 ~2 T Centroid
of group 1
,..1 0 1 2 3 .,. ~entroid
of group 2
~------------------GROUP 1* )I GROUP 2*._----------------~
Symbol t Symbol I
*Group 1: **Group 2:
represents: one root-resorption patient, as sel~cted according to the root condition.
represents: one control patient, aa selected according to the root condition.
Control group Root resorption group
4
IJ\ -...J

FIGURE 24
Histogram of the classification of the sample in two groups by the S.P.S.S. step-wise discriminant analysis (Step 10. Variables used: T3, T4, 24 h. urine Ca, serum F04, T.R.P., serum Ca, Alk. Phosph., 24 h. urine P011 , FTH, cortisol).
4
11.1 3 1:1 C1l
•rl +' a! 2 P;
c,.; 0
~ l
] z t * * t
* t
I • o • It \ I I I I I I .----.-------.-l-----.---1
":"3 ~,f .-1
Centroid
~4
of group 1
0 1 2j. Centroid
of group 2
3
. GROUP l I GROUP 2*-------------------7 ~
Symbol t represents: one root-resorption patient, as selected according to the root condition.
Symbol I represents: one control patient, aa selected according to the root condition.
*Group 1: Control group **Group 2: Root resorption group
4
0\ (X)

CHAPTER V
DISCUSSION
The purpose of this study was to demonstrate how
normal patients undergoing orthodontic treatment could be
adequately distinguished, one from another, based on their
metabolic fingerprint, when some of them exhibited
generalized root resorption and some not. This was in
contrast to previous studies 3 , 37 , 68 which attempted to
establish a metabolic characteristic of the root resorption
patient by comparing the results of several laboratory tests
to their normal ranges.
The results of this study demonstrate a strong
relationship between the overall metabolic picture and
generalized root resorption which appears in patients during
the first year and a half after the initiation of
orthodontic treatment.
Since it has been shown that orthodontic treatment
can cause root resorption, very strict criteria for the
sample selection were placed. Orthodontic patients, in
order to qualify for the root resorption group, had to
exhibit moderate to severe generalized root resorption and
69

70
be in treatment for a relatively short period of time. In
these patients, the observed root resorption could not be
attributed readily to the applied orthodontic mechanics and
the characteristic term, "idiopathic", could be used in
discribing that condition. Furthermore, these resorption
cases constitute a source of concern to both orthodrntist
and patient. The prognosis in these cases, for both the
orthodontic treatment and the future health of the dentition
is poor. Orthodontic patients, in order to qualify for the
control group in this study, did not exhibit any
radiographic evidence of root resorption.
The sample was highly selected. It is obvious that
comparisons between two extreme situations were attempted.
The percentage of orthodontic patients exhibiting idiopathic
root resorption is not more than 10%, while the large
majority of the orthodontic patient population exhibits some
minor degree of root resoprtion.
A noteworthy result of this study is that, in order
to demonstrate the relationship between metabolism and root
resorption, the metabolic fingerprint of each patient had to
be used rather than individual metabolic variables. An
attempt to relate, statistically, individual metabolic
variables to root resorption failed, although some greater
variability among the values of some metabolic factors can
be observed. Also, occasional, values outside their normal
ranges could be seen in the root resorption group. If the

71
study was ended at that point, the conclusions drawn would
had been similar to those of Newman 37 Newman, in 1975,
after examining the relationship of T4 , PBI, serum Ca,
serum P04 and Alk. Phosph. to root resorption, came to the
conclusion that systemic factors and metabolic problems were
not at all related to root resorption.
Use of direct discriminant analysis allowed the
measurments of each patient to be taken as a biochemical
unit. By using this metabolic fingerprint, we attempted to
determine the significance of the separation of those
patients in two groups. The result of that statistical
analysis demonstrated that the control and root resorption
patients were classified in two separate groups with a
certanity ranging between 93 to 100%, with the exception of
one control patient which was classified as a root
resorption case. This divergent datum indicates that, in
addition to the choosen variables, there should be others
also influencing root resorption. It can be suggested that
some of these additional variables should be related to the
anatomy of the root and the P.D.L. and to the chemical
composition of the cementum. Another possible explanation
for divergence could be that the chemical analyses give a
metabolic fingerprint at a particular time. Perhaps that
patient would have been classified as a control, if the
tests were performed at an earlier and perhaps that patient
will develop root resorption as the treatment progresses.

72
Becks 3 in 1936, after studying 100 patients with
root resorption, stated that 66% of the orthodontic patients
and 86% of the nonorthodontic patients exhibited definite
hypothyroidism. The findings of Becks were based mainly on
readings of their basal metabolic rate. The present study,
using more precise methods for the determination of thyroid
function, does not support this finding. On the contrary,
it is shown that in the root resorption group, there was one
patient exhibiting a high value of T3 and also the mean
values for the T3 and T4 were greater, although
statistically, not significant, when compared to the mean
values exhibited in the control group.
The results of Tager 68 could not be evaluated and
compared to this study, because his study sample included
patients with several problems, i.e. delayed tooth eruption,
tooth deformities and root resorption.
The step-wise discriminant analysis, shows that the
single most important separating variable is the T3 , while
the factor which enhances best the separating action of
T3 , is T4 . This result indicated that thyroid function
is closely related to root resorption. Nevertheless, it is
apparent that the separation of the sample in two groups is
insignificant and only after five variables are included in
the discriminant analysis, can one observe the sample
separation (Figures 15 to 20). The sequence by which the
variables were included one after another in the step-wise

73
analysis, is based on the potential of each variable to
increase the separating action of the previously added
variables and does not necessarily imply any biological
mechanism, nor does the sequence follow any biological
pertinency. An impression was gained that the seauence by
which the variables were included in the step-wise
discriminant analysis do not express a particular pattern or
syndrome, not detectable in the graphical two dimensional
representation of each case. On the contrary, it is
tempting to speculate, based on the small differences
between the mean values and the large standard deviations,
shown in Table IV, that there could be several biological
mechanisms involved, some of them possibly related to
nutritional status, as Marshall and Becks have shown, and
some of them to renal and gastrointestinal problems, as
Sisher and Weinman suggested, and some of them to primary
endocrinal problems.
This study described clearly a definite relationship
between the metabolic picture of the patients, as given by
the tests which were selected, and generalized root
resorption. Furthermore, it is suggested that the procedure
applied in this study could be use prospectively as a
prediction test concerning the behavior of the roots of the
dentition of future orthodontic patients.
It is further suggested that the following studies
should follow this preliminary study.

1. Replication of the same study while using a large
number of patients, selected with the same strict selection
criteria used in this study. The results of this study will
enhance the calibration of the discriminant analysis.
74
2. Addition of orthodontic patients exhibiting less
than moderate degree of root resorption. This study will
determine if these patients can be classified, based on
their metabolic fingerprint, in a way corresponding to their
root condition.
3 Application of the derived prediction test
prospectively, to future orthodontic patients.
These studies are needed for the development of an
accurate and cost effective prediction test, which could be
applied in the Orthodontic profession.

CHAPTER VI
SUMMARY AND CONCLUSIONS
This study was designed to test: (1) The
significance of the variation of individually selected
metabolic variables (test values) between orthodontic
patients exhibiting moderate to severe generalized root
resorption and others exhibiting no radiographic evidence of
that condition. (2) The possibility of classifying these
patients in two separate groups on the basis of their
metabolic fingerprint.
The sample consisted of 12 orthodontic patients, six
of whom exhibited root resorption; the other six none.
The selected metabolic variables which were also
used to compose and describe the metabolic fingerprint of
each patient, were as follows: serum calcium, serum
phosphorus, 24 hour urine calcium, 24 hour urine phosphorus,
tubular reabsorption of phosphorous, triodothyronine,
tetraiodothyronine, cortisol and parathormone.
The two-sample t test showed no significant
differences between individual test values between groups.
The S.P.S.S. direct discriminant analysis was performed and
75

76
it was possible to classify the patients into two groups
with a probability of group membership better than 90%. One
control case was classified incorrectly.
The results of this study indicates that it is
possible to separate healthy orthodontic patients,
exhibiting generalized root resorption, from patients
without root resorption.The success relates to each
patient's metabolic fingerprint and the application of the
S.P.S.S. discriminant analysis in characterization of the
fingerprint.
On the basis of our findings, it is suggested that
the described method: (1) could be used as a prediction
test for moderate to severe generalized root resorption in
prospective orthodontic patients, and (2) should be used as
a basis for further research, so that an even more accurate
and more versatile prediction test may be developed.

REFERENCES
1. Baumrind, S., Buck, D.L.: Rate Changes in Cell Replication and Protein Syntesis in the Periodontal Ligament Incident to Tootrh Movement; Am. J. Orthodont., 57:109-131, 1970.
2. Becks H., Weber M.: The Influence of Diet on the Bone System with Special Reference to the Alveolar Process and the Labyrinthine Capsule; J.A.D.A., 18:197-264, 1931.
3. Becks, H.: Root Resorptions and Their Relation to Pathologic Bone Formation; Int. J. Orthodont., 22:445-478, 1936.
4. Blunt, J.W., Tanaka, Y., Deluca, H.F.: The Biological Activity of 25 - HCC, a Metebolite of Vitamin D; Proc. Nat. Acad. Sci., U.S.A., 61:1503-1506, 1968.
5. Boyde, A., Lester, K.S.: Electron Microscopy of Resorbing Surfaces of Dental Hard Tissues; Zeitschrift fuz Zellforschung, 83:538-548, 1967.
6. Bullough, W.S.: The Energy Relations of Mitotic Activity; Biological Reviews, 27:133-168, 1952.
7. Burkhart, J.M., Jowsey, J.: Parathyroid and Thyroid Hormones in the Development of Immobilization of Osteoporosis. Endocrininology, 81:1053-1062, 1967.
8. Castelli, W.A., Dempster, W.T.: The Periodontal Vasculoriture and its Responses to Experimental Pressures; J.A.D.A., 70:889-905, 1965.
9. Crumley, P.J.: Collagen Formation in the Normal and Stressed Periodontium, Periodontics; 2:53-61, 1964.
10. DeShields, R.W.: A Study of Root Resorption in Treated Class II, Division 1 Malocclusions; Angle Orthodont., 39:231-245, 1969.
11. Dougherty, T.F.: Effect of Hormones on Lymphatic Tissue; Physiological Reviews, 32:379-401, 1952.
77

12. Eastoe, J.E.: Insoluble Collagen in the Mechanisms of Tooth Support; J. Wright and Son Ltd., Bristie, pp. 14-19, 1967.
13. Feinblatt, J., Belanger, L.F., Rasmussen, H.: The Effect of Phosphate Infusion Upon Bone Metabolism and P.T.H. Action; Am. J. Physiol., 218:1624-1631, 1970.
78
14. Gottlieb, B., Orban, B.: Die Veranderungen der Gewebe bein ubermassiger Beanspruchung der Zahue; Georj. Tieme, Leipzing, 1931.
15. Hartigan, J.A.: Clustering; Ann. Rev. Biophys. Bioengineering, 2:81-101, 1973.
16. Hemley: The Etiology of Root Resorption of Vital Permanent Teeth; Dental soc., City of N.Y., Jan. 1938.
17. Hemley: The Incidence of Root Resorption of Vital Permanent Teeth; J. Dent. Res., 20:133-141, 1941.
18. Henry - Weinman: The Pattern of Resorption and Repair of Human Cementum; J.A.D.A., 42:170-280, 1951.
19. Herzberg, B.: Bone Changes Incident to Orthodontic Tooth Movement in Men; J.A.D.A., 19:1777, 1932.
20. Hirsch, P.F., Munson, P.L.: Thyrocelcitonin; Physiol. Rev., 49:548-622, 1969.
21. Jee, W.S.S., Nolan, P.O.: Origin of Osteoclasts from the Fusion of Phagocytes; Nature: 200-325, 1963.
22. Johnson, A.L., Appleton, J.L.T., Rittershafer, L.S.: Tissue Changes Involved in Tooth Movement; Int. J. Orthodont. and Oral Surg., 12:889-898, 1926.
23. Ketcham, A.: A Preliminary Report of an Investigation of Root Resorption of Permanent Teeth; Int. J. Of Orthodont., Oral Surg. and Radiog., 13:97-127, 1927.
24. Ketcham, A.: A Radiographic Study of Orthodontic Tooth Movement; A Preliminary Report; J.A.D.A., 14:1577-1598, 1927.
25. Ketcham, A.: A Progress Report of an Investigation of Root Resorption of Permanent Teeth; Int. J. of Orthodont., Oral Surg., Rad., 15:310-328, 1929.
26. Kwam, E.: Tissue Changes Incident to Movement of Rat Molars, Thesis; Universitetsforloget, Oslo, 1957.

27. Kwam, E.: A Study of Cell-Free Zone Following Experimental Tooth Movement in the Rat; Trans. Europ. Orthod. Soc., 419-435, 1969.
28. Kwam, E.: Scanning Electron Microscopy of Tissue Changes on the Pressure Surface of Human Premolars Following Tooth Movement; Scand. J. Dent. Res., 80:357-368, 1972.
29. Little, K.: Osteoporotic Mechanisms; Int. Med. Res., 1:509-529, 1973.
79
30. Little, K., Valderama, J.A.: Some Mechanisms Involved in the Osteoporotic Process; Gerontolojia, 14:109, 1968.
31. Macapanpan, L.C., Weinman, J.P., Brodie, A.G.: Early Tissue Changes Following Tooth Movement in Rats; Angle Orthodont., 24:79-95, 1954.
32. Marshall, J.A.: The Relation of Malnutrition to Dental Pathology; Int. J. Orthodont., Oral Surg and Radiog., 17:527-551, 1931.
33. Marshall, J.A.: Deficient Diets and Experimental Malocclusions Considered from the Clinical Aspect; Int. J. Orthodont., 18:438-442, 1932.
34. Marshall, J.A.: A Study of Bone and Tissue Changes Incident to Experimental Tooth Movement and its Application to Orthodontic Practice; Int. J. Orthodont, 19:1-17,1933.
35. Marshall, J.A.: The Classification, Etiology, Diagnosis, Prognosis and Treatment of Radicular Resorption of Teeth; Int. J. Orthodont., 20:731-746, 1934.
36. Messler, M., Malone, A.: Root Resorption in Human Permanent Teeth; Am.J.Orthodont., 40:619-633, 1954.
37. Newman, W.G.: Possible Etiologic Factors in External Root Resorption; Am.J.Orthodont., 67:522-538, 1975.
38. Oppenheim, A.: Tissue Changes Particularly of Bone, Incident to Tooth Movement; Am. Orthodont., Oct., 1911, Jan., 1912.
39. Oppenheim, A.: The Crisis in Orthodontia; Int. J. Orthodont., 19:1201, 1933.

40. Oppenheim, A.: The Crisis in Orthodontia, Int. J. Orthodont., 20:18, 1934.
41. Oppenheim, A.: The Crisis in Orthodontia; Int. J. Orthodont., 21:50, 1935.
42. Oppenheim, A.: Biologic Orthodontic Therapy and Reality; Angle Orthodont., 6:5,59,153, 1930.
43. Oppenheim, A.: Possibility for Orthodontic Physiologic Movement; Am. J. Orthodont. and Oral Surg., 30:277-345, 1944.
44. Phillips, J.R.: Apical Root Resorption Under Orthodontic Treatment; Angle Orthodont., 25:1-22, 1955.
80
45. Pinsker, L.J.: Root Resorption under Orthodontic Appliances as Affected by Corticosterioids in the Rhesus Monkey; Int. J. Orthodont., 1:4-12, 1962.
46. Raisz, L.: Physiologic and Pharmacologic Regulation of Bone Resorption; Seminars in Medicine of the Beth. Isteel Hospital, Boston, 282:909-916, 1970.
47. Reitan, K., Skiellen, W.G.: Tissue Changes Following the Rotation of Teeth in the Dog; Angle Orthodont., 10:140-147, 1940.
48. Reitan, K.: The Initial Tissue Reaction Incident to Orthodontic Tooth Movement; Acta. Scand. Odont. Supplement, 6, 1951.
49. Reitan, K.: Tissue Behavior During Orthodontic Tooth Movement; Am.J.Orthodont., 46:881-900, 1962.
50. Reitan, K.: Clinical and Histologic Observations on Tooth Movement During and After Orthodontic treatment; Am.J.Orthodont., 53:721-745, 1967.
51. Reitan, K., Kwam, E.: Comparative Behavior of Human and Animal Tissue During Experimental Tooth Movement; Angle Orthodont., 41:1-14, 1971.
52. Reitan, K.: Initial Tissue Behavior During Apical Root Resorption; Angle Orthodont., 44:1:63-82, 1974.
53. Robbins, S.L.: Cell Injury and Cell Death; in Robbins S.L. (ed.) Pathology W.B. Sanders, Philadelphia and London, 1967.

54. Rothbladt, J.M., Waldo, C.M.: Tissue Response to Tooth Movement in Normal and Abnormal Metabolic States; J.Dent.Res., 32:678-679, 1953.
55. Rudolf: A Comparative Study in Root Resorption in Permanent Teeth; J.A.D.A., 23:822-826, 1936.
56. Rudolf: An Evaluation of Root Resorption Occuring During Orthodontic Treatment; J.Dent. Res., 19:367-371, 1940.
57. Rygh, P.: Ultrastuctural Vascular Changes in Pressure Zones of Rat Molar Periodontium Incident to Orthodontic Tooth Movement; Scand. J. Dent. Res., 80:307-321, 1972.
58. Rygh, P.: Ultrastructural Cellular Reactions in Pressure Zones of Rat Molar Periodontium Incident to Orthodontic Tooth Movement; Acta. Odont. Scand., 30:575-593, 1972.
59. Rygh, P., Selvig, A.K.V.: Ezythrocytic Crystalization in Rat Molar Periodontium Incident to Tooth Movement; Scan. J. Dent. Res., 81:62-73, 1973.
60. Rygh, P.V.: Orthodontic Root Resorption Studied by Electron Microscopy; Angle Orthodont., 47:1:1-16, 1977.
61. Sandstedt, C.: Einige Beitrage zur Theorie der Zahnregulierung Nord. Tandl. Tidsska, 5:236-256, 1904.
62. Sandstedt, C.: Einige Beitrage zur Theorie der Zahnregulierung Nord. Tandl. Tidsska, 6:1-25, 1905.
63. S.A.S.: Statistical Analysis System. S.A.S. Institute Inc., Raleigh, North Carolina, 1979 edition.
81
64. Schwarz, A.: Tissue Changes Incident to Tooth Movement; Int. Orthodont. Congress, 1931.
65. Schwartz, A.: Tissue Changes Incidential to Tooth Movement; Int. J. Orthodont., 18:331, 1932.
66. S.P.S.S. Statistical Package for the Social Sciences. McGraw-Hill Book Company, Second edition.
67. Storey, E.: The Nature of Tooth Movement; Am.J.Orthodont., 63:292-314, 1972.
68. Tager, B.N.: Endocrine Problems in Orthodontics; Am.J.Orthodont., 867-875, 1951.

82
69. Tencate, A.R., Deporta, D.A., Freeman, E.: The Role of Fibroblast in the Remodeling of P.D.L. During Physiologic Tooth Movement; Am.J.Orthodont., 69:155-1~8, 1976.
70. Trueta, J., Amato, V.P.: The Vascular Contribution to Osteogenesis Changes in the Growth Cartilage Caused by Experimentally induced Ischeemia; J. of Bone and Joint Surg., 42B:57l-587, 1960.
71. Trueta, J.: A Theory of Bone Formation; Acta. Orthopoedica Scand., 32:190-198, 1962.
72. Utley, B.K.: The Activity of Alveolar Bone Incident to Orthodontic Tooth Movement as Studied by Oxytetrecyclin-Induced Fluorescence; Am.J.Orthodont., 54:167-201, 1968.
73. Vaas, G.: Lysosomes and the Cellular Physiology of Bone Resorption, Frontiers of Biology, Edited by J.T. Dingle, H.B. Fell, Amsterdam, North-Holland Publishing Co., 1969, pp. 217-253.
74. Waldo, C.M.: Method for the Study of Tissue Response to Tooth Movement; J. Dent. Res., 32:690-691, 1953.
75. Waldo, C.M., Rothblatt, J.M.: Histologic Response to Tooth Movement in the Laboratory Rat, Procedure and Preliminary Observations; J.Dent. Res., 33:481-486, 1954.
76. Weinman - Sicher: Bone and Bones. Fundamentals of Bone Biology; St. Louis, C.V. Mosby, 1955.
77. Zaki, A.E., Heysen, G.: Histology of the Periodontium Following Tooth Movement; J. Dent. Res., 42:1373-1379, 1963.

APPENDIX A

APPENDIX A
Copy of consent form which patients were requested to sign, prior to participation in this study.
IRB Number: l/80-5c
LOYOLA UNIVERSITY MEDICAL CENTER MAYWOOD, ILLINOIS
SCHOOL OF DENTISTRY Orthodontics and
Preventive Dentistry and Community Health
INFORMED CONSENT
Patient's name: Date:
83
-------------Project title: Some Metabolic Aspects of Root Resorption, A
Preliminary Study in Normal, and Orthodontically Treated Patients
PATIENT INFORMATION
This study is an attempt to relate some minerals of the blood and hormones controlling the minerals, to root resorption, which appears in some orthodontically treated patients.
Description and explanation of procedure:
1. Blood will be drawn to perform complete biochemical screening of the patient. The results will indicate physiologic function of various organ systems including enzymes and hormones that may vary within normal limits as the function of mineral metabolism.
2. Twenty-four hour urine tests which will allow us to determine renal function concerning some minerals.
Risks and discomforts:
1. Not to have breakfast before the drawing of the blood which has to be taken in the morning between 8 a.m. and 10 a.m.
2. The collection of 24 hour urine.

84
Potential benefits:
As a result of this study, it might be possible to predict the degree of root resorption which may occur in a patient, normally or when certain orthodontic procedures are done.
Alternatives~ There are no alternatives, except no participation.
CONSENT
I have fully explained to (patient, parent, legal represen-tative)
the nature and purpose of the above-described procedure and the risks that are involved in its performance. I have answered and will answer all questions to the best of my ability.
I have procedure with permission for know that
(principal investigator)
been fully informed of the above-described its possible benefits and risks. I give my my/my child's participation in this study. I
or his/her associates 7(_p_r~i-n~i~c-l~.p-a~l~i-n_v_e_s~t~i~g-a~t'o-r~)----
will be available to answer any questions I may have. If at any time, I feel my questions have not been adequately answered, I may request to speak with a member of the Medical Center Institutional Review Board. I understand that I am free to withdraw this consent and discontinue participation in this project at any time without prejudice to my/my child's medical care. I have received a copy of this informed consent document.
I understand that biomedical or behavioral research such as that in which I have agreed to participate, by its nature, involves risk of injury. In the event of physical injury resulting from these research procedures, emergency medical treatment will be provided at no cost, in accordance with the policy of Loyola University Medical Center. No additional free medical treatment or compensation will be provided except as required by Illinois law.

85
In the event you believe that you have suffered any physical injury as the result of participation in the research program please contact Dr. R.J. Blumenthal, Chairman, Institutional Review Board for Portection of Human Subjects at the Medical Center, telephone (312) 531-3384.
(Signature: patient/parent/legal representative)
(Signature: witness to signatures)

APPROVAL SHEET
The thesis submitted by Stavros Papaconstantinous, D.D.S. has been read and approved by the following committee:
Hoerman, Kirk C., D.D.S., M.S. Director, Dental Auxiliary Utilization Program, Loyola
Klapper, Lewis, D.M.D., M.Sc.D., D.Sc. Assistant Professor and Chairman, Orthodontic Department, Loyola.
Spencer, Herta, M.D. Chief Metabolic Section, Veteran Administration Hospital, Hines Professor of Medicine, Loyola
The final copies have been examined by the director of the thesis and the signature which appears below verifies the fact that any necessary changes have been incorporated and that the thesis is now given final approval by the Committee with reference to content and form.
The thesis is therefore accepted in partial fulfillment of the requirements for the degree of Master of Science.
71 1'-1/f/1 I
Date Director's Signature