characterization of historical ceramics: a case study
TRANSCRIPT

Romanian Reports in Physics 72, 801 (2020)
CHARACTERIZATION OF HISTORICAL CERAMICS: A CASE STUDY
R.C. FIERASCU1, I. FIERASCU1*, A.M. BAROI1, R.I. BRAZDIS1, T. FISTOS1, C.A. NICOLAE1, V. RADITOIU1, I.C. INEL2,3, V. SAVA3
1 National Institute for Research & Development in Chemistry and Petrochemistry – ICECHIM Bucharest, 202 Spl. Independentei, 060021 Bucharest, Romania
2 National Museum of the Union, Alba Iulia, Romania, 12–14 Mihai Viteazu Str., 510010 Alba Iulia, Alba, Romania
3 Arad Museum Complex, 1 George Enescu Sq., 310131 Arad, Romania * Corresponding author: [email protected]
Received October 6, 2019
Abstract. Many scientific disciplines contribute with their specific methods of investigation, to the formation of a real image of different ancient objects. For ceramic materials, the use of analytical methods (especially those based on physical phenomena) presents a great importance: they can offer information regarding the raw materials, human traditions and regional history. The study presents the archaeometrical characterization of ceramic artifacts with a high historical value. The artifacts were collected from A1_1 Sagu site (Arad county), being dated to approx. 1600–1250 BC, belonging to an unfortified Late Bronze Age (LBA) settlement. Due to the impressive amount of ceramic material found and the large area the settlement covered, the mentioned site represents a LBA landmark of the region. The artifacts were analyzed using X-ray diffraction, X-ray fluorescence, thermal analysis, FTIR spectroscopy and optical microscopy. The analytical results obtained confirmed a common origin for the three analyzed samples, similar to other Late Bronze Age pottery discovered in Transylvania. The ceramic artefacts are of low-calcium nature, with a high iron content; the presence of hematite in all the samples, can define the technique used for firing: most probably, the process was ended in oxidizing atmosphere and it can also be correlated with an increased firing temperature. The elemental and mineralogical composition can be further used for the development of provenance maps of Romanian ceramic artefacts.
Key words: ceramic materials, non-destructive techniques, archaeometrical
characterization.
1. INTRODUCTION
The historical and analytical analysis of different discovered artifacts is a good instrument to offer information related to ancient societies [1]. From trans disciplinary studies can be obtained information regarding the materials, manufacture technology (especially the firing techniques) and socio-economic aspects of that time. For a complete and complex characterization of these type of ancient objects, the most suitable techniques are the non-destructive methods (based on X-rays) or micro-destructive techniques (such as the spectroscopic or thermal methods), which
Article no. 801 R.C. Fierascu et al. 2
can offer a “fingerprint” of phases formed during firing [2] or information regarding the used material for production of the ceramic objects. To understand past manufacture production, it is “a must” to know chemical composition of the objects. In order to understand ancient people’s habits, as well as to identify the artefacts’ composition and origin, analytical investigation of the archaeological materials represents a key tool [3].
The late Bronze Age (LBA) settlement Şagu-Site A1-1 is the most representative unfortified LBA settlement, through the abundance of archaeological materials discovered and their chronological complexity [4]. Archaeologists discovered archaeological features in 2010, during the construction of Arad Timisoara highway. The area of excavation was of 720 × 40 m, LBA settlement having only 530 m. In this section, most of the objects were identified from the LBA, which means a density of 1 complex at 69 m2. From a chronological point of view, the settlement begins to be inhabited during LBA I but also continues in the LBA II stage when it reaches the maximum of expansion. Due to the various discoveries related to the practice of pottery, metallurgy and agriculture, the impressive amount of ceramic material, and the large area that was excavated, the Şagu “Sit A1_1” depicts a LBA II landmark in the studied region.
2. MATERIALS AND METHODS
2.1. SITE LOCATION AND ARCHAEOLOGICAL MATERIALS
The settlement of Şagu is located near the city of Arad (Arad county), along the national road 69 that connects Arad and Timişoara. Site “A1_1” was identified between Şagu and Cruceni, and the geographical coordinates of the site are: latitude N46°03’25.52’’, longitude: E21°18’33.99’’, absolute altitude – between 140 and 141 m. Excavation site and its characteristics were previously extensively described [4].
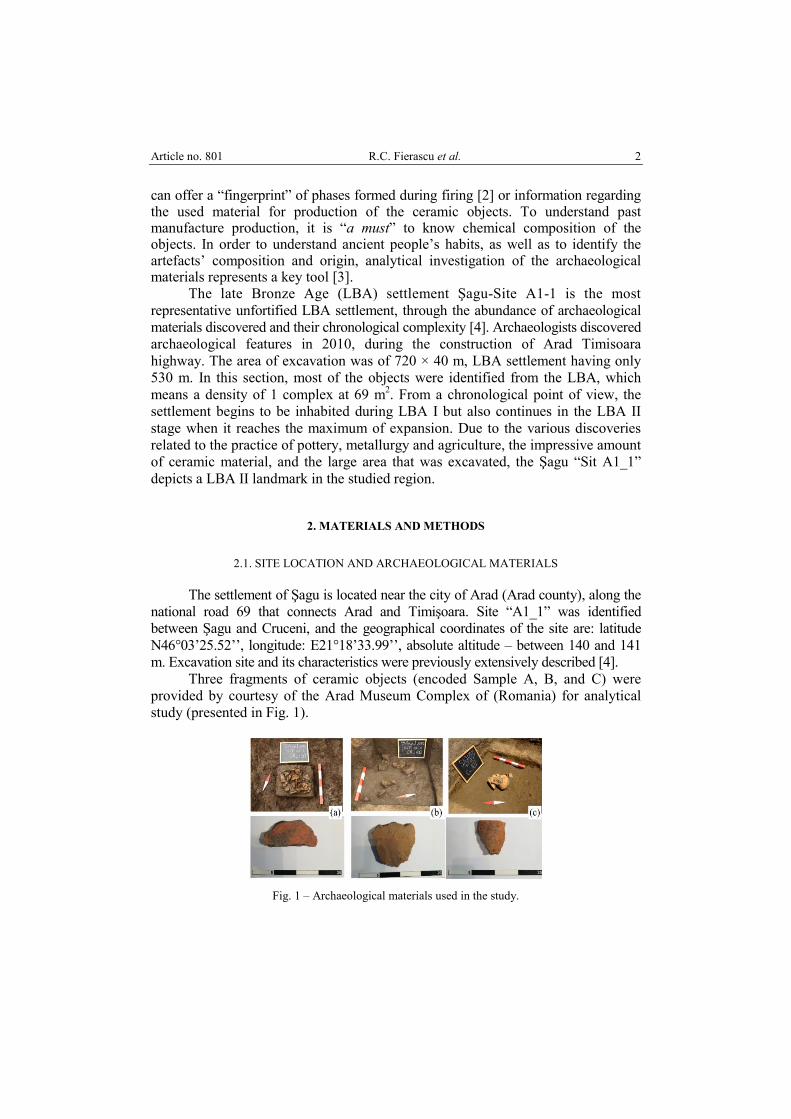
Three fragments of ceramic objects (encoded Sample A, B, and C) were provided by courtesy of the Arad Museum Complex of (Romania) for analytical study (presented in Fig. 1).
Fig. 1 – Archaeological materials used in the study.

Characterization of historical ceramics Article no. 801 3
Sample A (museum encoding Cx. 100). In the culture level, an agglomeration of several ceramic fragments from a broken vessel was identified. There was a lot of burning in the vessel, small pieces of adobe, some vitrified and charcoal. The ceramic fragment was taken from the described vessel.
Sample B (Cx. 102). Agglomeration of ceramic fragments were discovered in the settlement. The fragments seem to come from a single pot, broken in place. The ceramic fragment was taken from the described vessel.
Sample C (Cx. 107). At the settlement, an agglomeration of adobe and intense burning was discovered. In some places oven wall were observed; some fragments come from its lid. Among the remains of the furnace were discovered various ceramic fragments, including a whole vessel. The ceramic fragment was taken from the entire vessel discovered among the remains of the oven.
These vessels were used for different purposes, preservation in brine, fermentation, etc. [4].
As can be seen from the images, all samples are curved; as surface analyses were performed on both sides of the artifacts, the samples will be referred to as convex and concave.
2.2. ANALYTICAL CHARACTERIZATION METHODS
The ceramic materials were studied using an appropriate methodology: in the first step, optical microscopy was applied in order to identify the possible inclusions in the ceramics, as well as for the analysis of possible surface features that cannot be identified upon visual inspection [5]; the microscopical evaluation was performed using an OPTIKA B-150DBR optical microscope.
For the primary evaluation of the ceramic composition was selected a non-destructive technique (X-ray fluorescence spectrometry), using two types of equipment, with different characteristics: a portable XRF spectrometer Olympus VANTA C (40 kV X-ray tube with rhodium anode, Silicon Drift Detector, in Geo-Chem configuration) and an energy-dispersive laboratory energy-dispersive spectrometer PW4025 (type MiniPal 2, PANalytical, B.V., The Netherlands), equipped with a Si-PIN detector. Determinations were performed at 20 kV and automatic current intensity, for 300 seconds, in Helium atmosphere. Probably, the most appropriate technique for the analysis of ceramic artefacts, X-ray diffraction was performed using a Rigaku SmartLab equipment, operated at 45 kV and 200 mA, CuKα radiation (1.54059 Å), parallel beam configuration (2θ/θ scan mode); the components were identified using the Rigaku Data Analysis Software PDXL 2, database provided by ICDD. For all the presented analyses, no sampling was required. The X-ray-based techniques were selected considering their proven ability to characterize the historical artifacts with minimum or no damage on the analyzed objects [5, 6].
The analytical evaluation was completed with the application of FTIR spectrometry and thermal analyses. FTIR analyses were performed using a Jasco

Article no. 801 R.C. Fierascu et al. 4
FTIR 6300 spectrometer equipped with a Specac ATR Golden Gate (KRS5 lens), in the 400–4000 cm–1 range (32 accumulations at a resolution of 4 cm–1). Thermal analyses were performed on a Q600 instrument (TA Instruments), DSC-TGA Standard module, using 100 µl alumina sample pans, at a heating rate of 20°C/min, from room temperature to 1030°C, using air (99.999%) as purge gas (30 ml/min).
For FTIR and thermal analyses, a few milligrams of ceramic material was liberated from each sample using a scalpel blade, without visibly damaging the artefacts.
3. RESULTS AND DISCUSSION
Optical microscopy images of the artefacts are pesented in Fig. 2.
Fig. 2 – Optical microscopy images of the analyzed materials.
Although optical microscopy on ceramic artifacts is usually applied on thin sections collected from the objects [7], we have chosen not to perform this type of sampling, in order to preserve the integrity of the materials. Thus, even though the analysis is not as accurate as a thin section evaluation, on all samples presented in Fig. 2 there can be observed the presence of what is most probably quartz inclusions. In the same time, the presence of black stains (especially visible on sample A) could be associated either with different minerals present, or can be burning evidences remaining on the artefact after cleaning procedures performed by the archaeologists.
The portable XRF analyses were performed directly on the ceramic artifacts. Although having its limitations for the analysis of ceramic samples [8], especially related to the sensitivity, precision, accuracy, and small area analyzed, the technique is not only fast, but can be applied for the analyses of larger objects, without the need for sampling, thus avoiding the shortcomings of the laboratory XRF instruments. The results of the analyses are presented in Table 1.

Characterization of historical ceramics Article no. 801 5
Table 1
Results of the portable XRF measurements (results are presented in mg/kg and represents the average of three determinations on points randomly selected on the surface of the artefacts)
Sample Element A convex A concave B convex B concave C convex C concave
Mg < LOD < LOD 1.2% ± 0.26 2.91% ± 0.93 < LOD < LOD Al 5.21% ± 0.9 3.39% ± 0.48 4.3% ± 0.6 4.62% ± 0.45 3.24% ± 0.38 3.26% ± 0.56 Si 15.1% ± 1.08 15.65% ± 0.97 18.17% ± 1.3 16.21% ± 1.18 11.64% ± 0.21 11.11% ± 0.15P 0.28% ± 0.09 0.06% ± 0.01 < LOD 0.12% ± 0.05 603 ± 96 0.18% ± 0.02 K 1.44% ± 0.19 1.33% ± 0.16 1.90% ± 0.25 1.64% ± 0.22 1.25% ± 0.11 1.55% ± 0.14 Ca 0.87% ± 0.18 0.59% ± 0.19 0.87% ± 0.14 0.99% ± 0.11 0.71% ± 0.01 0.49% ± 0.01 Ti 0.65% ± 0.09 0.57% ± 0.09 0.49% ± 0.07 0.58% ± 0.05 0.61% ± 0.01 0.61% ± 0.01 Cr < LOD 106 ± 18 < LOD 129 ± 17 < LOD 119 ± 18 Mn 409 ± 57 543 ± 63 847 ± 81 443 ± 39 909 ± 58 351 ± 29 Fe 5.83% ± 0.32 5.46% ± 0.33 5.11% ± 0.23 5.33% ± 0.18 5.47% ± 0.13 6.24% ± 0.14 Ni 72 ± 15 68 ± 27 < LOD 93 ± 6 110 ± 18 89 ± 9 Cu 59 ± 4 99 ± 6 < LOD 80 ± 6 88 ± 6 74 ± 5 Zn 176 ± 4 173 ± 5 186 ± 12 136 ± 4 192 ± 5 185 ± 5 Sr 130 ± 2 136 ± 2 165 ± 1 167 ± 2 162 ± 2 130 ± 2 Zr 229 ± 2 196 ± 3 201 ± 10 201 ± 3 199 ± 3 198 ± 3 Rb 149 ± 2 153 ± 2 124 ± 6 139 ± 2 153 ± 2 173 ± 2 Mo 26.7 ± 1 29.6 ± 2 52.9 ± 5 30 ± 1 48.1 ± 2 45.4 ± 2 Pb 57.4 ± 2 41 ± 3 74.8 ± 7 26.3 ± 2 61.5 ± 3 49.3 ± 3 LE 70.45% ± 1.07 72.77% ± 1.21 67.72% ± 2.65 67.38% ± 1.67 76.82% ± 0.31 76.37% ± 0.29
Legend: LOD – limit of detection; LE – light elements.
Evaluation of the artefacts composition by laboratory XRF is presented in Fig. 3.
2 4 6 80
10000
20000
30000
40000
FeKb
FeKa
MnKa
CrKaTiKa
CaKaKKa
RhLa
SKa
SiKa
Inte
nsity
(a.u
.)
Energy (keV)
C concave C convex B concave B convex A concave A convex
AlKa
Fig. 3 – XRF spectra of the analyzed materials.
The XRF analysis performed using laboratory equipment (results presented in Table 2) shows a good concordance with the portable instrument.

Article no. 801 R.C. Fierascu et al. 6
Table 2
Results of the laboratory XRF measurements for the major elements identified (results are presented in % and represents the mean of three determinations)
Sample Element A convex A concave B convex B concave C convex C concave
MgO 0.7 ± 0.1 0.8 ± 0.1 0.9 ± 0.12 0.9 ± 0.21 0.7 ± 0.2 0.8 ± 0.21 Al2O3 22.4 ± 0.2 23.3% ± 0.18 21.3 ± 0.2 21.4 ± 0.13 21.9 ± 0.15 21.5 ± 0.21 SiO2 53.9 ± 0.9 53.9 ± 1.4 54.5 ± 0.3 54.2 ± 0.22 56.8 ± 0.34 55.6 ± 0.42 P2O5 1.7 ± 0. 1 2.4 ± 0.2 2.1 ± 0.21 2.0 ± 0.2 1.5 ± 0.22 1.2 ± 0.19 SO3 0.53 ± 0.11 0.7 ± 0.1 0.51 ± 0.1 0.51 ± 0.12 0.68 ± 0.16 0.81 ± 0.08 Cl 2.0 ± 0.17 2.55 ± 0.25 1.9 ± 0.14 2.0 ± 0.11 2.35 ± 0.29 2.3 ± 0.15
K2O 2.47 ± 0.1 2.34 ± 0.23 2.45 ± 0.2 2.33 ± 0.09 2.38 ± 0.13 2.42 ± 0.1 CaO 1.36 ± 0.1 1.42 ± 0.08 1.78 ± 0.2 1.91 ± 0.21 1.60 ± 0.29 1.52 ± 0.32 TiO2 1.16 ± 0.1 1.13 ± 0.1 1.03 ± 0.2 1.04 ± 0.2 1.01 ± 0.2 1.02 ± 0.2 Fe2O3 9.86 ± 0.32 9.27 ± 0.46 9.90 ± 0.2 9.39 ± 0.2 7.50 ± 0.3 9.3 ± 0.41
Besides the elements presented in Table 2, minor elements (V, Cr, Mn, Cu,
Zn) were also detected in all the analyzed samples. As it can be seen from both analyses, the ceramics can be categorized as Ca-poor
ceramics [2]. In the same time, the samples composition is dominated by the presence of Al and especially Si, their nature remaining to be established by X-ray diffraction. The presence of other elements in the samples is due to their presence as impurities in the original clay. A very interesting feature of the samples is represented by the presence of Sr and Zr, in a relatively constant amount (as determined by portable XRF) which it would suggest a common origin of the clay used for the manufacturing of all three samples.
From the portable XRF results, a Rb-Fe-Sr scattergram can be constructed, in order to compare our results with other studies [9] (Fig. 4).
0 25 50 75 1000
25
50
75
1000
25
50
75
100
Fe/1000 (mg/kg)
Sr (m
g/kg
)
Rb (mg/kg) Fig. 4 – Rb-Fe-Sr scattergram (normalized values) obtained for the analyzed samples.
Fe concentration was divided by 1000 in order to plot the values on a similar scale.

Characterization of historical ceramics Article no. 801 7
The elements were selected considering several characteristics, that makes them good indicators, in order to be used for further comparison with other LBA ceramics: Rb is commonly found as trace element of other minerals (especially K minerals, such as muscovite) being able to act as a marker for the original clay used; Fe is commonly present in ceramics, while Sr, commonly found as carbonates or sulfates, is usually associated with calcium minerals [9]. Although the high Rb content makes the studied samples difficult to compare with literature data [9], the ternary plot presented in Fig. 4 represents a good instrument for the development of compositional maps for the specific Romanian area studied.
Using the results obtained by laboratory XRF, two indices can be calculated, defining the elemental composition of the samples [10]:
– Chemical Index of Alteration (CIA), defined as:
2 3
2 3 2 2
Al OCIA 100;Al O CaO Na O K O
(1)
– Index of Compositional Variance (ICV), defined as:
2 3 2 2 2
2 3
Fe O K O Na O CaO MgO MnO TiOICV .Al O
(2)
Considering the equations described above, for the analyzed samples, the obtained results ranged for CIA from 74.72 (sample B concave) to 79.47 (A concave), respectively for ICV from 0.75 (C convex) to 0.92 (B concave). The results confirm the common origin. The relatively high CIA values suggests a medium chemical degradation effect. The increase of CIA values usually indicated, as other authors also reported [10], an increase of the clay mineral component, due to the re-alteration of sedimentary rocks or to newly deposited sediments (that could also be correlated with an > 20% Al2O3 content). As the ICV varies between 0.01 (clay minerals) to 1000 (silicates), our results suggest the addition of extra minerals (such as muscovite) in small amounts in the samples. Considering the results for each individual sample (defined as the average of the results obtained for the two sides – presented in Table 3), it can be observed that the composition of the three samples is very similar, lacking any significant differences. This is extremely visible when plotting the major elements (Al2O3-Fe2O3-SiO2 and Al2O3-Fe2O3-CaO) (Fig. 5). In the same time, from the CIA value, it can be observed a much more homogeneous nature of sample C (aspect also relevant from the XRF determinations).
Comparing our results with other studies on bronze age ceramics, it can be noted that the calcium content clearly differentiates our samples to those of Anatolian origin [10], placing them closer to Late Bronze Age metallurgical ceramics discovered in Cyprus [11].
Article no. 801 R.C. Fierascu et al. 8
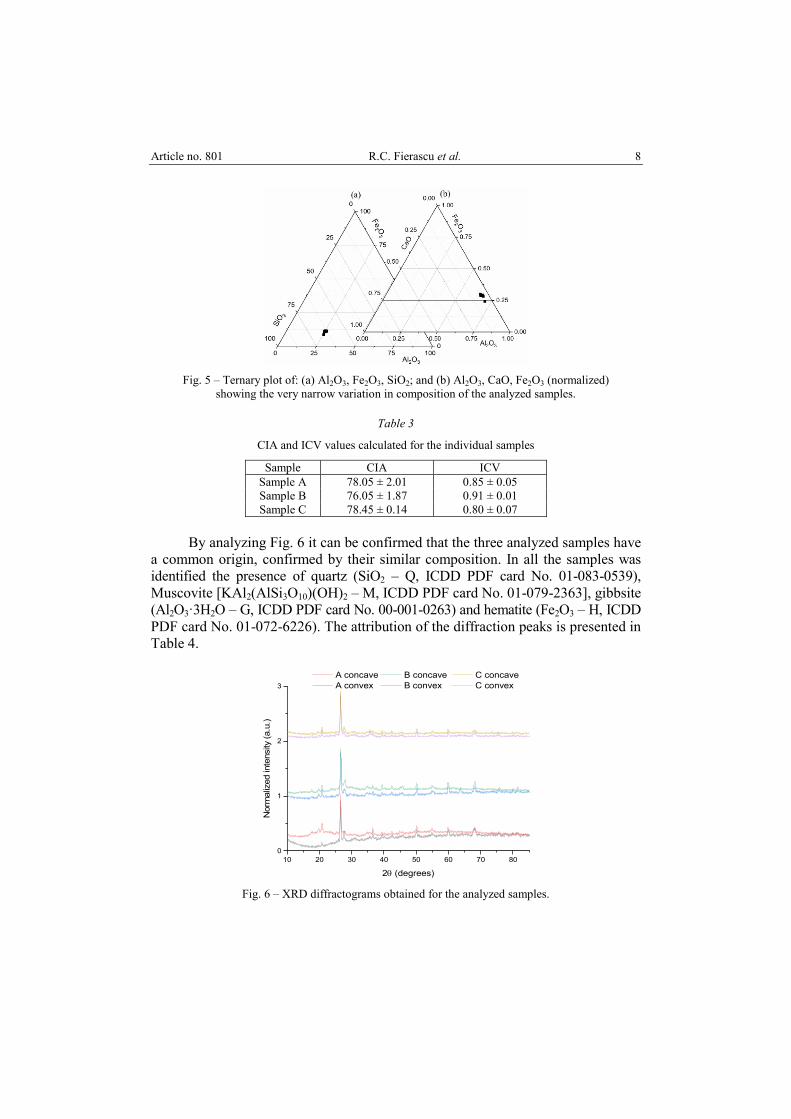
Fig. 5 – Ternary plot of: (a) Al2O3, Fe2O3, SiO2; and (b) Al2O3, CaO, Fe2O3 (normalized)
showing the very narrow variation in composition of the analyzed samples.
Table 3
CIA and ICV values calculated for the individual samples
Sample CIA ICV Sample A 78.05 ± 2.01 0.85 ± 0.05 Sample B 76.05 ± 1.87 0.91 ± 0.01 Sample C 78.45 ± 0.14 0.80 ± 0.07
By analyzing Fig. 6 it can be confirmed that the three analyzed samples have
a common origin, confirmed by their similar composition. In all the samples was identified the presence of quartz (SiO2 – Q, ICDD PDF card No. 01-083-0539), Muscovite [KAl2(AlSi3O10)(OH)2 – M, ICDD PDF card No. 01-079-2363], gibbsite (Al2O3·3H2O – G, ICDD PDF card No. 00-001-0263) and hematite (Fe2O3 – H, ICDD PDF card No. 01-072-6226). The attribution of the diffraction peaks is presented in Table 4.
10 20 30 40 50 60 70 800
1
2
3
Nor
mal
ized
inte
nsity
(a.u
.)
2q (degrees)
A concave B concave C concave A convex B convex C convex
Fig. 6 – XRD diffractograms obtained for the analyzed samples.

Characterization of historical ceramics Article no. 801 9
Table 4
Composition of sample A, as determined by XRD
2q (degrees) Phase (hkl) 17.71 M (0,0,4); 19.68 M (0,2,0); 20.78 Q (1,0,0); M (1,1,1); G (1,1,0) 22.68 M (1,1,2); 23.52 M (0,2,3) 24.29 H (0,1,2) 25.44 M (1,1,–4) 26.58 Q (1,0,1); M (0,2,4); G (1,1,2) 27.62 M (0,0,6); G (–1,1,2) 29.62 M (0,2,5) 31.04 M (1,1,5) 33.40 H (1,0,4) 35.61 M (1,3,0); H (1,1,0) 36.54 Q (1,1,0) 39.37 Q (0,1,2); M (1,1,7); G (3,1,2) 40.22 Q (1,1,1); M (1,1,–8); G (0,2,2) 42.38 Q (2,0,0); M (1,3,5) 45.07 G (2,1,4) 45.81 Q (0,2,1); M (0,4,5); 49.26 M (2,2,–7) 50.08 Q (1,1,2); M (0,2,10); H (0,2,4) 54.89 Q (2,0,2); M (0,4,8); H (1,1,6); G (–1,2,4) 59.91 Q (2,1,1); M (0,2,12) 64.12 Q (1,1,3); M (1,5,7); H (3,0,0); G (4,1,5) 68.16 Q (2,1,2); M (1,5,–9) 73.40 Q (0,1,4); M (2,4,–11) 75.54 Q (0,3,2); M (2,6,4) 79.85 Q (2,2,1); H (2,2,3); G (0,0,8) 81.27 Q (3,1,0); M (3,1,11); H (1,2,8)
Regarding other studies on LBA ceramic fragments discovered in Romania,
the analyzed samples are clearly differentiated by the absence of plagioclase minerals or K-feldspars, as observed by Ionescu et al. [12] in Late Bronze Age pottery from Ilişua, Transylvania. The mineralogical study strongly supports the local production of the ceramic materials. The hematite phase can also be explained either as present in the clay used for manufacturing, as it represents a very common mineral found in soil [13], or by its formation during firing, as it can be obtained through the transformation of lepidocrocite around the temperature of 500°C [14].
As can already be expected, the ceramic samples present very similar FTIR spectra (Fig. 7), only minor differences being observed both between different sides of each sample and between different samples. The spectra can be interpreted as follows: the band at approx. 1630 cm–1 is due to the H-O-H bending of water molecule, while the one at 3400 cm–1 is due to the O-H stretching [15], a consequence of the moisture present in all the samples. The absence of the common ceramic

Article no. 801 R.C. Fierascu et al. 10
mineral wollastonite (as suggested by the low calcium content and by the results of the XRD analyses) is further confirmed by FTIR analysis (the mineral presenting a strong intensity peak around 1080 cm–1, absent in all the samples) [15]. The rest of the peaks identified in the FTIR spectra are grouped all under 1000 cm–1: the very intense band at approx. 985 cm–1 can be assigned to muscovite with three Si atoms [16], as can also be attributed the bands at 685, 475 and 415 cm–1 (bending of Si-O-Al group, bending of Si-O-Si group, and Al-OH librational modes, respectively) [17]; quartz presents specifics bands at 797, 776, 510 and 450 cm–1, respectively [18]. The presence of gibbsite is suggested by the peaks appearing at approx. 750 and 660 cm–1 [19]. Finally, hematite presents specific peaks in the studied region, at 560 and 476 cm–1 [20].
4000 3500 3000 2500 2000 1500 1000 5000
25
50
75
100
125
150
175
Tran
smitt
ance
(a.u
.)
Wavenumber (cm-1)
A concave B concave C concave A convex B convex C convex
Fig. 7 – FTIR spectra of the ceramic artifacts.
The results of the thermal analyses (TGA/DTG/DSC) are presented in Fig. 8 and Table 5.
Fig. 8 – Thermal analyses of the analysed samples.
Characterization of historical ceramics Article no. 801 11
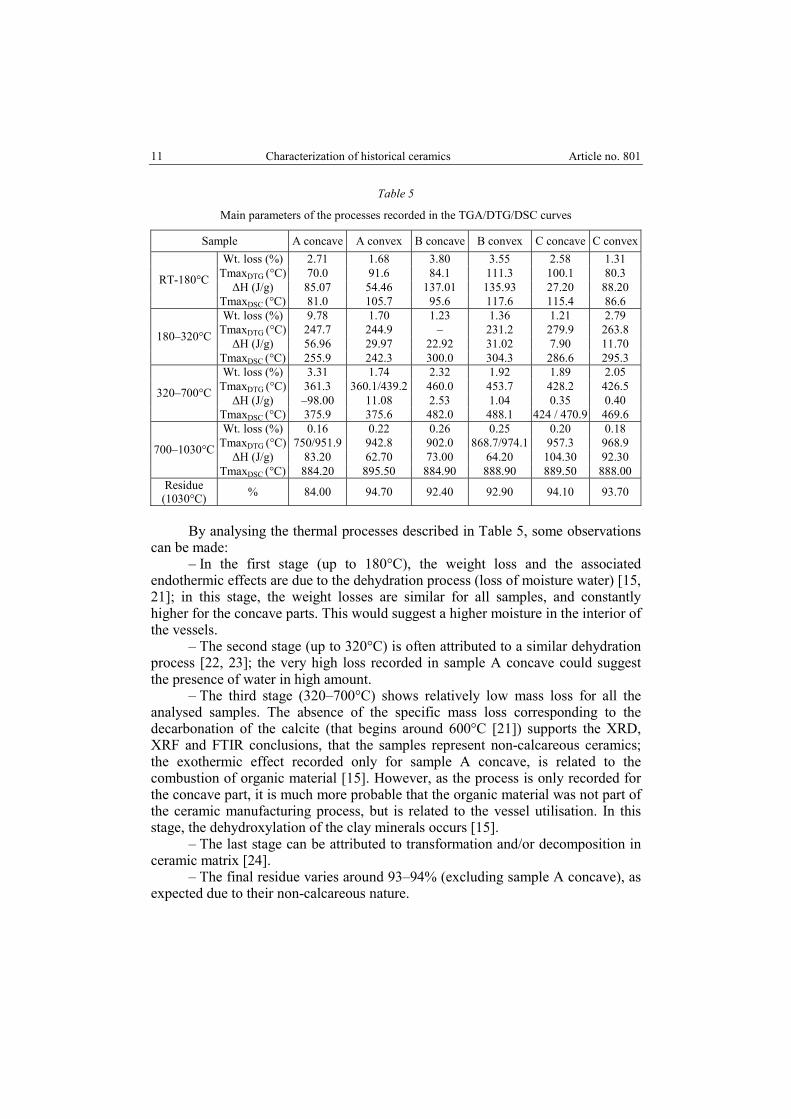
Table 5
Main parameters of the processes recorded in the TGA/DTG/DSC curves
Sample A concave A convex B concave B convex C concave C convex Wt. loss (%) 2.71 1.68 3.80 3.55 2.58 1.31
TmaxDTG (°C) 70.0 91.6 84.1 111.3 100.1 80.3 ΔH (J/g) 85.07 54.46 137.01 135.93 27.20 88.20 RT-180°C
TmaxDSC (°C) 81.0 105.7 95.6 117.6 115.4 86.6 Wt. loss (%) 9.78 1.70 1.23 1.36 1.21 2.79
TmaxDTG (°C) 247.7 244.9 – 231.2 279.9 263.8 ΔH (J/g) 56.96 29.97 22.92 31.02 7.90 11.70 180–320°C
TmaxDSC (°C) 255.9 242.3 300.0 304.3 286.6 295.3 Wt. loss (%) 3.31 1.74 2.32 1.92 1.89 2.05
TmaxDTG (°C) 361.3 360.1/439.2 460.0 453.7 428.2 426.5 ΔH (J/g) –98.00 11.08 2.53 1.04 0.35 0.40 320–700°C
TmaxDSC (°C) 375.9 375.6 482.0 488.1 424 / 470.9 469.6 Wt. loss (%) 0.16 0.22 0.26 0.25 0.20 0.18
TmaxDTG (°C) 750/951.9 942.8 902.0 868.7/974.1 957.3 968.9 ΔH (J/g) 83.20 62.70 73.00 64.20 104.30 92.30 700–1030°C
TmaxDSC (°C) 884.20 895.50 884.90 888.90 889.50 888.00 Residue
(1030°C) % 84.00 94.70 92.40 92.90 94.10 93.70
By analysing the thermal processes described in Table 5, some observations
can be made: – In the first stage (up to 180°C), the weight loss and the associated
endothermic effects are due to the dehydration process (loss of moisture water) [15, 21]; in this stage, the weight losses are similar for all samples, and constantly higher for the concave parts. This would suggest a higher moisture in the interior of the vessels.
– The second stage (up to 320°C) is often attributed to a similar dehydration process [22, 23]; the very high loss recorded in sample A concave could suggest the presence of water in high amount.
– The third stage (320–700°C) shows relatively low mass loss for all the analysed samples. The absence of the specific mass loss corresponding to the decarbonation of the calcite (that begins around 600°C [21]) supports the XRD, XRF and FTIR conclusions, that the samples represent non-calcareous ceramics; the exothermic effect recorded only for sample A concave, is related to the combustion of organic material [15]. However, as the process is only recorded for the concave part, it is much more probable that the organic material was not part of the ceramic manufacturing process, but is related to the vessel utilisation. In this stage, the dehydroxylation of the clay minerals occurs [15].
– The last stage can be attributed to transformation and/or decomposition in ceramic matrix [24].
– The final residue varies around 93–94% (excluding sample A concave), as expected due to their non-calcareous nature.

Article no. 801 R.C. Fierascu et al. 12
By analysing the results of the analytical study, some conclusions can be drawn: – all the ceramic samples have a common origin (regarding the raw materials
used) and were obtained using similar manufacturing techniques; – the ceramic artefacts are of low-calcium nature, with a high iron content; – the presence of hematite in all the samples, can define the technique used
for firing: most probably, the process was ended in oxidizing atmosphere [24]; it must also be considered, that in Ca-poor ceramics, the hematite content was found to increase with the firing temperature [25];
– by observing the red colour of the artefacts, corroborated with the previous observation and literature data [24, 25], it can be suggested a firing temperature over 800°C;
– the presence of the DSC event around 880°C and the absence of any exothermic peaks in the region above 900°C would suggest a firing temperature bellow this value [15].
4. CONCLUSIONS
For ceramic materials, the use of analytical methods presents a great importance: they can offer information regarding the raw materials, human traditions and regional history. In this study, three samples from an LBA settlement (A1_1 Sagu site, Arad county) were analysed using X-ray diffraction, X-ray fluorescence, thermal analysis, FTIR Spectroscopy and optical microscopy. From the corroborated results was confirmed a common origin for the three analysed samples, similar to other Late Bronze Age pottery discovered in Transylvania. The ceramic artefacts are of low-calcium nature, with a high iron content. Using these findings, corroborated with the lack of exothermic peaks above 900°C, the firing process can be suggested (being ended in oxidizing atmosphere), while the firing temperature can be estimated between 800 and 880°C. Mineralogical studies were able to provide the composition of the raw materials, a good starting point for future development of a map correlating the ceramic composition with the clay composition in different Romanian areas, a tool that would prove very useful in supporting local production of the ceramic objects.
Acknowledgements. The present work was supported by a grant of the Romanian National Authority for Scientific Research and Innovation, CNCS/CCCDI – UEFISCDI, project number PN-III-P1-1.2-PCCDI-2017-0413, contract 50PCCDI/2018, within PNCDI III.
REFERENCES
1. L. Medeghini, M. Sala, C. De Vito and S. Mignardi, Ceram. Int. 45, 11457–11467 (2019). 2. R.M. Ion, M.L. Ion, R.C. Fierascu, S. Serban, I. Dumitriu, C. Radovici, I. Bauman, S. Cosulet
and V.I.R. Niculescu, J. Therm. Anal. Calorim. 102, 393–398 (2010).

Characterization of historical ceramics Article no. 801 13
3. A. Brysbaert, P. Siozos, M. Vetters, A. Philippidis and D. Anglos, J. Archaeol. Sci. 83, 49–61 (2017).
4. V. Sava, G.P. Hurezan, and F. Mărginean, Ziridava. Studia Arheologica 26, 83–108 (2012). 5. M. El Amraoui, M. Haddad, L. Bejjit, S. Ait Lyazidi, and R. Lakhal, IOP Conf. Ser.: Mater. Sci.
Eng. 186, 012029 (2017). 6. S. Khrissi, M. Haddad, L. Bejjit, S. Ait Lyazidi, M. El Amraoui, and C. Falguères, IOP Conf.
Ser.: Mater. Sci. Eng. 186, 012028 (2017). 7. P.S. Quinn, Ceramic Petrography: The Interpretation of Archaeological Pottery & Related
Artefacts in Thin Section, Archaeopress Archaeology, Oxford, 2013. 8. R.H. Tykot, Appl. Spectrosc. 70, 42–56 (2016). 9. M. Morgenstein and C.A. Redmount, J. Archaeol. Sci. 32, 1613–1623 (2005). 10. B. Semiz, E. Abay, F. Dedeoğlu, E. Konakçi and A. Ozan, J. Mediterr. Archaeol. Archaeom. 18,
121–150 (2018). 11. A. Hein, V. Kilikoglou and V. Kassianidou, J. Archaeol. Sci. 34, 141–154 (2007). 12. C. Ionescu, V. Hoeck, and L.M. Ghergari, Appl. Clay Sci. 53, 466–475 (2011). 13. A.V. Oancea, G. Bodi, V. Nica, L.E. Ursu, M. Drobota, C. Cotofana, A.L. Vasiliu,
B.C. Simionescu and M. Olaru, J. Eur. Ceram. Soc. 37, 5079–5098 (2017). 14. A. Kara and A. İssi, Bol. Soc. Esp. Ceram. Vidr. 52, 42–47 (2013). 15. R. Palanivel and U. Rajesh Kumar, Rom. Journ. Phys. 56, 195–208 (2011). 16. J.D. Jordá, M.M. Jordán, R. Ibanco-Cañete, M.A. Montero, J.A. Reyes-Labarta, A. Sánchez and
M. Cerdán, Appl. Clay Sci. 115, 1–16 (2015). 17. M.R. Abukhadra and M. Mostafa, Sci. Total Environ. 667, 101–111 (2019). 18. C.M. Müller, B. Pejcic, L. Esteban, C. Delle Piane, M. Raven and B. Mizaikoff, Sci. Rep. 4, 6764
(2014). 19. P.A. Schroeder, Infrared Spectroscopy in clay science, Teaching Clay Science (CMS Workshop
Lectures, Vol. 11), The Clay Mineral Society, Aurora, 2002. 20. H.M. Zaid, J. Chem. Pharm. Res. 9, 29–33 (2017). 21. S. Shoval and Y. Paz, Appl. Clay Sci. 82, 113–120 (2013). 22. V.A. Drebushchak, L.N. Mylnikova and V.I. Molodin, J. Therm. Anal. Calorim. 90, 73–79
(2007). 23. V.A. Drebushchak, L.N. Mylnikova and T.N. Drebushchak, J. Therm. Anal. Calorim. 104, 459–466
(2011). 24. M. Bayazit, I. Işık, A. Issi and E. Genç, Appl. Clay Sci. 126, 180–189 (2016). 25. P. Holakooei, U. Tessari, M. Verde and C. Vaccaro, J. Therm. Anal. Calorim. 118, 165–176
(2014).

Article no. 801 R.C. Fierascu et al. 14