characterization of hop aroma using gc/ms, headspace trap ... · 3 hops are highly polar (acids,...
TRANSCRIPT

Introduction
Hops are a critical ingredient in beer. They provide an important balance to the malt in the taste of many beers. They also aid the
brewing process in precipitating out proteins, etc. during the boil. Hops also have preservative properties that help keep beer fresh and free from bacteriological attack.
Hops contribute to the taste of beer in three ways:
• Bittering–hopscontaincompoundssuchahumulonesthatareveryinsolublein water but isomerize on boiling to form isohumulones, which are partially soluble and impart the bitter flavor to beer.
• Flavoring–compoundssuchasterpenesandestersprovidethefruity,citrus,earthy, resiny flavors to many beers.
• Aromacompounds–thesearethevolatileorganiccompoundsthatmigrateinto the vapor above the head of beer and gives the beer its characteristic smell. This can be flowery, citrusy, fruity, etc. They form a very important part of the overall flavor of beer.
Characterization of Hop Aroma Using GC/MS, Headspace Trap and Olfactory Port
A P P L I C A T I O N N O T E
Author:Andrew Tipler
PerkinElmer, Inc. Shelton, CT
Gas Chromatography/Mass Spectrometry

2
There are many types of hops that deliver a very wide range of flavors. Hops need to be stored carefully and be used when fresh since the flavor will degrade as they age. Consequently there is a need to characterize the quality of hops so that the brewer can develop and deliver the required product.
Aromacharacterizationofhopsiscomplex;therearemanycompounds in hops that contribute to flavor. Table 1 lists the composition of typical hops and Table 2 lists some of the key aroma compounds. The traditional way to evaluate hop quality is touseanexperiencedbrewertoassessthehopsorganolepticallyby crushing a few of the hops in their fingers and smelling the released aroma. This is effective but not objective and lacks the quantitative information needed to make correct decisions on how to utilize the hops.
This application note describes a system that is able to provide both an objective chemical analysis of hop aroma using gas chromatography/mass spectrometry and, at the same time, provide the means for the user to monitor the olfactory character of each component as it elutes from the chromatographic column. Such an approach allows the user to gain a fuller characterization of a particular hop sample.
Analytical System
The analytical system comprises five main components:
HS TrapStatic headspace (HS) sampling is very suitedforextractingaromacompoundsoutofhops.Aweighedamountofhops(pellets or leaves) is placed in a glass vial andsealedasshowninFigure1.Thisvialisthenheatedinanovenatasetfixedtemperatureandforasetfixedtimeperiod.Aportionofthevaporisthenextractedfromthevialbytheheadspacesampling system and introduced into the GC column for separation and analysis.
Whileextremelyconvenient,staticheadspacesamplingonlydelivers a very small fraction of the headspace vapor into the GC column and so it is really best suited to high concentrations of compounds.Intheanalysisofcomplexsamples,itisoftenfoundthat low levels of some components are critical to the overall aroma of that sample. To increase the amount of sample value introduced into the GC column, a headspace trap system was used.
Using this technology, most or even the entire headspace vapor is passed through an adsorbent trap to collect and focus the VOCs. The trap is then rapidly heated and the desorbed components are transferred to the GC column. In this way, the amount of sample vapor entering the GC column can be increased by a factor of up to100x.Thistechniqueisideallysuitedforhoparomaanalysis.
Figures2to4aresimplifiedrepresentationsoftheHStrapoperation–thereareothervalvesandplumbingneededtoensure that sample vapor goes where it should and not anywhere else. Essentially, the principle is very similar to classical static headspace but at the end of the vial equilibration step, after the vapor is pressurized, it is fully vented through an adsorbent trap. This process may be repeated to effectively vent the entire headspace vapor through the adsorbent trap. Once the trap is loaded, it is rapidly heated and the desorbed VOCs are transferred to the GC column.
Figure 2. Schematic diagram of the HS trap system showing the equilibrated vial being pressurized with carrier gas.
column
Headspace Trap Sampler Gas Chromatograph
detector
trapseal
valve
vial
oven
Table 1. Composition of typical hops.
Component %
Vegetative material (cellulose, lignin, etc.) 40
Proteins 15
Total resins (bittering compounds) 15
Water 10
Ash 8
Lipids, wax, pectin 5
Tannins 4
Monosaccharides 2
Essential oils (flavor/aroma compounds) 0.5 to 2
Table 2. Key hop aroma compounds.
Component Comment
Myrcene Pungent flavor; normally oxidized during the boil into other flavor compounds such as linalool and geraniol and their oxides
Humulene Delicate and refined flavor characteristic of noble hops; broken down by boiling into oxidative flavors
Caryophyllene and farnesene Herbal spicy character -- not well characterized
Figure 1. Hops inside a headspace vial awaiting analysis.
3
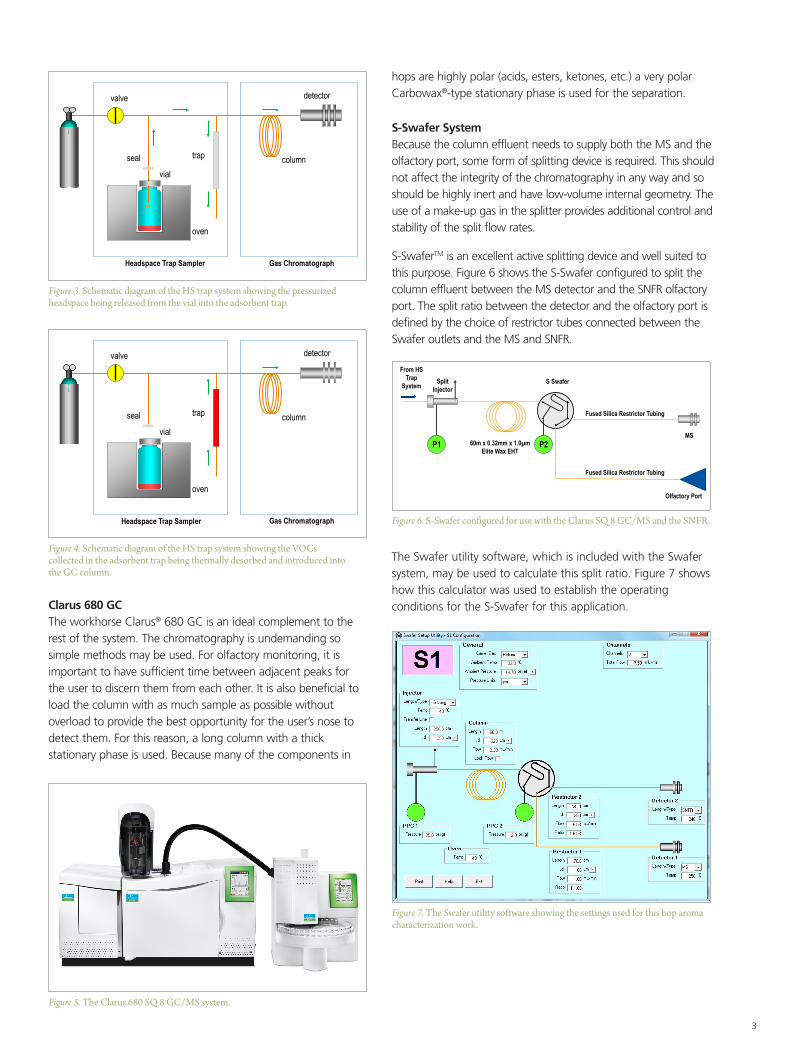
hops are highly polar (acids, esters, ketones, etc.) a very polar Carbowax®-type stationary phase is used for the separation.
S-Swafer SystemBecausethecolumneffluentneedstosupplyboththeMSandtheolfactory port, some form of splitting device is required. This should not affect the integrity of the chromatography in any way and so should be highly inert and have low-volume internal geometry. The use of a make-up gas in the splitter provides additional control and stability of the split flow rates.
S-SwaferTMisanexcellentactivesplittingdeviceandwellsuitedtothispurpose.Figure6showstheS-SwaferconfiguredtosplitthecolumneffluentbetweentheMSdetectorandtheSNFRolfactoryport. The split ratio between the detector and the olfactory port is defined by the choice of restrictor tubes connected between the SwaferoutletsandtheMSandSNFR.
The Swafer utility software, which is included with the Swafer system,maybeusedtocalculatethissplitratio.Figure7showshow this calculator was used to establish the operating conditions for the S-Swafer for this application. Clarus 680 GC
The workhorse Clarus®680GCisanidealcomplementtotherest of the system. The chromatography is undemanding so simplemethodsmaybeused.Forolfactorymonitoring,itisimportant to have sufficient time between adjacent peaks for the user to discern them from each other. It is also beneficial to load the column with as much sample as possible without overload to provide the best opportunity for the user’s nose to detectthem.Forthisreason,alongcolumnwithathickstationaryphaseisused.Becausemanyofthecomponentsin
Figure 3. Schematic diagram of the HS trap system showing the pressurized headspace being released from the vial into the adsorbent trap.
column
Headspace Trap Sampler Gas Chromatograph
detector
trapseal
valve
vial
oven
Figure 4. Schematic diagram of the HS trap system showing the VOCs collected in the adsorbent trap being thermally desorbed and introduced into the GC column.
column
Headspace Trap Sampler Gas Chromatograph
detector
trapseal
valve
vial
oven
Figure 6. S-Swafer configured for use with the Clarus SQ 8 GC/MS and the SNFR.
MS
Olfactory Port
S Swafer
60m x 0.32mm x 1.0µm Elite Wax EHT
From HS Trap
System Split Injector
Fused Silica Restrictor Tubing
Fused Silica Restrictor Tubing
P1 P2
Figure 5. The Clarus 680 SQ 8 GC/MS system.
Figure 7. The Swafer utility software showing the settings used for this hop aroma characterization work.

4
Analytical Conditions
Typical Chromatography
Figure9showstotalionchromatograms(TIC)offourtypical hops from different countries. Part of the German Hallertau is highlightedandisexpandedinFigure10.ThepoweroftheMSenables a particular peak to be identified from its mass spectrum (asshowninFigure11)bysearchingtheNISTspectrallibrarysuppliedwiththeClarusSQ8system.TheresultsofthissearcharegiveninFigure12.Resultsofthissearchverystronglyindicatethatthepeakelutingat36.72minutesis3,7-dimethyl-1,6-octadien-3-ol, otherwise known as linalool. Linalool is a very important aroma compound and will provide a delicate flowery aroma to the beer. The amount of linalool (or any other compound once identified) may be quantified by calibrating theGC/MSwithstandardmixturesofthiscompound.
Clarus SQ 8 Mass SpectrometerAmassspectrometerisanimportantpartofanaromacharacterization system. It’s important not only to detect and describe the aromas of the various components eluting from the GC column but to also to identify what those components are and possibly what their levels in the hops are.
TheClarusSQ8quadrupolemassspectrometerisideallysuitedfor this purpose and will quickly identify and quantify components usingclassicalspectrainthesuppliedNISTlibrary.Thissoftwareisalso able to interact with the olfactory information as described later in this document.
GC SNFR AccessoryFigure8showsapictureoftheSNFRaccessory.ThisisconnectedtotheGCviaaflexibleheatedtransferline.Thesplitcolumneffluent travels to the glass nose-piece through deactivated fused silica tubing.
While monitoring the aroma compounds eluting from the GC column, the user is able to capture vocal narration via a built-in microphone and aroma intensity by adjustment of a joystick.
Figure 8. The SNFR olfactory port accessory.
Headspace system PerkinElmer® TurboMatrix™ 110 HS Trap
Vial equilibration 80 °C for 15 minutes
Needle 120 °C
Transfer line 140 °C, column connected directly to HS trap
Carrier gas Helium at 25 psig
Dry purge 5 min
Trap Air toxics, 30 °C to 300 °C, hold for 5 min
Extraction cycles 1 with 40 psig extraction pressure
Table 3. HS Trap conditions.
Scan range m/z 35 to 350
Scan time 0.8 s
Interscan delay 0.1 s
Source temp 250 °C
Inlet line temp 250 °C
Table 5. MS conditions.
Olfactory port PerkinElmer SNFR
Transfer line 225 cm x 0.250 mm at 240 °C
Humidified air 500 mL/min with jar set to 37 °C
Table 6. Olfactory port conditions.
Sample preparation Hops (leaves or pellets) were ground with a rotary coffee grinder and 1 g was weighed into a sample vial and sealed
Vial Standard 22-mL vial with aluminum crimped cap with PTFE lined silicone septum
Table 8. Sample details.
Swafer PerkinElmer S-Swafer in the S1 configuration
Settings Developed using the Swafer utility software – see Figure 7
Table 7. Swafer conditions.
Gas Chromatograph/ PerkinElmer Clarus 680 SQ 8 Mass Spectrometer
Column 60 m x 0.32 mm x 1.0µm Elite-5MS connected directly to the HS trap
Oven 40 °C for 2 min, then 4 °C/min to 240 °C for 8 min
Carrier gas 13 psig at Swafer
Injector PSS at 300 °C, carrier gas off
Table 4. GC conditions.
Figure 9. Typical TIC chromatograms of four hop samples.
5.01 10.01 15.01 20.01 25.01 30.01 35.01 40.01 45.01 50.01 55.01Time0
100
%
0
100
%
0
100
%
0
100
%
Centennial Scan EI+ TIC
2.00e9
4.26 7.15
12.6812.36
10.89
14.54
23.97
27.0637.97
36.7433.96
32.3729.30
31.1735.48
55.0453.2744.2745.2347.00
50.45
G_Hallertau Scan EI+ TIC
2.00e9
4.26 6.30
7.77
12.68
11.58
14.52
19.34
22.9424.03 29.25
26.93 32.31
37.98
36.72
35.37
39.8144.24
46.13
55.0447.15
EK Goldings Scan EI+ TIC
2.00e9
5.47
4.26
6.30
7.75
12.6512.18
11.5814.49
18.5922.70
24.02 28.7324.9831.34
39.8137.98
35.4044.82
Saaz Scan EI+ TIC
2.00e95.70
4.26
5.47 6.28
7.14
15.60
12.63
12.33
14.39
17.19
26.9022.92
24.3629.22
28.4931.32
29.4334.04
32.28
36.71
35.30
38.0155.04
44.81

5
Figure 10. Highlighted detail from Figure 9.
60m x 0.32mm x 1.0um Elite waxHS
35.89 36.09 36.29 36.49 36.69 36.89 37.09 37.29 37.49 37.69 37.89 38.09 38.29Time0
100
%
G_Hallertau Scan EI+ TIC
1.60e937.98
36.72
37.65
Figure 11. Mass spectrum from peak highlighted in Figure 10.
60m x 0.32mm x 1.0um Elite waxHS
36 41 46 51 56 61 66 71 76 81 86 91 96 101 106 111 116 121 126 131 136 141 146 151 156m/z0
100
%
G_Hallertau 2448 (36.723) Cm (2445:2452-2431:2439) Scan EI+ 8.22e793.063971.0742
42.9691
39.0021
37.9944
54.9890
52.9759
50.9626
69.0731
67.0619
55.9955
57.0018
80.0677
79.0628
77.0528
83.0821 92.0597
84.0868
86.0961
121.1624
94.0681
107.117796.0762
97.0802 111.1313
117.1243
136.1390
122.1653134.1154125.1311
139.1459154.1760
Figure 12. Results from library search on mass spectrum shown in Figure 11.
Also known as linalool

6
Figure 14. TIC chromatograms of a further four hop sample.
5.01 10.01 15.01 20.01 25.01 30.01 35.01 40.01 45.01 50.01 55.01Time0
100
%
0
100
%
0
100
%
0
100
%
Willamette Scan EI+ TIC
2.00e9
5.67
4.26
6.27
15.95
12.62
10.8414.58
19.28
17.12
23.94
23.0736.71
33.96
29.4628.6726.51
24.33 32.3435.46
37.9840.82 55.0444.85
47.63
NorthernBrewer Scan EI+ TIC
2.00e926.99
36.7229.27
29.0934.0131.04 39.51 41.49
44.85
44.2758.1955.0653.27
47.00
Simcoe Scan EI+ TIC
2.00e9
24.09
25.01
36.7229.25
28.73
31.01 34.0232.30 35.36
39.05
38.03
41.49
44.82 47.00
45.98
55.0652.5249.19
Cascade Scan EI+ TIC
2.00e9
5.644.23
6.27
15.99
12.60
12.29 15.56
18.54
23.91
25.23 33.98
29.3028.2832.42
36.72
35.55 38.66
44.3052.52
49.2144.88
47.51
met
hylb
utan
ol
acet
one
β-pi
nene
β-ph
illan
dren
e
myr
cene
hum
ulen
e
cary
iphy
llene
β-fa
rnes
ene
α-pi
nene
limon
ene
linal
ool
Figure 15. Example of a hop chromatogram being reviewed within the TurboMass™ software with the audio narration and aroma intensity graphically overlaid.
Figure 13. Typical TIC chromatograms of four hop samples.
0
100
%
G_Hallertau Scan EI+ TIC
2.00e9
4.26 6.30
7.77
12.68
11.58
14.52
19.34
22.9424.03 29.25
26.93 32.31
37.98
36.72
35.37
39.8144.24
46.13
55.0447.15
acet
ic a
cid
acet
one
met
hylb
utan
ol
isov
aler
icac
id
isob
utyr
icac
id
myr
cene
5.01 10.01 15.01 20.01 25.01 30.01 35.01 40.01 45.01 50.01 55.01
Byperformingfurtheridentificationsofthechromatographicpeaks,aprofileofthehopcharactermaybeestablished.Figure13 shows further peaks identified in the German Hallertau chromatogrampreviouslyshowninFigure9.Annotatedpeaksaremainlyaliphaticacidswhichindicateadegreeofoxidationin the hops in this particular sample. The strongly flavored
myrcenepeakisrathersmallerthanexpected.Theseobservations indicate that this particular sample is rather old (whichwastrue–thiswasareallyoldsamplethathadbeenpoorly stored).
Figure14showschromatographyoffouradditionalhopsamples.

7
Olfactory Characterization
Figure15showsanexampleofahopchromatogramwiththeaudio narration and intensity recordings graphically overlaid. AudionarrationisstoredinastandardWAVfileformatthatmaybe replayed from this screen to the operator from any point in the displayed chromatogram by means of a simple mouse-click. The narrationWAVfilemayalsobeplayedbackfrommostmediaapplicationsincludingtheMicrosoft®MediaPlayer,whichisincluded with the Windows® operating systems. The audio data
Start Time 9/19/2013 2:39:02 PM
Duration 60.00
Time Stamp Spoken text Intensity
23.02 almost like a match 123.07 a sulfur smell 025.18 subtle 225.22 subtle 025.33 not quite sure what that was 025.70 nothing there 030.70 little off odor 133.67 foul smell 236.23 smell of cardboard must 036.35 bananas 236.82 almost mint 238.08 that was a nice fruit 338.20 very citrus 042.47 hot 442.50 pepper 242.70 again 342.82 it's an off odor 642.85 are very bad off order 643.08 a sweaty socks smell 643.72 that's a fruity smell 243.73 very pleasing 245.78 floral 246.30 a burning smell 246.37 burning match almost 247.02 pepper smell 147.95 pepper 148.93 sweet 149.13 a sweet smell 349.88 interesting smell 149.92 can't describe it 050.32 ah 350.35 medical smell again 450.40 medicinal 454.08 solvent 1
Project Name OKTOBERFEST.PRO
Sample Name 019-HallertauDry
Time Stamp Spoken text Intensity1.05 coming up on a minute 02.13 two minutes 05.15 a sweet smell 05.20 very faint 06.07 nothing there 06.65 very very faint smell 26.88 off order 37.12 like sour milk 27.25 sour milk 47.30 was a very good banana smell 57.35 fruity smell 48.18 like a sour milk 48.23 sour milk 49.17 fruit there 210.02 nothing there 010.10 large peak and I smell nothing 011.52 burning smell 211.58 almost woody 012.00 little sweet 112.45 almost a hint of coffee 013.22 that’s an off smell 313.25 a rancid smell 313.82 something 313.88 almost 013.90 medical 015.43 medical smell 215.47 is almost toffee like 215.57 very pleasing 416.43 off order 017.92 slight sweet 018.58 bubblegum 019.88 hint of something sweet 021.00 off order of skunk 321.08 definite skunk 522.90 something 3
Table 9. Typical output report showing text transcribed from the audio narration and the corresponding aroma intensity data.
maybetranscribedintotextatthetimeoftherecording.TheNuance® Dragon®NaturallySpeakingsoftwareperformsthisfunction.ItisincludedintheSNFRproduct.Table9showsatypical report from a hop analysis showing the user’s transcribed narration and the recorded aroma intensity from the joystick. This report is formatted as a comma-separated value (CSV) file suitable fordirectimportationintoMicrosoft®Excel® or other application software.

For a complete listing of our global offices, visit www.perkinelmer.com/ContactUs
Copyright ©2013, PerkinElmer, Inc. All rights reserved. PerkinElmer® is a registered trademark of PerkinElmer, Inc. All other trademarks are the property of their respective owners. 011349_01
PerkinElmer, Inc. 940 Winter Street Waltham, MA 02451 USA P: (800) 762-4000 or (+1) 203-925-4602www.perkinelmer.com
Conclusions
TheadditionofanolfactoryporttoaHSGC/MSsystemextendsitsapplicationforaromacharacterizationofsamplessuch as hops. The ability to directly correlate organoleptic perception against hard analytical data provides insights difficult to obtain otherwise.
This system should be of interest to brewers and researchers involved in the following:
• Qualitycontrolofrawhops
• Productdevelopment
• Troubleshootingofoff-flavors
• Storage/agingstudies
• Comparisonstudies
• Aromaanalysisoffinishedbeer
• Reverseengineeringofcompetitiveproducts