characterization of ice-induced low-frequency …icing.ae.illinois.edu/papers/13/aiaa-2013-2673.pdf1...
TRANSCRIPT

1
American Institute of Aeronautics and Astronautics
Characterization of Ice-Induced Low-Frequency Flowfield Oscillations and their Effect on Airfoil Performance
Phillip J. Ansell and Michael B. Bragg†
University of Illinois at Urbana-Champaign, Urbana, Illinois 61801
Wind tunnel measurements were used to determine the unsteady location of shear-layer
reattachment on an NACA 0012 airfoil with a leading-edge horn-ice shape, along with the corresponding time-resolved unsteady iced-airfoil performance. Similar trends in low-frequency content were identified between the unsteady shear-layer reattachment location and the iced-airfoil performance. Conditional averaging was used to determine the average relationship between the unsteady reattachment location and the iced-airfoil performance corresponding to this common low-frequency mode. A phase relationship was also identified between the shear-layer reattachment location and the iced-airfoil performance. Changes in spectral content over time in the airfoil performance and reattachment location were analyzed using wavelet transforms. The low-frequency oscillations were observed to occur at similar time instances between these signals, and appeared to originate in the separation bubble at a location corresponding to nearly half of the separation bubble length. This low-frequency mode was then propagated throughout the surface pressure flowfield, affecting both the airfoil performance and the separation bubble length. A summary of the low-frequency oscillation in the airfoil flowfield is presented.
Nomenclature c = airfoil chord length Cd = drag coefficient Ch = hinge moment coefficient Cl = lift coefficient Cm = quarter-chord pitching moment coefficient Cp = pressure coefficient f = frequency m = slope of θ with respect to x/c M∞ = freestream Mach number N = number of samples r = time lag interval Re = Reynolds number based on chord length Rpq = cross-correlation function U = velocity x = coordinate in the airfoil model chordwise direction xr = shear-layer reattachment location y = coordinate in the airfoil model chord-normal direction = airfoil angle of attack Δt = time step (inverse of sample rate) θ = phase angle ρ = cross-correlation coefficient σ = standard deviation of sample τ = time lag τ0 = time delay
Graduate Research Assistant, Department of Aerospace Engineering, Member AIAA. † Professor of Aerospace Engineering, Interim Dean of College of Engineering, Fellow AIAA.
Dow
nloa
ded
by U
NIV
ER
SIT
Y O
F IL
LIN
OIS
on
Aug
ust 1
4, 2
013
| http
://ar
c.ai
aa.o
rg |
DO
I: 1
0.25
14/6
.201
3-26
73
31st AIAA Applied Aerodynamics Conference
June 24-27, 2013, San Diego, CA
AIAA 2013-2673
Copyright © 2013 by P. Ansell and M. Bragg. Published by the American Institute of Aeronautics and Astronautics, Inc., with permission.
2 American Institute of Aeronautics and Astronautics
I. Introduction hile many significant strides have led to a decline in the number of icing-related aircraft accidents occurring annually, airframe icing remains a serious concern for aviation safety. This is particularly true in the private
aviation community, where from 1998 to 2009, there were 510 icing-related accidents recorded in FAA and NASA databases involving non-commercial airplanes, nearly 40% of which resulted in fatalities.1 As a response to the dangers of airframe icing, numerous studies have been conducted to better determine the ice accretion process and the effects of aircraft icing. These investigations have been conducted in an effort to provide a better understanding2 and classification3 of traits of ice accretions. Such studies have also investigated the effects of icing on aircraft performance4 and controllability.5 However, the current state of understanding of unsteady effects about an iced flowfield is limited, which precipitates the need for additional investigation of unsteady iced-aircraft performance.
One unsteady effect of particular interest that is present in certain iced-airfoil flowfields is a low-frequency oscillation that occurs prior to static stall. This low-frequency oscillation on iced airfoils was first discussed in detail by Zaman and Potapczuk.6 These authors identified oscillations in experimental wake velocities and numerically-computed airfoil performance at Strouhal numbers (based on projected airfoil height) near 0.02, which is an order of magnitude lower than the typical Strouhal number of bluff-body shedding. These authors also identified similarities in the low-frequency content in the wake of the iced airfoil with the unsteadiness in the LRN(1)-1007 airfoil near stalling conditions as discussed by Zaman et al.7 This low-frequency oscillation was also observed in the computational results of Potapczuk.8 A similar low-frequency ice-induced oscillation was also identified by Bragg et al.9 in the velocity spectrum taken just downstream of a simulated horn-ice shape on an NACA 0012 airfoil.
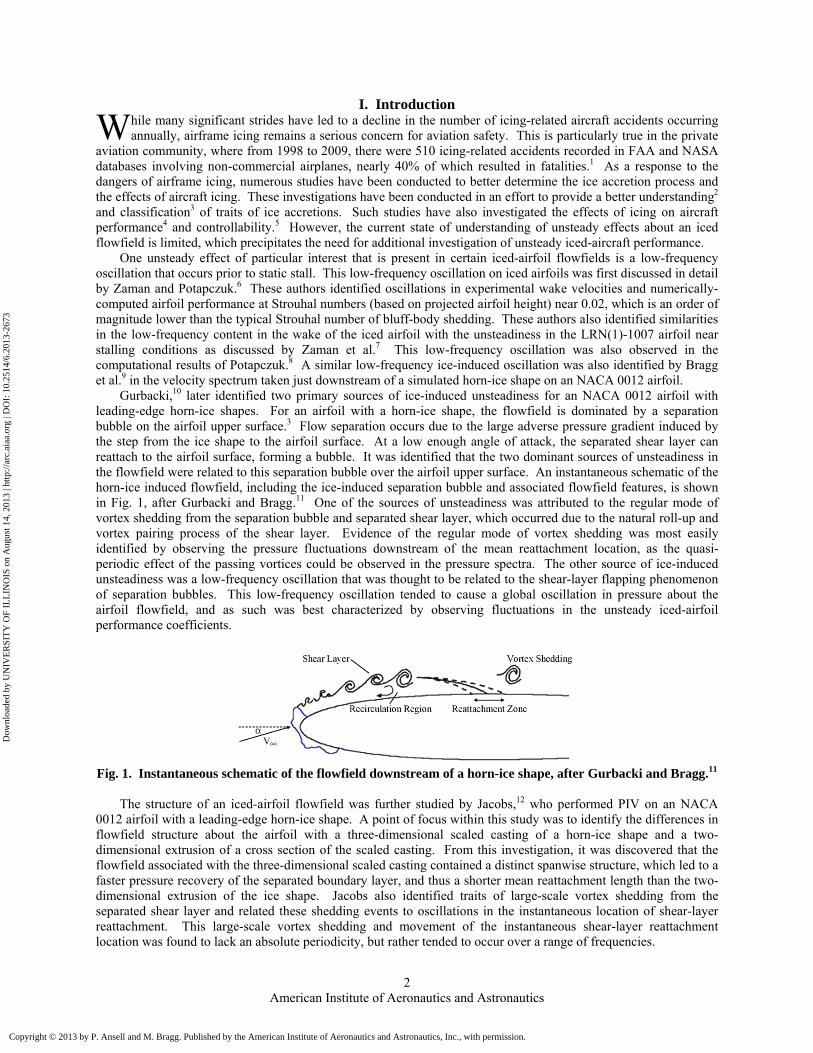
Gurbacki,10 later identified two primary sources of ice-induced unsteadiness for an NACA 0012 airfoil with leading-edge horn-ice shapes. For an airfoil with a horn-ice shape, the flowfield is dominated by a separation bubble on the airfoil upper surface.3 Flow separation occurs due to the large adverse pressure gradient induced by the step from the ice shape to the airfoil surface. At a low enough angle of attack, the separated shear layer can reattach to the airfoil surface, forming a bubble. It was identified that the two dominant sources of unsteadiness in the flowfield were related to this separation bubble over the airfoil upper surface. An instantaneous schematic of the horn-ice induced flowfield, including the ice-induced separation bubble and associated flowfield features, is shown in Fig. 1, after Gurbacki and Bragg.11 One of the sources of unsteadiness was attributed to the regular mode of vortex shedding from the separation bubble and separated shear layer, which occurred due to the natural roll-up and vortex pairing process of the shear layer. Evidence of the regular mode of vortex shedding was most easily identified by observing the pressure fluctuations downstream of the mean reattachment location, as the quasi-periodic effect of the passing vortices could be observed in the pressure spectra. The other source of ice-induced unsteadiness was a low-frequency oscillation that was thought to be related to the shear-layer flapping phenomenon of separation bubbles. This low-frequency oscillation tended to cause a global oscillation in pressure about the airfoil flowfield, and as such was best characterized by observing fluctuations in the unsteady iced-airfoil performance coefficients.
Fig. 1. Instantaneous schematic of the flowfield downstream of a horn-ice shape, after Gurbacki and Bragg.11
The structure of an iced-airfoil flowfield was further studied by Jacobs,12 who performed PIV on an NACA
0012 airfoil with a leading-edge horn-ice shape. A point of focus within this study was to identify the differences in flowfield structure about the airfoil with a three-dimensional scaled casting of a horn-ice shape and a two-dimensional extrusion of a cross section of the scaled casting. From this investigation, it was discovered that the flowfield associated with the three-dimensional scaled casting contained a distinct spanwise structure, which led to a faster pressure recovery of the separated boundary layer, and thus a shorter mean reattachment length than the two-dimensional extrusion of the ice shape. Jacobs also identified traits of large-scale vortex shedding from the separated shear layer and related these shedding events to oscillations in the instantaneous location of shear-layer reattachment. This large-scale vortex shedding and movement of the instantaneous shear-layer reattachment location was found to lack an absolute periodicity, but rather tended to occur over a range of frequencies.
W
Dow
nloa
ded
by U
NIV
ER
SIT
Y O
F IL
LIN
OIS
on
Aug
ust 1
4, 2
013
| http
://ar
c.ai
aa.o
rg |
DO
I: 1
0.25
14/6
.201
3-26
73
Copyright © 2013 by P. Ansell and M. Bragg. Published by the American Institute of Aeronautics and Astronautics, Inc., with permission.

3 American Institute of Aeronautics and Astronautics
The effect of the low-frequency mode associated with iced airfoils on the unsteady flap hinge moment for an airfoil has also become an area of interest. Ansell et al.13 evaluated levels of unsteadiness in hinge-moment signals prior to stall for an NACA 23012 airfoil with a simple flap under a clean configuration and an array of simulated contaminated configurations. These authors discovered that for this leading-edge type stall airfoil, the addition of a simulated glaze-ice accretion led to changes in the unsteady hinge moment behavior near stall that were distinctly different from other types of simulated leading-edge contaminants.
Similar low-frequency oscillations in airfoil flowfields have also been associated with certain types of clean airfoils operating at low Reynolds numbers prior to stall. Investigation of this phenomenon was first pursued in great detail by Zaman et al.7,14 on an LRN(1)-1007 for a Reynolds number range from 4 × 10⁴ to 1.4 × 10⁵. These low-frequency oscillations were also observed by Bragg et al.15 for the same airfoil section operating at Reynolds numbers from 3 × 10⁵ to 1.4 × 10⁶. The low-frequency oscillations corresponded to a Strouhal number, based on the airfoil projected height and freestream velocity, near 0.02, which is an order of magnitude lower than the Strouhal number of bluff-body shedding. Similar values of Strouhal number were also identified in results reported by Bragg et al.,16 and the characteristics of the visualized flowfield were described. These low-frequency oscillations about the LRN(1)-1007 were further investigated by Broeren and Bragg,17 who characterized the low-frequency oscillations using phase-averaged LDV and hot-wire data. A clear, periodic stalling and unstalling behavior was identified for the LRN(1)-1007 airfoil. Both the leading-edge separation bubble and the trailing-edge turbulent separation in the airfoil flowfield appeared to have an influence on this periodic stalling behavior of the airfoil.
Low-frequency oscillations were also studied in detail in a later investigation by Broeren,18 who observed these types of oscillations in the flowfields about various airfoils operating at Reynolds numbers of 3 × 10⁵. Six of the twelve airfoils tested in this investigation exhibited low-frequency oscillations prior to stall, all of which were classified as having either a thin-airfoil stall type or a mixed thin-airfoil and trailing-edge stall type. For the mixed thin-airfoil and trailing-edge stall type, the presence of the trailing-edge separation appeared to amplify the unsteadiness associated with the leading-edge laminar separation bubble. The low-frequency oscillations were not identified for any airfoils that were associated with a leading-edge stall type or a pure trailing-edge stall type at the Reynolds number tested.
Rinoie and Takemura19 also identified a low-frequency oscillation in an airfoil flowfield near stall in LDV measurements taken about an NACA 0012 airfoil at a Reynolds number of 1.3 × 10⁵. Similar to the observations of Broeren and Bragg,17 these authors identified a similar quasi-periodic stalling and unstalling behavior of the airfoil, which was governed by the extent of the leading-edge separation present in the airfoil flowfield throughout the oscillation cycle. The separation bubble on the airfoil surface, and its effects at different phases of the oscillation cycle, were also compared to the “short” and “long” bubble classifications of Tani.20 These short bubbles can become long bubbles through a process known as “bursting,” as described by Gaster.21 Similar observations were made in the LES results by Almutairi and AlQadi22 for an NACA 0012 airfoil at a Reynolds number of 5 × 10⁴. These authors also identified a switching from a short laminar separation bubble to a fully separated flow over the airfoil upper surface, which was brought on by a bursting and subsequent growth of the laminar separation bubble. A mechanism for this low-frequency oscillation was also proposed by these authors, where an absolute instability in the separation bubble causes the growth of the bubble and stalling of the airfoil, and an interaction of the separated shear layer and the leading-edge flowfield leads to subsequent reattachment.
The purpose of the current study is to determine the relationship between the low-frequency oscillation of the reattaching shear layer downstream of a horn-ice shape and the unsteady airfoil performance. Knowledge of such a relationship would provide an improved understanding of sources of unsteady content of iced-airfoil flowfields.
II. Experimental Methods Wind Tunnel Data Acquisition
The data obtained in this investigation were acquired from a series of wind tunnel tests, performed at the University of Illinois at Urbana-Champaign. The Illinois 3-ft × 4-ft wind tunnel was used throughout this investigation. This tunnel had a maximum empty test section speed of 165 mph (242 ft/sec), and turbulence intensity less than 0.1% for all operating speeds. This resulted in a maximum tunnel streamwise Reynolds number of approximately 1.5 × 10⁶/ft. All data were acquired in this investigation at a chord-based Re = 1.80 × 10⁶ (M∞ = 0.18).
All tests were performed on an 18-inch chord, single-element NACA 0012 model. This model was outfitted with 68 chordwise pressure taps located near the model mid-span. Pressure lines were run from the pressure taps to a set of electronically-scanned pressure modules, which were used to obtain time-averaged static pressure measurements about the airfoil model. These pressure measurements were used to calculate the airfoil Cp distribution, which was then used to calculate the airfoil lift and quarter-chord pitching moment coefficients (Cl and
Dow
nloa
ded
by U
NIV
ER
SIT
Y O
F IL
LIN
OIS
on
Aug
ust 1
4, 2
013
| http
://ar
c.ai
aa.o
rg |
DO
I: 1
0.25
14/6
.201
3-26
73
Copyright © 2013 by P. Ansell and M. Bragg. Published by the American Institute of Aeronautics and Astronautics, Inc., with permission.

4 American Institute of Aeronautics and Astronautics
Cm, respectively). While the current NACA 0012 was a single-element airfoil model, the surface static pressures across the trailing-edge region of the airfoil could be integrated to determine the hinge moment about a prescribed hinge line. As a result, the hinge moment coefficient (Ch) was calculated for a 30%-chord flap with hinge line located at x/c = 0.70, y/c = 0.0. Airfoil performance measurements were also obtained using a three-component balance, whose turntable was used to regulate the model angle of attack. Wake pressures were obtained using a traversable wake rake located downstream of the airfoil model, along with the electronically-scanned pressure system. From these wake data, the airfoil drag coefficient (Cd) was also calculated using standard wake velocity deficit methods.
In addition to the static pressure taps, the NACA 0012 model was also outfitted with 37 ultra-miniature, high-frequency response pressure transducers, which were integrated into the model surface at the model mid-span. These pressure transducers provided unsteady surface static pressure measurements, which could be integrated to obtain the unsteady model performance. The unsteady pressures about the trailing-edge portion of the model were also used to determine the unsteady hinge moment coefficient for the same simulated 30%-chord flap as the time-averaged surface pressures.
The model was also equipped with a removable leading edge. As such, a scaled casting of an ice accretion could be installed to replace the clean leading-edge section of the airfoil model. In this investigation, a horn-ice shape was simulated based on a two-dimensional extrusion of a scaled horn-ice shape casting. A profile of the horn-ice shape on the NACA 0012 model is shown in Fig. 2, after Gurbacki and Bragg.11
Fig. 2. NACA 0012 with horn-ice shape, after Gurbacki and Bragg.11
A series of measurements were also acquired from a surface-mountable hot-film array. The hot-film array was
manufactured by Tao Systems, and was a Senflex Model SF9501 array. This hot-film array consisted of 32 film elements and was placed on the model upper surface, covering a chordwise distance from x/c = 0.39 to x/c = 0.57. Each hot-film element on the array was regulated using a dedicated constant-temperature anemometer. A diagram of the hot-film array that was used is shown in Fig. 3, modified from Ref. 23. All unsteady measurements, which included measurements from the model-integrated pressure transducers and the surface-mounted hot films, were sampled simultaneously using a National Instruments SCXI system. These unsteady data were acquired at a sample rate of 2 kHz for 10 seconds, and were low-pass filtered with a cutoff at the 1 kHz Nyquist frequency using a low-pass Bessel filter.
Fig. 3. Diagram of hot-film array used on the surface of the NACA 0012 model, adapted from Ref. 23.
Dow
nloa
ded
by U
NIV
ER
SIT
Y O
F IL
LIN
OIS
on
Aug
ust 1
4, 2
013
| http
://ar
c.ai
aa.o
rg |
DO
I: 1
0.25
14/6
.201
3-26
73
Copyright © 2013 by P. Ansell and M. Bragg. Published by the American Institute of Aeronautics and Astronautics, Inc., with permission.
5 American Institute of Aeronautics and Astronautics
Hot-Film Array Data Reduction The hot-film array measurements on the iced NACA 0012 model were used to determine the unsteady location of shear-layer reattachment downstream of the ice shape. The reattachment location was determined using the method from Ansell and Bragg.24 This method uses a comparison of short-time cross-correlations of signals from adjacent films to detect the flow bifurcation that occurs at reattachment. This bifurcation creates a phase reversal between adjacent sensors at the reattachment location. The location of this phase reversal also produces strong levels of anti-correlation between signals of adjacent sensors across a short-time window. By extracting these locations of maximum anti-correlation across the total record length, the unsteady shear-layer reattachment location was determined.
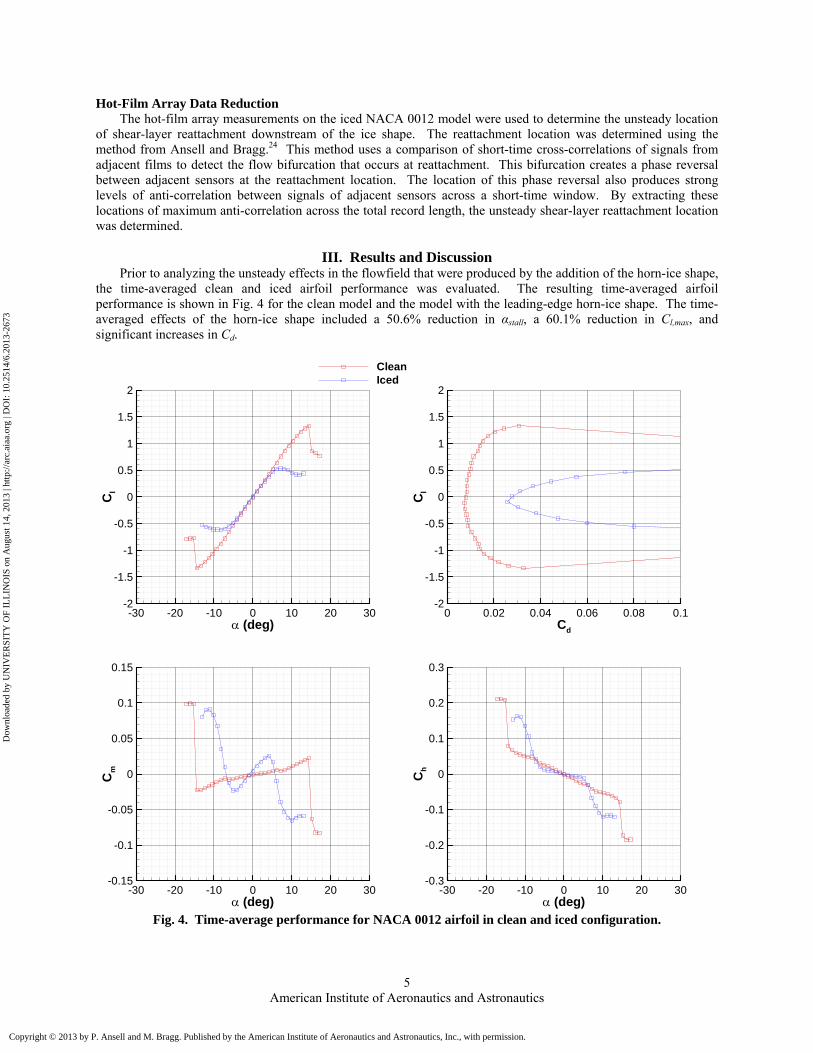
III. Results and Discussion Prior to analyzing the unsteady effects in the flowfield that were produced by the addition of the horn-ice shape, the time-averaged clean and iced airfoil performance was evaluated. The resulting time-averaged airfoil performance is shown in Fig. 4 for the clean model and the model with the leading-edge horn-ice shape. The time-averaged effects of the horn-ice shape included a 50.6% reduction in αstall, a 60.1% reduction in Cl,max, and significant increases in Cd.
Fig. 4. Time-average performance for NACA 0012 airfoil in clean and iced configuration.
(deg)
Cl
-30 -20 -10 0 10 20 30-2
-1.5
-1
-0.5
0
0.5
1
1.5
2
CleanIced
Cd
Cl
0 0.02 0.04 0.06 0.08 0.1-2
-1.5
-1
-0.5
0
0.5
1
1.5
2
(deg)
Cm
-30 -20 -10 0 10 20 30-0.15
-0.1
-0.05
0
0.05
0.1
0.15
(deg)
Ch
-30 -20 -10 0 10 20 30-0.3
-0.2
-0.1
0
0.1
0.2
0.3
Dow
nloa
ded
by U
NIV
ER
SIT
Y O
F IL
LIN
OIS
on
Aug
ust 1
4, 2
013
| http
://ar
c.ai
aa.o
rg |
DO
I: 1
0.25
14/6
.201
3-26
73
Copyright © 2013 by P. Ansell and M. Bragg. Published by the American Institute of Aeronautics and Astronautics, Inc., with permission.

6 American Institute of Aeronautics and Astronautics
In order to characterize the unsteady content of the iced-airfoil performance coefficients, power spectral density (PSD) functions were calculated for Cl, Cm, and Ch using standard Fast Fourier Transform methods. These PSD functions were calculated for the angle-of-attack range near stall where the low-frequency oscillations were observed to occur. These resulting PSD functions of the iced-airfoil performance are shown in Fig. 5 across a low-frequency range. From Fig. 5, a low-frequency peak in the airfoil performance coefficients is clearly visible near a frequency of 10 Hz in all airfoil performance coefficients for 5° ≤ α ≤ 7°. It was verified that this frequency was not a structural mode of the model through a simple impulse-response experiment. The amplitude of this low-frequency oscillation tended to grow with increased angle of attack up until stall at α = 7°. This low-frequency mode was identified as being quasi-periodic, since these peaks cover a narrow bandwidth of frequencies, as observed in the airfoil performance PSD functions. This observation was consistent with those reported in the literature.10
Fig. 5. PSD functions of unsteady iced-airfoil performance coefficients across a low-frequency range: a) Cl, b) Cm, c) Ch.
The low-frequency unsteady characteristics of the shear-layer reattachment location and iced-airfoil performance were analyzed at α = 5°. At this angle of attack, the low-frequency oscillations in the airfoil performance were large enough to be identified in the PSD functions in Fig. 5. Below this angle of attack, any low-frequency oscillations in the airfoil performance coefficients were difficult to identify. Using the reattachment zone determined by Jacobs,12 it was also identified that at α = 5° shear-layer reattachment occurred on the airfoil surface across a zone small enough for the low-frequency component to be captured across the hot-film array. Thus, by
Freq (Hz)
PS
D(d
B/H
z)
0 20 40 60 80 100-80
-70
-60
-50
-40
-30
=4°=4.5°=5°=5.5°=6°=6.5°=7°
a)
Cl
Freq (Hz)
PS
D(d
B/H
z)
0 20 40 60 80 100-90
-80
-70
-60
-50
-40
b)
Cm
Freq (Hz)
PS
D(d
B/H
z)
0 20 40 60 80 100-80
-70
-60
-50
-40
-30
c)
Ch
Dow
nloa
ded
by U
NIV
ER
SIT
Y O
F IL
LIN
OIS
on
Aug
ust 1
4, 2
013
| http
://ar
c.ai
aa.o
rg |
DO
I: 1
0.25
14/6
.201
3-26
73
Copyright © 2013 by P. Ansell and M. Bragg. Published by the American Institute of Aeronautics and Astronautics, Inc., with permission.

7 American Institute of Aeronautics and Astronautics
performing an analysis on the unsteady flowfield at α = 5°, the angle of attack was high enough for a dominant average frequency of the low-frequency mode to appear in the iced-airfoil performance, but was also low enough such that the reattachment zone was small enough to be reasonably covered by the hot-film array. Surface-oil flow visualization was completed at this angle of attack, and is shown in Fig. 6, after Ansell and Bragg.24 From Fig. 6, the location of mean shear-layer reattachment corresponds to x/c = 0.48, and the reattachment zone was estimated to occur between x/c = 0.42 and x/c = 0.53.
Fig. 6. Surface-oil flow visualization of iced NACA 0012 airfoil at α = 5°, after Ansell and Bragg.24
The effect of this separation bubble on the airfoil pressure distribution can be observed in the time-averaged Cp
distributions at α = 5° shown in Fig. 7. From Fig. 7, at α = 5° the clean airfoil has a clear suction peak at the airfoil leading edge on the upper surface. However, with the addition of the ice shape, the influence of this suction peak is significantly reduced. This occurs primarily due to the presence of the long separation bubble on the upper surface of the iced airfoil. In the iced-airfoil Cp distribution in Fig. 7, the leading-edge region on the upper surface is instead characterized by a plateau in Cp which is a classic characteristic of separated flows on airfoils.20
Fig. 7. Time-averaged Cp distribution on the clean and iced NACA 0012 airfoil at α = 5°.
The unsteady location of shear-layer reattachment was estimated using the hot-film array measurements, as
reported in Ansell and Bragg.24 Since all unsteady measurements were acquired simultaneously, the resulting unsteady reattachment location was time-resolved with the measurements from the unsteady pressure transducers
x/c
Cp
0 0.2 0.4 0.6 0.8 1
-2.5
-2
-1.5
-1
-0.5
0
0.5
1
1.5
Clean Upper SurfaceClean Lower SurfaceIced Upper SurfaceIced Lower Surface
Dow
nloa
ded
by U
NIV
ER
SIT
Y O
F IL
LIN
OIS
on
Aug
ust 1
4, 2
013
| http
://ar
c.ai
aa.o
rg |
DO
I: 1
0.25
14/6
.201
3-26
73
Copyright © 2013 by P. Ansell and M. Bragg. Published by the American Institute of Aeronautics and Astronautics, Inc., with permission.

8 American Institute of Aeronautics and Astronautics
integrated into the airfoil surface. Using these unsteady pressure measurements, the instantaneous performance (Cl, Cm, and Ch) of the iced airfoil could be determined. This allowed for the time-dependent relationship between the airfoil performance and the separation bubble length to be analyzed. The resulting unsteady shear-layer reattachment location compared well with reattachment data found in the literature.12,25,26 An example comparison of a schematic of shear-layer reattachment, generated from the model of Kiya and Sasaki,25 and the resulting shear-layer reattachment time history on the iced NACA 0012 is shown in Fig. 8.24 By comparing the reattachment model in Fig. 8 a) to the reattachment location determined using the hot-film array in Fig. 8 b), the shear-layer reattachment location determined using the hot-film array has qualitatively similar characteristics as the model from the literature. Also, by comparing Fig. 6 with Fig. 8, the mean reattachment location determined from the surface-mounted hot-film array is consistent with that determined from surface-oil flow visualization. As discussed in Ansell and Bragg, the effect of the regular mode of vortex shedding is characterized by short time-scale oscillations in the shear-layer reattachment location, and the effect of the low-frequency mode is characterized by a long time-scale oscillation in the reattachment location about the mean.24
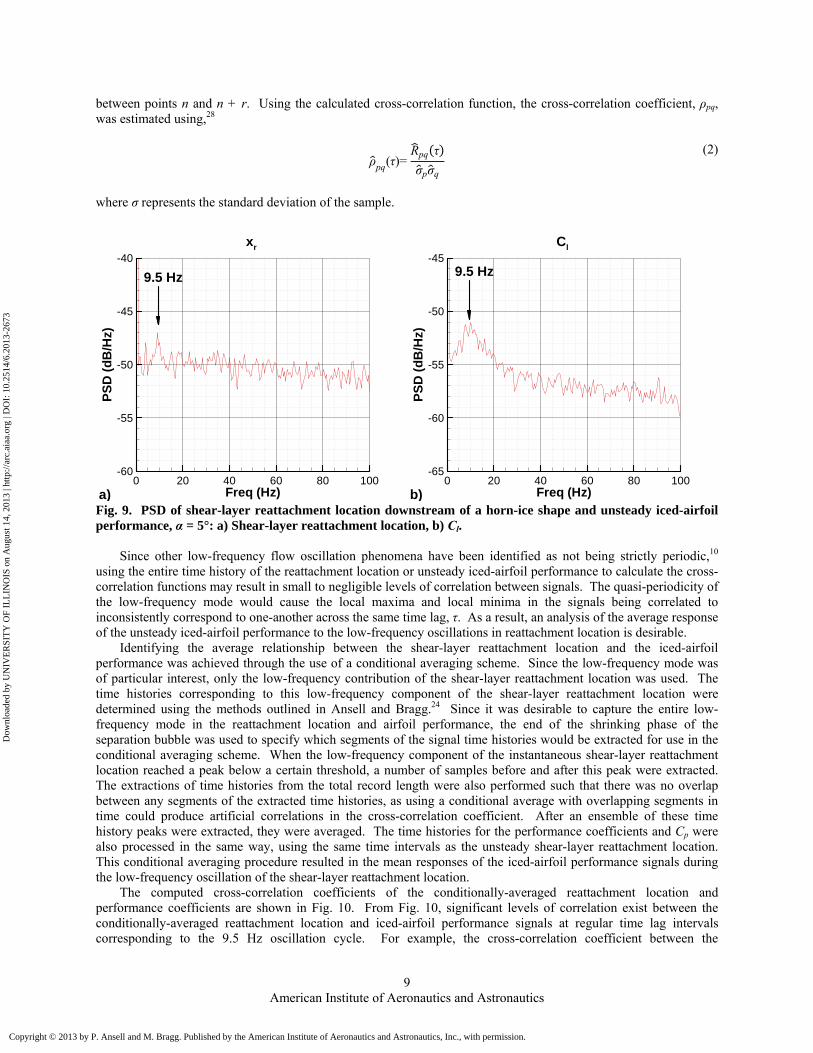
Fig. 8. Comparison of shear-layer reattachment location determined from: a) model after Kiya and Sasaki,25 and b) hot-film array measurements of Ansell and Bragg.24 At α = 5°, the PSD functions of the reattachment location and iced-airfoil performance coefficients were calculated. The resulting PSDs for the unsteady shear-layer reattachment location and the unsteady airfoil Cl are shown in Fig. 9. As shown in Fig. 9, the PSDs for the shear-layer reattachment location and the unsteady airfoil performance reveal consistent peaks in low-frequency spectral content. The peaks in energy density for the shear-layer reattachment location and performance coefficients correspond to a frequency of 9.5 Hz. This indicates that the dominant oscillations are occurring with the same frequency for the reattaching shear layer and the iced-airfoil performance. This low-frequency oscillation is similar to those discussed by previous authors.6,7,11,14-19,22,27 The oscillations of this low-frequency mode are represented by a global oscillation of the entire airfoil flowfield.
Since Fig. 9 reveals similarities in frequency content between the location of shear-layer reattachment and iced-airfoil performance, it is desirable to also determine any correlations between these signals. The cross-correlation coefficient provides an effective measure of the existence of relationships between signals. The cross-correlation coefficient was calculated based on an estimation of the cross-correlation function, which when computed directly can be calculated by28
Rpq r∆t =1
N-rpnqn+r
N-r
n=1
(1)
where N represents the number of data samples, r = 0, 1, 2, …, m represents the given time lag interval (with m < N), and p and q represent the quantities for which the cross-correlation is being computed. It should be noted that for this investigation, Δt was known to be the inverse of the sample rate, thus making the quantity rΔt the time lag, τ,
Ut/xr
(xr,
i-xr)
/xr
0 5 10 15 20-0.3
-0.2
-0.1
0
0.1
0.2
0.3
Regular ModeShear-Layer FlappingAverage Location
a) Time (sec)
xr/c
0.15 0.2 0.250.35
0.4
0.45
0.5
0.55
0.6
Regular ModeLow-Frequency ModeAverage Location
b)
Dow
nloa
ded
by U
NIV
ER
SIT
Y O
F IL
LIN
OIS
on
Aug
ust 1
4, 2
013
| http
://ar
c.ai
aa.o
rg |
DO
I: 1
0.25
14/6
.201
3-26
73
Copyright © 2013 by P. Ansell and M. Bragg. Published by the American Institute of Aeronautics and Astronautics, Inc., with permission.
9 American Institute of Aeronautics and Astronautics
between points n and n + r. Using the calculated cross-correlation function, the cross-correlation coefficient, ρpq, was estimated using,28
ρpq(τ)=
Rpq τ
σpσq
(2)
where σ represents the standard deviation of the sample.
Fig. 9. PSD of shear-layer reattachment location downstream of a horn-ice shape and unsteady iced-airfoil performance, α = 5°: a) Shear-layer reattachment location, b) Cl. Since other low-frequency flow oscillation phenomena have been identified as not being strictly periodic,10 using the entire time history of the reattachment location or unsteady iced-airfoil performance to calculate the cross-correlation functions may result in small to negligible levels of correlation between signals. The quasi-periodicity of the low-frequency mode would cause the local maxima and local minima in the signals being correlated to inconsistently correspond to one-another across the same time lag, τ. As a result, an analysis of the average response of the unsteady iced-airfoil performance to the low-frequency oscillations in reattachment location is desirable. Identifying the average relationship between the shear-layer reattachment location and the iced-airfoil performance was achieved through the use of a conditional averaging scheme. Since the low-frequency mode was of particular interest, only the low-frequency contribution of the shear-layer reattachment location was used. The time histories corresponding to this low-frequency component of the shear-layer reattachment location were determined using the methods outlined in Ansell and Bragg.24 Since it was desirable to capture the entire low-frequency mode in the reattachment location and airfoil performance, the end of the shrinking phase of the separation bubble was used to specify which segments of the signal time histories would be extracted for use in the conditional averaging scheme. When the low-frequency component of the instantaneous shear-layer reattachment location reached a peak below a certain threshold, a number of samples before and after this peak were extracted. The extractions of time histories from the total record length were also performed such that there was no overlap between any segments of the extracted time histories, as using a conditional average with overlapping segments in time could produce artificial correlations in the cross-correlation coefficient. After an ensemble of these time history peaks were extracted, they were averaged. The time histories for the performance coefficients and Cp were also processed in the same way, using the same time intervals as the unsteady shear-layer reattachment location. This conditional averaging procedure resulted in the mean responses of the iced-airfoil performance signals during the low-frequency oscillation of the shear-layer reattachment location. The computed cross-correlation coefficients of the conditionally-averaged reattachment location and performance coefficients are shown in Fig. 10. From Fig. 10, significant levels of correlation exist between the conditionally-averaged reattachment location and iced-airfoil performance signals at regular time lag intervals corresponding to the 9.5 Hz oscillation cycle. For example, the cross-correlation coefficient between the
Freq (Hz)
PS
D(d
B/H
z)
0 20 40 60 80 100-60
-55
-50
-45
-40
9.5 Hz
a)
xr
Freq (Hz)
PS
D(d
B/H
z)
0 20 40 60 80 100-65
-60
-55
-50
-459.5 Hz
b)
Cl
Dow
nloa
ded
by U
NIV
ER
SIT
Y O
F IL
LIN
OIS
on
Aug
ust 1
4, 2
013
| http
://ar
c.ai
aa.o
rg |
DO
I: 1
0.25
14/6
.201
3-26
73
Copyright © 2013 by P. Ansell and M. Bragg. Published by the American Institute of Aeronautics and Astronautics, Inc., with permission.

10 American Institute of Aeronautics and Astronautics
reattachment location and Cl exhibits positive peaks at τ = -0.034 sec and τ = 0.074 sec. The time between these peaks is 0.108 seconds, which is approximately one full cycle of the 9.5 Hz, low-frequency mode. Similar time delays corresponding to the 9.5 Hz mode can also be observed between the other peaks in the cross-correlation coefficients in Fig. 10. Such a result would be expected, as the local extremum in the reattachment location would correlate well with the local extremum in the performance coefficients of a previous or future oscillation cycle.
Fig. 10. Cross-correlation coefficients of conditionally-averaged shear-layer reattachment location and iced-airfoil performance.
The relationship between the reattachment location and the iced-airfoil performance can also be characterized by observing the sign and corresponding time lags of local extrema in the correlation coefficient. For example, using the same peaks mentioned previously in the correlation coefficient between xr and Cl, the positive peak nearest zero time lag corresponds to a time lag of τ = -0.034 sec, which is close to one-quarter of a cycle of the low-frequency mode. The cross-correlation coefficient also crosses near the origin at τ = 0 sec, and reaches another positive peak at a positive time lag near three-quarters of a cycle of the low-frequency mode at τ = 0.074 sec. This suggests a possibility of a phase relationship of approximately π/2 between the airfoil surface pressure and the separation bubble length, which will be confirmed later in this paper. Similar trends can also be observed for the correlation coefficients between the reattachment location and Cm and Ch. However, the time lags of the peaks in these correlation coefficients are different than they are for the correlation coefficient with Cl, which suggests that the relationship between the two moment coefficients and the bubble length is also different than π/2.
For the peak in the cross-correlation coefficient between xr and Cl at τ = -0.034 sec, the value of the cross-correlation coefficient is positive, but the time lag is negative. This would indicate that prior to a local maximum in length of the separation bubble, there exists a maximum in lift coefficient. As well, prior to a local minimum in the length of the separation bubble, there exists a minimum in lift coefficient. From an aerodynamics perspective, this type of behavior would be expected, as a higher circulation effect of the airfoil would cause the length of the separation bubble to increase. However, shortly after τ = 0 sec, the first extremum in the cross-correlation coefficient at a positive time lag is negative. This would indicate that a local minimum in lift coefficient is preceded by a local maximum in separation bubble length, or a local maximum in lift coefficient is preceded by a local minimum in separation bubble length. Since correlation does not indicate causation, it is not possible to determine here whether the unsteadiness in shear-layer reattachment or iced-airfoil performance serves as a source of these oscillations.
In order to further understand how the airfoil lift coefficient can lead the movement of the reattachment location, the cross-correlation coefficients between the conditionally-averaged reattachment location and upper surface Cp were also calculated. The resulting correlation coefficients are provided in the contour of Fig. 11. From Fig. 11, it can be seen that at τ = 0 sec, the reattachment location exhibits strong levels of positive correlation with the Cp at the airfoil leading edge. Thus, at one given time instance, if the separation bubble is large, the leading-edge pressure is high, and if the separation bubble is small, the leading-edge pressure is low. This observation is to be expected, and has been frequently observed in the literature.20
(sec)
-0.4 -0.2 0 0.2 0.4-0.6
-0.4
-0.2
0
0.2
0.4
0.6
0.8
1
Cl
Cm
Ch
Dow
nloa
ded
by U
NIV
ER
SIT
Y O
F IL
LIN
OIS
on
Aug
ust 1
4, 2
013
| http
://ar
c.ai
aa.o
rg |
DO
I: 1
0.25
14/6
.201
3-26
73
Copyright © 2013 by P. Ansell and M. Bragg. Published by the American Institute of Aeronautics and Astronautics, Inc., with permission.

11 American Institute of Aeronautics and Astronautics
From the cross-correlation coefficients shown in Fig. 11, it appears as though the oscillations in Cp have convective qualities, as indicated by the downstream movement of the regions of high or low correlation coefficient with time. However, it is unclear here whether the pressure fluctuation simply propagates extremely slowly from the airfoil leading edge to x/c = 0.20 and then faster to the airfoil trailing edge, or if the pressure oscillations are caused by an instability that has an opposite effect in the region upstream of x/c = 0.20 than it has downstream of x/c = 0.20, creating a change in the sign of the cross-correlation coefficient across this location. Regardless, the cause of the airfoil lift coefficient leading the reattachment location can be determined by observing the region of strong anti-correlation near x/c = 0.20 and τ = -0.03 sec. This location corresponds to the beginning of the pressure recovery region on the airfoil surface, as observed in the iced-airfoil Cp distribution in Fig. 7. Since the correlation coefficient is negative near x/c = 0.20, this would indicate that prior to a local maximum in the length of the separation bubble, there would be a local minimum in pressure within this region, and hence a local maximum in lift coefficient. Similarly, prior to a local minimum in the length of the separation bubble, there would be a local maximum in pressure within this region, leading to a local minimum in lift coefficient. While it is fairly common for the leading-edge suction peak to provide much of the lift in an airfoil flowfield, a long separation bubble on an airfoil tends to decrease the influence of this suction peak and create long stretches of constant pressure on the airfoil surface.20 As a result, in this case the instance in time when maximum lift is achieved is not when the leading-edge pressure is lowest, but rather when the plateau in the airfoil Cp along the separation bubble length is associated with the lowest pressure.
Fig. 11. Cross-correlation coefficients of conditionally-averaged shear-layer reattachment location and upper surface airfoil Cp.
Based on the observations from the cross-correlation coefficients in Fig. 10, a more detailed investigation on the
phase relationship between the reattachment location and performance coefficients was performed. Since the cross-correlation coefficient between xr and Cl tended to cross near origin, switching signs after crossing τ = 0 sec, and since the dominant average frequency was consistent between the reattachment location and the iced-airfoil performance coefficients, this suggests the existence of a phase relationship between the separation bubble length and the iced-airfoil performance at the low-frequency mode. In order to better understand the phase relationship between the reattachment location and iced-airfoil performance, the relative signal phase distributions in the cross-spectra between the reattachment location and iced-airfoil performance coefficients were calculated. The resulting phase relations, as a function of frequency, are shown in Fig. 12. From Fig. 12, at a frequency of 9.5 Hz, Cl does appear to lead the phase of the reattachment location by π/2. This observation is consistent with the cross-correlation coefficient shown in Fig. 10. Additionally, Cm appears to be out of phase with the reattachment location (by a factor of π) at 9.5 Hz, which is also consistent with the cross-correlation coefficient shown in Fig. 10. The phase relationship of the reattachment location and Ch, however, is closer to 3π/2 at 9.5 Hz, which is essentially -π/2. This is also consistent with the cross-correlation coefficient shown in Fig. 10, as the cross-correlation coefficient of xr and Ch appears to be similar to that between xr and Cl.
(sec)
x/c
-0.2 -0.1 0 0.1 0.20
0.2
0.4
0.6
0.8
1
0.250.20.150.10.050
-0.05-0.1-0.15-0.2-0.25
Dow
nloa
ded
by U
NIV
ER
SIT
Y O
F IL
LIN
OIS
on
Aug
ust 1
4, 2
013
| http
://ar
c.ai
aa.o
rg |
DO
I: 1
0.25
14/6
.201
3-26
73
Copyright © 2013 by P. Ansell and M. Bragg. Published by the American Institute of Aeronautics and Astronautics, Inc., with permission.

12 American Institute of Aeronautics and Astronautics
Fig. 12. Phase relationship between shear-layer reattachment location and iced-airfoil performance across low-frequency range, α = 5°. The analysis performed insofar on the low-frequency mode of oscillation in the iced-airfoil flowfield reveal consistency in the frequency content of the reattachment location and the airfoil performance, as well as a phase relationship between the separation bubble length and the airfoil performance. However, additional understanding of the low-frequency mode that operates in the iced-airfoil performance and reattachment location can be obtained by observing changes in spectral content over time. This was accomplished by performing a wavelet transform on the conditionally-averaged signals. The Mortlet wavelet was used to calculate the continuous wavelet transform (CWT) of the conditionally-averaged reattachment location and iced-airfoil performance, and the resulting wavelet transforms are shown in Fig. 13. From Fig. 13, as expected, the high-concentrations of energy in the signals correspond to the same frequency near 9.5 Hz, as was the case in Fig. 9. However, it is interesting to note that the concentration of energy near 9.5 Hz is not constant across time. Instead, a region of high-amplitude activity at 9.5 Hz can be observed in all of the wavelet transforms in Fig. 13 near t = 0 sec, that then decreases in magnitude farther from t = 0 sec. This can be expected, as the purpose of the conditional average was to focus the signal analysis on one average low-frequency oscillation cycle. As seen in Fig. 13 a), the wavelet transform of the conditionally-averaged shear-layer reattachment location produces a high-amplitude output at 0 sec. This suggests that the conditional averaging scheme that was used in this investigation correctly centers the signals being averaged about a reference center in the low-frequency mode in the reattachment location. Additionally, from Fig. 13, b), c), and d), the wavelet transforms of the conditionally-averaged iced-airfoil performance coefficients produced high-amplitude outputs at times that are consistent with the high-amplitude spectral content observed in the reattachment location. From Fig. 13 b), the maximum wavelet transform output near 9.5 Hz for Cl occurs at a time of 0 sec. While the cross-correlation coefficient between xr and Cl shown in Fig. 10 displayed nearly zero correlation between xr and Cl at τ = 0 sec, the time corresponding to the highest level of spectral content at 9.5 Hz was the same between the reattachment location and Cl. This is to be expected, as the cross-correlation coefficient determines the time-dependent relationship between these two signals by comparing relative magnitudes across various time lags, while the CWT determines the magnitude of oscillations at a given frequency. Thus, it is possible that the oscillations can be strongest in xr and Cl at the same instance in time, even if this does not correspond to the instance in time of an absolute extremum in a signal.
In Fig. 13 c) and d), the high-amplitude output in the wavelet transform near 9.5 Hz for Cm and Ch occurs at t = -0.0275 sec and t = -0.0225, respectively. This slight difference in time can be attributed to the convective qualities of the pressure oscillations across the airfoil surface. Since the surface static pressure across the trailing-edge region of the airfoil has a dominating influence on both Cm and Ch, it can be expected that these measurements will display high-amplitude levels in the CWT at time instances where the trailing-edge pressure oscillations are greatest. By inspecting the cross-correlation coefficient between xr and Cp in Fig. 11, it can be observed that the time of maximum amplitude in the CWT of Cm and Ch corresponds to the time lag of maximum correlation
Freq (Hz)
(r
ad
ian
s)
0 10 20 30-15
-10
-5
0
5
10
15
Cl
Cm
Ch
/2
-/2
-0.482
0.990 1.389
Dow
nloa
ded
by U
NIV
ER
SIT
Y O
F IL
LIN
OIS
on
Aug
ust 1
4, 2
013
| http
://ar
c.ai
aa.o
rg |
DO
I: 1
0.25
14/6
.201
3-26
73
Copyright © 2013 by P. Ansell and M. Bragg. Published by the American Institute of Aeronautics and Astronautics, Inc., with permission.

13 American Institute of Aeronautics and Astronautics
coefficient at the airfoil trailing edge in Fig. 11. Thus, it is likely that the high-amplitude content observed in the CWT of Cm and Ch near t = -0.025 is actually a product of the prior oscillation cycle at 9.5 Hz.
Fig. 13. Continuous Morlet wavelet transform, α = 5°: a) Shear-layer reattachment location, b) Cl, c) Cm, d) Ch; maximum amplitude at 9.5 Hz marked with square symbol.
Since the oscillations in Cp were observed to be convected across the airfoil upper surface in Fig. 11, additional effort was taken to further characterize the propagation of these oscillations. The propagation of the low-frequency mode can be observed by studying the shift in phase angle between pressure transducers across the airfoil surface at a particular frequency. This allows the average convection characteristics of particular Fourier modes of interest to be determined. The distribution in phase angle of the airfoil Cp across the upper surface, corresponding to the low-frequency mode at 9.5 Hz, is shown in Fig. 14. The phase angle distribution in Fig. 14 was calculated in reference to the Cp of the farthest upstream pressure transducer location on the airfoil upper surface. Also included in Fig. 14 is a linear data fit of the phase angle distribution for the section downstream of x/c = 0.20. From Fig. 14, it is interesting to note the change in the phase angle progression of the low-frequency mode across the upper surface, particularly near x/c = 0.20. This location corresponds to 42% of the mean separation bubble length (x = 0.42xr). At this location, the relative phase angle of the surface static Cp appears to quickly increase from x/c = 0.105 to x/c = 0.210. Similar observations have been previously made by Hudy et al.,29 where the phase angle associated with shear layer flapping suddenly increased by a factor of π upon a change from upstream convection to downstream convection of the low frequency mode near x = 0.5xr. Similar results were observed by Heenan and
Time (sec)
Fre
q(H
z)
-0.4 -0.2 0 0.2 0.40
10
20
30
CWT (dB)-20-25-30-35-40-45-50
a)
xr
Time (sec)
Fre
q(H
z)
-0.4 -0.2 0 0.2 0.40
10
20
30
CWT (dB)-25-30-35-40-45-50-55
b)
Cl
Time (sec)
Fre
q(H
z)
-0.4 -0.2 0 0.2 0.40
10
20
30
CWT (dB)-35-40-45-50-55-60-65
c)
Cm
Time (sec)
Fre
q(H
z)
-0.4 -0.2 0 0.2 0.40
10
20
30
CWT (dB)-30-35-40-45-50-55-60
d)
Ch
Dow
nloa
ded
by U
NIV
ER
SIT
Y O
F IL
LIN
OIS
on
Aug
ust 1
4, 2
013
| http
://ar
c.ai
aa.o
rg |
DO
I: 1
0.25
14/6
.201
3-26
73
Copyright © 2013 by P. Ansell and M. Bragg. Published by the American Institute of Aeronautics and Astronautics, Inc., with permission.

14 American Institute of Aeronautics and Astronautics
Morrison,30 where the shear-layer flapping frequency appeared to change from upstream convection to downstream convection across x = 0.4xr.
A given shift in phase angle between two known locations is commonly used to determine the time delay of a given Fourier mode between these two locations. In the current example, the time delay represents the average convection time for the given Fourier mode between two locations. This method has been shown by Piersol31 to be capable of rendering time delay estimates with the same accuracy as other conventional methods of estimating time delay. The time delay associated with a given phase angle between two measurements can be calculated by28
τ0=θpq( )
2
(3)
where τ0 represents the time delay and θpq represents the relative phase angle between locations p and q. The time delays corresponding to the distribution of phase angles are also included in Fig. 14.
With the time delay and the distance between two locations known, the average convection velocity of a given Fourier mode can be calculated. In this way, the slope of the phase angle distribution can also be used to calculate the average convection velocity
Uc
2π c
m
(4)
where Uc represents the convection velocity and m represents the slope of θ with respect to x/c. Using the slope of the phase angle distribution shown in Fig. 14, downstream of x/c = 0.20 the average convection velocity of the low-frequency mode was calculated to be 0.145U∞. This convection velocity is similar to the value of 0.124U∞ reported by Gurbacki.10 By comparing Fig. 14 with Fig. 11, the distribution of time delays in Fig. 14 appear to be consistent with the time lags associated with the cross-correlation coefficient of xr and Cp in Fig. 11.
Fig. 14. Convection of low-frequency mode (f = 9.5 Hz), displaying phase angle and time delay distribution across airfoil upper surface.
The relationship between the propagation of the low-frequency mode through the upper surface Cp and the
movement of the shear-layer reattachment location can be further studied using the wavelet transform of the unsteady Cp signals from the surface-integrated pressure transducers. By performing a wavelet transform on each of these Cp signals and extracting the variations in amplitude at the low-frequency mode at 9.5 Hz, changes in the energy content of the low-frequency mode throughout the surface pressure flowfield can be observed as a function of time. Using the same conditional averaging scheme discussed earlier, the average progression of the low-frequency mode through the upper surface Cp can be identified in response to an oscillation of the shear-layer reattachment location at the low-frequency mode. The resulting wavelet-based progression of the low-frequency mode through the airfoil Cp is shown in Fig. 15.
x/c
(r
ad
ian
s)
0(s
ec
)
0 0.2 0.4 0.6 0.8 1-1
0
1
2
3
4
5
0
0.02
0.04
0.06
0.08
Dow
nloa
ded
by U
NIV
ER
SIT
Y O
F IL
LIN
OIS
on
Aug
ust 1
4, 2
013
| http
://ar
c.ai
aa.o
rg |
DO
I: 1
0.25
14/6
.201
3-26
73
Copyright © 2013 by P. Ansell and M. Bragg. Published by the American Institute of Aeronautics and Astronautics, Inc., with permission.
15 American Institute of Aeronautics and Astronautics
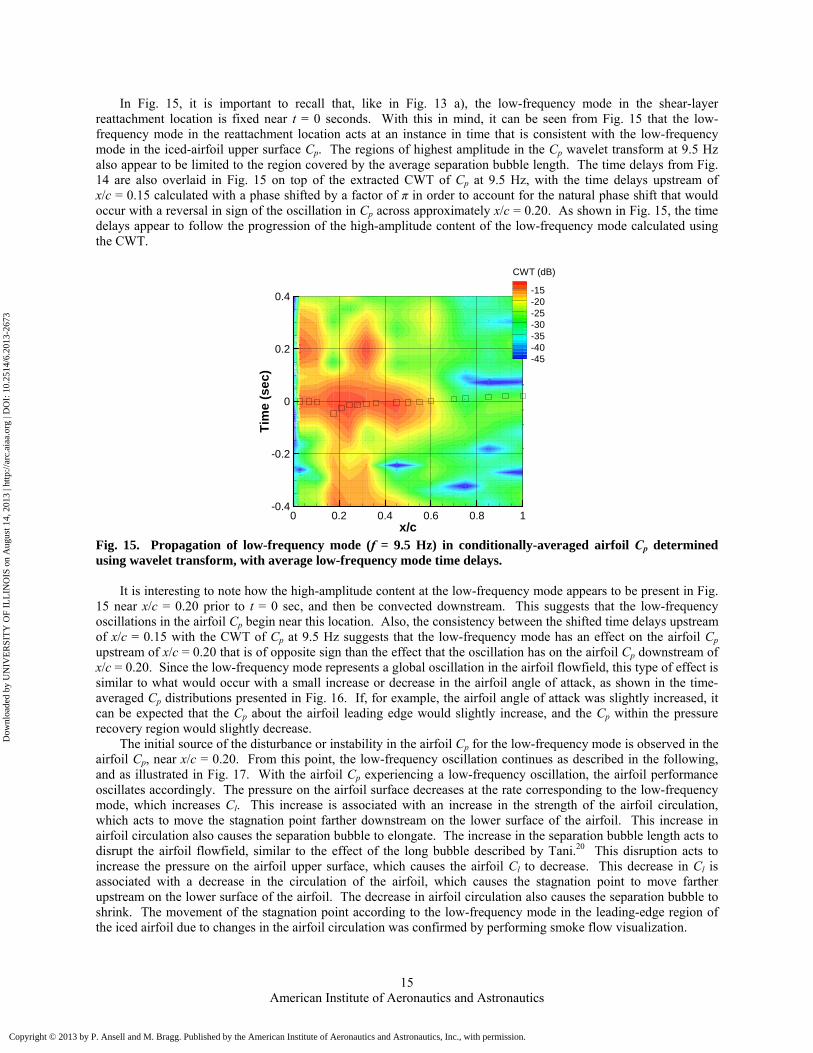
In Fig. 15, it is important to recall that, like in Fig. 13 a), the low-frequency mode in the shear-layer reattachment location is fixed near t = 0 seconds. With this in mind, it can be seen from Fig. 15 that the low-frequency mode in the reattachment location acts at an instance in time that is consistent with the low-frequency mode in the iced-airfoil upper surface Cp. The regions of highest amplitude in the Cp wavelet transform at 9.5 Hz also appear to be limited to the region covered by the average separation bubble length. The time delays from Fig. 14 are also overlaid in Fig. 15 on top of the extracted CWT of Cp at 9.5 Hz, with the time delays upstream of x/c = 0.15 calculated with a phase shifted by a factor of π in order to account for the natural phase shift that would occur with a reversal in sign of the oscillation in Cp across approximately x/c = 0.20. As shown in Fig. 15, the time delays appear to follow the progression of the high-amplitude content of the low-frequency mode calculated using the CWT.
Fig. 15. Propagation of low-frequency mode (f = 9.5 Hz) in conditionally-averaged airfoil Cp determined using wavelet transform, with average low-frequency mode time delays.
It is interesting to note how the high-amplitude content at the low-frequency mode appears to be present in Fig.
15 near x/c = 0.20 prior to t = 0 sec, and then be convected downstream. This suggests that the low-frequency oscillations in the airfoil Cp begin near this location. Also, the consistency between the shifted time delays upstream of x/c = 0.15 with the CWT of Cp at 9.5 Hz suggests that the low-frequency mode has an effect on the airfoil Cp upstream of x/c = 0.20 that is of opposite sign than the effect that the oscillation has on the airfoil Cp downstream of x/c = 0.20. Since the low-frequency mode represents a global oscillation in the airfoil flowfield, this type of effect is similar to what would occur with a small increase or decrease in the airfoil angle of attack, as shown in the time-averaged Cp distributions presented in Fig. 16. If, for example, the airfoil angle of attack was slightly increased, it can be expected that the Cp about the airfoil leading edge would slightly increase, and the Cp within the pressure recovery region would slightly decrease. The initial source of the disturbance or instability in the airfoil Cp for the low-frequency mode is observed in the airfoil Cp, near x/c = 0.20. From this point, the low-frequency oscillation continues as described in the following, and as illustrated in Fig. 17. With the airfoil Cp experiencing a low-frequency oscillation, the airfoil performance oscillates accordingly. The pressure on the airfoil surface decreases at the rate corresponding to the low-frequency mode, which increases Cl. This increase is associated with an increase in the strength of the airfoil circulation, which acts to move the stagnation point farther downstream on the lower surface of the airfoil. This increase in airfoil circulation also causes the separation bubble to elongate. The increase in the separation bubble length acts to disrupt the airfoil flowfield, similar to the effect of the long bubble described by Tani.20 This disruption acts to increase the pressure on the airfoil upper surface, which causes the airfoil Cl to decrease. This decrease in Cl is associated with a decrease in the circulation of the airfoil, which causes the stagnation point to move farther upstream on the lower surface of the airfoil. The decrease in airfoil circulation also causes the separation bubble to shrink. The movement of the stagnation point according to the low-frequency mode in the leading-edge region of the iced airfoil due to changes in the airfoil circulation was confirmed by performing smoke flow visualization.
x/c
Tim
e(s
ec
)
0 0.2 0.4 0.6 0.8 1-0.4
-0.2
0
0.2
0.4
CWT (dB)
-15-20-25-30-35-40-45
Dow
nloa
ded
by U
NIV
ER
SIT
Y O
F IL
LIN
OIS
on
Aug
ust 1
4, 2
013
| http
://ar
c.ai
aa.o
rg |
DO
I: 1
0.25
14/6
.201
3-26
73
Copyright © 2013 by P. Ansell and M. Bragg. Published by the American Institute of Aeronautics and Astronautics, Inc., with permission.

16 American Institute of Aeronautics and Astronautics
Fig. 16. Iced-airfoil time-averaged Cp for α = 5° and small increase or decrease in angle of attack.
Fig. 17. Schematic of low-frequency oscillation cycle.
IV. Summary and Conclusions
This paper provides an analysis of the relationship between a low-frequency mode of the ice-induced separation bubble length and iced-airfoil performance. The unsteady location of shear-layer reattachment was determined on an NACA 0012 airfoil with a leading-edge horn-ice shape using measurements obtained from a surface-mountable hot-film array. These measurements were time-resolved with measurements from a series of surface-integrated pressure transducers, which were used to determine unsteady airfoil performance. Both the reattachment location and iced-airfoil performance exhibited an average low-frequency mode near 9.5 Hz. After performing a conditional average on the shear-layer reattachment location and the iced-airfoil performance, the average relationship between the separation bubble length and iced-airfoil performance was identified. A π/2 phase relationship between the reattachment location and the lift coefficient at the low-frequency mode was discovered. Regions of high-amplitude energy at the low-frequency mode were also identified for both the reattachment location and iced-airfoil
x/c
Cp
0 0.2 0.4 0.6 0.8 1
-2.5
-2
-1.5
-1
-0.5
0
0.5
1
1.5
= 4.5° Upper Surface = 4.5° Lower Surface = 5° Upper Surface = 5° Lower Surface = 5.5° Upper Surface = 5.5° Lower Surface
Increasing Pressure
Decreasing Pressure
Dow
nloa
ded
by U
NIV
ER
SIT
Y O
F IL
LIN
OIS
on
Aug
ust 1
4, 2
013
| http
://ar
c.ai
aa.o
rg |
DO
I: 1
0.25
14/6
.201
3-26
73
Copyright © 2013 by P. Ansell and M. Bragg. Published by the American Institute of Aeronautics and Astronautics, Inc., with permission.

17 American Institute of Aeronautics and Astronautics
performance using continuous wavelet transforms. From this, the low-frequency oscillations were observed to occur in the reattachment location and the airfoil performance at similar time instances.
Investigation of the progression of the low-frequency mode across the airfoil surface was performed using phase angle analysis. Extraction of the low-frequency mode from the conditionally-averaged Cp wavelet transforms also provided a mapping of the low-frequency energy across the airfoil surface as a function of time. The low-frequency mode was observed to begin in the airfoil Cp near x/c = 0.20 (x = 0.42xr). Like for the airfoil performance, high-amplitude activity was present in the airfoil Cp at a time when it was also observed in the reattachment location.
An explanation of one oscillation cycle at the low-frequency mode was described. The oscillation in the airfoil Cp causes the oscillations in the airfoil performance. As Cl reaches a maximum, the increased circulation of the airfoil causes an elongation of the separation bubble. The long extent of separated flow disrupts the airfoil flowfield, which causes Cl to decrease. This decrease in Cl is associated with a decrease in the airfoil circulation, which then causes the separation bubble to shrink, which completes the oscillation cycle.
Acknowledgements
The authors wish to thank Dr. Mike Kerho of Rolling Hills Research Corporation, along with Mark Davis and the staff of NASA Dryden Flight Research Center for their contributions to this work. Support for this program was provided via STTR Contract No. NNX10CB57C.
References
1 Dillingham, G.L., “Preliminary Information on Aircraft Icing and Winter Operations,” GAO-10-441T, United States Government Accountability Office Testimony Before the Subcommittee on Aviation. Committee on Transportation and Infrastructure, 2010. 2 Addy, H.E., Potapczuk, M.G., and Sheldon, D.W., “Modern Airfoil Ice Accretions,” AIAA-97-0174, 35th AIAA Aerospace Sciences Meeting and Exhibit, Reno, NV, Jan. 1997. 3 Bragg, M.B., Broeren, A.P., and Blumenthal, L., “Iced-Airfoil Aerodynamics,” Progress in Aerospace Sciences, Vol. 41, No. 5, 2005, pp. 323-362. 4 Broeren, A.P., Bragg, M.B., Addy, H.E., Lee, S., Moens, F., and Guffond, D., “Effect of High-Fidelity Ice-Accretion Simulations on Full-Scale Airfoil Performance,” AIAA Journal of Aircraft, Vol. 47, No. 1, 2010, pp. 240-254. 5 Bragg, M.B., Hutchison, T., Merret, J., Oltman, R., and Pokhariyal, D., “Effect of Ice Accretion on Aircraft Flight Dynamics,” AIAA-2000-0360, 38th AIAA Aerospace Sciences Meeting and Exhibit, Reno, NV, Jan. 2000. 6 Zaman, K.B.M.Q., and Potapczuk, M.G., “The Low-Frequency Oscillation in the Flow over a NACA 0012 Airfoil with an ‘Iced’ Leading Edge,” NASA/TM-102018, June 1989. 7 Zaman, K.B.M.Q., McKinzie, D.J., and Rumsey, C.L., “A Natural Low Frequency Oscillation of the Flow over an Airfoil Near Stalling Conditions,” Journal of Fluid Mechanics, Vol. 202, 1989 pp. 403-442. 8 Potapczuk, M.G., “Numerical Analysis of an NACA 0012 Airfoil with Leading-Edge Ice Accretions,” AIAA Journal of Aircraft, Vol. 25, No. 3, 1988, pp. 193-194. 9 Bragg, M.B., Khodadoust, A., and Spring, S.A., “Measurements in a Leading-Edge Separation Bubble due to a Simulated Airfoil Ice Accretion,” AIAA Journal, Vol. 30, No. 6, 1992, pp. 1462-1467. 10 Gurbacki, H. M., “Ice-Induced Unsteady Flowfield Effects on Airfoil Performance,” Ph.D. Dissertation, University of Illinois at Urbana-Champaign, 2003. 11 Gurbacki, H.M., and Bragg, M.B., “Unsteady Aerodynamic Measurements on an Iced Airfoil,” 42nd AIAA Aerospace Sciences Meeting and Exhibit, Reno, NV, Jan. 2004. 12 Jacobs, J.J., “Iced Airfoil Separation Bubble Measurements by Particle Image Velocimetry,” Ph.D. Dissertation, University of Illinois at Urbana-Champaign, 2007. 13 Ansell, P.J., Bragg, M.B., and Kerho, M.F., “Envelope Protection System for Iced Airfoils Using Flap Hinge Moment,” 11ICE-0025/2011-38-0066, SAE 2011 International Conference on Aircraft and Engine Icing and Ground Deicing, Chicago, IL, June, 2011. 14 Zaman, K.B.M.Q., Bar-Sever, A., and Mangalam, S.M., “Effect of Acoustic Excitation on the Flow over a Low-Re Airfoil,” Journal of Fluid Mechanics, Vol. 182, 1987, pp. 127-148. 15 Bragg, M.B., Heinrich, D.C., Khodadoust, A., “Low-Frequency Flow Oscillation over Airfoils near Stall,” AIAA Journal, Vol. 31, No. 7, 1993, pp. 1341-1343. 16 Bragg, M.B., Heinrich, D.C., Balow, F.A., and Zaman, K.B.M.Q., “Flow Oscillation over an Airfoil Near Stall,” AIAA Journal, Vol. 34, No. 1, 1996, pp. 199-201.
Dow
nloa
ded
by U
NIV
ER
SIT
Y O
F IL
LIN
OIS
on
Aug
ust 1
4, 2
013
| http
://ar
c.ai
aa.o
rg |
DO
I: 1
0.25
14/6
.201
3-26
73
Copyright © 2013 by P. Ansell and M. Bragg. Published by the American Institute of Aeronautics and Astronautics, Inc., with permission.

18 American Institute of Aeronautics and Astronautics
17 Broeren, A.P. and Bragg, M.B., “Flowfield Measurements over an Airfoil During Natural Low-Frequency Oscillations Near Stall,” AIAA Journal, Vol. 37, No. 1, 1998, pp. 130-132. 18 Broeren, A.P., “An Experimental Study of Unsteady Flow over Airfoils Near Stall,” Ph.D. Dissertation, Department of Mechanical and Industrial Engineering, University of Illinois, Urbana, IL 2000. 19 Rinoie, K. and Takemura, N., “Oscillating Behavior of Laminar Separation Bubble Formed on an Aerofoil Near Stall,” Aeronautical Journal, Vol. 108, No. 1081, 2004, pp. 153-163. 20 Tani, I., “Low-Speed Flows Involving Bubble Separations,” Progress in Aerospace Sciences, Vol. 5, 1964, pp. 70-103. 21 Gaster, M., “The Structure and Behavior of Laminar Separation Bubbles,” Aeronautical Research Council R&M 3595, 1967. 22 Almutairi, J.H. and AlQadi, I.M., “Large-Eddy Simulation of Natural Low-Frequency Oscillations of Separating-Reattaching Flow Near Stall Conditions,” AIAA Journal, Vol. 51, No. 4, 2013, pp. 981-991. 23 Senflex Multi-Element Surface Hot-Film Sensors: General Information and Catalog of Standard Arrays, Tao of Systems Integration, Inc., Hampton, VA. 24 Ansell, P.J. and Bragg, M.B., “Measurement of Unsteady Flow Reattachment on an Airfoil with a Leading-Edge Horn-Ice Shape,” 30th AIAA Applied Aerodynamics Conference, New Orleans, LA, June 2012. 25 Kiya, M., and Sasaki, K., “Structure of Large-Scale Vortices and Unsteady Reverse Flow in the Reattaching Zone of a Turbulent Separation Bubble,” Journal of Fluid Mechanics, Vol. 154, 1985, pp. 463-491. 26 Schäfer, F., Breuer, M., and Durst, F., “The Dynamics of the Transitional Flow over a Backward-Facing Step,” Journal of Fluid Mechanics, Vol. 623, 2009, pp. 85-119. 27 Sandham, N.D., “Transitional Separation Bubbles and Unsteady Aspects of Aerofoil Stall,” Aeronautical Journal, Vol. 112, No. 1133, 2008, pp. 395-404. 28 Bendat, J.S., and Piersol, A.G., Random Data: Analysis and Measurement Procedures, 3rd ed., New York, NY: Wiley-Interscience, 2000. 29 Hudy, L.M., Naguib, A.M., and Humphreys, W.M., “Wall-Pressure-Array Measurements Beneath a Separating/Reattaching Flow Region,” Physics of Fluids, Vol. 15, No. 3, 2003, pp. 706-717. 30 Heenan, A.F. and Morrison, J.F., “Passive Control of Pressure Fluctuations Generated by Separated Flow,” AIAA Journal, Vol. 36, No. 6, 1998, pp. 1014-1022. 31 Piersol, A.G., “Time Delay Estimation Using Phase Data,” IEEE Transactions on Acoustics, Speech, and Signal Processing, Vol. ASSP-29, No. 3, 1981, pp. 471-477.
Dow
nloa
ded
by U
NIV
ER
SIT
Y O
F IL
LIN
OIS
on
Aug
ust 1
4, 2
013
| http
://ar
c.ai
aa.o
rg |
DO
I: 1
0.25
14/6
.201
3-26
73
Copyright © 2013 by P. Ansell and M. Bragg. Published by the American Institute of Aeronautics and Astronautics, Inc., with permission.