characterization of intact monoclonal antibody with microfluidic chip electrophoresis ...€¦ ·...
TRANSCRIPT
Characterization of intact monoclonal antibody with microfluidic chip electrophoresis mass spectrometry
Authors
Chien-Hsun Chen,1 Andreas Krupke,2 Stephane Houel,1 Aaron Bailey,1 Aran Paulus,1 Daniel Lopez-Ferrer,1 Andreas FR Huhmer,1 Shiaw-Min Chen,2 Achim Karger,2 Steve Williams,2 Michael Wenz,2 Scott Mellors,3 Chris Petty3 1Thermo Fisher Scientific, San Jose, CA; 2Thermo Fisher Scientific, South San Francisco, CA; 908 Devices, Boston, MA
POSTER NOTE 65000
0
20
40
60
80
100
Rel
ativ
eIn
tens
ity
148165
G0F/G1F+1Lys148325
148488
148653
148200 148400 148600 148800 149000Mass
020406080
1002.514
2.0 2.2 2.4 2.6 2.8 3.0
NL: 2.69E7
B
Chien-Hsun Chen1, Andreas Krupke2, Stephane Houel1, Aaron Bailey1, Aran Paulus1, Daniel Lopez-Ferrer1, Andreas FR Huhmer1, Shiaw-Min Chen2, Achim Karger2, Steve Williams2, Michael Wenz2, Scott Mellors3, Chris Petty3
1Thermo Fisher Scientific, Chromatography and Mass Spectrometry, San Jose, CA, 95134; 2Thermo Fisher Scientific, Life Sciences Solutions, South San Francisco, CA 94080; 3908 Devices, Boston, MA 02210
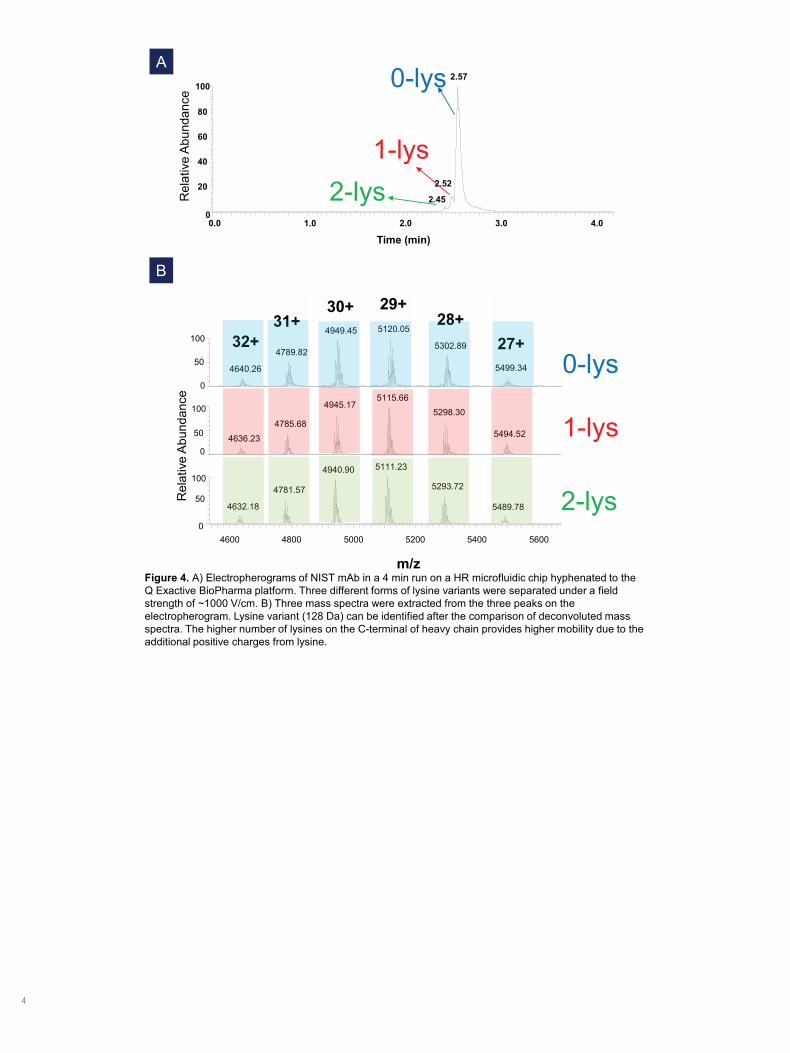
Figure 4. A) Electropherograms of NIST mAb in a 4 min run on a HR microfluidic chip hyphenated to the Q Exactive BioPharma platform. Three different forms of lysine variants were separated under a field strength of ~1000 V/cm. B) Three mass spectra were extracted from the three peaks on the electropherogram. Lysine variant (128 Da) can be identified after the comparison of deconvoluted mass spectra. The higher number of lysines on the C-terminal of heavy chain provides higher mobility due to the additional positive charges from lysine.
ABSTRACTHeterogeneity of monoclonal antibodies (mAbs), including glycosylation variants, carboxyl terminal truncation, and deamidation products, is an important analytical problem in the biopharmaceutical industry. High resolution mass spectrometry is a powerful tool for the characterization of mAbs, however, some proteoforms might not be observed due to sample complexity. In this study, a microfluidic chip electrophoresis system (ZipChip™ from 908 Devices), coupled to the high resolution Thermo Scientific™ Q Exactive™ Biopharma platform, was used to separate and characterize the NIST mAb (RM 8671), capturing distinct lysine variants and respective proteoforms. Preliminary data provides identification of most proteoforms listed in the NIST mAb Referenced Material 8671.
INTRODUCTION The main goal of this work was to develop a method to characterize heterogeneous mAb on an intact protein level. In order to resolve the complexity of mAb, a powerful combination of an efficient separation system, coupled to high-performance mass spectrometer (MS), and data analysis software is necessary. The separation of charge variants is still a challenging task, especially on an intact protein level. Capillary electrophoresis (CE) provides an ideal separation technique for charge variants of mAb. Microfluidic CE provides advantages in characterizing mAb given its good separation efficiency and short migration time based on high field strength and short separation channel. High-performance MS, including high mass accuracy and resolution, is also important for antibody characterization. An Orbitrap™ mass spectrometer is a good option for this application, and the Q Exactive BioPharma platform is suitable for the analysis of very large biomolecules. The challenge of protein MS data analysis usually increases with its molecular weight. The Thermo Scientific™ BioPharma Finder™ software is specifically designed to characterize the complex protein via delicate deconvolution of mass spectra for individual time windows in combination with a thorough comparison to a reference database with all variants. In this study, a powerful combination of microfluidic CE separation, MS detection, and data analysis is presented to solve one of the most challenging workflows in the biopharma industry.
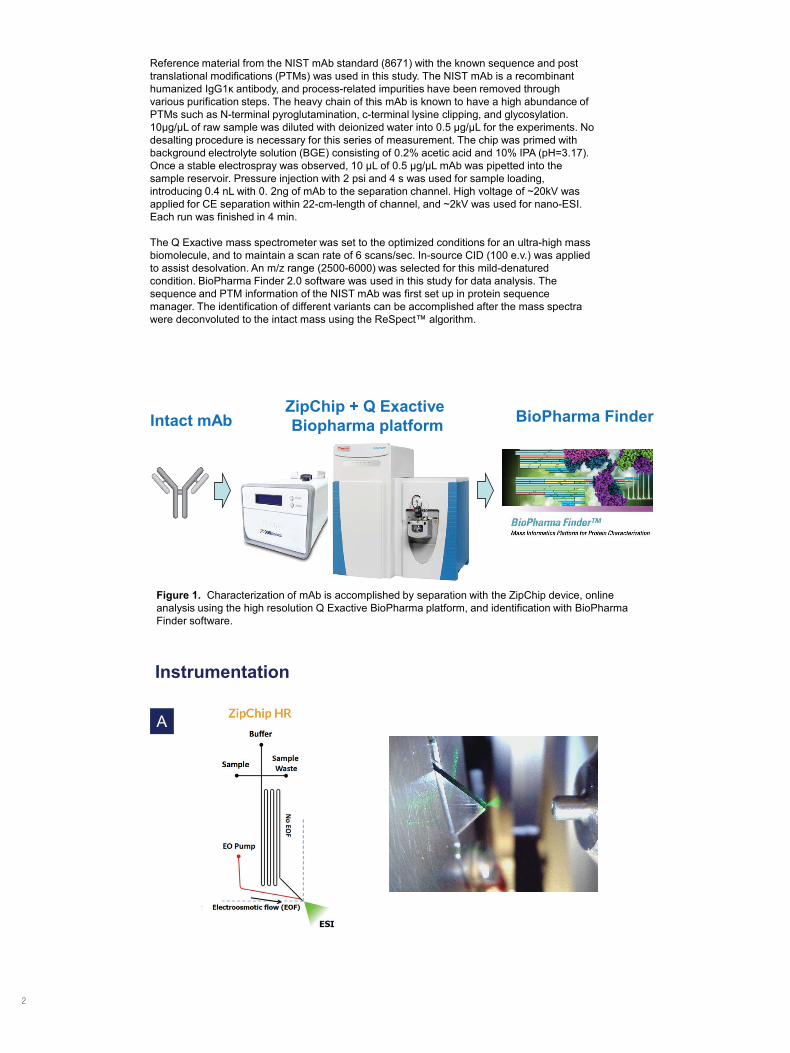
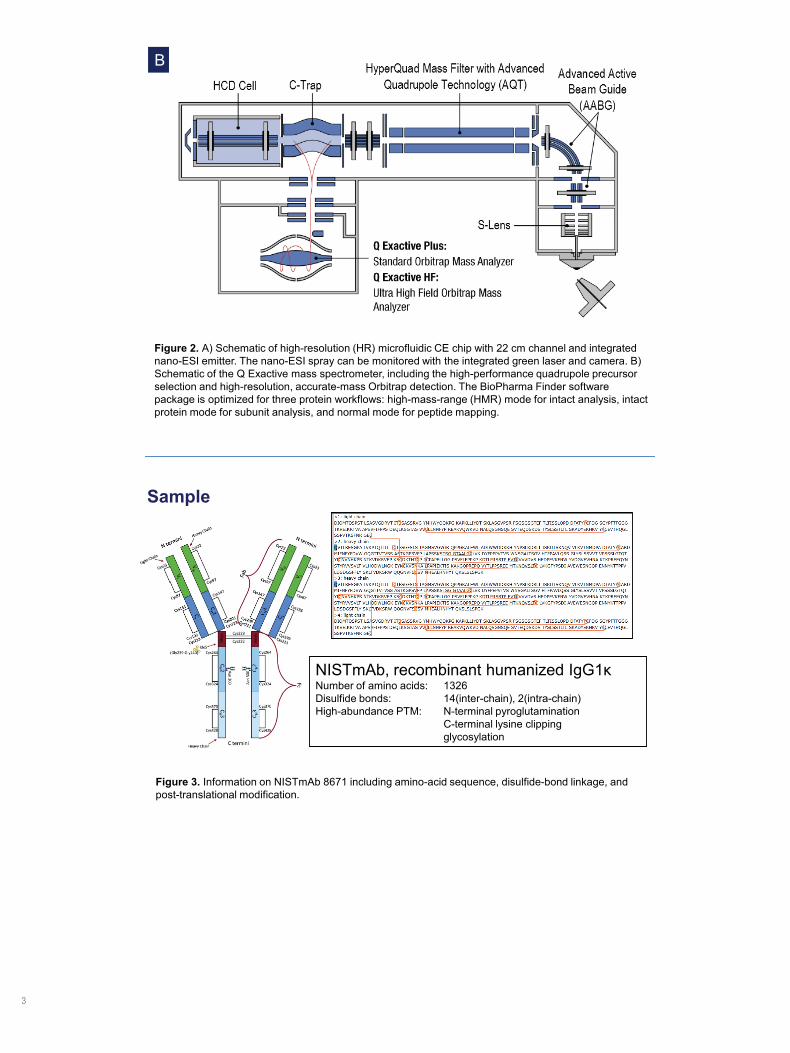
MATERIALS AND METHODS Reference material from the NIST mAb standard (8671) with the known sequence and post translational modifications (PTMs) was used in this study. The NIST mAb is a recombinant humanized IgG1κ antibody, and process-related impurities have been removed through various purification steps. The heavy chain of this mAb is known to have a high abundance of PTMs such as N-terminal pyroglutamination, c-terminal lysine clipping, and glycosylation. 10μg/μL of raw sample was diluted with deionized water into 0.5 μg/μL for the experiments. No desalting procedure is necessary for this series of measurement. The chip was primed with background electrolyte solution (BGE) consisting of 0.2% acetic acid and 10% IPA (pH=3.17). Once a stable electrospray was observed, 10 μL of 0.5 μg/μL mAb was pipetted into the sample reservoir. Pressure injection with 2 psi and 4 s was used for sample loading, introducing 0.4 nL with 0. 2ng of mAb to the separation channel. High voltage of ~20kV was applied for CE separation within 22-cm-length of channel, and ~2kV was used for nano-ESI. Each run was finished in 4 min.
The Q Exactive mass spectrometer was set to the optimized conditions for an ultra-high mass biomolecule, and to maintain a scan rate of 6 scans/sec. In-source CID (100 e.v.) was applied to assist desolvation. An m/z range (2500-6000) was selected for this mild-denatured condition. BioPharma Finder 2.0 software was used in this study for data analysis. The sequence and PTM information of the NIST mAb was first set up in protein sequence manager. The identification of different variants can be accomplished after the mass spectra were deconvoluted to the intact mass using the ReSpect™ algorithm.
CONCLUSIONS • Clear mAb signal was detected within four minutes coupling 908 Devices’ ZipChip system with the Q
Exactive BioPharma platform. No sample preparation or desalting was necessary.• Lysine variants of NIST mAb can be separated on a microfluidic chip electrophoresis device. The
mobility was increased with additional positive charges added to the c-terminal of heavy chain from lysine.
• Five glycosylated variants including G0F/GOF, G0F/G1F, G1F/G1F, G1F/G2F, and G2F/G2F were observed from 2-lys, 1-lys, and 0-lys migration timeframes.• Peaks with different lysine variants can be distinguished from the electropherogram.• Three orders of dynamic range for detection was achieved. • Most of the proteoforms listed in the NIST mAb Reference Material can be identified in this study.
REFERENCES 1. John E. Schiel, Darryl L. Davis, and Oleg V. Borisov, “State-of-the-Art and Emerging technologies for Therapeutic
Monoclonal Antibody Characterization: The NISTmAb Case Study”, American Chemical Society (2015)
2. Erin A. Redman, J. Scott Mellors, Jason A. Starkey, and Michael Ramsey, “Characterization of Intact Antibody Drug Conjugate Variants Using Microfluidic Capillary Electrophoresis – Mass Spectrometry” Anal. Chem. 88, 2220-2226 (2016)
ACKNOWLEDGEMENTS The authors gratefully acknowledge the help and support of Jennifer N. Sutton and Michael A. Blank from Thermo Fisher Scientific.
TRADEMARKS/LICENSING © 2016 Thermo Fisher Scientific Inc. All rights reserved. ZipChip is a trademark of 908 Devices Inc. ReSpect is a trademark of Positive Probablity Ltd. All other trademarks are the property of Thermo Fisher Scientific and its subsidiaries. This information is not intended to encourage use of these products in any manner that might infringe the intellectual property rights of others.
Characterization of Intact Monoclonal Antibody with Microfluidic Chip Electrophoresis Mass Spectrometry
Instrumentation Results
0.0 1.0 2.0 3.0 4.0
Time (min)
0
20
40
60
80
100
Rel
ativ
e A
bund
ance
2.57
2.52
2.452-lys1-lys
0-lys
0
20
40
60
80
100
Rel
ativ
eIn
tens
ity
148036
148199G1F/G1F
148361
G1F/G2F148523 G2F/G2F
148686
147800 148000 148200 148400 148600 148800 149000 149200Mass
0-lysG0F/G0F
G0F/G1F
4600 4800 5000 5200 5400 5600
m/z
0
50
100
0
50
100
Rel
ativ
e A
bund
ance
0
50
1005120.054949.45
5302.894789.82
5499.344640.26
5115.664945.17
5298.304785.68
5494.524636.23
5111.234940.90
5293.724781.57
4632.18 5489.78
0-lys
1-lys
2-lys
29+28+
30+31+
32+ 27+
Sample
NISTmAb, recombinant humanized IgG1κNumber of amino acids: 1326Disulfide bonds: 14(inter-chain), 2(intra-chain)High-abundance PTM: N-terminal pyroglutamination C-terminal lysine clipping glycosylation
Figure 3. Information on NISTmAb 8671 including amino-acid sequence, disulfide-bond linkage, and post-translational modification.
A
B
A
B
C
A
C
A
B
Workflow
Intact mAb BioPharma Finder
Figure 1. Characterization of mAb is accomplished by separation with the ZipChip device, online analysis using the high resolution Q Exactive BioPharma platform, and identification with BioPharma Finder software.
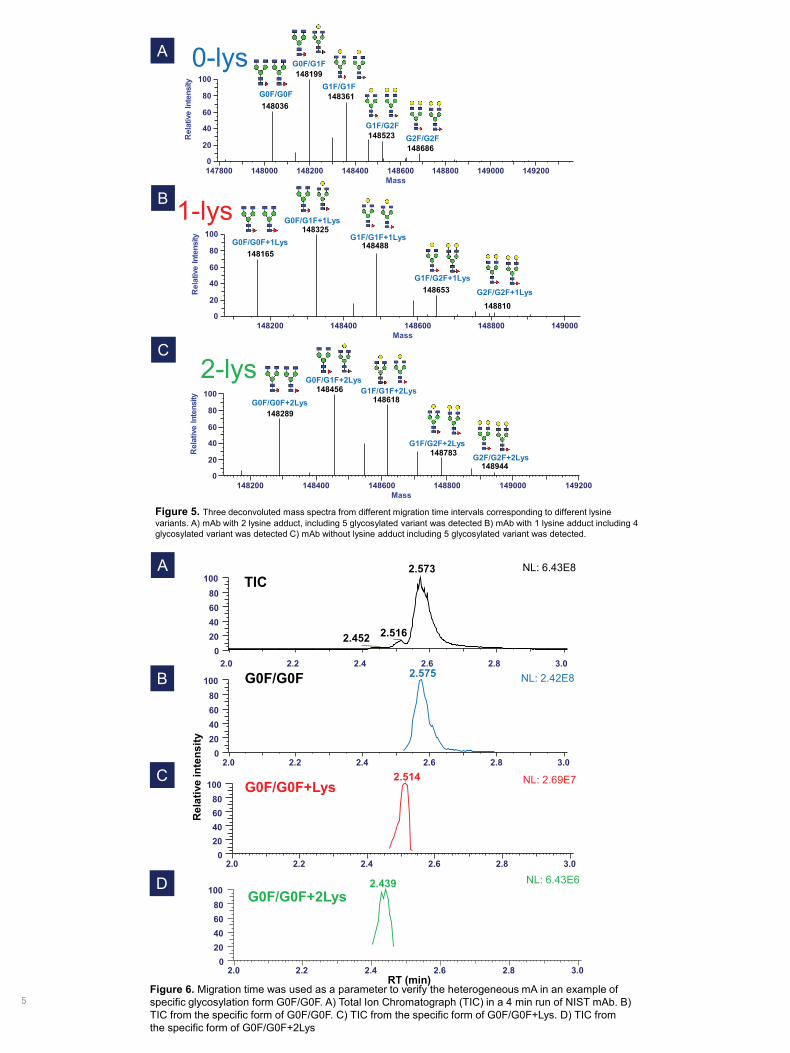
Figure 5. Three deconvoluted mass spectra from different migration time intervals corresponding to different lysine variants. A) mAb with 2 lysine adduct, including 5 glycosylated variant was detected B) mAb with 1 lysine adduct including 4 glycosylated variant was detected C) mAb without lysine adduct including 5 glycosylated variant was detected.
Figure 6. Migration time was used as a parameter to verify the heterogeneous mA in an example of specific glycosylation form G0F/G0F. A) Total Ion Chromatograph (TIC) in a 4 min run of NIST mAb. B) TIC from the specific form of G0F/G0F. C) TIC from the specific form of G0F/G0F+Lys. D) TIC from the specific form of G0F/G0F+2Lys
Table 1. Identified proteoforms of NIST mAb through the BioPharma Finder 2.0 software.
Figure 2. A) Schematic of high-resolution (HR) microfluidic CE chip with 22 cm channel and integrated nano-ESI emitter. The nano-ESI spray can be monitored with the integrated green laser and camera. B) Schematic of the Q Exactive mass spectrometer, including the high-performance quadrupole precursor selection and high-resolution, accurate-mass Orbitrap detection. The BioPharma Finder software package is optimized for three protein workflows: high-mass-range (HMR) mode for intact analysis, intact protein mode for subunit analysis, and normal mode for peptide mapping.
ZipChip + Q Exactive Biopharma platform
D
020406080
100
020406080
1002.573
2.5162.452
2.575
2.0 2.2 2.4 2.6 2.8 3.0
NL: 6.43E8
NL: 2.42E8
0
20
40
60
80
100
Rel
ativ
eIn
tens
ity G0F/G0F+2Lys148289
G0F/G1F+2Lys148456 G1F/G1F+2Lys
148618
G1F/G2F+2Lys148783
148200 148400 148600 148800 149000 149200Mass
G2F/G2F+2Lys148944
2-lys
2.0 2.2 2.4 2.6 2.8 3.0
020406080
1002.439
2.0 2.2 2.4 2.6 2.8 3.0RT (min)
NL: 6.43E6
Rel
ativ
e in
tens
ity
TIC
G0F/G0F
G0F/G0F+Lys
G0F/G0F+2Lys
Protein Name
Average Mass(Da)
Theoretical Mass (Da)
Mass Error (ppm)
Relative Abundance
Migration Time(min)
G0F/G1F 148198.57 148199.21 4.3 100.00 2.525 - 2.796
G1F/G1F 148361.47 148361.35 0.9 72.91 2.529 - 2.796
G0F/G0F 148035.72 148037.07 9.1 61.98 2.516 - 2.796
G1F/G2F 148523.22 148523.49 1.8 26.25 2.555 - 2.796
G2F/G2F 148685.71 148685.63 0.6 12.21 2.525 - 2.796
G0F/G1F+1Lys 148324.56 148327.41 19.2 7.13 2.465 - 2.543
G1F/G1F+1Lys 148488.20 148489.55 9.1 5.05 2.465 - 2.532
G0F/G0F+1Lys 148164.61 148165.27 4.4 4.45 2.460 - 2.538
G1F/G2F+1Lys 148652.87 148651.69 7.9 1.90 2.474 - 2.538
G2F/G2F+1Lys 148810.62 148813.83 21.5 0.49 2.495 - 2.538
G0F/G1F+2Lys 148456.27 148455.61 4.5 1.54 2.416 - 2.463
G0F/G0F+2Lys 148289.32 148293.47 28.0 1.17 2.399 - 2.468
G1F/G1F+2Lys 148617.97 148617.75 1.5 1.15 2.399 - 2.463
G1F/G2F+2Lys 148782.93 148779.89 20.5 0.38 2.405 - 2.457
G2F/G2F+2Lys 148944.03 148942.03 13.4 0.10 2.416 - 2.457
1-lysG0F/G0F+1Lys G1F/G1F+1Lys
G1F/G2F+1Lys
148810G2F/G2F+1Lys
2
0
20
40
60
80
100
Rel
ativ
eIn
tens
ity
148165
G0F/G1F+1Lys148325
148488
148653
148200 148400 148600 148800 149000Mass
020406080
1002.514
2.0 2.2 2.4 2.6 2.8 3.0
NL: 2.69E7
B
Chien-Hsun Chen1, Andreas Krupke2, Stephane Houel1, Aaron Bailey1, Aran Paulus1, Daniel Lopez-Ferrer1, Andreas FR Huhmer1, Shiaw-Min Chen2, Achim Karger2, Steve Williams2, Michael Wenz2, Scott Mellors3, Chris Petty3
1Thermo Fisher Scientific, Chromatography and Mass Spectrometry, San Jose, CA, 95134; 2Thermo Fisher Scientific, Life Sciences Solutions, South San Francisco, CA 94080; 3908 Devices, Boston, MA 02210
Figure 4. A) Electropherograms of NIST mAb in a 4 min run on a HR microfluidic chip hyphenated to the Q Exactive BioPharma platform. Three different forms of lysine variants were separated under a field strength of ~1000 V/cm. B) Three mass spectra were extracted from the three peaks on the electropherogram. Lysine variant (128 Da) can be identified after the comparison of deconvoluted mass spectra. The higher number of lysines on the C-terminal of heavy chain provides higher mobility due to the additional positive charges from lysine.
ABSTRACTHeterogeneity of monoclonal antibodies (mAbs), including glycosylation variants, carboxyl terminal truncation, and deamidation products, is an important analytical problem in the biopharmaceutical industry. High resolution mass spectrometry is a powerful tool for the characterization of mAbs, however, some proteoforms might not be observed due to sample complexity. In this study, a microfluidic chip electrophoresis system (ZipChip™ from 908 Devices), coupled to the high resolution Thermo Scientific™ Q Exactive™ Biopharma platform, was used to separate and characterize the NIST mAb (RM 8671), capturing distinct lysine variants and respective proteoforms. Preliminary data provides identification of most proteoforms listed in the NIST mAb Referenced Material 8671.
INTRODUCTION The main goal of this work was to develop a method to characterize heterogeneous mAb on an intact protein level. In order to resolve the complexity of mAb, a powerful combination of an efficient separation system, coupled to high-performance mass spectrometer (MS), and data analysis software is necessary. The separation of charge variants is still a challenging task, especially on an intact protein level. Capillary electrophoresis (CE) provides an ideal separation technique for charge variants of mAb. Microfluidic CE provides advantages in characterizing mAb given its good separation efficiency and short migration time based on high field strength and short separation channel. High-performance MS, including high mass accuracy and resolution, is also important for antibody characterization. An Orbitrap™ mass spectrometer is a good option for this application, and the Q Exactive BioPharma platform is suitable for the analysis of very large biomolecules. The challenge of protein MS data analysis usually increases with its molecular weight. The Thermo Scientific™ BioPharma Finder™ software is specifically designed to characterize the complex protein via delicate deconvolution of mass spectra for individual time windows in combination with a thorough comparison to a reference database with all variants. In this study, a powerful combination of microfluidic CE separation, MS detection, and data analysis is presented to solve one of the most challenging workflows in the biopharma industry.
MATERIALS AND METHODS Reference material from the NIST mAb standard (8671) with the known sequence and post translational modifications (PTMs) was used in this study. The NIST mAb is a recombinant humanized IgG1κ antibody, and process-related impurities have been removed through various purification steps. The heavy chain of this mAb is known to have a high abundance of PTMs such as N-terminal pyroglutamination, c-terminal lysine clipping, and glycosylation. 10μg/μL of raw sample was diluted with deionized water into 0.5 μg/μL for the experiments. No desalting procedure is necessary for this series of measurement. The chip was primed with background electrolyte solution (BGE) consisting of 0.2% acetic acid and 10% IPA (pH=3.17). Once a stable electrospray was observed, 10 μL of 0.5 μg/μL mAb was pipetted into the sample reservoir. Pressure injection with 2 psi and 4 s was used for sample loading, introducing 0.4 nL with 0. 2ng of mAb to the separation channel. High voltage of ~20kV was applied for CE separation within 22-cm-length of channel, and ~2kV was used for nano-ESI. Each run was finished in 4 min.
The Q Exactive mass spectrometer was set to the optimized conditions for an ultra-high mass biomolecule, and to maintain a scan rate of 6 scans/sec. In-source CID (100 e.v.) was applied to assist desolvation. An m/z range (2500-6000) was selected for this mild-denatured condition. BioPharma Finder 2.0 software was used in this study for data analysis. The sequence and PTM information of the NIST mAb was first set up in protein sequence manager. The identification of different variants can be accomplished after the mass spectra were deconvoluted to the intact mass using the ReSpect™ algorithm.
CONCLUSIONS • Clear mAb signal was detected within four minutes coupling 908 Devices’ ZipChip system with the Q
Exactive BioPharma platform. No sample preparation or desalting was necessary.• Lysine variants of NIST mAb can be separated on a microfluidic chip electrophoresis device. The
mobility was increased with additional positive charges added to the c-terminal of heavy chain from lysine.
• Five glycosylated variants including G0F/GOF, G0F/G1F, G1F/G1F, G1F/G2F, and G2F/G2F were observed from 2-lys, 1-lys, and 0-lys migration timeframes.• Peaks with different lysine variants can be distinguished from the electropherogram.• Three orders of dynamic range for detection was achieved. • Most of the proteoforms listed in the NIST mAb Reference Material can be identified in this study.
REFERENCES 1. John E. Schiel, Darryl L. Davis, and Oleg V. Borisov, “State-of-the-Art and Emerging technologies for Therapeutic
Monoclonal Antibody Characterization: The NISTmAb Case Study”, American Chemical Society (2015)
2. Erin A. Redman, J. Scott Mellors, Jason A. Starkey, and Michael Ramsey, “Characterization of Intact Antibody Drug Conjugate Variants Using Microfluidic Capillary Electrophoresis – Mass Spectrometry” Anal. Chem. 88, 2220-2226 (2016)
ACKNOWLEDGEMENTS The authors gratefully acknowledge the help and support of Jennifer N. Sutton and Michael A. Blank from Thermo Fisher Scientific.
TRADEMARKS/LICENSING © 2016 Thermo Fisher Scientific Inc. All rights reserved. ZipChip is a trademark of 908 Devices Inc. ReSpect is a trademark of Positive Probablity Ltd. All other trademarks are the property of Thermo Fisher Scientific and its subsidiaries. This information is not intended to encourage use of these products in any manner that might infringe the intellectual property rights of others.
Characterization of Intact Monoclonal Antibody with Microfluidic Chip Electrophoresis Mass Spectrometry
Instrumentation Results
0.0 1.0 2.0 3.0 4.0
Time (min)
0
20
40
60
80
100
Rel
ativ
e A
bund
ance
2.57
2.52
2.452-lys1-lys
0-lys
0
20
40
60
80
100
Rel
ativ
eIn
tens
ity
148036
148199G1F/G1F
148361
G1F/G2F148523 G2F/G2F
148686
147800 148000 148200 148400 148600 148800 149000 149200Mass
0-lysG0F/G0F
G0F/G1F
4600 4800 5000 5200 5400 5600
m/z
0
50
100
0
50
100
Rel
ativ
e A
bund
ance
0
50
1005120.054949.45
5302.894789.82
5499.344640.26
5115.664945.17
5298.304785.68
5494.524636.23
5111.234940.90
5293.724781.57
4632.18 5489.78
0-lys
1-lys
2-lys
29+28+
30+31+
32+ 27+
Sample
NISTmAb, recombinant humanized IgG1κNumber of amino acids: 1326Disulfide bonds: 14(inter-chain), 2(intra-chain)High-abundance PTM: N-terminal pyroglutamination C-terminal lysine clipping glycosylation
Figure 3. Information on NISTmAb 8671 including amino-acid sequence, disulfide-bond linkage, and post-translational modification.
A
B
A
B
C
A
C
A
B
Workflow
Intact mAb BioPharma Finder
Figure 1. Characterization of mAb is accomplished by separation with the ZipChip device, online analysis using the high resolution Q Exactive BioPharma platform, and identification with BioPharma Finder software.
Figure 5. Three deconvoluted mass spectra from different migration time intervals corresponding to different lysine variants. A) mAb with 2 lysine adduct, including 5 glycosylated variant was detected B) mAb with 1 lysine adduct including 4 glycosylated variant was detected C) mAb without lysine adduct including 5 glycosylated variant was detected.
Figure 6. Migration time was used as a parameter to verify the heterogeneous mA in an example of specific glycosylation form G0F/G0F. A) Total Ion Chromatograph (TIC) in a 4 min run of NIST mAb. B) TIC from the specific form of G0F/G0F. C) TIC from the specific form of G0F/G0F+Lys. D) TIC from the specific form of G0F/G0F+2Lys
Table 1. Identified proteoforms of NIST mAb through the BioPharma Finder 2.0 software.
Figure 2. A) Schematic of high-resolution (HR) microfluidic CE chip with 22 cm channel and integrated nano-ESI emitter. The nano-ESI spray can be monitored with the integrated green laser and camera. B) Schematic of the Q Exactive mass spectrometer, including the high-performance quadrupole precursor selection and high-resolution, accurate-mass Orbitrap detection. The BioPharma Finder software package is optimized for three protein workflows: high-mass-range (HMR) mode for intact analysis, intact protein mode for subunit analysis, and normal mode for peptide mapping.
ZipChip + Q Exactive Biopharma platform
D
020406080
100
020406080
1002.573
2.5162.452
2.575
2.0 2.2 2.4 2.6 2.8 3.0
NL: 6.43E8
NL: 2.42E8
0
20
40
60
80
100
Rel
ativ
eIn
tens
ity G0F/G0F+2Lys148289
G0F/G1F+2Lys148456 G1F/G1F+2Lys
148618
G1F/G2F+2Lys148783
148200 148400 148600 148800 149000 149200Mass
G2F/G2F+2Lys148944
2-lys
2.0 2.2 2.4 2.6 2.8 3.0
020406080
1002.439
2.0 2.2 2.4 2.6 2.8 3.0RT (min)
NL: 6.43E6
Rel
ativ
e in
tens
ity
TIC
G0F/G0F
G0F/G0F+Lys
G0F/G0F+2Lys
Protein Name
Average Mass(Da)
Theoretical Mass (Da)
Mass Error (ppm)
Relative Abundance
Migration Time(min)
G0F/G1F 148198.57 148199.21 4.3 100.00 2.525 - 2.796
G1F/G1F 148361.47 148361.35 0.9 72.91 2.529 - 2.796
G0F/G0F 148035.72 148037.07 9.1 61.98 2.516 - 2.796
G1F/G2F 148523.22 148523.49 1.8 26.25 2.555 - 2.796
G2F/G2F 148685.71 148685.63 0.6 12.21 2.525 - 2.796
G0F/G1F+1Lys 148324.56 148327.41 19.2 7.13 2.465 - 2.543
G1F/G1F+1Lys 148488.20 148489.55 9.1 5.05 2.465 - 2.532
G0F/G0F+1Lys 148164.61 148165.27 4.4 4.45 2.460 - 2.538
G1F/G2F+1Lys 148652.87 148651.69 7.9 1.90 2.474 - 2.538
G2F/G2F+1Lys 148810.62 148813.83 21.5 0.49 2.495 - 2.538
G0F/G1F+2Lys 148456.27 148455.61 4.5 1.54 2.416 - 2.463
G0F/G0F+2Lys 148289.32 148293.47 28.0 1.17 2.399 - 2.468
G1F/G1F+2Lys 148617.97 148617.75 1.5 1.15 2.399 - 2.463
G1F/G2F+2Lys 148782.93 148779.89 20.5 0.38 2.405 - 2.457
G2F/G2F+2Lys 148944.03 148942.03 13.4 0.10 2.416 - 2.457
1-lysG0F/G0F+1Lys G1F/G1F+1Lys
G1F/G2F+1Lys
148810G2F/G2F+1Lys
0
20
40
60
80
100
Rel
ativ
eIn
tens
ity
148165
G0F/G1F+1Lys148325
148488
148653
148200 148400 148600 148800 149000Mass
020406080
1002.514
2.0 2.2 2.4 2.6 2.8 3.0
NL: 2.69E7
B
Chien-Hsun Chen1, Andreas Krupke2, Stephane Houel1, Aaron Bailey1, Aran Paulus1, Daniel Lopez-Ferrer1, Andreas FR Huhmer1, Shiaw-Min Chen2, Achim Karger2, Steve Williams2, Michael Wenz2, Scott Mellors3, Chris Petty3
1Thermo Fisher Scientific, Chromatography and Mass Spectrometry, San Jose, CA, 95134; 2Thermo Fisher Scientific, Life Sciences Solutions, South San Francisco, CA 94080; 3908 Devices, Boston, MA 02210
Figure 4. A) Electropherograms of NIST mAb in a 4 min run on a HR microfluidic chip hyphenated to the Q Exactive BioPharma platform. Three different forms of lysine variants were separated under a field strength of ~1000 V/cm. B) Three mass spectra were extracted from the three peaks on the electropherogram. Lysine variant (128 Da) can be identified after the comparison of deconvoluted mass spectra. The higher number of lysines on the C-terminal of heavy chain provides higher mobility due to the additional positive charges from lysine.
ABSTRACTHeterogeneity of monoclonal antibodies (mAbs), including glycosylation variants, carboxyl terminal truncation, and deamidation products, is an important analytical problem in the biopharmaceutical industry. High resolution mass spectrometry is a powerful tool for the characterization of mAbs, however, some proteoforms might not be observed due to sample complexity. In this study, a microfluidic chip electrophoresis system (ZipChip™ from 908 Devices), coupled to the high resolution Thermo Scientific™ Q Exactive™ Biopharma platform, was used to separate and characterize the NIST mAb (RM 8671), capturing distinct lysine variants and respective proteoforms. Preliminary data provides identification of most proteoforms listed in the NIST mAb Referenced Material 8671.
INTRODUCTION The main goal of this work was to develop a method to characterize heterogeneous mAb on an intact protein level. In order to resolve the complexity of mAb, a powerful combination of an efficient separation system, coupled to high-performance mass spectrometer (MS), and data analysis software is necessary. The separation of charge variants is still a challenging task, especially on an intact protein level. Capillary electrophoresis (CE) provides an ideal separation technique for charge variants of mAb. Microfluidic CE provides advantages in characterizing mAb given its good separation efficiency and short migration time based on high field strength and short separation channel. High-performance MS, including high mass accuracy and resolution, is also important for antibody characterization. An Orbitrap™ mass spectrometer is a good option for this application, and the Q Exactive BioPharma platform is suitable for the analysis of very large biomolecules. The challenge of protein MS data analysis usually increases with its molecular weight. The Thermo Scientific™ BioPharma Finder™ software is specifically designed to characterize the complex protein via delicate deconvolution of mass spectra for individual time windows in combination with a thorough comparison to a reference database with all variants. In this study, a powerful combination of microfluidic CE separation, MS detection, and data analysis is presented to solve one of the most challenging workflows in the biopharma industry.
MATERIALS AND METHODS Reference material from the NIST mAb standard (8671) with the known sequence and post translational modifications (PTMs) was used in this study. The NIST mAb is a recombinant humanized IgG1κ antibody, and process-related impurities have been removed through various purification steps. The heavy chain of this mAb is known to have a high abundance of PTMs such as N-terminal pyroglutamination, c-terminal lysine clipping, and glycosylation. 10μg/μL of raw sample was diluted with deionized water into 0.5 μg/μL for the experiments. No desalting procedure is necessary for this series of measurement. The chip was primed with background electrolyte solution (BGE) consisting of 0.2% acetic acid and 10% IPA (pH=3.17). Once a stable electrospray was observed, 10 μL of 0.5 μg/μL mAb was pipetted into the sample reservoir. Pressure injection with 2 psi and 4 s was used for sample loading, introducing 0.4 nL with 0. 2ng of mAb to the separation channel. High voltage of ~20kV was applied for CE separation within 22-cm-length of channel, and ~2kV was used for nano-ESI. Each run was finished in 4 min.
The Q Exactive mass spectrometer was set to the optimized conditions for an ultra-high mass biomolecule, and to maintain a scan rate of 6 scans/sec. In-source CID (100 e.v.) was applied to assist desolvation. An m/z range (2500-6000) was selected for this mild-denatured condition. BioPharma Finder 2.0 software was used in this study for data analysis. The sequence and PTM information of the NIST mAb was first set up in protein sequence manager. The identification of different variants can be accomplished after the mass spectra were deconvoluted to the intact mass using the ReSpect™ algorithm.
CONCLUSIONS • Clear mAb signal was detected within four minutes coupling 908 Devices’ ZipChip system with the Q
Exactive BioPharma platform. No sample preparation or desalting was necessary.• Lysine variants of NIST mAb can be separated on a microfluidic chip electrophoresis device. The
mobility was increased with additional positive charges added to the c-terminal of heavy chain from lysine.
• Five glycosylated variants including G0F/GOF, G0F/G1F, G1F/G1F, G1F/G2F, and G2F/G2F were observed from 2-lys, 1-lys, and 0-lys migration timeframes.• Peaks with different lysine variants can be distinguished from the electropherogram.• Three orders of dynamic range for detection was achieved. • Most of the proteoforms listed in the NIST mAb Reference Material can be identified in this study.
REFERENCES 1. John E. Schiel, Darryl L. Davis, and Oleg V. Borisov, “State-of-the-Art and Emerging technologies for Therapeutic
Monoclonal Antibody Characterization: The NISTmAb Case Study”, American Chemical Society (2015)
2. Erin A. Redman, J. Scott Mellors, Jason A. Starkey, and Michael Ramsey, “Characterization of Intact Antibody Drug Conjugate Variants Using Microfluidic Capillary Electrophoresis – Mass Spectrometry” Anal. Chem. 88, 2220-2226 (2016)
ACKNOWLEDGEMENTS The authors gratefully acknowledge the help and support of Jennifer N. Sutton and Michael A. Blank from Thermo Fisher Scientific.
TRADEMARKS/LICENSING © 2016 Thermo Fisher Scientific Inc. All rights reserved. ZipChip is a trademark of 908 Devices Inc. ReSpect is a trademark of Positive Probablity Ltd. All other trademarks are the property of Thermo Fisher Scientific and its subsidiaries. This information is not intended to encourage use of these products in any manner that might infringe the intellectual property rights of others.
Characterization of Intact Monoclonal Antibody with Microfluidic Chip Electrophoresis Mass Spectrometry
Instrumentation Results
0.0 1.0 2.0 3.0 4.0
Time (min)
0
20
40
60
80
100
Rel
ativ
e A
bund
ance
2.57
2.52
2.452-lys1-lys
0-lys
0
20
40
60
80
100
Rel
ativ
eIn
tens
ity
148036
148199G1F/G1F
148361
G1F/G2F148523 G2F/G2F
148686
147800 148000 148200 148400 148600 148800 149000 149200Mass
0-lysG0F/G0F
G0F/G1F
4600 4800 5000 5200 5400 5600
m/z
0
50
100
0
50
100
Rel
ativ
e A
bund
ance
0
50
1005120.054949.45
5302.894789.82
5499.344640.26
5115.664945.17
5298.304785.68
5494.524636.23
5111.234940.90
5293.724781.57
4632.18 5489.78
0-lys
1-lys
2-lys
29+28+
30+31+
32+ 27+
Sample
NISTmAb, recombinant humanized IgG1κNumber of amino acids: 1326Disulfide bonds: 14(inter-chain), 2(intra-chain)High-abundance PTM: N-terminal pyroglutamination C-terminal lysine clipping glycosylation
Figure 3. Information on NISTmAb 8671 including amino-acid sequence, disulfide-bond linkage, and post-translational modification.
A
B
A
B
C
A
C
A
B
Workflow
Intact mAb BioPharma Finder
Figure 1. Characterization of mAb is accomplished by separation with the ZipChip device, online analysis using the high resolution Q Exactive BioPharma platform, and identification with BioPharma Finder software.
Figure 5. Three deconvoluted mass spectra from different migration time intervals corresponding to different lysine variants. A) mAb with 2 lysine adduct, including 5 glycosylated variant was detected B) mAb with 1 lysine adduct including 4 glycosylated variant was detected C) mAb without lysine adduct including 5 glycosylated variant was detected.
Figure 6. Migration time was used as a parameter to verify the heterogeneous mA in an example of specific glycosylation form G0F/G0F. A) Total Ion Chromatograph (TIC) in a 4 min run of NIST mAb. B) TIC from the specific form of G0F/G0F. C) TIC from the specific form of G0F/G0F+Lys. D) TIC from the specific form of G0F/G0F+2Lys
Table 1. Identified proteoforms of NIST mAb through the BioPharma Finder 2.0 software.
Figure 2. A) Schematic of high-resolution (HR) microfluidic CE chip with 22 cm channel and integrated nano-ESI emitter. The nano-ESI spray can be monitored with the integrated green laser and camera. B) Schematic of the Q Exactive mass spectrometer, including the high-performance quadrupole precursor selection and high-resolution, accurate-mass Orbitrap detection. The BioPharma Finder software package is optimized for three protein workflows: high-mass-range (HMR) mode for intact analysis, intact protein mode for subunit analysis, and normal mode for peptide mapping.
ZipChip + Q Exactive Biopharma platform
D
020406080
100
020406080
1002.573
2.5162.452
2.575
2.0 2.2 2.4 2.6 2.8 3.0
NL: 6.43E8
NL: 2.42E8
0
20
40
60
80
100
Rel
ativ
eIn
tens
ity G0F/G0F+2Lys148289
G0F/G1F+2Lys148456 G1F/G1F+2Lys
148618
G1F/G2F+2Lys148783
148200 148400 148600 148800 149000 149200Mass
G2F/G2F+2Lys148944
2-lys
2.0 2.2 2.4 2.6 2.8 3.0
020406080
1002.439
2.0 2.2 2.4 2.6 2.8 3.0RT (min)
NL: 6.43E6
Rel
ativ
e in
tens
ity
TIC
G0F/G0F
G0F/G0F+Lys
G0F/G0F+2Lys
Protein Name
Average Mass(Da)
Theoretical Mass (Da)
Mass Error (ppm)
Relative Abundance
Migration Time(min)
G0F/G1F 148198.57 148199.21 4.3 100.00 2.525 - 2.796
G1F/G1F 148361.47 148361.35 0.9 72.91 2.529 - 2.796
G0F/G0F 148035.72 148037.07 9.1 61.98 2.516 - 2.796
G1F/G2F 148523.22 148523.49 1.8 26.25 2.555 - 2.796
G2F/G2F 148685.71 148685.63 0.6 12.21 2.525 - 2.796
G0F/G1F+1Lys 148324.56 148327.41 19.2 7.13 2.465 - 2.543
G1F/G1F+1Lys 148488.20 148489.55 9.1 5.05 2.465 - 2.532
G0F/G0F+1Lys 148164.61 148165.27 4.4 4.45 2.460 - 2.538
G1F/G2F+1Lys 148652.87 148651.69 7.9 1.90 2.474 - 2.538
G2F/G2F+1Lys 148810.62 148813.83 21.5 0.49 2.495 - 2.538
G0F/G1F+2Lys 148456.27 148455.61 4.5 1.54 2.416 - 2.463
G0F/G0F+2Lys 148289.32 148293.47 28.0 1.17 2.399 - 2.468
G1F/G1F+2Lys 148617.97 148617.75 1.5 1.15 2.399 - 2.463
G1F/G2F+2Lys 148782.93 148779.89 20.5 0.38 2.405 - 2.457
G2F/G2F+2Lys 148944.03 148942.03 13.4 0.10 2.416 - 2.457
1-lysG0F/G0F+1Lys G1F/G1F+1Lys
G1F/G2F+1Lys
148810G2F/G2F+1Lys
3
0
20
40
60
80
100
Rel
ativ
eIn
tens
ity
148165
G0F/G1F+1Lys148325
148488
148653
148200 148400 148600 148800 149000Mass
020406080
1002.514
2.0 2.2 2.4 2.6 2.8 3.0
NL: 2.69E7
B
Chien-Hsun Chen1, Andreas Krupke2, Stephane Houel1, Aaron Bailey1, Aran Paulus1, Daniel Lopez-Ferrer1, Andreas FR Huhmer1, Shiaw-Min Chen2, Achim Karger2, Steve Williams2, Michael Wenz2, Scott Mellors3, Chris Petty3
1Thermo Fisher Scientific, Chromatography and Mass Spectrometry, San Jose, CA, 95134; 2Thermo Fisher Scientific, Life Sciences Solutions, South San Francisco, CA 94080; 3908 Devices, Boston, MA 02210
Figure 4. A) Electropherograms of NIST mAb in a 4 min run on a HR microfluidic chip hyphenated to the Q Exactive BioPharma platform. Three different forms of lysine variants were separated under a field strength of ~1000 V/cm. B) Three mass spectra were extracted from the three peaks on the electropherogram. Lysine variant (128 Da) can be identified after the comparison of deconvoluted mass spectra. The higher number of lysines on the C-terminal of heavy chain provides higher mobility due to the additional positive charges from lysine.
ABSTRACTHeterogeneity of monoclonal antibodies (mAbs), including glycosylation variants, carboxyl terminal truncation, and deamidation products, is an important analytical problem in the biopharmaceutical industry. High resolution mass spectrometry is a powerful tool for the characterization of mAbs, however, some proteoforms might not be observed due to sample complexity. In this study, a microfluidic chip electrophoresis system (ZipChip™ from 908 Devices), coupled to the high resolution Thermo Scientific™ Q Exactive™ Biopharma platform, was used to separate and characterize the NIST mAb (RM 8671), capturing distinct lysine variants and respective proteoforms. Preliminary data provides identification of most proteoforms listed in the NIST mAb Referenced Material 8671.
INTRODUCTION The main goal of this work was to develop a method to characterize heterogeneous mAb on an intact protein level. In order to resolve the complexity of mAb, a powerful combination of an efficient separation system, coupled to high-performance mass spectrometer (MS), and data analysis software is necessary. The separation of charge variants is still a challenging task, especially on an intact protein level. Capillary electrophoresis (CE) provides an ideal separation technique for charge variants of mAb. Microfluidic CE provides advantages in characterizing mAb given its good separation efficiency and short migration time based on high field strength and short separation channel. High-performance MS, including high mass accuracy and resolution, is also important for antibody characterization. An Orbitrap™ mass spectrometer is a good option for this application, and the Q Exactive BioPharma platform is suitable for the analysis of very large biomolecules. The challenge of protein MS data analysis usually increases with its molecular weight. The Thermo Scientific™ BioPharma Finder™ software is specifically designed to characterize the complex protein via delicate deconvolution of mass spectra for individual time windows in combination with a thorough comparison to a reference database with all variants. In this study, a powerful combination of microfluidic CE separation, MS detection, and data analysis is presented to solve one of the most challenging workflows in the biopharma industry.
MATERIALS AND METHODS Reference material from the NIST mAb standard (8671) with the known sequence and post translational modifications (PTMs) was used in this study. The NIST mAb is a recombinant humanized IgG1κ antibody, and process-related impurities have been removed through various purification steps. The heavy chain of this mAb is known to have a high abundance of PTMs such as N-terminal pyroglutamination, c-terminal lysine clipping, and glycosylation. 10μg/μL of raw sample was diluted with deionized water into 0.5 μg/μL for the experiments. No desalting procedure is necessary for this series of measurement. The chip was primed with background electrolyte solution (BGE) consisting of 0.2% acetic acid and 10% IPA (pH=3.17). Once a stable electrospray was observed, 10 μL of 0.5 μg/μL mAb was pipetted into the sample reservoir. Pressure injection with 2 psi and 4 s was used for sample loading, introducing 0.4 nL with 0. 2ng of mAb to the separation channel. High voltage of ~20kV was applied for CE separation within 22-cm-length of channel, and ~2kV was used for nano-ESI. Each run was finished in 4 min.
The Q Exactive mass spectrometer was set to the optimized conditions for an ultra-high mass biomolecule, and to maintain a scan rate of 6 scans/sec. In-source CID (100 e.v.) was applied to assist desolvation. An m/z range (2500-6000) was selected for this mild-denatured condition. BioPharma Finder 2.0 software was used in this study for data analysis. The sequence and PTM information of the NIST mAb was first set up in protein sequence manager. The identification of different variants can be accomplished after the mass spectra were deconvoluted to the intact mass using the ReSpect™ algorithm.
CONCLUSIONS • Clear mAb signal was detected within four minutes coupling 908 Devices’ ZipChip system with the Q
Exactive BioPharma platform. No sample preparation or desalting was necessary.• Lysine variants of NIST mAb can be separated on a microfluidic chip electrophoresis device. The
mobility was increased with additional positive charges added to the c-terminal of heavy chain from lysine.
• Five glycosylated variants including G0F/GOF, G0F/G1F, G1F/G1F, G1F/G2F, and G2F/G2F were observed from 2-lys, 1-lys, and 0-lys migration timeframes.• Peaks with different lysine variants can be distinguished from the electropherogram.• Three orders of dynamic range for detection was achieved. • Most of the proteoforms listed in the NIST mAb Reference Material can be identified in this study.
REFERENCES 1. John E. Schiel, Darryl L. Davis, and Oleg V. Borisov, “State-of-the-Art and Emerging technologies for Therapeutic
Monoclonal Antibody Characterization: The NISTmAb Case Study”, American Chemical Society (2015)
2. Erin A. Redman, J. Scott Mellors, Jason A. Starkey, and Michael Ramsey, “Characterization of Intact Antibody Drug Conjugate Variants Using Microfluidic Capillary Electrophoresis – Mass Spectrometry” Anal. Chem. 88, 2220-2226 (2016)
ACKNOWLEDGEMENTS The authors gratefully acknowledge the help and support of Jennifer N. Sutton and Michael A. Blank from Thermo Fisher Scientific.
TRADEMARKS/LICENSING © 2016 Thermo Fisher Scientific Inc. All rights reserved. ZipChip is a trademark of 908 Devices Inc. ReSpect is a trademark of Positive Probablity Ltd. All other trademarks are the property of Thermo Fisher Scientific and its subsidiaries. This information is not intended to encourage use of these products in any manner that might infringe the intellectual property rights of others.
Characterization of Intact Monoclonal Antibody with Microfluidic Chip Electrophoresis Mass Spectrometry
Instrumentation Results
0.0 1.0 2.0 3.0 4.0
Time (min)
0
20
40
60
80
100
Rel
ativ
e A
bund
ance
2.57
2.52
2.452-lys1-lys
0-lys
0
20
40
60
80
100
Rel
ativ
eIn
tens
ity
148036
148199G1F/G1F
148361
G1F/G2F148523 G2F/G2F
148686
147800 148000 148200 148400 148600 148800 149000 149200Mass
0-lysG0F/G0F
G0F/G1F
4600 4800 5000 5200 5400 5600
m/z
0
50
100
0
50
100
Rel
ativ
e A
bund
ance
0
50
1005120.054949.45
5302.894789.82
5499.344640.26
5115.664945.17
5298.304785.68
5494.524636.23
5111.234940.90
5293.724781.57
4632.18 5489.78
0-lys
1-lys
2-lys
29+28+
30+31+
32+ 27+
Sample
NISTmAb, recombinant humanized IgG1κNumber of amino acids: 1326Disulfide bonds: 14(inter-chain), 2(intra-chain)High-abundance PTM: N-terminal pyroglutamination C-terminal lysine clipping glycosylation
Figure 3. Information on NISTmAb 8671 including amino-acid sequence, disulfide-bond linkage, and post-translational modification.
A
B
A
B
C
A
C
A
B
Workflow
Intact mAb BioPharma Finder
Figure 1. Characterization of mAb is accomplished by separation with the ZipChip device, online analysis using the high resolution Q Exactive BioPharma platform, and identification with BioPharma Finder software.
Figure 5. Three deconvoluted mass spectra from different migration time intervals corresponding to different lysine variants. A) mAb with 2 lysine adduct, including 5 glycosylated variant was detected B) mAb with 1 lysine adduct including 4 glycosylated variant was detected C) mAb without lysine adduct including 5 glycosylated variant was detected.
Figure 6. Migration time was used as a parameter to verify the heterogeneous mA in an example of specific glycosylation form G0F/G0F. A) Total Ion Chromatograph (TIC) in a 4 min run of NIST mAb. B) TIC from the specific form of G0F/G0F. C) TIC from the specific form of G0F/G0F+Lys. D) TIC from the specific form of G0F/G0F+2Lys
Table 1. Identified proteoforms of NIST mAb through the BioPharma Finder 2.0 software.
Figure 2. A) Schematic of high-resolution (HR) microfluidic CE chip with 22 cm channel and integrated nano-ESI emitter. The nano-ESI spray can be monitored with the integrated green laser and camera. B) Schematic of the Q Exactive mass spectrometer, including the high-performance quadrupole precursor selection and high-resolution, accurate-mass Orbitrap detection. The BioPharma Finder software package is optimized for three protein workflows: high-mass-range (HMR) mode for intact analysis, intact protein mode for subunit analysis, and normal mode for peptide mapping.
ZipChip + Q Exactive Biopharma platform
D
020406080
100
020406080
1002.573
2.5162.452
2.575
2.0 2.2 2.4 2.6 2.8 3.0
NL: 6.43E8
NL: 2.42E8
0
20
40
60
80
100
Rel
ativ
eIn
tens
ity G0F/G0F+2Lys148289
G0F/G1F+2Lys148456 G1F/G1F+2Lys
148618
G1F/G2F+2Lys148783
148200 148400 148600 148800 149000 149200Mass
G2F/G2F+2Lys148944
2-lys
2.0 2.2 2.4 2.6 2.8 3.0
020406080
1002.439
2.0 2.2 2.4 2.6 2.8 3.0RT (min)
NL: 6.43E6
Rel
ativ
e in
tens
ity
TIC
G0F/G0F
G0F/G0F+Lys
G0F/G0F+2Lys
Protein Name
Average Mass(Da)
Theoretical Mass (Da)
Mass Error (ppm)
Relative Abundance
Migration Time(min)
G0F/G1F 148198.57 148199.21 4.3 100.00 2.525 - 2.796
G1F/G1F 148361.47 148361.35 0.9 72.91 2.529 - 2.796
G0F/G0F 148035.72 148037.07 9.1 61.98 2.516 - 2.796
G1F/G2F 148523.22 148523.49 1.8 26.25 2.555 - 2.796
G2F/G2F 148685.71 148685.63 0.6 12.21 2.525 - 2.796
G0F/G1F+1Lys 148324.56 148327.41 19.2 7.13 2.465 - 2.543
G1F/G1F+1Lys 148488.20 148489.55 9.1 5.05 2.465 - 2.532
G0F/G0F+1Lys 148164.61 148165.27 4.4 4.45 2.460 - 2.538
G1F/G2F+1Lys 148652.87 148651.69 7.9 1.90 2.474 - 2.538
G2F/G2F+1Lys 148810.62 148813.83 21.5 0.49 2.495 - 2.538
G0F/G1F+2Lys 148456.27 148455.61 4.5 1.54 2.416 - 2.463
G0F/G0F+2Lys 148289.32 148293.47 28.0 1.17 2.399 - 2.468
G1F/G1F+2Lys 148617.97 148617.75 1.5 1.15 2.399 - 2.463
G1F/G2F+2Lys 148782.93 148779.89 20.5 0.38 2.405 - 2.457
G2F/G2F+2Lys 148944.03 148942.03 13.4 0.10 2.416 - 2.457
1-lysG0F/G0F+1Lys G1F/G1F+1Lys
G1F/G2F+1Lys
148810G2F/G2F+1Lys
0
20
40
60
80
100
Rel
ativ
eIn
tens
ity
148165
G0F/G1F+1Lys148325
148488
148653
148200 148400 148600 148800 149000Mass
020406080
1002.514
2.0 2.2 2.4 2.6 2.8 3.0
NL: 2.69E7
B
Chien-Hsun Chen1, Andreas Krupke2, Stephane Houel1, Aaron Bailey1, Aran Paulus1, Daniel Lopez-Ferrer1, Andreas FR Huhmer1, Shiaw-Min Chen2, Achim Karger2, Steve Williams2, Michael Wenz2, Scott Mellors3, Chris Petty3
1Thermo Fisher Scientific, Chromatography and Mass Spectrometry, San Jose, CA, 95134; 2Thermo Fisher Scientific, Life Sciences Solutions, South San Francisco, CA 94080; 3908 Devices, Boston, MA 02210
Figure 4. A) Electropherograms of NIST mAb in a 4 min run on a HR microfluidic chip hyphenated to the Q Exactive BioPharma platform. Three different forms of lysine variants were separated under a field strength of ~1000 V/cm. B) Three mass spectra were extracted from the three peaks on the electropherogram. Lysine variant (128 Da) can be identified after the comparison of deconvoluted mass spectra. The higher number of lysines on the C-terminal of heavy chain provides higher mobility due to the additional positive charges from lysine.
ABSTRACTHeterogeneity of monoclonal antibodies (mAbs), including glycosylation variants, carboxyl terminal truncation, and deamidation products, is an important analytical problem in the biopharmaceutical industry. High resolution mass spectrometry is a powerful tool for the characterization of mAbs, however, some proteoforms might not be observed due to sample complexity. In this study, a microfluidic chip electrophoresis system (ZipChip™ from 908 Devices), coupled to the high resolution Thermo Scientific™ Q Exactive™ Biopharma platform, was used to separate and characterize the NIST mAb (RM 8671), capturing distinct lysine variants and respective proteoforms. Preliminary data provides identification of most proteoforms listed in the NIST mAb Referenced Material 8671.
INTRODUCTION The main goal of this work was to develop a method to characterize heterogeneous mAb on an intact protein level. In order to resolve the complexity of mAb, a powerful combination of an efficient separation system, coupled to high-performance mass spectrometer (MS), and data analysis software is necessary. The separation of charge variants is still a challenging task, especially on an intact protein level. Capillary electrophoresis (CE) provides an ideal separation technique for charge variants of mAb. Microfluidic CE provides advantages in characterizing mAb given its good separation efficiency and short migration time based on high field strength and short separation channel. High-performance MS, including high mass accuracy and resolution, is also important for antibody characterization. An Orbitrap™ mass spectrometer is a good option for this application, and the Q Exactive BioPharma platform is suitable for the analysis of very large biomolecules. The challenge of protein MS data analysis usually increases with its molecular weight. The Thermo Scientific™ BioPharma Finder™ software is specifically designed to characterize the complex protein via delicate deconvolution of mass spectra for individual time windows in combination with a thorough comparison to a reference database with all variants. In this study, a powerful combination of microfluidic CE separation, MS detection, and data analysis is presented to solve one of the most challenging workflows in the biopharma industry.
MATERIALS AND METHODS Reference material from the NIST mAb standard (8671) with the known sequence and post translational modifications (PTMs) was used in this study. The NIST mAb is a recombinant humanized IgG1κ antibody, and process-related impurities have been removed through various purification steps. The heavy chain of this mAb is known to have a high abundance of PTMs such as N-terminal pyroglutamination, c-terminal lysine clipping, and glycosylation. 10μg/μL of raw sample was diluted with deionized water into 0.5 μg/μL for the experiments. No desalting procedure is necessary for this series of measurement. The chip was primed with background electrolyte solution (BGE) consisting of 0.2% acetic acid and 10% IPA (pH=3.17). Once a stable electrospray was observed, 10 μL of 0.5 μg/μL mAb was pipetted into the sample reservoir. Pressure injection with 2 psi and 4 s was used for sample loading, introducing 0.4 nL with 0. 2ng of mAb to the separation channel. High voltage of ~20kV was applied for CE separation within 22-cm-length of channel, and ~2kV was used for nano-ESI. Each run was finished in 4 min.
The Q Exactive mass spectrometer was set to the optimized conditions for an ultra-high mass biomolecule, and to maintain a scan rate of 6 scans/sec. In-source CID (100 e.v.) was applied to assist desolvation. An m/z range (2500-6000) was selected for this mild-denatured condition. BioPharma Finder 2.0 software was used in this study for data analysis. The sequence and PTM information of the NIST mAb was first set up in protein sequence manager. The identification of different variants can be accomplished after the mass spectra were deconvoluted to the intact mass using the ReSpect™ algorithm.
CONCLUSIONS • Clear mAb signal was detected within four minutes coupling 908 Devices’ ZipChip system with the Q
Exactive BioPharma platform. No sample preparation or desalting was necessary.• Lysine variants of NIST mAb can be separated on a microfluidic chip electrophoresis device. The
mobility was increased with additional positive charges added to the c-terminal of heavy chain from lysine.
• Five glycosylated variants including G0F/GOF, G0F/G1F, G1F/G1F, G1F/G2F, and G2F/G2F were observed from 2-lys, 1-lys, and 0-lys migration timeframes.• Peaks with different lysine variants can be distinguished from the electropherogram.• Three orders of dynamic range for detection was achieved. • Most of the proteoforms listed in the NIST mAb Reference Material can be identified in this study.
REFERENCES 1. John E. Schiel, Darryl L. Davis, and Oleg V. Borisov, “State-of-the-Art and Emerging technologies for Therapeutic
Monoclonal Antibody Characterization: The NISTmAb Case Study”, American Chemical Society (2015)
2. Erin A. Redman, J. Scott Mellors, Jason A. Starkey, and Michael Ramsey, “Characterization of Intact Antibody Drug Conjugate Variants Using Microfluidic Capillary Electrophoresis – Mass Spectrometry” Anal. Chem. 88, 2220-2226 (2016)
ACKNOWLEDGEMENTS The authors gratefully acknowledge the help and support of Jennifer N. Sutton and Michael A. Blank from Thermo Fisher Scientific.
TRADEMARKS/LICENSING © 2016 Thermo Fisher Scientific Inc. All rights reserved. ZipChip is a trademark of 908 Devices Inc. ReSpect is a trademark of Positive Probablity Ltd. All other trademarks are the property of Thermo Fisher Scientific and its subsidiaries. This information is not intended to encourage use of these products in any manner that might infringe the intellectual property rights of others.
Characterization of Intact Monoclonal Antibody with Microfluidic Chip Electrophoresis Mass Spectrometry
Instrumentation Results
0.0 1.0 2.0 3.0 4.0
Time (min)
0
20
40
60
80
100
Rel
ativ
e A
bund
ance
2.57
2.52
2.452-lys1-lys
0-lys
0
20
40
60
80
100
Rel
ativ
eIn
tens
ity
148036
148199G1F/G1F
148361
G1F/G2F148523 G2F/G2F
148686
147800 148000 148200 148400 148600 148800 149000 149200Mass
0-lysG0F/G0F
G0F/G1F
4600 4800 5000 5200 5400 5600
m/z
0
50
100
0
50
100
Rel
ativ
e A
bund
ance
0
50
1005120.054949.45
5302.894789.82
5499.344640.26
5115.664945.17
5298.304785.68
5494.524636.23
5111.234940.90
5293.724781.57
4632.18 5489.78
0-lys
1-lys
2-lys
29+28+
30+31+
32+ 27+
Sample
NISTmAb, recombinant humanized IgG1κNumber of amino acids: 1326Disulfide bonds: 14(inter-chain), 2(intra-chain)High-abundance PTM: N-terminal pyroglutamination C-terminal lysine clipping glycosylation
Figure 3. Information on NISTmAb 8671 including amino-acid sequence, disulfide-bond linkage, and post-translational modification.
A
B
A
B
C
A
C
A
B
Workflow
Intact mAb BioPharma Finder
Figure 1. Characterization of mAb is accomplished by separation with the ZipChip device, online analysis using the high resolution Q Exactive BioPharma platform, and identification with BioPharma Finder software.
Figure 5. Three deconvoluted mass spectra from different migration time intervals corresponding to different lysine variants. A) mAb with 2 lysine adduct, including 5 glycosylated variant was detected B) mAb with 1 lysine adduct including 4 glycosylated variant was detected C) mAb without lysine adduct including 5 glycosylated variant was detected.
Figure 6. Migration time was used as a parameter to verify the heterogeneous mA in an example of specific glycosylation form G0F/G0F. A) Total Ion Chromatograph (TIC) in a 4 min run of NIST mAb. B) TIC from the specific form of G0F/G0F. C) TIC from the specific form of G0F/G0F+Lys. D) TIC from the specific form of G0F/G0F+2Lys
Table 1. Identified proteoforms of NIST mAb through the BioPharma Finder 2.0 software.
Figure 2. A) Schematic of high-resolution (HR) microfluidic CE chip with 22 cm channel and integrated nano-ESI emitter. The nano-ESI spray can be monitored with the integrated green laser and camera. B) Schematic of the Q Exactive mass spectrometer, including the high-performance quadrupole precursor selection and high-resolution, accurate-mass Orbitrap detection. The BioPharma Finder software package is optimized for three protein workflows: high-mass-range (HMR) mode for intact analysis, intact protein mode for subunit analysis, and normal mode for peptide mapping.
ZipChip + Q Exactive Biopharma platform
D
020406080
100
020406080
1002.573
2.5162.452
2.575
2.0 2.2 2.4 2.6 2.8 3.0
NL: 6.43E8
NL: 2.42E8
0
20
40
60
80
100
Rel
ativ
eIn
tens
ity G0F/G0F+2Lys148289
G0F/G1F+2Lys148456 G1F/G1F+2Lys
148618
G1F/G2F+2Lys148783
148200 148400 148600 148800 149000 149200Mass
G2F/G2F+2Lys148944
2-lys
2.0 2.2 2.4 2.6 2.8 3.0
020406080
1002.439
2.0 2.2 2.4 2.6 2.8 3.0RT (min)
NL: 6.43E6
Rel
ativ
e in
tens
ity
TIC
G0F/G0F
G0F/G0F+Lys
G0F/G0F+2Lys
Protein Name
Average Mass(Da)
Theoretical Mass (Da)
Mass Error (ppm)
Relative Abundance
Migration Time(min)
G0F/G1F 148198.57 148199.21 4.3 100.00 2.525 - 2.796
G1F/G1F 148361.47 148361.35 0.9 72.91 2.529 - 2.796
G0F/G0F 148035.72 148037.07 9.1 61.98 2.516 - 2.796
G1F/G2F 148523.22 148523.49 1.8 26.25 2.555 - 2.796
G2F/G2F 148685.71 148685.63 0.6 12.21 2.525 - 2.796
G0F/G1F+1Lys 148324.56 148327.41 19.2 7.13 2.465 - 2.543
G1F/G1F+1Lys 148488.20 148489.55 9.1 5.05 2.465 - 2.532
G0F/G0F+1Lys 148164.61 148165.27 4.4 4.45 2.460 - 2.538
G1F/G2F+1Lys 148652.87 148651.69 7.9 1.90 2.474 - 2.538
G2F/G2F+1Lys 148810.62 148813.83 21.5 0.49 2.495 - 2.538
G0F/G1F+2Lys 148456.27 148455.61 4.5 1.54 2.416 - 2.463
G0F/G0F+2Lys 148289.32 148293.47 28.0 1.17 2.399 - 2.468
G1F/G1F+2Lys 148617.97 148617.75 1.5 1.15 2.399 - 2.463
G1F/G2F+2Lys 148782.93 148779.89 20.5 0.38 2.405 - 2.457
G2F/G2F+2Lys 148944.03 148942.03 13.4 0.10 2.416 - 2.457
1-lysG0F/G0F+1Lys G1F/G1F+1Lys
G1F/G2F+1Lys
148810G2F/G2F+1Lys
4
0
20
40
60
80
100
Rel
ativ
eIn
tens
ity
148165
G0F/G1F+1Lys148325
148488
148653
148200 148400 148600 148800 149000Mass
020406080
1002.514
2.0 2.2 2.4 2.6 2.8 3.0
NL: 2.69E7
B
Chien-Hsun Chen1, Andreas Krupke2, Stephane Houel1, Aaron Bailey1, Aran Paulus1, Daniel Lopez-Ferrer1, Andreas FR Huhmer1, Shiaw-Min Chen2, Achim Karger2, Steve Williams2, Michael Wenz2, Scott Mellors3, Chris Petty3
1Thermo Fisher Scientific, Chromatography and Mass Spectrometry, San Jose, CA, 95134; 2Thermo Fisher Scientific, Life Sciences Solutions, South San Francisco, CA 94080; 3908 Devices, Boston, MA 02210
Figure 4. A) Electropherograms of NIST mAb in a 4 min run on a HR microfluidic chip hyphenated to the Q Exactive BioPharma platform. Three different forms of lysine variants were separated under a field strength of ~1000 V/cm. B) Three mass spectra were extracted from the three peaks on the electropherogram. Lysine variant (128 Da) can be identified after the comparison of deconvoluted mass spectra. The higher number of lysines on the C-terminal of heavy chain provides higher mobility due to the additional positive charges from lysine.
ABSTRACTHeterogeneity of monoclonal antibodies (mAbs), including glycosylation variants, carboxyl terminal truncation, and deamidation products, is an important analytical problem in the biopharmaceutical industry. High resolution mass spectrometry is a powerful tool for the characterization of mAbs, however, some proteoforms might not be observed due to sample complexity. In this study, a microfluidic chip electrophoresis system (ZipChip™ from 908 Devices), coupled to the high resolution Thermo Scientific™ Q Exactive™ Biopharma platform, was used to separate and characterize the NIST mAb (RM 8671), capturing distinct lysine variants and respective proteoforms. Preliminary data provides identification of most proteoforms listed in the NIST mAb Referenced Material 8671.
INTRODUCTION The main goal of this work was to develop a method to characterize heterogeneous mAb on an intact protein level. In order to resolve the complexity of mAb, a powerful combination of an efficient separation system, coupled to high-performance mass spectrometer (MS), and data analysis software is necessary. The separation of charge variants is still a challenging task, especially on an intact protein level. Capillary electrophoresis (CE) provides an ideal separation technique for charge variants of mAb. Microfluidic CE provides advantages in characterizing mAb given its good separation efficiency and short migration time based on high field strength and short separation channel. High-performance MS, including high mass accuracy and resolution, is also important for antibody characterization. An Orbitrap™ mass spectrometer is a good option for this application, and the Q Exactive BioPharma platform is suitable for the analysis of very large biomolecules. The challenge of protein MS data analysis usually increases with its molecular weight. The Thermo Scientific™ BioPharma Finder™ software is specifically designed to characterize the complex protein via delicate deconvolution of mass spectra for individual time windows in combination with a thorough comparison to a reference database with all variants. In this study, a powerful combination of microfluidic CE separation, MS detection, and data analysis is presented to solve one of the most challenging workflows in the biopharma industry.
MATERIALS AND METHODS Reference material from the NIST mAb standard (8671) with the known sequence and post translational modifications (PTMs) was used in this study. The NIST mAb is a recombinant humanized IgG1κ antibody, and process-related impurities have been removed through various purification steps. The heavy chain of this mAb is known to have a high abundance of PTMs such as N-terminal pyroglutamination, c-terminal lysine clipping, and glycosylation. 10μg/μL of raw sample was diluted with deionized water into 0.5 μg/μL for the experiments. No desalting procedure is necessary for this series of measurement. The chip was primed with background electrolyte solution (BGE) consisting of 0.2% acetic acid and 10% IPA (pH=3.17). Once a stable electrospray was observed, 10 μL of 0.5 μg/μL mAb was pipetted into the sample reservoir. Pressure injection with 2 psi and 4 s was used for sample loading, introducing 0.4 nL with 0. 2ng of mAb to the separation channel. High voltage of ~20kV was applied for CE separation within 22-cm-length of channel, and ~2kV was used for nano-ESI. Each run was finished in 4 min.
The Q Exactive mass spectrometer was set to the optimized conditions for an ultra-high mass biomolecule, and to maintain a scan rate of 6 scans/sec. In-source CID (100 e.v.) was applied to assist desolvation. An m/z range (2500-6000) was selected for this mild-denatured condition. BioPharma Finder 2.0 software was used in this study for data analysis. The sequence and PTM information of the NIST mAb was first set up in protein sequence manager. The identification of different variants can be accomplished after the mass spectra were deconvoluted to the intact mass using the ReSpect™ algorithm.
CONCLUSIONS • Clear mAb signal was detected within four minutes coupling 908 Devices’ ZipChip system with the Q
Exactive BioPharma platform. No sample preparation or desalting was necessary.• Lysine variants of NIST mAb can be separated on a microfluidic chip electrophoresis device. The
mobility was increased with additional positive charges added to the c-terminal of heavy chain from lysine.
• Five glycosylated variants including G0F/GOF, G0F/G1F, G1F/G1F, G1F/G2F, and G2F/G2F were observed from 2-lys, 1-lys, and 0-lys migration timeframes.• Peaks with different lysine variants can be distinguished from the electropherogram.• Three orders of dynamic range for detection was achieved. • Most of the proteoforms listed in the NIST mAb Reference Material can be identified in this study.
REFERENCES 1. John E. Schiel, Darryl L. Davis, and Oleg V. Borisov, “State-of-the-Art and Emerging technologies for Therapeutic
Monoclonal Antibody Characterization: The NISTmAb Case Study”, American Chemical Society (2015)
2. Erin A. Redman, J. Scott Mellors, Jason A. Starkey, and Michael Ramsey, “Characterization of Intact Antibody Drug Conjugate Variants Using Microfluidic Capillary Electrophoresis – Mass Spectrometry” Anal. Chem. 88, 2220-2226 (2016)
ACKNOWLEDGEMENTS The authors gratefully acknowledge the help and support of Jennifer N. Sutton and Michael A. Blank from Thermo Fisher Scientific.
TRADEMARKS/LICENSING © 2016 Thermo Fisher Scientific Inc. All rights reserved. ZipChip is a trademark of 908 Devices Inc. ReSpect is a trademark of Positive Probablity Ltd. All other trademarks are the property of Thermo Fisher Scientific and its subsidiaries. This information is not intended to encourage use of these products in any manner that might infringe the intellectual property rights of others.
Characterization of Intact Monoclonal Antibody with Microfluidic Chip Electrophoresis Mass Spectrometry
Instrumentation Results
0.0 1.0 2.0 3.0 4.0
Time (min)
0
20
40
60
80
100
Rel
ativ
e A
bund
ance
2.57
2.52
2.452-lys1-lys
0-lys
0
20
40
60
80
100
Rel
ativ
eIn
tens
ity
148036
148199G1F/G1F
148361
G1F/G2F148523 G2F/G2F
148686
147800 148000 148200 148400 148600 148800 149000 149200Mass
0-lysG0F/G0F
G0F/G1F
4600 4800 5000 5200 5400 5600
m/z
0
50
100
0
50
100
Rel
ativ
e A
bund
ance
0
50
1005120.054949.45
5302.894789.82
5499.344640.26
5115.664945.17
5298.304785.68
5494.524636.23
5111.234940.90
5293.724781.57
4632.18 5489.78
0-lys
1-lys
2-lys
29+28+
30+31+
32+ 27+
Sample
NISTmAb, recombinant humanized IgG1κNumber of amino acids: 1326Disulfide bonds: 14(inter-chain), 2(intra-chain)High-abundance PTM: N-terminal pyroglutamination C-terminal lysine clipping glycosylation
Figure 3. Information on NISTmAb 8671 including amino-acid sequence, disulfide-bond linkage, and post-translational modification.
A
B
A
B
C
A
C
A
B
Workflow
Intact mAb BioPharma Finder
Figure 1. Characterization of mAb is accomplished by separation with the ZipChip device, online analysis using the high resolution Q Exactive BioPharma platform, and identification with BioPharma Finder software.
Figure 5. Three deconvoluted mass spectra from different migration time intervals corresponding to different lysine variants. A) mAb with 2 lysine adduct, including 5 glycosylated variant was detected B) mAb with 1 lysine adduct including 4 glycosylated variant was detected C) mAb without lysine adduct including 5 glycosylated variant was detected.
Figure 6. Migration time was used as a parameter to verify the heterogeneous mA in an example of specific glycosylation form G0F/G0F. A) Total Ion Chromatograph (TIC) in a 4 min run of NIST mAb. B) TIC from the specific form of G0F/G0F. C) TIC from the specific form of G0F/G0F+Lys. D) TIC from the specific form of G0F/G0F+2Lys
Table 1. Identified proteoforms of NIST mAb through the BioPharma Finder 2.0 software.
Figure 2. A) Schematic of high-resolution (HR) microfluidic CE chip with 22 cm channel and integrated nano-ESI emitter. The nano-ESI spray can be monitored with the integrated green laser and camera. B) Schematic of the Q Exactive mass spectrometer, including the high-performance quadrupole precursor selection and high-resolution, accurate-mass Orbitrap detection. The BioPharma Finder software package is optimized for three protein workflows: high-mass-range (HMR) mode for intact analysis, intact protein mode for subunit analysis, and normal mode for peptide mapping.
ZipChip + Q Exactive Biopharma platform
D
020406080
100
020406080
1002.573
2.5162.452
2.575
2.0 2.2 2.4 2.6 2.8 3.0
NL: 6.43E8
NL: 2.42E8
0
20
40
60
80
100
Rel
ativ
eIn
tens
ity G0F/G0F+2Lys148289
G0F/G1F+2Lys148456 G1F/G1F+2Lys
148618
G1F/G2F+2Lys148783
148200 148400 148600 148800 149000 149200Mass
G2F/G2F+2Lys148944
2-lys
2.0 2.2 2.4 2.6 2.8 3.0
020406080
1002.439
2.0 2.2 2.4 2.6 2.8 3.0RT (min)
NL: 6.43E6
Rel
ativ
e in
tens
ity
TIC
G0F/G0F
G0F/G0F+Lys
G0F/G0F+2Lys
Protein Name
Average Mass(Da)
Theoretical Mass (Da)
Mass Error (ppm)
Relative Abundance
Migration Time(min)
G0F/G1F 148198.57 148199.21 4.3 100.00 2.525 - 2.796
G1F/G1F 148361.47 148361.35 0.9 72.91 2.529 - 2.796
G0F/G0F 148035.72 148037.07 9.1 61.98 2.516 - 2.796
G1F/G2F 148523.22 148523.49 1.8 26.25 2.555 - 2.796
G2F/G2F 148685.71 148685.63 0.6 12.21 2.525 - 2.796
G0F/G1F+1Lys 148324.56 148327.41 19.2 7.13 2.465 - 2.543
G1F/G1F+1Lys 148488.20 148489.55 9.1 5.05 2.465 - 2.532
G0F/G0F+1Lys 148164.61 148165.27 4.4 4.45 2.460 - 2.538
G1F/G2F+1Lys 148652.87 148651.69 7.9 1.90 2.474 - 2.538
G2F/G2F+1Lys 148810.62 148813.83 21.5 0.49 2.495 - 2.538
G0F/G1F+2Lys 148456.27 148455.61 4.5 1.54 2.416 - 2.463
G0F/G0F+2Lys 148289.32 148293.47 28.0 1.17 2.399 - 2.468
G1F/G1F+2Lys 148617.97 148617.75 1.5 1.15 2.399 - 2.463
G1F/G2F+2Lys 148782.93 148779.89 20.5 0.38 2.405 - 2.457
G2F/G2F+2Lys 148944.03 148942.03 13.4 0.10 2.416 - 2.457
1-lysG0F/G0F+1Lys G1F/G1F+1Lys
G1F/G2F+1Lys
148810G2F/G2F+1Lys
5
0
20
40
60
80
100
Rel
ativ
eIn
tens
ity
148165
G0F/G1F+1Lys148325
148488
148653
148200 148400 148600 148800 149000Mass
020406080
1002.514
2.0 2.2 2.4 2.6 2.8 3.0
NL: 2.69E7
B
Chien-Hsun Chen1, Andreas Krupke2, Stephane Houel1, Aaron Bailey1, Aran Paulus1, Daniel Lopez-Ferrer1, Andreas FR Huhmer1, Shiaw-Min Chen2, Achim Karger2, Steve Williams2, Michael Wenz2, Scott Mellors3, Chris Petty3
1Thermo Fisher Scientific, Chromatography and Mass Spectrometry, San Jose, CA, 95134; 2Thermo Fisher Scientific, Life Sciences Solutions, South San Francisco, CA 94080; 3908 Devices, Boston, MA 02210
Figure 4. A) Electropherograms of NIST mAb in a 4 min run on a HR microfluidic chip hyphenated to the Q Exactive BioPharma platform. Three different forms of lysine variants were separated under a field strength of ~1000 V/cm. B) Three mass spectra were extracted from the three peaks on the electropherogram. Lysine variant (128 Da) can be identified after the comparison of deconvoluted mass spectra. The higher number of lysines on the C-terminal of heavy chain provides higher mobility due to the additional positive charges from lysine.
ABSTRACTHeterogeneity of monoclonal antibodies (mAbs), including glycosylation variants, carboxyl terminal truncation, and deamidation products, is an important analytical problem in the biopharmaceutical industry. High resolution mass spectrometry is a powerful tool for the characterization of mAbs, however, some proteoforms might not be observed due to sample complexity. In this study, a microfluidic chip electrophoresis system (ZipChip™ from 908 Devices), coupled to the high resolution Thermo Scientific™ Q Exactive™ Biopharma platform, was used to separate and characterize the NIST mAb (RM 8671), capturing distinct lysine variants and respective proteoforms. Preliminary data provides identification of most proteoforms listed in the NIST mAb Referenced Material 8671.
INTRODUCTION The main goal of this work was to develop a method to characterize heterogeneous mAb on an intact protein level. In order to resolve the complexity of mAb, a powerful combination of an efficient separation system, coupled to high-performance mass spectrometer (MS), and data analysis software is necessary. The separation of charge variants is still a challenging task, especially on an intact protein level. Capillary electrophoresis (CE) provides an ideal separation technique for charge variants of mAb. Microfluidic CE provides advantages in characterizing mAb given its good separation efficiency and short migration time based on high field strength and short separation channel. High-performance MS, including high mass accuracy and resolution, is also important for antibody characterization. An Orbitrap™ mass spectrometer is a good option for this application, and the Q Exactive BioPharma platform is suitable for the analysis of very large biomolecules. The challenge of protein MS data analysis usually increases with its molecular weight. The Thermo Scientific™ BioPharma Finder™ software is specifically designed to characterize the complex protein via delicate deconvolution of mass spectra for individual time windows in combination with a thorough comparison to a reference database with all variants. In this study, a powerful combination of microfluidic CE separation, MS detection, and data analysis is presented to solve one of the most challenging workflows in the biopharma industry.
MATERIALS AND METHODS Reference material from the NIST mAb standard (8671) with the known sequence and post translational modifications (PTMs) was used in this study. The NIST mAb is a recombinant humanized IgG1κ antibody, and process-related impurities have been removed through various purification steps. The heavy chain of this mAb is known to have a high abundance of PTMs such as N-terminal pyroglutamination, c-terminal lysine clipping, and glycosylation. 10μg/μL of raw sample was diluted with deionized water into 0.5 μg/μL for the experiments. No desalting procedure is necessary for this series of measurement. The chip was primed with background electrolyte solution (BGE) consisting of 0.2% acetic acid and 10% IPA (pH=3.17). Once a stable electrospray was observed, 10 μL of 0.5 μg/μL mAb was pipetted into the sample reservoir. Pressure injection with 2 psi and 4 s was used for sample loading, introducing 0.4 nL with 0. 2ng of mAb to the separation channel. High voltage of ~20kV was applied for CE separation within 22-cm-length of channel, and ~2kV was used for nano-ESI. Each run was finished in 4 min.
The Q Exactive mass spectrometer was set to the optimized conditions for an ultra-high mass biomolecule, and to maintain a scan rate of 6 scans/sec. In-source CID (100 e.v.) was applied to assist desolvation. An m/z range (2500-6000) was selected for this mild-denatured condition. BioPharma Finder 2.0 software was used in this study for data analysis. The sequence and PTM information of the NIST mAb was first set up in protein sequence manager. The identification of different variants can be accomplished after the mass spectra were deconvoluted to the intact mass using the ReSpect™ algorithm.
CONCLUSIONS • Clear mAb signal was detected within four minutes coupling 908 Devices’ ZipChip system with the Q
Exactive BioPharma platform. No sample preparation or desalting was necessary.• Lysine variants of NIST mAb can be separated on a microfluidic chip electrophoresis device. The
mobility was increased with additional positive charges added to the c-terminal of heavy chain from lysine.
• Five glycosylated variants including G0F/GOF, G0F/G1F, G1F/G1F, G1F/G2F, and G2F/G2F were observed from 2-lys, 1-lys, and 0-lys migration timeframes.• Peaks with different lysine variants can be distinguished from the electropherogram.• Three orders of dynamic range for detection was achieved. • Most of the proteoforms listed in the NIST mAb Reference Material can be identified in this study.
REFERENCES 1. John E. Schiel, Darryl L. Davis, and Oleg V. Borisov, “State-of-the-Art and Emerging technologies for Therapeutic
Monoclonal Antibody Characterization: The NISTmAb Case Study”, American Chemical Society (2015)
2. Erin A. Redman, J. Scott Mellors, Jason A. Starkey, and Michael Ramsey, “Characterization of Intact Antibody Drug Conjugate Variants Using Microfluidic Capillary Electrophoresis – Mass Spectrometry” Anal. Chem. 88, 2220-2226 (2016)
ACKNOWLEDGEMENTS The authors gratefully acknowledge the help and support of Jennifer N. Sutton and Michael A. Blank from Thermo Fisher Scientific.
TRADEMARKS/LICENSING © 2016 Thermo Fisher Scientific Inc. All rights reserved. ZipChip is a trademark of 908 Devices Inc. ReSpect is a trademark of Positive Probablity Ltd. All other trademarks are the property of Thermo Fisher Scientific and its subsidiaries. This information is not intended to encourage use of these products in any manner that might infringe the intellectual property rights of others.
Characterization of Intact Monoclonal Antibody with Microfluidic Chip Electrophoresis Mass Spectrometry
Instrumentation Results
0.0 1.0 2.0 3.0 4.0
Time (min)
0
20
40
60
80
100
Rel
ativ
e A
bund
ance
2.57
2.52
2.452-lys1-lys
0-lys
0
20
40
60
80
100
Rel
ativ
eIn
tens
ity
148036
148199G1F/G1F
148361
G1F/G2F148523 G2F/G2F
148686
147800 148000 148200 148400 148600 148800 149000 149200Mass
0-lysG0F/G0F
G0F/G1F
4600 4800 5000 5200 5400 5600
m/z
0
50
100
0
50
100
Rel
ativ
e A
bund
ance
0
50
1005120.054949.45
5302.894789.82
5499.344640.26
5115.664945.17
5298.304785.68
5494.524636.23
5111.234940.90
5293.724781.57
4632.18 5489.78
0-lys
1-lys
2-lys
29+28+
30+31+
32+ 27+
Sample
NISTmAb, recombinant humanized IgG1κNumber of amino acids: 1326Disulfide bonds: 14(inter-chain), 2(intra-chain)High-abundance PTM: N-terminal pyroglutamination C-terminal lysine clipping glycosylation
Figure 3. Information on NISTmAb 8671 including amino-acid sequence, disulfide-bond linkage, and post-translational modification.
A
B
A
B
C
A
C
A
B
Workflow
Intact mAb BioPharma Finder
Figure 1. Characterization of mAb is accomplished by separation with the ZipChip device, online analysis using the high resolution Q Exactive BioPharma platform, and identification with BioPharma Finder software.
Figure 5. Three deconvoluted mass spectra from different migration time intervals corresponding to different lysine variants. A) mAb with 2 lysine adduct, including 5 glycosylated variant was detected B) mAb with 1 lysine adduct including 4 glycosylated variant was detected C) mAb without lysine adduct including 5 glycosylated variant was detected.
Figure 6. Migration time was used as a parameter to verify the heterogeneous mA in an example of specific glycosylation form G0F/G0F. A) Total Ion Chromatograph (TIC) in a 4 min run of NIST mAb. B) TIC from the specific form of G0F/G0F. C) TIC from the specific form of G0F/G0F+Lys. D) TIC from the specific form of G0F/G0F+2Lys
Table 1. Identified proteoforms of NIST mAb through the BioPharma Finder 2.0 software.
Figure 2. A) Schematic of high-resolution (HR) microfluidic CE chip with 22 cm channel and integrated nano-ESI emitter. The nano-ESI spray can be monitored with the integrated green laser and camera. B) Schematic of the Q Exactive mass spectrometer, including the high-performance quadrupole precursor selection and high-resolution, accurate-mass Orbitrap detection. The BioPharma Finder software package is optimized for three protein workflows: high-mass-range (HMR) mode for intact analysis, intact protein mode for subunit analysis, and normal mode for peptide mapping.
ZipChip + Q Exactive Biopharma platform
D
020406080
100
020406080
1002.573
2.5162.452
2.575
2.0 2.2 2.4 2.6 2.8 3.0
NL: 6.43E8
NL: 2.42E8
0
20
40
60
80
100
Rel
ativ
eIn
tens
ity G0F/G0F+2Lys148289
G0F/G1F+2Lys148456 G1F/G1F+2Lys
148618
G1F/G2F+2Lys148783
148200 148400 148600 148800 149000 149200Mass
G2F/G2F+2Lys148944
2-lys
2.0 2.2 2.4 2.6 2.8 3.0
020406080
1002.439
2.0 2.2 2.4 2.6 2.8 3.0RT (min)
NL: 6.43E6
Rel
ativ
e in
tens
ity
TIC
G0F/G0F
G0F/G0F+Lys
G0F/G0F+2Lys
Protein Name
Average Mass(Da)
Theoretical Mass (Da)
Mass Error (ppm)
Relative Abundance
Migration Time(min)
G0F/G1F 148198.57 148199.21 4.3 100.00 2.525 - 2.796
G1F/G1F 148361.47 148361.35 0.9 72.91 2.529 - 2.796
G0F/G0F 148035.72 148037.07 9.1 61.98 2.516 - 2.796
G1F/G2F 148523.22 148523.49 1.8 26.25 2.555 - 2.796
G2F/G2F 148685.71 148685.63 0.6 12.21 2.525 - 2.796
G0F/G1F+1Lys 148324.56 148327.41 19.2 7.13 2.465 - 2.543
G1F/G1F+1Lys 148488.20 148489.55 9.1 5.05 2.465 - 2.532
G0F/G0F+1Lys 148164.61 148165.27 4.4 4.45 2.460 - 2.538
G1F/G2F+1Lys 148652.87 148651.69 7.9 1.90 2.474 - 2.538
G2F/G2F+1Lys 148810.62 148813.83 21.5 0.49 2.495 - 2.538
G0F/G1F+2Lys 148456.27 148455.61 4.5 1.54 2.416 - 2.463
G0F/G0F+2Lys 148289.32 148293.47 28.0 1.17 2.399 - 2.468
G1F/G1F+2Lys 148617.97 148617.75 1.5 1.15 2.399 - 2.463
G1F/G2F+2Lys 148782.93 148779.89 20.5 0.38 2.405 - 2.457
G2F/G2F+2Lys 148944.03 148942.03 13.4 0.10 2.416 - 2.457
1-lysG0F/G0F+1Lys G1F/G1F+1Lys
G1F/G2F+1Lys
148810G2F/G2F+1Lys
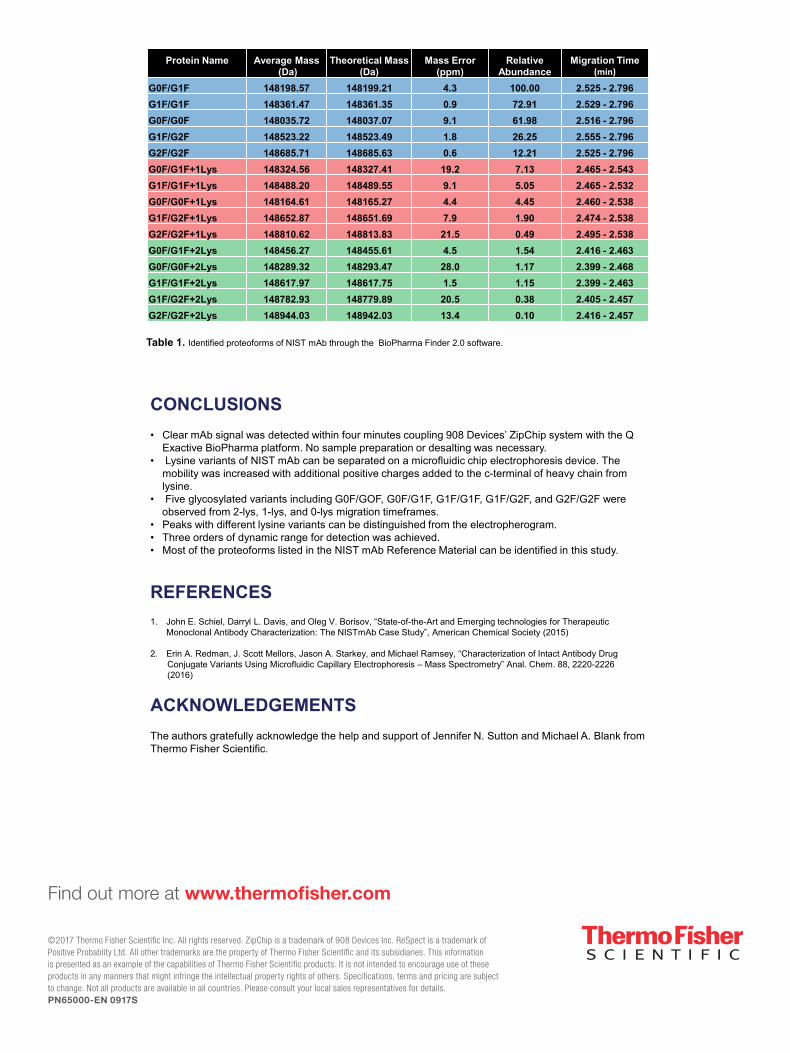
Find out more at www.thermofisher.com
©2017 Thermo Fisher Scientific Inc. All rights reserved. ZipChip is a trademark of 908 Devices Inc. ReSpect is a trademark of Positive Probablity Ltd. All other trademarks are the property of Thermo Fisher Scientific and its subsidiaries. This information is presented as an example of the capabilities of Thermo Fisher Scientific products. It is not intended to encourage use of these products in any manners that might infringe the intellectual property rights of others. Specifications, terms and pricing are subject to change. Not all products are available in all countries. Please consult your local sales representatives for details. PN65000-EN 0917S
0
20
40
60
80
100
Rel
ativ
eIn
tens
ity
148165
G0F/G1F+1Lys148325
148488
148653
148200 148400 148600 148800 149000Mass
020406080
1002.514
2.0 2.2 2.4 2.6 2.8 3.0
NL: 2.69E7
B
Chien-Hsun Chen1, Andreas Krupke2, Stephane Houel1, Aaron Bailey1, Aran Paulus1, Daniel Lopez-Ferrer1, Andreas FR Huhmer1, Shiaw-Min Chen2, Achim Karger2, Steve Williams2, Michael Wenz2, Scott Mellors3, Chris Petty3
1Thermo Fisher Scientific, Chromatography and Mass Spectrometry, San Jose, CA, 95134; 2Thermo Fisher Scientific, Life Sciences Solutions, South San Francisco, CA 94080; 3908 Devices, Boston, MA 02210
Figure 4. A) Electropherograms of NIST mAb in a 4 min run on a HR microfluidic chip hyphenated to the Q Exactive BioPharma platform. Three different forms of lysine variants were separated under a field strength of ~1000 V/cm. B) Three mass spectra were extracted from the three peaks on the electropherogram. Lysine variant (128 Da) can be identified after the comparison of deconvoluted mass spectra. The higher number of lysines on the C-terminal of heavy chain provides higher mobility due to the additional positive charges from lysine.
ABSTRACTHeterogeneity of monoclonal antibodies (mAbs), including glycosylation variants, carboxyl terminal truncation, and deamidation products, is an important analytical problem in the biopharmaceutical industry. High resolution mass spectrometry is a powerful tool for the characterization of mAbs, however, some proteoforms might not be observed due to sample complexity. In this study, a microfluidic chip electrophoresis system (ZipChip™ from 908 Devices), coupled to the high resolution Thermo Scientific™ Q Exactive™ Biopharma platform, was used to separate and characterize the NIST mAb (RM 8671), capturing distinct lysine variants and respective proteoforms. Preliminary data provides identification of most proteoforms listed in the NIST mAb Referenced Material 8671.
INTRODUCTION The main goal of this work was to develop a method to characterize heterogeneous mAb on an intact protein level. In order to resolve the complexity of mAb, a powerful combination of an efficient separation system, coupled to high-performance mass spectrometer (MS), and data analysis software is necessary. The separation of charge variants is still a challenging task, especially on an intact protein level. Capillary electrophoresis (CE) provides an ideal separation technique for charge variants of mAb. Microfluidic CE provides advantages in characterizing mAb given its good separation efficiency and short migration time based on high field strength and short separation channel. High-performance MS, including high mass accuracy and resolution, is also important for antibody characterization. An Orbitrap™ mass spectrometer is a good option for this application, and the Q Exactive BioPharma platform is suitable for the analysis of very large biomolecules. The challenge of protein MS data analysis usually increases with its molecular weight. The Thermo Scientific™ BioPharma Finder™ software is specifically designed to characterize the complex protein via delicate deconvolution of mass spectra for individual time windows in combination with a thorough comparison to a reference database with all variants. In this study, a powerful combination of microfluidic CE separation, MS detection, and data analysis is presented to solve one of the most challenging workflows in the biopharma industry.
MATERIALS AND METHODS Reference material from the NIST mAb standard (8671) with the known sequence and post translational modifications (PTMs) was used in this study. The NIST mAb is a recombinant humanized IgG1κ antibody, and process-related impurities have been removed through various purification steps. The heavy chain of this mAb is known to have a high abundance of PTMs such as N-terminal pyroglutamination, c-terminal lysine clipping, and glycosylation. 10μg/μL of raw sample was diluted with deionized water into 0.5 μg/μL for the experiments. No desalting procedure is necessary for this series of measurement. The chip was primed with background electrolyte solution (BGE) consisting of 0.2% acetic acid and 10% IPA (pH=3.17). Once a stable electrospray was observed, 10 μL of 0.5 μg/μL mAb was pipetted into the sample reservoir. Pressure injection with 2 psi and 4 s was used for sample loading, introducing 0.4 nL with 0. 2ng of mAb to the separation channel. High voltage of ~20kV was applied for CE separation within 22-cm-length of channel, and ~2kV was used for nano-ESI. Each run was finished in 4 min.
The Q Exactive mass spectrometer was set to the optimized conditions for an ultra-high mass biomolecule, and to maintain a scan rate of 6 scans/sec. In-source CID (100 e.v.) was applied to assist desolvation. An m/z range (2500-6000) was selected for this mild-denatured condition. BioPharma Finder 2.0 software was used in this study for data analysis. The sequence and PTM information of the NIST mAb was first set up in protein sequence manager. The identification of different variants can be accomplished after the mass spectra were deconvoluted to the intact mass using the ReSpect™ algorithm.
CONCLUSIONS • Clear mAb signal was detected within four minutes coupling 908 Devices’ ZipChip system with the Q
Exactive BioPharma platform. No sample preparation or desalting was necessary.• Lysine variants of NIST mAb can be separated on a microfluidic chip electrophoresis device. The
mobility was increased with additional positive charges added to the c-terminal of heavy chain from lysine.
• Five glycosylated variants including G0F/GOF, G0F/G1F, G1F/G1F, G1F/G2F, and G2F/G2F were observed from 2-lys, 1-lys, and 0-lys migration timeframes.• Peaks with different lysine variants can be distinguished from the electropherogram.• Three orders of dynamic range for detection was achieved. • Most of the proteoforms listed in the NIST mAb Reference Material can be identified in this study.
REFERENCES 1. John E. Schiel, Darryl L. Davis, and Oleg V. Borisov, “State-of-the-Art and Emerging technologies for Therapeutic
Monoclonal Antibody Characterization: The NISTmAb Case Study”, American Chemical Society (2015)
2. Erin A. Redman, J. Scott Mellors, Jason A. Starkey, and Michael Ramsey, “Characterization of Intact Antibody Drug Conjugate Variants Using Microfluidic Capillary Electrophoresis – Mass Spectrometry” Anal. Chem. 88, 2220-2226 (2016)
ACKNOWLEDGEMENTS The authors gratefully acknowledge the help and support of Jennifer N. Sutton and Michael A. Blank from Thermo Fisher Scientific.
TRADEMARKS/LICENSING © 2016 Thermo Fisher Scientific Inc. All rights reserved. ZipChip is a trademark of 908 Devices Inc. ReSpect is a trademark of Positive Probablity Ltd. All other trademarks are the property of Thermo Fisher Scientific and its subsidiaries. This information is not intended to encourage use of these products in any manner that might infringe the intellectual property rights of others.
Characterization of Intact Monoclonal Antibody with Microfluidic Chip Electrophoresis Mass Spectrometry
Instrumentation Results
0.0 1.0 2.0 3.0 4.0
Time (min)
0
20
40
60
80
100
Rel
ativ
e A
bund
ance
2.57
2.52
2.452-lys1-lys
0-lys
0
20
40
60
80
100
Rel
ativ
eIn
tens
ity
148036
148199G1F/G1F
148361
G1F/G2F148523 G2F/G2F
148686
147800 148000 148200 148400 148600 148800 149000 149200Mass
0-lysG0F/G0F
G0F/G1F
4600 4800 5000 5200 5400 5600
m/z
0
50
100
0
50
100
Rel
ativ
e A
bund
ance
0
50
1005120.054949.45
5302.894789.82
5499.344640.26
5115.664945.17
5298.304785.68
5494.524636.23
5111.234940.90
5293.724781.57
4632.18 5489.78
0-lys
1-lys
2-lys
29+28+
30+31+
32+ 27+
Sample
NISTmAb, recombinant humanized IgG1κNumber of amino acids: 1326Disulfide bonds: 14(inter-chain), 2(intra-chain)High-abundance PTM: N-terminal pyroglutamination C-terminal lysine clipping glycosylation
Figure 3. Information on NISTmAb 8671 including amino-acid sequence, disulfide-bond linkage, and post-translational modification.
A
B
A
B
C
A
C
A
B
Workflow
Intact mAb BioPharma Finder
Figure 1. Characterization of mAb is accomplished by separation with the ZipChip device, online analysis using the high resolution Q Exactive BioPharma platform, and identification with BioPharma Finder software.
Figure 5. Three deconvoluted mass spectra from different migration time intervals corresponding to different lysine variants. A) mAb with 2 lysine adduct, including 5 glycosylated variant was detected B) mAb with 1 lysine adduct including 4 glycosylated variant was detected C) mAb without lysine adduct including 5 glycosylated variant was detected.
Figure 6. Migration time was used as a parameter to verify the heterogeneous mA in an example of specific glycosylation form G0F/G0F. A) Total Ion Chromatograph (TIC) in a 4 min run of NIST mAb. B) TIC from the specific form of G0F/G0F. C) TIC from the specific form of G0F/G0F+Lys. D) TIC from the specific form of G0F/G0F+2Lys
Table 1. Identified proteoforms of NIST mAb through the BioPharma Finder 2.0 software.
Figure 2. A) Schematic of high-resolution (HR) microfluidic CE chip with 22 cm channel and integrated nano-ESI emitter. The nano-ESI spray can be monitored with the integrated green laser and camera. B) Schematic of the Q Exactive mass spectrometer, including the high-performance quadrupole precursor selection and high-resolution, accurate-mass Orbitrap detection. The BioPharma Finder software package is optimized for three protein workflows: high-mass-range (HMR) mode for intact analysis, intact protein mode for subunit analysis, and normal mode for peptide mapping.
ZipChip + Q Exactive Biopharma platform
D
020406080
100
020406080
1002.573
2.5162.452
2.575
2.0 2.2 2.4 2.6 2.8 3.0
NL: 6.43E8
NL: 2.42E8
0
20
40
60
80
100
Rel
ativ
eIn
tens
ity G0F/G0F+2Lys148289
G0F/G1F+2Lys148456 G1F/G1F+2Lys
148618
G1F/G2F+2Lys148783
148200 148400 148600 148800 149000 149200Mass
G2F/G2F+2Lys148944
2-lys
2.0 2.2 2.4 2.6 2.8 3.0
020406080
1002.439
2.0 2.2 2.4 2.6 2.8 3.0RT (min)
NL: 6.43E6
Rel
ativ
e in
tens
ity
TIC
G0F/G0F
G0F/G0F+Lys
G0F/G0F+2Lys
Protein Name
Average Mass(Da)
Theoretical Mass (Da)
Mass Error (ppm)
Relative Abundance
Migration Time(min)
G0F/G1F 148198.57 148199.21 4.3 100.00 2.525 - 2.796
G1F/G1F 148361.47 148361.35 0.9 72.91 2.529 - 2.796
G0F/G0F 148035.72 148037.07 9.1 61.98 2.516 - 2.796
G1F/G2F 148523.22 148523.49 1.8 26.25 2.555 - 2.796
G2F/G2F 148685.71 148685.63 0.6 12.21 2.525 - 2.796
G0F/G1F+1Lys 148324.56 148327.41 19.2 7.13 2.465 - 2.543
G1F/G1F+1Lys 148488.20 148489.55 9.1 5.05 2.465 - 2.532
G0F/G0F+1Lys 148164.61 148165.27 4.4 4.45 2.460 - 2.538
G1F/G2F+1Lys 148652.87 148651.69 7.9 1.90 2.474 - 2.538
G2F/G2F+1Lys 148810.62 148813.83 21.5 0.49 2.495 - 2.538
G0F/G1F+2Lys 148456.27 148455.61 4.5 1.54 2.416 - 2.463
G0F/G0F+2Lys 148289.32 148293.47 28.0 1.17 2.399 - 2.468
G1F/G1F+2Lys 148617.97 148617.75 1.5 1.15 2.399 - 2.463
G1F/G2F+2Lys 148782.93 148779.89 20.5 0.38 2.405 - 2.457
G2F/G2F+2Lys 148944.03 148942.03 13.4 0.10 2.416 - 2.457
1-lysG0F/G0F+1Lys G1F/G1F+1Lys
G1F/G2F+1Lys
148810G2F/G2F+1Lys