characterization of particle size distributions of …...characterization of particle size...
TRANSCRIPT

Characterization of Particle Size Distributions of Runoff from High Impervious Urban Catchments in the Greater Toronto Area
Prepared by: Toronto and Region Conservation September 2012


Characterization of Particle Size Distributions of
Runoff from High Impervious Urban Catchments
in the Greater Toronto Area
Final Report
Prepared for:
Ontario Ministry of the Environment
Prepared by:
Cheryl Goncalves and Tim Van Seters
Toronto and Region Conservation Authority’s Sustainable Technologies Evaluation Program
© Toronto and Region Conservation Authority

Characterization of Particle Size Distributions of Urban Runoff
Final Report Page i
NOTICE
The contents of this report do not necessarily represent the policies of the supporting agencies. Although
every reasonable effort has been made to ensure the integrity of the report, the supporting agencies do
not make any warranty or representation, expressed or implied, with respect to the accuracy or
completeness of the information contained herein. Mention of trade names or commercial products does
not constitute endorsement or recommendation of those products. No financial support was received
from manufacturers or suppliers of technologies used or evaluated in this project.
This report was prepared by Chreyl Goncalves and Tim Van Seters, with field support provided by Christy
Graham, Matt Derro, Paul Greck and Amanda Wilson.
Report citation: Goncalves, C., Van Seters, T. 2012. Characterization of Particle Size Distributions in
Runoff from High Impervious Urban Catchments in the Greater Toronto Area. Toronto and Region
Conservation Authority.
PUBLICATION INFORMATION Reports conducted under the Sustainable Technologies Evaluation Program (STEP) are available at
www.sustainabletechnologies.ca. For more information about this study, or STEP, please contact:
Tim Van Seters
Manager, Sustainable Technologies
Toronto and Region Conservation Authority
5 Shoreham Drive,
Downsview, Ontario
M3N 1S4
Tel: 289-268-3902
Fax: 416-661-6898
E-mail: [email protected]

Characterization of Particle Size Distributions of Urban Runoff
Final Report Page ii
THE SUSTAINABLE TECHNOLOGIES EVALUATION PROGRAM
The Sustainable Technologies Evaluation Program (STEP) is a multi-agency program, led by the Toronto
and Region Conservation Authority (TRCA). The program was developed to provide the information, data
and analytical tools necessary to support broader implementation of sustainable technologies and
practices within a Canadian context. The main program objectives are to:
monitor and evaluate clean water, air and energy technologies;
assess barriers and opportunities to implementing technologies ;
develop supporting tools, guidelines and policies, and
promote broader use of effective technologies through research, education and advocacy.
Technologies evaluated under STEP are not limited to physical products or devices; they may also
include preventative measures, alternative urban site designs, and other innovative practices that help
create more sustainable and liveable communities.

Characterization of Particle Size Distributions of Urban Runoff
Final Report Page iii
ACKNOWLEDGEMENTS This project was made possible by funding support from the Ontario Ministry of the Environment. In kind
support for lab services was provided by the Ontario Ministry of the Environment Lab Services Branch,
the University of Waterloo and the Virginia Polytechnic Institute and State University. The authors thank
the external reviewers for providing insights and comments on an earlier draft of this report.


Characterization of Particle Size Distributions of Urban Runoff
Final Report Page iv
EXECUTIVE SUMMARY
Many stormwater best management practices rely, at least in part, on sedimentation for treatment of
runoff. The effectiveness of these practices is strongly influenced by the size distribution of particles
because smaller particles tend to have lower settling velocities. Thus, accurate data and information on
the size distribution of particles in urban runoff is important.
This study assesses the accuracy and reliability of common laboratory particle size distribution (PSD)
analytical methods, and identifies a range of PSDs in stormwater runoff that is broadly representative of
high impervious drainage areas in the Greater Toronto Area.
To determine the accuracy of laboratory PSD analytical methods, two to three samples of a standard
solution of known PSD were submitted for analysis to five laboratories. Three of these laboratories
analyzed samples using laser diffraction methods and two used digital micro-imaging. Comparison of
PSD results showed good overall correlation among labs, but reported differences were as high as 80%
of the standard particle size in certain size ranges.
Samples submitted for PSD analysis were also analyzed for total suspended solids (TSS) at three of the
five laboratories. Comparisons revealed only one lab to provide reasonably accurate and repeatable TSS
results.
Following the laboratory assessment, untreated stormwater runoff was sampled from six high impervious
parking and road drainage areas over the course of six rain events. Grab samples were collected within
the storm sewer system, directly from paved surfaces and at storm sewer outfalls. The PSD of samples
was analyzed by the two labs that best matched the standard during testing. Comparison of PSD field
test results from these two labs showed no statistically significant difference in the average PSDs.
However, significant differences were found in the size ranges between 250 and 14.9 µm, and 3.73 to
0.66 µm. There was no significant difference between the reported TSS values from the two labs.
Results from the lab that best matched the standard showed a median particle size range of 4.2 to 31.1
microns across the various source areas and rain events. On average, 50% of particles were finer than
13.7 microns and 90% of particles were finer than 55 microns. Although samples were collected from
different source areas and at different locations within the drainage network, the variability among
samples collected at a single site was often greater than the variability among samples collected at
different sites.
Comparisons to other literature showed that samples collected in the Greater Toronto Area both in the
present and previous studies tend to have finer particle PSDs than those collected in many other cold
climate jurisdictions. This result is particularly evident in the coarser particle size range above 200 µm,
which was almost never found, even in runoff sampled directly from the pavement surface. Further testing
is recommended to assess how detection of these coarse particles may be influenced by the sampling
methods and laboratory techniques used to analyze samples. This testing should also address the
potential discrepancy between the PSD of stormwater as reported by laboratories and the actual or
‘effective’ PSD of urban runoff draining to stormwater treatment facilities.


Characterization of Particle Size Distributions of Urban Runoff
Final Report Page v
TABLE OF CONTENTS
EXECUTIVE SUMMARY ............................................................................................................................. iv
1.0 INTRODUCTION ................................................................................................................................... 1
2.0 SITE DESCRIPTION ............................................................................................................................. 3
2.1 Parking lot sites ...................................................................................................................... 3
2.2 Storm sewer outfalls .............................................................................................................. 5
3.0 STUDY METHODS ................................................................................................................................ 7
3.1 Lab comparison ...................................................................................................................... 7
3.2 Lab methods ........................................................................................................................... 7
3.3 Field sampling ........................................................................................................................ 8
3.3.1 Sample collection .................................................................................................. 8
3.3.2 Sample preparation ............................................................................................... 8
4.0 LABORATORY COMPARISONS .......................................................................................................... 9
4.1 Particle size distribution ........................................................................................................ 9
4.2 Total suspended solids .......................................................................................................... 10
5.0 FIELD SAMPLING RESULTS ............................................................................................................... 12
5.1 Precipitation ............................................................................................................................ 12
5.2 Total suspended solids .......................................................................................................... 12
5.3 Particle size distribution ........................................................................................................ 13
5.3.1 Laboratory comparison using field samples ......................................................... 13
5.3.2 Field sample particle size distributions ................................................................. 15
5.3.3 Site comparative analysis ..................................................................................... 17
5.3.4 Sampling method comparative analysis ............................................................... 18
5.3.5 Comparison to other studies ................................................................................. 20
6.0 CONCLUSIONS .................................................................................................................................... 22
7.0 REFERENCES ...................................................................................................................................... 24
LIST OF TABLES
Table 2.1: Stormwater runoff sites ............................................................................................................... 3
Table 4.1: Results from paired t-tests using D-values from each lab, compared to D-values of the test
standard ....................................................................................................................................................... 10
Table 4.2: Correlations between repeat samples ........................................................................................ 10
Table 4.3: TSS results from Standard Sample submission ......................................................................... 11
Table 5.1: Rainfall events, 24 hour cumulative amounts and maximum intensity ....................................... 12
Table 5.2: Average particle size distributions, TSS concentrations and descriptive statistics for all sites .. 16
Table 5.3: Results of ANOVA comparing d10, d50 and d90 values ................................................................ 18
Table 5.4: Comparison of particle size distributions from previous studies in cold climates ....................... 20
LIST OF FIGURES
Figure 2.1: Bramport site location ............................................................................................................... 4
Figure 2.2: Kortright and Earth Rangers site locations ............................................................................... 4

Characterization of Particle Size Distributions of Urban Runoff
Final Report Page vi
Figure 2.3: TRCA Head Office site location ................................................................................................ 5
Figure 2.4: Black Creek site location .......................................................................................................... 6
Figure 2.5: Lawrence at Weston site location ............................................................................................. 6
Figure 4.1: PSD for test standard and average PSD reported by Labs A, B, C, D and E .......................... 9
Figure 5.1: Lab A TSS values vs Lab B TSS values ................................................................................... 13
Figure 5.2: Average difference in individual particle size distribution ranges between Lab A and Lab B ... 14
Figure 5.3: Average cumulative PSD for Lab A and B with 95% confidence limits ..................................... 14
Figure 5.4: Average and individual sample particle size distributions in the GTA ...................................... 15
Figure 5.5: Average and individual sample particle size distributions by sampling location ....................... 17
Figure 5.6: PSDs of samples collected using an auto sampler or grab method ......................................... 19
APPENDIX A: Mean PSD Correlations
APPENDIX B: Frequency Distribution and Average PSD for Mixed Use and Parking Lot Sites

Characterization of Particle Size Distributions of Urban Runoff
Final Report Page 1
1.0 INTRODUCTION
Insoluble particles and other solid materials that become suspended in water are, in terms of total mass, the
largest source of water pollution. Suspended particulate matter clouds the water, reduces the ability of some
aquatic organisms to find food, clogs and abrades fish gills, inhibits photosynthesis by aquatic plants,
disrupts aquatic food webs, and acts as a transport vector for heavy metals, pesticides, nutrients and other
harmful substances. Once deposited, the sediment can destroy the feeding and spawning grounds of fish,
and fill lakes, artificial reservoirs and stream channels.
The distance that suspended solids travel, and the type and quantity of pollutants transported, is strongly
influenced by the size and shape of the particles in runoff. While large particles settle out rapidly, particles in
the smaller size range remain in suspension for long distances. The smaller silt and clay sized particles have
greater surface area by mass than larger particles, and thus offer more surface sites for the adsorption of
dissolved constituents. In samples of highway runoff, Sansalone and Buchberger (1997) found a strong
preferential association of zinc, copper and lead to finer particle sizes. Vase and Chiew (2004) reported a
similar association of nutrients (phosphorus and nitrogen) to finer particle sizes in stormwater runoff in
Australia.
The effectiveness of stormwater best management practices that rely, at least in part, on sedimentation for
treatment of runoff is strongly influenced by the size distribution of particles because smaller particles tend to
have lower settling velocities. Thus, accurate data and information on the size distribution of particles in
urban runoff are critical to ensuring that these practices are appropriately designed and sized. Existing
studies, however, report widely varying distributions making it difficult to select and size stormwater control
devices based on the particle size distribution of runoff being treated. In Wisconsin, for instance, Selbig and
Bannerman (2011) reported median particle sizes from six urban sources areas ranging from approximately
42 µm in runoff from a mixed use strip mall to 200 µm from runoff samples collected from feeder streets. A
considerably smaller median particle size (6 - 9 µm) was found in samples collected through the US National
Urban Runoff Program (Driscoll, 1986) and in several studies within the Greater Toronto Area (e.g. SWAMP
studies, 2003 - 2005; Stantec, 2010). In samples of highway runoff, Sansalone et al (1998) found much
coarser distributions (d50=570 um) than has been reported elsewhere.
The wide variation in particle size distribution among studies is influenced by site conditions, including soil
type, wind and tree canopy, as well as from human influences, such as vehicular activity and the application
of de-icing materials (OMOE, 2003). Some of the variation may also be attributed to differences in sample
collection and analysis methods. Studies have shown that transportation and storage of samples can
influence the size distribution. Phillip and Walling (1995), for instance, found that storing samples even for
an hour substantially increased the mean particle size of fluvial suspended solids due to flocculation. A
similar positive correlation between fine particle sizes (2 – 7 µm) and storage time was noted by Li et al
(2005), suggesting that extended storage in stormwater treatment systems can enhance settling
performance.
This project expands on earlier studies by testing the accuracy and reliability of common laboratory PSD
analytical methods, and identifying PSD ranges in stormwater runoff collected from six high impervious
drainage areas in the Greater Toronto Area (GTA). Potential sources of variability in field data were reduced

Characterization of Particle Size Distributions of Urban Runoff
Final Report Page 2
by employing a single, repeatable sampling and processing method, selecting similar types of source areas,
limiting sampling to a narrow geographic range, and submitting samples to laboratories able to accurately
reproduce a solution of known PSD. Field sampling PSD results are compared to other local stormwater
runoff studies or studies of similar source areas to provide a context for interpretation of results. Although the
sample size in this study is small, the data provide a valuable contribution to the larger body of literature on
urban runoff PSDs, and are helpful in characterizing a PSD range that is broadly representative of highly
impervious areas within the Greater Toronto Area.

Characterization of Particle Size Distributions of Urban Runoff
Final Report Page 3
2.0 SITE DESCRIPTIONS
Rain event runoff was sampled from six small, high impervious drainage areas that are representative of
where underground sedimentation devices would typically be installed. These sites include a combination of
parking lots and small residential and mixed used catchments. Samples were collected within the storm
sewer system, from paved surfaces and at storm sewer outfalls (Table 2.1). In all cases, sampled runoff
was untreated.
Table 2.1: Stormwater runoff sites
Site Land Use Major Land
Cover types
Drainage
area (m2) Sample location
Black Creek Residential Grass, Roof
and Asphalt 2100 Storm Sewer outfall
Lawrence @
Weston Mixed use Roof, Asphalt 1575 Storm Sewer outfall
TRCA head office Private Parking lot Asphalt 1600 Runoff leaving parking lot
Bramport Commercial
parking lot Asphalt 33,500 Storm sewer manhole
Kortright Private Parking lot Asphalt 3100 Runoff leaving parking lot
Earth Rangers Private Parking lot Asphalt 800 Runoff leaving parking lot
2.1 Parking lot sites Four locations were selected to represent stormwater runoff originating in parking lots. The Bramport site is a
commercial and retail development parking lot near the intersection of Airport Road and Bovaird Drive in
Brampton (Figure 2.1). The parking lot area upstream of the sampling location is 33,500 m2. Samples of
runoff were collected from a storm sewer accessed through a manhole. The storm sewer drains to an Oil
and Grit Separator unit and underground infiltration chamber system, both of which were downstream of the
sampling location. During large rain events, an orifice on the storm sewer downstream of the infiltration
chamber system resulted in temporary detention of water in the storm sewer system. Grab samples were
taken from the surface using an extendable swing sampling pole. The intake and tubing for an automatic
sampler was also installed at the bottom of the manhole to facilitate comparison of the two sampling
methods.
Two sites were located within the Kortright Conservation Area near the intersection of Pine Valley Drive and
Rutherford Road in Vaughan (Figure 2.2). The north site has a drainage are of approximately 3100 m2 and is
at the north east end of the main Kortright parking lot, where runoff is directed into a ditch. The south has a
drainage area of 800 m2 and is at the south east end of the Earth Rangers parking lot where the runoff flows
towards a drainage ditch. Both sites are paved with asphalt. Samples were collected using grab sample
bottles directly from the surface as the runoff drained off of the parking lot, and before mixing with surface
waters in either of the drainage ditches.

Characterization of Particle Size Distributions of Urban Runoff
Final Report Page 4
Figure 2.1: Bramport site location
Figure 2.2: Kortright and Earth Rangers parking lots

Characterization of Particle Size Distributions of Urban Runoff
Final Report Page 5
The fourth parking lot site is located at the TRCA Head office near the intersection of Jane Street and Steeles
Avenue West in Toronto (Figure 2.3). This asphalt paved lot has a drainage area of 1600 m2 and discharges
to a small wetland on the north west side of the parking lot. Samples were collected at the edge of the
pavement shortly after runoff left the parking lot, prior to mixing with any water in the wetland.
Figure 2.3: TRCA Head Office parking lot. Samples were collected immediately adjacent to the paved parking area as water entered the grass channel shown in the image above.
2.2 Storm sewer outfalls Two sites were located at storm sewer outfalls draining into Toronto streams. The Black Creek site is located
near the intersection of Black Creek Drive and Tretheway Drive in Toronto and has a drainage area of
approximately 2100 m2 (Figure 2.4). The drainage area is residential, with roads, cul-de-sacs and
landscaped areas.
The Lawrence at Weston site is located at the intersection of Little Avenue and Lawrence Avenue West, and
has an estimated drainage area of 1575 m2 (Figure 2.5). This site drains both residential areas and
commercial plazas. At both sites samples are collected from the storm sewer outfall prior to any mixing with
the stream. Samples were not taken when water levels in the stream rose above the invert of the storm
sewer outfall, which typically occurred late in a storm event.

Characterization of Particle Size Distributions of Urban Runoff
Final Report Page 6
Figure 2.4: Black Creek site location
Figure 2.5: Lawrence at Weston site location

Characterization of Particle Size Distributions of Urban Runoff
Final Report Page 7
3.0 STUDY METHODS
3.1 Lab comparison In order to determine the accuracy and comparability of laboratory analytical methods, a standard solution of
known PSD was submitted to five laboratories. The standard solution was prepared by adding 75 mg of a
dry silica mix (Sil-co-sil 52) to 500 mL of distilled water, resulting in a sediment concentration of 150 mg/L.
The Sil-co-sil 52 product was selected because the PSD is strictly controlled as part of its manufacturing
process and its median particle size (12 μm) and range (1 to 60 μm) compared well with field sample results
from other studies in the GTA (e.g. SWAMP, 2005).
Labs received 2 or 3 submissions of this standard solution for analysis. The reported PSDs for each lab were
compared for accuracy and variability among the samples. The two labs that reported the lowest variability
among samples and the most accurate match to the standard were chosen for submission of the field
samples.
3.2 Lab methods Laboratory results of the samples were reported by each lab as the percent of sample volume in each size
range. Reported size ranges were not consistent between labs, as there is no standard reporting range.
Each lab followed different procedures, but there were two main methods of particle size determination used.
Labs A, B and D used laser diffraction, a method in which a laser beam is passed through the sample. As the
beam encounters particles, the light is diffracted at an angle which is directly proportionate to the size of the
particle itself. The particle size distribution of the sample is identified by the light intensity distribution pattern
resulting from all the particles in the sample. Labs A, B and D referenced ISO 13320:2009 for particle size
analysis using laser diffraction. These three labs used a Coulter Counter Particle Size Analyzer to identify the
PSD.
Digital micro-imaging was used by Labs C and E. Again, there was no standard method followed by either
lab, but the British Standard BS 3406-4 was referenced. In this method the particles in the sample are
allowed to settle as the liquid seeps through a filter with a pore size of 0.4 microns. Lab C used sonication to
disperse the particles prior to settling on the filter, whereas Lab E did not use sonication, and particles that
had agglomerated were not separated. After settling, photomicrographs of the particles retained on the filter
are taken using an optical microscope at different magnifications. An Image Processing Software is used to
detect the edges of particles, and calculates the number and size of each particle based on the number of
pixels it covers in the photo. Results were reported as the number of particles within each size range.
Labs A, B and C also analyzed the samples for Total Suspended Solids (TSS) based on a method similar or
equivalent to ASTM D5907-09. By this method, a known aliquot of the sample is filtered through a glass fiber
filter, and dried to remove any water. The weight of the remaining residue is the total amount of suspended
solids in the aliquot. Results for TSS analysis were reported as the weight of suspended solids (mg) per liter
of sample water.

Characterization of Particle Size Distributions of Urban Runoff
Final Report Page 8
3.3 Field sampling Samples were collected during six rain events between October 20th and December 15th 2011. During the
first three events, runoff samples were collected at three sites: Bramport, Black Creek and Lawrence at
Weston. Additional sites were later added to characterize a wider range of runoff conditions. These
additional sites were first sampled during the November 29th 2011 rain event. Grab samples were taken to
avoid potential particle size bias associated with automated samplers (Clark et al, 2009). Since grab samples
are collected at a point in time, the PSDs do not represent the event mean distribution. Rainfall
measurements were obtained from tipping bucket rain gauges operated and maintained by TRCA’s
hydrometrics group.
3.3.1 Sample collection
Prior to sample collection, nalgene sample bottles were rinsed three times using the sample water. At
Bramport, an extendable sampling pole was used to reach down into the manhole upstream of the oil grit
separator, and collect a sample from a depth of approximately 30 cm below the surface. Grab samples were
collected directly from the flow as it left the storm water outlet pipe (prior to entering the stream) at both Black
Creek and Lawrence at Weston. At Kortright, Earth Rangers and TRCA Head Office, the samples were
taken at the point, or close to the point, where the runoff left the paved surface. Once filled the containers
were capped and placed in a cooler.
During the rain event on December 15th, 2011 additional samples were collected using automated sampling
pumps installed at the Bramport, Black Creek and the Lawrence and Weston sites. Grab samples were
collected using the grab method described above, immediately followed by a sample collected using the
autosampler.
The automated samplers were set up with the intake installed inside the outlet pipe (at Black Creek and
Lawrence at Weston) and at the bottom of the manhole at Bramport. Sample tubing was Teflon lined and
fully purged prior to sampling following a standard procedure. Sample preparation and analysis for both grab
and automated samples was the same.
3.3.2 Sample preparation
Every effort was made to submit representative samples to both Lab A and B. Sample nalgenes were
inverted several times to thoroughly mix and re-suspend the particles. One bottle for each lab was filled one
quarter full. The nalgene was then capped, inverted again several times and the two bottles were filled to
another one-quarter (half-full). The process was repeated two more times, inverting the nalgene and filling
the bottles to three-quarters full, and then filling them completely.
Samples were delivered to both Lab A and Lab B within 48 hours of rain events for analysis of both PSD and
TSS. After each event the nalgenes were filled with de-ionized water for 24 hours, and then rinsed with a
10% hydrogen peroxide and water solution. After air drying, the nalgenes were sealed with the caps to avoid
contamination until the next grab sample event.

Characterization of Particle Size Distributions of Urban Runoff
Final Report Page 9
4.0 LABORATORY COMPARISONS
4.1 Particle size distribution Standard PSDs submitted to the five labs resulted in slightly different reported PSDs (Figure 4.1). Labs A and
B, using laser diffraction, followed the standard test PSD closely, with the largest discrepancies in the finer
range, between 1 to 4 microns. Lab D, which also used laser diffraction, reported a PSD that was much more
consistent with the reported PSDs of Lab C and E, which used digital microimaging.
Figure 4.1: PSD for test standard and average PSD reported by Labs A, B, C, D and E.
Due to differences in the size ranges reported by the five labs, results were instead compared based on
estimated D values from the plotted PSD distributions (see Appendix A). D-values from each Lab PSD were
compared to the corresponding D-values of the test standard using a paired t-test (Table 4.2). Labs C, D and
E were found to be significantly different from the test standard in the two-tailed test. Labs A and B, which
both used laser diffraction, reported PSDs that were not significantly different from the standard PSD and
much closer to the actual size distribution.

Characterization of Particle Size Distributions of Urban Runoff
Final Report Page 10
Table 4.1: Results from paired t-tests using D-values from each lab, compared to D-values of the test standard.
Standard Lab A Lab B Lab C Lab D Lab E
Mean 14.37 17.43 15.45 8.87 9.47 8.61
Variance 107.15 215.11 162.05 23.93 20.36 24.34
Observations 9 9 9 9 9 9
Pearson Correlation 0.998 0.999 0.997 0.995 0.992
df 8 8 8 8 8
t Stat 2.10 1.35 -3.01 -2.50 -3.15
P(T<=t) two-tail 0.07 0.21 0.02 0.04 0.01
t Critical two-tail 2.31 2.31 2.31 2.31 2.31
Consistent with the above comparisons, Lab B was best correlated with the standard, followed by A, D, C
and E Although not as representative of the standard test PSD, it was interesting to note that Labs C and E,
which used microimaging, were highly correlated to each other, (r = 0.9981), even though only Lab C used
‘sonication’ to break up conglomerates.
Labs were also evaluated upon the ability to produce PSDs that were comparable between “replicate”
samples (Table 4.3). Each lab received 2 or 3 test standard samples, and the results were compared via
paired t-tests. Lab A showed the best correlation between the paired replicates, with the lowest correlation
being 0.971 between samples 1 and 3, and the highest being 0.993 between samples 1 and 2. Lab B and C
also showed good repeatability, having correlations of 0.989 and 0.986 respectively between the two
samples. Lab D and E showed the lowest repeat sample correlations among all labs tested.
Table 4.2: Correlations between repeat samples
1 vs 2 1 vs 3 2 vs 3
Lab A 0.993 0.971 0.992
Lab B 0.989 - -
Lab C 0.986 - -
Lab D 0.942 0.991 0.927
Lab E 0.966 0.919 0.977
Based on the results of the standard testing, samples from the field study were submitted to labs A and B.
These labs showed both the highest correlation with the test standard, and good repeatability between
samples.
4.2 Total suspended solids Labs A, B and C each evaluated 2 samples of the test standard for Total Suspended Solids. Lab A provided
TSS results that had a small variance between the two samples, and was very close to the actual TSS value
of 150 mg/L (Table 4.1). However results from Labs B and C showed a large variance, and reported TSS
values were much lower than the standard value.

Characterization of Particle Size Distributions of Urban Runoff
Final Report Page 11
Table 4.3: TSS results from Standard Sample submission1
Lab A Lab A Lab B Lab B Lab C Lab C
Reported TSS (mg/L) 145 144 99 127 75 100
Difference from Standard -5 -6 -51 -23 -75 -50
Variance 0.5 392 312.5 Note: 1 Although the samples submitted contained 150 mg/L of solids, approximately 5 mg/L may have been lost through the 1.5 to 2 micron glass fibre filter used to determine TSS. Thus the exact TSS concentration of the standard is unknown, but a loss of more than 5 mg/L seems unlikely based on the size distribution presented in Figure 4.1.


Characterization of Particle Size Distributions of Urban Runoff
Final Report Page 12
5.0 FIELD SAMPLING RESULTS
5.1 Precipitation A total of six rain events were sampled between October 20th and Dec 31st, 2011. Events ranged in size from
a 24 hour cumulative rainfall of 2.4 mm on October 24th to 58 mm on November 29th, 2011 (Table 5.1). The
storm on November 23rd 2011 produced the highest intensity rainfall (8 mm/min or 480 mm/h), recorded at
8:00 pm. The majority of rain events were sampled after the first flush of solids washed off the pavement
surfaces, but before the rain had stopped. Samples from Earth Rangers, Kortright and TRCA Head Office
were collected earlier because these sites were closer. These samples may have included all or a portion of
the first flush.
Table 5.1: Rainfall events, 24 hour cumulative amounts and maximum intensity
Event # and
Date
1
20-Oct
2
24-Oct
3
23-Nov
4
29-Nov
5
5-Dec
6
15-Dec
24 hour cumulative rainfall (mm)
24.4 2.4 10.2 58 7.8 6.6
Max intensity (mm/h)
8.8 9.6 480 8.8 2.4 14.4
5.2 Total suspended solids Labs A and B also analyzed each sample for the amount of Total Suspended Solids (TSS). TSS values from
Lab A and B were matched by sample date and compared using a paired t-test. Results indicate that there is
no significant difference between the reported TSS values from Lab A and Lab B (ptwo-tail = 0.129). However
Figure 5.1 shows that as the TSS increased above 90 mg/L, Lab A reported values higher than Lab B.
Further comparisons indicate that there was no significant difference in reported TSS values when paired
samples were compared on a site by site basis. Comparisons of TSS for each rain event revealed a
significant difference between Lab A and Lab B values reported for the December 15th event.

Characterization of Particle Size Distributions of Urban Runoff
Final Report Page 13
Figure 5.1: Lab A TSS values vs Lab B TSS values
5.3 Particle size distribution A total of 44 water samples collected at the six sites during the six rain events were submitted for
determination of their particle size distribution. However six samples were below the detectable limit for
particle size distribution and were not analyzed. In order to compare the analytical results from the field
samples, replicate samples were analyzed at Labs A and B, with both labs receiving 17 replicates. Lab A
analyzed an additional 4 samples without replicates.
5.3.1 Laboratory comparison using field samples
Duplicate samples identified by Lab A or Lab B were matched by both site and event, and a matched pairs t-
test was conducted. This test compared the percentage of particles in each particle range identified by Lab
A, to those identified by Lab B. There were no significant differences found in any of the 17 pairs, indicating
that there was no significant difference between the paired PSDs reported by Labs A and B. Average PSDs
were also calculated for each lab, and compared using a paired t-test. Statistically there was no difference
between the Average Lab A PSD and the Average Lab B PSD (P (T<=t) two-tail= 0.999) and the two
distributions were highly correlated (r = 0.84). Appendix A shows correlations between labs at each site.
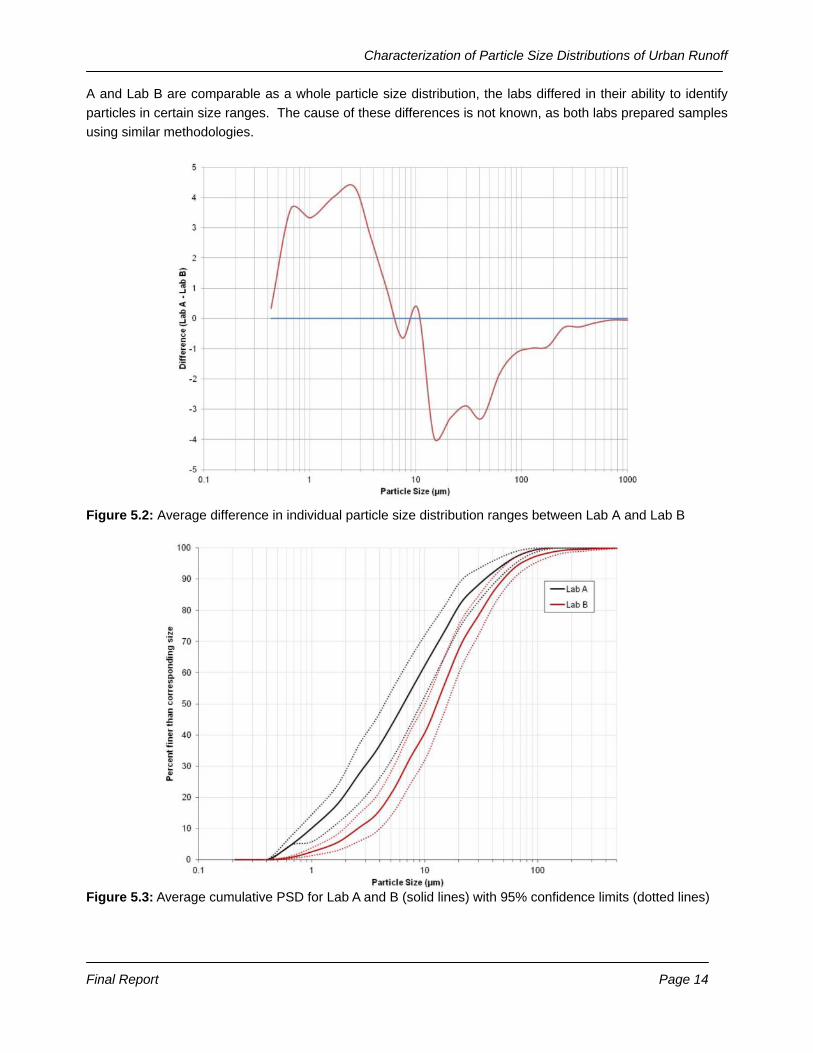
To further test for differences, each size range was tested independently in a matched pairs test. Averages
were calculated for each size range, for samples analyzed by Lab A and Lab B. Significant differences
between the two labs were found in the size ranges between 250 and 14.9 µm, in which Lab B identified
more particles, and 3.73 to 0.66 µm, in which significantly more particles were identified by Lab A (Figure
5.2). When the 95% confidence intervals are plotted along with the average cumulative PSD of both labs, the
separation of the confidence intervals confirmed this difference (Figure 5.3). While the average PSDs of Lab
Characterization of Particle Size Distributions of Urban Runoff
Final Report Page 14
A and Lab B are comparable as a whole particle size distribution, the labs differed in their ability to identify
particles in certain size ranges. The cause of these differences is not known, as both labs prepared samples
using similar methodologies.
Figure 5.2: Average difference in individual particle size distribution ranges between Lab A and Lab B
Figure 5.3: Average cumulative PSD for Lab A and B (solid lines) with 95% confidence limits (dotted lines)
Characterization of Particle Size Distributions of Urban Runoff
Final Report Page 15
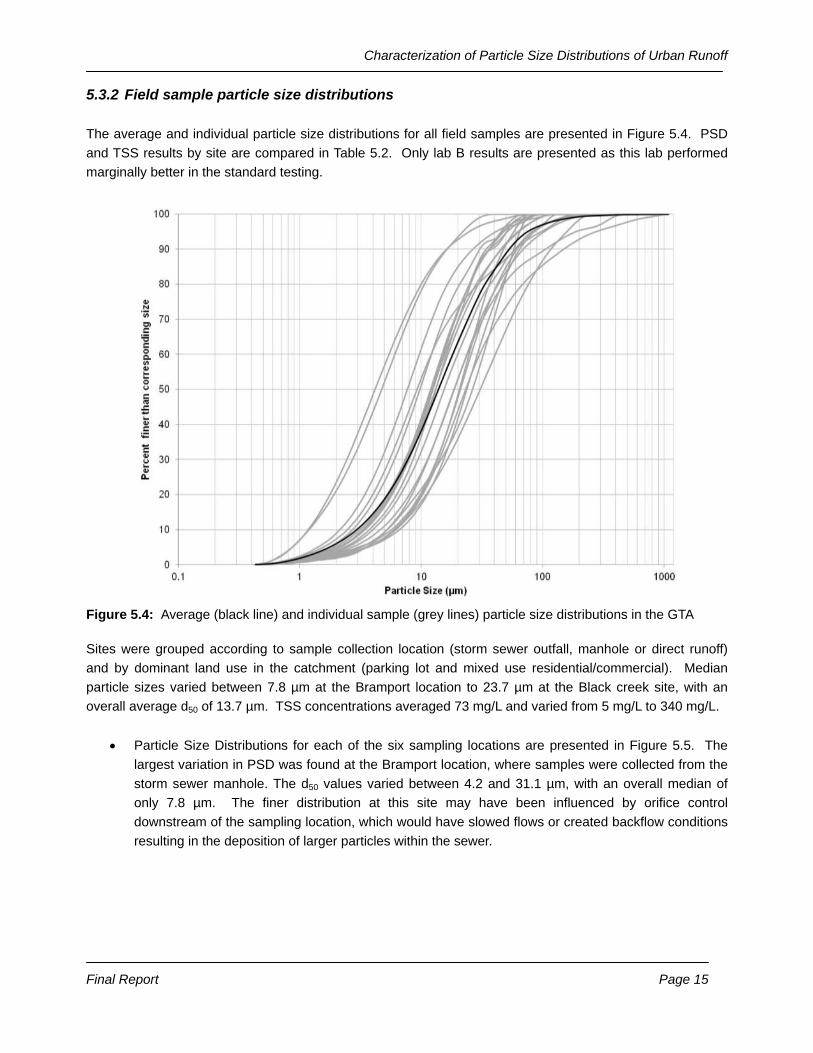
5.3.2 Field sample particle size distributions
The average and individual particle size distributions for all field samples are presented in Figure 5.4. PSD
and TSS results by site are compared in Table 5.2. Only lab B results are presented as this lab performed
marginally better in the standard testing.
Figure 5.4: Average (black line) and individual sample (grey lines) particle size distributions in the GTA
Sites were grouped according to sample collection location (storm sewer outfall, manhole or direct runoff)
and by dominant land use in the catchment (parking lot and mixed use residential/commercial). Median
particle sizes varied between 7.8 µm at the Bramport location to 23.7 µm at the Black creek site, with an
overall average d50 of 13.7 µm. TSS concentrations averaged 73 mg/L and varied from 5 mg/L to 340 mg/L.
Particle Size Distributions for each of the six sampling locations are presented in Figure 5.5. The
largest variation in PSD was found at the Bramport location, where samples were collected from the
storm sewer manhole. The d50 values varied between 4.2 and 31.1 µm, with an overall median of
only 7.8 µm. The finer distribution at this site may have been influenced by orifice control
downstream of the sampling location, which would have slowed flows or created backflow conditions
resulting in the deposition of larger particles within the sewer.

Characterization of Particle Size Distributions of Urban Runoff
Final Report Page 16
Table 5.2: Average particle size distributions, TSS concentrations and descriptive statistics for all sites.
Site BC LW ER HO KPP BRAM
Sample Location Storm outfall Direct asphalt runoff storm sewer manhole
Land use
Mixed
residential Parking lot Parking lot
# of observations 3 4 3 2 3 5
Mean TSS Conc. 52.0 30.6 132.7 48.5 56.7 63.8
Min TSS 5.0 5.0 20.0 14.0 31.0 53.0
Max TSS 102.0 64.0 340.0 83.0 102.0 88.0
Mean 34.0 16.0 20.3 20.5 26.0 16.7
Median 21.0 11.5 14.9 13.6 14.9 7.1
Mode 22.8 10.8 13.0 13.0 13.0 6.2
d10 5.8 3.4 4.1 4.0 4.0 1.7
d20 10.3 5.8 7.0 6.5 7.1 2.8
d30 13.7 7.8 9.4 9.3 9.4 4.4
d40 18.1 10.2 12.5 12.3 12.5 5.8
d50 23.7 12.5 16.0 15.0 16.4 7.8
d60 28.7 16.2 19.8 19.0 21.6 10.3
d70 35.2 19.8 26.1 23.9 28.5 15.0
d80 45.8 26.2 34.5 34.0 38.0 23.9
d90 66.4 46.7 50.3 50.3 60.5 50.3
Min d50 21.1 11.8 12.4 12.7 9.9 4.2
Max d50 27.1 13.0 21.0 19.0 23.8 31.1
SD 18.9 1.2 5.8 8.4 12.5 14.8
CV 55.6 7.4 28.6 41.2 48.0 88.7
Note: D values are interpolated from the PSD graphs and are therefore approximate values
At the other parking lot locations, runoff was collected directly from the surface. These sites - TRCA Head
Office, Kortright, and Earth Rangers - showed less variation in the distributions, and their PSDs were very
similar, with d50 values ranging between 9.9 and 23.8 µm. The average site d50 was very similar among sites
(15 – 16.4 µm). Stormwater outfall sites at Black Creek and Lawrence and Weston showed more variation
between sites than within each site. This result was expected given that the catchment areas contributing to
the outfalls are very different. Frequency distributions for each site are presented in Appendix B.

Characterization of Particle Size Distributions of Urban Runoff
Final Report Page 17
Figure 5.5: Average (black) and individual sample (grey) particle size distributions by sampling location
5.3.3 Site comparative analysis
Sites were compared using d10, d50 and d90 values reported by Lab B. d10 values ranged from 1.19 to 6.80
µm, d50 from 4.15 to 31.1 µm and d90 from 16.39 to 153.0 µm. Comparisons were made between sites that
were sampled during the same rain event. An Analysis of Variance (ANOVA) was used to compare d10, d50
and d90 particle sizes. As sampling did not occur at every site during every rain event, comparisons between
all the sites was not possible.

Characterization of Particle Size Distributions of Urban Runoff
Final Report Page 18
Table 5.3 presents the results of the ANOVA comparisons. D-values for the Black Creek and Lawrence-
Weston sites were compared for events 2, 5 and 6. At the d10 and d50 levels, these two sites were statistically
different. As mentioned previously, there was more variation in the d10 and d50 levels between these sites
than within the sites.
Kortright and Earth Rangers sites were compared for events 4, 5 and 7. Statistically there was no significant
difference between these sites in terms of d10, d50 or d90 values. There was more variation among events
sampled at these sites than between sites. Similarity between these sites was expected, as the sites are
close to one another, have similar drainage areas and land uses, and were sampled at approximately the
same time.
The Lawrence-Weston mixed use site was also compared to the Bramport parking lot site for events 4, 5 and
6. These two sites were statistically different for the d10 and d50 values.
Five sites were sampled during both rain events 4 and 5. The d10, d50 and d90 values were compared for
these two events and found no significant difference between the events. The temporal variation in the D-
values at each individual site was greater than the spatial variation at different sampling sites.
Table 5.3: Results of ANOVA comparing d10, d50 and d90 values
ANOVA Sites Sample Location Events p(d10) p(d50) p(d90)
1 BC Storm outfall
2,5,6 0.00191 0.00331 0.2657 LW Storm outfall
2 ER Direct surface runoff
4,5,7 0.7372 0.8270 0.5468 KPP Direct surface runoff
3 LW Storm outfall
4,5,6 0.0272 0.0242 0.5812 BRAM Parking lot manhole
4
BRAM Parking lot manhole
4,5 0.4518 0.4964 0.3233
ER Direct surface runoff
THO Direct surface runoff
KPP Direct surface runoff
LW Storm outfall
Notes: 1Significant at p<0.01, 2significant at p<0.05
Average PSDs for all samples collected were calculated for parking lot runoff sites (Earth Rangers, TRCA
Head Office, Kortright, and Bramport), and for mixed use sites (Lawrence-Weston and Black Creek). The
average PSDs were compared using an ANOVA, and no significant difference between the two types of
runoff was found (p =0.632).
5.3.4 Sampling method comparative analysis
Samples collected by an automated sampler were compared to samples collected using the grab method
(Figure 5.6). At the Black Creek and Lawrence-Weston sites the two methods produce similar PSDs, which
are highly correlated (r = 0.977 and 0.981 respectively). However, the PSDs produced from the Bramport

Characterization of Particle Size Distributions of Urban Runoff
Final Report Page 19
location are different. The PSD captured by the auto sampler had a much coarser distribution, and the
correlation between the two methods is low (r = 0.542273) compared to the other two sites.
Figure 5.6: PSDs of samples collected using an auto sampler or grab method. Samples at the BRAM site were collected at different depths in the water column
The low correlation at Bramport is likely related to differences in the location of the auto sample and grab
sample collected at this site. The intake for the automated sampler was located at the bottom of a manhole,
and the sampling rod was not long enough to collect the grab sample at the same location. Hence, the
sample was collected higher up in the column of water within the manhole, and as a result some of the
coarser and heavier particles that had settled may not have been captured by the grab sample resulting in
the finer grab PSD shown in Figure 5.5. This may also explain why this particular site had the finest PSD and
highest coefficient of variation (see Table 5.2) among sites, and highlights the importance of integrated depth
sampling where the flow stream well exceeds the diameter of the grab sampling container.
Other researchers have also evaluated the effect of auto samplers on the distribution of particle sizes.
Fowler et al (2009) did not find a statistically significant difference between median particle sizes and
sediment event mean concentrations in parking lot runoff collected using auto samplers and whole volume
samples, but noted that some bias was evident in particle sizes greater than 160 microns. A study of
highway runoff water quality in California also found no difference is PSDs between samples collected by the
grab or automated samplers (Caltrans, 2001). Clark et al (2009) reported that peristaltic pump auto
samplers could not effectively capture particles above 250 microns. In our study, over 95% of particles were
below 200 microns, which may explain why the two types of samples were well correlated at the sites where
samples were taken at the same location and depth.
Characterization of Particle Size Distributions of Urban Runoff
Final Report Page 20
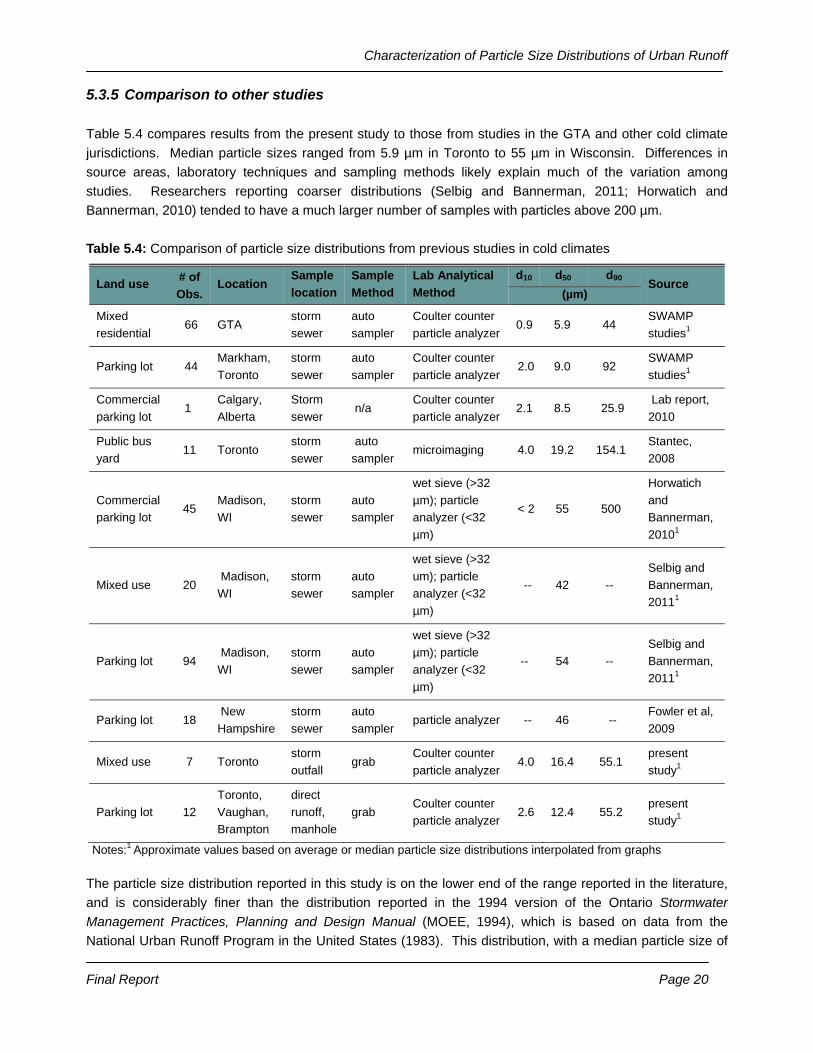
5.3.5 Comparison to other studies
Table 5.4 compares results from the present study to those from studies in the GTA and other cold climate
jurisdictions. Median particle sizes ranged from 5.9 µm in Toronto to 55 µm in Wisconsin. Differences in
source areas, laboratory techniques and sampling methods likely explain much of the variation among
studies. Researchers reporting coarser distributions (Selbig and Bannerman, 2011; Horwatich and
Bannerman, 2010) tended to have a much larger number of samples with particles above 200 µm.
Table 5.4: Comparison of particle size distributions from previous studies in cold climates
Land use # of
Obs. Location
Sample
location
Sample
Method
Lab Analytical
Method
d10 d50 d90 Source
(µm)
Mixed
residential 66 GTA
storm
sewer
auto
sampler
Coulter counter
particle analyzer 0.9 5.9 44
SWAMP
studies1
Parking lot 44 Markham,
Toronto
storm
sewer
auto
sampler
Coulter counter
particle analyzer 2.0 9.0 92
SWAMP
studies1
Commercial
parking lot 1
Calgary,
Alberta
Storm
sewer n/a
Coulter counter
particle analyzer 2.1 8.5 25.9
Lab report,
2010
Public bus
yard 11 Toronto
storm
sewer
auto
sampler microimaging 4.0 19.2 154.1
Stantec,
2008
Commercial
parking lot 45
Madison,
WI
storm
sewer
auto
sampler
wet sieve (>32
µm); particle
analyzer (<32
µm)
< 2 55 500
Horwatich
and
Bannerman,
20101
Mixed use 20 Madison,
WI
storm
sewer
auto
sampler
wet sieve (>32
um); particle
analyzer (<32
µm)
-- 42 --
Selbig and
Bannerman,
20111
Parking lot 94 Madison,
WI
storm
sewer
auto
sampler
wet sieve (>32
µm); particle
analyzer (<32
µm)
-- 54 --
Selbig and
Bannerman,
20111
Parking lot 18 New
Hampshire
storm
sewer
auto
sampler particle analyzer -- 46 --
Fowler et al,
2009
Mixed use 7 Toronto storm
outfall grab
Coulter counter
particle analyzer 4.0 16.4 55.1
present
study1
Parking lot 12
Toronto,
Vaughan,
Brampton
direct
runoff,
manhole
grab Coulter counter
particle analyzer 2.6 12.4 55.2
present
study1
Notes:1 Approximate values based on average or median particle size distributions interpolated from graphs
The particle size distribution reported in this study is on the lower end of the range reported in the literature,
and is considerably finer than the distribution reported in the 1994 version of the Ontario Stormwater
Management Practices, Planning and Design Manual (MOEE, 1994), which is based on data from the
National Urban Runoff Program in the United States (1983). This distribution, with a median particle size of

Characterization of Particle Size Distributions of Urban Runoff
Final Report Page 21
95 µm, is currently recommended by the City of Toronto for use in sizing hydrodynamic separators when site
specific particle size data are not available.

Characterization of Particle Size Distributions of Urban Runoff
Final Report Page 22
6.0 CONCLUSIONS
This study characterizes the PSD of stormwater and TSS in runoff from six highly impervious urban
drainage areas in the GTA and offers insights into some of the factors that may influence results. The
major study findings include the following:
Testing the reported PSD results of five laboratories against a standard of known PSD showed
good overall correlation among labs but only Labs A and B reported PSDs that were statistically
comparable to the standard
TSS results from standard testing conducted at three laboratories revealed only one lab to
provide reasonably accurate and repeatable results.
The two labs that best matched the standard during lab testing were used to analyze field
samples. Field test results from these labs showed the PSDs to be statistically different for
particle sizes between 250 to 14.9 µm, and 3.73 to 0.66 µm.
Field sampling results from the lab that best matched the standard showed a median particle size
range of 4.2 to 31.1 µm across the various source areas and rain events. On average, 50% of
particles were finer than 13.7 µm and 90% of particles were finer than 55 µm.
Although samples were collected from different source areas and at different locations within the
drainage network (e.g. direct road runoff, storm sewer, storm outfall), there was more variability
among samples collected at a single site than there was among samples collected at different
sites.
Comparisons to other literature showed that samples collected in the Greater Toronto Area both
in the present and previous studies tend to have finer particle PSDs than those collected in other
cold climate jurisdictions. This result is particularly evident in the coarser particle sizes above 200
µm, which were almost never found, even in runoff sampled directly from the pavement surface.
Comparisons between auto samplers and manual grab samples showed good comparability over
the full range of particle sizes reported by the laboratory. The only set of samples that showed a
difference was collected at different depths in the flow stream.
While this study has helped to characterize the PSD of urban runoff using a specific sampling and
analytical method, questions remain about the factors influencing the wide variability of PSD results
reported by different researchers. The large variation at the site level indicates that stormwater PSD is
strongly influenced by local conditions and land use. However, the literature review also indicates a clear
difference among studies in the presence of coarser size particles greater than 150 to 200 microns, which
in this study were rarely found in samples collected either from the sewer, at the outfall or in direct runoff
from the surface. Testing the five laboratories against a standard with a coarser distribution would help to
determine whether these particles are effectively characterized by common laboratory PSD analysis
methods. Further investigations into intra-event variability, and the role of sample collection timing and
method on PSD should also be conducted.
Laboratories typically use chemical dispersants and other physical treatments to break up agglomerated
particles prior to analysis. These procedures are an important part of the standard PSD analysis
procedure that reduces variability associated with agglomeration caused by storage and/or mixing during
transport to laboratories. However, breaking up agglomerates renders the PSD results less representative
Characterization of Particle Size Distributions of Urban Runoff
Final Report Page 23
of actual field conditions. The actual field or ‘effective’ PSD is subject to a variety of physical, chemical
and biologically mediated flocculation processes. These processes are neither well understood nor easy
to simulate, but would typically produce a coarser PSD than is reported by laboratories (Phillips and
Walling, 1995). Further research is needed to assess the relationship between the PSD of stormwater as
reported by laboratories and the ‘effective’ field PSD in urban runoff, as well as the factors that may
influence this relationship. Once the ‘effective’ PSD is better understood, additional monitoring is needed
to assess the capacity of stormwater sedimentation devices to alter this PSD through treatment.

Characterization of Particle Size Distributions of Urban Runoff
Final Report Page 24
7.0 REFERENCES
Caltrans, 2001. Tahoe Basin Stormwater Monitoring Program, Final Report. Monitoring season 2000-
2001. California Department of Transportation.
Clark S.E, Siu CY, Pitt R, Renning CD, Treese DP. 2009. Peristaltic pump autosamplers for solids
measurement in stormwater runoff. Water Environment Research: 81(2): 192-200.
Driscoll, E.D., 1986, Detention and retention controls for urban stormwater, in Urbonas, Ben, and
Roesner, L.A., eds., Urban runoff quality—Impact and quality enhancement technology,
Proceedings of an Engineering Foundation Conference, Heinniker, N.H., June 23–27, 1986: New
York, American Society of Civil Engineers, p. 145–163.
Fowler, G.D.; Roseen, R.M.; Ballestero, T.P.; Guo, Qizhong; and Houle, James, 2009, Sediment
monitoring bias by autosampler in comparison with whole volume sampling for parking lot runoff,
in Proceedings of the World Environmental and Water Resources Congress 2009—Great Rivers,
Kansas City, Mo., May 17–21, 2009: p. 1514–1522.
Horwatich, J.A., and Bannerman, R.T., 2010, Parking lot runoff quality and treatment efficiency of a
stormwater-filtration device, Madison, Wisconsin, 2005–07: U.S. Geological Survey Scientific
Investigations Report 2009–5196, 50 p.
Li, Yingxia; Lau, S.-L.; Kayhanian, Masoud; and Stenstrom, M.K., 2005, Particle size distribution in
highway runoff: Journal of Environmental Engineering, v. 131, no. 9, p. 1267–1276.
Ontario Ministry of the Environment and Energy, 1994. Stormwater Management and Practices Planning
and Design Manual. Toronto.
Ontario Ministry of the Environment. 2003. Stormwater Management Planning and Design Manual.
Toronto.
Phillips, J.M. and Walling, D.E., 1995. An assessment of the effects of sample collection, storage and
resuspension on the representativeness of measurements of the effective particle size distribution
of fluvial suspended sediment, Water Resources, v. 29, no. 11, pp. 2498-2508.
Sansalone , J. J., & Buchberger, S. G. (1997). Characterization of Metals and Solids in Urban Highway
Winter Snow and Spring Rainfall-Runoff. Journal of the Transportation Research Board , 1523,
147-159.
Sansalone, J.J., Koran, J.M., Smithson, J.A., and Buchberger, S.G., 1998, Physical characteristics of
urban roadway solids transported during rain events: Journal of Environmental Engineering, v.
124, no. 5, p. 427–440.

Characterization of Particle Size Distributions of Urban Runoff
Final Report Page 25
Selbig , W. R., & Bannerman, R. T., 2011. Characterizing the Size Distribution of Particles in Urban
Stormwater by Use of Fixed-Point Sample-Collection Methods. Open-File Report 2011–1052,
U.S. Department of the Interior and U.S. Geological Survey, Reston.
Stantec, 2010. TTC Birchmount Garage. Stormceptor Monitoring Study. Stormceptor. Toronto.
Stormwater Assessment Monitoring and Performance (SWAMP) Program, 2005; Synthesis of Monitoring
Studies Conducted under the Stormwater Assessment Monitoring and Performance Program.
Toronto and Region Conservation Authority (TRCA). Toronto, Ontario.
Stormwater Assessment Monitoring and Performance (SWAMP) Program, 2004; Performance
Assessment of Two Types of Oil & Grit Separator for Stormwater Management in Parkig Lot
Applications – Markham & Toronto, Ontario. Toronto and Region Conservation Authority (TRCA).
Toronto, Ontario.
Stormwater Assessment Monitoring and Performance (SWAMP) Program, 2003; Performance
Assessment of a Highway Stormwater Quality Retention Pond. Toronto and Region
Conservation Authority (TRCA). Toronto, Ontario.
Vase, J and Chiew, H.S. 2004. Nutrient loads associated with different sediment sizes in urban
stormwater and surface pollutants. Journal of Environmental Engineering, ASCE, v. 130, no 4.
APPENDIX A
Mean PSD Correlations


Characterization of Particle Size Distributions of Urban Runoff
Final Report Page A1
Figure A1: Correlation between mean PSD reported by Lab A and Lab B
R² = 0.4812
0
2
4
6
8
10
12
14
16
18
0 2 4 6 8 10 12 14 16 18
Lab A
Lab B
Bramport
R² = 0.9336
0
2
4
6
8
10
12
14
16
18
0 2 4 6 8 10 12 14 16 18
Lab A
Lab B
TRCA Head Office

APPENDIX B
Frequency Distribution and Average PSD for Mixed
Use and Parking Lot Sites


Characterization of Particle Size Distributions of Urban Runoff
Final Report Page B1
Fre
quen
cy
Particle Size (µm) Figure B1: Frequency distribution of particle sizes by site

Characterization of Particle Size Distributions of Urban Runoff
Final Report Page B2
Figure B2: Average PSD for six urban runoff sites in the GTA
Figure B3: Average PSD for mixed use and parking lot sites in the GTA