characterization of particulate matter from atmospheric fluidized bed
TRANSCRIPT

Characterization of particulate matter
from atmospheric fluidized bed biomass gasifiers


Linnaeus University Dissertations
No 50/2011
CHARACTERIZATION
OF PARTICULATE MATTER
FROM ATMOSPHERIC FLUIDIZED
BED BIOMASS GASIFIERS
EVA GUSTAFSSON
LINNAEUS UNIVERSITY PRESS
CHARACTERIZATION OF PARTICULATE MATTER FROM ATMOSPHERIC
FLUIDIZED BED BIOMASS GASIFIERS Doctoral dissertation, School of Engineering, Linnaeus University 2011 ISBN: 978-91-86491-80-2 Printed by: Intellecta Infolog, Gothenburg

ABSTRACT Gustafsson, Eva. (2011). Characterization of particulate matter from atmospheric fluidized bed biomass gasifiers. Linnaeus University Dissertations No 50/2011. ISBN: 978-91-86491-80-2. Written in English.
Through biomass gasification, biomass can be converted at high temperature to a product gas rich in carbon monoxide, hydrogen, and methane. After cleaning and upgrading, the product gas can be converted to biofuels such as hydrogen; methanol; dimethyl ether; and synthetic diesel, gasoline, and natural gas. Particulate matter (PM) is formed as a contaminant in the gasification process, and the aim of this work was to develop and apply a method for sampling and characterization of PM in the hot product gas.
A particle measurement system consisting of a dilution probe combined in series with a bed of granular activated carbon for tar adsorption was developed, with the aim of extracting a sample of the hot product gas without changing the size distribution and composition of the PM. The mass size distribution and concentration, as well as the morphology and elementary composition, of PM in the size range 10 nm to 10 μm in the product gas from a bubbling fluidized bed (BFB) gasifier, a circulating fluidized bed (CFB) gasifier and an indirect BFB gasifier using various types of biomass as fuel were determined.
All gasifiers and fuels displayed a bimodal particle mass size distribution with a fine mode in the <0.5 μm size range and a coarse mode in the >0.5 μm size range. Compared with the mass concentration of the coarse mode the mass concentration of the fine mode was low from all gasifiers. The evaluation of the results for the fine-mode PM was complicated by condensing potassium chloride for the CFB gasifier when using miscanthus as fuel and by condensing tars for the indirect BFB gasifier when using wood C as fuel. The mass concentration of the coarse-mode PM was higher from the CFB gasifier than from the two BFB gasifiers. The coarse-mode PM from the BFB gasifier when using wood A as fuel was dominated by char. In the CFB gasifier the coarse-mode PM was mainly ash and bed material when using all fuels. The coarse-mode PM from the indirect BFB gasifier when using wood C as fuel was mainly ash.
KEYWORDS: biomass gasification, fluidized bed, particulate matter, particle morphology, particle elementary composition

1
Table of contents
1. Introduction .....................................................................................................3 1.1 Background ...............................................................................................3 1.2 Aim ...........................................................................................................4 1.3 List of papers.............................................................................................4
2. Theory ..............................................................................................................7 2.1 Biomass .....................................................................................................7 2.2 Biomass gasification..................................................................................9
2.2.1 Basics ................................................................................................9 2.2.2 Gasification techniques...................................................................10 2.2.3 Ash..................................................................................................13 2.2.4 Tars.................................................................................................16
2.3 Particulate matter....................................................................................18 2.3.1 Particle theory.................................................................................18 2.3.2 Particle formation mechanisms ......................................................21 2.3.3 Sampling of particulate matter .......................................................25
2.4 Cleaning and upgrading in biomass gasification.....................................27 2.4.1 Methods for particulate matter removal .........................................27 2.4.2 Methods for tar reduction ..............................................................28
2.5 Applications of biomass gasification.......................................................30 2.5.1 Production of heat and power ........................................................31 2.5.2 Production of vehicle fuels..............................................................31 2.5.3 CHRISGAS – VVBGC ................................................................33
3. Experimental ..................................................................................................35 3.1 Types of biomass.....................................................................................35 3.2 Gasifiers ..................................................................................................36
3.2.1 The bubbling fluidized bed gasifier system at TPS........................36 3.2.2 The circulating fluidized bed gasifier system at TUD....................37 3.2.3 The indirect bubbling fluidized bed gasifier system at Chalmers...38
3.3 Particle measurement system ..................................................................39 3.4 Particle characterization instruments......................................................43
3.4.1 Scanning mobility particle sizer (SMPS) .......................................43 3.4.2 Aerodynamic particle sizer (APS) ..................................................45 3.4.3 Low pressure impactor (LPI) .........................................................45
3.5 Particle analysis techniques .....................................................................46 3.5.1 Scanning electron microscopy with energy dispersive spectroscopy (SEM-EDS)............................................................................................47 3.5.2 Particle induced X-ray emission (PIXE) analysis ...........................47 3.5.3 Inductively coupled plasma mass spectrometry/atomic emission spectroscopy (ICP-MS/AES) .................................................................47 3.5.4 Thermogravimetric analysis (TGA) ...............................................47
2
4. Results and Discussion................................................................................... 49 4.1 Particle mass size distributions and concentrations ................................ 49 4.2 Particle morphology and elementary composition.................................. 54
4.2.1 Particle morphology ....................................................................... 54 4.2.2 Particle elementary composition .................................................... 56
4.3 Potential for improvement of the particle measurement system............. 59 4.3.1 Homogeneous nucleation and condensation of inorganic vapours in the dilution probe................................................................................ 60 4.3.2 Incomplete tar adsorption in the bed of granular activated carbon 62
5. Conclusion ..................................................................................................... 65 Future work........................................................................................................ 69 Acknowledgements ............................................................................................ 71 Summary of papers............................................................................................. 73
Author’s contribution.................................................................................... 76 Papers not included in the thesis .................................................................. 76
Journal papers .......................................................................................... 76 Conference papers ................................................................................... 77
References .......................................................................................................... 79

3
1. INTRODUCTION
1.1 Background To reduce climate change, the European Union has set targets for 2020 that imply that emissions of greenhouse gases shall be reduced by 20% compared to 1990 levels, that 20% of energy shall be supplied by renewable energy sources, that biofuels shall constitute 10% of the total use of vehicle fuels, and that energy consumption shall be decreased by 20%.1 The targets for Sweden for 2020 are that emissions of greenhouse gases shall be reduced by 40% (compared to 1990), that 50% of energy shall be supplied by renewable energy sources, and that no fossil fuels shall be used for heating.2 In 2009, almost 45% of the energy used in Sweden originated from renewable energy sources, mainly bioenergy and hydropower.3 Biomass is a renewable energy source that today is mainly used to produce heat and power, but also increasingly to produce biofuels, such as ethanol and biogas, mainly through biochemical conversion. However, thermochemical processing can also be used, and one alternative is to gasify the biomass at high temperature. The aim of biomass gasification is to convert the solid biomass to a gas rich in carbon monoxide, hydrogen, and methane, by supplying less oxygen than needed for complete combustion. After cleaning and upgrading, the gas can be converted into a wide variety of liquid and gaseous chemicals, including biofuels such as hydrogen; methanol; dimethyl ether (DME); and synthetic diesel, gasoline, and natural gas (SNG). During biomass gasification, compounds in both gas and particle phases that may be regarded as contaminants are produced, including fine- and coarse-mode particles (e.g., fly ash and fragmented non-volatilized material) and volatilized components and tars that condense and form particles during cooling. Biomass gasification has the potential to contribute to the energy system in the future but the process needs to be optimized in order to compete with conventional energy from fossil sources. A precise characterization of the

4
various contaminants and their physical states at actual process temperatures would facilitate the design and optimize the function of equipment used for cleaning and upgrading of the product gas. Particle characterization at high temperature is usually problematic, since both inorganic and organic vapours may form particulate matter (PM) through homogeneous nucleation and condensation as the gas cools after sample extraction. When sampling PM in the hot product gas produced by biomass gasification, the main concern is tar condensation at temperatures below 400°C, as well as condensation of alkali chloride vapours at temperatures above 500°C. The particle formation mechanisms during biomass combustion have been thoroughly studied; however, few studies have focused on the particle formation mechanisms during biomass gasification. Even if the same biomass is used in a gasification process, the atmosphere is overall reducing, affecting both the formation and oxidation of char and the volatilization and formation of inorganic vapours.
1.2 Aim The aim of this work was to develop and apply a method for sampling and characterization of PM in the hot product gas from biomass gasification. The mass size distribution and concentration, as well as the morphology and elementary composition, of PM in the size range 10 nm to 10 μm from three different gasifiers using various types of biomass as fuel were determined.
1.3 List of papers This thesis is based on the following five appended papers, referred to in the text by their Roman numerals (I-V).
I. Method for high-temperature particle sampling in tar-rich gases from the thermochemical conversion of biomass Eva Gustafsson and Michael Strand Energy & Fuels, 2010:24:2042-2051 In this study a method for high-temperature particle sampling in tar-rich gases from the thermochemical conversion of biomass was developed and tested.
5
II. Physical and chemical characterization of aerosol particles formed during the thermochemical conversion of wood pellets using a bubbling fluidized bed gasifier Eva Gustafsson, Michael Strand, and Mehri Sanati Energy & Fuels, 2007:21:3660-3667 This study characterized, both physically and chemically, aerosol particles formed during the steam- and oxygen-blown biomass gasification of wood pellets in an atmospheric 20 kW bubbling fluidized bed gasifier.
III. Characterization of particulate matter from a circulating fluidized bed gasifier using different types of biomass Eva Gustafsson, Leteng Lin, Eleonora Simeone, Marcin Siedlecki, and Michael Strand Manuscript, submitted to Energy & Fuels in February 2011 This study characterized the particulate matter formed during steam and oxygen gasification of biomass in a circulating fluidized bed gasifier at atmospheric pressure using calcined magnesite as bed material. IV. Characterization of particulate matter in the hot product gas from indirect steam bubbling fluidized bed gasification of wood pellets Eva Gustafsson, Leteng Lin, Martin Seemann, Jennie Rodin, and Michael Strand Energy & Fuels, 2011, doi:10.1021/ef101710u This study characterized the particulate matter formed during indirect steam bubbling fluidized bed gasification of wood pellets at atmospheric pressure.
V. Characterization of particulate matter in the hot product gas from atmospheric fluidized bed biomass gasifiers Eva Gustafsson, Leteng Lin, and Michael Strand Biomass & Bioenergy, 2011, doi:10.1016/j.biombioe.2011.02.053 This study compares the characteristics of particulate matter in the hot product gas from three different atmospheric fluidized bed biomass gasifiers: a bubbling fluidized bed (BFB) gasifier, a circulating fluidized bed (CFB) gasifier, and an indirect BFB gasifier (the latter integrated with a CFB boiler).

6

7
2. THEORY
2.1 Biomass There are various definitions available for biomass. The one used by the United Nations Framework Convention on Climate Change is as follows:4
Biomass means non-fossilized and biodegradable organic material originating from plants, animals and micro-organisms. This shall also include products, by-products, residues and waste from agriculture, forestry and related industries as well as the non-fossilized and biodegradable organic fractions of industrial and municipal wastes. Biomass also includes gases and liquids recovered from the decomposition of non-fossilized and biodegradable organic material.
Consequently, biomass includes trees, grasses, and crops, as well as residues from agriculture and forestry.5 Bioenergy is energy extracted from biomass and a biofuel is the carrier of bioenergy.6 The main components of ligno-cellulosic biomass (the fibrous parts of plants) are cellulose, hemicellulose, and lignin, all polymers. While cellulose is a linear polymer of glucose monomers, hemicellulose is a branched polymer of various sugars such as xylos, glucose, and galactose.5 Lignin is a branched aromatic polymer consisting of three monomeric precursors: trans-p-coumaryl alcohol, trans-coniferyl alcohol and trans-sinapyl alcohol.7 The content of the main components varies; generally cellulose constitutes 40-50 weight-% (dry) of the biomass and hemicellulose 20-40%.8 The content of lignin is high in woody plants and could constitute 35% of the biomass.5 Molecular structures for cellulose, one type of hemicellulose (xylan), and the monomeric precursors of lignin are presented in Figure 1.

8
Figure 1. Molecular structures of (a) cellulose, (b) xylan, a type of hemicellulose, and (c) monomeric
precursors of lignin (trans-p-coumaryl alcohol, trans-coniferyl alcohol, and trans-sinapyl alcohol).
The composition of the biomass could also be described using ultimate and proximate analyses. The ultimate analysis includes elementary analysis of the dominating elements (carbon, hydrogen, oxygen, nitrogen, and sulphur), as well as the ash and moisture (M) content (eq. 1). In the proximate analysis, moisture, volatile matter, fixed carbon, and ash content are determined.5
%100 −=++++++ weightMASHSNOHC (1)
Carbon is usually the dominating element in biomass, constituting 30-60 weight-% (dry), with higher concentrations in woody fuels compared to herbaceous fuels.6,9 Biomass contains considerably more oxygen, around 30-40% compared to coal, where the oxygen content could be below 10%, leading to a lower heating value for biomass compared to coal.8,9 The higher heating value (HHV, “the total energy content released when the fuel is burnt in air, including the latent heat contained in the water vapour”8) for biomass is approximately 20 MJ/kg, while the HHV for coal could be 30 MJ/kg.5 Five to six per cent of the biomass is composed of hydrogen, while the concentrations of nitrogen and sulphur are normally each below 1%.9 Ash is defined as “the inorganic solid residue left after the fuel is burned”.5 The ash content in biomass varies and could be less than 1 weight-% (dry), for example, in clean wood, while rice husks contain more than 20% ash.9 The composition of ash, as well as problems with ash in biomass gasification, will be further discussed in section 2.2.3. The moisture content in biomass varies depending on the type of biomass. For freshly cut wood a moisture content of 30-60 weight-% is normal.5 The volatile matter constitutes the compounds that are formed and released during pyrolysis of the biomass, while the fixed carbon is the carbon remaining in the char after pyrolysis.5 Normally, 70-86 weight-% (dry) of the biomass is

9
released as volatile matter during combustion, indicating the importance of the pyrolysis process.6,10 In coal, the share of volatile matter is less, with higher amounts of fixed carbon.8 To use the biomass as a fuel in a gasification process, the biomass could be upgraded. A moisture content of 10-20 weight-% is advantageous to produce a product gas with a high heating value, so usually pre-drying is necessary.5 In the experimental work in this thesis, pelletized fuels have been used in order to have a dry fuel of homogeneous size.
2.2 Biomass gasification
2.2.1 Basics Thermochemical gasification could be defined as “the conversion by partial oxidation at elevated temperature of carbonaceous feedstock such as biomass or coal into a gaseous energy carrier”.11 A biomass gasification process includes drying, pyrolysis, gasification, and oxidation of the fuel. During drying, the biomass is heated and water evaporates.10 If the biomass is further heated above 200°C, the pyrolysis or devolatilization process whereby the biomass is converted to solid char, tars, and gases starts.10,11 At high temperatures (>800°C), the char is gasified and partly oxidized using air, oxygen, and/or steam to produce gases and ash.10 The tars are also converted and partly oxidized to other tars and gases: tars are discussed in section 2.2.4. The gases produced are carbon monoxide, carbon dioxide, hydrogen, water, methane, and other light hydrocarbons, with carbon monoxide and hydrogen (or methane) as the desired products. Ideally, all the carbon present in the biomass should be converted to a gaseous product, that is, carbon monoxide and hydrogen (or methane). Tars and residual carbon are unwanted in the product gas, since they imply an incomplete conversion.10,12 A scheme of the biomass gasification process is presented in Figure 2.
Moist biomassDrying
Dry biomass
Pyrolysis
Gases
Tars
Char GasesAsh/residual carbon
Char gasification/oxidation
Gases
Tars
Gas-phase reactions including oxidation
Gases
Increasing temperature
Figure 2. Scheme of biomass gasification process (based on Basu5 and Knoef 12).

10
During biomass gasification many chemical reactions occur, some of which are presented in Table 1. The reactions of char with carbon dioxide and steam are endothermic, and the heat is preferably supplied by char oxidation, but also by oxidation of carbon monoxide, methane, and hydrogen.5,10,12 The heterogeneous reactions with char are slow and determine the rate of the gasification process.11,12 Table 1. Important reactions during biomass gasification.5
char reactions Boudouard reaction C + CO2 2CO Endothermic Water-gas reaction C + H2O CO + H2 Endothermic Hydrogasification reaction C + 2H2 CH4 Exothermic Partial oxidation of char C + 0.5O2 → CO Exothermic Oxidation of char C + O2 → CO2 Exothermic
gas-phase reactions
Water-gas shift reaction CO + H2O CO2 + H2 Exothermic Steam-reforming reaction CH4 + H2O CO + 3H2 Endothermic Methanation reaction 2CO + 2H2 → CH4 + CO2 Exothermic Methanation reaction CO + 3H2 CH4 + H2O Exothermic Methanation reaction CO2 + 4H2 → CH4 + 2H2O Exothermic
The composition of the produced gas is affected by the biomass and the gasification process, including parameters such as reactor type, gasifying agent, heating rate, temperature, pressure and water vapour content.11-13 It is difficult to predict the gas composition in product gas from biomass gasification since equilibriums are rarely reached and kinetic effects are of importance.10-12
2.2.2 Gasification techniques There are several options available regarding biomass gasification techniques and they differ regarding, among other factors, reactor design, heat for gasification, gasification agent, and pressure.10,12 The gasifier reactor could be either fixed bed, fluidized bed, or entrained flow (EF); however, other designs are also available. Among fixed bed gasifiers the updraft and downdraft are the most common (Figure 3). In an updraft gasifier (Figure 3a), also called a counter-current gasifier, the biomass is fed from the top while the gasifying agent (air, oxygen and/or steam) is fed from the bottom. As the biomass moves down in the reactor it passes through zones of drying, pyrolysis, gasification, and finally, oxidation.12 The advantages with the updraft gasifier are the simple design compared to fluidized beds, low concentration of residual carbon, high efficiency, and the possibility to gasify fuels with high moisture content while the largest disadvantage is the high tar concentration in the product gas.10-12 In a downdraft gasifier (Figure 3b), also

11
called a co-current gasifier, the biomass is fed from the top with the gasifying agent flowing in the same direction as the biomass. As the biomass moves down in the reactor it passes through zones of drying, pyrolysis, oxidation, and finally, gasification.12 The advantages with the downdraft gasifier are the simple design and low tar concentration in the product gas, while the disadvantages are the difficulties in up-scaling of the process and high requirements for the biomass (low moisture and ash content).10-12
Biomass
Product gas
Ash
Gasifying agent
Drying
Pyrolysis
Gasification
Oxidation
Grate
Biomass
Product gas
Ash
Gasifying agent
Drying
Pyrolysis
Gasification
Oxidation
Grate
ab
Figure 3. Scheme of (a) fixed bed updraft gasifier and (b) fixed bed downdraft gasifier.12
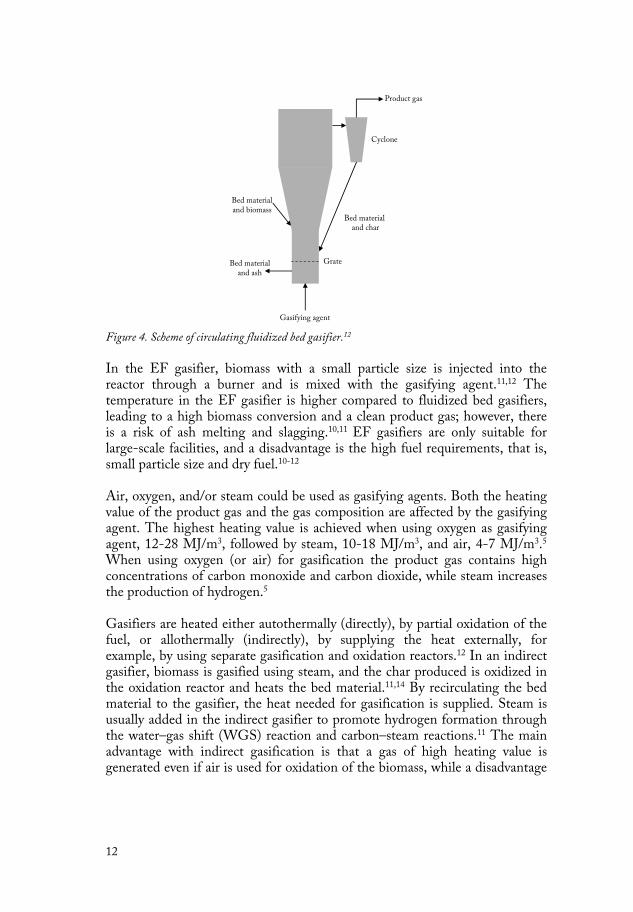
Fluidized bed gasifiers include the bubbling fluidized bed (BFB) and the circulating fluidized bed (CFB) gasifiers (Figure 4). The BFB and CFB gasifiers are similar. The biomass and bed material, for example, sand, are fluidized by the gasifying agent.10 In the BFB gasifier the gas velocity is lower and the bed bubbles, with a freeboard for reactions in gas-phase above the bed, while in the CFB gasifier the gas velocity is higher and unconverted biomass and bed material circulate by means of a cyclone.10,12 In neither the BFB nor the CFB gasifier are there separate zones of drying, pyrolysis, gasification, and oxidation.10,12 The advantages of the BFB and CFB gasifiers compared to the fixed bed gasifiers are the flexibility in fuel requirements, high reaction rate due to good heat and mass transfer, and the possibility to scale up the process in size, while the disadvantages are the more complex process operation, problems with bed agglomeration (see section 2.2.3), incomplete carbon conversion (especially for BFB gasifiers), and higher concentrations of PM.10-12
12
GrateBed materialand ash
Gasifying agent
Bed materialand biomass
Cyclone
Product gas
Bed material and char
Figure 4. Scheme of circulating fluidized bed gasifier.12
In the EF gasifier, biomass with a small particle size is injected into the reactor through a burner and is mixed with the gasifying agent.11,12 The temperature in the EF gasifier is higher compared to fluidized bed gasifiers, leading to a high biomass conversion and a clean product gas; however, there is a risk of ash melting and slagging.10,11 EF gasifiers are only suitable for large-scale facilities, and a disadvantage is the high fuel requirements, that is, small particle size and dry fuel.10-12
Air, oxygen, and/or steam could be used as gasifying agents. Both the heating value of the product gas and the gas composition are affected by the gasifying agent. The highest heating value is achieved when using oxygen as gasifying agent, 12-28 MJ/m3, followed by steam, 10-18 MJ/m3, and air, 4-7 MJ/m3.5 When using oxygen (or air) for gasification the product gas contains high concentrations of carbon monoxide and carbon dioxide, while steam increases the production of hydrogen.5
Gasifiers are heated either autothermally (directly), by partial oxidation of the fuel, or allothermally (indirectly), by supplying the heat externally, for example, by using separate gasification and oxidation reactors.12 In an indirect gasifier, biomass is gasified using steam, and the char produced is oxidized in the oxidation reactor and heats the bed material.11,14 By recirculating the bed material to the gasifier, the heat needed for gasification is supplied. Steam is usually added in the indirect gasifier to promote hydrogen formation through the water–gas shift (WGS) reaction and carbon–steam reactions.11 The main advantage with indirect gasification is that a gas of high heating value is generated even if air is used for oxidation of the biomass, while a disadvantage
13
is that the tar concentration could be high due to the pyrolytic process involved.11 Gasifiers could be operated at atmospheric pressure or be pressurized. Different pressures generate product gas with approximately the same gas composition and heating value.11 The main advantages of pressurized gasification compared to atmospheric gasification are the higher total conversion efficiency and having the product gas already compressed for downstream processes, while the main disadvantages are the higher capital costs and the complex fuel feeding to the gasifier.11,12 Several other aspects are of importance when designing a biomass gasification process, among them:
• Lambda value (λ): the ratio between the oxygen input and oxygen required for total fuel oxidation to carbon dioxide and water. The optimum range for λ during biomass gasification is 0.2-0.4. Higher λ means that the biomass is to a larger extent combusted, resulting in a low char concentration but a high carbon dioxide concentration and a low heating value.15 If λ is increased the temperature also increases.5
• Steam to biomass ratio: the ratio between the flow rates of steam and
biomass. The addition of steam leads to a higher gas yield, heating value, and carbon conversion efficiency, as well as to a higher concentration of hydrogen. However, the concentration of carbon dioxide is also higher.15
2.2.3 Ash Both the concentration and composition of ash vary depending on the type of biomass: while clean wood could contain less than 1 weight-% (dry) ash, the ash content in rice husks could be more than 20 weight-% (dry).9 The ash consists both of inherent ash, which is present as salts, as a part of the organic structure of the biomass or as pure compounds, and entrained ash that consists of, for example, soil particles. The behaviour of the inherent and entrained ash is different. The inherent ash is more mobile and partly volatilizes during combustion and gasification, while the entrained ash is present as minerals.6,9 The major ash-forming elements in biomass are silicon, calcium, magnesium, potassium, sodium, and phosphorus, while the minor ash-forming elements are iron, aluminium, manganese, and various heavy metals.6 The ash could cause problems such as agglomeration and slagging, ash deposition, fouling, and corrosion during biomass combustion and gasification. As the biomass is heated, part of the ash volatilizes, that is,
14
mainly alkali and heavy metals. At a specific temperature, depending on the ash composition, the ash starts to melt. High concentrations of calcium and magnesium have been reported to increase the ash-melting temperature, while high concentrations of potassium and sodium seem to decrease the ash-melting temperature. Woody fuels generally have a higher ash-melting temperature compared to herbaceous fuels.6 Agglomeration and slagging in fluidized bed combustion and gasification occur at high temperatures, generally >800°C. While agglomeration implies interactions with the bed material, slagging occurs on process surfaces; however, both mechanisms imply sintering and fusion of the ash.6 Different mechanisms have been suggested for the agglomeration in fluidized bed combustion and gasification of biomass. Of great importance is the formation of silicates of alkali and alkali earth metals with a low melting temperature.16 As silica sand is usually used as bed material, problems with agglomeration are common. Öhman et al. suggest an agglomeration mechanism based on three steps: (1) ash deposition on the bed material forming a coating (ash in the form of fine particles and alkali compounds through condensation and surface chemical reactions), (2) sintering of the inner layer of the coating, and (3) partial melting of the coating creating a sticky outer layer on the bed particle, causing agglomeration.17 Öhman et al. found that the elements present in the melt mainly originated from the fuel and consisted of silicates. Nuutinen et al.18, Brus et al.19 and Öhman et al.20 also studied the bed agglomeration in fluidized bed combustion and gasification of biomass. Nuutinen et al. found multi-layer coatings on the bed material, the composition depending both on the bed material and fuel.18 Brus et al. also found multi-layer coatings on the bed material when using various fuels, but found that for straw, rich in potassium and silicon, no coatings were formed; instead the bed particles were bound together directly by potassium silicate.19 Öhman et al. studied agglomeration during both combustion and gasification of different fuels.20 No differences in agglomeration behaviour between combustion and gasification, except when using lucerne as fuel were found. Ash deposition at lower temperatures, generally <800°C, does not imply sintering and fusion of the ash, but could lead to fouling of, for example, heat exchangers, leading to a reduced capacity. Corrosion could occur in biomass boilers, due to the presence of chlorine and alkali metal chlorides.6 To predict the ash-related problems, a number of indices, originally developed for coal, could be used. However, coal and biomass ashes behave differently. While coal generally has higher ash content than biomass, the mobility of the biomass ash is higher, leading to volatilization of the ash. Also, the compositions between coal and biomass ash differ.6 The alkali index (kg alkali oxide/GJ) is an empirical index that could be used as a threshold for when ash-related problems are likely to occur. The concentration of chlorine in the

15
fuel is also of importance when predicting the ash-related problems. The mobility, and consequently, also the volatility of potassium is increased if chlorine is present in high concentrations.9 Bartels et al. reviewed different methods used for avoiding problems with agglomeration.21 Operational actions include lowering of the bed temperature, a temporary increase of gas velocity, breaking up the agglomerates by temporarily stopping the fuel feed, pulsations on the gas flow, exchange of bed material, and sieving of recycled bed material. By using additives such as kaolin and dolomite, the formation of low melting alkali silicates could be avoided through alternative reactions. Also, other bed materials, without or with lower concentrations of silica compared to sand, such as alumina and magnesite, could be used to reduce the problems with agglomeration due to the limited formation of alkali silicates.21 However, when using bed materials without silica, agglomeration could take place due to ash melting. Ergudenler and Ghaly studied the agglomeration in a fluidized bed gasifier using straw as fuel and alumina as bed material.22 Agglomeration took place when using alumina as bed material, but at higher temperatures than when using silica sand as bed material. Another way of reducing the problems with bed agglomeration is to reduce the concentration of potassium and chlorine in the biomass through water leaching. More than 80% of the potassium and more than 90% of the chlorine could be removed by leaching, which increases the ash-melting temperature.23 Dayton et al. studied the release of inorganic material during combustion of both unleached and leached biomass.23 The concentration of alkali and chlorine in the biomass was reduced by leaching, and so was the release of these compounds to the vapour phase during combustion. Davidsson et al. compared the release of alkali metals from unleached, water-leached, and acid-leached biomass during heating in nitrogen to 1000°C.24 Acid leaching was more effective compared to water leaching, and it was mainly the inorganically bound alkali metals that were leached from the biomass. In addition, leaching was more effective for straw compared to wood. A reduction of the alkali metal content by leaching also affects the pyrolysis and combustion behaviour of the biomass. Fahmi et al. studied the pyrolysis and combustion of different fuels, unleached and leached, using thermogravimetric analysis (TGA) and gas chromatography-mass spectrometry.25 A higher concentration of alkali in the biomass increased the rate of biomass degradation during pyrolysis. In addition, the temperature at maximum degradation was lower. The concentration of alkali in the biomass also affected the mechanism of degradation, as well as the yield of products; for example, more char was produced from a biomass with a high concentration of alkali.

16
In addition to the ash-related problems during biomass combustion and gasification discussed above, the ash also contributes significantly to PM formation during both biomass combustion and gasification. The particle formation mechanisms, both from the volatile and non-volatile parts of the ash, will be treated in detail in section 2.3.2. When PM in the hot product gas from biomass gasification is sampled, volatilized ash could contribute to the PM by particle formation in the particle measurement system. Techniques used for sampling of PM at high temperatures are treated in section 2.3.3 and also in the experimental section, 3.3.
2.2.4 Tars Tars are organic compounds formed in the pyrolysis step in biomass gasification as an unwanted by-product. They cause operational problems, as well as decreased total process efficiency. When sampling PM in the hot product gas from biomass gasification in the presence of tars, care must be taken so that the tars do not contribute to the PM or change the original PM in any way. Various definitions of tars are available in the literature. Li and Suzuki define tars as “the condensable fraction of the organic gasification products”.26 This definition is applicable in this work, since mainly the condensable species are a problem when sampling and characterizing PM from biomass gasification at high temperature. Evans and Milne studied the pyrolysis products from different types of biomasses and their main components (cellulose, hemicellulose and lignin) at different temperatures.27 A scheme describing the pyrolysis process is presented in Figure 5. According to Evans and Milne the primary pyrolysis could be described as a depolymerization of the main components of biomass to monomers and fragments of monomers at temperatures below 500°C. As the temperature was increased to 600°C, some of the primary pyrolysis products started to crack; however, no major changes took place until 700°C where low-molecular weight gases, alkenes, and also aromatic species were formed. At 950°C polyaromatic hydrocarbons (PAH) compounds were formed from all main components; however, the concentrations were higher from lignin compared to cellulose. Morf et al. describe two reaction pathways for the PAH formation as (1) a direct combination of intact aromatic rings, and (2) H2 abstraction followed by C2H2 addition.28 In a later study by Evans and Milne the presence of different tar fractions at various temperatures were studied.29 The primary products were decomposed before the tertiary PAH compounds were formed.

17
Solid phase
Vapour phase
Biomass
CO, CO2, H2O
Char
Primary vapours(oxygenates)
Light hydrocarbons,aromatics, oxygenates
Olefins, aromatics,CO, CO2, H2O, H2
PAH, CO, CO2, H2O,
H2, CH4
CO, CO2, H2O, H2
Pyrolysis severityTemperature
Primary processes Secondary processes Tertiary processes
Figure 5. Scheme of the pyrolysis of biomass (based on Evans and Milne27).
The standard for measuring tars in product gas from biomass gasification includes the isokinetic sampling (see section 2.3.3) of both particles and tars, using a heated probe.30 PM is collected on a heated filter and the tars are trapped in organic solvents. The tars could be analysed both gravimetrically and by using gas chromatography (molar masses <350 g/mol) to gain information about the concentration of individual tar compounds. There are also other methods available for tar analysis. Brage et al. used a method based on solid phase adsorption on amino phase.31 After elution, the concentration of individual tar compounds was determined using gas chromatography with a flame ionization detector (FID). Moersch et al. developed an on-line method for quantification of tars.32 The total concentration of hydrocarbons was first measured using a FID, the condensable tars were then removed using a filter, and finally, the remaining hydrocarbons were quantified using a second FID. The difference in hydrocarbon concentration represents the tar concentration. Karellas and Karl used Raman spectroscopy to analyse the concentration of tars in product gas from biomass gasification on line.33 As discussed above, the tar concentration and composition is dependent on the process temperature, but also the type of gasifier is important. Milne et al. compiled tar concentrations from numerous fixed and fluidized bed gasifiers.34 Fixed bed updraft gasifiers had the highest tar concentration, 100 g/m3, while the concentrations from fluidized beds and fixed bed downdraft gasifiers were 10 and 1 g/m3, respectively. In fixed bed updraft gasifiers primary tars dominate, while tertiary tars dominate in fixed bed downdraft gasifiers. In fluidized bed gasifiers both secondary and tertiary tars are present. Milne et al. concluded that there was a great variation in the reported tar concentrations, partly due to different tar definitions and measurement methods.34
The tar dew point is an important parameter when the process problems with tars, as well as the problems when sampling PM, are predicted, since it represents the temperature at which tars start to condense. Li and Suzuki define the tar dew point as “the temperature at which the real total partial pressure of tar equals the saturation pressure of tar”.26 The concentration of

18
heavy PAH compounds (4-7 aromatic rings) is especially important for the calculation of the tar dew point since they condense at high temperatures, even at rather low concentrations.26 The Energy Research Centre of the Netherlands has developed a model for calculation of the tar dew point that is available online.35 Methods used for tar reduction as well as the limits on tar concentrations for different processes, will be treated in section 2.4.2.
2.3 Particulate matter
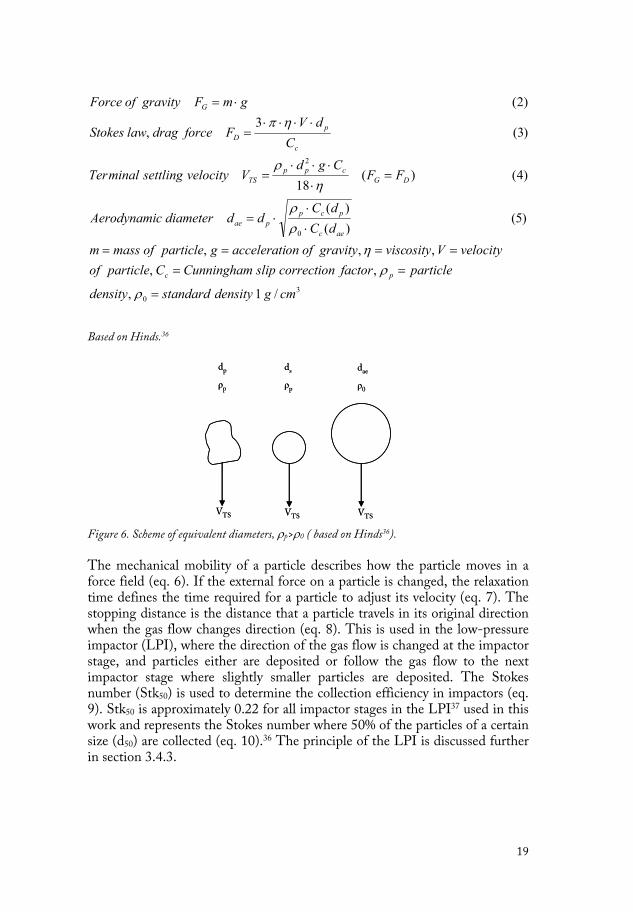
2.3.1 Particle theory The equations presented in this section are valid for spherical particles and low Reynolds number (Re < 1). For the prevailing experimental conditions in this work Re < 1 is valid for particles in the studied size range 10 nm to 10 μm, and in addition, spherical particles were assumed. A particle dispersed in air experiences a gravitational force (eq. 2). At the same time, the particle experiences a drag force in the opposite direction by the air surrounding the particle (eq. 3). When these forces are equal the particle has reached its terminal settling velocity (eq. 4).36
The particle diameter (dp) is the most important parameter used in describing a particle according to its properties and its behaviour. However, the particle diameter is not always easily defined, for example, in the case of irregular particles; see Figure 6. To facilitate description, a number of equivalent diameters have been defined, among them the Stokes diameter (ds) and the aerodynamic diameter (dae). The Stokes diameter is defined as the diameter of a sphere that has the same terminal settling velocity and density as the original particle. The aerodynamic diameter is defined as the diameter of a sphere that has the same terminal settling velocity as the original particle and a particle density of 1 g/cm3 (standard density). The three particles in Figure 6 all have the same terminal settling velocity. In the case of spherical particles, the dae is related to the particle diameter by equation 5, based on equal terminal settling velocities.36
19
30
0
2
/1,
,,,,,
)5()()(
)4()(18
)3(3
,
)2(
cmgdensityandardstdensity
particlefactorcorrectionslipCunninghamCparticleofvelocityVosityviscgravityofonacceleratigparticleofmassm
dCdC
dddiametercAerodynami
FFCgd
VvelocitysettlinginalmTer
CdV
FforcedraglawStokes
gmFgravityofForce
pc
aec
pcppae
DGcpp
TS
c
pD
G
=
======
⋅⋅
⋅=
=⋅
⋅⋅⋅=
⋅⋅⋅⋅=
⋅=
ρ
ρη
ρρ
ηρ
ηπ
Based on Hinds.36
VTS VTS VTS
dae
ρ0
ds
ρp
dp
ρp
VTS VTS VTS
dae
ρ0
ds
ρp
dp
ρp
Figure 6. Scheme of equivalent diameters, ρp>ρ0 ( based on Hinds36).
The mechanical mobility of a particle describes how the particle moves in a force field (eq. 6). If the external force on a particle is changed, the relaxation time defines the time required for a particle to adjust its velocity (eq. 7). The stopping distance is the distance that a particle travels in its original direction when the gas flow changes direction (eq. 8). This is used in the low-pressure impactor (LPI), where the direction of the gas flow is changed at the impactor stage, and particles either are deposited or follow the gas flow to the next impactor stage where slightly smaller particles are deposited. The Stokes number (Stk50) is used to determine the collection efficiency in impactors (eq. 9). Stk50 is approximately 0.22 for all impactor stages in the LPI37 used in this work and represents the Stokes number where 50% of the particles of a certain size (d50) are collected (eq. 10).36 The principle of the LPI is discussed further in section 3.4.3.

20
velocityjetVplatejetofradiusrvelocityinitialV
CVStkrdyeffiicienccollectionwithdiameterParticle
StkrSStknumberStokes
VSancedistStoppingBmtimeelaxationRFVBmobilityMechanical
j
cjp
G
TS
===
⋅⋅⋅⋅⋅
=
==
⋅=⋅=
=
,,
)10(18%50
)9(22.0
)8()7(
)6(
0
5050
50
0
ρη
ττ
Based on Hinds.36
A charged particle in an electric field experiences a force from the electric field, the electrostatic force (eq. 11). In the same way as in a gravitational field, the particle in an electric field reaches a terminal electrostatic velocity when the force in the electric field is equal to the drag force (eq. 12). The electrical mobility of a particle describes how the particle moves in an electric field (eq. 13). This property is used in the scanning mobility particle sizer (SMPS) where the particles are classified according to their electrical mobility and corresponding mobility equivalent diameter (dB) (eq. 12).36 The principle of the SMPS is discussed in section 3.4.1.
diameterequivalentmobilitydstrengthfieldelectricalEelectronanofgecharegescharelementaryofnumbern
EVZmobilityElectrical
FFdCEenVvelocityticelectrostainalTerm
EenFforceticElectrosta
B
TE
DEB
cTE
E
====
=
=⋅⋅⋅⋅⋅⋅
=
⋅⋅=
,,,
)13(
)12(3
)11(
ηπ
Based on Hinds.36
Even without an external force present, particles move due to diffusion caused by collisions with gas molecules. The net movement is in the direction of lower particle concentration. Diffusion becomes more important with decreasing particle diameter and is dependent on the diffusion coefficient (eq. 14).36
21
etemperaturTtcoefficiensBoltzmannkBTkDtcoefficienDiffusion
==⋅⋅=
,´)14(
2.3.2 Particle formation mechanisms The particle formation mechanisms during biomass gasification are not well known. Much work has been done on the particle formation mechanisms during both coal and biomass combustion, which forms the basis for this section. However, one can expect partly different particle formation routes during biomass gasification due to the overall reducing atmosphere. Regarding coal, the behaviour of coal ashes is different from that of biomass ashes, as discussed previously (section 2.2.3). The aim of this work is to characterize the PM at high temperature; however, particle formation mechanisms during cooling are also important since the aerosol is cooled in the particle measurement system.
Usually the PM is divided into a fine and a coarse mode. In this work the separation between the fine and coarse modes will be at a particle diameter of 0.5 μm; other common separations are 1 μm or 2.5 μm. Fine- and coarse-mode particles from biomass combustion have different particle formation mechanisms.38 Fine particles originate from inorganic and organic vapours and are formed through mechanisms such as homogeneous nucleation, condensation, and chemical reactions. Coarse particles are formed through mechanical processes, but ash melting and coalescence also may occur. The elementary composition of fine- and coarse-mode PM is also different, with the fine mode rich in potassium, chlorine, and sulphur. Heavy metals could be present, especially when using demolition wood as fuel. The coarse mode is rich in calcium, magnesium, silicon, potassium, and aluminium.39 Fine-mode PM As mentioned previously (section 2.2.3), the ash partly volatilizes as the biomass is heated. The volatilization is dependent on the fuel, the gas atmosphere, and the process technology and conditions. Alkali and heavy metals, as well as chlorine, are volatile, but oxides of silicon, calcium, and magnesium have also been found to volatilize at low levels at high temperature and local reducing conditions close to the burning fuel particle during biomass combustion.6
During cooling, either in the process or in a sampling probe, the inorganic vapours become supersaturated and form PM through homogeneous nucleation and condensation. Homogeneous nucleation is a direct gas-to-particle conversion mechanism that requires high saturation ratios (2-10), while condensation occurs on available particle surfaces at lower saturation
22
ratios.36 Homogeneous nucleation produces high number concentrations of very fine particles that grow by condensation and coagulation (see below). The presence of nuclei suppresses further homogeneous nucleation, since condensation reduces the saturation ratio. Volatilized material is enriched in the fine mode, due to the higher surface area to mass ratio compared to the coarse-mode PM.38
Potassium and chlorine are important for the formation of fine-mode PM. More than 90% of both potassium and chlorine is present as water-soluble salts.6 In a study of pyrolysis and gasification of different types of biomass by Björkman et al., 20–50% of the chlorine was released at temperatures as low as 400°C, possibly as hydrogen chloride, and continued to be released as potassium chloride at temperatures above 700°C, leaving 30–60% of the chlorine in the char at 900°C.40 Olsson et al. found that there was only a minor release of potassium during pyrolysis of biomass below 500°C, due to decomposition of the organic material.41 At temperatures >500°C potassium was released as potassium chloride, and a high concentration of chlorine in the biomass enhanced the release of potassium. Knudsen et al. report results similar to those of Björkman et al. and Olsson et al. regarding the release of potassium and chlorine during biomass combustion.42 In addition, a high concentration of silicon reduced the release of potassium due to silicate formation; however if the concentration of chlorine was also high, this effect was counteracted. Potassium was also found to be released as potassium hydroxide through dissociation of potassium carbonate followed by reaction with water. Christensen et al. studied the formation of fine-mode PM from biomass combustion.43 A mechanism based on homogeneous nucleation of potassium sulphate followed by condensation of potassium sulphate and chloride was proposed. In addition, potassium could condense as potassium carbonate and hydroxide if the concentration of chlorine and sulphur was not high enough to bind all potassium. The formation of potassium sulphate requires that oxygen is present, and therefore, potassium sulphate is not likely to be formed to any major extent during biomass gasification.20 Vervaeke et al. studied the distribution of heavy metals in various ash fractions produced during fixed bed downdraft gasification of biomass cultivated at a contaminated site.44 Cadmium, lead, and zinc were mainly found in the fly ash, indicating volatilization during gasification followed by homogeneous nucleation and/or condensation to PM during cooling.
Other elements have also been shown to volatilize during biomass gasification. Turn et al. studied the fate of inorganic constituents of bagasse and banagrass during fluidized bed gasification.45 Silicon, aluminium, titanium, iron,

23
calcium, magnesium, sodium, potassium, phosphorus, and chlorine were detected in the gas phase, indicating that these elements were partly volatilized during gasification, some of them, however, at low levels.
Normally, calcium is not considered to volatilize from the biomass during thermochemical conversion and is, therefore, mainly thought to be present in the coarse-mode PM.39 Calcium has been found in the fine-mode PM in previous work on PM from biomass combustion. Lind et al. found calcium in the fine-mode PM from fluidized bed wood combustion, and concluded that homogeneous nucleation of CaO was a possible particle formation mechanism.46 Obernberger et al. report that fine-mode particles rich in calcium could be directly released during bark combustion.47 During coal combustion, calcium, magnesium, and silicon were found to volatilize and form fine-mode PM through homogeneous nucleation and condensation;48 however, the temperature was higher, >1500°C, than temperatures used for fluidized bed biomass combustion and gasification. Soot consists of fine particles that form through chemical reactions during fuel-rich conditions.38 It consists of primary particles with a diameter of 10-200 nm linked in chains.49 Soot formation can be divided into four processes: particle nucleation or particle inception where the PAH soot precursors polymerize; particle surface reactions (growth and oxidation); particle coagulation (see below); and particle agglomeration, where chains of soot particles are formed.50 Aromatic compounds generally have a higher sooting tendency compared to aliphatic compounds, and the temperatures for soot formation are also lower.49 Temperatures for soot formation from pure compounds are generally above 1000°C.49 Soot formation from biomass combustion and gasification has not been studied much. Fitzpatrick et al. studied soot formation from biomass combustion and concluded that soot could be formed directly from polymerization of pyrolysis products.51 Knoef states that soot can form during high-temperature oxygen gasification.12 Milne et al. conclude that maturation of tars can form soot at high temperatures.34 Hindsgaul et al. studied the PM from a two-stage downdraft gasifier fired with wood chips and found that soot dominated the PM.52 In a fixed bed gasifier the reaction temperature is higher compared to fluidized bed gasifiers, which could lead to increased soot formation. When the particles move in the surrounding gas, due to either diffusion or external forces, they collide and form larger particles leading to a lower particle number concentration. The process is called coagulation or agglomeration for solid particles. The agglomerates could coalesce and partly fuse at high temperature. Coagulation must be taken into account when sampling PM if the number concentration is higher than 106 particles/cm3.36
24
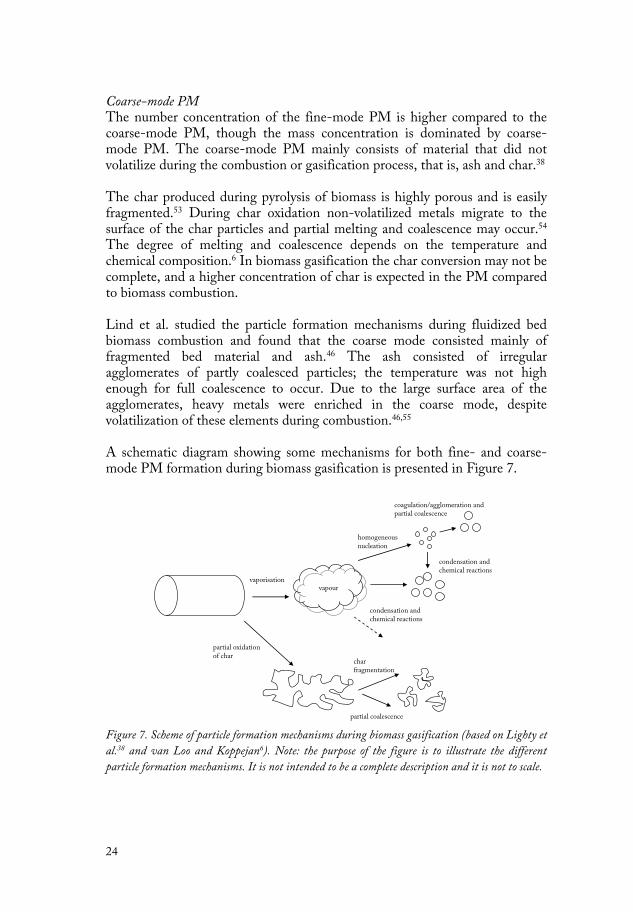
Coarse-mode PM The number concentration of the fine-mode PM is higher compared to the coarse-mode PM, though the mass concentration is dominated by coarse-mode PM. The coarse-mode PM mainly consists of material that did not volatilize during the combustion or gasification process, that is, ash and char.38 The char produced during pyrolysis of biomass is highly porous and is easily fragmented.53 During char oxidation non-volatilized metals migrate to the surface of the char particles and partial melting and coalescence may occur.54 The degree of melting and coalescence depends on the temperature and chemical composition.6 In biomass gasification the char conversion may not be complete, and a higher concentration of char is expected in the PM compared to biomass combustion. Lind et al. studied the particle formation mechanisms during fluidized bed biomass combustion and found that the coarse mode consisted mainly of fragmented bed material and ash.46 The ash consisted of irregular agglomerates of partly coalesced particles; the temperature was not high enough for full coalescence to occur. Due to the large surface area of the agglomerates, heavy metals were enriched in the coarse mode, despite volatilization of these elements during combustion.46,55 A schematic diagram showing some mechanisms for both fine- and coarse-mode PM formation during biomass gasification is presented in Figure 7.
vaporisationvapour
homogeneousnucleation
condensation and chemical reactions
coagulation/agglomeration and partial coalescence
partial oxidationof char
char fragmentation
partial coalescence
condensation and chemical reactions
Figure 7. Scheme of particle formation mechanisms during biomass gasification (based on Lighty et
al.38 and van Loo and Koppejan6). Note: the purpose of the figure is to illustrate the different
particle formation mechanisms. It is not intended to be a complete description and it is not to scale.
25
2.3.3 Sampling of particulate matter In this section methods for sampling of PM used in biomass combustion and gasification will be presented, with a focus on methods used at high temperature. Specific instruments will not be discussed. The sampling method, instruments, and analysis techniques used in this work are presented in sections 3.3, 3.4, and 3.5.
It is always important to extract a representative sample when characterizing PM, regarding both the concentration and size distribution. Isokinetic sampling minimizes particle losses at the inlet to the probe. It is fulfilled if the velocity in the probe inlet is the same as outside the probe and if the probe is directed against the gas flow. Isokinetic sampling is only of importance for supermicrometre particles and does not guarantee that no further particle losses occur downstream from the probe inlet. Particles could be lost in the sampling system due to impaction, sedimentation, diffusion, electrostatic attraction, and thermophoresis. Therefore, the sampling system should be short and straight without changes in tube diameter (same velocity) to minimize the losses.36 Sampling of PM at high temperature is usually problematic, due to the physical and chemical transformation of the sample. Both inorganic and organic vapours may form PM through homogeneous nucleation and condensation (see section 2.3.2), as the gas is cooled after sample extraction. In biomass gasification, the main concern is tar condensation at temperatures below 400°C as well as condensation of inorganic vapours, which are present at temperatures above 500°C. If the particle number concentration is high (>106 particles/cm3), coagulation also must be taken into account (see section 2.3.2). Various types of probes have been designed to sample PM at high temperature from biomass combustion with a controlled condensation, especially of inorganic vapours. Strand et al. designed a high-temperature dilution probe and tested it in a laboratory set-up and in a CFB boiler fired with wood chips at a temperature of 780°C.56 When using high dilution ratios the vapours deposited on the probe walls, while at lower dilution ratios, a nucleation mode was generated in the probe. A dilution probe similar to that used by Strand et al., was used by Wiinikka et al. to investigate the particle formation at high temperatures during fixed bed combustion of wood pellets.57 PM was sampled at several locations at temperatures from 200 to 1450°C and alkali chlorides formed PM at temperatures from 600 down to 450°C. Jimenez and Ballester tested and compared three probes for high-temperature sampling of particles from biomass combustion in a laboratory scale reactor; an aerodynamic quenching particle-sampling probe, a dilution probe, and a thermophoretic

26
sampling probe.58 All three probes gave rise to artefact particles, but in the case of the aerodynamic quenching particle-sampling probe and the thermophoretic sampling probe, the particles produced differed from the original particles and therefore it was possible to make a separation. Heated cascade impactors and filters have been used to sample PM at temperatures above the dew point of condensing vapours. For biomass combustion, the focus has been on inorganic vapours. Valmari et al. studied the particle size distribution during CFB combustion of biomass using a heated cascade impactor.59 At a temperature of 650°C, the fine mode PM contained only potassium sulphate; while at 160°C potassium chloride and potassium carbonate had condensed on the original particles. In another study, Valmari et al. used a heated quartz fibre filter to collect PM from CFB biomass combustion at 810-850°C.60 Downstream from the filter, the inorganic vapours were quenched with cool air and the PM formed was collected on a second filter. Calcium, phosphorus, and silicon were not found to be volatilized in the combustion process, potassium was partly volatilised, while chlorine was totally volatilized. For biomass gasification, heated cascade impactors and filters have also been used to prevent tars from contributing to the PM. Hasler and Nussbaumer used a cascade impactor to characterize PM from both fixed and fluidized bed biomass gasification.61 The impactor was heated to 270°C. Van der Nat et al.62
and Simeone et al.63 also used heated (220 and 400°C, respectively) cascade impactors to characterize PM from CFB biomass gasification. Gabra et al. used a heated filter (350°C) to sample PM from biomass gasification.64 A similar method was used by Yamazaki et al. to sample PM from fixed bed downdraft biomass gasification.65 Tars can also be removed before particle collection, for example, using porous activated carbon to adsorb tars in vapour phase. In the case of physical adsorption, molecules in gas phase interact with the solid adsorbent surface by van der Waals forces.66 In studies by Mastral et al. it was shown that the adsorption of tar compounds on activated carbon increased with increasing molecular size and decreasing volatility.67-69 Mastral et al. also showed, in another study, that there was a competition for adsorption between different tar compounds, adsorption efficiency being highest for the tar with the lowest volatility.70 Zhen-Shu showed that the tar removal efficiency of activated carbon fibres decreased with increasing temperature, since the process is exothermic; at lower temperatures, however, there was a risk of condensation and pore blockage that could reduce adsorption.71
Another option is to remove the tars from the PM using a thermodenuder. A thermodenuder consists of a section where the gas is heated, followed by a

27
denuder section where adsorption and cooling take place.72 First, the volatile material is evaporated, and then it is removed from the gas and adsorbed. Denuder operation is based on the fact that the diffusion velocity of gaseous species is higher than the diffusion velocity of particles.73 Compounds in gas phase will diffuse to the walls of the denuder, and the particles pass through. Burtscher et al. presented a thermodenuder where activated carbon was used in the adsorption section.74 The thermodenuder was successfully tested on atmospheric particles, on combustion particles, and on the adsorption and desorption of PAH on NaCl and combustion particles.
It is also possible to characterize the PM through analysis of the various ash fractions produced during biomass combustion and gasification. Vervaeke et al. studied the distribution of heavy metals in various ash fractions produced during fixed bed downdraft gasification of biomass cultivated at a contaminated site.44
2.4 Cleaning and upgrading in biomass gasification Depending on the aim of the biomass gasification process, the product gas needs various amounts of cleaning and upgrading. The main contaminants are PM and tars, and methods for the removal and reduction of these constituents will be presented. Other contaminants, such as sulphur and nitrogen compounds, may also have to be removed. A precise characterization of the various contaminants and their physical states at actual process temperatures facilitates the design and optimizes the function of equipment used for cleaning and upgrading of the product gas.
2.4.1 Methods for particulate matter removal PM could be removed using methods such as cyclones, filters, electrostatic precipitators and scrubbers.12 Cyclones can be used to remove coarse-mode PM with particle diameter >10 μm. The product gas is forced to rotate and due to their inertia, coarse particles are separated, since they cannot follow the gas flow.12 Cyclones can operate at high temperature and high pressure.6 Filters of various materials could be used for PM removal. Bag filters are constructed of ceramic, polymeric, or natural fibres and, depending on the material, can operate at temperatures up to 350°C.12 Bag filters are efficient also for fine-mode PM; however, the product gas needs to be cooled prior to cleaning, and tar condensation could be a problem.6,12 Candle filters of metal

28
or ceramic material can withstand temperatures up to 800°C, which means that no or little cooling of the product gas is necessary.6,12 However, a high filtration temperature implies that vapours of alkali and heavy metals could pass through the filter and form PM, posing a risk for catalysts used downstream from the filter (see also section 2.4.2). Candle filters could also be combined with a catalyst used for tar cracking for simultaneous PM and tar removal, for example, alumina candle filters with nickel catalyst in the pores.75 Rapagnà et al. put a ceramic candle filter with nickel catalyst in the freeboard of a fluidized bed biomass gasifier instead of using a separate filter unit.76 A rotating particle separator is a combination of a cyclone and a filter. Coarse particles are removed in the cyclone, and the outgoing gas passes through a rotating filter for removal of fine particles.6 When using an electrostatic precipitator for PM removal the particles are charged, exposed to an electric field, and deposited on collection plates.6,12 Particles are removed from the collection plates either mechanically at temperatures up to 500°C (normally 150°C for biomass combustion applications) or by using water at low temperature, 65°C.12 The efficiency of electrostatic precipitators is high for fine-mode PM also.6 In a scrubber, a liquid (water) is used to remove the PM. The product gas is passed through a spray of water, and the particles collide and coalesce with the water droplets and are removed from the product gas, for example, using a cyclone.6,12 An advantage of using a scrubber for PM removal is that gases such as hydrogen chloride can be removed at the same time. However, the disadvantages are that the efficiency is low for fine-mode PM, that the produced water needs treatment, and that scrubbers work only at low temperature, below 100°C.6,12
Knoef presented guidelines for concentrations of PM, alkali, and chloride for various applications of biomass gasification.12 For PM the requirements are 50 and 30 mg/m3 (normalized to 0°C, 1 atm, and dry gas), respectively, for gas engines and turbines, while for the production of hydrogen using WGS (see section 2.5.2) the requirement is 0.02 mg/m3. For alkali the requirements are 1 and 0.25 mg/m3, respectively, for gas engines and turbines, and for chloride, 10 mg/m3 for gas engines.
2.4.2 Methods for tar reduction As discussed in section 2.2.4, tar is formed during biomass gasification and may cause operational problems. Various methods are available to reduce the tar concentration in the product gas.
29
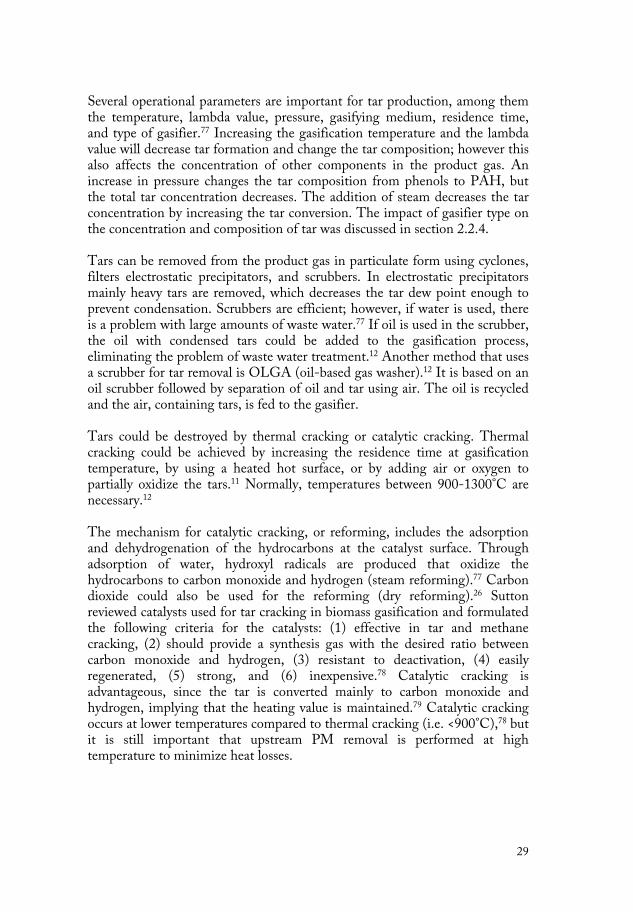
Several operational parameters are important for tar production, among them the temperature, lambda value, pressure, gasifying medium, residence time, and type of gasifier.77 Increasing the gasification temperature and the lambda value will decrease tar formation and change the tar composition; however this also affects the concentration of other components in the product gas. An increase in pressure changes the tar composition from phenols to PAH, but the total tar concentration decreases. The addition of steam decreases the tar concentration by increasing the tar conversion. The impact of gasifier type on the concentration and composition of tar was discussed in section 2.2.4. Tars can be removed from the product gas in particulate form using cyclones, filters electrostatic precipitators, and scrubbers. In electrostatic precipitators mainly heavy tars are removed, which decreases the tar dew point enough to prevent condensation. Scrubbers are efficient; however, if water is used, there is a problem with large amounts of waste water.77 If oil is used in the scrubber, the oil with condensed tars could be added to the gasification process, eliminating the problem of waste water treatment.12 Another method that uses a scrubber for tar removal is OLGA (oil-based gas washer).12 It is based on an oil scrubber followed by separation of oil and tar using air. The oil is recycled and the air, containing tars, is fed to the gasifier. Tars could be destroyed by thermal cracking or catalytic cracking. Thermal cracking could be achieved by increasing the residence time at gasification temperature, by using a heated hot surface, or by adding air or oxygen to partially oxidize the tars.11 Normally, temperatures between 900-1300°C are necessary.12 The mechanism for catalytic cracking, or reforming, includes the adsorption and dehydrogenation of the hydrocarbons at the catalyst surface. Through adsorption of water, hydroxyl radicals are produced that oxidize the hydrocarbons to carbon monoxide and hydrogen (steam reforming).77 Carbon dioxide could also be used for the reforming (dry reforming).26 Sutton reviewed catalysts used for tar cracking in biomass gasification and formulated the following criteria for the catalysts: (1) effective in tar and methane cracking, (2) should provide a synthesis gas with the desired ratio between carbon monoxide and hydrogen, (3) resistant to deactivation, (4) easily regenerated, (5) strong, and (6) inexpensive.78 Catalytic cracking is advantageous, since the tar is converted mainly to carbon monoxide and hydrogen, implying that the heating value is maintained.79 Catalytic cracking occurs at lower temperatures compared to thermal cracking (i.e. <900°C),78 but it is still important that upstream PM removal is performed at high temperature to minimize heat losses.

30
Catalysts could be used in the gasifier to reduce the tar concentration or in a separate reactor where tar, methane, and other hydrocarbons are converted.78
• Dolomite (magnesium and calcium carbonate) could be used both in the gasifier and in a separate reactor. It is an inexpensive catalyst with a high efficiency in tar reduction, but the mechanical strength is low and methane is not reformed.78
• Alkali metal catalysts (carbonates and minerals) are usually added to the gasifier and reduce both the tar and methane concentration. A disadvantage is the difficult and costly regeneration of the catalyst.78
• Nickel catalysts are the most studied catalysts used in biomass gasification. Normally, they are used in a separate reactor where tar and hydrocarbons are converted. Nickel catalysts are relatively cheap, but problems with deactivation could occur.78
• Limestone and olivine (a mineral of magnesium, iron oxide, and silica) have been used as catalytic bed additives to decrease the tar concentration.80
Catalysts could be deactivated, that is, lose some of their activity, through several mechanisms, such as poisoning, coking or fouling, and sintering.81 Poisoning of a catalyst occurs when a contaminant binds to the catalyst’s active sites. Nickel catalysts have been shown to be poisoned by sulphur, chlorine, and alkali metals.13,82 This poses a problem when using high-temperature filtration, since vapour of, for example, potassium chloride could pass through the filter (section 2.4.1). Coking or fouling means that solid carbon is deposited on the catalyst surface, while sintering implies that the catalyst is physically changed.81 The applied method for tar reduction is also dependent on the product gas requirements for downstream processes. Knoef presented guidelines for tar concentration for various applications: gas turbines are not sensitive to tar, as long as the tar is in vapour phase; gas engines require tar concentrations below 50 mg/m3 (normalized to 0°C, 1 atm, and dry gas); for hydrogen production using WGS, the tar concentration must be below 0.1 mg/m3.12
2.5 Applications of biomass gasification The main applications of biomass gasification are the production of heat, power, and chemicals (e.g. vehicle fuels). The gas requirements are different,
31
regarding both the main gas-phase composition and the concentration of contaminants, depending on whether heat and power or chemicals and vehicle fuels are to be produced. Heat and power production requires that the gas is combustible (lower heating value >5 MJ/m3) and that the concentration of contaminants such as PM and tars is lower than the guidelines discussed in the previous sections (2.4.1 and 2.4.2). For vehicle-fuel production, a nitrogen-free gas is also required, and generally the hydrogen concentration must exceed 50%.12
2.5.1 Production of heat and power Power production through biomass gasification could be achieved by using pressurized gasification and a gas turbine in a combined cycle that also includes a steam turbine (IGCC, integrated gasification combined cycle) or by using atmospheric gasification and a gas turbine or a gas engine. Heat is also produced and could either be used in the process or be delivered as district heating.11 To produce power using a gas turbine the product gas is compressed (in the case of atmospheric gasification) and burnt with air, and the hot flue gas runs the gas turbine. The remaining heat in the flue gas could be used for steam production (combined cycle) and/or for pre-heating of the combustion air.11 Gas engines can also be used for power production. Normally, gas engines are used for smaller scale applications compared to gas turbines, but the division is not absolute. The main advantages of gas engines compared to gas turbines are the higher robustness, higher efficiency at small scale, and higher tolerance for contaminants. Gas engines are not used in combined cycle, due to the low increase in total efficiency.11
2.5.2 Production of vehicle fuels Synthesis gas produced through biomass gasification could be converted to various chemicals, some of them appropriate as vehicle fuels. In this section, some of the most interesting compounds for future vehicles are presented: hydrogen, methanol, DME, Fischer Tropsch diesel and gasoline and SNG (Figure 8).
• Hydrogen is one of the main components in synthesis gas but the
concentration can be further increased through the WGS reaction (Table 1), using catalysts. Two reactors are used, one at a temperature of 350-500°C using an iron oxide catalyst and one at a temperature of 200°C using a copper catalyst. Downstream from the second reactor carbon monoxide concentrations of 0.2% can be reached.13 Carbon

32
dioxide may then be removed in a scrubber, and there are techniques available for further cleaning to produce hydrogen with a purity greater than 99.99%.83
• Methanol can be produced from synthesis gas, using the WGS reaction followed by catalytic reactions between hydrogen and carbon monoxide and/or carbon dioxide. Catalysts containing copper and zinc oxide are normally used at a temperature of 220-300°C and a pressure of 50-100 bars. Methanol can be directly used in internal combustion engines, and can also be converted to various other chemicals, such as DME formed through dehydration of methanol. DME could replace diesel as a fuel.13
• In the Fischer-Tropsch process, alkanes are produced from synthesis gas and alkanes are the main components in both diesel and gasoline.13 Reactions between carbon monoxide and hydrogen
produce alkanes with 1 to 50 carbons, depending on the temperature, gas composition, pressure, catalyst type, and catalyst composition.13,83 Cobalt, iron or ruthenium catalysts can be used for the reaction.13
• If SNG is the desired product from biomass gasification, the process should be optimized to produce methane. Also, carbon monoxide and carbon dioxide could react with hydrogen and form methane and water (Table 1), usually using nickel catalysts.12
Spath and Dayton reviewed the production of various fuels and chemicals from synthesis gas produced from biomass gasification (SNG was not included) and found that hydrogen and methanol were most cost competitive compared to fossil fuels.83 The challenge is to produce a clean synthesis gas from biomass gasification, since 50-75% of the vehicle fuel production cost originates from the production of synthesis gas.
Synthesis gasCO+H2
H2
WGS
Methanol
DME
DieselGasoline
Fischer-Tropsch
SNG
Figure 8. Scheme of the production of vehicle fuels from synthesis gas (based on Spath and
Dayton83, and Zhang84).

33
2.5.3 CHRISGAS – VVBGC The basis for this work was the CHRISGAS project (Clean Hydrogen-rich Synthesis Gas).85 The project started in 2004 and ended in 2010 and was financed by the European Commission (EC) 6th Framework Programme (CHRISGAS Project number SES6-CT-2004-502587) and the Swedish Energy Agency. The aim of the project was “to demonstrate, within a five-year period, the production of a clean hydrogen-rich synthesis gas from biomass”.85 The project was based around the Växjö Värnamo Biomass Gasification Centre (VVBGC). The plant was built in the 1990s by Sydkraft (now E.ON) and was used for the production of heat and power through pressurized biomass air gasification in an IGCC process. The aim was to rebuild the plant for steam and oxygen gasification, with high temperature cleaning of the product gas using a ceramic filter and catalytic or thermal steam reforming of hydrocarbons and tar. Downstream from the steam reformer a WGS step was planned to increase the share of hydrogen in the gas, to produce a synthesis gas of such a quality that it could be used for the production of vehicle fuels. The plans for VVBGC are further discussed in Albertazzi et al.86 The process scheme (after rebuild) is presented in Figure 9. Unfortunately, due to insufficient industry participation, the rebuild was not realized. Instead, the research within the CHRISGAS project was performed at other gasifiers, but with the retained aim of demonstrating the production of synthesis gas through pressurized steam and oxygen biomass gasification.
Figure 9. Process scheme of the Växjö Värnamo Biomass Gasification Centre (after rebuild).

34
35
3. EXPERIMENTAL
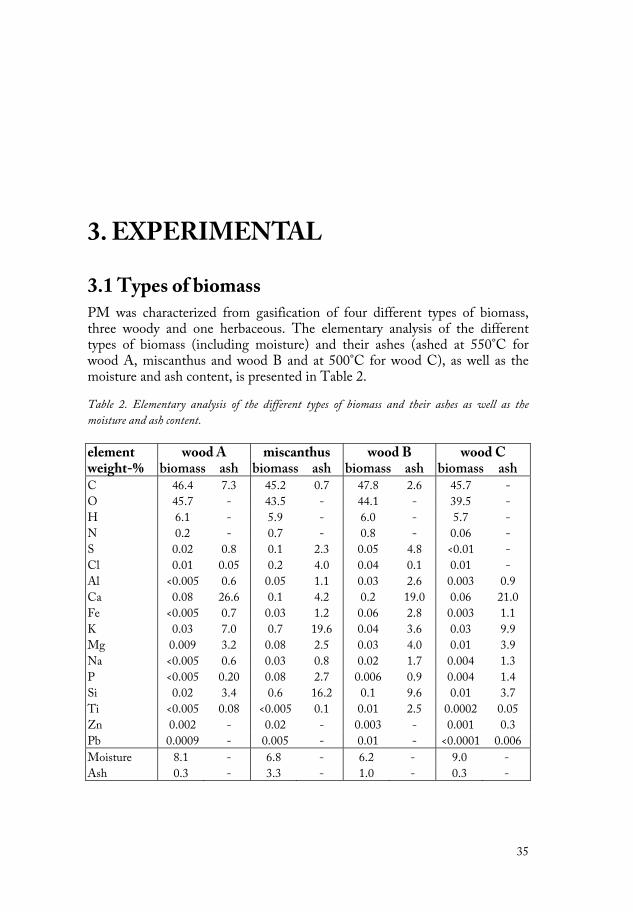
3.1 Types of biomass PM was characterized from gasification of four different types of biomass, three woody and one herbaceous. The elementary analysis of the different types of biomass (including moisture) and their ashes (ashed at 550°C for wood A, miscanthus and wood B and at 500°C for wood C), as well as the moisture and ash content, is presented in Table 2.
Table 2. Elementary analysis of the different types of biomass and their ashes as well as the
moisture and ash content.
element wood A miscanthus wood B wood C weight-% biomass ash biomass ash biomass ash biomass ash C 46.4 7.3 45.2 0.7 47.8 2.6 45.7 -
O 45.7 - 43.5 - 44.1 - 39.5 -
H 6.1 - 5.9 - 6.0 - 5.7 -
N 0.2 - 0.7 - 0.8 - 0.06 -
S 0.02 0.8 0.1 2.3 0.05 4.8 <0.01 -
Cl 0.01 0.05 0.2 4.0 0.04 0.1 0.01 -
Al <0.005 0.6 0.05 1.1 0.03 2.6 0.003 0.9
Ca 0.08 26.6 0.1 4.2 0.2 19.0 0.06 21.0
Fe <0.005 0.7 0.03 1.2 0.06 2.8 0.003 1.1
K 0.03 7.0 0.7 19.6 0.04 3.6 0.03 9.9
Mg 0.009 3.2 0.08 2.5 0.03 4.0 0.01 3.9
Na <0.005 0.6 0.03 0.8 0.02 1.7 0.004 1.3
P <0.005 0.20 0.08 2.7 0.006 0.9 0.004 1.4
Si 0.02 3.4 0.6 16.2 0.1 9.6 0.01 3.7
Ti <0.005 0.08 <0.005 0.1 0.01 2.5 0.0002 0.05
Zn 0.002 - 0.02 - 0.003 - 0.001 0.3
Pb 0.0009 - 0.005 - 0.01 - <0.0001 0.006
Moisture 8.1 - 6.8 - 6.2 - 9.0 -
Ash 0.3 - 3.3 - 1.0 - 0.3 -

36
Wood A and wood C are clean, new wood, while wood B is demolition wood. Miscanthus is an herbaceous fuel. All fuels were fed to the gasifiers as pellets. The fuels mainly differ in the concentration of ash, with ten times more ash in miscanthus compared to wood A and wood C. Also, the composition of the ash varies. Calcium and potassium are the dominant ash-forming elements in wood A and wood C and potassium and silicon dominate miscanthus, while wood B is rich in calcium and silicon. Further information about the analysis of wood A, miscanthus, and wood B is available in Porbatzki and Müller87 and Porbatzki.88
3.2 Gasifiers In this work, PM from three atmospheric fluidized bed biomass gasifiers of different types, sizes, and heat supply was characterized.
3.2.1 The bubbling fluidized bed gasifier system at TPS The first gasifier was a 20 kW BFB gasifier located at TPS Termiska Processer AB (Nyköping, Sweden) and is no longer in operation (Figure 10). Wood A was gasified using steam and oxygen at 850°C. The fuel was fed into the bottom of the gasifier and calcined magnesite was used as bed material. A cyclone at approximately 500°C and a ceramic filter at approximately 360°C were used for cleaning of the product gas. PM was sampled inside the gasifier, 20 cm from the upper connection on the flange of the gasifier at a gas temperature of approximately 500°C. The concentration of main gas-phase compounds, moisture content, tar concentration, and λ are presented in Table 3. The results from the BFB gasifier are presented in Papers II and V.
Figure 10. Scheme of the bubbling fluidized bed gasifier system at TPS Termiska Processer AB.
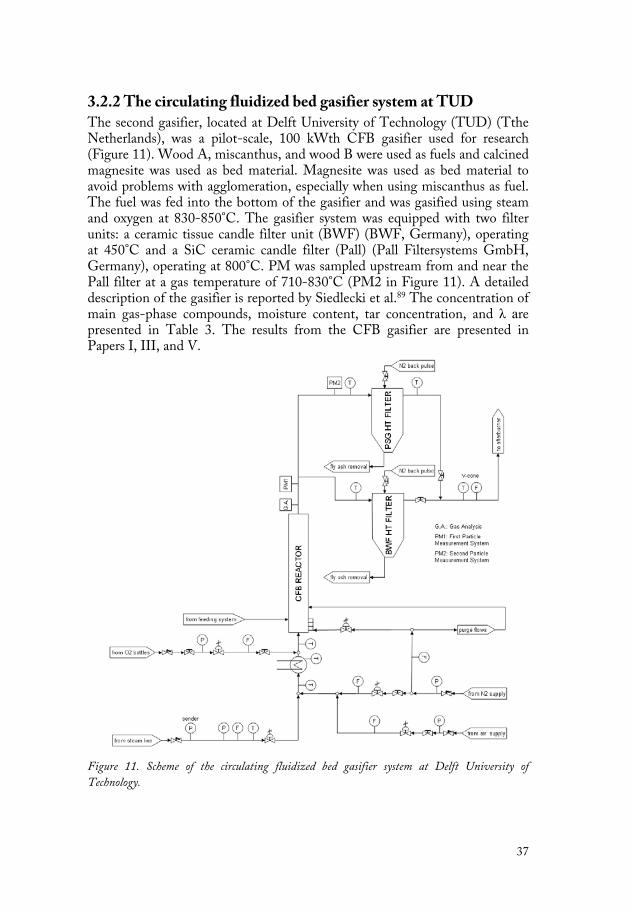
37
3.2.2 The circulating fluidized bed gasifier system at TUD The second gasifier, located at Delft University of Technology (TUD) (Tthe Netherlands), was a pilot-scale, 100 kWth CFB gasifier used for research (Figure 11). Wood A, miscanthus, and wood B were used as fuels and calcined magnesite was used as bed material. Magnesite was used as bed material to avoid problems with agglomeration, especially when using miscanthus as fuel. The fuel was fed into the bottom of the gasifier and was gasified using steam and oxygen at 830-850°C. The gasifier system was equipped with two filter units: a ceramic tissue candle filter unit (BWF) (BWF, Germany), operating at 450°C and a SiC ceramic candle filter (Pall) (Pall Filtersystems GmbH, Germany), operating at 800°C. PM was sampled upstream from and near the Pall filter at a gas temperature of 710-830°C (PM2 in Figure 11). A detailed description of the gasifier is reported by Siedlecki et al.89 The concentration of main gas-phase compounds, moisture content, tar concentration, and λ are presented in Table 3. The results from the CFB gasifier are presented in Papers I, III, and V.
Figure 11. Scheme of the circulating fluidized bed gasifier system at Delft University of
Technology.

38
3.2.3 The indirect bubbling fluidized bed gasifier system at Chalmers The third gasifier, located at Chalmers Technical University (Göteborg, Sweden), was an indirect 2–4 MW (fuel) BFB gasifier (Figure 12). The gasifier is an add-on to the existing 12 MWth CFB boiler used to heat the university campus using wood chips as fuel. Wood C was gasified using steam at a temperature of 850°C, and silica sand was used as bed material. The fuel and steam are heated by the bed material in the gasifier, forming product gas containing a mixture of gases, particles, tar, char, and ash. The gas phase exits at the top of the gasifier, while the char and bottom ash are recirculated, together with the bed material, to the CFB boiler where the char is combusted. PM was sampled approximately 3 m downstream from the gasifier exit at a temperature of 770°C. Further details regarding the gasifier system are presented by Thunman and Seemann.90 The concentration of main gas-phase compounds, moisture content, and tar concentration are presented in Table 3. The results from the indirect BFB gasifier are presented in Papers IV and V.
Figure 12. The indirect bubbling fluidized bed gasifier system at Chalmers Technical University.

39
Table 3. Concentration of main gas-phase compounds, moisture content, tar concentration, and λa
in product gas from three gasifiers. The main gas phase compounds are presented in dry volume-%
and are normalized to 100%, the moisture content is presented in wet volume-% and the tar
concentration is presented in moist gas at ambient conditions (~25°C and 100 kPa).
compound [dry volume-%]
BFB CFB indirect BFB
wood A wood A miscanthus wood B wood C
CO 14.6 13.2 12.7 11.0 32.0
H2 29.9 29.8 34.0 28.1 22.3
CO2 26.3 36.1 34.0 36.6 14.1
CH4 5.4 5.7 5.2 5.0 10.9
C2H2 - 0.1 0.1 0.1 -
C2H4 0.9 1.5 1.3 1.6 3.9
C3H8 - - - - 0.7
C2H6 0.1 - - - 0.2
N2 22.8 13.6 12.8 17.5 16.0
moisture content [vol-% wet]
37.0 54.1 52.8 60.1 71.0
total tar [g/m3] 1.5 1.7 1.0 1.3 2.3
λ 0.35 0.38 0.33 0.33 b
a λ is the ratio between oxygen input and oxygen required for total fuel oxidation to CO2 and H2O. b λ is not applicable.
The concentration of carbon monoxide in the product gas from the indirect BFB gasifier when using wood C as fuel was higher compared to the other gasifiers while the concentration of carbon dioxide was lower. In addition, the tar concentration was slightly higher. This was expected since only steam was used as gasifying agent, which also should imply high hydrogen concentrations.11 The reason for the even higher hydrogen concentrations from the BFB and CFB gasifiers could be the catalytic effect of the magnesite bed material on the WGS reaction.89
3.3 Particle measurement system The particle measurement systems used at the three different gasifiers were similar. The aim was to extract a sample of the hot product gas, without changing the size distribution and composition of the PM, to allow PM

40
characterization using various instruments and analysis techniques. In product gas from biomass gasification both inorganic and organic vapours are present that may form PM during cooling, through homogeneous nucleation and condensation. In addition, if the particle number concentration is high (>106 particles/cm3), coagulation may affect the particle number concentration and size distribution. In order to prevent these processes, a particle measurement system consisting of a dilution probe combined in series with a bed of granular activated carbon for tar adsorption was developed. In this section the basis for the particle measurement system is presented. The particle measurement system was studied in detail in Paper I, and the particle measurement systems used at the different gasifiers are presented in Papers II-V. The sample of the hot product gas was extracted using a dilution probe similar to the one used by Strand et al.56 to sample PM from biomass combustion at high temperature. In the dilution probe, the sample was diluted with pre-heated nitrogen and the gas temperature was reduced to approximately 300°C (Figure 13a). The aim was to favour condensation of the inorganic vapours on the probe walls over PM formation, and to prevent particle coagulation by reducing the particle number concentration. The dilution ratio (primary dilution) was varied during the measurements by adjusting the nitrogen flow. If a change in the dilution ratio is followed by a change in the particle size distribution, this indicates that PM was formed in the particle measurement system. Downstream from the dilution probe, tars were still mainly present as vapours, and the diluted gas entered the bed of granular activated carbon for tar adsorption. The bed of granular activated carbon was slightly different for the various measurements. At the CFB and indirect BFB gasifiers, the bed was contained in a stainless steel tube and was divided into two sections of 100 mm and 60 mm each, corresponding to a total of 70 cm3 of granular activated carbon (activated charcoal Norit, type RB3, diameter 3 mm, surface area 1100 m2/g; Norit Nederland B.V., Amersfoort, The Netherlands) (Figure 13b). At the BFB gasifier a smaller amount (i.e. 20 cm3) of carbon was present in only one section in a stainless steel tube. The temperature at the inlet to the bed of granular activated carbon was 220–320°C during the measurements at all gasifiers. In order to investigate the operation of the particle measurement system, various laboratory experiments were performed. The tar adsorption in the bed of granular activated carbon was tested using several methods. In the first tests, naphthalene was used as a tar model compound and the adsorption at temperatures up to 250°C was studied. The conclusion from the first tests was that the bed of granular activated carbon was suitable for tar adsorption at tar

41
concentrations prevailing in the particle measurement system when sampling PM from biomass gasification. The tar adsorption capacity was also tested using a model aerosol of potassium sulphate and diethyl-hexyl-sebacate (DEHS, C26H50O4), a model aerosol of potassium sulphate and tar-rich gas from a laboratory scale gasifier, and real product gas from the CFB gasifier at TUD. It was found that the adsorption capacity was dependent on the temperature, as well as on the tar concentration and composition. A detailed description of these experiments is presented in Paper I. To study whether the granular activated carbon emitted any particles when heated, nitrogen was passed through a heated bed of granular activated carbon in laboratory experiments. The results indicated that only negligible amounts of particles were emitted from the bed under these conditions. The particle transport efficiency in the bed of granular activated carbon was determined for fine- and coarse-mode PM. For fine-mode PM, the particle transport efficiency was determined experimentally using potassium sulphate
reference particles. The losses due to diffusion were determined theoretically and adjusted to match the experimentally determined losses. Then the particle transport efficiency for volumetric flow rates other than those used in the experimental determination could be approximated. Further details regarding the particle transport efficiency for fine-mode PM are presented in Paper I. For coarse-mode PM, the particle transport efficiency was determined experimentally using magnesite reference particles; further details are presented in Paper IV. For both fine- and coarse-mode PM the transport efficiency was determined at ambient temperature and pressure (~25°C and 100 kPa). No other losses in the particle measurement system, for example, in the dilution probe inlet, were determined.
Since the particle losses in the bed of granular activated carbon were significant for particles with dB < 30 nm and dae > 7 μm, a denuder was also tested as an alternative to the bed of granular activated carbon. The denuder consisted of a concentric stainless steel tube within which a concentric tube of stainless steel gauze was mounted (Figure 13c). Approximately 400 cm3 of granular activated carbon was used to fill the cavity between the two tubes. The particle losses were lower in the denuder compared to the bed, but the adsorption capacity of the denuder was insufficient compared to tar concentrations present in product gas from biomass gasification. The comparison of the bed of granular activated carbon and the denuder is presented in Paper I.

42
N2
Dilution and cooling
Hot gas in
Activated carbon
T2
100 mm 60 mm
T4T3
T1
a b
Activated carbon
Stainless steel gauze
T2
T1
c
Figure 13. Scheme of (a) the dilution probe, (b) the bed of granular activated carbon, and (c) the
denuder.
Downstream from the bed of granular activated carbon the gas was diluted using an ejector diluter (secondary dilution) (Dekati Ltd., Tampere, Finland); see Figure 14.91 The gas was diluted using clean, pressurized air. The air is directed through a critical nozzle that determines the flow of air, approximately 30 lpm during the measurements. A pressure drop is created in the ejector nozzle; gas is drawn into the diluter and mixes with the dilution air. The dilution ratio is determined by the ratio of the total flow in the diluter to the flow of sampled gas. The dilution ratio is constant as long as the pressure of the sampled gas is constant. Downstream from the ejector diluter the particle characterization instruments withdraw as much flow as they need and the rest is ventilated.
Figure 14. Scheme of the ejector diluter.91
Downstream from the ejector diluter an oven was used during the measurements at the CFB and indirect BFB gasifiers to verify that tars had been removed in the bed of granular activated carbon. The diluted gas containing PM was heated to 300-400°C and the particle size distribution was studied. A change in the particle size distribution due to heating would indicate that tars formed PM in the particle measurement system. During the measurements at the indirect BFB gasifier, this was the case for the fine-mode PM, and the oven was used as a thermodenuder to enable regeneration of the particle size distribution as it was in the hot product gas. During the measurements at the BFB gasifier, no oven was used downstream from the ejector diluter. Instead, PM was collected on a Teflon filter and analysed using thermogravimetric analysis (TGA, see section 3.5.4) to verify that the content

43
of volatile PM, that is, tars, was low. Another Teflon filter was used to determine the elementary composition (see section 3.5.3). The conditioned gas was then split between the instruments described in section 3.4. The CO analyser, based on infrared technology, was used in all measurements as a reference for adjusting and determining the dilution ratio. The scheme of the whole particle measurement system, as used at the CFB and indirect BFB gasifiers, is presented in Figure 15. The particle measurement system used at the BFB gasifier was slightly different and is presented in Paper II.
N2
T1T2-T4
Dilution probe
Bed Ejector diluter
Thermodenuder/oven
Product gas
Air Excess gas
Bypass
SMPS APSGasanalyzer
Pump
LPI
Pressure meter
Figure 15. Scheme of the particle measurement system used at the CFB and indirect BFB gasifiers.
3.4 Particle characterization instruments Three different instruments were used to determine the number and mass size distributions and concentrations of PM in the size range 10 nm to 10 μm. The different instruments complement each other regarding the size range. Two of the instruments are on-line, or almost on-line, instruments (SMPS and APS), while one is an off-line instrument (LPI), but with the possibility of collecting PM for further morphologic and elementary analysis.
3.4.1 Scanning mobility particle sizer (SMPS) A model 3080 SMPS (TSI Inc., Shoreview, MN, USA) including a model 3081 differential mobility analyser (DMA) and a model 3010 condensation particle counter (CPC) (both from TSI Inc.), was used to determine the number size distribution of particles with dB = 10-700 nm. The lower and upper size limits could be changed by regulating the sample flow to the

44
instrument and by changing the measuring time. The SMPS is a semi-on-line instrument; a scan of the particle number size distribution could be determined approximately every two to three minutes. A scheme of the model 3081 DMA is presented in Figure 16.92 The aerosol first passes through an impactor used to remove large particles. After that the aerosol is transported through a bipolar charger, where the particles collide with bipolar ions and receive a known charge distribution. The charged aerosol enters the DMA, which has an electric potential between two concentric metal cylinders. Positively charged particles are attracted to the negatively charged collector rod in the centre of the DMA. A charged particle has an electrical mobility (Z) (eq. 13, section 2.3.1) and particles with a certain electrical mobility are able to exit through a small slit in the collector rod. By changing the strength of the electric field, particles with varying electrical mobility exit through the slit and are counted using the CPC. In the CPC the aerosol passes over heated 1-butanol and becomes saturated. During cooling, the particles grow by condensation of 1-butanol and are counted optically. The particle mass size distribution and concentration are then calculated from the particle number size distribution, assuming spherical particles and standard density. Under these conditions, dB can be estimated using the Stokes diameter (ds) and dB ≈ dae according to eq. 5.
Figure 16. Scheme of the model 3081 DMA.92

45
3.4.2 Aerodynamic particle sizer (APS) A model 3321 APS (TSI Inc., Shoreview, MN, USA) was used to determine the number size distribution of particles with dae = 0.5-7.5 μm. The APS is an on-line instrument that continuously measures the particle number size distribution and concentration. A scheme of the model 3321 APS is presented in Figure 17.93 As the aerosol flow is drawn into the APS, it is divided into a sample flow and a sheath flow. The filtered sheath flow is used downstream to centre the sample flow and to accelerate the total flow through the nozzle. Due to the greater inertia of large particles, the resulting velocity of large particles is lower than the velocity of the gas, while small particles follow the gas. The particles pass through two laser beams and light is scattered, collected, and converted to an electrical pulse. The velocity of each particle is calculated by measuring the time between the two pulses and by using a calibration curve. Then the dae can be calculated. The particle mass size distribution and concentration are calculated from the particle number size distribution, assuming spherical particles and standard density.
Figure 17. Scheme of the model 3321 APS.93
3.4.3 Low pressure impactor (LPI) An LPI (Dekati Ltd., Tampere, Finland) was used to determine the mass size distribution of particles with dae = 0.03-10 μm. The LPI is a 13-stage cascade impactor that measures the particle mass size distribution and concentration.
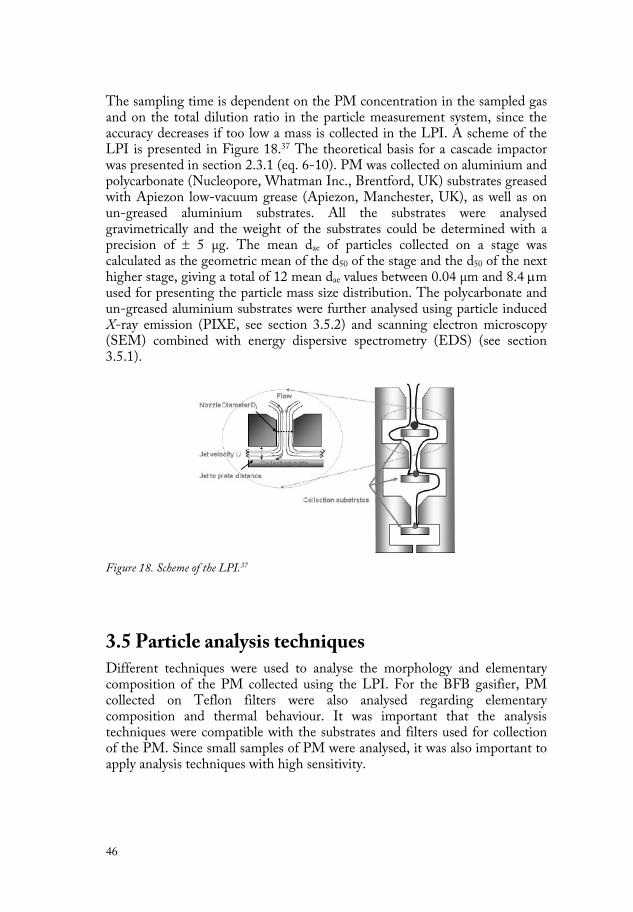
46
The sampling time is dependent on the PM concentration in the sampled gas and on the total dilution ratio in the particle measurement system, since the accuracy decreases if too low a mass is collected in the LPI. A scheme of the LPI is presented in Figure 18.37 The theoretical basis for a cascade impactor was presented in section 2.3.1 (eq. 6-10). PM was collected on aluminium and polycarbonate (Nucleopore, Whatman Inc., Brentford, UK) substrates greased with Apiezon low-vacuum grease (Apiezon, Manchester, UK), as well as on un-greased aluminium substrates. All the substrates were analysed gravimetrically and the weight of the substrates could be determined with a precision of ± 5 μg. The mean dae of particles collected on a stage was calculated as the geometric mean of the d50 of the stage and the d50 of the next higher stage, giving a total of 12 mean dae values between 0.04 μm and 8.4 μm used for presenting the particle mass size distribution. The polycarbonate and un-greased aluminium substrates were further analysed using particle induced X-ray emission (PIXE, see section 3.5.2) and scanning electron microscopy (SEM) combined with energy dispersive spectrometry (EDS) (see section 3.5.1).
Figure 18. Scheme of the LPI.37
3.5 Particle analysis techniques Different techniques were used to analyse the morphology and elementary composition of the PM collected using the LPI. For the BFB gasifier, PM collected on Teflon filters were also analysed regarding elementary composition and thermal behaviour. It was important that the analysis techniques were compatible with the substrates and filters used for collection of the PM. Since small samples of PM were analysed, it was also important to apply analysis techniques with high sensitivity.
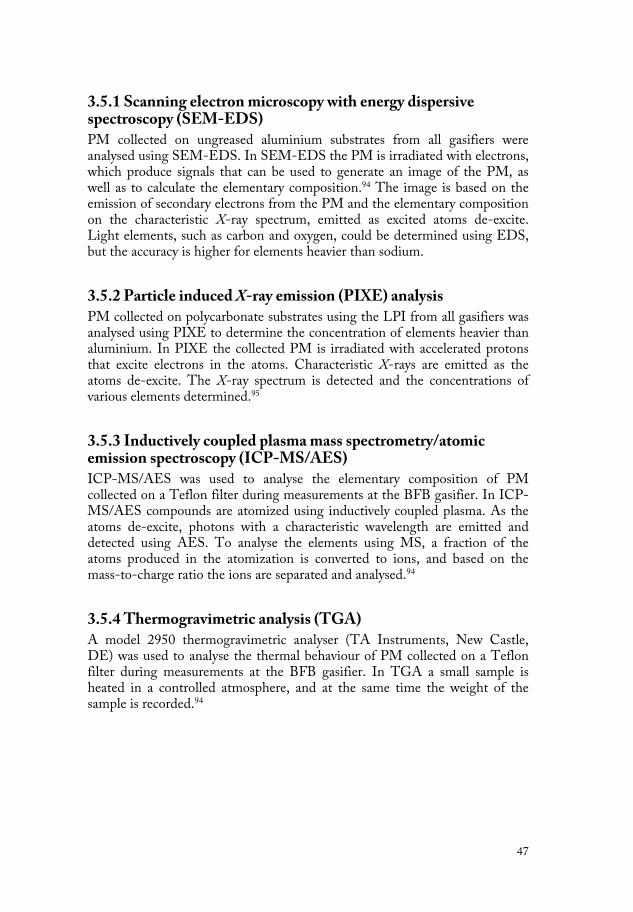
47
3.5.1 Scanning electron microscopy with energy dispersive spectroscopy (SEM-EDS) PM collected on ungreased aluminium substrates from all gasifiers were analysed using SEM-EDS. In SEM-EDS the PM is irradiated with electrons, which produce signals that can be used to generate an image of the PM, as well as to calculate the elementary composition.94 The image is based on the emission of secondary electrons from the PM and the elementary composition on the characteristic X-ray spectrum, emitted as excited atoms de-excite. Light elements, such as carbon and oxygen, could be determined using EDS, but the accuracy is higher for elements heavier than sodium.
3.5.2 Particle induced X-ray emission (PIXE) analysis PM collected on polycarbonate substrates using the LPI from all gasifiers was analysed using PIXE to determine the concentration of elements heavier than aluminium. In PIXE the collected PM is irradiated with accelerated protons that excite electrons in the atoms. Characteristic X-rays are emitted as the atoms de-excite. The X-ray spectrum is detected and the concentrations of various elements determined.95
3.5.3 Inductively coupled plasma mass spectrometry/atomic emission spectroscopy (ICP-MS/AES) ICP-MS/AES was used to analyse the elementary composition of PM collected on a Teflon filter during measurements at the BFB gasifier. In ICP-MS/AES compounds are atomized using inductively coupled plasma. As the atoms de-excite, photons with a characteristic wavelength are emitted and detected using AES. To analyse the elements using MS, a fraction of the atoms produced in the atomization is converted to ions, and based on the mass-to-charge ratio the ions are separated and analysed.94
3.5.4 Thermogravimetric analysis (TGA) A model 2950 thermogravimetric analyser (TA Instruments, New Castle, DE) was used to analyse the thermal behaviour of PM collected on a Teflon filter during measurements at the BFB gasifier. In TGA a small sample is heated in a controlled atmosphere, and at the same time the weight of the sample is recorded.94

48
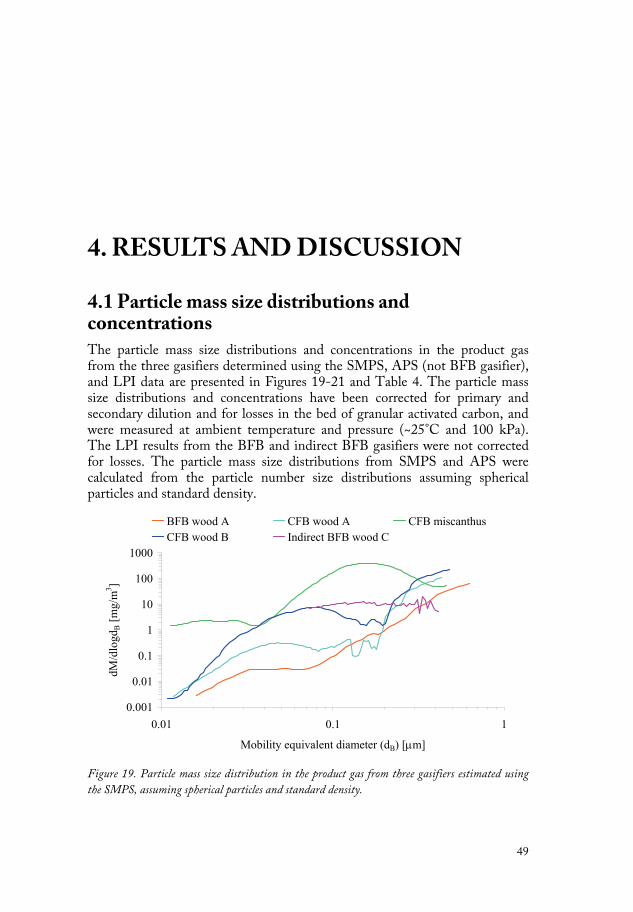
49
4. RESULTS AND DISCUSSION
4.1 Particle mass size distributions and concentrations The particle mass size distributions and concentrations in the product gas from the three gasifiers determined using the SMPS, APS (not BFB gasifier), and LPI data are presented in Figures 19-21 and Table 4. The particle mass size distributions and concentrations have been corrected for primary and secondary dilution and for losses in the bed of granular activated carbon, and were measured at ambient temperature and pressure (~25°C and 100 kPa). The LPI results from the BFB and indirect BFB gasifiers were not corrected for losses. The particle mass size distributions from SMPS and APS were calculated from the particle number size distributions assuming spherical particles and standard density.
0.001
0.01
0.1
1
10
100
1000
0.01 0.1 1
Mobility equivalent diameter (dB) [μm]
dM/d
logd
B [m
g/m
3 ]
BFB wood A CFB wood A CFB miscanthusCFB wood B Indirect BFB wood C
Figure 19. Particle mass size distribution in the product gas from three gasifiers estimated using
the SMPS, assuming spherical particles and standard density.
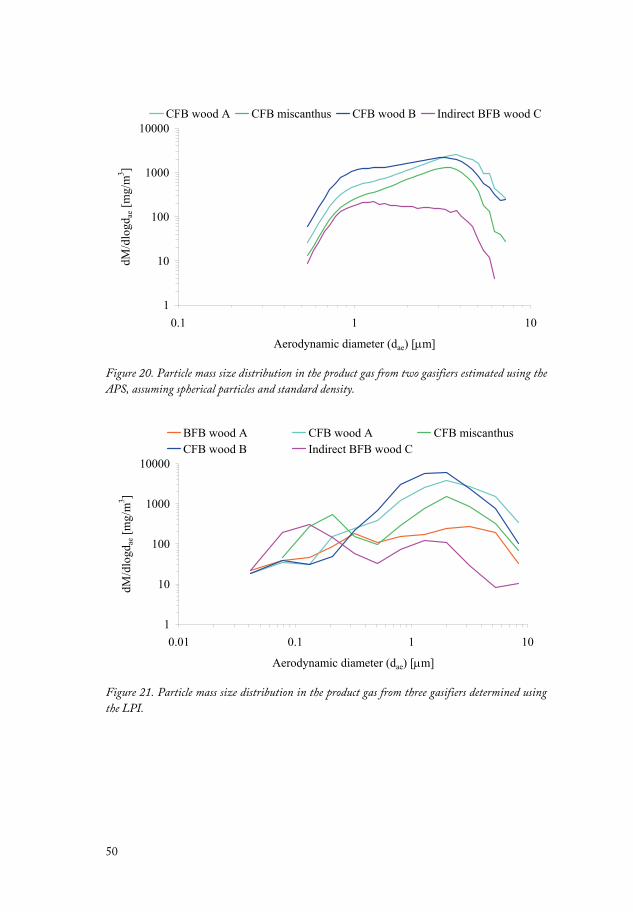
50
1
10
100
1000
10000
0.1 1 10
Aerodynamic diameter (dae) [μm]
dM/d
logd
ae [m
g/m
3 ]CFB wood A CFB miscanthus CFB wood B Indirect BFB wood C
Figure 20. Particle mass size distribution in the product gas from two gasifiers estimated using the
APS, assuming spherical particles and standard density.
1
10
100
1000
10000
0.01 0.1 1 10
Aerodynamic diameter (dae) [μm]
dM/d
logd
ae [m
g/m
3 ]
BFB wood A CFB wood A CFB miscanthusCFB wood B Indirect BFB wood C
Figure 21. Particle mass size distribution in the product gas from three gasifiers determined using
the LPI.

51
Table 4. Particle mass concentrations in the product gas from three gasifiers estimated and
determined using SMPS, APS and LPI. The mass concentrations are corrected for primary and
secondary dilution and losses in the bed of granular activated carbon, unless otherwise stated, and
were measured at ambient temperature and pressure (~25°C and 100 kPa).
mass concentration (mg/m3)
SMPS (dB = 0.01-a)
APS (dae = 0.5–7.5 μmb)
LPI (dae = 0.03–10 μm)
BFB, wood A 10 c 310d
15 1 170 2 590
170 570 970
CFB
-wood A
-miscanthus
-wood B 40 1 320 3 760
Indirect BFB,
wood C
10 130 240d
aThe upper limit for the SMPS was 0.67 μm for the BFB gasifier; 0.43, 0.46, and 0.48 μm for the CFB gasifier using wood A, miscanthus, and wood B, respectively as fuels; and 0.42 μm for the indirect BFB gasifier. This was affected by the sample flow to the instrument and the measuring time. For the indirect BFB gasifier, the lower limit was 0.07 μm since smaller particles were affected by tar condensation (see further section 4.3.2) and the mass concentration was measured downstream from the thermodenuder. bThe upper limit was set to 7.5 μm since losses of coarser particles were large. cThe APS was not used during the measurements at the BFB gasifier. dNot corrected for losses.
The particle mass size distribution and concentration in the product gas from the BFB and CFB gasifiers when using wood A as fuel, estimated using SMPS, were similar, with a fine mode in the <0.1 μm size range (Figure 19). When using miscanthus as fuel in the CFB gasifier, the fine mode was affected by the dilution ratio, indicating that particle formation occurred in the measurement system. This was due to homogeneous nucleation and condensation of potassium chloride, which is further discussed in section 4.3.1. The ash content in wood B was higher compared to wood A; this could be the reason for the higher concentration of fine-mode PM from wood B. The fine-mode PM from the indirect BFB gasifier when using wood C as fuel was affected by tar condensation, and measurements were performed downstream from the thermodenuder (400°C). Only particles with dB > 70 nm are included in the particle mass size distribution in Figure 19, since smaller particles were formed downstream from the thermodenuder. This is further discussed in section 4.3.2. Slightly different measurement size ranges were used in the SMPS for each gasifier and fuel, due to experimental conditions; however, this had a limited effect on the results. The fine-mode PM was also characterized using the LPI (Figure 21). A mode at approximately 0.1 μm was present in the particle mass size distribution from

52
all gasifiers and fuels, though with a higher mass concentration compared with the SMPS results. This may be due to bounce-off or re-entrainment of coarse-mode PM in the LPI, but also to the approximations made regarding spherical particles and standard density when calculating the particle mass size distributions and concentrations from the SMPS results. The fine modes from the CFB gasifier when using miscanthus as fuel and from the indirect BFB gasifier when using wood C as fuel were affected by particle formation in the measurement system. For the indirect BFB gasifier, LPI measurements were performed upstream from the thermodenuder, and consequently, the fine mode is biased by tars contributing to the PM. Therefore, the LPI results from the indirect BFB gasifier were not corrected for losses. The mass size distribution of coarse particles varied between the gasifiers. As shown in Figures 20 and 21 and Table 4, the mass concentration of coarse particles, as estimated and determined using the APS and the LPI, was about one order of magnitude higher from the CFB gasifier than from the BFB and indirect BFB gasifiers. The high PM concentration in product gas from the CFB gasifier was probably an effect of ash and fragmented magnesite bed material that was entrained with the gas and passed through the process cyclone. The gas velocity and entrainment of ash and bed material is much lower in a BFB compared to a CFB gasifier. For the CFB gasifier, the particle mass concentration from wood B was higher compared to both wood A and, especially, miscanthus. This was probably due to the larger feed of bed material when using wood B as fuel. When using miscanthus as a fuel in the CFB gasifier, both high temperature filters were connected in parallel (due to high pressure drop over the Pall filter); this could have affected the particle mass concentration and size distribution at the sampling position. The coarse mode was not affected by particle formation in the measurement system in any of the gasifiers. Homogeneous nucleation produces fine-mode PM, and condensation mainly occurs on the fine particles, due to the higher surface area to mass ratio compared to coarse particles.38
For all gasifiers and fuels the mass concentration of the coarse-mode PM was significantly larger compared to the fine-mode PM. In addition, the losses in the measurement system were high for particles with dae > 3 μm. This is indicated by the decrease in the particle mass size distribution for all gasifiers in Figures 20 and 21. The results were corrected for losses in the bed of granular activated carbon at ambient conditions; however, other losses, for example, in the probe inlet, were not taken into account. The actual mass concentration of PM with dae > 3 μm was considerably higher than indicated by the presented results. In Figure 22 results from the SMPS, APS, and LPI are presented for the CFB gasifier when using wood A as fuel. Also, results from a measurement using an

53
isokinetic sampling probe (to minimize particle losses) and a heated cascade impactor (CI) are presented for comparison (see further details in Paper III).
0.001
0.01
0.1
1
10
100
1000
10000
100000
0.01 0.1 1 10 100
Aerodynamic diameter, dae [μm]
dM/d
logd
ae[m
g/m
3 ]
CFB wood A SMPS CFB wood A APSCFB wood A LPI CFB wood A CI
Figure 22. Particle mass size distribution in the product gas from the CFB gasifier when using
wood A as fuel, estimated and determined using the SMPS, APS, LPI, and a heated CI, assuming
spherical particles and standard density.
The agreement between the different particle characterization instruments was good. Despite using different particle measurement systems, the result from the heated CI was similar to the results from the APS and LPI for particles with dae < 3 μm. For larger particles, the losses in the particle measurement system used upstream from the APS and LPI are large, indicated by the increase in the particle mass size distribution as measured using the heated CI for dae > 3 μm. The particle mass concentrations (Table 4) as measured using APS and LPI for all gasifiers and fuels showed the same trend, but the mass concentration estimated using the APS was approximately half of the mass concentration using the LPI. The difference could be partly due to the approximations made regarding spherical particles and standard density when calculating the particle mass concentration from the APS results. Further comparisons of the results from the various particle characterization instruments are presented in Papers II-V.

54
4.2 Particle morphology and elementary composition
4.2.1 Particle morphology The morphology of PM collected during measurements at the three gasifiers was analysed using SEM. PM was collected on ungreased aluminium substrates using the LPI and a selection of the substrates were analysed based on the modes in the particle mass size distributions. In Figures 23a-e some of the SEM images are presented to illustrate the morphology of the sampled PM. More SEM images are available in Papers II-IV.
SEM images of the fine-mode PM from CFB gasification of wood A and miscanthus are presented in Figures 23a-b. While the fine-mode PM from wood A consisted of irregular particles with a physical particle diameter < 1 μm, the fine-mode PM from miscanthus consisted of rounded particles of different sizes. Possibly the individual particles fused together on the LPI substrates either during or after sampling, forming the larger spheres in Figure 23b. The SEM images of the fine-mode PM do not indicate that soot was present. SEM images of the coarse-mode PM from BFB gasification of wood A, CFB gasification of wood A, and indirect BFB gasification of wood C are presented in Figures 23c-e. The PM consists of flaky, smooth pieces as well as agglomerated and partly fused structures. In the PM from the indirect BFB gasifier, rounded particles are also present. The flaky, smooth pieces were identified as char particles. The share of char was highest in the coarse-mode PM from the BFB gasifier, while the share in both the CFB and indirect BFB gasifiers was low. In the CFB gasifier there was a high load of bed material and probably the PM was constituted by both fragmented bed material and ash. The origin of the coarse-mode PM in the indirect BFB gasifier was probably ash (both from the wood pellets used as gasifier fuel and from the wood chips used as CFB boiler fuel), but the bed material may also have contributed to the PM. These results are in line with previous findings in which the content of unconverted char from BFB gasifiers was found to be high.10 In a CFB gasifier, the char conversion is higher than in a BFB gasifier.12 In the indirect BFB gasifier the char is recirculated to the CFB boiler with the bed material and is combusted before it is completely gasified. The time available for char attrition is consequently much shorter in an indirect than in a direct gasifier, where the char is gasified and partly oxidized in the gasifier reactor.
The PM in some of the images in Figure 23 seems to have a physical particle diameter larger than the mean dae for the LPI stage. The LPI size fractionates

55
PM based on the dae. A particle with a density below 1 g/cm3 has an dae smaller than the physical particle diameter (eq. 5). Also, the shape of the particle affects the dae and the particles are mainly non-spherical. Due to the difference between the physical particle diameter and dae particles that appear larger than the mean dae for an impactor stage could have been correctly classified. However, the presence of particles with a large physical particle diameter could also indicate that particles bounced off or were entrained from upstream stages in the LPI.
c. d.
e. Figure 23. SEM images of PM collected
on ungreased aluminum substrates
using LPI (magnification 5000×,
9640× for image c):
a. CFB, wood A, dae = 0.2 μm
b. CFB, miscanthus, dae = 0.1 μm
c. BFB, wood A, dae = 3.2 μm
d. CFB, wood A, dae = 3.2 μm
e. indirect BFB, wood C, dae = 2 μm
a. b.

56
4.2.2 Particle elementary composition The elementary composition of the PM collected during measurements at the three gasifiers was analysed using EDS (in combination with the SEM analysis), PIXE, and ICP-MS/AES (only PM from the BFB gasifier). In the EDS analysis, carbon and oxygen were detected in PM from all gasifiers. Since the accuracy in quantification of light elements was low, these elements have been excluded from further discussion. PM was collected on greased polycarbonate substrates using the LPI, and all substrates were analysed using PIXE; results are presented in Figures 24a-e. For the CFB gasifier when using miscanthus as fuel the substrate corresponding to dae = 0.13 μm was removed in Figure 24c, and for the indirect BFB gasifier when using wood C as fuel, the substrate corresponding to dae = 0.04 μm was removed in Figure 24e due to unreasonable results. PM from the BFB gasifier was also collected on a Teflon filter and analysed using ICP-MS/AES; results are presented in Table 5. Neither, ICP-MS/AES or PIXE analysis could quantify carbon, and PIXE only quantifies elements heavier than aluminium. Less than 15% of the mass was detected using PIXE analysis of the PM from all gasifiers, implying that the mass was dominated by elements not detectable (lighter than aluminium), such as hydrogen, carbon and oxygen, sodium, and magnesium.
There was no distinct difference in the elementary composition between fine-and coarse-mode PM from either the BFB or CFB gasifiers when using wood A as fuel (Figures 24a-b). Calcium was the dominant element for particles of all sizes, but manganese and iron were also present in substantial concentrations. The results of the ICP-MS/AES analysis of PM (dae < 5 μm) from the BFB gasifier when using wood A as fuel also indicate that calcium was the dominant element followed by sodium and sulphur. In the biomass analysis (Table 2), calcium was the dominant ash-forming element, and calcium was present in high concentrations in the magnesite bed material. Normally, calcium is not considered to volatilize from the biomass during thermochemical conversion and is, therefore, mainly thought to be present in the coarse-mode PM.39 However, calcium has been found in the fine-mode PM in previous work on PM from biomass combustion.46,47 Since the bed material contains high concentrations of calcium, it is possible that calcium, and also magnesium, was volatilized from the magnesite bed material used in both the BFB and CFB gasifiers. This is supported by the result of the EDS analysis, where magnesium was present in both the fine- and coarse-mode PM from both the BFB and CFB gasifiers when using wood A as fuel. Extensive fragmentation of the magnesite bed material could explain the calcium in particles around 0.5 μm in size; however, particles with mobility equivalent diameter as low as 40 nm are not likely to be formed through mechanical processes to any great extent. Finally, the calcium in the fine-mode PM could
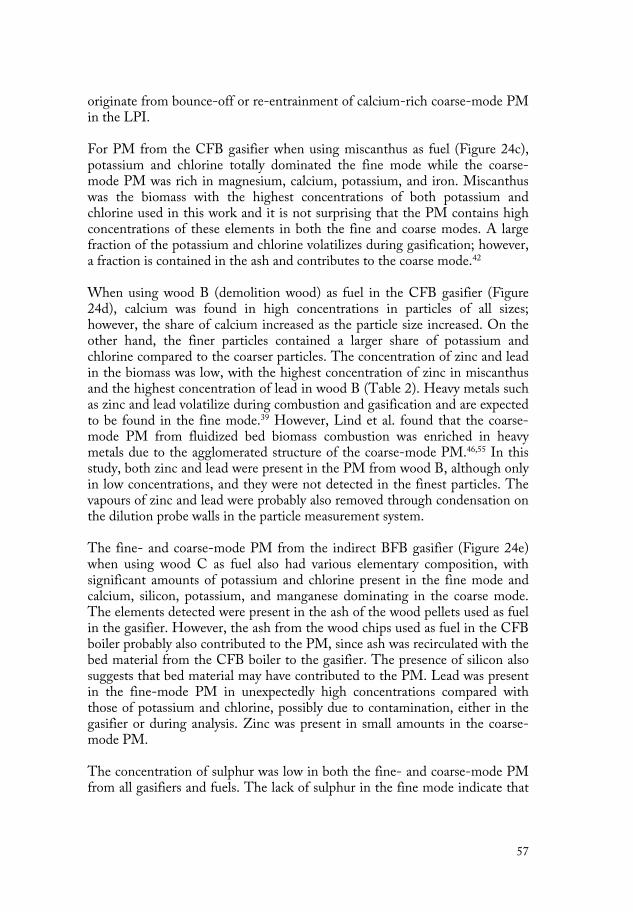
57
originate from bounce-off or re-entrainment of calcium-rich coarse-mode PM in the LPI. For PM from the CFB gasifier when using miscanthus as fuel (Figure 24c), potassium and chlorine totally dominated the fine mode while the coarse-mode PM was rich in magnesium, calcium, potassium, and iron. Miscanthus was the biomass with the highest concentrations of both potassium and chlorine used in this work and it is not surprising that the PM contains high concentrations of these elements in both the fine and coarse modes. A large fraction of the potassium and chlorine volatilizes during gasification; however, a fraction is contained in the ash and contributes to the coarse mode.42
When using wood B (demolition wood) as fuel in the CFB gasifier (Figure 24d), calcium was found in high concentrations in particles of all sizes; however, the share of calcium increased as the particle size increased. On the other hand, the finer particles contained a larger share of potassium and chlorine compared to the coarser particles. The concentration of zinc and lead in the biomass was low, with the highest concentration of zinc in miscanthus and the highest concentration of lead in wood B (Table 2). Heavy metals such as zinc and lead volatilize during combustion and gasification and are expected to be found in the fine mode.39 However, Lind et al. found that the coarse-mode PM from fluidized bed biomass combustion was enriched in heavy metals due to the agglomerated structure of the coarse-mode PM.46,55 In this study, both zinc and lead were present in the PM from wood B, although only in low concentrations, and they were not detected in the finest particles. The vapours of zinc and lead were probably also removed through condensation on the dilution probe walls in the particle measurement system. The fine- and coarse-mode PM from the indirect BFB gasifier (Figure 24e) when using wood C as fuel also had various elementary composition, with significant amounts of potassium and chlorine present in the fine mode and calcium, silicon, potassium, and manganese dominating in the coarse mode. The elements detected were present in the ash of the wood pellets used as fuel in the gasifier. However, the ash from the wood chips used as fuel in the CFB boiler probably also contributed to the PM, since ash was recirculated with the bed material from the CFB boiler to the gasifier. The presence of silicon also suggests that bed material may have contributed to the PM. Lead was present in the fine-mode PM in unexpectedly high concentrations compared with those of potassium and chlorine, possibly due to contamination, either in the gasifier or during analysis. Zinc was present in small amounts in the coarse-mode PM. The concentration of sulphur was low in both the fine- and coarse-mode PM from all gasifiers and fuels. The lack of sulphur in the fine mode indicate that
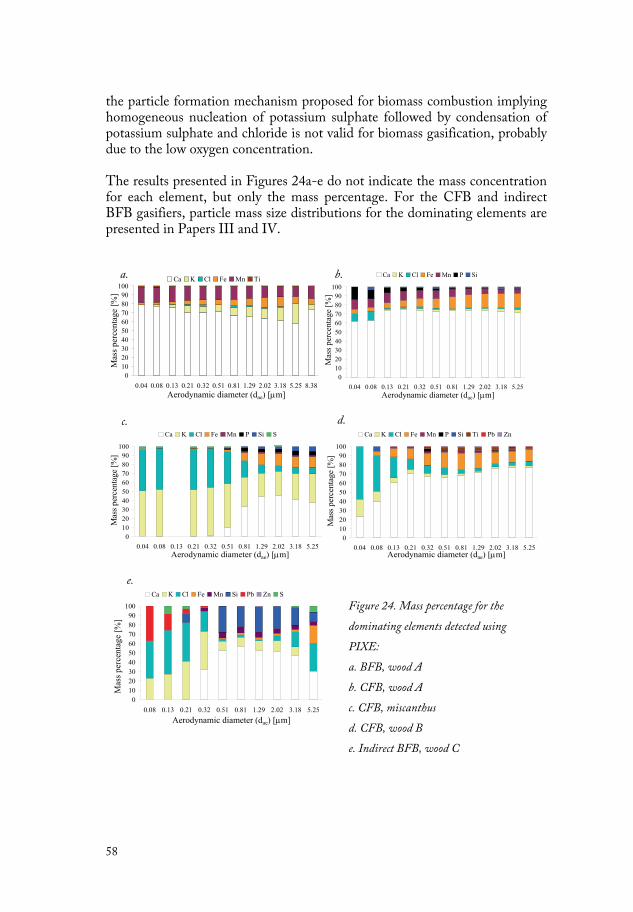
58
the particle formation mechanism proposed for biomass combustion implying homogeneous nucleation of potassium sulphate followed by condensation of potassium sulphate and chloride is not valid for biomass gasification, probably due to the low oxygen concentration. The results presented in Figures 24a-e do not indicate the mass concentration for each element, but only the mass percentage. For the CFB and indirect BFB gasifiers, particle mass size distributions for the dominating elements are presented in Papers III and IV.
0102030405060708090
100
0.04 0.08 0.13 0.21 0.32 0.51 0.81 1.29 2.02 3.18 5.25 8.38Aerodynamic diameter (dae) [μm]
Mas
s per
cent
age
[%]
Ca K Cl Fe Mn Ti
0102030405060708090
100
0.04 0.08 0.13 0.21 0.32 0.51 0.81 1.29 2.02 3.18 5.25Aerodynamic diameter (dae) [μm]
Mas
s per
cent
age
[%]
Ca K Cl Fe Mn P Si
0102030405060708090
100
0.04 0.08 0.13 0.21 0.32 0.51 0.81 1.29 2.02 3.18 5.25Aerodynamic diameter (dae) [μm]
Mas
s per
cent
age
[%]
Ca K Cl Fe Mn P Si S
0102030405060708090
100
0.04 0.08 0.13 0.21 0.32 0.51 0.81 1.29 2.02 3.18 5.25Aerodynamic diameter (dae) [μm]
Mas
s per
cent
age
[%]
Ca K Cl Fe Mn P Si Ti Pb Zn
0102030405060708090
100
0.08 0.13 0.21 0.32 0.51 0.81 1.29 2.02 3.18 5.25Aerodynamic diameter (dae) [μm]
Mas
s per
cent
age
[%]
Ca K Cl Fe Mn Si Pb Zn S
b.
c. d.
a.
e.
Figure 24. Mass percentage for the
dominating elements detected using
PIXE:
a. BFB, wood A
b. CFB, wood A
c. CFB, miscanthus
d. CFB, wood B
e. Indirect BFB, wood C
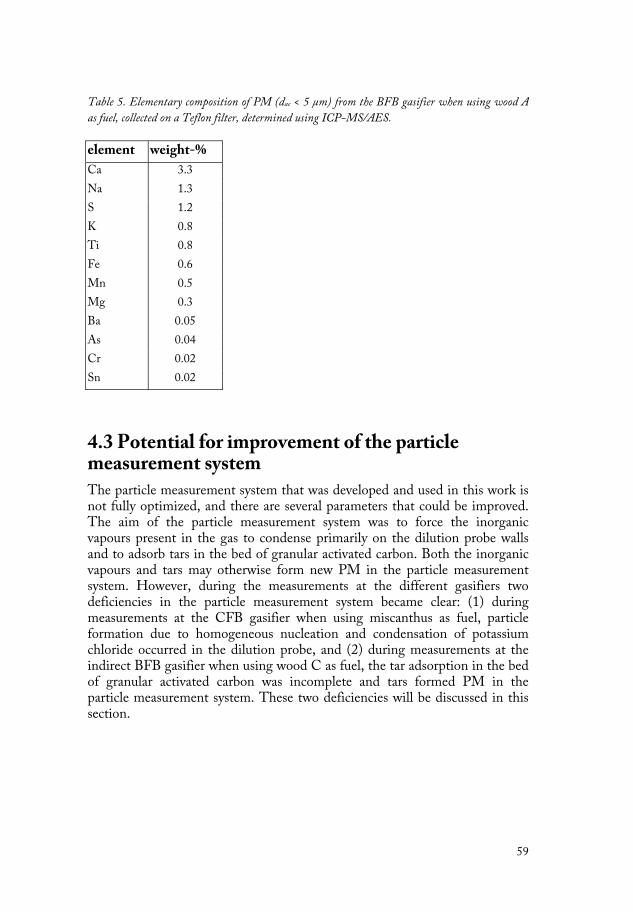
59
Table 5. Elementary composition of PM (dae < 5 μm) from the BFB gasifier when using wood A
as fuel, collected on a Teflon filter, determined using ICP-MS/AES.
element weight-%
Ca 3.3
Na 1.3
S 1.2
K 0.8
Ti 0.8
Fe 0.6
Mn 0.5
Mg 0.3
Ba 0.05
As 0.04
Cr 0.02
Sn 0.02
4.3 Potential for improvement of the particle measurement system The particle measurement system that was developed and used in this work is not fully optimized, and there are several parameters that could be improved. The aim of the particle measurement system was to force the inorganic vapours present in the gas to condense primarily on the dilution probe walls and to adsorb tars in the bed of granular activated carbon. Both the inorganic vapours and tars may otherwise form new PM in the particle measurement system. However, during the measurements at the different gasifiers two deficiencies in the particle measurement system became clear: (1) during measurements at the CFB gasifier when using miscanthus as fuel, particle formation due to homogeneous nucleation and condensation of potassium chloride occurred in the dilution probe, and (2) during measurements at the indirect BFB gasifier when using wood C as fuel, the tar adsorption in the bed of granular activated carbon was incomplete and tars formed PM in the particle measurement system. These two deficiencies will be discussed in this section.
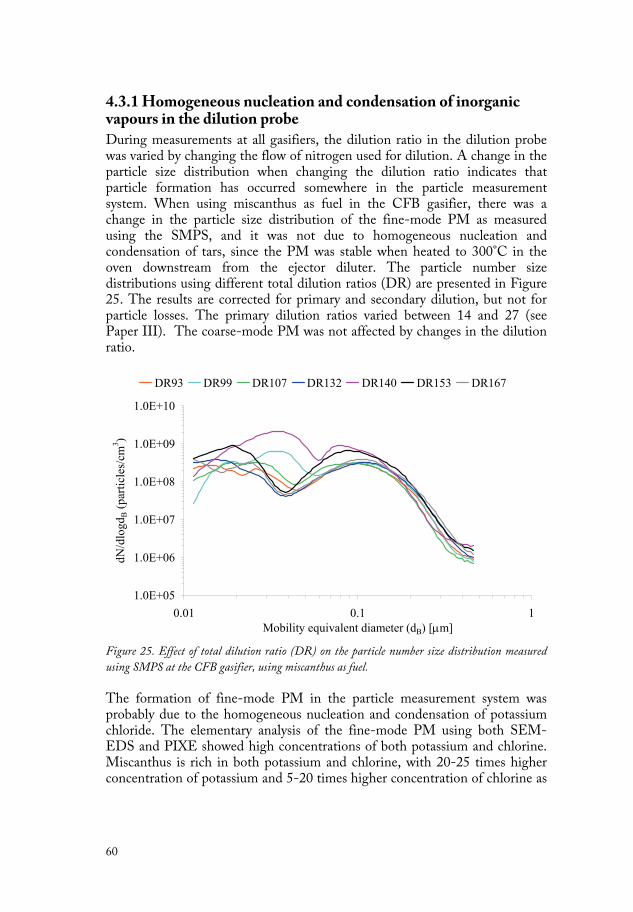
60
4.3.1 Homogeneous nucleation and condensation of inorganic vapours in the dilution probe During measurements at all gasifiers, the dilution ratio in the dilution probe was varied by changing the flow of nitrogen used for dilution. A change in the particle size distribution when changing the dilution ratio indicates that particle formation has occurred somewhere in the particle measurement system. When using miscanthus as fuel in the CFB gasifier, there was a change in the particle size distribution of the fine-mode PM as measured using the SMPS, and it was not due to homogeneous nucleation and condensation of tars, since the PM was stable when heated to 300°C in the oven downstream from the ejector diluter. The particle number size distributions using different total dilution ratios (DR) are presented in Figure 25. The results are corrected for primary and secondary dilution, but not for particle losses. The primary dilution ratios varied between 14 and 27 (see Paper III). The coarse-mode PM was not affected by changes in the dilution ratio.
1.0E+05
1.0E+06
1.0E+07
1.0E+08
1.0E+09
1.0E+10
0.01 0.1 1Mobility equivalent diameter (dB) [μm]
dN/d
logd
B (p
artic
les/
cm3 )
DR93 DR99 DR107 DR132 DR140 DR153 DR167
Figure 25. Effect of total dilution ratio (DR) on the particle number size distribution measured
using SMPS at the CFB gasifier, using miscanthus as fuel.
The formation of fine-mode PM in the particle measurement system was probably due to the homogeneous nucleation and condensation of potassium chloride. The elementary analysis of the fine-mode PM using both SEM-EDS and PIXE showed high concentrations of both potassium and chlorine. Miscanthus is rich in both potassium and chlorine, with 20-25 times higher concentration of potassium and 5-20 times higher concentration of chlorine as

61
compared to wood A and wood B (Table 2). A large fraction of the potassium and chlorine volatilizes during gasification and may form PM through homogeneous nucleation and condensation, for example, during cooling.43 The aim of the dilution probe was to force the inorganic vapours present in the gas to condense primarily on the probe walls, instead of forming new particles. However, probably due to the large amount of potassium chloride, part of the vapours formed PM. Theoretically; an increased primary dilution ratio should generate less PM due to a lower concentration of vapour. Also, the particle size distribution should be shifted toward smaller particle diameters. This trend is not obvious from Figure 25. This could be due to many factors, among them the accuracy in determining the dilution ratio. Nucleation and condensation processes are sensitive to varying concentrations of inorganic vapours in the raw product gas, for example, due to an irregular supply of fuel. In addition, some of the samples in Figure 25 (DR140 and DR153) were collected before the bypass to the BWF filter in the CFB gasifier was opened (due to high pressure drop over the Pall filter), while the others were collected afterwards, which could also affect the result presented in Figure 25. To solve the problems with homogeneous nucleation and condensation of inorganic vapours in the particle measurement system, higher dilution ratios could be used. During the measurements at the indirect BFB gasifier, higher primary dilution ratios were used compared to the primary dilution ratios used at the CFB gasifier. The total dilution ratio is calculated by comparing the carbon monoxide concentration in the diluted gas with the carbon monoxide concentration in the raw product gas. A stable concentration of carbon monoxide in the diluted gas is a prerequisite for the determination of the dilution ratio, and during the measurements at the indirect BFB gasifier it was possible to stabilize the system on lower carbon monoxide concentrations than during the measurements at the CFB gasifier. Possibly this could be due to the varying pressures in the gasifiers. The ejector diluter used for secondary dilution in the particle measurement system also determines the flow in the system. This flow is dependent on pressure. In the indirect BFB gasifier there was a small negative pressure, while in the CFB gasifier there was a small excess pressure. In addition, during measurements at the CFB gasifier, the back pulsing with nitrogen for cleaning of the Pall filter also momentarily affected the pressure in the gasifier and therefore also the flow in the particle measurement system. Consequently, lower primary dilution ratios had to be used during the measurements at the CFB gasifier compared to the indirect BFB gasifier to maintain an acceptable accuracy in determining the dilution ratio. However, when using higher dilution ratios in the particle measurement system, the PM concentration is reduced possibly leading to difficulties when applying the particle characterization instruments.
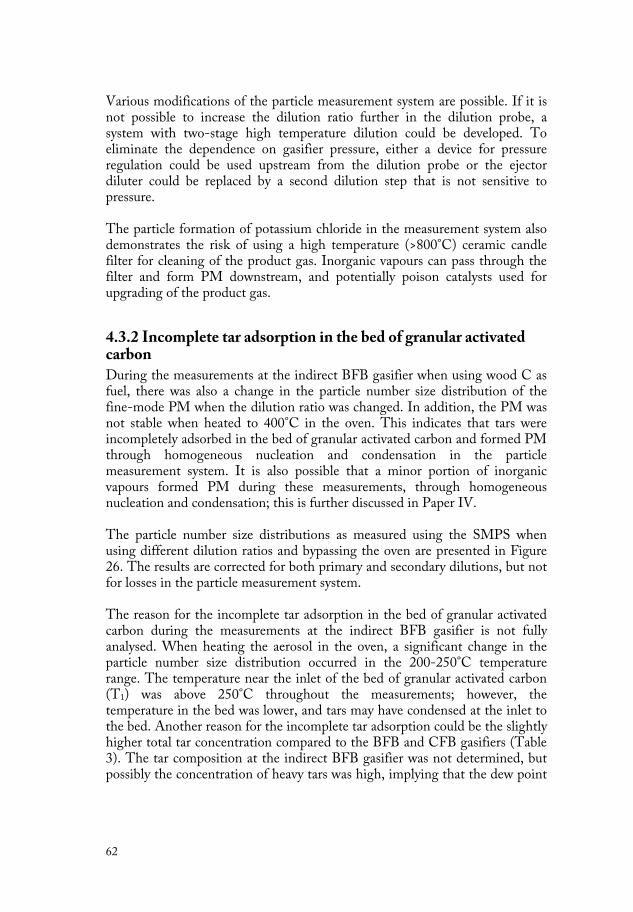
62
Various modifications of the particle measurement system are possible. If it is not possible to increase the dilution ratio further in the dilution probe, a system with two-stage high temperature dilution could be developed. To eliminate the dependence on gasifier pressure, either a device for pressure regulation could be used upstream from the dilution probe or the ejector diluter could be replaced by a second dilution step that is not sensitive to pressure. The particle formation of potassium chloride in the measurement system also demonstrates the risk of using a high temperature (>800°C) ceramic candle filter for cleaning of the product gas. Inorganic vapours can pass through the filter and form PM downstream, and potentially poison catalysts used for upgrading of the product gas.
4.3.2 Incomplete tar adsorption in the bed of granular activated carbon During the measurements at the indirect BFB gasifier when using wood C as fuel, there was also a change in the particle number size distribution of the fine-mode PM when the dilution ratio was changed. In addition, the PM was not stable when heated to 400°C in the oven. This indicates that tars were incompletely adsorbed in the bed of granular activated carbon and formed PM through homogeneous nucleation and condensation in the particle measurement system. It is also possible that a minor portion of inorganic vapours formed PM during these measurements, through homogeneous nucleation and condensation; this is further discussed in Paper IV. The particle number size distributions as measured using the SMPS when using different dilution ratios and bypassing the oven are presented in Figure 26. The results are corrected for both primary and secondary dilutions, but not for losses in the particle measurement system.
The reason for the incomplete tar adsorption in the bed of granular activated carbon during the measurements at the indirect BFB gasifier is not fully analysed. When heating the aerosol in the oven, a significant change in the particle number size distribution occurred in the 200-250°C temperature range. The temperature near the inlet of the bed of granular activated carbon (T1) was above 250°C throughout the measurements; however, the temperature in the bed was lower, and tars may have condensed at the inlet to the bed. Another reason for the incomplete tar adsorption could be the slightly higher total tar concentration compared to the BFB and CFB gasifiers (Table 3). The tar composition at the indirect BFB gasifier was not determined, but possibly the concentration of heavy tars was high, implying that the dew point
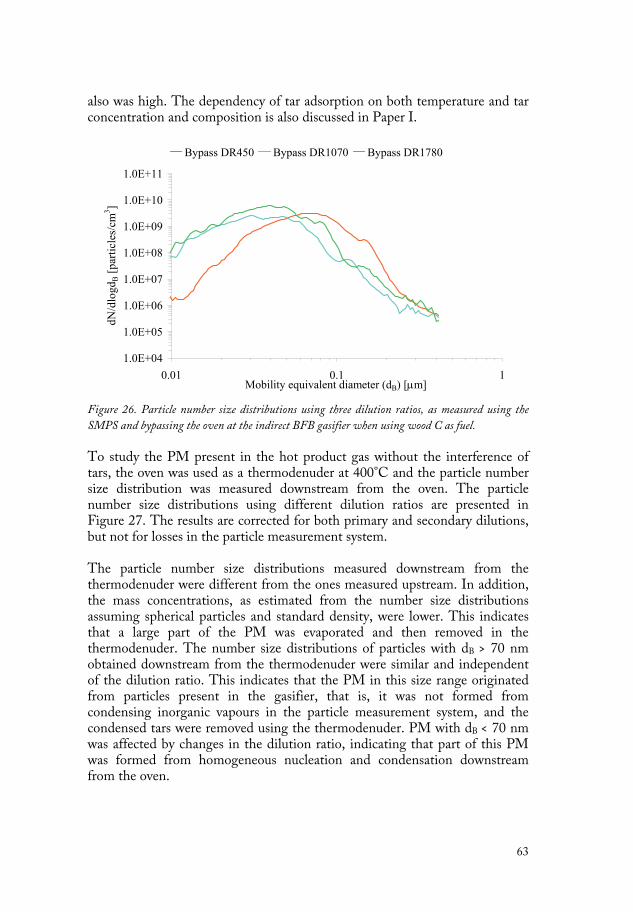
63
also was high. The dependency of tar adsorption on both temperature and tar concentration and composition is also discussed in Paper I.
1.0E+04
1.0E+05
1.0E+06
1.0E+07
1.0E+08
1.0E+09
1.0E+10
1.0E+11
0.01 0.1 1Mobility equivalent diameter (dB) [μm]
dN/d
logd
B [p
artic
les/
cm3 ]
Bypass DR450 Bypass DR1070 Bypass DR1780
Figure 26. Particle number size distributions using three dilution ratios, as measured using the
SMPS and bypassing the oven at the indirect BFB gasifier when using wood C as fuel.
To study the PM present in the hot product gas without the interference of tars, the oven was used as a thermodenuder at 400°C and the particle number size distribution was measured downstream from the oven. The particle number size distributions using different dilution ratios are presented in Figure 27. The results are corrected for both primary and secondary dilutions, but not for losses in the particle measurement system. The particle number size distributions measured downstream from the thermodenuder were different from the ones measured upstream. In addition, the mass concentrations, as estimated from the number size distributions assuming spherical particles and standard density, were lower. This indicates that a large part of the PM was evaporated and then removed in the thermodenuder. The number size distributions of particles with dB > 70 nm obtained downstream from the thermodenuder were similar and independent of the dilution ratio. This indicates that the PM in this size range originated from particles present in the gasifier, that is, it was not formed from condensing inorganic vapours in the particle measurement system, and the condensed tars were removed using the thermodenuder. PM with dB < 70 nm was affected by changes in the dilution ratio, indicating that part of this PM was formed from homogeneous nucleation and condensation downstream from the oven.
64
1.0E+04
1.0E+05
1.0E+06
1.0E+07
1.0E+08
1.0E+09
1.0E+10
1.0E+11
0.01 0.1 1Mobility equivalent diameter (dB) [μm]
dN/d
logd
B [p
artic
les/
cm3 ]
Oven DR450 Oven DR1070 Oven DR1780
Figure 27. Particle number size distributions using three dilution ratios, as measured using the
SMPS and downstream from the thermodenuder at 400°C at the indirect BFB gasifier when
using wood C as fuel.
Even if the fine-mode PM was affected by tar nucleation and condensation, the main part of the tars was removed by the particle measurement system, since the estimated PM mass concentration was lower compared to the total tar concentration. In addition, the dominating coarse mode was representatively characterized without any impact of condensing tars. To solve the problems of incomplete tar adsorption in the bed of granular activated carbon, the function of the bed could be further investigated, including the adsorption characteristics at various temperatures and also the impact of tar concentration and composition. This is not an easy task, since the tar concentration and composition varies with gasifier technique and process conditions. Higher primary dilution ratios, as discussed in section 4.3.1, could facilitate the tar adsorption, but during the measurements at the indirect BFB gasifier high primary dilution ratios were already used. The use of the thermodenuder could also be further investigated if the tar adsorption in the bed of granular activated carbon is incomplete. An adsorbent could be used downstream from the heating section to adsorb the tars that evaporate and prevent PM formation.
65
5. CONCLUSION
In biomass gasification, the solid biomass is converted at high temperature to a product gas rich in carbon monoxide, hydrogen, and methane. After cleaning and upgrading, the product gas can be converted into biofuels such as hydrogen; methanol; DME; and synthetic diesel, gasoline, and natural gas. PM is formed as a contaminant in the gasification process, and the aim of this work was to develop and apply a method for sampling and characterization of PM in the hot product gas. A particle measurement system consisting of a dilution probe combined in series with a bed of granular activated carbon for tar adsorption was developed with the aim of extracting a sample of the hot product gas, without changing the size distribution and composition of the PM. The mass size distribution and concentration, as well as the morphology and elementary composition, of the PM in the size range 10 nm to 10 μm from a BFB gasifier, a CFB gasifier and an indirect BFB gasifier using various types of biomass as fuel were determined. A precise characterization of the various contaminants and their physical states at actual process temperatures would facilitate the design and optimize the function of equipment used for cleaning and upgrading of the product gas. All gasifiers and fuels displayed a bimodal particle mass size distribution with a fine mode in the <0.5 μm size range and a coarse mode in the >0.5 μm size range. Compared with the mass concentration of the coarse mode, the mass concentration of the fine mode was low from all gasifiers. The mass concentration of the fine-mode PM was affected by the ash content in the biomass used as fuel. The evaluation of the results for the fine-mode PM was complicated by condensing potassium chloride for the CFB gasifier when using miscanthus as fuel and by condensing tars for the indirect BFB gasifier when using wood C as fuel.

66
The mass concentration of the coarse-mode PM was higher from the CFB gasifier than from the two BFB gasifiers. The coarse-mode PM from the BFB gasifier was dominated by char. In the CFB gasifier the coarse-mode PM was mainly ash and fragmented bed material, and the concentration varied, depending on the ash content in the biomass used as fuel and the feed of bed material. The coarse-mode PM from the indirect BFB gasifier was mainly ash, probably originating both from the BFB gasifier and the CFB boiler to which the gasifier was connected. The higher char content in PM from the BFB gasifier compared to the other gasifiers was expected, since the char conversion is higher in a CFB gasifier, and in the indirect BFB gasifier the char is recirculated to the CFB boiler with the bed material and is combusted before it is completely gasified. The coarse mode was not affected by particle formation in the measurement system in any of the gasifiers. However, the losses in the measurement system were high for particles with dae > 3 μm. The elementary composition of the fine- and coarse-mode PM from the BFB and CFB gasifiers when using wood A as fuel was similar, while the elementary composition of the PM from the CFB gasifier when using miscanthus and wood B as fuels and from the indirect BFB gasifier when using wood C as fuel varied with particle size. Calcium and magnesium dominated the PM from the BFB and CFB gasifiers when using wood A as fuel, and it originated from the ash and bed material. When using miscanthus as fuel in the CFB gasifier, potassium and chlorine were present in PM of all sizes; however, the coarse mode also contained magnesium, calcium, and iron. PM from the CFB gasifier when using wood B (demolition wood) as fuel showed an elementary composition similar to that when using miscanthus as fuel; however, the share of potassium and chlorine was lower for particles of all sizes, and in addition, zinc and lead were detected in the PM. For the indirect BFB gasifier, silicon was present in considerable concentrations in the coarse-mode PM when using wood C as fuel, possibly originating from the bed material. The coarse-mode PM was also rich in calcium, potassium, and manganese, while the fine mode was rich in potassium and chlorine, and had unexpectedly high concentrations of lead. Biomass gasification has the potential to contribute to the energy system in the future, but the process needs to be optimized to compete with conventional energy from fossil sources. The characterization of PM in the hot product gas from biomass gasification and the understanding of the particle formation mechanisms taking place during biomass gasification are of vital importance when biomass gasification for energy purposes is applied. The result presented in this work has shown that the characteristics of the PM in the hot product gas are affected by the type of gasifier, the bed material, and the biomass used as fuel. The important particle formation mechanisms
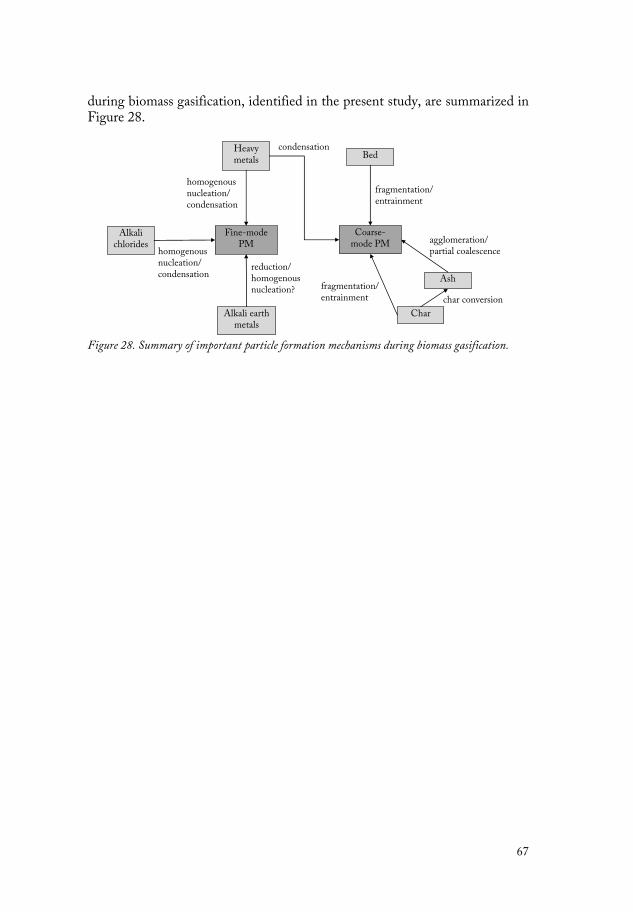
67
during biomass gasification, identified in the present study, are summarized in Figure 28.
Char
Ash
Bed
Coarse-mode PM
Fine-modePM
fragmentation/entrainment
fragmentation/entrainment char conversion
agglomeration/partial coalescence
Alkali chlorides
Alkali earthmetals
reduction/homogenousnucleation?
homogenousnucleation/condensation
Heavymetals
homogenousnucleation/condensation
condensation
Figure 28. Summary of important particle formation mechanisms during biomass gasification.

68

69
FUTURE WORK
In this work, a new method for sampling and characterization of PM in the hot product gas from biomass gasification was developed and applied. Results on particle mass size distributions, concentrations, and morphologic and elementary analysis of the PM were presented. However, there is a potential for improvements of the particle measurement system and some suggestions for future work are presented below.
• The dilution probe could be further developed to be able to remove
higher concentrations of inorganic vapours and prevent particle formation.
• The function of the bed of granular activated carbon could be further investigated, for example, regarding adsorption characteristics at various temperatures and tar concentrations and compositions.
• The losses of PM in the measurement system could be further studied to increase the accuracy of the results. In this work the losses in the bed of granular activated carbon and thermodenuder was quantified at ambient conditions. But losses occur also in the dilution probe and ejector diluter, and when sampling hot gas, there will be an effect of thermophoretic losses.
• The use of a denuder for tar adsorption was investigated in Paper I,
but was never tested on real product gas from biomass gasification. In combination with higher dilution ratios in the dilution probe (lower tar concentrations), the denuder might be sufficient for tar adsorption.
• So far, particle measurements have only been performed at
atmospheric gasifiers. Pressurized gasifiers are advantageous for the production of biofuels and PM characterization at high pressure requires that the measurement system is modified.

70
• In this work, results from different gasifiers and fuels are presented;
however, the focus was not on a variation in process parameters, which would increase the understanding of the particle formation mechanisms during biomass gasification.
71
ACKNOWLEDGEMENTS
I would like to express my greatest gratitude to my main (and only) supervisor, Michael Strand, for sharing his knowledge and experience. Without you this work would have been much more difficult, if not to say impossible. I am also grateful to all colleagues at the Linnæus University in Växjö for assistance and friendship, no one mentioned, no one forgotten. The work with this thesis has included co-operation with several companies, universities and research institutions in Sweden and in Europe among them TPS Termiska Processer AB, Forschungszentrum Jülich, Delft Technical University, S.E.P. Scandinavian Energy Project, and Chalmers University of Technology. To my friends: thanks for all your love and support. To my family, Mum and Rolf, Sven and Martina: you mean the world to me!
Dad, I wish you were here. Albin and Joar, you are the loves of my life! Joar, continue to explore the world! Financial support through the European Commission (EC) 6th Framework Programme (CHRISGAS Project number SES6-CT-2004-502587) and the Swedish Energy Agency is gratefully acknowledged.

72
73
SUMMARY OF PAPERS
I. Method for high-temperature particle sampling in tar-rich gases from the thermochemical conversion of biomass Eva Gustafsson and Michael Strand Energy & Fuels, 2010:24:2042-2051 In this study a method for high-temperature particle sampling in tar-rich gases from the thermochemical conversion of biomass was developed and tested. Both a bed of granular activated carbon and a denuder were used for tar adsorption. First, the transport efficiency of particles was determined both theoretically and experimentally using a K2SO4 reference aerosol, and the losses were found to be smaller in the denuder than in the bed of granular activated carbon. The adsorption capacity was then tested using a model aerosol of K2SO4 and diethyl-hexyl-sebacate (DEHS). The adsorption capacity of the bed of granular activated carbon was found to be higher than that of the denuder. The adsorption capacity was also tested using a model aerosol of K2SO4 particles and tar-rich gas from a laboratory-scale gasifier. As for DEHS, the result indicated that the capacity of the bed of granular activated carbon was higher than that of the denuder; it was also found that the adsorption was incomplete when the tar concentrations increased. In addition, the bed of granular activated carbon was successfully tested during experiments using a 100 kW circulating fluidized bed gasifier. The results indicate that the tar adsorption capacity is dependent not only on the total tar concentration but also on the tar composition.
II. Physical and chemical characterization of aerosol particles formed during the thermochemical conversion of wood pellets using a bubbling fluidized bed gasifier Eva Gustafsson, Michael Strand, and Mehri Sanati Energy & Fuels, 2007:21:3660-3667 The present study aimed to characterize, both physically and chemically, aerosol particles formed during the steam- and oxygen-blown biomass

74
gasification of wood pellets in an atmospheric 20 kW bubbling fluidized bed gasifier. The product gas from the gasifier was sampled upstream from the cyclone at 500°C. The particle number size distribution determined using a scanning mobility particle sizer was bimodal, with modes at 20–30 and 400 nm, mobility equivalent diameters (dB). The total mean number concentration of particles with dB = 15–670 nm was approximately 7·105
particles/cm3; however, the concentration of particles with dB < 80 nm fluctuated. The particle mass size distribution determined using a low-pressure impactor (LPI) was bimodal, and the total mass concentration of particles with aerodynamic diameters (dae) < 5 μm was 310 mg/m3. Microscopy analysis of particulate matter on the lower LPI stages, expected to sample particles with dae < 0.4 μm, revealed structures approximately 10 μm in physical particle diameter. In addition, the mass concentration of particles with dae < 0.5 μm determined using a LPI was higher than that estimated using a SMPS, possibly because of the bounce-off or re-entrainment of coarser particles from higher LPI stages. Elementary analysis of the particulate matter indicated that it was dominated by carbon. The collected particulate matter was stable when heated in nitrogen to 500°C, indicating that the carbon was not present as volatile tars but more likely as char or soot. The particulate matter collected on all LPI stages contained a small percentage of ash (noncarbonaceous inorganic material), with calcium as the dominant element.
III. Characterization of particulate matter from a circulating fluidized bed gasifier using different types of biomass Eva Gustafsson, Leteng Lin, Eleonora Simeone, Marcin Siedlecki, Michael Strand Manuscript, submitted to Energy & Fuels in February 2011 This study characterized the particulate matter (PM) formed during steam and oxygen gasification of biomass in a circulating fluidized bed gasifier at atmospheric pressure using calcined magnesite as bed material. Three different types of biomass were used: wood pellets of clean wood (wood A); miscanthus pellets, an energy crop; and wood pellets of demolition wood (wood B). Two systems were used to sample the PM, and both on- and offline analysis techniques were used to characterize the PM. Four different instruments were used to measure the particle mass size distribution and concentration in the size range 0.01–30 μm. The agreement between the instruments was good, and the particle mass size distributions upstream of any cleaning device were bimodal, dominated by the coarse mode (>0.5 μm). The particle mass concentration of the fine mode (<0.5 μm) varied, depending on which biomass was used as fuel. The variation in particle mass concentration of the coarse mode was less, and was due to different loads of bed material and various ash contents in the biomass. The morphological analysis of the PM showed that the char content was low and that the PM was dominated by ash and bed

75
material. The coarse-mode PM was rich in magnesium and calcium, while potassium and chlorine were prevalent in the fine-mode PM. The elementary composition of the PM varied between the different types of biomass used and heavy metals, that is, zinc and lead, were detected in low concentrations when using wood B as fuel.
IV. Characterization of particulate matter in the hot product gas from indirect steam bubbling fluidized bed gasification of biomass Eva Gustafsson, Leteng Lin, Martin Seemann, Jennie Rodin, and Michael Strand Energy & Fuels, 2011, doi:10.1021/ef101710u This study characterized the particulate matter (PM) formed during indirect steam bubbling fluidized bed gasification of wood pellets at atmospheric pressure. A system including a dilution probe, a bed of granular activated carbon, and a thermodenuder was used to sample the PM at high temperature with the aim of separating it from condensing inorganic vapours and tars. The particle mass size distribution was bimodal with a fine mode in the <0.5-μm size range and a dominating coarse mode in the >0.5-μm size range. The coarse mode was representatively characterized, but condensing inorganic vapours and tars complicated the evaluation of the results for the fine-mode PM. The morphological analysis of the PM indicated that the char content was low. The inorganic fraction was dominated by potassium and chlorine for fine-mode PM and calcium and silicon for coarse-mode PM.
V. Characterization of particulate matter in the hot product gas from atmospheric fluidized bed biomass gasifiers Eva Gustafsson, Leteng Lin, and Michael Strand Biomass & Bioenergy, 2011, doi:10.1016/j.biombioe.2011.02.053 This study compares the characteristics of particulate matter (PM) in the hot product gas from three different atmospheric fluidized bed biomass gasifiers: a bubbling fluidized bed (BFB) gasifier, a circulating fluidized bed (CFB) gasifier, and an indirect BFB gasifier (the latter integrated with a CFB boiler). All gasifiers displayed a bimodal particle mass size distribution with a fine mode in the <0.5 μm size range and a coarse mode in the >0.5 μm size range. Compared with the mass concentration of the coarse mode the mass concentration of the fine mode was low in all gasifiers. For both the BFB and CFB gasifiers the fine-mode PM had a similar inorganic composition, indicating an origin from the ash and the magnesite bed material used in both gasifiers. In the indirect BFB gasifier the fine-mode PM was instead dominated by potassium and chlorine, and the tar fraction properties evoked tar condensation in the sampling system that affected mainly the fine-mode PM. The coarse-mode PM in the BFB gasifier was dominated by char

76
fragments abraded from the pyrolyzed wood pellets. In the CFB gasifier the coarse-mode PM was mainly ash and magnesite bed material that passed through the process cyclone. In the indirect BFB gasifier the coarse-mode PM was mainly ash, probably originating both from the BFB gasifier and the CFB boiler.
Author’s contribution I. The author was responsible for the planning and execution of the experimental work, analysis of results, and writing of the manuscript. The raw gas and tar analyses were not performed by the author. II. The author was responsible for the planning and execution of the experimental work, analysis of results, and writing of the manuscript. The raw gas and tar analyses, as well as the morphological and elementary analyses of the PM, were not performed by the author. III. The author was responsible for the planning and execution of the experimental work regarding the second particle measurement system and analysis of results from the second particle measurement system. The author was responsible for writing of the manuscript. The morphological and elementary analyses of the PM were not performed by the author. IV. The author was responsible for the planning and execution of the experimental work, analysis of results, and writing of the manuscript. The raw gas and tar analyses, as well as the morphological and elementary analyses of the PM, were not performed by the author. V. The author was responsible for the planning and execution of the experimental work, analysis of results, and writing of the manuscript. The raw gas and tar analyses were not performed by the author.
Papers not included in the thesis
Journal papers Lin, L.; Gustafsson, E.; Strand, M., Aerosol-based method for investigating biomass char reactivity at high temperatures. Combustion and Flame 2011, doi:10.1016/j.combustflame.2010.11.015.

77
Pagels, J.; Gudmundsson, A.; Gustafsson, E.; Asking, L.; Bohgard, M., Evaluation of aerodynamic particle sizer and electrical low-pressure impactor for unimodal and bimodal mass-weighted size distributions. Aerosol Science and Technology 2005, 39, (9), 871-887.
Conference papers Gustafsson, E.; Lin, L.; Strand, M., Characteristics of aerosol particles from steam and oxygen gasification of various biofuels. In 18th European Biomass Conference and Exhibition, Lyon, France, 2010; pp 900-902. Lin, L.; Gustafsson, E.; Strand, M., High-temperature kinetics of fine biomass char particles in air and CO2. In 18th European Biomass Conference and Exhibition, Lyon, France, 2010; pp 797-801. Gustafsson, E.; Lin, L.; Strand, M., Sampling of particles from biomass gasification: A method for testing the tar adsorption capacity of a bed of granular activated carbon. In Bioenergy 2009, Jyväskylä, Finland, 2009; pp 645-649. Lin, L.; Gustafsson, E.; Strand, M., Investigation on the oxidation kinetics of biomass char particles. In Bioenergy 2009, Jyväskylä, Finland, 2009; pp 933-939. Gustafsson, E.; Strand, M., Further development and testing of a method for characterization of particles from biomass gasification using a laboratory scale gasifier. In 16th European Biomass Conference and Exhibition, Valencia, Spain, 2008; pp 1037-1040. Gustafsson, E.; Strand, M.; Sanati, M., Measurement of aerosol particles from steam and oxygen blown gasification of wood pellets in a 20 kW atmospheric bubbling fluidised bed (ABFB) gasifier. In 15th European Biomass Conference and Exhibition, Berlin, Germany, 2007; pp 1128-1130. Einvall, J.; Albertazzi, S.; Hulteberg, C.; Basile, F.; Larsson, A.-C.; Gustafsson, E.; Brandin, J.; Trifirò, F.; Sanati, M., Impact of fly ash from biomass gasification on deactivation of reforming catalysts. In 12th Nordic Symposium on Catalysis, Trondheim, Norway, 2006; p 132. Pagels, J.; Gustafsson, E.; Gudmundsson, A.; Asking, L.; Dahl, A.; Bohgard, M., Intercomparision of ELPI and APS for coarse, fine and bimodal particle mass weighted size-distributions. In PM 2003, Pittsburgh, USA, 2003.

78
Pagels, J.; Gustafsson, E.; Gudmundsson, A.; Asking, L.; Dahl, A.; Bohgard, M., Intercomparision of ELPI, APS and DLPI for coarse, fine and bimodal size-distributions. In NOSA 2002, Oslo, Norway, 2002.

79
REFERENCES
1. European Commission, EU action against climate change. http://ec.europa.eu/climateaction/index_en.htm (2011-03-15).
2. Regeringskansliet, Nationellt klimatarbete. http://www.regeringen.se/sb/d/8756 (2011-03-15).
3. Statens energimyndighet, Energiläget 2010; 2010.
4. UNFCCC - United Nations Framework Convention on Climate Change, Clarifications on definition of biomass and consideration of changes in carbon pools due to a CDM project activity, EB-20, Annex 8; 2005.
5. Basu, P., Biomass gasification and pyrolysis - Practical design and theory. Academic Press: Burlington, MA, 2010.
6. van Loo, S.; Koppejan, J., Eds. Handbook of biomass combustion and co-Firing. Twente University Press, 2008.
7. Kitani, O.; Hall, C. W., Biomass handbook. Gordon and Breach Science Publishers: New York, 1989.
8. McKendry, P., Energy production from biomass (part 1): Overview of biomass. Bioresource Technology 2002, 83, (1), 37-46.
9. Jenkins, B. M.; Baxter, L. L.; Miles, T. R., Jr.; Miles, T. R., Combustion properties of biomass. Fuel Processing Technology 1998, 54, (1-3), 17-46.
10. Kaltschmitt, M.; Rösch, C.; Dinkelbach, L.; (eds.), Biomass gasification in Europe. 1998.
11. Bridgwater, A. V., The technical and economic feasibility of biomass gasification for power generation. Fuel 1995, 74, (5), 631-653.
12. Knoef, H. A. M., Ed. Handbook biomass gasification. BTG Biomass Technology Group: Enschede, 2005.
13. Huber, G. W.; Iborra, S.; Corma, A., Synthesis of transportation fuels from biomass: Chemistry, catalysts, and engineering. Chemical Reviews 2006, 106, (9), 4044-4098.
14. Corella, J.; Toledo, J. M.; Molina, G., A review on dual fluidized-bed biomass gasifiers. Industrial & Engineering Chemistry Research 2007, 46, (21), 6831-6839.
15. Alauddin, Z. A. B. Z.; Lahijani, P.; Mohammadi, M.; Mohamed, A. R., Gasification of lignocellulosic biomass in fluidized beds for renewable energy development: A review. Renewable and Sustainable Energy Reviews 2010, 14, (9), 2852-2862.
16. Baxter, L. L.; Miles, T. R.; Miles, T. R., Jr.; Jenkins, B. M.; Milne, T.; Dayton, D.; Bryers, R. W.; Oden, L. L., Behavior of inorganic material in biomass-fired power

80
boilers: Field and laboratory experiences. Fuel Processing Technology 1998, 54, (1-3), 47-78.
17. Öhman, M.; Nordin, A.; Skrifvars, B.-J.; Backman, R.; Hupa, M., Bed agglomeration characteristics during fluidized bed combustion of biomass fuels. Energy & Fuels 2000, 14, (1), 169-178.
18. Nuutinen, L. H.; Tiainen, M. S.; Virtanen, M. E.; Enestam, S. H.; Laitinen, R. S., Coating layers on bed particles during biomass fuel combustion in fluidized-bed boilers. Energy & Fuels 2004, 18, (1), 127-139.
19. Brus, E.; Öhman, M.; Nordin, A., Mechanisms of bed agglomeration during fluidized-bed combustion of biomass fuels. Energy & Fuels 2005, 19, (3), 825-832.
20. Öhman, M.; Pommer, L.; Nordin, A., Bed agglomeration characteristics and mechanisms during gasification and combustion of biomass fuels. Energy & Fuels 2005, 19, (4), 1742-1748.
21. Bartels, M.; Lin, W.; Nijenhuis, J.; Kapteijn, F.; van Ommen, J. R., Agglomeration in fluidized beds at high temperatures: Mechanisms, detection and prevention. Progress in Energy and Combustion Science 2008, 34, (5), 633-666.
22. Ergudenler, A.; Ghaly, A. E., Agglomeration of alumina sand in a fluidized bed straw gasifier at elevated temperatures. Bioresource Technology 1993, 43, (3), 259-268.
23. Dayton, D. C.; Jenkins, B. M.; Turn, S. Q.; Bakker, R. R.; Williams, R. B.; Belle-Oudry, D.; Hill, L. M., Release of inorganic constituents from leached biomass during thermal conversion. Energy & Fuels 1999, 13, (4), 860-870.
24. Davidsson, K. O.; Korsgren, J. G.; Pettersson, J. B. C.; Jäglid, U., The effects of fuel washing techniques on alkali release from biomass. Fuel 2002, 81, (2), 137-142.
25. Fahmi, R.; Bridgwater, A. V.; Darvell, L. I.; Jones, J. M.; Yates, N.; Thain, S.; Donnison, I. S., The effect of alkali metals on combustion and pyrolysis of Lolium and Festuca grasses, switchgrass and willow. Fuel 2007, 86, (10-11), 1560-1569.
26. Li, C.; Suzuki, K., Tar property, analysis, reforming mechanism and model for biomass gasification - An overview. Renewable and Sustainable Energy Reviews 2009, 13, (3), 594-604.
27. Evans, R. J.; Milne, T. A., Molecular characterization of the pyrolysis of biomass. 1. Fundamentals. Energy & Fuels 1987, 1, (2), 123-137.
28. Morf, P.; Hasler, P.; Nussbaumer, T., Mechanisms and kinetics of homogeneous secondary reactions of tar from continuous pyrolysis of wood chips. Fuel 2002, 81, (7), 843-853.
29. Evans, R. J.; Milne, T. A., Chemistry of tar formation and maturation in the thermochemical conversion of biomass. In Developments in thermochemical biomass conversion, Bridgwater, A. V.; Boocock, D. G. B., Eds. Blackie Academic & Professional: 1997; Vol. 2, pp 803-816.
30. Technical Committee CEN/TC 143 "Measurement of organic contaminants (tar) in biomass producer gases" Biomass Gasification - Tar and Particles in Product Gases - Sampling and Analysis, Document TC 143WI CSC 03002; 2005.
31. Brage, C.; Yu, Q.; Chen, G.; Sjöström, K., Use of amino phase adsorbent for biomass tar sampling and separation. Fuel 1997, 76, (2), 137-142.
32. Moersch, O.; Spliethoff, H.; Hein, K. R. G., Tar quantification with a new online analyzing method. Biomass and Bioenergy 2000, 18, (1), 79-86.
33. Karellas, S.; Karl, J., Analysis of the product gas from biomass gasification by means of laser spectroscopy. Optics and Lasers in Engineering 2007, 45, (9), 935-946.
81
34. Milne, T. A.; Evans, R. J.; Abatzoglou, N. Biomass gasifier tars: Their nature, formation and conversion; National Renewable Energy Laboratory: Golden, Colorado, USA, 1998.
35. ECN - Energy research Centre of the Netherlands Thersites - the ECN tar dew point site. http://www.thersites.nl (2011-04-08).
36. Hinds, W. C., Aerosol technology: properties, behavior, and measurement of airborne particles. 2. ed.; Wiley: New York, 1999.
37. Dekati Ltd DLPI user manual, ver. 3.62; 2010.
38. Lighty, J. S.; Veranth, J. M.; Sarofim, A. F., Combustion aerosols: Factors governing their size and composition and implications to human health. Journal of the Air and Waste Management Association 2000, 50, (9), 1565-1618.
39. Jöller, M.; Brunner, T.; Obernberger, I., Modeling of aerosol formation during biomass combustion in grate furnaces and comparison with measurements. Energy & Fuels 2005, 19, (1), 311-323.
40. Björkman, E.; Strömberg, B., Release of chlorine from biomass at pyrolysis and gasification conditions. Energy & Fuels 1997, 11, (5), 1026-1032.
41. Olsson, J. G.; Jäglid, U.; Pettersson, J. B. C.; Hald, P., Alkali metal emission during pyrolysis of biomass. Energy & Fuels 1997, 11, (4), 779-784.
42. Knudsen, J. N.; Jensen, P. A.; Dam-Johansen, K., Transformation and release to the gas phase of Cl, K, and S during combustion of annual biomass. Energy & Fuels 2004, 18, (5), 1385-1399.
43. Christensen, K. A.; Stenholm, M.; Livbjerg, H., Formation of submicron aerosol particles, HCl and SO2 in straw-fired boilers. Journal of Aerosol Science 1998, 29, (4), 421-444.
44. Vervaeke, P.; Tack, F. M. G.; Navez, F.; Martin, J.; Verloo, M. G.; Lust, N., Fate of heavy metals during fixed bed downdraft gasification of willow wood harvested from contaminated sites. Biomass and Bioenergy 2006, 30, (1), 58-65.
45. Turn, S. Q.; Kinoshita, C. M.; Ishimura, D. M.; Zhou, J., The fate of inorganic constituents of biomass in fluidized bed gasification. Fuel 1998, 77, (3), 135-146.
46. Lind, T.; Valmari, T.; Kauppinen, E.; Nilsson, K.; Sfiris, G.; Maenhaut, W., Ash formation mechanisms during combustion of wood in circulating fluidized beds. Proceedings of the Combustion Institute 2000, 28, (2), 2287-2295.
47. Obernberger, I.; Brunner, T.; Jöller, M., Characterisation and formation of aerosols and fly-ashes from fixed-bed biomass combustion. In Aerosols from biomass combustion, Nussbaumer, T., Ed. Zürich, Switzerland, 2001.
48. Neville, M.; Quann, R. J.; Haynes, B. S.; Sarofim, A. F., Vaporization and condensation of mineral matter during pulverized coal combustion. Symposium (International) on Combustion 1981, 18, (1), 1267-1274.
49. Glassman, I., Combustion. 3. ed.; Academic Press: San Diego, 1996.
50. Frenklach, M., Reaction mechanism of soot formation in flames. Physical Chemistry Chemical Physics 2002, 4, 2028-2037.
51. Fitzpatrick, E. M.; Ross, A. B.; Bates, J.; Andrews, G.; Jones, J. M.; Phylaktou, H.; Pourkashanian, M.; Williams, A., Emission of oxygenated species from the combustion of pine wood and its relation to soot formation. Process Safety and Environmental Protection 2007, 85, (5 B), 430-440.

82
52. Hindsgaul, C.; Schramm, J.; Gratz, L.; Henriksen, U.; Bentzen, J. D., Physical and chemical characterization of particles in producer gas from wood chips. Bioresource Technology 2000, 73, (2), 147-155.
53. Scala, F.; Chirone, R.; Salatino, P., Combustion and attrition of biomass chars in a fluidized bed. Energy & Fuels 2006, 20, (1), 91-102.
54. Wornat, M. J.; Hurt, R. H.; Yang, N. Y. C.; Headley, T. J., Structural and compositional transformations of biomass chars during combustion. Combustion and Flame 1995, 100, (1-2), 131-143.
55. Lind, T.; Valmari, T.; Kauppinen, E. I.; Sfiris, G.; Nilsson, K.; Maenhaut, W., Volatilization of the heavy metals during circulating fluidized bed combustion of forest residue. Environmental Science and Technology 1999, 33, (3), 496-502.
56. Strand, M.; Bohgard, M.; Swietlicki, E.; Gharibi, A.; Sanati, M., Laboratory and field test of a sampling method for characterization of combustion aerosols at high temperatures. Aerosol Science and Technology 2004, 38, (8), 757-765.
57. Wiinikka, H.; Gebart, R.; Boman, C.; Boström, D.; Nordin, A.; Öhman, M., High-temperature aerosol formation in wood pellets flames: Spatially resolved measurements. Combustion and Flame 2006, 147, (4), 278-293.
58. Jimenez, S.; Ballester, J., A comparative study of different methods for the sampling of high temperature combustion aerosols. Aerosol Science and Technology 2005, 39, (9), 811-821.
59. Valmari, T.; Kauppinen, E. I.; Kurkela, J.; Jokiniemi, J. K.; Sfiris, G.; Revitzer, H., Fly ash formation and deposition during fluidized bed combustion of willow. Journal of Aerosol Science 1998, 29, (4), 445-459.
60. Valmari, T.; Lind, T. M.; Kauppinen, E. I.; Sfiris, G.; Nilsson, K.; Maenhaut, W., Field study on ash behavior during circulating fluidized-bed combustion of biomass. 1. Ash formation. Energy & Fuels 1999, 13, (2), 379-389.
61. Hasler, P.; Nussbaumer, T., Particle size distribution of the fly ash from biomass gasification. In 10th European biomass conference and technology exhibition: biomass for energy and industry, Kopetz, H., Ed. Würzburg, Germany, 1998; pp 1623-1625.
62. van der Nat, K. V.; Siedlecki, M.; de Jong, W.; Woudstra, N.; Verkooijen, A. H. M., Particle size characterization of particles present in the producer gas of a steam and oxygen blown biomass circulating fluidized bed gasifier. In 14th European biomass conference and exhibition: Biomass for energy, industry and climate protection, Sjunnesson, L., Carrasco, J. E., Helm, P., Grassi, A., Eds. Paris, France, 2005; pp 642-645.
63. Simeone, E.; Nacken, M.; Haag, W.; Heidenreich, S.; Jong, W. d., Filtration performance at high temperatures and analysis of ceramic filter elements during biomass gasification. Biomass and Bioenergy 2011 (submitted).
64. Gabra, M.; Pettersson, E.; Backman, R.; Kjellström, B., Evaluation of cyclone gasifier performance for gasification of sugar cane residue - Part 1: Gasification of bagasse. Biomass and Bioenergy 2001, 21, (5), 351-369.
65. Yamazaki, T.; Kozu, H.; Yamagata, S.; Murao, N.; Ohta, S.; Shiya, S.; Ohba, T., Effect of superficial velocity on tar from downdraft gasification of biomass. Energy & Fuels 2005, 19, (3), 1186-1191.
66. Cheremisinoff, N. P.; Cheremisinoff, P. N., Carbon adsorption for pollution control. PTR Prentice Hall: Englewood Cliffs, N.J., 1993.
67. Mastral, A. M.; Garcia, T.; Callen, M. S.; Navarro, M. V.; Galban, J., Removal of naphthalene, phenanthrene, and pyrene by sorbents from hot gas. Environmental Science and Technology 2001, 35, (11), 2395-2400.
83
68. Mastral, A. M.; García, T.; Callén, M. S.; Murillo, R.; Navarro, M. V.; López, J. M., Sorbent characteristics influence on the adsorption of PAC: I. PAH adsorption with the same number of rings. Fuel Processing Technology 2002, 77-78, 373-379.
69. Mastral, A. M.; Garcia, T.; Murillo, R.; Callen, M. S.; Lopez, J. M.; Navarro, M. V., Measurements of polycyclic aromatic hydrocarbon adsorption on activated carbons at very low concentrations. Industrial and Engineering Chemistry Research 2003, 42, (1), 155-161.
70. Mastral, A. M.; Garcia, T.; Murillo, R.; Callen, M. S.; Lopez, J. M.; Navarro, M. V.; Galban, J., Study of the adsorption of polyaromatic hydrocarbon binary mixtures on carbon materials by gas-phase fluorescence detection. Energy & Fuels 2003, 17, (3), 669-676.
71. Zhen-Shu, L., Control of PAHs from Incineration by Activated Carbon Fibers. Journal of Environmental Engineering 2006, 132, (5), 463-469.
72. Wehner, B.; Philippin, S.; Wiedensohler, A., Design and calibration of a thermodenuder with an improved heating unit to measure the size-dependent volatile fraction of aerosol particles. Journal of Aerosol Science 2002, 33, (7), 1087-1093.
73. Spurny, K. R., Analytical chemistry of aerosols. Lewis: Boca Raton, 1999.
74. Burtscher, H.; Baltensperger, U.; Bukowiecki, N.; Cohn, P.; Huglin, C.; Mohr, M.; Matter, U.; Nyeki, S.; Schmatloch, V.; Streit, N.; Weingartner, E., Separation of volatile and non-volatile aerosol fractions by thermodesorption: Instrumental development and applications. Journal of Aerosol Science 2001, 32, (4), 427-442.
75. Engelen, K.; Zhang, Y.; Draelants, D. J.; Baron, G. V., A novel catalytic filter for tar removal from biomass gasification gas: Improvement of the catalytic activity in presence of H2S. Chemical Engineering Science 2003, 58, (3-6), 665-670.
76. Rapagnà, S.; Gallucci, K.; Di Marcello, M.; Matt, M.; Nacken, M.; Heidenreich, S.; Foscolo, P. U., Gas cleaning, gas conditioning and tar abatement by means of a catalytic filter candle in a biomass fluidized-bed gasifier. Bioresource Technology 2010, 101, (18), 7123-7130.
77. Han, J.; Kim, H., The reduction and control technology of tar during biomass gasification/pyrolysis: An overview. Renewable and Sustainable Energy Reviews 2008, 12, (2), 397-416.
78. Sutton, D.; Kelleher, B.; Ross, J. R. H., Review of literature on catalysts for biomass gasification. Fuel Processing Technology 2001, 73, (3), 155-173.
79. Basu, P., Combustion and gasification in fluidized beds. Taylor & Francis Group: Boca Raton, 2006.
80. Devi, L.; Ptasinski, K. J.; Janssen, F. J. J. G., A review of the primary measures for tar elimination in biomass gasification processes. Biomass and Bioenergy 2002, 24, (2), 125-140.
81. Forzatti, P.; Lietti, L., Catalyst deactivation. Catalysis Today 1999, 52, (2-3), 165-181.
82. Dayton, D. C. A review of the literature on catalytic biomass tar destruction; National Renewable Energy Laboratory: Golden, Colorado, USA, 2002.
83. Spath, P. L.; Dayton, D. C. Preliminary screening - technical and economic assessment of synthesis gas fto fuels and chemicals with emphasis on the potential for biomass-derived syngas; National Renewable Energy Laboratory: Golden, Colorado, USA, 2003.
84. Zhang, W., Automotive fuels from biomass via gasification. Fuel Processing Technology 2010, 91, (8), 866-876.

84
85. Linnæus University, CHRISGAS – fuels from biomass. http://lnu.se/research-groups/chrisgas?l=en (2011-04-08)
86. Albertazzi, S.; Basile, F.; Brandin, J.; Einvall, J.; Hulteberg, C.; Fornasari, G.; Rosetti, V.; Sanati, M.; Trifiro, F.; Vaccari, A., The technical feasibility of biomass gasification for hydrogen production. Catalysis Today 2005, 106, 297-300.
87. Porbatzki, D.; Müller, M., Mass spectrometric investigations on the release of inorganic species during gasification of wood, straw, and miscanthus. In 15th European Biomass Conference & Exhibition, Berlin, Germany, 2007; pp 1216-1220.
88. Porbatzki, D. Freisetzung anorganischer Spezies bei der thermochemischen Umwandlung biogener Festbrennstoffe. Rheinisch-Westfälischen Technischen Hochschule, Aachen, 2008.
89. Siedlecki, M.; Nieuwstraten, R.; Simeone, E.; de Jong, W.; Verkooijen, A. H. M., Effect of magnesite as bed material in a 100 kWth steam and oxygen blown circulating fluidized-bed biomass gasifier on gas composition and tar formation. Energy & Fuels 2009, 23, (11), 5643-5654.
90. Thunman, H.; Seemann, M. C., First experiences with the new Chalmers gasifier. In 20th International Conference on Fluidized Bed Combustion, Yue G., Zhang, H., Zhao, C., Luo, Z., Eds. Xi’an, China, 2010; pp 659-663.
91. Dekati Ltd Dekati(R) Diluter, User manual, ver 5.0; 2010.
92. TSI Inc Model 3936 SMPS (Scanning mobility particle sizer), Instruction manual, P/N 1933796, Revision H; 2003.
93. TSI Inc Model 3321 Aerodynamic particle sizer spectrometer, Instruction manual, P/N 1930092, Revision E.; 2004.
94. Skoog, D. A.; Holler, F. J.; Nieman, T. A., Principles of instrumental analysis. 5 ed.; Saunders College Publishing: 1998.
95. Johansson, S. A. E.; Campbell, J. L.; Malmqvist, K. G., Particle-induced X-ray emission specrometry (PIXE). John Wiley & Sons, Inc.: New York, 1995.