characterization of photodetectors using a …s2is.org/issues/v9/n2/papers/paper18.pdf · the...
TRANSCRIPT
J.-S. Botero V., F.-E. López G., J.-F. Vargas B., CHARACTERIZATION OF PHOTODECTORS USING A MONOCHROMATOR AND A BROADBAND LIGHT SOURCE IN THE XYZ COLOR SPACE
752
CHARACTERIZATION OF PHOTODECTORS USING A
MONOCHROMATOR AND A BROADBAND LIGHT
SOURCE IN THE XYZ COLOR SPACE J.-S. Botero V.1,*, F.-E. López G.1 and J.-F. Vargas B.2
1Grupo de investigación AEyCC,
Facultad de Ingenierías, Instituto Tecnológico Metropolitano ITM,
Carrera 31 No. 54-10, Medellín, Colombia. 2Grupo de Investigación SISTEMIC,
Facultad de Ingeniería, Universidad de Antioquia UdeA
Calle 70 No. 52-21, Medellín, Colombia
E-mail: [email protected], [email protected], [email protected]
Submitted: Jan. 5, 2016 Accepted: Mar. 31, 2016 Published: June 1, 2016
Abstract- Photodetectors are sensors, which respond to the electromagnetic radiation of the spectrum. Their
spectral response depends on many factors of the manufacturing process, e.g. the type of diode that is used
or, in some cases, the optical elements that are added to limit the response band. In this paper, we propose
an experimental methodology to obtain the spectral response of a photodetector by constructing the
characteristic curve using the monochromatic response. For this purpose, we use a broadband source as
input of the monochromator to vary the wavelength each five nm. The characteristic curves of one
commercial color sensor were obtained (including the loss) using the output ratio of the monochromator.
Via the numerical expression of the response curve, it is possible to model the actual response of the
photodetectors to known or simulated spectra of electromagnetic radiation, and thus to generalize
photometric measurements. Previously we have demonstrated the importance of obtaining such
measurements to study light sources. Finally, this newly developed method helps studying the behavior of a
photodetector in detail; hence, it enables the derivation of photometric measurements from known data or
simulations.
Index terms: Photodetector, monochromator, broadband light sources, XYZ color space, RGB sensors.
INTERNATIONAL JOURNAL ON SMART SENSING AND INTELLIGENT SYSTEMS VOL. 9, NO. 2, JUNE 2016
753
I. INTRODUCTION
Photodetectors are sensors that convert electromagnetic energy into an electrical signal. Its
function is to show a particular spectral region as output. They are almost always made of
semiconductors that are responsive to photo-excitation and include optical filters to limit the
response region among other methods of manufacture [1–3]. The visible light is a small segment
of the electromagnetic spectrum comprised of wavelengths between 380 nm and 780 nm.
Nowadays its research is one of the most important fields worldwide; its influence on our
behavior has been widely demonstrated [4–11] and the effect on multiple biological systems
such as plants [12–14] and stem cells [15,16], or on food quality [17] is studied. The interest in
the study of new applications [18] and the difficulty in taking measurements, which occurs in
some cases, have sparked interest in novel models to perform experiments, and to develop light
control applications more accurately and at a lower cost. The applications for photodetectors are
manifold, the most common are varying photometric measurements [19–21], applications where
infrared radiation is utilized [22–26] and where color measurement is required [27–33],
intelligent lighting control [19,34–36], the derivation of measures such as CCT (Correlated Color
Temperature) [37], the estimation of the CRI (Color Rendering Index) [38] and the determination
of power measurements in more particular cases such as PAR (Photosynthetically Active
Radiation) [39]. However, the response of low-cost photodetectors is not adjusted to the referred
measurements and approximations or transformations are necessary, i.e. calibration models
[27,32,33,40] that allow interpreting the output data as a reliable measure. However, this
procedure involves extensive experimental work, which is usually done by taking one part of the
sample space with known characteristics that allows obtaining the inverse model of the
photodetectors. Said inverse model is difficult to generalize, due to the impossibility to determine
the full sample space, as in the characterization of light sources [37,38], where it is not possible
to include all possible and purchasable light sources while performing the training of the sensor.
The same effect occurs when color charts or nonstandard light sources are used for calibrating the
color sensors. A further problem is that the adaption of inverse models again requires
experimental procedure.
In this paper, a model was developed and implemented to obtain the characteristic curve of low-
cost photodetectors using a broadband light source, a monochromator and a high-resolution
J.-S. Botero V., F.-E. López G., J.-F. Vargas B., CHARACTERIZATION OF PHOTODECTORS USING A MONOCHROMATOR AND A BROADBAND LIGHT SOURCE IN THE XYZ COLOR SPACE
754
spectrometer. Initially the light passes the monochromator and splits into two beams. One of
them goes to the spectrometer to measure the power and the other one goes to the photodetector
to assess the value of the output signal. This procedure is repeated varying the output wavelength
of the monochromator in steps of 10 nm in the visible region absorption spectrum. For each
photodetector 41 points are obtained, and then adjusted to compensate the losses occurring in the
optical fiber. The monochromator, as well as the source response, are not completely flat;
therefore, the beam is split and measured in the spectrometer. The adjusted data represents the
spectral response or the characteristic curve of the sensor. The mathematically expressed
characteristic curve allows implementing interpolation models of discrete measures from
simulated spectra or from known reflectance functions, as in the case of color palettes. The
presented methodology reduces the necessity of experiments and allows constructing multiple
models from the same photodetector’s curve. The datasets of spectra from light sources and
reflectance functions of color charts are widely distributed, which allows turning the sensors into
measuring devices based on the simulation. As a result of the proposed methodology, the
response curve of the TCS3141CS sensor was obtained. The measurement data of the Macbeth
color palette was directly obtained with the sensor and the estimated values were obtained with
the curve using said methodology (simulated). As a result of the comparison an error below 3.6%
error was found. This manuscript is organized as follows: In section 2, the photodetectors, the
light source and the spectrometer used for the calibration, are described. Section 3 explains the
experimental methodology and the scheme for obtaining the characteristic curve. Section 4
discusses the implemented model and its features. In section 5, the process of interpreting the
measurements and the interpolation model is exhibited in detail. And finally, in section 6
conclusions and future prospects of the here presented work are drawn.
II. MATERIALS
a. Broadband source EQ-99
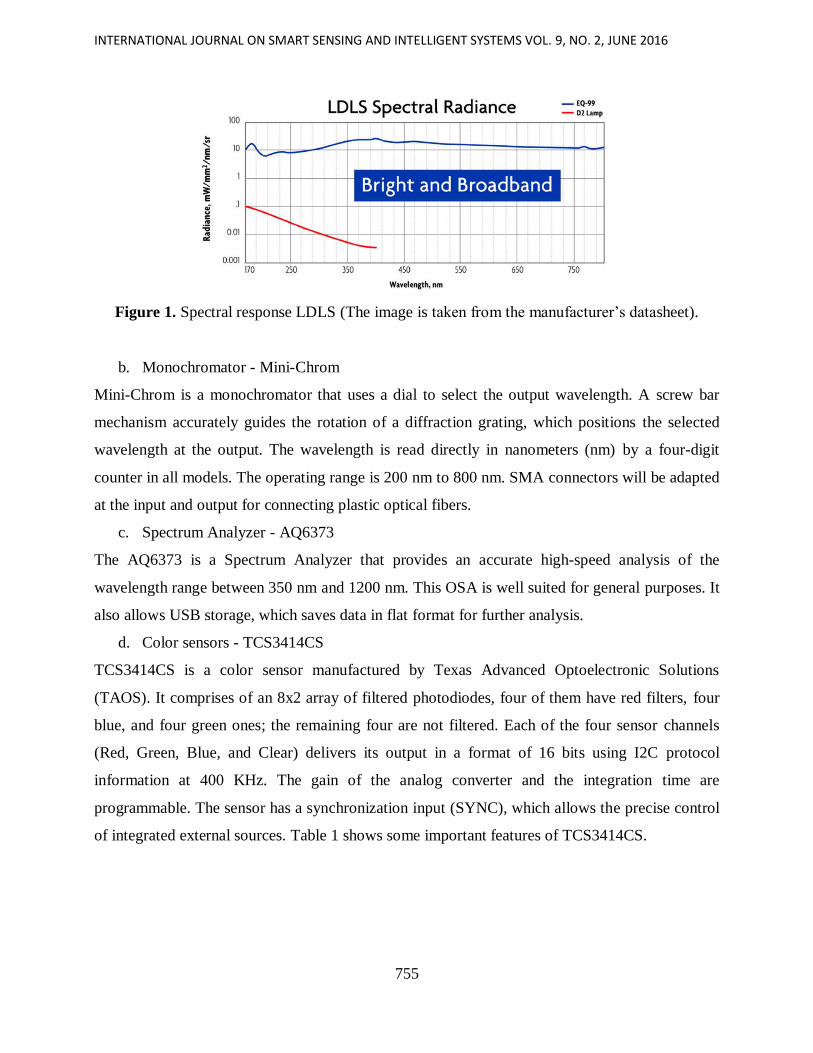
The EQ-99 is a Laser-Driven Light Source (LDLS) UV-VIS-NIR manufactured by
ENERGETIQ. This broadband source is specially designed for high brightness and high stability.
The spectral output ranges from 170 nm to 2100 nm, with a Numerical Aperture (NA) up to 0.47
and a typical bulb life longer than 5000 h. For the model presented in this article, it is crucial that
the light source shows a flat spectral response. Figure 1 shows the spectral response of the LDLS.
INTERNATIONAL JOURNAL ON SMART SENSING AND INTELLIGENT SYSTEMS VOL. 9, NO. 2, JUNE 2016
755
Figure 1. Spectral response LDLS (The image is taken from the manufacturer’s datasheet).
b. Monochromator - Mini-Chrom
Mini-Chrom is a monochromator that uses a dial to select the output wavelength. A screw bar
mechanism accurately guides the rotation of a diffraction grating, which positions the selected
wavelength at the output. The wavelength is read directly in nanometers (nm) by a four-digit
counter in all models. The operating range is 200 nm to 800 nm. SMA connectors will be adapted
at the input and output for connecting plastic optical fibers.
c. Spectrum Analyzer - AQ6373
The AQ6373 is a Spectrum Analyzer that provides an accurate high-speed analysis of the
wavelength range between 350 nm and 1200 nm. This OSA is well suited for general purposes. It
also allows USB storage, which saves data in flat format for further analysis.
d. Color sensors - TCS3414CS
TCS3414CS is a color sensor manufactured by Texas Advanced Optoelectronic Solutions
(TAOS). It comprises of an 8x2 array of filtered photodiodes, four of them have red filters, four
blue, and four green ones; the remaining four are not filtered. Each of the four sensor channels
(Red, Green, Blue, and Clear) delivers its output in a format of 16 bits using I2C protocol
information at 400 KHz. The gain of the analog converter and the integration time are
programmable. The sensor has a synchronization input (SYNC), which allows the precise control
of integrated external sources. Table 1 shows some important features of TCS3414CS.
.
J.-S. Botero V., F.-E. López G., J.-F. Vargas B., CHARACTERIZATION OF PHOTODECTORS USING A MONOCHROMATOR AND A BROADBAND LIGHT SOURCE IN THE XYZ COLOR SPACE
756
.Table 1. Characteristic TCS3414CS
Characteristic Value Units
Sensor Photodiode [𝑁𝐴]
Clock frequency 0 – 400 [𝐾𝐻𝑧]
A/D Resolution 16 [𝑏𝑖𝑡𝑠]
Operating voltage 2.7 − 3.6 [𝑉]
Supply Current (𝑉𝐷𝐷 = 3.6) 8.7-11 [𝑚𝐴]
Operating temperature −40 − 85 [°𝐶]
Communication 𝐼2𝐶 [𝑁𝐴]
Chanels R, G, B, clear [𝑁𝐴]
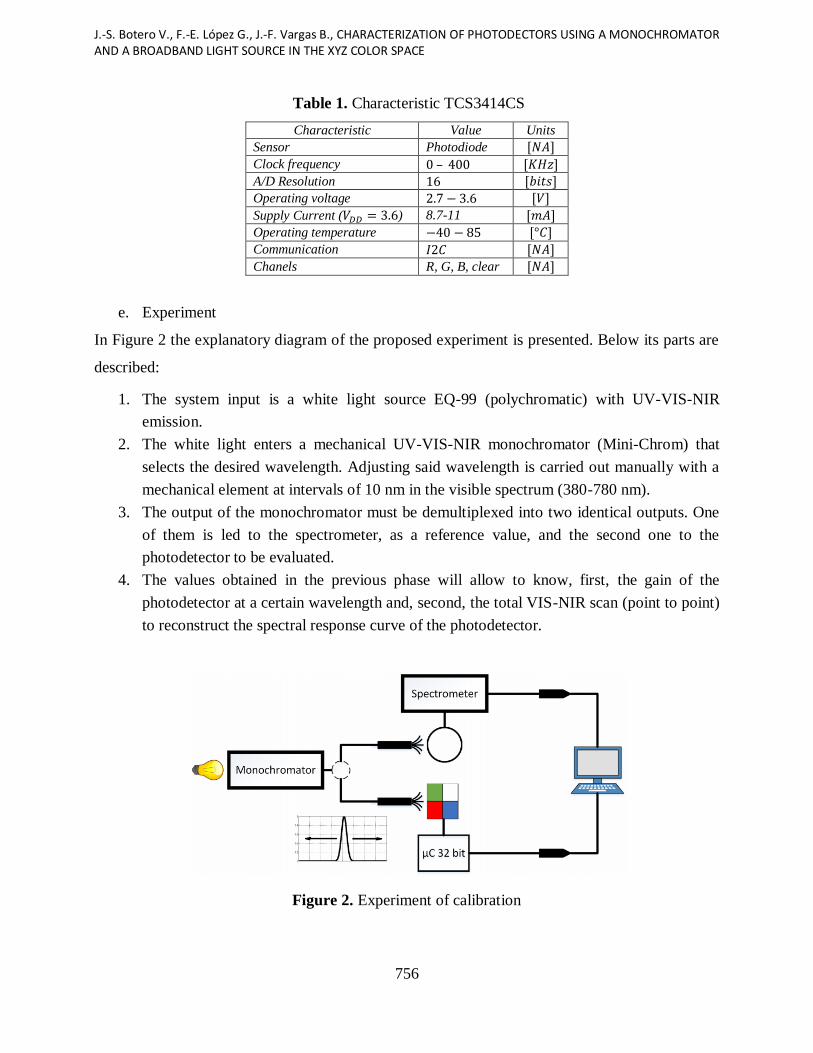
e. Experiment
In Figure 2 the explanatory diagram of the proposed experiment is presented. Below its parts are
described:
1. The system input is a white light source EQ-99 (polychromatic) with UV-VIS-NIR
emission.
2. The white light enters a mechanical UV-VIS-NIR monochromator (Mini-Chrom) that
selects the desired wavelength. Adjusting said wavelength is carried out manually with a
mechanical element at intervals of 10 nm in the visible spectrum (380-780 nm).
3. The output of the monochromator must be demultiplexed into two identical outputs. One
of them is led to the spectrometer, as a reference value, and the second one to the
photodetector to be evaluated.
4. The values obtained in the previous phase will allow to know, first, the gain of the
photodetector at a certain wavelength and, second, the total VIS-NIR scan (point to point)
to reconstruct the spectral response curve of the photodetector.
Figure 2. Experiment of calibration

INTERNATIONAL JOURNAL ON SMART SENSING AND INTELLIGENT SYSTEMS VOL. 9, NO. 2, JUNE 2016
757
f. CIE standard observer matching functions
Values in the color space 𝑋, 𝑌, 𝑍 of a surface can be obtained using the model shown in equation
1. Where 𝐸(𝜆) represents the source, 𝑃(𝜆) the reflectance curve and 𝑥(𝜆), 𝑦(𝜆) and 𝑧(𝜆) the
curve of the observer.
𝑋 = 𝑘 ∑ 𝐸(𝜆) ∙ 𝑥(𝜆) ∙ 𝑃(𝜆)𝑑𝜆
780
𝜆=380
(1) 𝑌 = 𝑘 ∑ 𝐸(𝜆) ∙ �̃�(𝜆) ∙ 𝑃(𝜆)𝑑𝜆
780
𝜆=380
𝑍 = 𝑘 ∑ 𝐸(𝜆) ∙ �̃�(𝜆) ∙ 𝑃(𝜆)𝑑𝜆
780
𝜆=380
g. Color checker
The color checker is a color palette with 24 samples arranged in 4 rows. The reflectance of the
samples are known, allowing to use it as a reference standard. In the Figure 3 the distribution of
the colors is shown. With the reflectance information of the Color Checker and given that the
source spectrum is known, one can calculate the value of the XYZ space using Equation 1.
Figure 3. Macbeth Chart
J.-S. Botero V., F.-E. López G., J.-F. Vargas B., CHARACTERIZATION OF PHOTODECTORS USING A MONOCHROMATOR AND A BROADBAND LIGHT SOURCE IN THE XYZ COLOR SPACE
758
III. SOLUTION
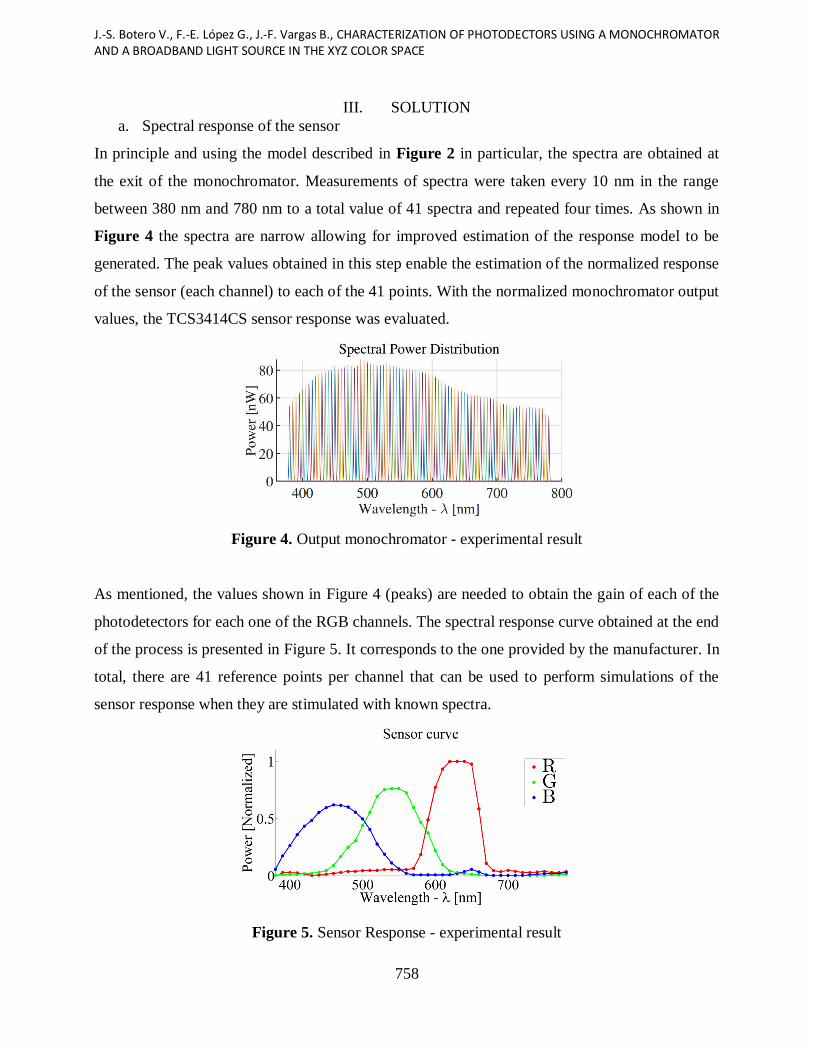
a. Spectral response of the sensor
In principle and using the model described in Figure 2 in particular, the spectra are obtained at
the exit of the monochromator. Measurements of spectra were taken every 10 nm in the range
between 380 nm and 780 nm to a total value of 41 spectra and repeated four times. As shown in
Figure 4 the spectra are narrow allowing for improved estimation of the response model to be
generated. The peak values obtained in this step enable the estimation of the normalized response
of the sensor (each channel) to each of the 41 points. With the normalized monochromator output
values, the TCS3414CS sensor response was evaluated.
Figure 4. Output monochromator - experimental result
As mentioned, the values shown in Figure 4 (peaks) are needed to obtain the gain of each of the
photodetectors for each one of the RGB channels. The spectral response curve obtained at the end
of the process is presented in Figure 5. It corresponds to the one provided by the manufacturer. In
total, there are 41 reference points per channel that can be used to perform simulations of the
sensor response when they are stimulated with known spectra.
Figure 5. Sensor Response - experimental result
INTERNATIONAL JOURNAL ON SMART SENSING AND INTELLIGENT SYSTEMS VOL. 9, NO. 2, JUNE 2016
759
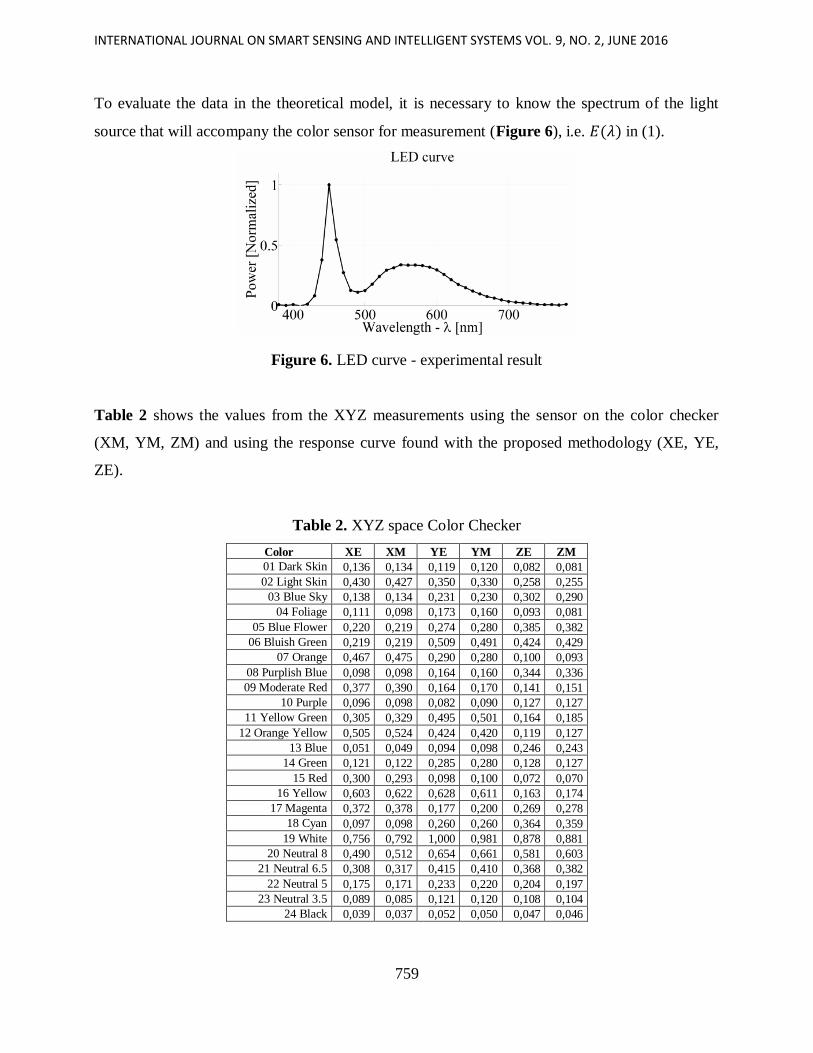
To evaluate the data in the theoretical model, it is necessary to know the spectrum of the light
source that will accompany the color sensor for measurement (Figure 6), i.e. 𝐸(𝜆) in (1).
Figure 6. LED curve - experimental result
Table 2 shows the values from the XYZ measurements using the sensor on the color checker
(XM, YM, ZM) and using the response curve found with the proposed methodology (XE, YE,
ZE).
Table 2. XYZ space Color Checker
Color XE XM YE YM ZE ZM
01 Dark Skin 0,136 0,134 0,119 0,120 0,082 0,081
02 Light Skin 0,430 0,427 0,350 0,330 0,258 0,255
03 Blue Sky 0,138 0,134 0,231 0,230 0,302 0,290
04 Foliage 0,111 0,098 0,173 0,160 0,093 0,081
05 Blue Flower 0,220 0,219 0,274 0,280 0,385 0,382
06 Bluish Green 0,219 0,219 0,509 0,491 0,424 0,429
07 Orange 0,467 0,475 0,290 0,280 0,100 0,093
08 Purplish Blue 0,098 0,098 0,164 0,160 0,344 0,336
09 Moderate Red 0,377 0,390 0,164 0,170 0,141 0,151
10 Purple 0,096 0,098 0,082 0,090 0,127 0,127
11 Yellow Green 0,305 0,329 0,495 0,501 0,164 0,185
12 Orange Yellow 0,505 0,524 0,424 0,420 0,119 0,127
13 Blue 0,051 0,049 0,094 0,098 0,246 0,243
14 Green 0,121 0,122 0,285 0,280 0,128 0,127
15 Red 0,300 0,293 0,098 0,100 0,072 0,070
16 Yellow 0,603 0,622 0,628 0,611 0,163 0,174
17 Magenta 0,372 0,378 0,177 0,200 0,269 0,278
18 Cyan 0,097 0,098 0,260 0,260 0,364 0,359
19 White 0,756 0,792 1,000 0,981 0,878 0,881
20 Neutral 8 0,490 0,512 0,654 0,661 0,581 0,603
21 Neutral 6.5 0,308 0,317 0,415 0,410 0,368 0,382
22 Neutral 5 0,175 0,171 0,233 0,220 0,204 0,197
23 Neutral 3.5 0,089 0,085 0,121 0,120 0,108 0,104
24 Black 0,039 0,037 0,052 0,050 0,047 0,046
J.-S. Botero V., F.-E. López G., J.-F. Vargas B., CHARACTERIZATION OF PHOTODECTORS USING A MONOCHROMATOR AND A BROADBAND LIGHT SOURCE IN THE XYZ COLOR SPACE
760
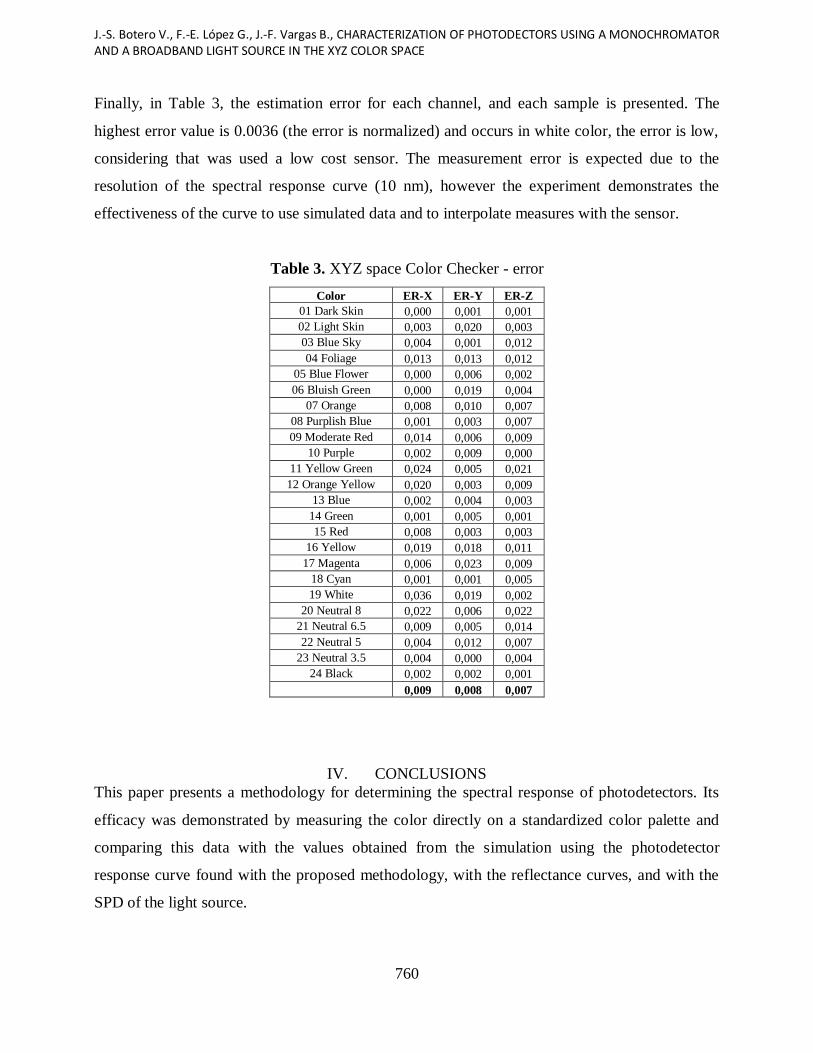
Finally, in Table 3, the estimation error for each channel, and each sample is presented. The
highest error value is 0.0036 (the error is normalized) and occurs in white color, the error is low,
considering that was used a low cost sensor. The measurement error is expected due to the
resolution of the spectral response curve (10 nm), however the experiment demonstrates the
effectiveness of the curve to use simulated data and to interpolate measures with the sensor.
Table 3. XYZ space Color Checker - error
Color ER-X ER-Y ER-Z
01 Dark Skin 0,000 0,001 0,001
02 Light Skin 0,003 0,020 0,003
03 Blue Sky 0,004 0,001 0,012
04 Foliage 0,013 0,013 0,012
05 Blue Flower 0,000 0,006 0,002
06 Bluish Green 0,000 0,019 0,004
07 Orange 0,008 0,010 0,007
08 Purplish Blue 0,001 0,003 0,007
09 Moderate Red 0,014 0,006 0,009
10 Purple 0,002 0,009 0,000
11 Yellow Green 0,024 0,005 0,021
12 Orange Yellow 0,020 0,003 0,009
13 Blue 0,002 0,004 0,003
14 Green 0,001 0,005 0,001
15 Red 0,008 0,003 0,003
16 Yellow 0,019 0,018 0,011
17 Magenta 0,006 0,023 0,009
18 Cyan 0,001 0,001 0,005
19 White 0,036 0,019 0,002
20 Neutral 8 0,022 0,006 0,022
21 Neutral 6.5 0,009 0,005 0,014
22 Neutral 5 0,004 0,012 0,007
23 Neutral 3.5 0,004 0,000 0,004
24 Black 0,002 0,002 0,001
0,009 0,008 0,007
IV. CONCLUSIONS
This paper presents a methodology for determining the spectral response of photodetectors. Its
efficacy was demonstrated by measuring the color directly on a standardized color palette and
comparing this data with the values obtained from the simulation using the photodetector
response curve found with the proposed methodology, with the reflectance curves, and with the
SPD of the light source.

INTERNATIONAL JOURNAL ON SMART SENSING AND INTELLIGENT SYSTEMS VOL. 9, NO. 2, JUNE 2016
761
The applications arising from knowing the characteristic curve of low-cost photodetectors extend
to all problems where it is necessary to find transformation models for output values and the
simulated stimulation data is known, for example, deriving models for measurements of CCT or
CRI with a color sensor using simulated spectra.
V. Acknowledgments
This work is part of the research project "Developing a methodology for obtaining experimental
spectral response of low cost photodetectors to derive photometric measurements" with ID
P14207, of the Automática, Electrónica y Ciencias Computacionales Group COL0053581.
Instituto Tecnológico Metropolitano, Medellín-Colombia. The authors thank CODI, “Estrategia
de sostenibilidad from Universidad de Antioquia” for the support to develop this work.
REFERENCES
[1] M. a Martínez, E.M. Valero, J. Hernández-Andrés, J. Romero, G. Langfelder, Combining
transverse field detectors and color filter arrays to improve multispectral imaging systems.,
Appl. Opt. 53 (2014) C14–C24. doi:10.1364/AO.53.000C14.
[2] G. Langfelder, Spectrally reconfigurable pixels for dual-color-mode imaging sensors,
Appl. Opt. 51 (2012) A91–A98. doi:10.1364/AO.51.000A91.
[3] H. Escid, M. Attari, M. Ait, W. Mechti, 0 . 35 µm CMOS optical sensor for an integrated
transimpedance circuit, Int. J. Smart Sens. Intell. Syst. 4 (2011) 467–481.
[4] ASSIST, Recommendations for Specifying Color Properties of Light Sources for Retail
Merchandising, Lighthing Research Center, 2010.
[5] K.. Biron, C.M.H. Demers, Perceptual Interactions between Light and Architecture: A
graphical vocabulary using models and photographs, in: PLEA2009, Quebec, 2009.
[6] Á. Logadóttir, S. a. Fotios, J. Christoffersen, S.S. Hansen, D.D. Corell, C. Dam-Hansen,
Investigating the use of an adjustment task to set preferred colour of ambient illumination,
Color Res. Appl. 38 (2013) 46–57. doi:10.1002/col.20714.
[7] F. Behar-Cohen, C. Martinsons, F. Viénot, G. Zissis, A. Barlier-Salsi, J.P. Cesarini, et al.,
Light-emitting diodes (LED) for domestic lighting: Any risks for the eye?, Prog. Retin.
Eye Res. 30 (2011) 239–257. doi:10.1016/j.preteyeres.2011.04.002.
[8] H. Li, X. Mao, Y. Han, Y. Luo, Wavelength dependence of colorimetric properties of
lighting sources based on multi- color LEDs, Opt. Express. 21 (2013) 3775–3783.
doi:10.1364/OE.21.003775.
J.-S. Botero V., F.-E. López G., J.-F. Vargas B., CHARACTERIZATION OF PHOTODECTORS USING A MONOCHROMATOR AND A BROADBAND LIGHT SOURCE IN THE XYZ COLOR SPACE
762
[9] F.S. Yılmaz, C. Ticleanu, G. Howlett, S. King, P.J. Littlefair, People-friendly lighting
controls – User performance and feedback on different interfaces, Light. Res. Technol.
(2015) 1477153515583180. doi:10.1177/1477153515583180.
[10] J. Schhanda, P. Csuti, F. Szabo, P. Bhusal, L. Halonen, Introduction to a study of
preferred colour rendering of light sources, Light. Res. Technol. 47 (2015) 28–35.
doi:10.1177/1477153513514426.
[11] T.P. State, T. Hong, K. Polytechnic, H. Kong, P. Corporation, K. City, et al., Colour
preference varies with lighting application, Light. Res. Technol. (2015) 1–13.
[12] I. Gómez, E. Pérez-Rodríguez, B. Viñegla, F.L. Figueroa, U. Karsten, Effects of solar
radiation on photosynthesis, UV-absorbing compounds and enzyme activities of the green
alga Dasycladus vermicularis from southern Spain, J. Photochem. Photobiol. B Biol. 47
(1998) 46–57. doi:10.1016/S1011-1344(98)00199-7.
[13] P. Pinho, T. Rosvall, E. Tetri, L. Halonen, Light emitting diodes in plant growth:
comparative growth test in greenhouse and evaluation of photosynthetic radiation, (2008).
[14] J. Torres-Sánchez, F. López-Granados, J.M. Peña, An automatic object-based method for
optimal thresholding in UAV images: Application for vegetation detection in herbaceous
crops, Comput. Electron. Agric. 114 (2015) 43–52. doi:10.1016/j.compag.2015.03.019.
[15] W.-K. Ong, H.-F. Chen, C.-T. Tsai, Y.-J. Fu, Y.-S. Wong, D.-J. Yen, et al., The activation
of directional stem cell motility by green light-emitting diode irradiation., Biomaterials. 34
(2013) 1911–20. doi:10.1016/j.biomaterials.2012.11.065.
[16] S. Yoshida, T. Mandel, C. Kuhlemeier, Stem cell activation by light guides plant
organogenesis, Genes Dev. 25 (2011) 1439–50. doi:10.1101/gad.631211.
[17] D. Wu, D.-W. Sun, Colour measurements by computer vision for food quality control – A
review, Trends Food Sci. Technol. 29 (2013) 5–20. doi:10.1016/j.tifs.2012.08.004.
[18] D. Bhattacharjee, G. Sharma, R. Bera, Universal intelligent sensor interface, Int. J. Smart
Sens. Intell. Syst. 8 (2015) 2307–2327.
[19] S. Matta, S.M. Mahmud, An intelligent light control system for power saving, in: IECON
2010-36th Annu. Conf. IEEE Ind. Electron. Soc., IEEE, 2010: pp. 3316–3321.
[20] M. Miki, Y. Kasahara, T. Hiroyasu, M. Yoshimi, Construction of Illuminance Distribution
Measurement System and Evaluation of Illuminance Convergence in Intelligent Lighting
System, in: IEEE SENSORS 2010 Conf., IEEE, 2010: pp. 2431–2434.
INTERNATIONAL JOURNAL ON SMART SENSING AND INTELLIGENT SYSTEMS VOL. 9, NO. 2, JUNE 2016
763
[21] Y.-J. Wen, J. Granderson, A.M. Agogino, Towards Embedded Wireless-Networked
Intelligent Daylighting Systems for Commercial Buildings, IEEE Int. Conf. Sens.
Networks, Ubiquitous, Trust. Comput. (2006) 326–331. doi:10.1109/SUTC.2006.1636196.
[22] M. Attas, E. Cloutis, C. Collins, D. Goltz, C. Majzels, J.R. Mansfield, et al., Near-infrared
spectroscopic imaging in art conservation: investigation of drawing constituents, J. Cult.
Herit. 4 (2003) 127–136. doi:10.1016/S1296-2074(03)00024-4.
[23] E.M. Gorostiza, J.L.L. Galilea, F.J.M. Meca, D.S. Monzú, F.E. Zapata, L.P. Puerto,
Infrared sensor system for mobile-robot positioning in intelligent spaces., Sensors. 11
(2011) 5416–38. doi:10.3390/s110505416.
[24] Y. Le Maoult, T. Sentenac, J.J. Orteu, J.P. Arcens, Fire Detection, Process Saf. Environ.
Prot. 85 (2007) 193–206. doi:10.1205/psep06035.
[25] C.-C. Tong, K.-L. Wen, Y.-T. Wang, S.-J. Lin, The development of portable infrared
color sensor, in: Ind. Technol. 2005. ICIT 2005. IEEE Int. Conf., IEEE, 2005: pp. 959–
962.
[26] T. Fu, H. Zhao, J. Zeng, Z. Wang, M. Zhong, C. Shi, Improvements to the three-color
optical CCD-based pyrometer system, Appl. Opt. 49 (2010) 5997–6005.
doi:10.1364/AO.49.005997.
[27] J.E. Agudo, P.J. Pardo, H. Sánchez, A.L. Pérez, M.I. Suero, A low-cost real color picker
based on arduino., Sensors (Basel). 14 (2014) 11943–56. doi:10.3390/s140711943.
[28] G.C. Anzalone, A.G. Glover, J.M. Pearce, Open-source colorimeter., Sensors (Basel). 13
(2013) 5338–46. doi:10.3390/s130405338.
[29] J.S. Bajić, D.Z. Stupar, B.M. Dakić, M.B. Živanov, L.F. Nagy, An absolute rotary
position sensor based on cylindrical coordinate color space transformation, Sensors
Actuators A Phys. 213 (2014) 27–34. doi:10.1016/j.sna.2014.03.036.
[30] K.-C. Lee, S.-H. Moon, B. Berkeley, S.-S. Kim, Optical feedback system with integrated
color sensor on LCD, Sensors Actuators A Phys. 130-131 (2006) 214–219.
doi:10.1016/j.sna.2006.01.028.
[31] M. Moghavvemi, S.S. Jamuar, E.H. Gan, Y.C. Yap, Design of low cost flexible RGB
color sensor, in: IEEE (Ed.), 2012 Int. Conf. Informatics, Electron. Vis., IEEE, Dhaka,
2012: pp. 1158–1162. doi:10.1109/ICIEV.2012.6317416.
[32] Ö.G. Saracoglu, H. Altural, Color Regeneration from Reflective Color Sensor Using an

J.-S. Botero V., F.-E. López G., J.-F. Vargas B., CHARACTERIZATION OF PHOTODECTORS USING A MONOCHROMATOR AND A BROADBAND LIGHT SOURCE IN THE XYZ COLOR SPACE
764
Artificial Intelligent Technique, Sensors (Basel). 10 (2010) 8363–8374.
doi:10.3390/s100908363.
[33] A. Sen, J. Albarella, J. Carey, P. Kim, W. McNamara III, Low-cost colorimetric sensor
for the quantitative detection of gaseous hydrogen sulfide, Sensors Actuators B Chem. 134
(2008) 234–237. doi:10.1016/j.snb.2008.04.046.
[34] M. Aldrich, N. Zhao, J.A. Paradiso, Energy efficient control of polychromatic solid state
lighting using a sensor network, in: SPIE 7784, Tenth Int. Conf. Solid State Light., SPIE,
2010. doi:10.1117/12.860755.
[35] M. Ashibe, M. Miki, T. Hiroyasu, Distributed optimization algorithm for lighting color
control using chroma sensors, in: 2008 IEEE Int. Conf. Syst. Man Cybern., IEEE,
Singapore, 2008: pp. 174–178. doi:10.1109/ICSMC.2008.4811270.
[36] J.-S. Botero V., F.-E. Lopez G., J.-F. Vargas B., Classification of artificial light sources
and estimation of Color Rendering Index using RGB sensors , K Nearest Neighbor and
Radial Basis Function, Int. J. Smart Sens. Intell. Syst. 8 (2015) 1505–1524.
[37] J.-S. Botero V., F.-E. Lopez G., J.-F. Vargas B., Calibration method for Correlated Color
Temperature (CCT) measurement using RGB color sensors, in: Image, Signal Process.
Artif. Vis. (STSIVA), 2013 XVIII Symp., IEEE, Bogotá, 2013: pp. 3–8.
doi:10.1109/STSIVA.2013.6644921.
[38] J.-S. Botero V., F.-E. Lopez G., J.-F. Vargas B., Calibration Method for Measuring the
Color Rendering Index (CRI) using RGB Sensor, Tecnológicas. EE (2013) 325–338.
[39] J.-S. Botero V., S.-M. Navarro, N. Giraldo, L. Atehortua, Estimation of
Photosynthetically Active Radiation (PAR) using a low cost spectrometer, IEEE Lat. Am.
Trans. 12 (2014) 107–111. doi:10.1109/TLA.2014.6749525.
[40] M. Assaad, I. Yohannes, A. Bermak, D. Ginhac, F. Meriaudeau, Design and
characterization of automated color sensor system, Int. J. Smart Sens. Intell. Syst. 7 (2014)
1–12.