characterization of stack effect in high-rise buildings ... · characterization of stack effect in...
TRANSCRIPT
1
Characterization of Stack Effect in High-Rise Buildings under
Winter Conditions, Including the Impact of Stairwell Pressurization
Steven Strege and Michael Ferreira
Hughes Associates Inc., Baltimore, MD, USA
Abstract
To characterize the magnitude of stack effect within stairwells and elevator shafts, differential pressure
measurements were taken in fifteen (15) high-rise buildings in four (4) different cities (Cleveland,
Baltimore, Minneapolis, and Philadelphia) during the winter months of January – March, 2013. Test
buildings ranged in height from 143 – 492 ft (44 – 150 m). Outside temperatures during testing ranged
from 10 – 59°F (-12 – 15°C). There was evidence of winter stack present in all buildings tested based on
the differential pressures measured. Under winter conditions, the data suggests that potentially large
quantities of air can migrate, floor-to-floor, via unprotected elevator shafts. Data further suggests
activation of the stairwell pressurization system may cause an increase in vertical air movement via
unprotected elevator shafts. This behavior may impact the movement of smoke floor-to-floor in a fire
event.
The exterior stack force on the building’s envelope does not always translate proportionally to shaft-to-
building differential pressures, as each building is unique. Although a building’s height and climate
(outside temperature) play important roles in determining vertical airflow movement within a building,
other variables such as architectural layout, wind, and ventilation systems may impact shaft-to-building
differential pressures. Hand calculations do not treat the building as a complete system, accounting for all
variables involved. A comparison between measured and hand calculated stack forces show that hand
calculations should be used only for first-order approximations, using conservative building envelope
leakage assumptions.
Keywords
Stack Effect, Smoke Control, Stairwell Pressurization, Elevator Pressurization, Elevator Lobby
2
Introduction
Stack effect is the vertical airflow within buildings caused by the temperature-created density differences
between the building interior and exterior or between two interior spaces [1]. Stack effect in high-rise
buildings under extreme temperature conditions can be a primary driver of floor-to-floor smoke spread
via vertical openings within the building, especially stairwells and elevators shafts.
Pressure differential testing was conducted to characterize vertical movement of air in buildings under
winter conditions. The purpose of the testing was to characterize the magnitude of the stack effect, within
stairwells and elevator shafts, for a variety of buildings, both in type (office, hotel) and height. To
characterize the magnitude of the stack effect, differential pressures measurements were taken in fifteen
(15) high-rise buildings, ranging in height from 143 – 492 ft (44 – 150 m), during the winter months of
January – March, 2013. When possible, data on the impact of stairwell pressurization system activation
on elevator-to-building airflows, was recorded. Measured differential pressures are compared with hand
calculations provided in the Handbook of Smoke Control Engineering [2].
Test Buildings
Differential pressure measurements were taken in fifteen (15) high-rise buildings in four (4) different
cities (Cleveland, Baltimore, Minneapolis, and Philadelphia) during the winter months of January –
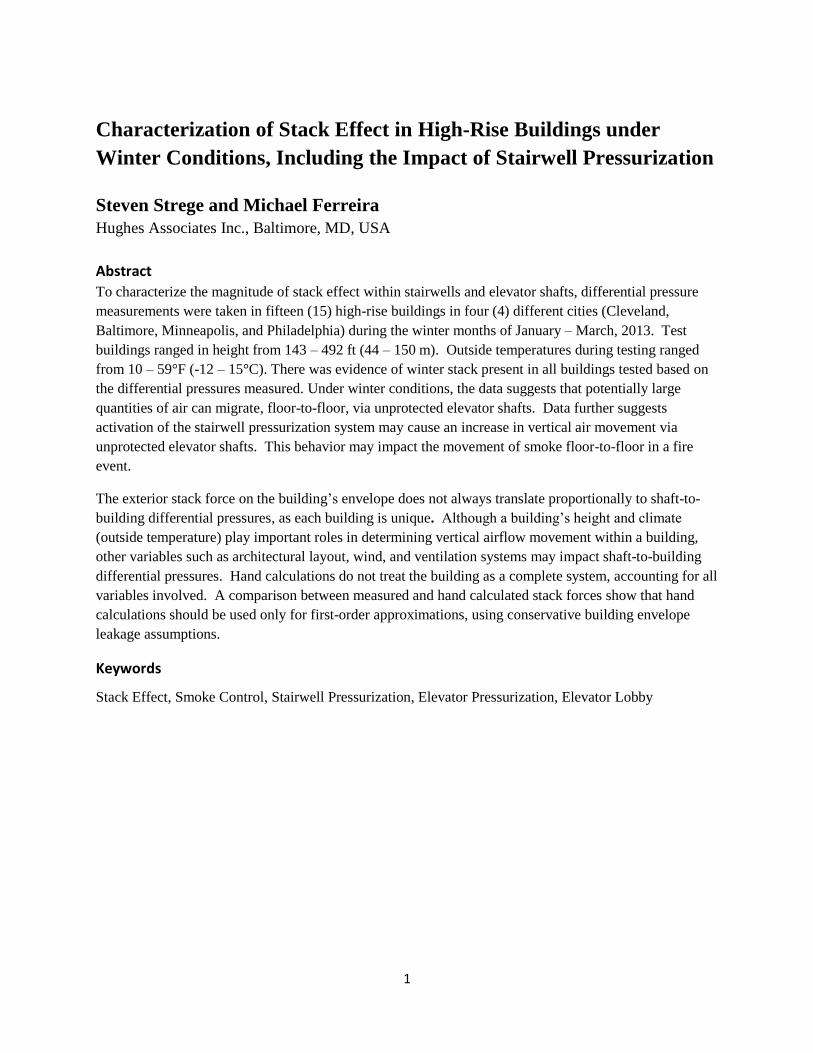
March, 2013. Table 1 describes the buildings visited for this study, including: location, building height,
number of floors, year built, occupancy type, exterior wall construction, number of stairs, number of
elevator hoistways, stair door undercut gap, elevator door width, and the approximate elevator door
leakage area. Building names have been omitted from this article to protect the interests of the property
owners.
3
Table 1. Summary of Buildings Tested
As shown in Table 1, the test buildings in this study ranged in height from 143 – 492 ft (44 – 150 m). In
some cases the building height could not be accurately obtained. In Table 1, building height values
shown in italics (with asterisks) are estimated, assuming a floor elevation of 13 feet (4 m), based on the
average floor-to-floor elevation heights of the other test buildings. The floor to floor heights for most of
the test buildings ranged between 11 – 14 feet (3.4 – 4.3 m). Building 3 had unusually tall floor heights,
nearing 19.5 feet (6 m) on average. Outside temperatures measured during testing ranged from 10 – 59°F
(-12 – 15°C).
The type of buildings examined in this study included high-rise residential hotels and office buildings.
The majority of the test buildings (12 of 15) consisted of high-rise residential hotels, due to their ease of
access. High-rise office buildings proved difficult to access for the purposes of obtaining test data, due to
increased security. Generally, most of the buildings in this study had an interior layout consisting of a
central corridor connecting stairwells and an elevator bank with rooms (or offices) located around the
corridor’s perimeter.
The majority of the test buildings’ exterior walls (envelope) consisted of a glass curtain wall or masonry
construction. All buildings had non-operable exterior windows expect for Building 12 and, in-part,
Building 6. Building 12 in Philadelphia (see Table 1) provides an important contrasting data point, where
each hotel room contained exterior balconies with sliding glass doors. The original construction year of
the test buildings range from 1922 – 2011, however most of the older buildings have been renovated and
it was unclear if renovations included substantial changes to the building’s exterior walls.
Most test buildings contained two stairwells (Building 14 had four stairs). Stair door leakages ranged
considerably, with undercut gaps ranging between 0 (gasketed) – 1.0 inch (0 – 2.5 cm). The number of
elevator hoistways in each building ranged from 3 – 10. Measured elevator door leakage ranged from
Building City, State Height (ft) Floors Year Occupancy Type Exterior Wall ConstructionNumber
of Stairs
Number of
Elevator
Hoistways
Stair Door
Undercut Gap
Elevator Door
Width (ft)
Elevator Door
Leakage (ft2)
1 320 25 1991 Residential Hotel 2 4 tight 3.5 0.60
2 419 31 1967 2 3 1/8" 4 0.58
3 430 22 2002 2 8 1/8" to 1" 4 0.58
4 272 22 1922 2 6 1/8" to 1" 4 0.74
5 399 32 2001 2 3 1/16" to 3/4" 3.5 0.51
6 221* 17 2011Glass Curtain Wall, Mostly
Non-Operable Windows
(Operable in l imited rooms)
2 6 1/16" to 1/2" 4 0.59
7 381 31 1983 2 5 1/4" to 1" 4 0.58
8 221* 17 1987 2 N/A 1/16" to 1/2" 4 0.52
9 227 19 1972Glass Curtain Wall
(Non-Operable Windows)2 N/A 1/16" to 3/4" 4 0.52
10 143* 11 1941 2 N/A 1/4" to 1/2" 4 0.74
11 492 33 1932 2 6 tight to 1" 3.5 0.59
12 364* 28 1964Masonry and Sliding Glass
Doors to Exterior Balconies
(Operable)
2 3 1/4" to 1/2" 3.25 0.49
13 394 32 2009 2 6 1/4" to 3/8" 3.5 0.48
14 299* 23 1995 4 10 1/4" to 3/8" 3.5 0.63
15 195* 15 1926 2 6 1/4" to 3/8" 3.25 0.65
Cleveland, OH
Baltimore, MD
Minneapolis, MN
Philadelphia, PA
Masonry and Fixed Glass
Windows (Non-Operable)
Masonry and Fixed Glass
Windows (Non-Operable)
Masonry and Fixed Glass
Windows (Non-Operable)
Masonry and Fixed Glass
Windows (Non-Operable)
Business
Residential Hotel
4
0.48 – 0.74 ft2/door, which is consistent with values reported in Handbook of Smoke Control Engineering
[2].
Measurements
For each building tested, the following measurements were taken (when possible):
1. Differential pressure between stair and building (in. W.G.)
a. On 1 or 2 upper levels (near top of building).
b. On 1 or 2 lower levels (ground floor).
2. Differential pressure between elevator hoistway and building (in. W.G.)
a. On 1 or 2 upper levels (near top of building).
b. On 1 or 2 lower levels (ground floor).
3. Differential pressure between exterior and building at ground floor doors (in. W.G.)
4. Outside temperature at the time of testing (°F)
5. Building temperature at the time of testing (°F)
6. Number of stairwells and elevator hoistways present
7. Stairwell door undercut gaps (in.)
8. Approximation of total leakage at each elevator door (ft2)
A calibrated hand-held differential pressure gauge (TSI model 8702) was used to take all differential
pressure measurements. For many measurement locations, a range of differential pressures were
observed. This was especially true for elevator hoistway measurements, when elevator cars were in
motion (as measurements were taken during normal building activity). Best efforts were made to take
average differential pressure measurements when all elevator doors were closed and elevator cars were
stationary. Likewise, best efforts were made to take stairwell measurements when all stair doors were
closed.
In an attempt to isolate the impact of outside air temperature on shaft-to-building differential pressures,
repeat measurements were conducted on the same building for different outside temperatures. Repeat
measurements were conducted in Buildings 1, 2, 3, and 11.
When possible, data on the impact of stair pressurization on airflow movement within the elevator shafts
was recorded. This was done by taking differential pressures in the elevator shafts (with respect to the
building), on the top occupied floor of the building, with the stair pressurization system both on and off.
Measurement Considerations
The driving forces governing air movement in a building include naturally occurring stack effect, wind
effects, fan-powered ventilation systems, and elevator piston effect [3]. It is important to note that shaft-
to-building differential pressures recorded during this study likely included all of these driving forces, at
least to some degree. Although stack effect is expected to be one of the primary contributors, the
magnitude of the other driving forces is not well characterized and should be considered when analyzing
the pressure differential data. Nevertheless, the differential pressures stated in this report are actual
values, measured under normal building activity, regardless of the driving force (or combination of
driving forces) producing the result.
5
Testing in all fifteen building was conducted while the building was under a normal HVAC mode with
elevator lobby doors open. In three of the test buildings (Building 3, 5, and 7), elevator-to-shaft testing
was also conducted with the stairwell pressurization systems activated. It should be noted that stair and
elevator shaft differential pressures during a fire alarm event may be considerably different from those
measured in this study, due to changes in active and passive building systems (ex. stair pressurization and
elevator lobby doors).
Stack Effect Measurement Results
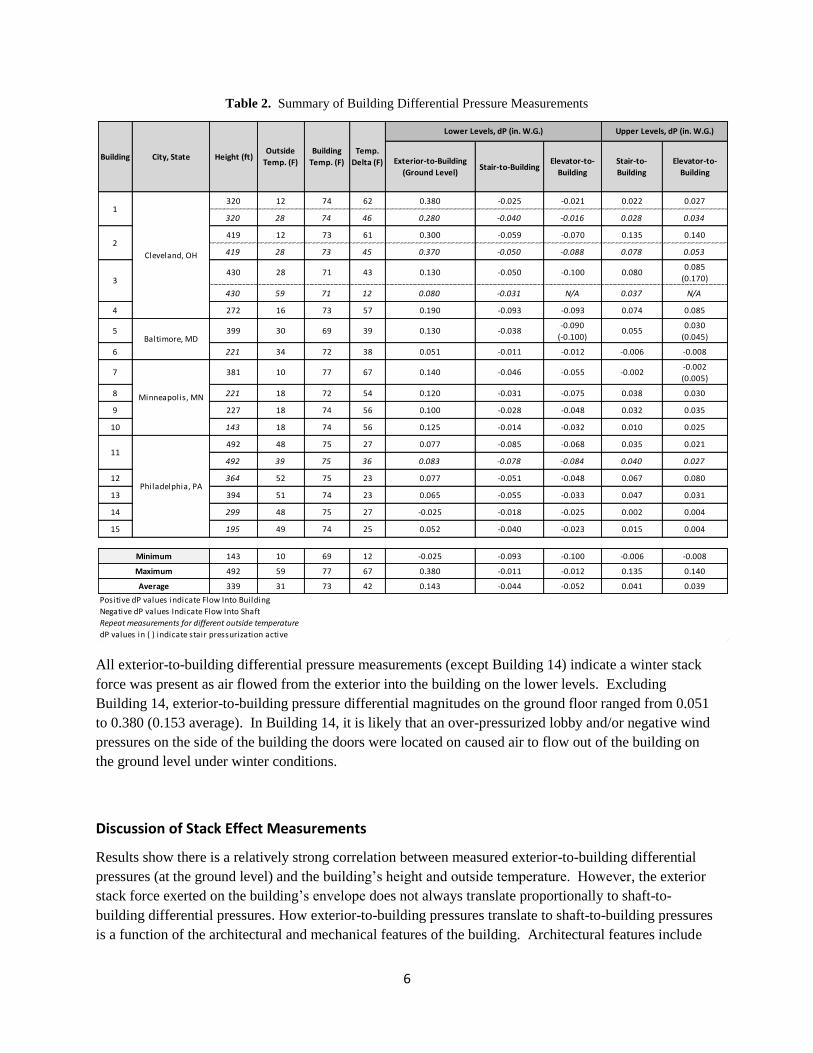
Table 2 provides a summary of the measurements taken at each building, including: outside temperature,
inside temperature, temperature delta, exterior-to-building differential pressure at ground level, stair-to-
building differential pressure on lower/upper levels, and elevator-to-building differential pressure on
lower/upper levels. Positive differential pressure values indicate flow from the shaft (or exterior) into the
building. Negative differential pressure values indicate flow from the building into the shaft (stair or
elevator).
As shown in Table 2, there was evidence of winter stack present in all buildings tested based on the
differential pressures measured. On the lower levels of all buildings, air was observed flowing from the
building into the stairwells and elevator hoistways. Pressure differential magnitudes on the lower levels
for the stairwells ranged from -0.011 to -0.093 in. W.G. (-0.044 in. W.G. average). Likewise, pressure
differential magnitudes on the lower levels for the elevator hoistways ranged between -0.012 to -0.100 in.
W.G. (-0.052 in. W.G. average).
On the upper levels of most buildings (except Building 6 and 7), air was observed flowing from the
stairwells and elevator hoistways into the building. Pressure differential magnitudes on the upper levels
for the stairwells ranged from -0.006 to 0.135 in. W.G. (0.041 in. W.G. average). Pressure differential
magnitudes on the upper levels for the elevator hoistways ranged from -0.008 to 0.140 in. W.G. (0.039 in.
W.G average). In Building 6 and 7, it is likely that pressurized corridors caused air to flow into the stair
and elevator hoistways on the upper levels of the building. A more detailed study was conducted on
Building 7, were stair-to-building pressure differentials were measured on every floor. Air was measured
flowing out of the stairwells into the building on Floors 7 – 18 (middle levels) at differential pressures as
high as 0.012 in. W.G. Air was also measured flowing from the stairs to outside, through roof access
doors, at differential pressures between 0.509 – 0.607 in. W.G.
6
Table 2. Summary of Building Differential Pressure Measurements
All exterior-to-building differential pressure measurements (except Building 14) indicate a winter stack
force was present as air flowed from the exterior into the building on the lower levels. Excluding
Building 14, exterior-to-building pressure differential magnitudes on the ground floor ranged from 0.051
to 0.380 (0.153 average). In Building 14, it is likely that an over-pressurized lobby and/or negative wind
pressures on the side of the building the doors were located on caused air to flow out of the building on
the ground level under winter conditions.
Discussion of Stack Effect Measurements
Results show there is a relatively strong correlation between measured exterior-to-building differential
pressures (at the ground level) and the building’s height and outside temperature. However, the exterior
stack force exerted on the building’s envelope does not always translate proportionally to shaft-to-
building differential pressures. How exterior-to-building pressures translate to shaft-to-building pressures
is a function of the architectural and mechanical features of the building. Architectural features include
Exterior-to-Building
(Ground Level)Stair-to-Building
Elevator-to-
Building
Stair-to-
Building
Elevator-to-
Building
320 12 74 62 0.380 -0.025 -0.021 0.022 0.027
320 28 74 46 0.280 -0.040 -0.016 0.028 0.034
419 12 73 61 0.300 -0.059 -0.070 0.135 0.140
419 28 73 45 0.370 -0.050 -0.088 0.078 0.053
430 28 71 43 0.130 -0.050 -0.100 0.0800.085
(0.170)
430 59 71 12 0.080 -0.031 N/A 0.037 N/A
4 272 16 73 57 0.190 -0.093 -0.093 0.074 0.085
5 399 30 69 39 0.130 -0.038-0.090
(-0.100)0.055
0.030
(0.045)
6 221 34 72 38 0.051 -0.011 -0.012 -0.006 -0.008
7 381 10 77 67 0.140 -0.046 -0.055 -0.002-0.002
(0.005)
8 221 18 72 54 0.120 -0.031 -0.075 0.038 0.030
9 227 18 74 56 0.100 -0.028 -0.048 0.032 0.035
10 143 18 74 56 0.125 -0.014 -0.032 0.010 0.025
492 48 75 27 0.077 -0.085 -0.068 0.035 0.021
492 39 75 36 0.083 -0.078 -0.084 0.040 0.027
12 364 52 75 23 0.077 -0.051 -0.048 0.067 0.080
13 394 51 74 23 0.065 -0.055 -0.033 0.047 0.031
14 299 48 75 27 -0.025 -0.018 -0.025 0.002 0.004
15 195 49 74 25 0.052 -0.040 -0.023 0.015 0.004
143 10 69 12 -0.025 -0.093 -0.100 -0.006 -0.008
492 59 77 67 0.380 -0.011 -0.012 0.135 0.140
339 31 73 42 0.143 -0.044 -0.052 0.041 0.039
Positive dP values indicate Flow Into Building
Negative dP values Indicate Flow Into Shaft
Repeat measurements for different outside temperature
dP values in ( ) indicate stair pressurization active
Upper Levels, dP (in. W.G.)
1
2
3
11
Cleveland, OH
Baltimore, MD
Minneapolis, MN
Philadelphia, PA
Temp.
Delta (F)
Lower Levels, dP (in. W.G.)
Minimum
Maximum
Average
Building City, State Height (ft)Outside
Temp. (F)
Building
Temp. (F)
7
building layout, internal airflow paths and envelope leakages. A building’s ventilation system can also
play a critical role on shaft-to-building differential pressures [3]. The impact of ventilation systems was
not included in this study.
Impact of Architectural Layout
The architectural layout of a building plays a critical role in determining how the exterior stack force on
the building is translated to the interior vertical shafts within the building. The network of airflow paths
within a building acts as a “system” and each building has a unique network. Small changes to the
architectural layout of a building can impact shaft-to-building difference pressures. Take the repeat
measurements of Building 2 for example. Notice as the temperature dropped from 28°F to 12°F, the
exterior-to-building force dropped slightly from 0.370 to 0.300, which is counterintuitive. As expected,
elevator-to-building differential pressures on the upper floors increased with a drop in outside temperature
from 0.053 to 0.140 in. W.G. As expected, stair-to-building differential pressures on the upper floors also
increased from 0.078 to 0.135 in. W.G. However, the primary reason for this substantial pressure
increase, between the two scenarios, is not the change in outside temperature, but is due to a change in the
configuration of a set of corridor double doors that open into an open floor layout. In the lower pressure
scenario, the corridor doors are closed and in the higher pressure scenario, the corridor doors are open.
Opening the corridor doors (which open to a large open floor layout) reduced the flow resistance on that
level, resulting in higher elevator-to-building differential pressures (and vertical airflow movement). This
is analogous to removal of a central corridor. A CONTAM model [4] of Building 2 was constructed and
validates this dynamic. This is just one example of how the architectural layout of a building can play a
critical role in shaft-to-building differential pressure measurements.
The building data set is limited in that all of the buildings tested contained a central corridor connecting
the stairwells and elevator shafts. Although this is a common building layout, other common building
layouts such as buildings having a largely open floor plan were not studied. As previously mentioned,
CONTAM modeling shows these centralized corridors provide airflow resistance (or back-pressure)
decreasing shaft-to-building differential pressures. In comparison, differential pressures at stair/elevator
doors may be much higher on floors with open floor plans as there is less resistance to airflow exiting the
shafts.
Impact of Building Envelope Leakage
A building’s envelope leakage also plays a critical role on shaft-to-building differential pressures. This
dynamic is well documented in the literature [2] and is also supported by the measured data set. For
example, Building 12 had one of the highest measured elevator-to-building differential pressures on the
upper floors, even though the building height was average for the data set (364 ft) and the outside
temperature was relatively warm at 52°F. The likely reason for relatively high shaft-to-building
differential pressures in Building 12 is due to the relatively loose envelope of the building (as each hotel
room has exterior balconies with sliding glass doors).
Based on past modeling studies, stair and elevator hoistway connections to ambient may significantly
impact the leakage of a building’s envelope (and shaft-to-building differential pressures). These
connections include; discharge doors, roof access doors, barometric relief dampers and elevator hoistway
vents. The impact of these architectural components was not included in this study.
8
Impact of Stairwell Pressurization on Elevator Shaft Pressures
In Table 2, values in parentheses [()] indicates a differential pressure recorded while the stair
pressurization system was active. As shown in Table 2, for all three buildings when the stair
pressurization system was activated, elevator-to-building differential pressures on the upper floors
increased. The increase in elevator-to-building differential pressures is due to additional air entering the
elevator shafts via leakage air from the pressurized stairwells. The magnitude increase was more evident
in Building 3 compared to Buildings 5 and 7. This may be due to the differences in the architectural
layout of the central corridors and lobby areas on the lower levels. The ground level of Building 3
consists of relatively small/tight elevator lobbies with one set of exterior doors, whereas in Buildings 5
and 7 the lower levels consist of large, open areas with multiple exterior doors (providing more avenues
to relieve leakage air from the pressurized stairwells).
Inherent stack effect holds true if the stairwells (and other vertical shafts) remain at building temperature.
But when the stairwell pressurization systems are activated, unconditioned outside air is supplied to the
stairwells and the temperature within the stairwell begins to transition toward the temperature of the
outside air. As the stair shaft temperature changes over time, the pressure profile in the stair can invert
changing normal winter stack effect to a reverse stack effect in the stair. The opposite is possible under
summer conditions as well. This condition (cold outside, cool stair, warm building) creates competing
stack forces. It should be noted that in all three buildings for this study where the stair pressurization
system was activated, the stairwell temperatures remained relatively warm (>55°F) during pressurization
because the supply air was conditioned (per design) and/or because there were heaters located in the
stairwells. Therefore, the impact of cooling the stairwells during pressurization on elevator-to-building
airflow movement could not be fully characterized in this study. However, a CONTAM model [4] of
Building 2 shows that cooling the stairs with outside air during stair pressurization may produce increased
stack within the elevator hoistways.
The impact of stairwell pressurization on elevator-to-building airflows, in Building 3, was analyzed.
Based on elevator-to-building differential pressure measurements (with and without the stair
pressurization system active) and elevator door leakages, the total quantity of air (potentially containing
smoke in a fire event) flowing onto the uppermost building level from the elevators due to winter stack
was calculated, per Equation 1, for Building 3.
√ (1)
where:
Q = volumetric flow through orifice, cfm
Ae = area of orifice, ft2
= pressure difference across orifice, in. W.G.
K = coefficient, 2610
Results, per Equation 1, are provided in Table 3. As shown in Table 3, as expected winter stack effect
causes air flow to the upper floors of the building via the elevator shafts; approximately 3,500 cfm of
airflow for a nominal eight car shaft. Activation of the stair pressurization system increased elevator-to-
building airflow via the elevator shafts; approximately 5,000 cfm of airflow.
9
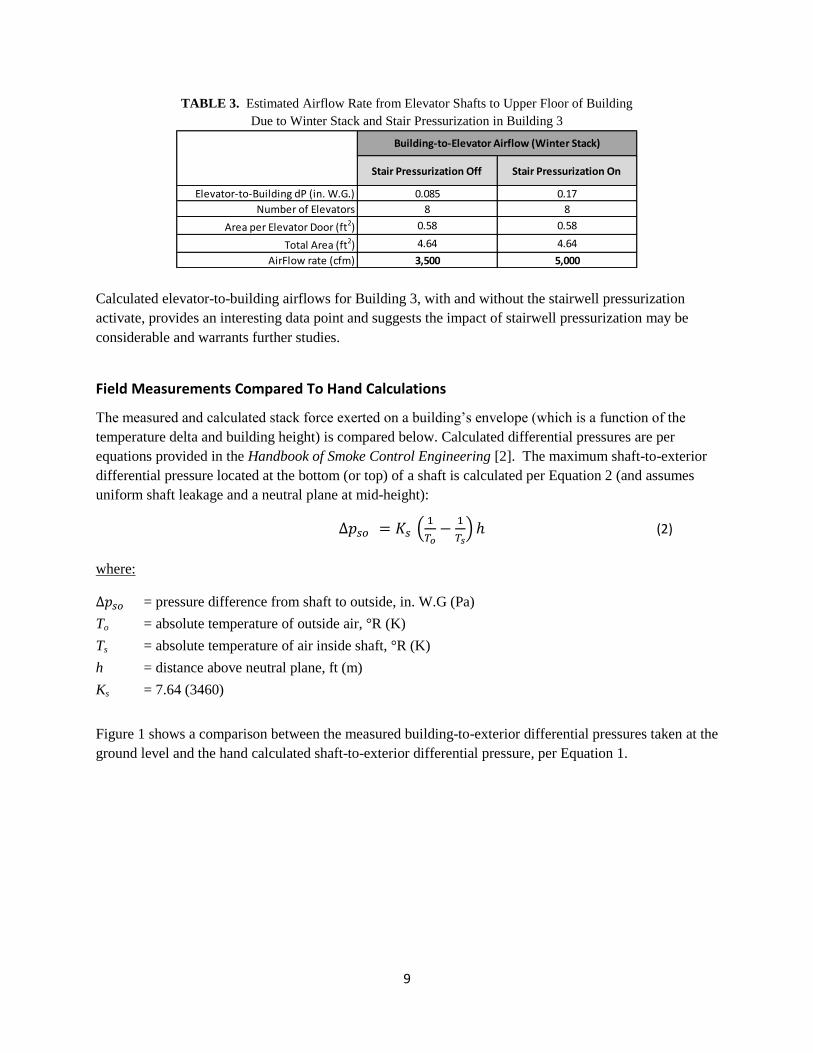
TABLE 3. Estimated Airflow Rate from Elevator Shafts to Upper Floor of Building
Due to Winter Stack and Stair Pressurization in Building 3
Calculated elevator-to-building airflows for Building 3, with and without the stairwell pressurization
activate, provides an interesting data point and suggests the impact of stairwell pressurization may be
considerable and warrants further studies.
Field Measurements Compared To Hand Calculations
The measured and calculated stack force exerted on a building’s envelope (which is a function of the
temperature delta and building height) is compared below. Calculated differential pressures are per
equations provided in the Handbook of Smoke Control Engineering [2]. The maximum shaft-to-exterior
differential pressure located at the bottom (or top) of a shaft is calculated per Equation 2 (and assumes
uniform shaft leakage and a neutral plane at mid-height):
(
) (2)
where:
= pressure difference from shaft to outside, in. W.G (Pa)
To = absolute temperature of outside air, °R (K)
Ts = absolute temperature of air inside shaft, °R (K)
h = distance above neutral plane, ft (m)
Ks = 7.64 (3460)
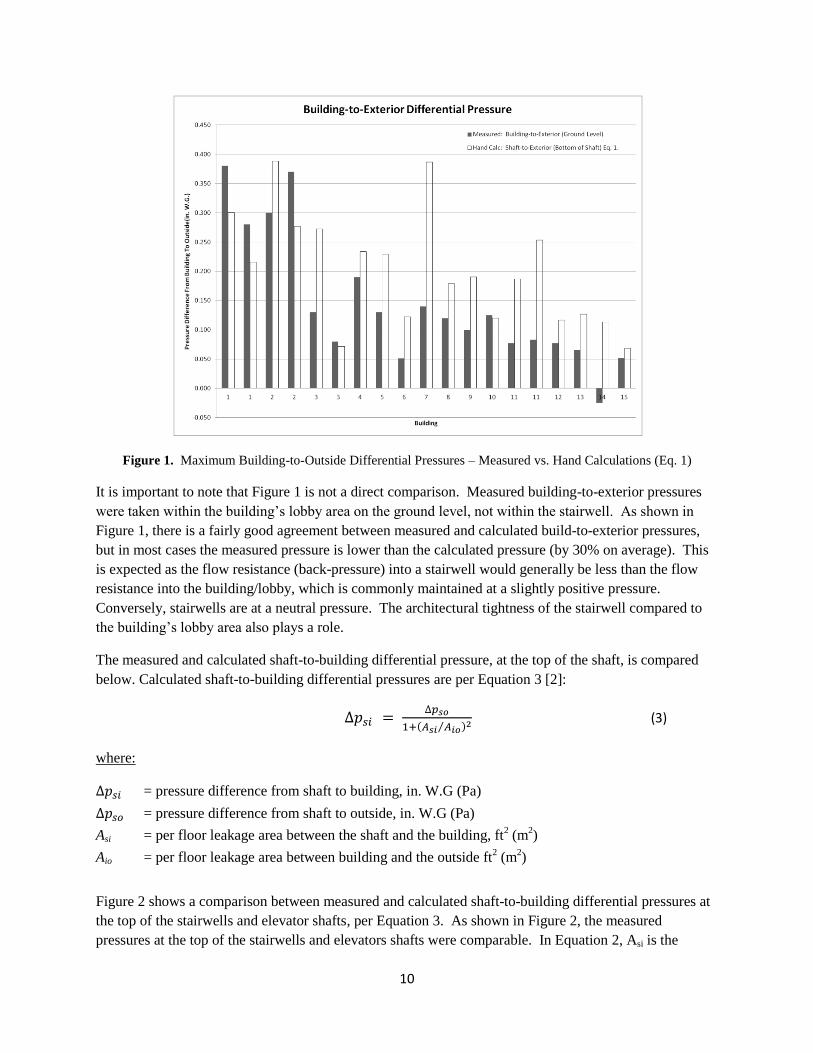
Figure 1 shows a comparison between the measured building-to-exterior differential pressures taken at the
ground level and the hand calculated shaft-to-exterior differential pressure, per Equation 1.
Stair Pressurization Off Stair Pressurization On
Elevator-to-Building dP (in. W.G.) 0.085 0.17
Number of Elevators 8 8
Area per Elevator Door (ft2) 0.58 0.58
Total Area (ft2) 4.64 4.64
AirFlow rate (cfm) 3,500 5,000
Building-to-Elevator Airflow (Winter Stack)
10
Figure 1. Maximum Building-to-Outside Differential Pressures – Measured vs. Hand Calculations (Eq. 1)
It is important to note that Figure 1 is not a direct comparison. Measured building-to-exterior pressures
were taken within the building’s lobby area on the ground level, not within the stairwell. As shown in
Figure 1, there is a fairly good agreement between measured and calculated build-to-exterior pressures,
but in most cases the measured pressure is lower than the calculated pressure (by 30% on average). This
is expected as the flow resistance (back-pressure) into a stairwell would generally be less than the flow
resistance into the building/lobby, which is commonly maintained at a slightly positive pressure.
Conversely, stairwells are at a neutral pressure. The architectural tightness of the stairwell compared to
the building’s lobby area also plays a role.
The measured and calculated shaft-to-building differential pressure, at the top of the shaft, is compared
below. Calculated shaft-to-building differential pressures are per Equation 3 [2]:
( ⁄ ) (3)
where:
= pressure difference from shaft to building, in. W.G (Pa)
= pressure difference from shaft to outside, in. W.G (Pa)
Asi = per floor leakage area between the shaft and the building, ft2 (m
2)
Aio = per floor leakage area between building and the outside ft2 (m
2)
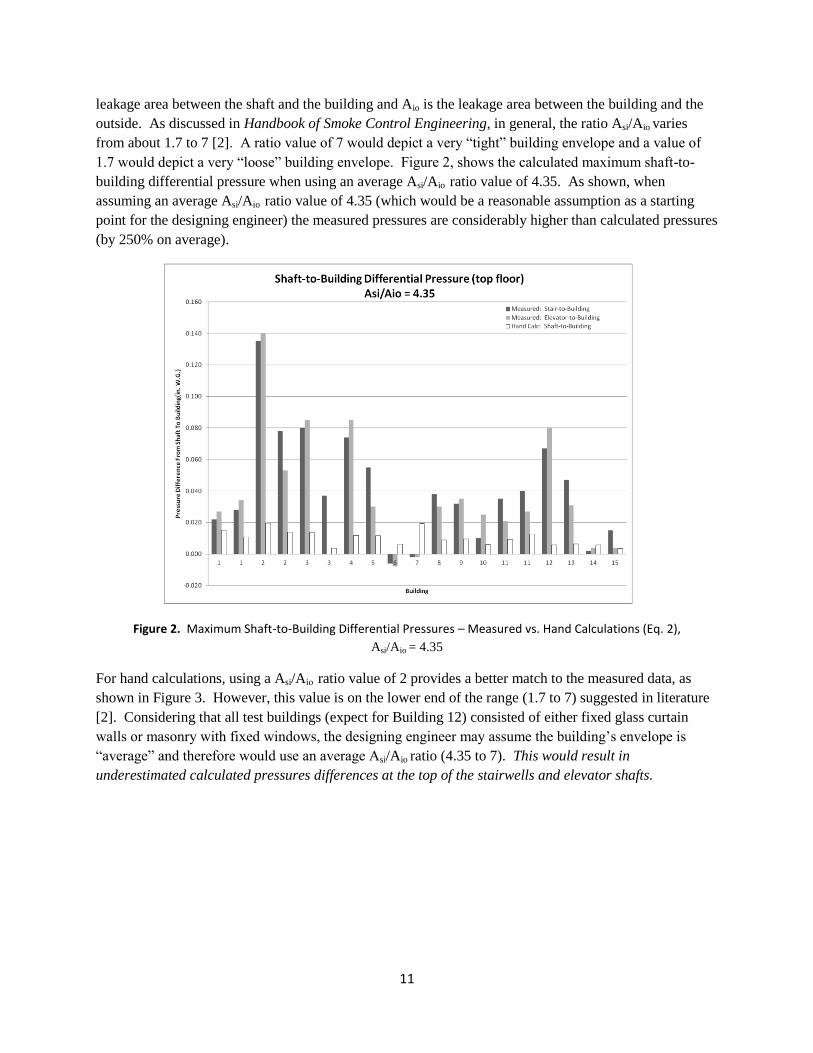
Figure 2 shows a comparison between measured and calculated shaft-to-building differential pressures at
the top of the stairwells and elevator shafts, per Equation 3. As shown in Figure 2, the measured
pressures at the top of the stairwells and elevators shafts were comparable. In Equation 2, Asi is the
11
leakage area between the shaft and the building and Aio is the leakage area between the building and the
outside. As discussed in Handbook of Smoke Control Engineering, in general, the ratio Asi/Aio varies
from about 1.7 to 7 [2]. A ratio value of 7 would depict a very “tight” building envelope and a value of
1.7 would depict a very “loose” building envelope. Figure 2, shows the calculated maximum shaft-to-
building differential pressure when using an average Asi/Aio ratio value of 4.35. As shown, when
assuming an average Asi/Aio ratio value of 4.35 (which would be a reasonable assumption as a starting
point for the designing engineer) the measured pressures are considerably higher than calculated pressures
(by 250% on average).
Figure 2. Maximum Shaft-to-Building Differential Pressures – Measured vs. Hand Calculations (Eq. 2),
Asi/Aio = 4.35
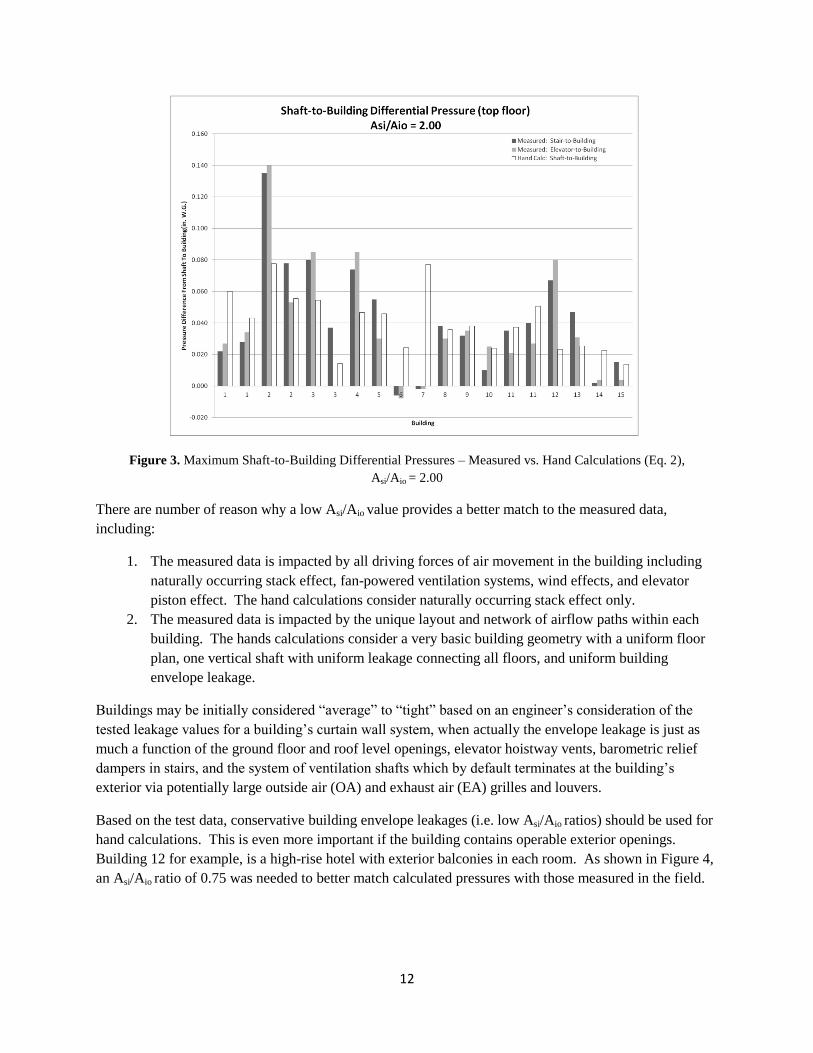
For hand calculations, using a Asi/Aio ratio value of 2 provides a better match to the measured data, as
shown in Figure 3. However, this value is on the lower end of the range (1.7 to 7) suggested in literature
[2]. Considering that all test buildings (expect for Building 12) consisted of either fixed glass curtain
walls or masonry with fixed windows, the designing engineer may assume the building’s envelope is
“average” and therefore would use an average Asi/Aio ratio (4.35 to 7). This would result in
underestimated calculated pressures differences at the top of the stairwells and elevator shafts.
12
Figure 3. Maximum Shaft-to-Building Differential Pressures – Measured vs. Hand Calculations (Eq. 2),
Asi/Aio = 2.00
There are number of reason why a low Asi/Aio value provides a better match to the measured data,
including:
1. The measured data is impacted by all driving forces of air movement in the building including
naturally occurring stack effect, fan-powered ventilation systems, wind effects, and elevator
piston effect. The hand calculations consider naturally occurring stack effect only.
2. The measured data is impacted by the unique layout and network of airflow paths within each
building. The hands calculations consider a very basic building geometry with a uniform floor
plan, one vertical shaft with uniform leakage connecting all floors, and uniform building
envelope leakage.
Buildings may be initially considered “average” to “tight” based on an engineer’s consideration of the
tested leakage values for a building’s curtain wall system, when actually the envelope leakage is just as
much a function of the ground floor and roof level openings, elevator hoistway vents, barometric relief
dampers in stairs, and the system of ventilation shafts which by default terminates at the building’s
exterior via potentially large outside air (OA) and exhaust air (EA) grilles and louvers.
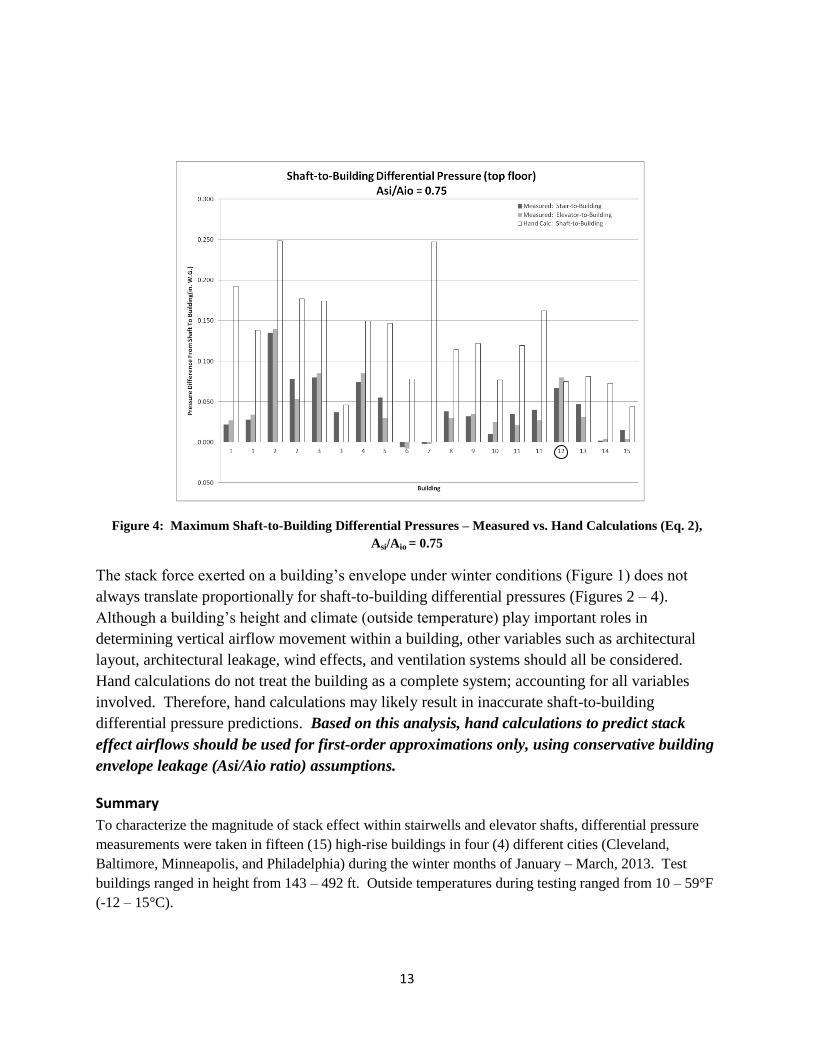
Based on the test data, conservative building envelope leakages (i.e. low Asi/Aio ratios) should be used for
hand calculations. This is even more important if the building contains operable exterior openings.
Building 12 for example, is a high-rise hotel with exterior balconies in each room. As shown in Figure 4,
an Asi/Aio ratio of 0.75 was needed to better match calculated pressures with those measured in the field.
13
Figure 4: Maximum Shaft-to-Building Differential Pressures – Measured vs. Hand Calculations (Eq. 2),
Asi/Aio = 0.75
The stack force exerted on a building’s envelope under winter conditions (Figure 1) does not
always translate proportionally for shaft-to-building differential pressures (Figures 2 – 4).
Although a building’s height and climate (outside temperature) play important roles in
determining vertical airflow movement within a building, other variables such as architectural
layout, architectural leakage, wind effects, and ventilation systems should all be considered.
Hand calculations do not treat the building as a complete system; accounting for all variables
involved. Therefore, hand calculations may likely result in inaccurate shaft-to-building
differential pressure predictions. Based on this analysis, hand calculations to predict stack
effect airflows should be used for first-order approximations only, using conservative building
envelope leakage (Asi/Aio ratio) assumptions.
Summary
To characterize the magnitude of stack effect within stairwells and elevator shafts, differential pressure
measurements were taken in fifteen (15) high-rise buildings in four (4) different cities (Cleveland,
Baltimore, Minneapolis, and Philadelphia) during the winter months of January – March, 2013. Test
buildings ranged in height from 143 – 492 ft. Outside temperatures during testing ranged from 10 – 59°F
(-12 – 15°C).
14
There was evidence of winter stack present in all buildings tested based on the differential pressures
measured. On the lower levels of all buildings, air was observed flowing from the building into the
stairwells and elevator hoistways with pressure differential magnitudes ranging between -0.011 to -0.100
in. W.G. (-0.048 in. W.G. average). Similarly, in most buildings (except Building 6 and 7) air was
observed flowing from the stair and elevator hoistways into the building on the upper levels with pressure
differential magnitudes ranging from -0.006 to 0.140 in. (0.040 in. W.G. average).
The shaft-to-building pressure differentials measured in this study suggest potentially large quantities of
air can migrate, floor-to-floor, via unprotected elevator shafts. More air may travel vertically in buildings
than is predicted by the simple hand calculations due to the complex interaction of forces impacting air
flow. Limited data collected, which was supported by CONTAM simulations, suggests that activation
of a stair pressurization system may significantly increase vertical air flow via unprotected elevator
shafts, particularly when unconditioned pressurization air is brought into the stairs and begins to lower
the temperature of the stairs relative to the building’s temperature.
The exterior-to-building stack force, under winter conditions, does not always translate proportionally
for shaft-to-building differential pressures. Although a building’s height and climate (outside
temperature) play important roles in determining vertical airflow movement within a building, other
variables such as architectural layout, leakage, wind effects, and ventilation systems should all be
considered. Hand calculations do not treat the building as a complete system; accounting for all variables
involved. Therefore, hand calculations may result in inaccurate shaft-to-building differential pressure
predictions. A comparison between measured and hand calculated stack forces show that hand
calculations should be used for first-order approximations only, using conservative building envelope
leakage (Asi/Aio ratio) assumptions.
Future studies should look to expand on this data set. Interesting data points would include warm
climates, buildings with operable openings, buildings with open floor layouts, and the impact of stairwell
pressurization systems (especially for systems that provide unconditioned air to the stairwells).
References
1. NFPA 92 (2012), Standard for Smoke Control Systems, National Fire Protection Association, Quincy,
Massachusetts, 2012.
2. Klote, J. H., Milke, J. A., Turnbull, P. G., Kashef, A., Ferreira M. J., (2012), Handbook of Smoke
Control Engineering, American Society for Heating Refrigeration and Air Conditioning Engineers,
Atlanta, GA, 2012.
3. Mowrer, F. W., Milke, J. A., Torero, J. L., (2004) “A Comparison of Driving Force for Smoke
Movement in Building,” Journal of fire Protection Engineering, Sage Publications, London, Vol. 14,
No. 4, 2004.
4. Walton, G. N. and Dols, Stuart (2005), “CONTAM 2.4 User Guide and Program Documentation,”
NISIR 7251, National Institute of Standards and Technology, November 2005.