characterization of sulfur flows in farm ... of sulfur flows in farm digesters at sheland farms...
TRANSCRIPT
CHARACTERIZATION OF SULFUR FLOWS
IN FARM DIGESTERS
at
SHELAND FARMS
Prepared for
THE NEW YORK STATE
ENERGY RESEARCH AND DEVELOPMENT AUTHORITY 17 Columbia Circle
Albany, NY 12203
Tom Fiesinger, Project Manager
Prepared by
DLTECH, INC. PO Box 3910
Ithaca, NY 14852
David C. Ludington, Ph.D.
DLtech, Inc.
And
Stanley Weeks, Ph.D.
Stanley A Weeks, LLC
4 Ashor Drive
Middle Grove, NY 12850
9443-1 September 2, 2008
i
TABLE OF CONTENTS
Section Page
1 DESCRIPTION……………………………………………………………………………. 1-1
2 RESULTS – 24 HOUR TEST, JANUARY 29-30, 2008…………..……………………… 2-1
3 RESULTS – 30 DAY TEST, NOVEMBER 16 to DECEMBER 15, 2007..…….………... 3-1
4 MASS FLOW OF SULFUR……………………………………………………………….. 4-1
Total Mixed Ration.……………………………………………………………… 4-1
Drinking Water…………………………………………………………………… 4-1
Manure………………….………………………………………………………… 4-2
Bedding….………….……………………………………………………………. 4-2
Milk………………………………………………………………………………. 4-3
Mass Flow of Manure…………………………………………………………….. 4-3
Biogas…………………………………………………………………………….. 4-6
APPENDIX………………………………………………………………………………………….. A-1

ii
TABLE OF FIGURES
Figure Page
2-1 Carbon Dioxide and Methane Concentration in Dry Biogas ………………..……………. 2-1 2-2 Carbon Dioxide Concentration Measured with Three Analyzers…………………………. 2-3
3-1 Diagram of Flow of Biogas at Sheland Farms………………………...……………………3-1 3-2 Biogas Flow at the Main and Engine Meters at Sheland Farms……….…………………. 3-2
3-3 Average Daily Temperature of Biogas at the Main Meter at Sheland Farms………………3-3
3-4 Concentration of Carbon Dioxide at Main Meter, Morning, Noon and Evening…………. 3-3
3-5 Concentration of Hydrogen Sulfide at Main Meter, Morning, Noon and Evening……….. 3-4
4-1 Digester Influent Pump Operation at Sheland Farms………………………..…………….. 4-4
4-2 Gallons in Reception Pit at Sheland Farms During a 12 Hour Period…………………….. 4-4
A-1 Schematic Drawing of Sheland Farms…..………………………………………………… A-1
A-2 Mass Flow Diagram of Sulfur, Sheland Farms…………………………………………… A-2

iii
TABLE OF TABLES
Table Page
2-1 Concentration of Carbon Dioxide and Hydrogen Sulfide…………………………………. 2-1
2-2 Statistical Analysis of Data from GEM 2000 Unit..……………………………………….. 2-2
3-1 Summary of Analysis of the Data Recorded During the 30 Day Test …………..……….. 3-1
3-2 Statistical Analysis of Concentration of CO2 and H2S for Morning, Noon and Evening….. 3-4
3-3 Analysis of the Concentration of Carbon Dioxide………………………………………….3-4
4-1 Numbers of Animals, TMR Fed and Sulfur Content………………………………………. 4-1
4-2 Sulfur in Cow Drinking Water…………………………………………………………….. 4-2
4-3 Properties of Raw Manure and Digester Influent and Effluent……………….…………… 4-2
4-4 Properties of Separated Solids at Sheland Farms …………………………………………. 4-3
4-5 Sulfur in Milk at Sheland Farms……………………………………….…………………... 4-3
4-6 Mass Balance Method for Determining Influent Total Solids……………………………... 4-5
4-7 Summary of Methods for Determining Mass Flow of Total Solids…………………..…… 4-6
4-8 Analysis of the Biogas ………………….…………………………………………………. 4-7
4-9 Summary of Sulfur Flow at Sheland Farms………………………………………...……… 4-7 A-1 Sheland Farms, 30 Day Test Data, Main Biogas Meter (Ahead of Condenser)…………… A-3
A-2 Sheland Farms, 30 Day Test Data, Engine Biogas Meter…………………………………..A-5
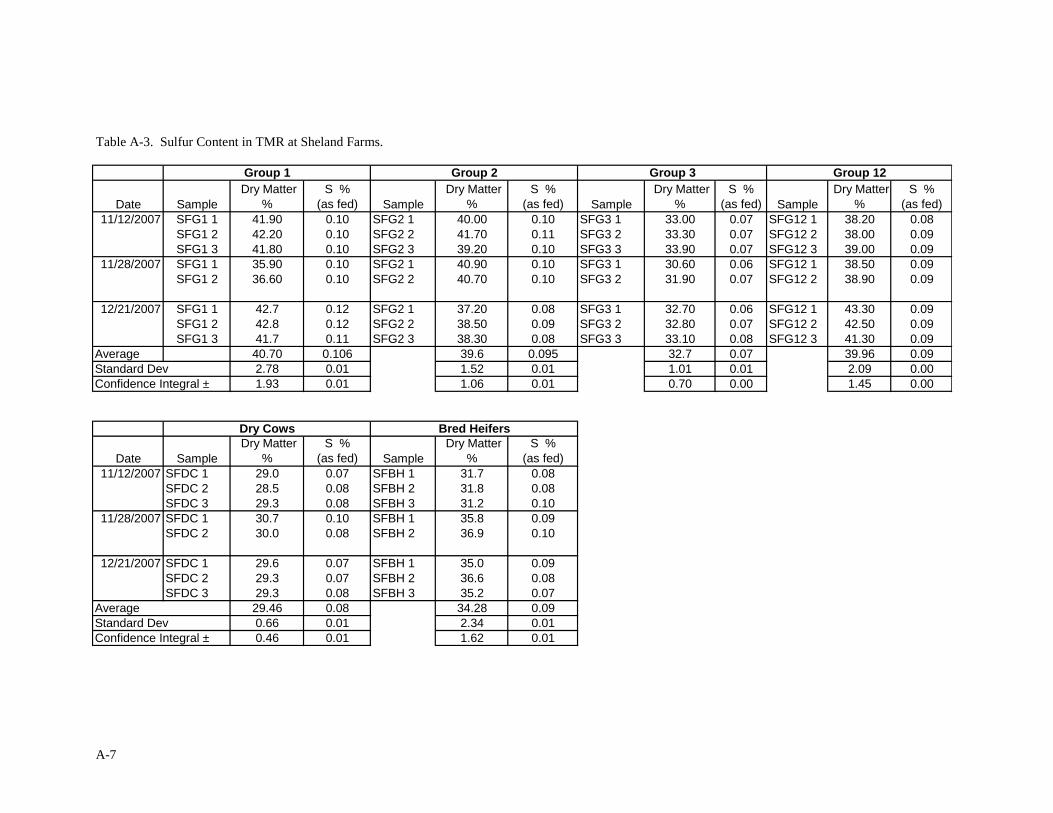
A-3 Sulfur Content in TMR at Sheland Farms…………………………………………………. A-6
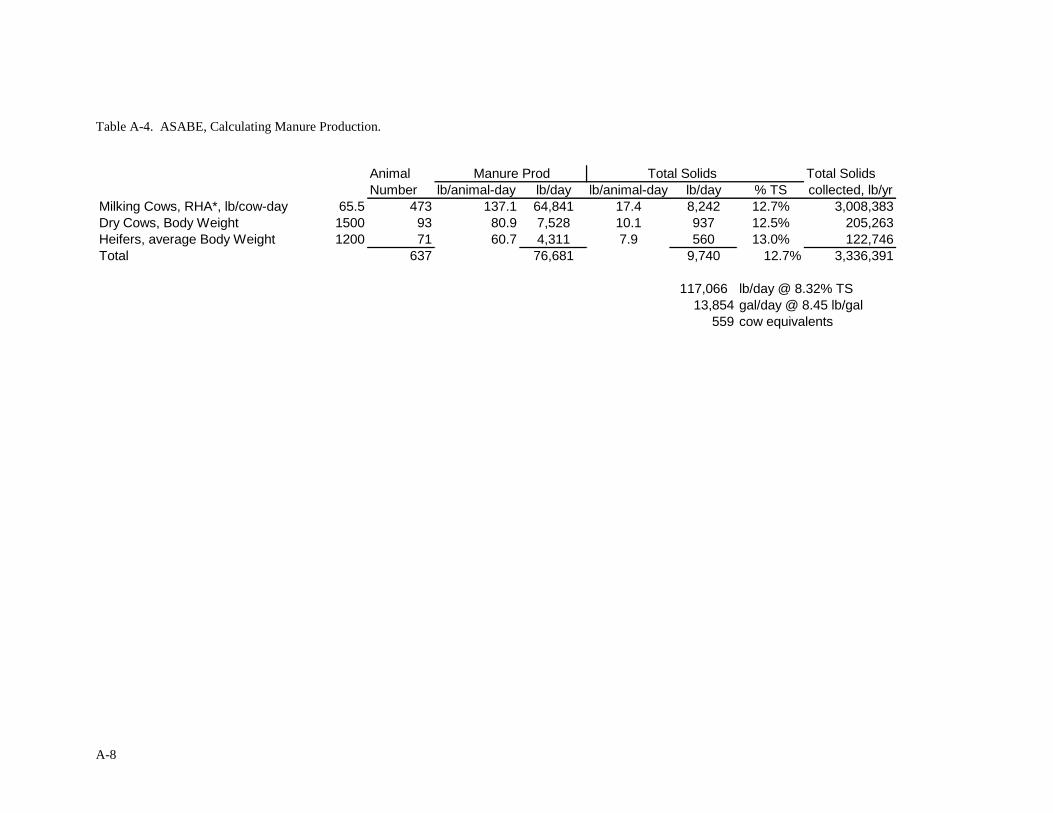
A-4 Cow Manure Production, Based on ASABE Equations…………………………………… A-7
1-1
Section 1
DESCRIPTION
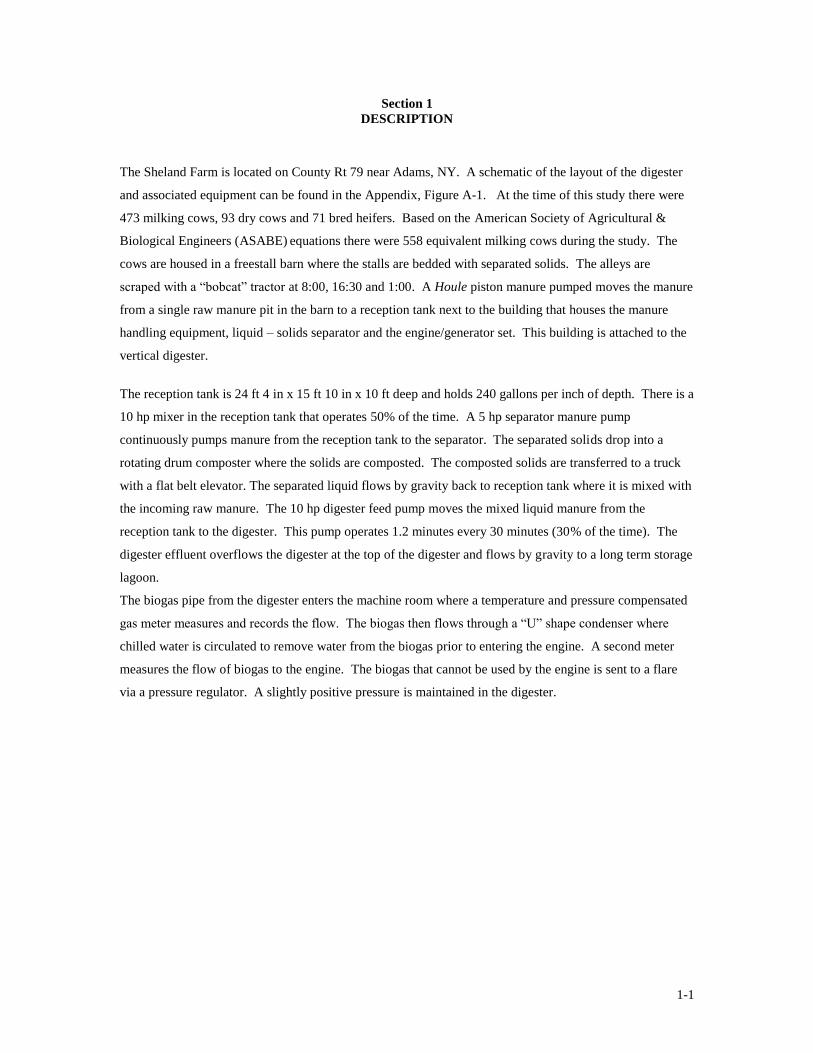
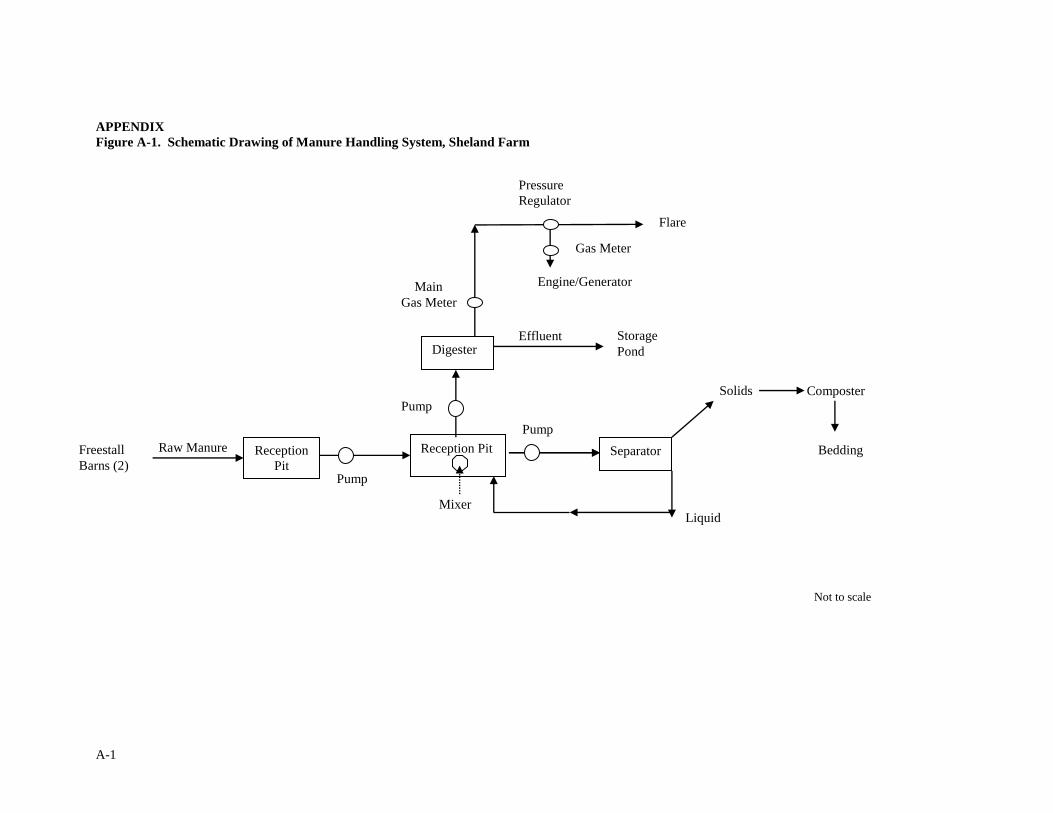
The Sheland Farm is located on County Rt 79 near Adams, NY. A schematic of the layout of the digester
and associated equipment can be found in the Appendix, Figure A-1. At the time of this study there were
473 milking cows, 93 dry cows and 71 bred heifers. Based on the American Society of Agricultural &
Biological Engineers (ASABE) equations there were 558 equivalent milking cows during the study. The
cows are housed in a freestall barn where the stalls are bedded with separated solids. The alleys are
scraped with a “bobcat” tractor at 8:00, 16:30 and 1:00. A Houle piston manure pumped moves the manure
from a single raw manure pit in the barn to a reception tank next to the building that houses the manure
handling equipment, liquid – solids separator and the engine/generator set. This building is attached to the
vertical digester.
The reception tank is 24 ft 4 in x 15 ft 10 in x 10 ft deep and holds 240 gallons per inch of depth. There is a
10 hp mixer in the reception tank that operates 50% of the time. A 5 hp separator manure pump
continuously pumps manure from the reception tank to the separator. The separated solids drop into a
rotating drum composter where the solids are composted. The composted solids are transferred to a truck
with a flat belt elevator. The separated liquid flows by gravity back to reception tank where it is mixed with
the incoming raw manure. The 10 hp digester feed pump moves the mixed liquid manure from the
reception tank to the digester. This pump operates 1.2 minutes every 30 minutes (30% of the time). The
digester effluent overflows the digester at the top of the digester and flows by gravity to a long term storage
lagoon.
The biogas pipe from the digester enters the machine room where a temperature and pressure compensated
gas meter measures and records the flow. The biogas then flows through a “U” shape condenser where
chilled water is circulated to remove water from the biogas prior to entering the engine. A second meter
measures the flow of biogas to the engine. The biogas that cannot be used by the engine is sent to a flare
via a pressure regulator. A slightly positive pressure is maintained in the digester.
2-1
Section 2
RESULTS – 24 HOUR TEST, JANUARY 29-30, 2008
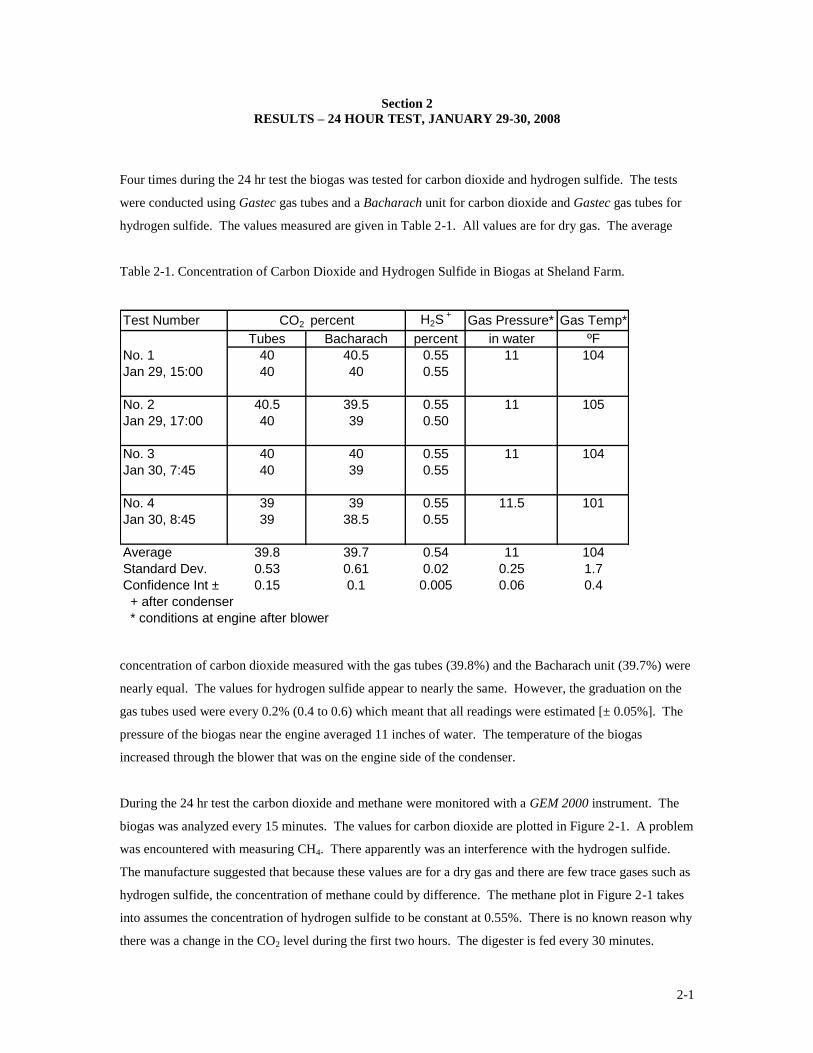
Four times during the 24 hr test the biogas was tested for carbon dioxide and hydrogen sulfide. The tests
were conducted using Gastec gas tubes and a Bacharach unit for carbon dioxide and Gastec gas tubes for
hydrogen sulfide. The values measured are given in Table 2-1. All values are for dry gas. The average
Table 2-1. Concentration of Carbon Dioxide and Hydrogen Sulfide in Biogas at Sheland Farm.
Test Number H2S +
Gas Pressure* Gas Temp*
Tubes Bacharach percent in water ºF
No. 1 40 40.5 0.55 11 104
Jan 29, 15:00 40 40 0.55
No. 2 40.5 39.5 0.55 11 105
Jan 29, 17:00 40 39 0.50
No. 3 40 40 0.55 11 104
Jan 30, 7:45 40 39 0.55
No. 4 39 39 0.55 11.5 101
Jan 30, 8:45 39 38.5 0.55
Average 39.8 39.7 0.54 11 104
Standard Dev. 0.53 0.61 0.02 0.25 1.7
Confidence Int ± 0.15 0.1 0.005 0.06 0.4
+ after condenser
* conditions at engine after blower
CO2 percent
concentration of carbon dioxide measured with the gas tubes (39.8%) and the Bacharach unit (39.7%) were
nearly equal. The values for hydrogen sulfide appear to nearly the same. However, the graduation on the
gas tubes used were every 0.2% (0.4 to 0.6) which meant that all readings were estimated [± 0.05%]. The
pressure of the biogas near the engine averaged 11 inches of water. The temperature of the biogas
increased through the blower that was on the engine side of the condenser.
During the 24 hr test the carbon dioxide and methane were monitored with a GEM 2000 instrument. The
biogas was analyzed every 15 minutes. The values for carbon dioxide are plotted in Figure 2-1. A problem
was encountered with measuring CH4. There apparently was an interference with the hydrogen sulfide.
The manufacture suggested that because these values are for a dry gas and there are few trace gases such as
hydrogen sulfide, the concentration of methane could by difference. The methane plot in Figure 2-1 takes
into assumes the concentration of hydrogen sulfide to be constant at 0.55%. There is no known reason why
there was a change in the CO2 level during the first two hours. The digester is fed every 30 minutes.

2-2
Figure 2-1. Carbon Dioxide and Methane Concentration in Dry Biogas at Sheland Farms.
0
10
20
30
40
50
60
70
15:1
0
16:1
0
17:1
0
18:1
0
19:1
0
20:1
0
21:1
0
22:1
0
23:1
0
0:1
0
1:1
0
2:1
0
3:1
0
4:1
0
5:1
0
6:1
0
7:1
0
8:1
0
9:1
0
Time, 29 & 30 Jan 08
Concentr
atio
n, perc
ent
Carbon Dioxide Methane
The statistical analysis of the data recorded by the GEM 2000 is shown in Table 2-2. The standard
Table 2-2. Statistical Analysis of Data from GEM 2000 Unit.
Gas Average Maximum Minimum Std Dev Confidence
CO2 40.9 43.9 39.9 0.77 0.18
CH4 58.5 59.6 55.6 0.77 0.18
deviation and confidence interval are the same for both gases because the concentration of methane was
calculated by difference. The average value of carbon dioxide as measured by all three methods was within
1.2% of each other.
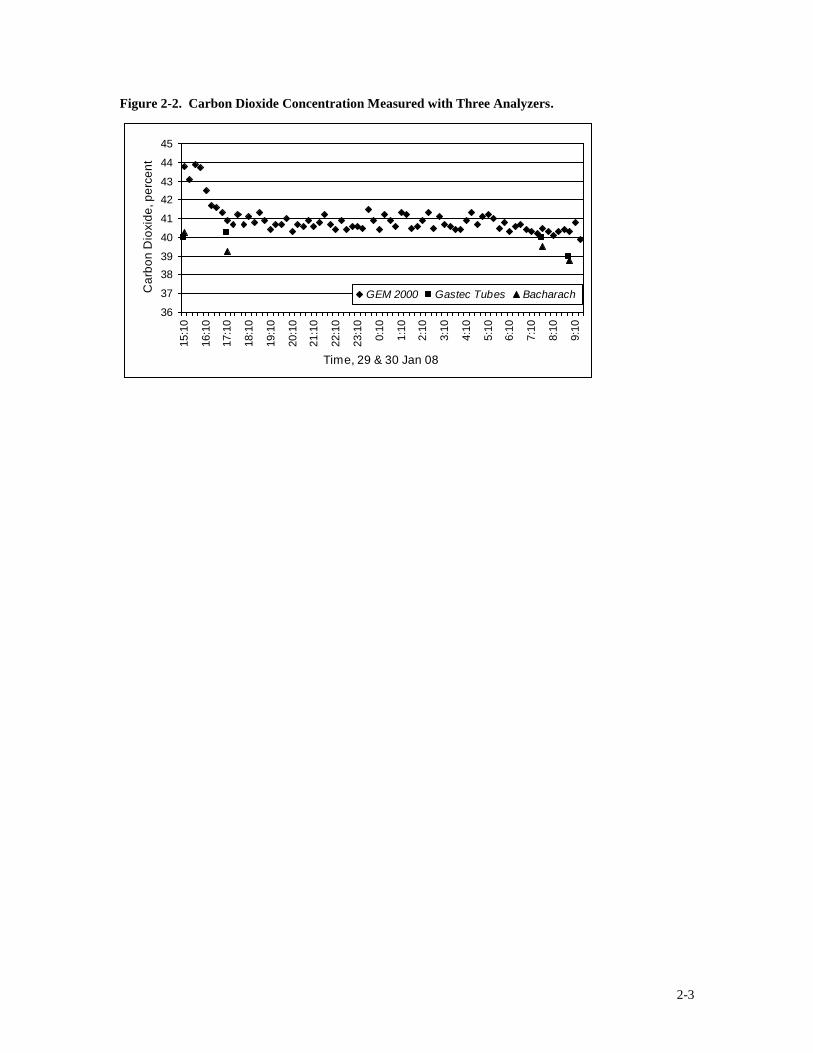
The percent carbon dioxide measured with the three different analyzers is shown in Figure 2-2. The change
in concentration during the first two hours is seen clearly. However, the concentration measured with the
gas tubes and Bacharach unit did not show this decline. Instead they showed a more consistent
concentration throughout the 24 hours. Because concentration of methane in biogas will generally be based
on the percent carbon dioxide measured with a Bacharach unit, validating this procedure is important.
2-3
Figure 2-2. Carbon Dioxide Concentration Measured with Three Analyzers.
36
37
38
39
40
41
42
43
44
45
15:1
0
16:1
0
17:1
0
18:1
0
19:1
0
20:1
0
21:1
0
22:1
0
23:1
0
0:1
0
1:1
0
2:1
0
3:1
0
4:1
0
5:1
0
6:1
0
7:1
0
8:1
0
9:1
0
Time, 29 & 30 Jan 08
Ca
rbo
n D
ioxid
e, p
erc
en
t
GEM 2000 Gastec Tubes Bacharach
3-1
Section 3
RESULTS: 30 DAY TEST, NOVEMBER 16 – DECEMBER 15, 2007
During the 30 day test the operator recorded data free time each day. The following data was recorded;
biogas temperature and pressure at the meter, reading from the biogas meters, two samples of biogas each
for hydrogen sulfide (gas tubes) and carbon dioxide (Bacharach unit). The raw data from the 30 day test
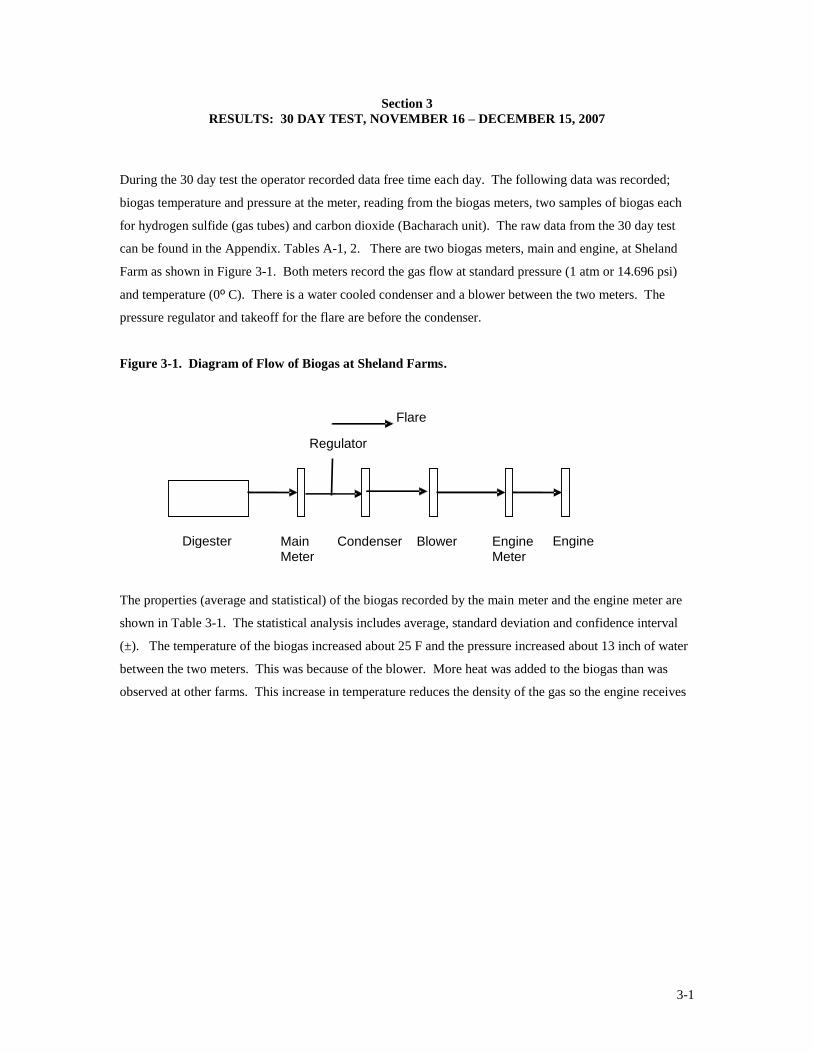
can be found in the Appendix. Tables A-1, 2. There are two biogas meters, main and engine, at Sheland
Farm as shown in Figure 3-1. Both meters record the gas flow at standard pressure (1 atm or 14.696 psi)
and temperature (0º C). There is a water cooled condenser and a blower between the two meters. The
pressure regulator and takeoff for the flare are before the condenser.
Figure 3-1. Diagram of Flow of Biogas at Sheland Farms.
The properties (average and statistical) of the biogas recorded by the main meter and the engine meter are
shown in Table 3-1. The statistical analysis includes average, standard deviation and confidence interval
(±). The temperature of the biogas increased about 25 F and the pressure increased about 13 inch of water
between the two meters. This was because of the blower. More heat was added to the biogas than was
observed at other farms. This increase in temperature reduces the density of the gas so the engine receives
Main Meter
Digester Condenser Blower Engine Meter
Engine
Regulator
Flare
3-2
Table 3-1. Summary of Analysis of the Data Recorded During the 30 Day Test at Sheland Farms.
fewer pounds of methane per cubic foot of gas drawn into the engine. The concentration of hydrogen
sulfide and carbon dioxide were similar. However, because the temperature and pressure of the biogas
where these samples were taken were not the same, the sulfur and carbon dioxide would be different. For
the sulfur analysis the flow and properties at the main meter will be used.
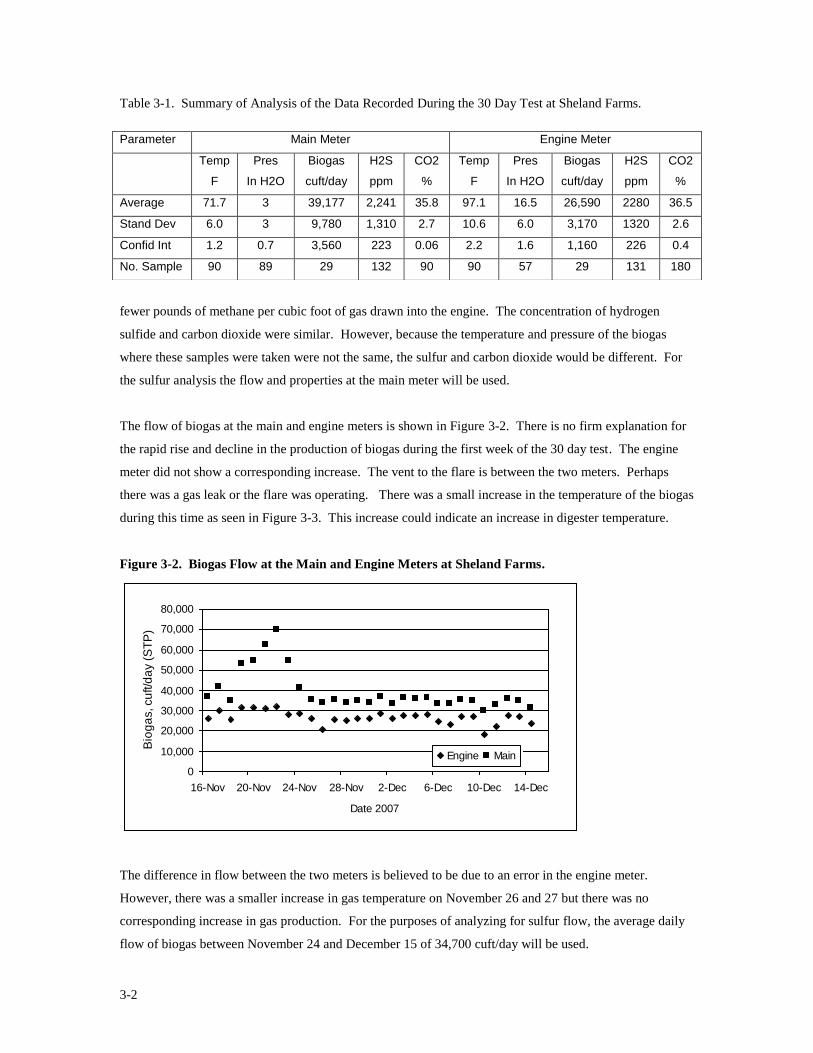
The flow of biogas at the main and engine meters is shown in Figure 3-2. There is no firm explanation for
the rapid rise and decline in the production of biogas during the first week of the 30 day test. The engine
meter did not show a corresponding increase. The vent to the flare is between the two meters. Perhaps
there was a gas leak or the flare was operating. There was a small increase in the temperature of the biogas
during this time as seen in Figure 3-3. This increase could indicate an increase in digester temperature.
Figure 3-2. Biogas Flow at the Main and Engine Meters at Sheland Farms.
0
10,000
20,000
30,000
40,000
50,000
60,000
70,000
80,000
16-Nov 20-Nov 24-Nov 28-Nov 2-Dec 6-Dec 10-Dec 14-Dec
Date 2007
Bio
ga
s, cu
ft/d
ay (
ST
P)
Engine Main
The difference in flow between the two meters is believed to be due to an error in the engine meter.
However, there was a smaller increase in gas temperature on November 26 and 27 but there was no
corresponding increase in gas production. For the purposes of analyzing for sulfur flow, the average daily
flow of biogas between November 24 and December 15 of 34,700 cuft/day will be used.
Parameter Main Meter Engine Meter
Temp
F
Pres
In H2O
Biogas
cuft/day
H2S
ppm
CO2
%
Temp
F
Pres
In H2O
Biogas
cuft/day
H2S
ppm
CO2
%
Average 71.7 3 39,177 2,241 35.8 97.1 16.5 26,590 2280 36.5
Stand Dev 6.0 3 9,780 1,310 2.7 10.6 6.0 3,170 1320 2.6
Confid Int 1.2 0.7 3,560 223 0.06 2.2 1.6 1,160 226 0.4
No. Sample 90 89 29 132 90 90 57 29 131 180
3-3
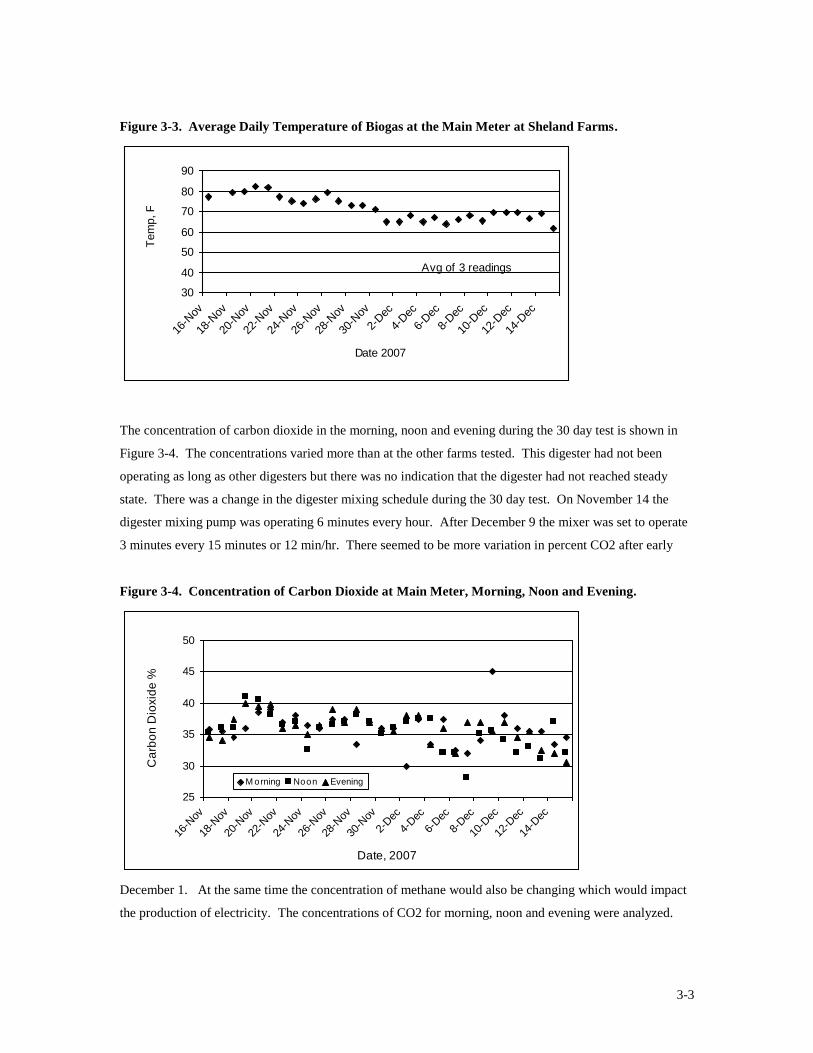
Figure 3-3. Average Daily Temperature of Biogas at the Main Meter at Sheland Farms.
30
40
50
60
70
80
90
16-N
ov
18-N
ov
20-N
ov
22-N
ov
24-N
ov
26-N
ov
28-N
ov
30-N
ov
2-Dec
4-Dec
6-Dec
8-Dec
10-D
ec
12-D
ec
14-D
ec
Date 2007
Tem
p, F
(Avg of 3 readings)
Avg of 3 readings
The concentration of carbon dioxide in the morning, noon and evening during the 30 day test is shown in
Figure 3-4. The concentrations varied more than at the other farms tested. This digester had not been
operating as long as other digesters but there was no indication that the digester had not reached steady
state. There was a change in the digester mixing schedule during the 30 day test. On November 14 the
digester mixing pump was operating 6 minutes every hour. After December 9 the mixer was set to operate
3 minutes every 15 minutes or 12 min/hr. There seemed to be more variation in percent CO2 after early
Figure 3-4. Concentration of Carbon Dioxide at Main Meter, Morning, Noon and Evening.
25
30
35
40
45
50
16-N
ov
18-N
ov
20-N
ov
22-N
ov
24-N
ov
26-N
ov
28-N
ov
30-N
ov
2-Dec
4-Dec
6-Dec
8-Dec
10-D
ec
12-D
ec
14-D
ec
Date, 2007
Ca
rbo
n D
ioxid
e %
M orning Noon Evening
December 1. At the same time the concentration of methane would also be changing which would impact
the production of electricity. The concentrations of CO2 for morning, noon and evening were analyzed.

3-4
The results are shown in Table 3-2. The average concentration of the three times during the day are similar
as are the standard deviations and confidence levels.
Table 3-2. Statistical Analysis of Concentration of CO2 and H2S for Morning, Noon and Evening.
Carbon Dioxide, percent Hydrogen Sulfide, ppm Analysis Morning Noon Evening Average Morning Noon Evening Average
Average 36.0 35.4 36.1 35.8 2,108 2,206 2,157 2,238
Stdev 2.7 2.8 2.4 2.0 1,397 1,325 1,387 1,103
Confid 0.97 1.03 0.87 0.72 508 500 523 401
The concentration of carbon dioxide was also analyzed before and after December 1. The results are
shown in Table 3-3. The average concentration after December 1 increased about 2% while the standard
deviation increased nearly 70% and confidence interval increased 80%.
Table 3-3 Analysis of the Concentration of Carbon Dioxide.
Dates Average Stdev Confidence
Through Dec 1 36.8 1.78 0.50
After Dec 1 34.7 3.01 0.91
The concentration of hydrogen sulfide at the main meter during the 30 day test is shown in Figure 3-5.
Again there was considerable variation after November 25 with no reason why this should be the case. To
emphasize this variation the average daily values were plotted and are shown as X. The values for
morning, noon and evening were also analyzed. The results are shown in Table 3-2. The average, standard
deviation and confidence intervals were all similar. There was no greater variability between days whether
morning, noon or evening.
Figure 3-5. Concentration of Hydrogen Sulfide at Main Meter, Morning, Noon and Evening.
0
500
1,000
1,500
2,000
2,500
3,000
3,500
4,000
4,500
5,000
16-N
ov
18-N
ov
20-N
ov
22-N
ov
24-N
ov
26-N
ov
28-N
ov
30-N
ov
2-Dec
4-Dec
6-Dec
8-Dec
10-D
ec
12-D
ec
14-D
ec
Date, 2007
Hyd
rog
en
Su
lfid
e%
M orning Noon Evening Daily Average
4-1
Section 4
MASS FLOW OF SULFUR
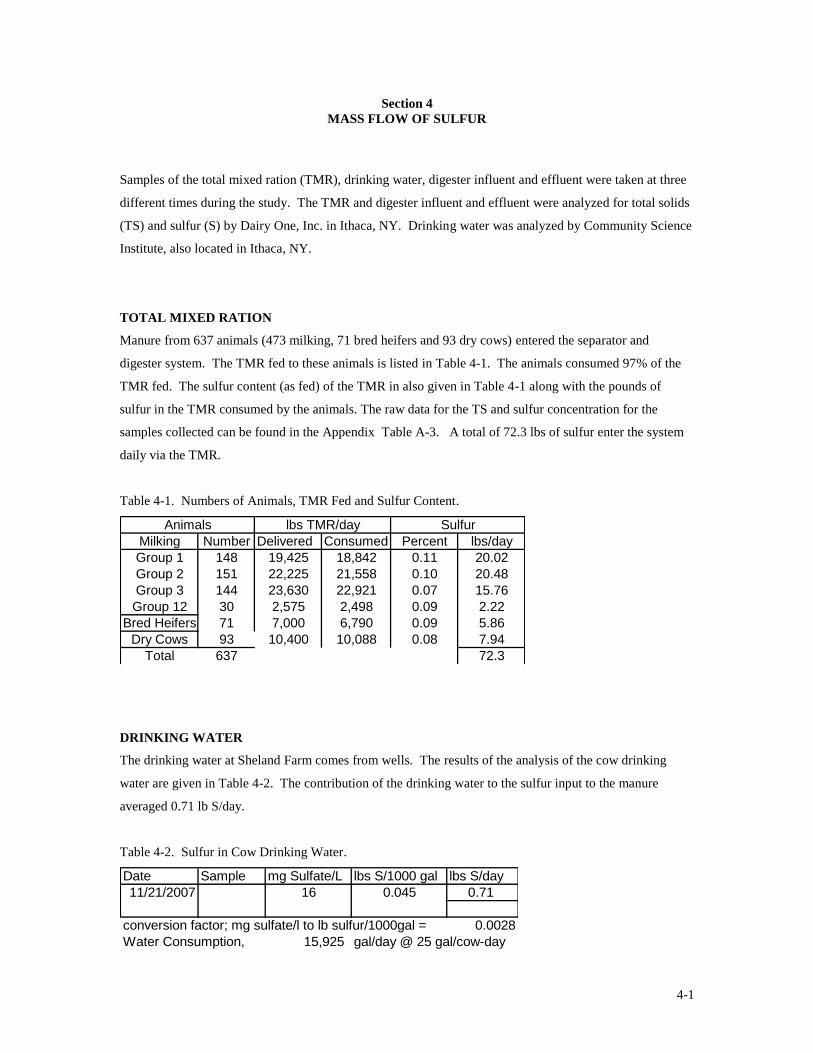
Samples of the total mixed ration (TMR), drinking water, digester influent and effluent were taken at three
different times during the study. The TMR and digester influent and effluent were analyzed for total solids
(TS) and sulfur (S) by Dairy One, Inc. in Ithaca, NY. Drinking water was analyzed by Community Science
Institute, also located in Ithaca, NY.
TOTAL MIXED RATION
Manure from 637 animals (473 milking, 71 bred heifers and 93 dry cows) entered the separator and
digester system. The TMR fed to these animals is listed in Table 4-1. The animals consumed 97% of the
TMR fed. The sulfur content (as fed) of the TMR in also given in Table 4-1 along with the pounds of
sulfur in the TMR consumed by the animals. The raw data for the TS and sulfur concentration for the
samples collected can be found in the Appendix Table A-3. A total of 72.3 lbs of sulfur enter the system
daily via the TMR.
Table 4-1. Numbers of Animals, TMR Fed and Sulfur Content.
Milking Number Delivered Consumed Percent lbs/day
Group 1 148 19,425 18,842 0.11 20.02
Group 2 151 22,225 21,558 0.10 20.48
Group 3 144 23,630 22,921 0.07 15.76
Group 12 30 2,575 2,498 0.09 2.22
Bred Heifers 71 7,000 6,790 0.09 5.86
Dry Cows 93 10,400 10,088 0.08 7.94
Total 637 72.3
lbs TMR/day SulfurAnimals
DRINKING WATER
The drinking water at Sheland Farm comes from wells. The results of the analysis of the cow drinking
water are given in Table 4-2. The contribution of the drinking water to the sulfur input to the manure
averaged 0.71 lb S/day.
Table 4-2. Sulfur in Cow Drinking Water.
Date Sample mg Sulfate/L lbs S/1000 gal lbs S/day
11/21/2007 16 0.045 0.71
conversion factor; mg sulfate/l to lb sulfur/1000gal = 0.0028
Water Consumption, 15,925 gal/day @ 25 gal/cow-day
4-2
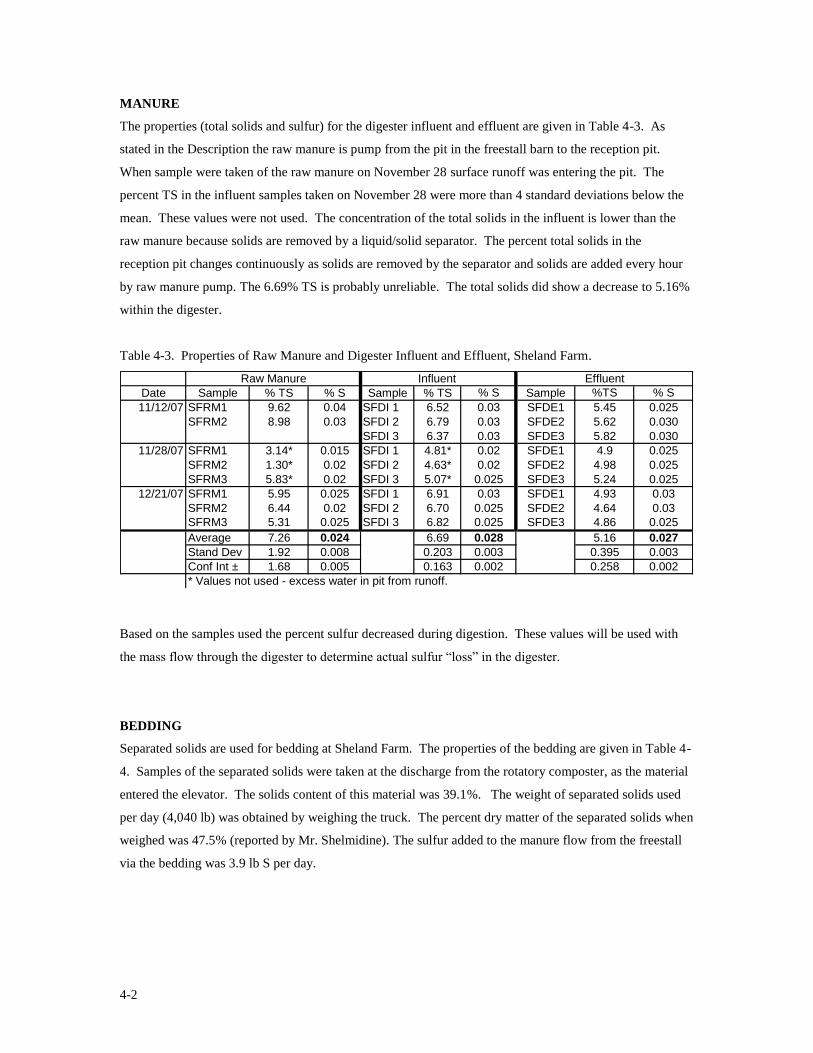
MANURE
The properties (total solids and sulfur) for the digester influent and effluent are given in Table 4-3. As
stated in the Description the raw manure is pump from the pit in the freestall barn to the reception pit.
When sample were taken of the raw manure on November 28 surface runoff was entering the pit. The
percent TS in the influent samples taken on November 28 were more than 4 standard deviations below the
mean. These values were not used. The concentration of the total solids in the influent is lower than the
raw manure because solids are removed by a liquid/solid separator. The percent total solids in the
reception pit changes continuously as solids are removed by the separator and solids are added every hour
by raw manure pump. The 6.69% TS is probably unreliable. The total solids did show a decrease to 5.16%
within the digester.
Table 4-3. Properties of Raw Manure and Digester Influent and Effluent, Sheland Farm.
Date Sample % TS % S Sample % TS % S Sample %TS % S
11/12/07 SFRM1 9.62 0.04 SFDI 1 6.52 0.03 SFDE1 5.45 0.025
SFRM2 8.98 0.03 SFDI 2 6.79 0.03 SFDE2 5.62 0.030
SFDI 3 6.37 0.03 SFDE3 5.82 0.030
11/28/07 SFRM1 3.14* 0.015 SFDI 1 4.81* 0.02 SFDE1 4.9 0.025
SFRM2 1.30* 0.02 SFDI 2 4.63* 0.02 SFDE2 4.98 0.025
SFRM3 5.83* 0.02 SFDI 3 5.07* 0.025 SFDE3 5.24 0.025
12/21/07 SFRM1 5.95 0.025 SFDI 1 6.91 0.03 SFDE1 4.93 0.03
SFRM2 6.44 0.02 SFDI 2 6.70 0.025 SFDE2 4.64 0.03
SFRM3 5.31 0.025 SFDI 3 6.82 0.025 SFDE3 4.86 0.025
Average 7.26 0.024 6.69 0.028 5.16 0.027
Stand Dev 1.92 0.008 0.203 0.003 0.395 0.003
Conf Int ± 1.68 0.005 0.163 0.002 0.258 0.002
* Values not used - excess water in pit from runoff.
EffluentInfluent Raw Manure
Based on the samples used the percent sulfur decreased during digestion. These values will be used with
the mass flow through the digester to determine actual sulfur “loss” in the digester.
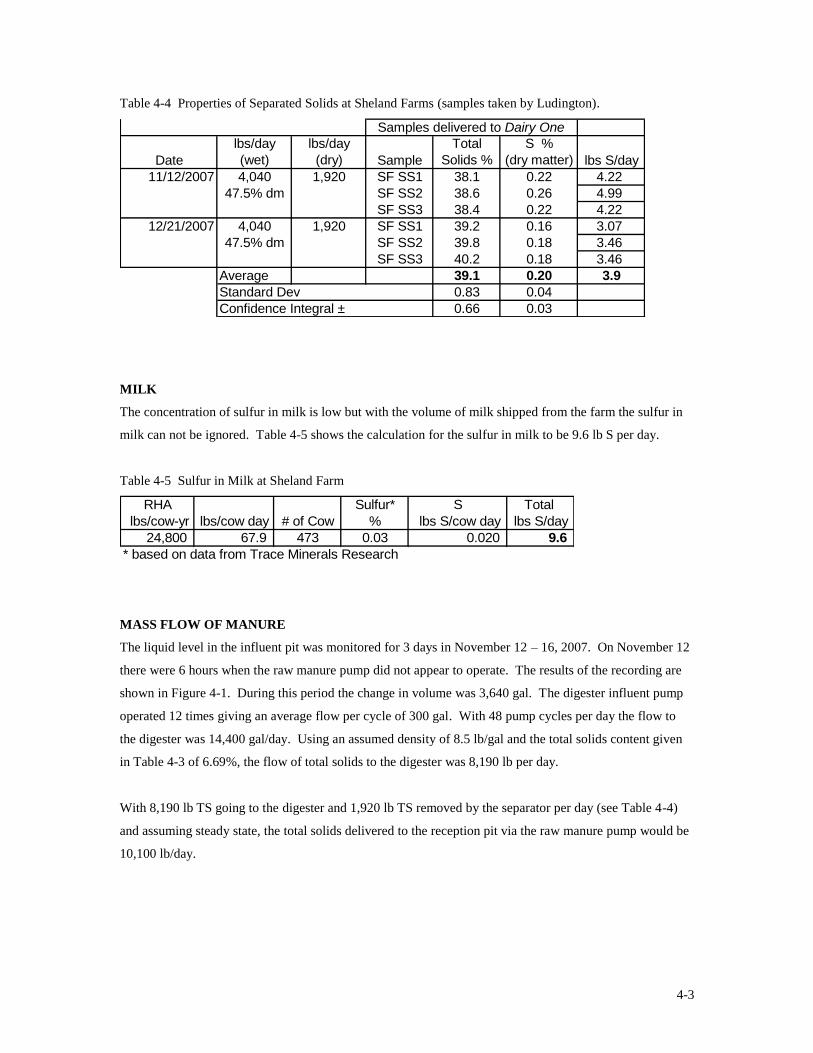
BEDDING
Separated solids are used for bedding at Sheland Farm. The properties of the bedding are given in Table 4-
4. Samples of the separated solids were taken at the discharge from the rotatory composter, as the material
entered the elevator. The solids content of this material was 39.1%. The weight of separated solids used
per day (4,040 lb) was obtained by weighing the truck. The percent dry matter of the separated solids when
weighed was 47.5% (reported by Mr. Shelmidine). The sulfur added to the manure flow from the freestall
via the bedding was 3.9 lb S per day.
4-3
Table 4-4 Properties of Separated Solids at Sheland Farms (samples taken by Ludington).
Date
lbs/day
(wet)
lbs/day
(dry) Sample
Total
Solids %
S %
(dry matter) lbs S/day
11/12/2007 4,040 1,920 SF SS1 38.1 0.22 4.22
47.5% dm SF SS2 38.6 0.26 4.99
SF SS3 38.4 0.22 4.22
12/21/2007 4,040 1,920 SF SS1 39.2 0.16 3.07
47.5% dm SF SS2 39.8 0.18 3.46
SF SS3 40.2 0.18 3.46
Average 39.1 0.20 3.9
Standard Dev 0.83 0.04
Confidence Integral ± 0.66 0.03
Samples delivered to Dairy One
MILK
The concentration of sulfur in milk is low but with the volume of milk shipped from the farm the sulfur in
milk can not be ignored. Table 4-5 shows the calculation for the sulfur in milk to be 9.6 lb S per day.
Table 4-5 Sulfur in Milk at Sheland Farm
RHA Sulfur* S Total
lbs/cow-yr lbs/cow day # of Cow % lbs S/cow day lbs S/day
24,800 67.9 473 0.03 0.020 9.6
* based on data from Trace Minerals Research
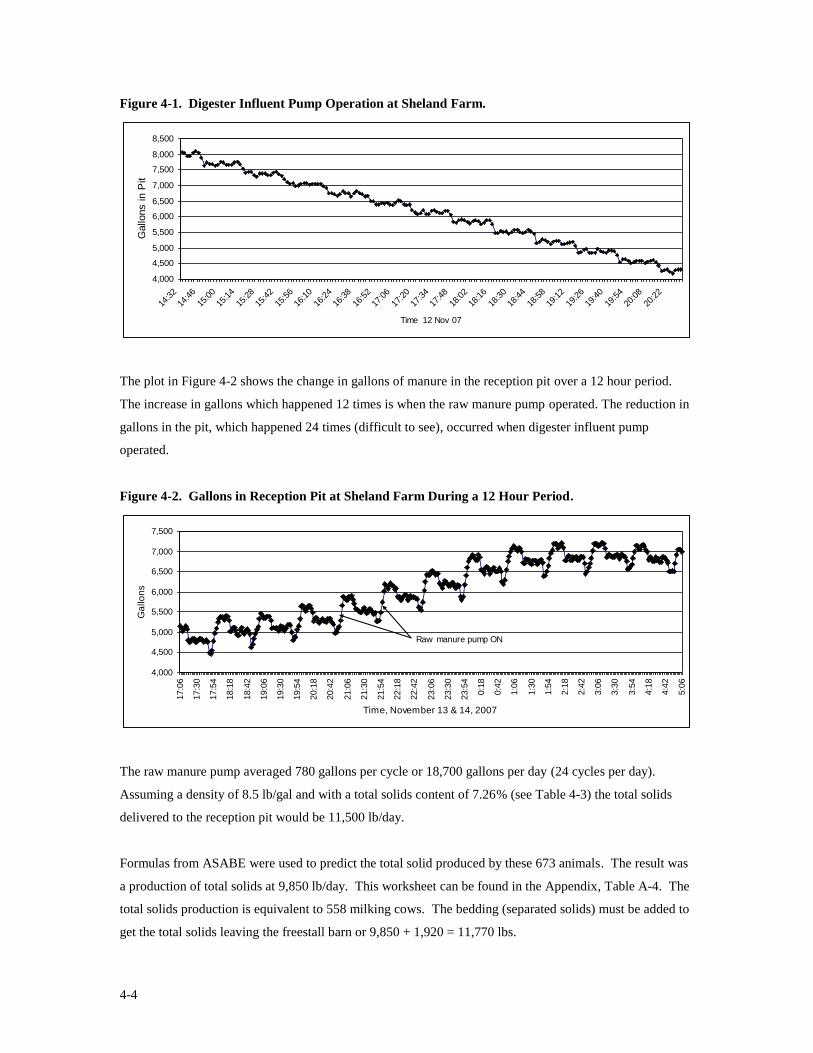
MASS FLOW OF MANURE
The liquid level in the influent pit was monitored for 3 days in November 12 – 16, 2007. On November 12
there were 6 hours when the raw manure pump did not appear to operate. The results of the recording are
shown in Figure 4-1. During this period the change in volume was 3,640 gal. The digester influent pump
operated 12 times giving an average flow per cycle of 300 gal. With 48 pump cycles per day the flow to
the digester was 14,400 gal/day. Using an assumed density of 8.5 lb/gal and the total solids content given
in Table 4-3 of 6.69%, the flow of total solids to the digester was 8,190 lb per day.
With 8,190 lb TS going to the digester and 1,920 lb TS removed by the separator per day (see Table 4-4)
and assuming steady state, the total solids delivered to the reception pit via the raw manure pump would be
10,100 lb/day.
4-4
Figure 4-1. Digester Influent Pump Operation at Sheland Farm.
4,000
4,500
5,000
5,500
6,000
6,500
7,000
7,500
8,000
8,500
14:3
2
14:4
6
15:0
0
15:1
4
15:2
8
15:4
2
15:5
6
16:1
0
16:2
4
16:3
8
16:5
2
17:0
6
17:2
0
17:3
4
17:4
8
18:0
2
18:1
6
18:3
0
18:4
4
18:5
8
19:1
2
19:2
6
19:4
0
19:5
4
20:0
8
20:2
2
Time 12 Nov 07
Gallo
ns in P
it
The plot in Figure 4-2 shows the change in gallons of manure in the reception pit over a 12 hour period.
The increase in gallons which happened 12 times is when the raw manure pump operated. The reduction in
gallons in the pit, which happened 24 times (difficult to see), occurred when digester influent pump
operated.
Figure 4-2. Gallons in Reception Pit at Sheland Farm During a 12 Hour Period.
4,000
4,500
5,000
5,500
6,000
6,500
7,000
7,500
17:0
6
17:3
0
17:5
4
18:1
8
18:4
2
19:0
6
19:3
0
19:5
4
20:1
8
20:4
2
21:0
6
21:3
0
21:5
4
22:1
8
22:4
2
23:0
6
23:3
0
23:5
4
0:1
8
0:4
2
1:0
6
1:3
0
1:5
4
2:1
8
2:4
2
3:0
6
3:3
0
3:5
4
4:1
8
4:4
2
5:0
6
Time, November 13 & 14, 2007
Ga
llo
ns
Raw manure pump ON
The raw manure pump averaged 780 gallons per cycle or 18,700 gallons per day (24 cycles per day).
Assuming a density of 8.5 lb/gal and with a total solids content of 7.26% (see Table 4-3) the total solids
delivered to the reception pit would be 11,500 lb/day.
Formulas from ASABE were used to predict the total solid produced by these 673 animals. The result was
a production of total solids at 9,850 lb/day. This worksheet can be found in the Appendix, Table A-4. The
total solids production is equivalent to 558 milking cows. The bedding (separated solids) must be added to
get the total solids leaving the freestall barn or 9,850 + 1,920 = 11,770 lbs.
4-5
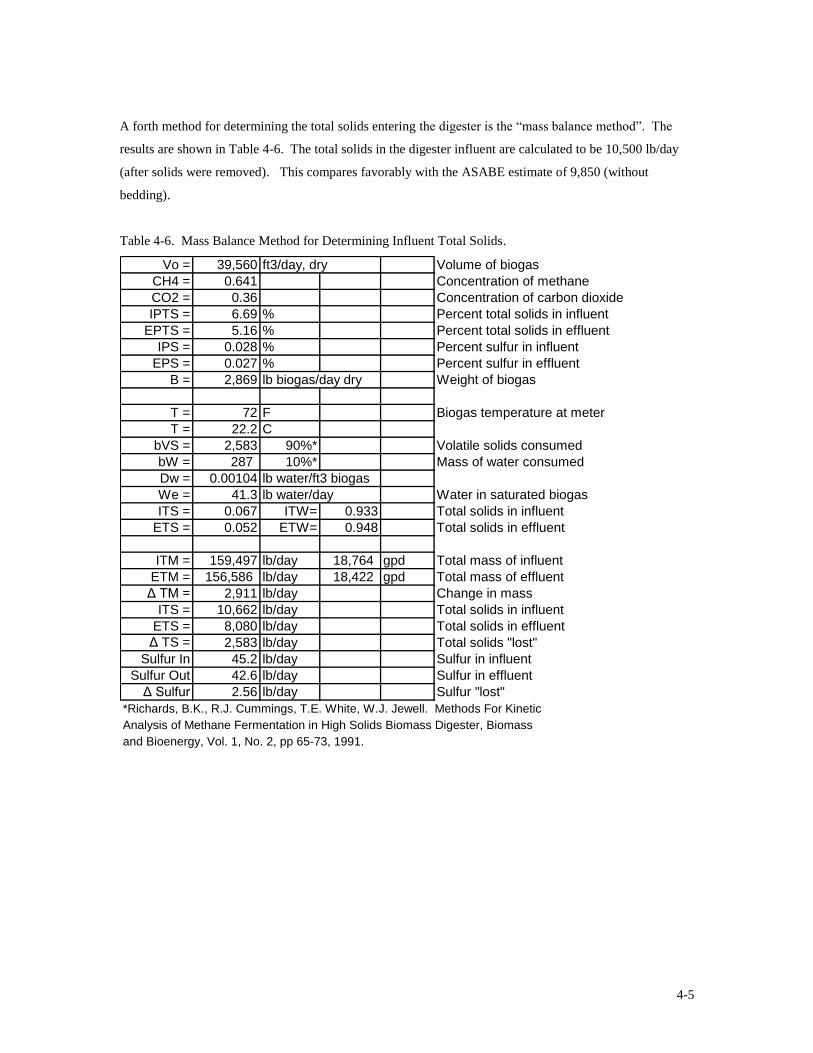
A forth method for determining the total solids entering the digester is the “mass balance method”. The
results are shown in Table 4-6. The total solids in the digester influent are calculated to be 10,500 lb/day
(after solids were removed). This compares favorably with the ASABE estimate of 9,850 (without
bedding).
Table 4-6. Mass Balance Method for Determining Influent Total Solids.
Vo = 39,560 ft3/day, dry Volume of biogas
CH4 = 0.641 Concentration of methane
CO2 = 0.36 Concentration of carbon dioxide
IPTS = 6.69 % Percent total solids in influent
EPTS = 5.16 % Percent total solids in effluent
IPS = 0.028 % Percent sulfur in influent
EPS = 0.027 % Percent sulfur in effluent
B = 2,869 lb biogas/day dry Weight of biogas
T = 72 F Biogas temperature at meter
T = 22.2 C
bVS = 2,583 90%* Volatile solids consumed
bW = 287 10%* Mass of water consumed
Dw = 0.00104 lb water/ft3 biogas
We = 41.3 lb water/day Water in saturated biogas
ITS = 0.067 ITW= 0.933 Total solids in influent
ETS = 0.052 ETW= 0.948 Total solids in effluent
ITM = 159,497 lb/day 18,764 gpd Total mass of influent
ETM = 156,586 lb/day 18,422 gpd Total mass of effluent
Δ TM = 2,911 lb/day Change in mass
ITS = 10,662 lb/day Total solids in influent
ETS = 8,080 lb/day Total solids in effluent
Δ TS = 2,583 lb/day Total solids "lost"
Sulfur In 45.2 lb/day Sulfur in influent
Sulfur Out 42.6 lb/day Sulfur in effluent
Δ Sulfur 2.56 lb/day Sulfur "lost"
*Richards, B.K., R.J. Cummings, T.E. White, W.J. Jewell. Methods For Kinetic
Analysis of Methane Fermentation in High Solids Biomass Digester, Biomass
and Bioenergy, Vol. 1, No. 2, pp 65-73, 1991.
4-6
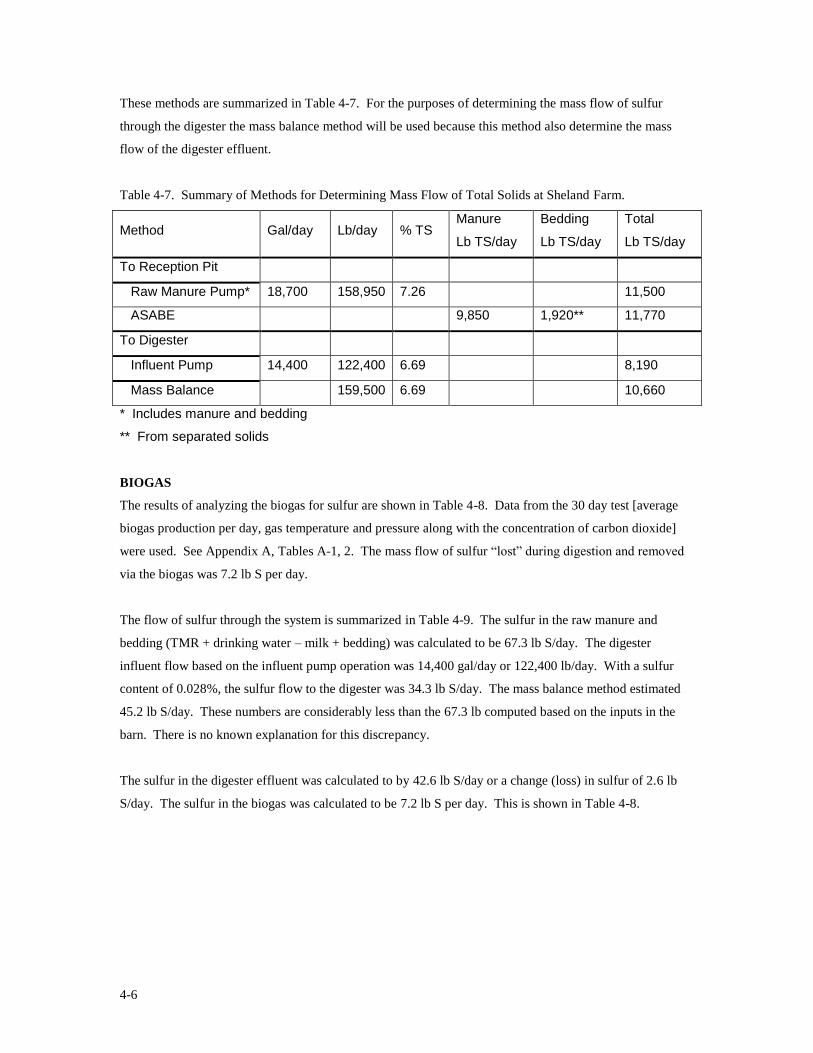
These methods are summarized in Table 4-7. For the purposes of determining the mass flow of sulfur
through the digester the mass balance method will be used because this method also determine the mass
flow of the digester effluent.
Table 4-7. Summary of Methods for Determining Mass Flow of Total Solids at Sheland Farm.
Method Gal/day Lb/day % TS Manure
Lb TS/day
Bedding
Lb TS/day
Total
Lb TS/day
To Reception Pit
Raw Manure Pump* 18,700 158,950 7.26 11,500
ASABE 9,850 1,920** 11,770
To Digester
Influent Pump 14,400 122,400 6.69 8,190
Mass Balance 159,500 6.69 10,660
* Includes manure and bedding
** From separated solids
BIOGAS
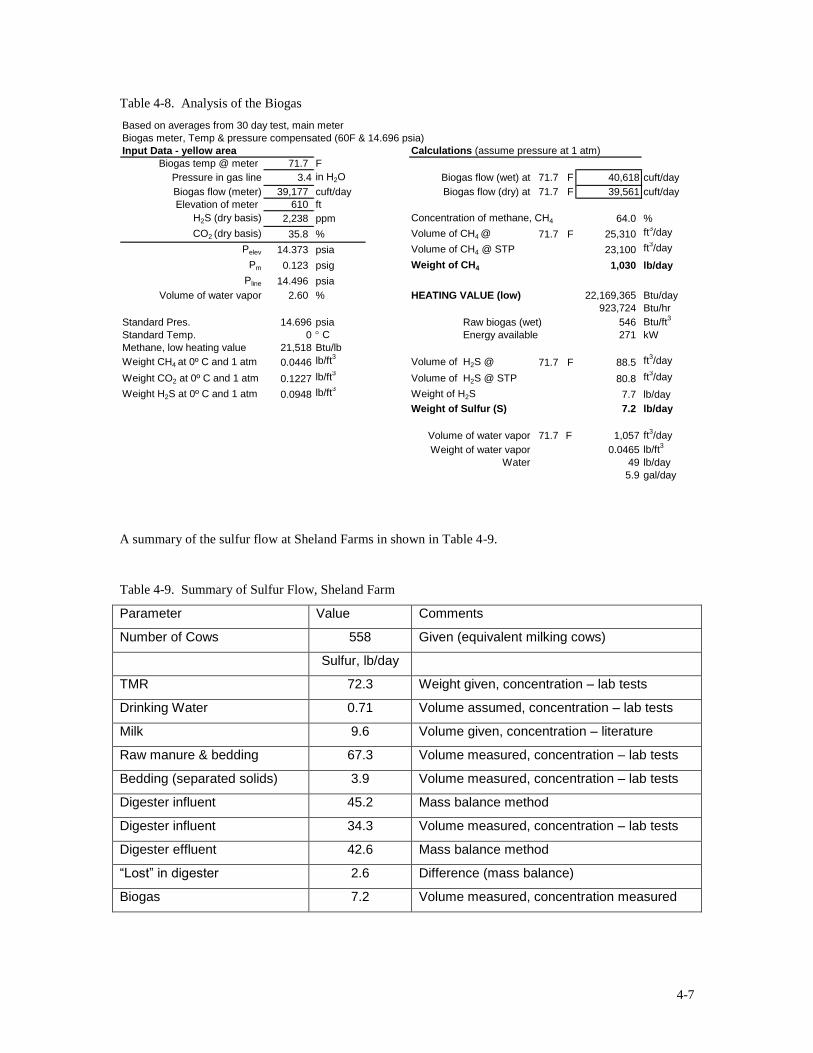
The results of analyzing the biogas for sulfur are shown in Table 4-8. Data from the 30 day test [average
biogas production per day, gas temperature and pressure along with the concentration of carbon dioxide]
were used. See Appendix A, Tables A-1, 2. The mass flow of sulfur “lost” during digestion and removed
via the biogas was 7.2 lb S per day.
The flow of sulfur through the system is summarized in Table 4-9. The sulfur in the raw manure and
bedding (TMR + drinking water – milk + bedding) was calculated to be 67.3 lb S/day. The digester
influent flow based on the influent pump operation was 14,400 gal/day or 122,400 lb/day. With a sulfur
content of 0.028%, the sulfur flow to the digester was 34.3 lb S/day. The mass balance method estimated
45.2 lb S/day. These numbers are considerably less than the 67.3 lb computed based on the inputs in the
barn. There is no known explanation for this discrepancy.
The sulfur in the digester effluent was calculated to by 42.6 lb S/day or a change (loss) in sulfur of 2.6 lb
S/day. The sulfur in the biogas was calculated to be 7.2 lb S per day. This is shown in Table 4-8.
4-7
Table 4-8. Analysis of the Biogas
Based on averages from 30 day test, main meter
Biogas meter, Temp & pressure compensated (60F & 14.696 psia)
Input Data - yellow area Calculations (assume pressure at 1 atm)
Biogas temp @ meter 71.7 F
Pressure in gas line 3.4 in H2O Biogas flow (wet) at 71.7 F 40,618 cuft/day
Biogas flow (meter) 39,177 cuft/day Biogas flow (dry) at 71.7 F 39,561 cuft/day
Elevation of meter 610 ft
H2S (dry basis) 2,238 ppm Concentration of methane, CH4 64.0 %
CO2 (dry basis) 35.8 % Volume of CH4 @ 71.7 F 25,310 ft3/day
Pelev 14.373 psia Volume of CH4 @ STP 23,100 ft3/day
Pm 0.123 psig Weight of CH4 1,030 lb/day
Pline 14.496 psia
Volume of water vapor 2.60 % HEATING VALUE (low) 22,169,365 Btu/day
923,724 Btu/hr
Standard Pres. 14.696 psia Raw biogas (wet) 546 Btu/ft3
Standard Temp. 0 C Energy available 271 kW
Methane, low heating value 21,518 Btu/lb
Weight CH4 at 0º C and 1 atm 0.0446 lb/ft3
Volume of H2S @ 71.7 F 88.5 ft3/day
Weight CO2 at 0º C and 1 atm 0.1227 lb/ft3
Volume of H2S @ STP 80.8 ft3/day
Weight H2S at 0º C and 1 atm 0.0948 lb/ft3
Weight of H2S 7.7 lb/day
Weight of Sulfur (S) 7.2 lb/day
Volume of water vapor 71.7 F 1,057 ft3/day
Weight of water vapor 0.0465 lb/ft3
Water 49 lb/day
5.9 gal/day
A summary of the sulfur flow at Sheland Farms in shown in Table 4-9.
Table 4-9. Summary of Sulfur Flow, Sheland Farm
Parameter Value Comments
Number of Cows 558 Given (equivalent milking cows)
Sulfur, lb/day
TMR 72.3 Weight given, concentration – lab tests
Drinking Water 0.71 Volume assumed, concentration – lab tests
Milk 9.6 Volume given, concentration – literature
Raw manure & bedding 67.3 Volume measured, concentration – lab tests
Bedding (separated solids) 3.9 Volume measured, concentration – lab tests
Digester influent 45.2 Mass balance method
Digester influent 34.3 Volume measured, concentration – lab tests
Digester effluent 42.6 Mass balance method
“Lost” in digester 2.6 Difference (mass balance)
Biogas 7.2 Volume measured, concentration measured
A-1
APPENDIX
Figure A-1. Schematic Drawing of Manure Handling System, Sheland Farm
Not to scale
Freestall
Barns (2)
Solids
Liquid
Raw Manure
Composter
Storage
Pond
Reception
Pit
Effluent Digester
Reception Pit Separator
Pump
Pump
Pump
Mixer
Flare
Engine/Generator
Gas Meter
Main
Gas Meter
Bedding
Pressure
Regulator
A-2
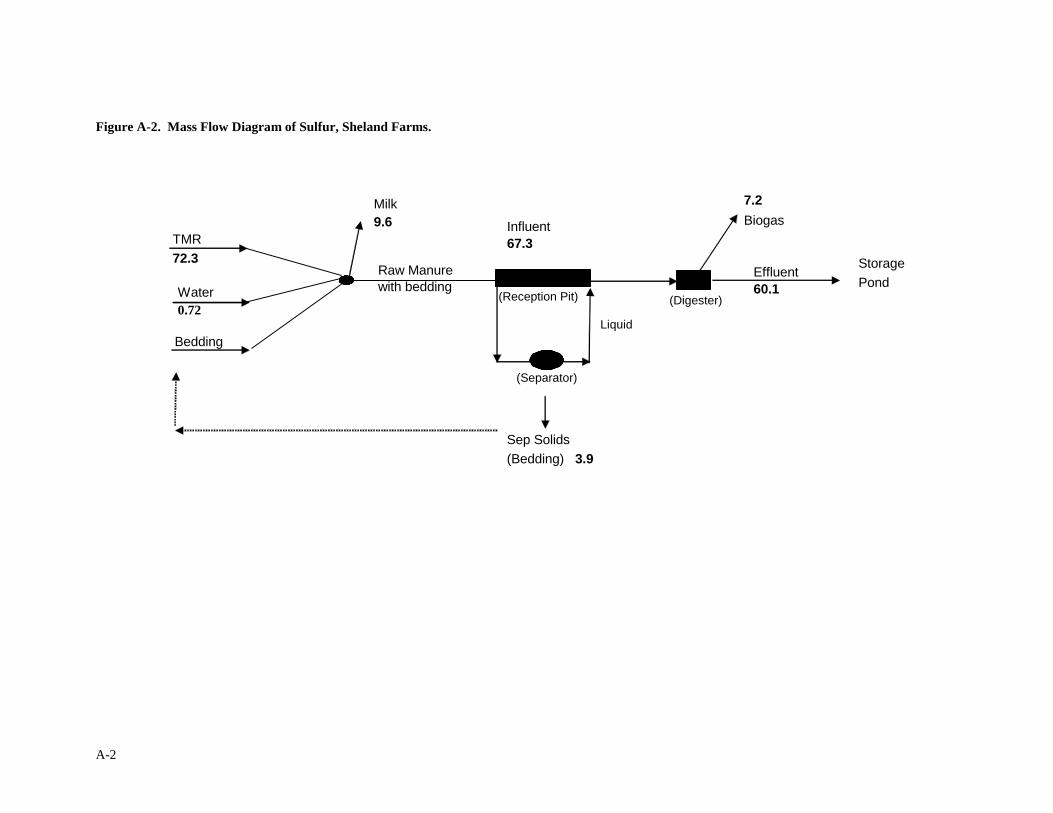
Figure A-2. Mass Flow Diagram of Sulfur, Sheland Farms.
Water
0.72
Bedding
Raw Manure
with bedding
Sep Solids
(Bedding) 3.9
Influent
67.3
Storage
Pond
?
Effluent
60.1
7.2
Biogas
(Separator)
(Digester)
TMR
72.3
Milk
9.6
(Reception Pit)
Liquid
A-3
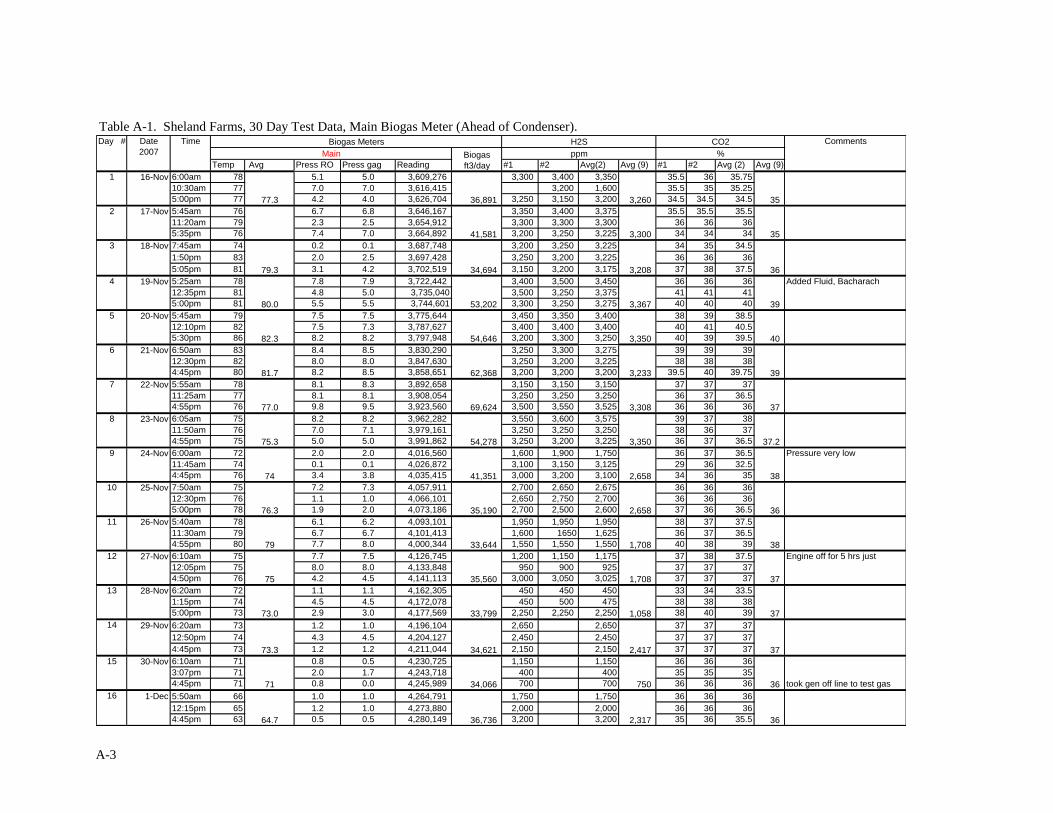
Table A-1. Sheland Farms, 30 Day Test Data, Main Biogas Meter (Ahead of Condenser).
Temp Avg Press RO Press gag Reading #1 #2 Avg(2) Avg (9) #1 #2 Avg (2) Avg (9)
16-Nov 6:00am 78 5.1 5.0 3,609,276 3,300 3,400 3,350 35.5 36 35.75
10:30am 77 7.0 7.0 3,616,415 3,200 1,600 35.5 35 35.25
5:00pm 77 4.2 4.0 3,626,704 3,250 3,150 3,200 34.5 34.5 34.5
17-Nov 5:45am 76 6.7 6.8 3,646,167 3,350 3,400 3,375 35.5 35.5 35.5
11:20am 79 2.3 2.5 3,654,912 3,300 3,300 3,300 36 36 36
5:35pm 76 7.4 7.0 3,664,892 3,200 3,250 3,225 34 34 34
18-Nov 7:45am 74 0.2 0.1 3,687,748 3,200 3,250 3,225 34 35 34.5
1:50pm 83 2.0 2.5 3,697,428 3,250 3,200 3,225 36 36 36
5:05pm 81 3.1 4.2 3,702,519 3,150 3,200 3,175 37 38 37.5
19-Nov 5:25am 78 7.8 7.9 3,722,442 3,400 3,500 3,450 36 36 36
12:35pm 81 4.8 5.0 3,735,040 3,500 3,250 3,375 41 41 41
5:00pm 81 5.5 5.5 3,744,601 3,300 3,250 3,275 40 40 40
20-Nov 5:45am 79 7.5 7.5 3,775,644 3,450 3,350 3,400 38 39 38.5
12:10pm 82 7.5 7.3 3,787,627 3,400 3,400 3,400 40 41 40.5
5:30pm 86 8.2 8.2 3,797,948 3,200 3,300 3,250 40 39 39.5
21-Nov 6:50am 83 8.4 8.5 3,830,290 3,250 3,300 3,275 39 39 39
12:30pm 82 8.0 8.0 3,847,630 3,250 3,200 3,225 38 38 38
4:45pm 80 8.2 8.5 3,858,651 3,200 3,200 3,200 39.5 40 39.75
22-Nov 5:55am 78 8.1 8.3 3,892,658 3,150 3,150 3,150 37 37 37
11:25am 77 8.1 8.1 3,908,054 3,250 3,250 3,250 36 37 36.5
4:55pm 76 9.8 9.5 3,923,560 3,500 3,550 3,525 36 36 36
23-Nov 6:05am 75 8.2 8.2 3,962,282 3,550 3,600 3,575 39 37 38
11:50am 76 7.0 7.1 3,979,161 3,250 3,250 3,250 38 36 37
4:55pm 75 5.0 5.0 3,991,862 3,250 3,200 3,225 36 37 36.5
24-Nov 6:00am 72 2.0 2.0 4,016,560 1,600 1,900 1,750 36 37 36.5 Pressure very low
11:45am 74 0.1 0.1 4,026,872 3,100 3,150 3,125 29 36 32.5
4:45pm 76 3.4 3.8 4,035,415 3,000 3,200 3,100 34 36 35
25-Nov 7:50am 75 7.2 7.3 4,057,911 2,700 2,650 2,675 36 36 36
12:30pm 76 1.1 1.0 4,066,101 2,650 2,750 2,700 36 36 36
5:00pm 78 1.9 2.0 4,073,186 2,700 2,500 2,600 37 36 36.5
26-Nov 5:40am 78 6.1 6.2 4,093,101 1,950 1,950 1,950 38 37 37.5
11:30am 79 6.7 6.7 4,101,413 1,600 1650 1,625 36 37 36.5
4:55pm 80 7.7 8.0 4,000,344 1,550 1,550 1,550 40 38 39
27-Nov 6:10am 75 7.7 7.5 4,126,745 1,200 1,150 1,175 37 38 37.5 Engine off for 5 hrs just
restarted12:05pm 75 8.0 8.0 4,133,848 950 900 925 37 37 37
4:50pm 76 4.2 4.5 4,141,113 3,000 3,050 3,025 37 37 37
28-Nov 6:20am 72 1.1 1.1 4,162,305 450 450 450 33 34 33.5
1:15pm 74 4.5 4.5 4,172,078 450 500 475 38 38 38
5:00pm 73 2.9 3.0 4,177,569 2,250 2,250 2,250 38 40 39
29-Nov 6:20am 73 1.2 1.0 4,196,104 2,650 2,650 37 37 37
12:50pm 74 4.3 4.5 4,204,127 2,450 2,450 37 37 37
4:45pm 73 1.2 1.2 4,211,044 2,150 2,150 37 37 37
30-Nov 6:10am 71 0.8 0.5 4,230,725 1,150 1,150 36 36 36
3:07pm 71 2.0 1.7 4,243,718 400 400 35 35 35
4:45pm 71 0.8 0.0 4,245,989 700 700 36 36 36 took gen off line to test gas
1-Dec 5:50am 66 1.0 1.0 4,264,791 1,750 1,750 36 36 36
12:15pm 65 1.2 1.0 4,273,880 2,000 2,000 36 36 36
4:45pm 63 0.5 0.5 4,280,149 3,200 3,200 35 36 35.5
73.0
73.3
71
64.7
16
12
13
14
15
8
9
10
11
4
5
6
7
Day #
1
2
3
79
75
Biogas Meters
77.3
79.3
80.0
82.3
81.7
Main
77.0
75.3
74
76.3
Date
2007
Time
3,350
Comments
%
H2S
ppm
Added Fluid, Bacharach
3,300
3,208
62,368
2,658 38
36
3,233
3,308
3,350
69,624
54,278
41,351
2,658
1,708
1,708
35,190
34,621
34,066
36,736
36
36
33,644
35,560
33,799
3,367
Biogas
ft3/day
36,891
41,581
34,694
53,202
54,646
3,260
1,058
2,417
750
2,317
35
35
36
39
40
39
37
37.2
38
37
37
37
CO2
A-4
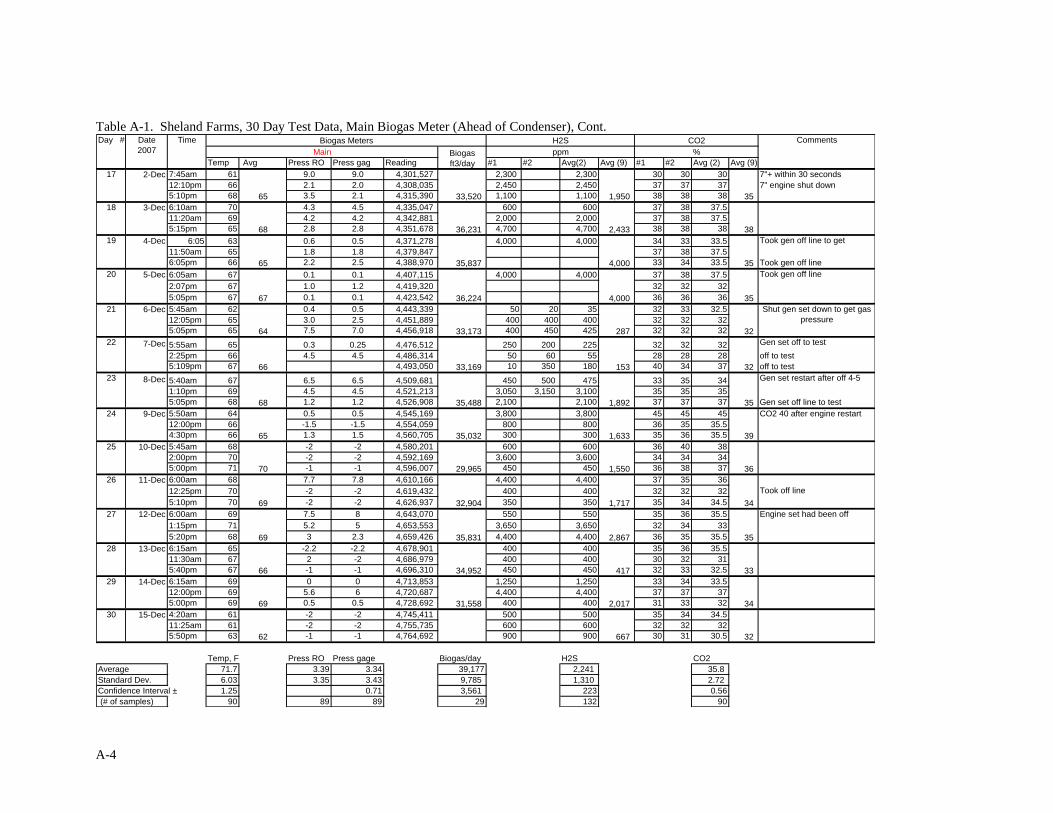
Table A-1. Sheland Farms, 30 Day Test Data, Main Biogas Meter (Ahead of Condenser), Cont.
Temp Avg Press RO Press gag Reading #1 #2 Avg(2) Avg (9) #1 #2 Avg (2) Avg (9)
2-Dec 7:45am 61 9.0 9.0 4,301,527 2,300 2,300 30 30 30 7"+ within 30 seconds
12:10pm 66 2.1 2.0 4,308,035 2,450 2,450 37 37 37 7" engine shut down
5:10pm 68 3.5 2.1 4,315,390 1,100 1,100 38 38 38
3-Dec 6:10am 70 4.3 4.5 4,335,047 600 600 37 38 37.5
11:20am 69 4.2 4.2 4,342,881 2,000 2,000 37 38 37.5
5:15pm 65 2.8 2.8 4,351,678 4,700 4,700 38 38 38
4-Dec 6:05 63 0.6 0.5 4,371,278 4,000 4,000 34 33 33.5 Took gen off line to get
samples11:50am 65 1.8 1.8 4,379,847 37 38 37.5
6:05pm 66 2.2 2.5 4,388,970 33 34 33.5 Took gen off line
5-Dec 6:05am 67 0.1 0.1 4,407,115 4,000 4,000 37 38 37.5 Took gen off line
2:07pm 67 1.0 1.2 4,419,320 32 32 32
5:05pm 67 0.1 0.1 4,423,542 36 36 36
6-Dec 5:45am 62 0.4 0.5 4,443,339 50 20 35 32 33 32.5
12:05pm 65 3.0 2.5 4,451,889 400 400 400 32 32 32
5:05pm 65 7.5 7.0 4,456,918 400 450 425 32 32 32
7-Dec 5:55am 65 0.3 0.25 4,476,512 250 200 225 32 32 32 Gen set off to test
2:25pm 66 4.5 4.5 4,486,314 50 60 55 28 28 28 off to test
5:109pm 67 4,493,050 10 350 180 40 34 37 off to test
8-Dec 5:40am 67 6.5 6.5 4,509,681 450 500 475 33 35 34 Gen set restart after off 4-5
hrs1:10pm 69 4.5 4.5 4,521,213 3,050 3,150 3,100 35 35 35
5:05pm 68 1.2 1.2 4,526,908 2,100 2,100 37 37 37 Gen set off line to test
9-Dec 5:50am 64 0.5 0.5 4,545,169 3,800 3,800 45 45 45 CO2 40 after engine restart
12:00pm 66 -1.5 -1.5 4,554,059 800 800 36 35 35.5
4:30pm 66 1.3 1.5 4,560,705 300 300 35 36 35.5
10-Dec 5:45am 68 -2 -2 4,580,201 600 600 36 40 38
2:00pm 70 -2 -2 4,592,169 3,600 3,600 34 34 34
5:00pm 71 -1 -1 4,596,007 450 450 36 38 37
11-Dec 6:00am 68 7.7 7.8 4,610,166 4,400 4,400 37 35 36
12:25pm 70 -2 -2 4,619,432 400 400 32 32 32 Took off line
5:10pm 70 -2 -2 4,626,937 350 350 35 34 34.5
12-Dec 6:00am 69 7.5 8 4,643,070 550 550 35 36 35.5 Engine set had been off
1:15pm 71 5.2 5 4,653,553 3,650 3,650 32 34 33
5:20pm 68 3 2.3 4,659,426 4,400 4,400 36 35 35.5
13-Dec 6:15am 65 -2.2 -2.2 4,678,901 400 400 35 36 35.5
11:30am 67 2 -2 4,686,979 400 400 30 32 31
5:40pm 67 -1 -1 4,696,310 450 450 32 33 32.5
14-Dec 6:15am 69 0 0 4,713,853 1,250 1,250 33 34 33.5
12:00pm 69 5.6 6 4,720,687 4,400 4,400 37 37 37
5:00pm 69 0.5 0.5 4,728,692 400 400 31 33 32
15-Dec 4:20am 61 -2 -2 4,745,411 500 500 35 34 34.5
11:25am 61 -2 -2 4,755,735 600 600 32 32 32
5:50pm 63 -1 -1 4,764,692 900 900 30 31 30.5
Temp, F Press RO Press gage Biogas/day H2S CO2
Average 71.7 3.39 3.34 39,177 2,241 35.8
Standard Dev. 6.03 3.35 3.43 9,785 1,310 2.72
Confidence Interval ± 1.25 0.71 3,561 223 0.56
(# of samples) 90 89 89 29 132 90
Date
2007
Time Biogas Meters H2S
Main Biogas
ft3/day
ppm
62
69
69
66
69
64
66
68
65
65
68
65
67
27
28
29
30
24
25
26
20
21
22
23
17
18
19
Day #
4,000 35
33,520 1,950
2,433
35
38
CO2 Comments
%
70
4,000
Shut gen set down to get gas
pressure
287
153
35
32
32
35
36,224
35,032
29,965
36,231
35,837
39
36
33,173
33,169
35,488
32,904
35,831
34,952
31,558 2,017
667
1,892
1,633
1,550
1,717
2,867
417
32
34
35
33
34

A-5
Table A-2 Sheland Farms, 30 Day Test Data, Engine Biogas Meter.
H2S CO2
ppm/% ppm/%
Temp Avg, F Press Press Eng* Reading #1 #2 Avg (2) Total Avg #1 #2 Avg
6:00am 107 >25 1,960,897 3,600 3,500 3,550 36 35 35.5
10:20am 103 >25 1,965,788 2,350 ###### 2,150 36 36 36.0
5:05pm 99 >25 1,972,910 3,250 3,300 3,275 38.5 38.5 38.5
6:00am 101 >25 1,987,065 3,800 3,620 3,710 36 37 36.5
11:15am 107 18.0 1,993,169 3,600 3,500 3,550 36 36 36.0
5:20pm 108 12.0 2,000,547 3,400 3,500 3,450 38 37.5 37.8
7:15am 103 11.5 2,017,184 3,200 3,200 3,200 36 36 36.0
1:45pm 109 20.5 2,024,283 3,500 3,400 3,450 37 38 37.5
5:15pm 106 22.0 2,028,248 3,250 3,400 3,325 37 37 37.0
5:40am 102 >25 5.0 2,042,835 3,550 3,550 3,550 36.5 34 35.3
12:30pm 88 13.5 5.0 2,051,709 3,350 3,250 3,300 41 40 40.5 Added fluid to Bacharach
4:55pm 89 13.0 6.0 2,057,375 3,200 2,700 2,950 48 45 46.5
5:55am 80 15.0 6.0 2,074,404 3,350 3,500 3,425 41 41 41.0
2:00pm 90 15.0 6.0 2,082,105 3,200 3,300 3,250 41 42 41.5
5:20pm 96 14.0 6.0 2,089,189 3,200 3,250 3,225 38 40 39.0
6:05am 93 14.5 6.0 2,105,611 3,300 3,300 3,300 39 40 39.5
12:30pm 92 14.0 6.0 2,113,986 3,250 3,300 3,275 38 39 38.5
4:50pm 90 14.5 6.0 2,119,511 3,200 3,200 3,200 40 39.5 39.8
6:00am 86 14.0 6.0 2,136,618 3,200 3,200 3,200 39 39 39.0
11:20am 85 13.5 5.5 2,143,335 3,300 3,250 3,275 36 38 37.0
5:00pm 83 14.8 6.5 2,150,819 3,400 3,500 3,450 36 37 36.5
6:10am 80 15.0 6.3 2,168,568 3,200 3,250 3,225 36 37 36.5
11:55am 82 13.00 5.8 2,175,901 3,250 3,250 3,250 36 36 36.0
5:00pm 83 11.0 4.3 2,179,506 3,250 3,300 3,275 37 37 37.0
6:00am 99 7.0 0.0 2,196,495 3,250 3,300 3,275 38 37 37.5
11:40am 99 >25 10.0 2,203,789 400 3,500 1,950 40 40 40.0
4:30pm 102 5.0 2,209,775 3,250 3,300 3,275 37 38 37.5
7:50am 100 >25 8.50 2,225,155 2,900 2,800 2,850 36 36 36.0
12:35pm 103 >25 10.0 2,231,705 2,850 2,900 2,875 36 37 36.5
4:55pm 107 >25 10.0 2,266,505 2,850 2,900 2,875 37 37 37.0
5:50am 108 >25 8.5 2,251,169 2,050 2,050 2,050 37 37 37.0
11:40am 109 23.0 8.0 2,258,444 1,600 1,650 1,625 36 36 36.0
5:00pm 107 21.0 8.0 2,264,874 1,500 1,500 1,500 37 39 38.0
6:15am 70 >25 8.5 2,271,971 1,150 1,150 1,150 39 39.5 39.3
12:15pm 74 >25 8.5 2,276,182 800 1,000 900 37 37 37.0
4:55pm 104 23.5 8.5 2,281,623 3,100 3,050 3,075 37 37 37.0
6:15am 101 >25 10.0 2,297,623 500 600 550 37 38 37.5
1:20pm 104 >25 9.5 2,304,624 500 500 500 37 37 37.0
5:10pm 105 >25 9.5 2,308,676 2,400 2,400 37 37 37.0
6:15am 106 >25 9.5 2,322,824 2,700 2,700 37 38 37.5
12:05pm 107 >25 9.0 2,328,837 2,600 2,600 37 37 37.0
4:40pm 106 24.0 8.5 2,334,065 2,200 2,200 39 40 39.5
6:15am 105 24.5 9.0 2,349,036 1,200 1,200 36 36 36.0
3:00pm 103 23.5 9.0 2,358,832 400 400 36 36 36.0
4:55pm 102 23.0 9.0 2,360,769 750 750 38 37 37.5
6:00am 104 >25 9.0 2,375,140 1,900 1,900 36 36 36.0
12:20pm 106 >25 9.0 2,382,138 2,000 2,000 36 36 36.0
4:50pm 99 >25 9.0 2,386,974 3,350 3,350 35 36 35.5
783 37
2,417 36
16
1-Dec
103 28,381
15
30-Nov
103 26,104
Went to one H2S sample per day
to conserve tubes
14
29-Nov
106 26,212 2,500 38
38
13
28-Nov
103 25,201 900 37
12
27-Nov
82.7 25,652
11
26-Nov
108 20,802 1,725 37
1,708
2,867 37
9
24-Nov
10
25-Nov
103 26,014
100 28,660 2,833
3,308 38
3,250 37
38
8
23-Nov
81.7 27,927
7
22-Nov
84.7 31950
6
21-Nov
91.7 31,007 3,258 39
3,267 41
5
20-Nov
88.7 31,207 3,300 41
4
1
16-Nov
93 31,569
3
18-Nov
106 25,651
19-Nov
2
17-Nov
105 30,119 3,570 37
3,325 37
103 26,168 2,992 37
Day # Date
2007
Time Engine Biogas Meters
Biogas
cuft/day
Comments
A-6
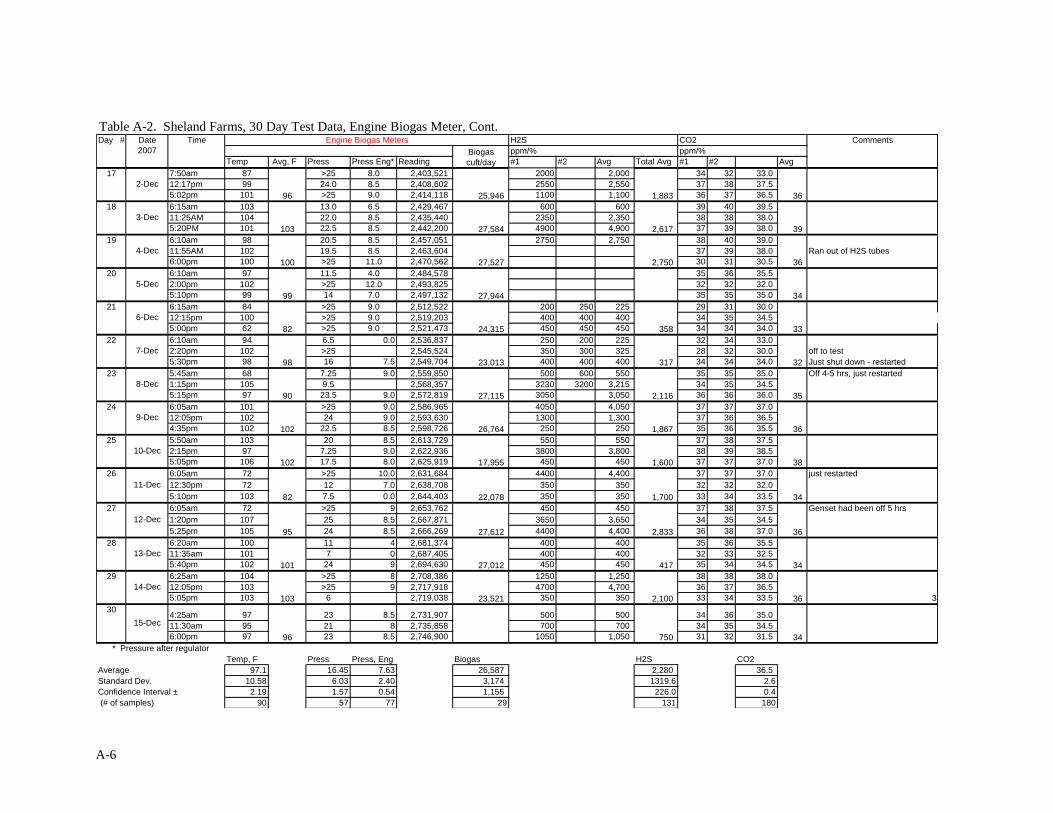
Table A-2. Sheland Farms, 30 Day Test Data, Engine Biogas Meter, Cont. H2S CO2
ppm/% ppm/%
Temp Avg, F Press Press Eng* Reading #1 #2 Avg Total Avg #1 #2 Avg
7:50am 87 >25 8.0 2,403,521 2000 2,000 34 32 33.0
12:17pm 99 24.0 8.5 2,408,602 2550 2,550 37 38 37.5
5:02pm 101 >25 9.0 2,414,118 1100 1,100 36 37 36.5
6:15am 103 13.0 6.5 2,429,467 600 600 39 40 39.5
11:25AM 104 22.0 8.5 2,435,440 2350 2,350 38 38 38.0
5:20PM 101 22.5 8.5 2,442,200 4900 4,900 37 39 38.0
6:10am 98 20.5 8.5 2,457,051 2750 2,750 38 40 39.0
11:55AM 102 19.5 8.5 2,463,604 37 39 38.0 Ran out of H2S tubes
6:00pm 100 >25 11.0 2,470,562 30 31 30.5
6:10am 97 11.5 4.0 2,484,578 35 36 35.5
2:00pm 102 >25 12.0 2,493,825 32 32 32.0
5:10pm 99 14 7.0 2,497,132 35 35 35.0
6:15am 84 >25 9.0 2,512,522 200 250 225 29 31 30.0
12:15pm 100 >25 9.0 2,519,203 400 400 400 34 35 34.5
5:00pm 62 >25 9.0 2,521,473 450 450 450 34 34 34.0
6:10am 94 6.5 0.0 2,536,837 250 200 225 32 34 33.0
2:20pm 102 >25 2,545,524 350 300 325 28 32 30.0 off to test
5:30pm 98 16 7.5 2,549,704 400 400 400 34 34 34.0 Just shut down - restarted
5:45am 68 7.25 9.0 2,559,850 500 600 550 35 35 35.0 Off 4-5 hrs, just restarted
1:15pm 105 9.5 2,568,357 3230 3200 3,215 34 35 34.5
5:15pm 97 23.5 9.0 2,572,819 3050 3,050 36 36 36.0
6:05am 101 >25 9.0 2,586,965 4050 4,050 37 37 37.0
12:05pm 102 24 9.0 2,593,630 1300 1,300 37 36 36.5
4:35pm 102 22.5 8.5 2,598,726 250 250 35 36 35.5
5:50am 103 20 8.5 2,613,729 550 550 37 38 37.5
2:15pm 97 7.25 9.0 2,622,936 3800 3,800 38 39 38.5
5:05pm 106 17.5 8.0 2,625,919 450 450 37 37 37.0
6:05am 72 >25 10.0 2,631,684 4400 4,400 37 37 37.0
12:30pm 72 12 7.0 2,638,708 350 350 32 32 32.0
5:10pm 103 7.5 0.0 2,644,403 350 350 33 34 33.5
6:05am 72 >25 9 2,653,762 450 450 37 38 37.5
1:20pm 107 25 8.5 2,667,871 3650 3,650 34 35 34.5
5:25pm 105 24 8.5 2,666,269 4400 4,400 36 38 37.0
6:20am 100 11 4 2,681,374 400 400 35 36 35.5
11:35am 101 7 0 2,687,405 400 400 32 33 32.5
5:40pm 102 24 9 2,694,630 450 450 35 34 34.5
6:25am 104 >25 8 2,708,386 1250 1,250 38 38 38.0
12:05pm 103 >25 9 2,717,918 4700 4,700 36 37 36.5
5:05pm 103 6 2,719,038 350 350 33 34 33.5 3
4:25am 97 23 8.5 2,731,907 500 500 34 36 35.0
11:30am 95 21 8 2,735,858 700 700 34 35 34.5
6:00pm 97 23 8.5 2,746,900 1050 1,050 31 32 31.5
Temp, F Press Press, Eng Biogas H2S CO2
Average 97.1 16.45 7.63 26,587 2,280 36.5
Standard Dev. 10.58 6.03 2.40 3,174 1319.6 2.6
Confidence Interval ± 2.19 1.57 0.54 1,155 226.0 0.4
(# of samples) 90 57 77 29 131 180
750 34
* Pressure after regulator
30
15-Dec
96
34
29
14-Dec
103 23,521 2,100 36
28
13-Dec
101 27,012
1,700
11-Dec
82 22,078
417
34
just restarted
27
12-Dec
95 27,612 2,833 36
Genset had been off 5 hrs
26
1,867 36
25
10-Dec
102 17,955 1,600 38
24
9-Dec
102 26,764
2,116 35
22
7-Dec
23
8-Dec
90 27,115
98 23,013
34 27,944
317 32
21
6-Dec
82 24,315 358 33
20
5-Dec
99
19
4-Dec
100 27,527 2,750 36
2,617 39 103
17
2-Dec
18
3-Dec
27,584
96 25,946 1,883 36
Comments
Biogas
cuft/day
Day # Date
2007
Time Engine Biogas Meters
A-7
Table A-3. Sulfur Content in TMR at Sheland Farms.
Date Sample
Dry Matter
%
S %
(as fed) Sample
Dry Matter
%
S %
(as fed) Sample
Dry Matter
%
S %
(as fed) Sample
Dry Matter
%
S %
(as fed)
11/12/2007 SFG1 1 41.90 0.10 SFG2 1 40.00 0.10 SFG3 1 33.00 0.07 SFG12 1 38.20 0.08
SFG1 2 42.20 0.10 SFG2 2 41.70 0.11 SFG3 2 33.30 0.07 SFG12 2 38.00 0.09
SFG1 3 41.80 0.10 SFG2 3 39.20 0.10 SFG3 3 33.90 0.07 SFG12 3 39.00 0.09
11/28/2007 SFG1 1 35.90 0.10 SFG2 1 40.90 0.10 SFG3 1 30.60 0.06 SFG12 1 38.50 0.09
SFG1 2 36.60 0.10 SFG2 2 40.70 0.10 SFG3 2 31.90 0.07 SFG12 2 38.90 0.09
12/21/2007 SFG1 1 42.7 0.12 SFG2 1 37.20 0.08 SFG3 1 32.70 0.06 SFG12 1 43.30 0.09
SFG1 2 42.8 0.12 SFG2 2 38.50 0.09 SFG3 2 32.80 0.07 SFG12 2 42.50 0.09
SFG1 3 41.7 0.11 SFG2 3 38.30 0.08 SFG3 3 33.10 0.08 SFG12 3 41.30 0.09
Average 40.70 0.106 39.6 0.095 32.7 0.07 39.96 0.09
Standard Dev 2.78 0.01 1.52 0.01 1.01 0.01 2.09 0.00
Confidence Integral ± 1.93 0.01 1.06 0.01 0.70 0.00 1.45 0.00
Date Sample
Dry Matter
%
S %
(as fed) Sample
Dry Matter
%
S %
(as fed)
11/12/2007 SFDC 1 29.0 0.07 SFBH 1 31.7 0.08
SFDC 2 28.5 0.08 SFBH 2 31.8 0.08
SFDC 3 29.3 0.08 SFBH 3 31.2 0.10
11/28/2007 SFDC 1 30.7 0.10 SFBH 1 35.8 0.09
SFDC 2 30.0 0.08 SFBH 2 36.9 0.10
12/21/2007 SFDC 1 29.6 0.07 SFBH 1 35.0 0.09
SFDC 2 29.3 0.07 SFBH 2 36.6 0.08
SFDC 3 29.3 0.08 SFBH 3 35.2 0.07
Average 29.46 0.08 34.28 0.09
Standard Dev 0.66 0.01 2.34 0.01
Confidence Integral ± 0.46 0.01 1.62 0.01
Dry Cows Bred Heifers
Group 1 Group 2 Group 3 Group 12
A-8
Table A-4. ASABE, Calculating Manure Production.
Animal Manure Prod Total Solids Total Solids
Number lb/animal-day lb/day lb/animal-day lb/day % TS collected, lb/yr
Milking Cows, RHA*, lb/cow-day 65.5 473 137.1 64,841 17.4 8,242 12.7% 3,008,383
Dry Cows, Body Weight 1500 93 80.9 7,528 10.1 937 12.5% 205,263
Heifers, average Body Weight 1200 71 60.7 4,311 7.9 560 13.0% 122,746
Total 637 76,681 9,740 12.7% 3,336,391
117,066 lb/day @ 8.32% TS
13,854 gal/day @ 8.45 lb/gal
559 cow equivalents