characterization of the 222rn family turbulent transport
TRANSCRIPT
HAL Id: hal-00296143https://hal.archives-ouvertes.fr/hal-00296143
Submitted on 12 Feb 2007
HAL is a multi-disciplinary open accessarchive for the deposit and dissemination of sci-entific research documents, whether they are pub-lished or not. The documents may come fromteaching and research institutions in France orabroad, or from public or private research centers.
L’archive ouverte pluridisciplinaire HAL, estdestinée au dépôt et à la diffusion de documentsscientifiques de niveau recherche, publiés ou non,émanant des établissements d’enseignement et derecherche français ou étrangers, des laboratoirespublics ou privés.
Characterization of the 222Rn family turbulenttransport in the convective atmospheric boundary layer
J.-F. Vinuesa, S. Galmarini
To cite this version:J.-F. Vinuesa, S. Galmarini. Characterization of the 222Rn family turbulent transport in the convec-tive atmospheric boundary layer. Atmospheric Chemistry and Physics, European Geosciences Union,2007, 7 (3), pp.697-712. �hal-00296143�

Atmos. Chem. Phys., 7, 697–712, 2007www.atmos-chem-phys.net/7/697/2007/© Author(s) 2007. This work is licensedunder a Creative Commons License.
AtmosphericChemistry
and Physics
Characterization of the 222Rn family turbulent transport in theconvective atmospheric boundary layer
J.-F. Vinuesa and S. Galmarini
European Commission - DG Joint Research Centre, Institute for Environment and Sustainability, Italy
Received: 2 June 2006 – Published in Atmos. Chem. Phys. Discuss.: 25 September 2006Revised: 1 February 2007 – Accepted: 6 February 2007 – Published: 12 February 2007
Abstract. The combined effect of turbulent transport and ra-dioactive decay on the distribution of222Rn and its progenyin convective atmospheric boundary layers (CBL) is inves-tigated. Large eddy simulation is used to simulate their dis-persion in steady state CBL and in unsteady conditions repre-sented by the growth of a CBL within a pre-existing reservoirlayer.
The exact decomposition of the concentration and fluxbudget equations under steady state conditions allowed usto determine which processes are responsible for the verticaldistribution of222Rn and its progeny. Their mean concentra-tions are directly correlated with their half-life, e.g.222Rnand 210Pb are the most abundant whereas218Po show thelowest concentrations.222Rn flux decreases linearly withheight and its flux budget is similar to the one of inert emittedscalar, i.e., a balance between on the one hand the gradientand the buoyancy production terms, and on the other handthe pressure and dissipation at smaller scales which tends todestroy the fluxes. While222Rn exhibits the typical bottom-up behavior, the maximum flux location of the daughters ismoving upwards while their rank in the222Rn progeny is in-creasing leading to a typical top-down behavior for210Pb.We also found that the relevant radioactive decaying con-tributions of222Rn short-lived daughters (218Po and214Pb)act as flux sources leading to deviations from the linear fluxshape. In addition, while analyzing the vertical distributionof the radioactive decay contributions to the concentrations,e.g. the decaying zone, we found a variation in height of222Rn daughters’ radioactive transformations.
Under unsteady conditions, the same behaviors reportedunder steady state conditions are found: deviation of thefluxes from the linear shape for218Po, enhanced discrepancyin height of the radioactive transformation contributions forall the daughters. In addition,222Rn and its progeny concen-
Correspondence to: J.-F. Vinuesa([email protected])
trations decrease due to the rapid growth of the CBL. Theanalysis emphasizes the crucial role of turbulent transport inthe behavior of222Rn morning concentrations, in particularthe ventilation at the top of the boundary layer that leads tothe dilution of222Rn by mixing with radon low concentrationair.
1 Introduction
222Rn is a naturally-occurring radioactive noble gas with ahalf-life of 3.8 days. Its unreactive nature makes it a suit-able tracer in studies of atmospheric boundary layers (Pors-tendorfer, 1994). Ground-based measurements and verticaldistributions of222Rn and its daughters have been exten-sively studied in the past, e.g., to characterize the turbulentproperties of the ABL, to perform regional and global cir-culation model benchmarking and to estimate regional sur-face fluxes of air pollutant and in particular climate-sensitivecompounds. For a review on the use of222Rn observationsin atmospheric sciences see Zahorowski et al. (2004). Sev-eral authors (Larson et al., 1972; Lopez et al., 1974; Polianet al., 1986; Gaudry et al., 1990; Ramonet et al., 1996; VinodKumar et al., 1999) have shown that the study of the behaviorof radon and its progeny is of great importance for air pollu-tant and greenhouse gases transport modeling. In particular,222Rn is often used to calibrate and validate transport models(Genthon and Armengaud, 1995; Li and Chang, 1996; Jacobet al., 1997; Stockwell et al., 1998; Dentener et al., 1999).
The correlation between ground level radon concentra-tions and meteorological conditions in the lower atmospherehas been investigated in various occasions (e.g., Moseset al., 1963; Pearson and Moses, 1966; Ikebe, 1970; Druil-het and Fontan, 1973a and 1973b; Beck and Gogolak, 1979;Robe et al., 1992; Kataoka et al., 2001; Galmarini, 2006) in-cluding the relationship with the atmospheric stability (e.g.,Wilkening, 1970; Guedalia et al., 1974; Fontan et al., 1979;
Published by Copernicus GmbH on behalf of the European Geosciences Union.

698 J.-F. Vinuesa and S. Galmarini: Turbulent transport of222Rn and its daughters
Guedalia et al., 1980; Fujinami and Esaka, 1987 and 1988;Kataoka et al., 1998; Sesana et al., 1998). It has alsobeen used to investigate transport processes such as convec-tion (Mahowald et al., 1997; Stockwell et al., 1998; Sesanaet al., 2006), diurnal variability (Jacob and Prather, 1990;Kataoka et al., 1998), and synoptic variability of the ABL(Allen et al., 1996). However only few studies have ad-dressed the vertical dispersion of radon and its daugh-ters. For instance, Ikebe and Shimo (1972), Druilhet andFontan (1973a, and 1973b) and Butterweck et al. (1994) esti-mated the vertical turbulent diffusivity from220Rn measure-ment profiles, Jacobi and Andre (1963) and Beck and Gogo-lak (1979) evaluated the radon and its daughter products con-centration profiles using a local gradient formulation for thefluxes assuming eddy diffusivities to be equal to eddy con-ductivity. Lopez et al. (1974) and Guedalia et al. (1973, and1974) used aircraft data to extract information on the verti-cal transport while Vinod Kumar et al. (1999) used Wangarafield experiment data set (Clarke et al., 1971) to analyze theirmodel results.
Some of the radon radionuclides and their short-liveddaughters have been used to study the turbulent diffusionprocess since they have half-lives of the same order of mag-nitude of the turnover time of the convective boundary layer(CBL). While the so-called long lived species are well mixedand the vertical flux profiles follow a linear shape (Wyn-gaard, 1985), the short-lived compound fluxes deviate fromthe inert linear profile. In this respect, accurate modeling re-quires a better understanding of how turbulence affects thedispersion of222Rn and its progeny in atmospheric boundarylayers. The scales associated with turbulent motions rangefrom the Kolmogorov dissipation scale (on the order of a mil-limeter) to the boundary layer depth (on the order of a kilo-meter). The largest eddies are responsible for the turbulenttransport of the scalars and momentum whereas the smallestones are mainly dissipative. Thus, realistic numerical exper-iments of the atmospheric boundary layer require the use oflarge-eddy simulation (LES) that allows to explicitly solverelevant turbulent scales.
Previous LES studies have shown that the turbulent mixingcan control the concentration and the distribution of react-ing scalars in the CBL (Schumann, 1989; Sykes et al., 1994;Gao and Wesely, 1994; Verver et al., 1997; Molemaker andVil a-Guerau de Arellano, 1998; Petersen et al., 1999; Pe-tersen, 2000; Petersen and Holtslag, 1999; Krol et al., 2000;Patton et al., 2001; Vinuesa and Vila-Guerau de Arel-lano, 2003; Vinuesa and Vila-Guerau de Arellano, 2005).However, these studies have been mostly restricted to mod-erately fast reacting flows involving a second-order and/or afirst order reaction. In particular, Vinuesa and Vila-Gueraude Arellano (2003) performed a budget analysis of the fluxesand (co-)variances for second-order reacting scalars in asteady-state CBL. A key and novel aspect of this work isto extend the analysis to a chain of decaying species witha wide range of half-lives. Every new species decays with
a timescale that varies from one to another. Its concentra-tion will depend on its own decay but also on the decay ofits mother. Thus the distribution of the new species will beaffected by the mixing of the previous one in the chain.
To our knowledge, no study so far has analyzed the turbu-lent transport of222Rn short-lived daughters in a CBL in asuch comprehensive manner. We perform a complete analy-sis of the vertical distribution, reactivity and turbulent trans-port of222Rn and its progeny under convective conditions. Inorder to account for all the relevant scales of the atmosphericboundary layer, we use LES to explicitly calculate the differ-ent terms of the concentration budget equations. The CBLanalyzed here is considered under steady and unsteady con-ditions i.e. a fully developed CBL and a CBL growing withinthe reservoir layer resulting from the collapse of previousdaytime CBL. In addition to the explicit calculation of thedifferent contributions to concentration budget equations, thestudy under steady state conditions allows to perform a fullbudget analysis of the turbulent transport, i.e. the fluxes, andso to identify the driving process of222Rn and its progenyconcentration behavior. The analysis of the unsteady bound-ary layer aims at understanding the exchanges between thereservoir and the mixed layer while the boundary layer isdeepening and so the turbulent timescale is increasing. Inaddition, the behavior of decaying species in this transientpart of the day has never been studied before.
The structure of this paper is as follows. In Sect. 2, wepresent the chemical system of the222Rn radioactive decay-ing chain together with the theoretical basis for concentrationand flux budget decompositions. The numerical simulationspecifications and the turbulent reacting flow classificationare presented in Sect. 3. The vertical distribution, the reactiv-ity and the transport by turbulence of222Rn and its daughtersin the case of the steady-state CBL are analyzed in Sect. 4.In Sect. 5, the results obtained under unsteady conditions arediscussed. Finally, a summary is presented and conclusionsare drawn in the last section.
2 222Rn decaying chain
We consider the radioactive decay chain of222Rn that reads:
222Rnλ0→ 218Po
λ1→ 214Pb
λ2→ 214Bi
λ3→ 210Pb, (1)
whereλ0, λ1, λ2 andλ3 are the decay frequencies equal to2.11×10−6, 3.80×10⁻³, 4.31×10⁻⁴, and 5.08×10⁻⁴ s−1,respectively. Note that we consider a direct transformationof 214Bi into 210Pb since the half-life of214Po (daughter of214Bi) is very short (164µs). Also we consider210Pb, thathas a half-life of 22.3 years, as an inert scalar with respect tothe temporal scales considered here. To increase readability,222Rn and its progeny will also be referred to asSi wherei
is the rank of the daughter in the decay chain from here on,e.g.S0 andS4 stand for222Rn and210Pb, respectively.
Atmos. Chem. Phys., 7, 697–712, 2007 www.atmos-chem-phys.net/7/697/2007/

J.-F. Vinuesa and S. Galmarini: Turbulent transport of222Rn and its daughters 699
In the planetary boundary layer, under horizontally homo-geneous conditions with no mean wind and neglecting thetransport due to molecular diffusion, the temporal evolutionof the mean concentrationsSi of a radionuclide reads
∂Si
∂t= −
∂wsi
∂z+ RSi
(2)
where the horizontal averages are denoted both by capitalletters and overbars whereas the fluctuations of the variablesaround the horizontal average value are represented by lowercase letters. For the chain (1), the radioactive source/sinktermsRSi
are
RS0 = −λ0 S0, (3)
RS1 = λ0 S0 − λ1 S1, (4)
RS2 = λ1 S1 − λ2 S2, (5)
RS3 = λ2 S2 − λ3 S3, (6)
RS4 = λ3 S3. (7)
The vertical scalar flux budget equation reads
∂wsi
∂t= −w2∂Si
∂z︸ ︷︷ ︸
G
+g
20θsi
︸ ︷︷ ︸
B
−∂w2si
∂z︸ ︷︷ ︸
T
− si∂π
∂z︸ ︷︷ ︸
P
− si∂τ3j
∂xj
− w∂〈u′′
j s′′i 〉
∂xj︸ ︷︷ ︸
D
+ Rwsi︸︷︷︸
CH
, (8)
wherew, θ and si represent the fluctuation of the verticalvelocity, the temperature and the reactant concentration, re-spectively.20 is a reference state potential temperature,Si
is the horizontal average reactant quantity andπ is the modi-fied pressure defined as[(p−p0)/ρ0]+(2/3)E, wherep, p0andρ0 are the pressure, a reference pressure and a referencedensity respectively, andE is the subgrid-scale turbulent ki-netic energy. The subgrid stress for momentum and scalarare represented byτ3j and 〈u′′
j s′′i 〉 respectively. The terms
on the right-hand side are the mean gradient term (G), thebuoyancy (B), the turbulent transport (T), the pressure term(P), the dissipation (D) and the chemical or radioactive de-cay contribution (CH). The description of the flux temporalevolution is of importance to identify the driven processesinvolved in the turbulent dispersion of222Rn and its progeny.
The radioactive decay terms in the budget equations are
Rws0 = −λ0 ws0, (9)
Rws1 = λ0 ws0 − λ1 ws1, (10)
Rws2 = λ1 ws1 − λ2 ws2, (11)
Rws3 = λ2 ws2 − λ3 ws3, (12)
Rws4 = λ3 ws3. (13)
Table 1. Initial values and prescribed surface fluxes used for bothsimulations.
Steady-state CBL Unsteady CBL
(1) (2)
zi 662.5 m 187.5 m
2m 288 K 286 K
12 5 K
(wθ)s 0.052 K m s−1
γθ 6×10⁻³ K m−1
3 Description of the numerical simulations
The capacity of LES to simulate extremely accurately tur-bulent condition of atmospheric boundary layers has beenwidely proved over the years through extensive compar-ison with laboratory and field measurements. We usethe three-dimensional LES code described by Cuijpers andDuynkerke (1993), Siebesma and Cuijpers (1995), Cuijpersand Holtslag (1998) and Vila-Guerau de Arellano and Cui-jpers (2000).
3.1 Specifications of the simulated boundary layers
Two representative cases are investigated: a fully developedfree convective atmospheric boundary layer and a CBL grow-ing overlayed by a reservoir layer resulting from the collapseof the previous daytime CBL. For both cases, the modelingdomains represent 6.4 km×6.4 km×1.5 km with a verticaland horizontal resolutions of 25 and 50 m respectively, lead-ing to 128×128×60 grid-points simulations. Periodic lateralboundary conditions are assumed. The maximum time-stepused in the calculations is 0.5 s.
As radon and its daughters are unaffected by moisture,the simulated atmospheric boundary layers (ABL) are dry,convective ABLs driven by buoyancy only (see Table 1 andFig. 1).
In the steady-state CBL,222Rn is emitted at the surfacewith a flux of 0.5 Bqm−2 s−1. All radionuclides have a zeroinitial profile except222Rn. The latter is the result of a pre-run of 1 hour simulation with the same surface flux, no initialconcentration and a decay constant set to zero. The simula-tion is running for 8 h with a pre-run of 1 h for the dynam-ics. The statistics and the budget analysis are done on thelast hour of the simulation. The convective velocity scalew∗, the ABL heightzi (defined as the depth where the sensi-ble heat flux is minimum) and the free convection time-scalet∗ ≡ zi/w∗ are equal to 1.12 ms−1, 800 m and 714.3 s, re-spectively.
For the unsteady convective BL, we follow a special proce-dure to initialize222Rn and its daughters profiles in order toensure consistency regarding the assumption of radioactive
www.atmos-chem-phys.net/7/697/2007/ Atmos. Chem. Phys., 7, 697–712, 2007

700 J.-F. Vinuesa and S. Galmarini: Turbulent transport of222Rn and its daughters
Fig. 1. Schematic representation of the experimental set-ups for the mean potential temperature2m(1- steady state and 2- unsteadysimulations) and the meanSi concentration in the unsteady CBL simulation (see the text for a definition of the different quantities shownabove).
equilibrium of 222Rn and its progeny. Briefly, the resultingsteady-state CBL of the previous simulation is divided intotwo regions: a nocturnal boundary layer of depthzi2 and areservoir layer. Since the reservoir layer is assumed decou-pled from the surface, no fresh radon is transported to this re-gion during the 8-h’ night. In the nocturnal boundary layer,a 222Rn surface flux of 0.5 Bqm−2 s−1 is assumed constantduring the night. In both regions, the222Rn and its daughtersprofile concentrations are analytically calculated as the resultof a 8 h period of radioactive activity from the resulting pro-files of the previously simulated steady-state CBL (see theappendix). The simulation of the unsteady CBL is starting atsunrise and is running for 8 h.
Similar convective boundary layers and turbulent atmo-spheric reacting flows have been successfully simulated us-ing the same SGS models that we used and even coarser reso-lutions. In particular,Jonker et al. (2004) used 128×128×50grid-points for a domain of 12.8 km×12.8 km×1.25 km tosimulate (among others) first order decaying scalars with tur-bulent Damkohler numbers up to 10. In our simulations, thebiggest turbulent Damkhler number is found for S1 and isequal to 2.71 (see Table 2). In addition, we also performedsimulations with coarser resolution (64×64×60 grid-points)that didn’t reveal any resolution dependency of the results.Thus, the results presented in the paper are not dependent onthe choice of the SGS model.
In order to investigate the possible dependency of our re-sults to the strength of the potential temperature inversion atthe top of the CBL or to the forcing imposed by the surfaceheat flux, several additional simulations were performed. Wesimulated 3 extra steady-state cases with weaker inversion
strengths. We used initial potential temperature jumps atthe top of the CBL of 1, 2 and 3 K. We also performed ex-tra simulations of the unsteady case based on weaker inver-sion strengths and stronger surface heat fluxes. We used ini-tial potential temperature jumps of 3, 3 and 5 K combinedwith surface heat fluxes of 0.052, 0.1 and 0.1 K m s−1, re-spectively. In addition, unsteady simulation with the sur-face diurnal variation of the surface heat flux (from 0.05to 0.2 K m s−1) and an initial potential temperature jump of2.5 K. Using the usual boundary layer scaling parameterssuch as the CBL depth or the convection velocity scale yieldto inversion strengths independent results in the steady stateboundary layer. In the case of the unsteady growth of theboundary layer, we found similar results except that differentforcing at the surface and capping at the top affect the bound-ary layer growth. However, the same discussion can be doneand the same conclusions can be drawn as the ones presentedin the following.
3.2 Reacting turbulent flow classification
The relative influence of turbulence on the species trans-formations can be quantified by the so-called turbulentDamkohler numberDat (Damkohler, 1940), defined as theratio between the integral time-scale of turbulent (τt ) and thechemical time-scale (τc) that is, in this context, the decaytime-scale of the radionuclide. Using this number, turbulentreacting flows can be classified into three categories (Schu-mann, 1989; Molemaker and Vila-Guerau de Arellano, 1998;Krol et al., 2000; Vila-Guerau de Arellano, 2003). For re-acting flows withDat<<1, the transformation proceeds ata slower rate than the turbulent mixing. Therefore, mixing
Atmos. Chem. Phys., 7, 697–712, 2007 www.atmos-chem-phys.net/7/697/2007/

J.-F. Vinuesa and S. Galmarini: Turbulent transport of222Rn and its daughters 701
Table 2. Volume averages of the turbulent Damkohler numbers.
Radionuclide Steady-state CBL Unsteady CBL
S0 <0.01 <0.01
S1 2.71 1.21–2.24
S2 0.31 0.14–0.25
S3 0.36 0.16–0.30
is reached prior to the transformations. WhenDat≈O(1),i.e. the time-scale of the transformation is of similar orderto the time-scale of the turbulent mixing, atmospheric turbu-lence controls the transformations. The behavior of activespecies can differ from the behavior observed and modeledof inert scalars. In the case of a decaying scalar, the effectof turbulent mixing will affect the spatial distribution of theradionuclei. ForDat>>1, transformations are much fasterthan the turbulent mixing meaning that species are trans-formed in-situ and are almost not transported. In our sim-ulations,τt=zi/w∗ andτc=λ−1
j with j=0, 1, 2, 3. The cor-respondingDat are summarized in Table 2. These numbersindicate that218Po (S1) is strongly influenced by the turbu-lent mixing of the CBL in both steady and unsteady condi-tions. The other short-lived daughters214Pb (S2) and214Bi(S3) refer to a moderate-slow regime indicating that their dis-tributions are only slightly affected by the combined effectsof decay and mixing.
While studying the relevance of accounting for the chem-ical contribution to second-order moments (fluxes and (co-)variances) of reacting scalars, Vinuesa and Vila-Guerau deArellano (2003) extended the turbulent reacting flow clas-sification by deriving other dimensionless numbers, the so-called Damkohler numbers for fluxes and (co-)variances.These numbers use a chemical time-scale based on thechemical terms included in second-order moment budgetequations. They showed that for flux and (co-)varianceDamkohler numbers∼O(1), the contribution of chemicalterms to second-order moment profiles is significant. Theflux Damkohler number can be expressed as the ratio of theflow time-scale to the time-scale of the chemical contributionto the flux. For a scalarB involved the chain
AλA→ B
λB→ C, (14)
the flux Damkohler number reads
Dawb =
∣∣∣∣Dat,B − Dat,A
w∗sa∗
w∗sb∗
∣∣∣∣. (15)
By using the w∗si∗ proposed by Cuijpers and Holt-slag (1998), i.e.w∗si∗ = 1
zi
∫ zi
0 wsidz, and chemical time-scales based on the radioactive decaying terms included influx budget equations, we calculate the flux Damkohler num-bers and report them in Table 3. In the steady state CBL, sig-nificant effects of the radioactive decay contribution on the
Table 3. Volume averages of the flux turbulent Damkohler numbers.
Radionuclide Steady-state CBL Unsteady CBL
S0 <0.01 <0.01
S1 1.08 0.62–0.38
S2 0.85 0.06—0.09
S3 0.16 0.01-0.02
S4 <0.01 <0.01
Fig. 2. Vertical profiles of222Rn and its progeny concentrations.The legend numbers represent the rank of the decaying compoundin the radioactive decay chain. The diamonds account for the con-centration of an inert scalar emitted at the surface with the same fluxas222Rn.
flux for 218Po (S1) and214Pb (S2) can be expected whereas214Bi (S3) flux Damkohler number only indicates a smallcontribution of the decaying process. However, under un-steady conditions only218Po (S1) flux is affected by the con-trol exerts by turbulence on the radioactive decay contribu-tion.
4 Dispersion of 222Rn and its progeny in the steady-state CBL
4.1 Vertical distribution and radioactive decay contribution
Figure 2 shows the vertical profile of222Rn and its progenyconcentrations. The mixed-layer concentrations are corre-lated with the half-lives of the radionuclei; the faster decay-ing the daughter is, the smaller is the concentration. Alsoas indicated by the Damkohler number classification,222Rnconcentration only shows a small deviation from the inertscalar one. All the radionuclides show overall well-mixedprofiles however since a wide range of radioactive decay fre-quencies is considered, e.g. from some minutes to days, any
www.atmos-chem-phys.net/7/697/2007/ Atmos. Chem. Phys., 7, 697–712, 2007
702 J.-F. Vinuesa and S. Galmarini: Turbulent transport of222Rn and its daughters
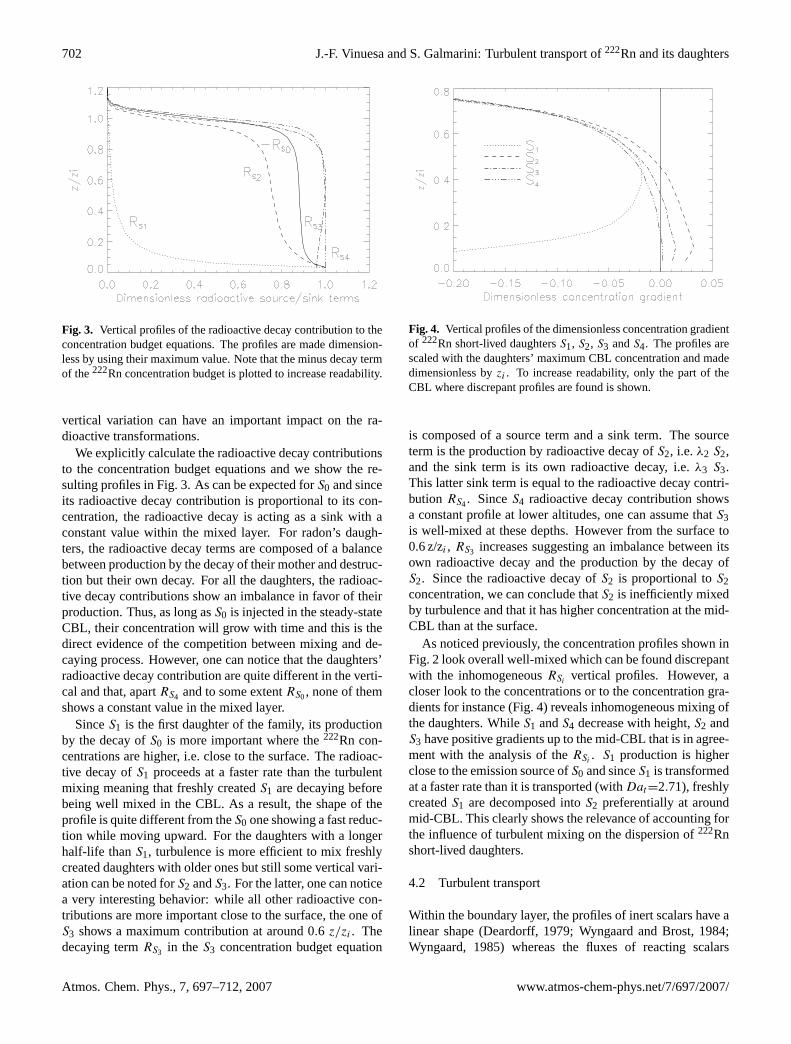
Fig. 3. Vertical profiles of the radioactive decay contribution to theconcentration budget equations. The profiles are made dimension-less by using their maximum value. Note that the minus decay termof the222Rn concentration budget is plotted to increase readability.
vertical variation can have an important impact on the ra-dioactive transformations.
We explicitly calculate the radioactive decay contributionsto the concentration budget equations and we show the re-sulting profiles in Fig. 3. As can be expected forS0 and sinceits radioactive decay contribution is proportional to its con-centration, the radioactive decay is acting as a sink with aconstant value within the mixed layer. For radon’s daugh-ters, the radioactive decay terms are composed of a balancebetween production by the decay of their mother and destruc-tion but their own decay. For all the daughters, the radioac-tive decay contributions show an imbalance in favor of theirproduction. Thus, as long asS0 is injected in the steady-stateCBL, their concentration will grow with time and this is thedirect evidence of the competition between mixing and de-caying process. However, one can notice that the daughters’radioactive decay contribution are quite different in the verti-cal and that, apartRS4 and to some extentRS0, none of themshows a constant value in the mixed layer.
SinceS1 is the first daughter of the family, its productionby the decay ofS0 is more important where the222Rn con-centrations are higher, i.e. close to the surface. The radioac-tive decay ofS1 proceeds at a faster rate than the turbulentmixing meaning that freshly createdS1 are decaying beforebeing well mixed in the CBL. As a result, the shape of theprofile is quite different from theS0 one showing a fast reduc-tion while moving upward. For the daughters with a longerhalf-life thanS1, turbulence is more efficient to mix freshlycreated daughters with older ones but still some vertical vari-ation can be noted forS2 andS3. For the latter, one can noticea very interesting behavior: while all other radioactive con-tributions are more important close to the surface, the one ofS3 shows a maximum contribution at around 0.6 z/zi . Thedecaying termRS3 in the S3 concentration budget equation
Fig. 4. Vertical profiles of the dimensionless concentration gradientof 222Rn short-lived daughtersS1, S2, S3 andS4. The profiles arescaled with the daughters’ maximum CBL concentration and madedimensionless byzi . To increase readability, only the part of theCBL where discrepant profiles are found is shown.
is composed of a source term and a sink term. The sourceterm is the production by radioactive decay ofS2, i.e.λ2 S2,and the sink term is its own radioactive decay, i.e.λ3 S3.This latter sink term is equal to the radioactive decay contri-bution RS4. SinceS4 radioactive decay contribution showsa constant profile at lower altitudes, one can assume thatS3is well-mixed at these depths. However from the surface to0.6 z/zi , RS3 increases suggesting an imbalance between itsown radioactive decay and the production by the decay ofS2. Since the radioactive decay ofS2 is proportional toS2concentration, we can conclude thatS2 is inefficiently mixedby turbulence and that it has higher concentration at the mid-CBL than at the surface.
As noticed previously, the concentration profiles shown inFig. 2 look overall well-mixed which can be found discrepantwith the inhomogeneousRSi
vertical profiles. However, acloser look to the concentrations or to the concentration gra-dients for instance (Fig. 4) reveals inhomogeneous mixing ofthe daughters. WhileS1 andS4 decrease with height,S2 andS3 have positive gradients up to the mid-CBL that is in agree-ment with the analysis of theRSi
. S1 production is higherclose to the emission source ofS0 and sinceS1 is transformedat a faster rate than it is transported (withDat=2.71), freshlycreatedS1 are decomposed intoS2 preferentially at aroundmid-CBL. This clearly shows the relevance of accounting forthe influence of turbulent mixing on the dispersion of222Rnshort-lived daughters.
4.2 Turbulent transport
Within the boundary layer, the profiles of inert scalars have alinear shape (Deardorff, 1979; Wyngaard and Brost, 1984;Wyngaard, 1985) whereas the fluxes of reacting scalars
Atmos. Chem. Phys., 7, 697–712, 2007 www.atmos-chem-phys.net/7/697/2007/

J.-F. Vinuesa and S. Galmarini: Turbulent transport of222Rn and its daughters 703
Fig. 5. Vertical profiles of the dimensionless fluxes for222Rn andits daughters. The values are made dimensionless byw∗si∗ as pro-posed by Cuijpers and Holtslag (1998).
show deviations with from this shape correlated withtheir Damkohler numbers (Gao and Wesely, 1994; Sykeset al., 1994; Vinuesa and Vila-Guerau de Arellano, 2003).These deviations are due to the action of the chemistry thatcan act as a sink or a source term in the flux budget.
The fluxes ofS0 and its progeny are shown in Fig. 5.The fluxes ofS0 and S4 have a linear profile whereas theones of the other daughters show deviations from the lin-ear shape. The flux of222Rn is similar to an inert scalarflux. Thus the chemical term, that is the radioactive decay inour case, has no impact on the vertical transport of222Rn asits Damkohler and flux Damkohler numbers suggested withDat<0.01 andDaws0<0.01. S1 has the highest Damkohlernumber (Dat=2.71) and its flux shows the biggest deviation.The other short-lived daughters, i.e.S2 andS3, have simi-lar Dat but while the deviation ofS2 flux is significant, theone ofS3 is rather small. Using the appropriate Damkohlernumber to assess the relevance of radioactive decay contri-bution to the flux allows clarifying this discrepancy. The fluxDamkohler number forS2 is 0.85 while the one ofS3 equals0.16 suggesting the vertical transport ofS2 is the one mostsignificantly affected by turbulence.
The most interesting point is that the vertical distributionof the fluxes changes from one daughter to another. ForS0,the maximum flux is found at the surface where it is emitted.Since all daughters are produced by the radioactive decom-position ofS0, one would expect to find maximum daughterfluxes close to the surface. However and as can be clearlynoticed in Fig. 5, this is not the case and the maximum fluxlocation is moving upwards while the rank of the daughterin the222Rn progeny is increasing.S1 has its maximum fluxat 0.25 z/zi and the others daughters maximum fluxes are lo-cated around 0.9 z/zi . Actually, the maximum flux locationreaches a quasi steady state value betwen 0.90 and 0.95 z/zi
(a)
(b)
(c)
(d)
Fig. 6. Vertical profiles of the dimensionless fluxes for222Rn, itsdaughters and the inert tracers. The values are made dimensionlessby w∗si∗ as proposed by Cuijpers and Holtslag (1998).
www.atmos-chem-phys.net/7/697/2007/ Atmos. Chem. Phys., 7, 697–712, 2007

704 J.-F. Vinuesa and S. Galmarini: Turbulent transport of222Rn and its daughters
(a) (b)
Fig. 7. Vertical profiles of the different contributions flux budget equations of(a) 222Rn (S0) and(b) 210Pb (S4). The profiles are madedimensionless usingw2
∗si∗z−1i
.
for the slowest (in the flux Damkohler number sense) daugh-ters, i.e.,S3 andS4.
In order to show the relevance of the turbulent fluxDamkohler number, one has to compare the evolution of theradionuclides to that of inert tracers released in the atmo-sphere at the same rate, location and time as the radionu-clides. Thus, we design a hypothetical decaying chain in-volving inert scalars that are produced as the222Rn progeny.For this academic case, we assume that each radionuclideproduces a radioactive daughter and an inert daughter. Thisdecaying pathway reads:
S0λ0→ S1 + I1, (16)
S1λ1→ S2 + I2, (17)
S2λ2→ S3 + I3, (18)
whereIi is the inert daughter created by the motherSi−1.Fig. 6 shows a comparison of theSi andIi fluxes.S1 has thebiggest flux Damkohler number (Daws1=1.08) and its fluxshows the most important deviation for the inert flux shapewhile the flux ofS3 (Daws3=0.16) is only slightly differentfrom I3 flux. This comparison clearly shows a correlationbetween the flux Damkohler number and the deviation of theradionuclide fluxes from the inert scalar shapes.
The understanding of the changes of flux profile shape be-haviors through222Rn progeny requires the determinationof which physical processes are responsible for their fluxes.Therefore, in order to study the relevance of the radioac-tive decay contribution to the flux, the terms of the fluxbudget Eq. (8) have been calculated explicitly. For an in-ert emitted scalar, our results are similar to previous stud-ies (Deardorff, 1974; Moeng and Wyngaard, 1984) and willnot be presented here. Briefly, the budget for inert emittedscalar reveals a balance between the gradient and the buoy-ancy production terms on the one hand, which are the majorflux sources up to the middle of the boundary layer, and on
the other hand the pressure and dissipation at smaller scaleswhich tend to destroy the fluxes. The transport contributionis removing flux from the lower boundary layer upwards witha maximum dissipating effect close to the surface.
Figure 7 shows the vertical profiles of the different con-tribution to the fluxes ofS0 and S4. Both have a negligi-ble radioactive decay contribution.S0 flux show the typi-cal decomposition obtained for bottom-up inert scalar (witha maximum flux at the surface) andS4 flux shows the oneof a top-down inert scalar (with a maximum flux at the topof the CBL). For this latter, we found similar results to thework of Cuijpers and Holtslag (1998) and in particular theircasea1. The gradient contribution becomes very small inthe lower boundary layer where the main production due tobuoyancy is balanced by the pressure correlation and the tur-bulent transport contributions. Turbulent transport is trans-porting flux upward with its maximum dissipative contribu-tion is located around 0.8 z/zi . ForS0 andS4, accounting forthe radioactive decay contribution to the flux is not relevantas was suggested by their very low flux Damkohler numbers(Table 3).
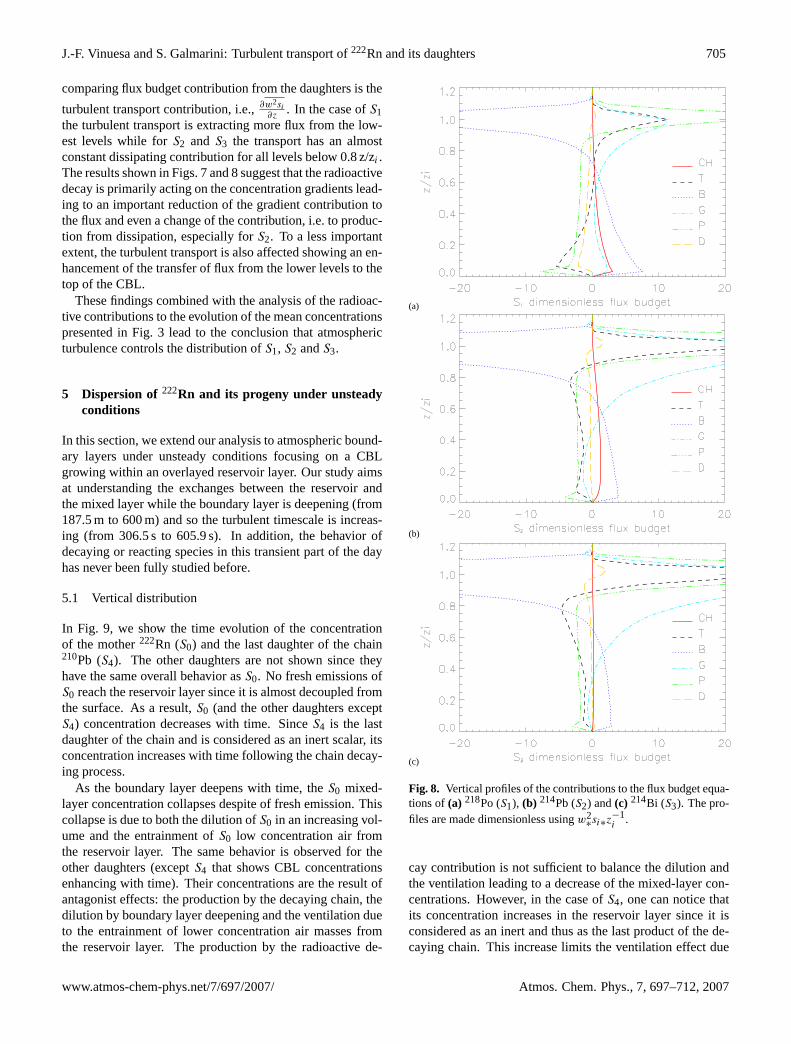
In Fig. 8, the vertical contributions to the flux budget equa-tions of the other daughters are presented. We found that theradioactive decay term is responsible for a relevant part of theflux production forS1 andS2 whereas it is almost negligiblefor S3. This is again in agreement with the flux Damkohlernumbers presented in Table 3. The gradient production, i.e.,w2 ∂Si
∂z, is the most affected term meaning that the radioac-
tive decay is responsible for the decrease of the concentra-tion gradient. The gradient term is reduced to one half of theS0 value and equals the radioactive decay contribution in thelower boundary layer in the case ofS1. In theS2 flux budget,it is actually dissipating flux in the same region. Its contribu-tion becomes small but remains negative forS3 and it reachesa zero contribution forS4 (see Fig. 7 of this paper and Fig. 3cof Cuijpers and Holtslag (1998) to compare to a top-down in-ert scalar). The other term that is showing differences while
Atmos. Chem. Phys., 7, 697–712, 2007 www.atmos-chem-phys.net/7/697/2007/
J.-F. Vinuesa and S. Galmarini: Turbulent transport of222Rn and its daughters 705
comparing flux budget contribution from the daughters is the
turbulent transport contribution, i.e.,∂w2si∂z
. In the case ofS1the turbulent transport is extracting more flux from the low-est levels while forS2 and S3 the transport has an almostconstant dissipating contribution for all levels below 0.8 z/zi .The results shown in Figs. 7 and 8 suggest that the radioactivedecay is primarily acting on the concentration gradients lead-ing to an important reduction of the gradient contribution tothe flux and even a change of the contribution, i.e. to produc-tion from dissipation, especially forS2. To a less importantextent, the turbulent transport is also affected showing an en-hancement of the transfer of flux from the lower levels to thetop of the CBL.
These findings combined with the analysis of the radioac-tive contributions to the evolution of the mean concentrationspresented in Fig. 3 lead to the conclusion that atmosphericturbulence controls the distribution ofS1, S2 andS3.
5 Dispersion of 222Rn and its progeny under unsteadyconditions
In this section, we extend our analysis to atmospheric bound-ary layers under unsteady conditions focusing on a CBLgrowing within an overlayed reservoir layer. Our study aimsat understanding the exchanges between the reservoir andthe mixed layer while the boundary layer is deepening (from187.5 m to 600 m) and so the turbulent timescale is increas-ing (from 306.5 s to 605.9 s). In addition, the behavior ofdecaying or reacting species in this transient part of the dayhas never been fully studied before.
5.1 Vertical distribution
In Fig. 9, we show the time evolution of the concentrationof the mother222Rn (S0) and the last daughter of the chain210Pb (S4). The other daughters are not shown since theyhave the same overall behavior asS0. No fresh emissions ofS0 reach the reservoir layer since it is almost decoupled fromthe surface. As a result,S0 (and the other daughters exceptS4) concentration decreases with time. SinceS4 is the lastdaughter of the chain and is considered as an inert scalar, itsconcentration increases with time following the chain decay-ing process.
As the boundary layer deepens with time, theS0 mixed-layer concentration collapses despite of fresh emission. Thiscollapse is due to both the dilution ofS0 in an increasing vol-ume and the entrainment ofS0 low concentration air fromthe reservoir layer. The same behavior is observed for theother daughters (exceptS4 that shows CBL concentrationsenhancing with time). Their concentrations are the result ofantagonist effects: the production by the decaying chain, thedilution by boundary layer deepening and the ventilation dueto the entrainment of lower concentration air masses fromthe reservoir layer. The production by the radioactive de-
(a)
(b)
(c)
Fig. 8. Vertical profiles of the contributions to the flux budget equa-tions of(a) 218Po (S1), (b) 214Pb (S2) and(c) 214Bi (S3). The pro-files are made dimensionless usingw2
∗si∗z−1i
.
cay contribution is not sufficient to balance the dilution andthe ventilation leading to a decrease of the mixed-layer con-centrations. However, in the case ofS4, one can notice thatits concentration increases in the reservoir layer since it isconsidered as an inert and thus as the last product of the de-caying chain. This increase limits the ventilation effect due
www.atmos-chem-phys.net/7/697/2007/ Atmos. Chem. Phys., 7, 697–712, 2007

706 J.-F. Vinuesa and S. Galmarini: Turbulent transport of222Rn and its daughters
(a)
(b)
Fig. 9. Vertical profiles of(a) 222Rn (S0) and(b) 210Pb (S4) con-centrations. The top of the CBL is overplotted with a white solidline and the entrainment layer is located between the dashed whitelines. The steppy aspect of these latter quantities is due to averagingprocedures, e.g. the CBL depth and the entrainment layer locationsare determined from the 5 min slab averaged sensible heat flux. Theconcentrations are plotted against time in minutes (lower x-axis)and int∗ (upper x-axis) wheret∗ = zi/w∗.
to vertical transport at the entrainment layer. In this case, thecombined effect of dilution and detrainment do not balancethe production by the radioactive decay and, as a result,S4concentration increases with time in the CBL.
5.2 Radioactive decay and turbulent transport contributions
The time evolution of the concentrations is the result of thecombined effect of the divergence of the fluxes that is thecontribution of the turbulent transport, and the radioactivedecay contribution (2). In order to understand which processis responsible for the collapse of the222Rn and its short-liveddaughters concentration in unsteady atmospheric boundarylayers, we focus in the following on the vertical profilesof the radioactive decay contributions (Fig. 10) and fluxes(Fig. 11).
Under unsteady conditions, we found similar vertical pro-files of the radioactive decay contribution toS0 progeny
(a)
(b)
(c)
(d)
Fig. 10. Vertical profiles of the radioactive decay contributions to222Rn progeny concentrations. Subfigures(a), (b), (c) and(d) areshowingRS1, RS2, RS3 andRS4, respectively. The top of the CBLis overplotted with a white solid line and the entrainment layer islocated between the dashed white lines. As in Fig. 9, the steppy as-pect of these latter quantities is due to the time averaging procedure.The location of theRS3 maximum is also shown with a solid blackline. The contributions have been made dimensionless using theirmaximum values. The profiles are plotted against time in minutes(lower x-axis) and int∗ (upper x-axis) wheret∗ = zi/w∗.
Atmos. Chem. Phys., 7, 697–712, 2007 www.atmos-chem-phys.net/7/697/2007/

J.-F. Vinuesa and S. Galmarini: Turbulent transport of222Rn and its daughters 707
concentrations as we found previously for the fully devel-oped CBL. The radioactive decay term acts as a sink forS0and as a source for its progeny. Moreover, the same verticalvariations can be reported. All contributions show a max-imum close to the surface exceptRS3 andRS4. While theradioactive decay contribution toS3 concentration is maxi-mum at the mid-CBL,RS4 shows a well-mixed profile. Alsoa fast reduction of the decay contribution toS2 is found whilemoving upward.
However, the variation with height of the radioactive decaycontributions is enhanced while the boundary layer is deep-ening. As suggested by their turbulent Damkohler numbersshown in Table 2,S1, S2 andS3 are affected by the turbulentstructures. Moreover since theDat are proportional toτt , theDat increase together with the turbulent timescale. When theturnover time of the CBL is increasing, it takes more time forturbulence to transport and mix the compounds all over theboundary layer. As a result, the turbulent mixing of radon’sdaughters is less efficient and the vertical variation of the ra-dioactive contribution is increasing with time.
Figure 11 shows the time evolution of the vertical fluxesfor S0, andS1. The fluxes of the other daughters are notshown since they have similar shape as the ones ofS1. Ac-tually for S2 and its daughters, we found the same behav-ior reported for the steady-state CBL: linear shapes (as sug-gested by the flux Damkohler numbers given in Table 3)with their maximum located close to the top of the bound-ary layer. Also suggested by the flux Damkohler numbers,only S1 fluxes show deviation from the inert shape and thesedeviations are decreasing with time as do the flux Damkohlernumbers (fromDaws1=0.62 at the beginning of the simula-tion toDaws1=0.38 at the end).
The most remarkable difference with the steady-state caseis the behavior ofS0. In the steady-state CBL,S0 flux is abottom-up flux with a maximum value at the surface (Fig. 5)whereas under unsteady conditions, the maximumS0 flux ismoving toward the boundary layer top (Fig. 11a). Actually,the flux shows maximum values when the boundary layergrowth rate is maximum. While the boundary layer is deep-ening, low222Rn concentration air masses are entrained fromthe reservoir layer. Turbulence transport is balancing the gra-dient of concentration induced by the entrainment of cleanerair by transporting222Rn towards the upper boundary layer.This upward flux is more vigorous when the ventilation pro-cess is enhanced by the increase of the boundary layer growthrate. Thus, the driving process responsible for the collapseof S0 concentration is much more likely the ventilation dueto the entrainment of low-concentration air masses from thereservoir layer.
5.3 Role of entrainment on222Rn mixed-layer concentra-tion
We have seen previously that entrainment plays a crucial roleon the behavior of222Rn and its progeny morning concen-
(a)
(b)
Fig. 11. Vertical profiles(a) 222Rn (S0) and (b) 218Po (S1) in-stantaneous fluxes. The fluxes are made dimensionless using theirmaximum values. The top of the CBL is overplotted with a whitesolid line and the entrainment layer is located between the dashedwhite lines. As in Figs. 9 and 10, the steppy aspect of these latterquantities is due to the time averaging procedure. The fluxes havebeen made dimensionless using their maximum values. The profilesare plotted against time in minutes (lower x-axis) and int∗ (upperx-axis) wheret∗ = zi/w∗.
trations. The entrainment fluxes(wsi)e account for the ex-change of compounds between the boundary layer and thefree troposphere (or here the reservoir layer) and thus influ-ence the vertical distribution of222Rn and its daughters inthe lower part of the troposphere. In the following, we fo-cus on the entrainment flux to the surface flux ratio of222Rn,i.e.β0=
−(ws0)e(ws0)s
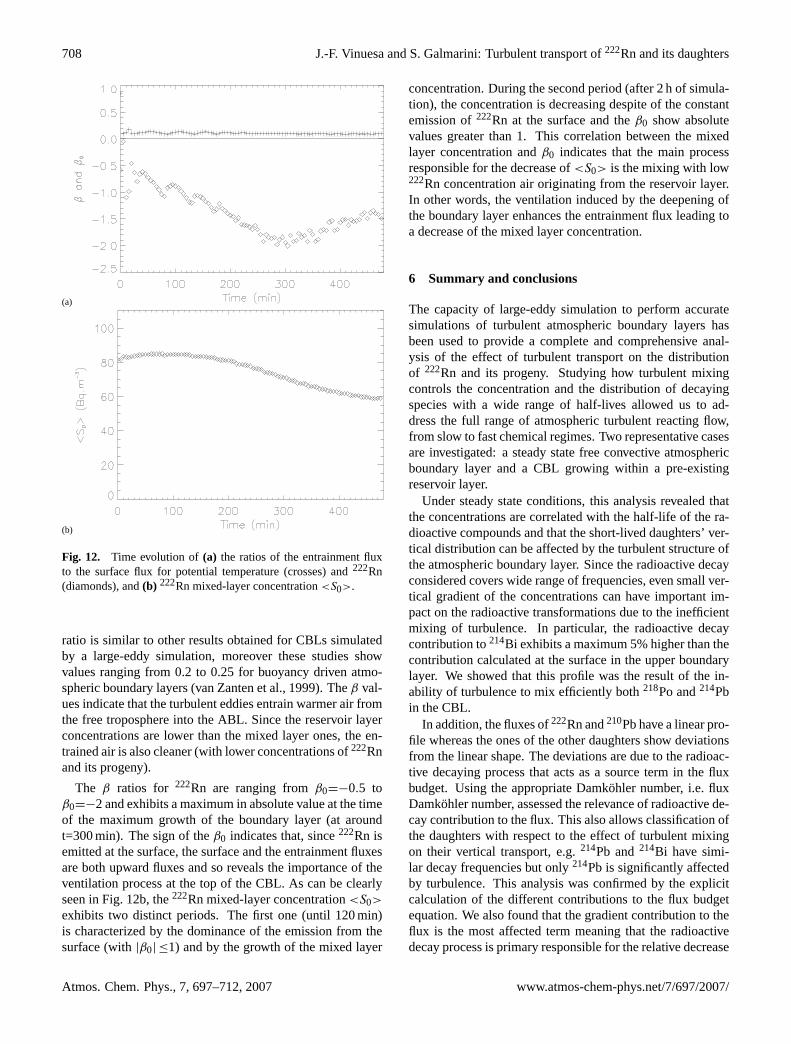
where(ws0)e and(ws0)s are the entrainmentand surface flux ofS0 respectively, to outline the importanceof the entrainment process. Figure 12 shows the time evo-lution of β (the ratio of entrainment to the surface flux ofpotential temperature),β0 and the mixed-layer concentration<S0> calculated from the results obtained for the simulationof the convective boundary layer under unsteady conditions.
The calculation ofβ gives an almost constant value ofβ=0.2 throughout the whole period of simulation. Theβ
www.atmos-chem-phys.net/7/697/2007/ Atmos. Chem. Phys., 7, 697–712, 2007
708 J.-F. Vinuesa and S. Galmarini: Turbulent transport of222Rn and its daughters
(a)
(b)
Fig. 12. Time evolution of(a) the ratios of the entrainment fluxto the surface flux for potential temperature (crosses) and222Rn(diamonds), and(b) 222Rn mixed-layer concentration<S0>.
ratio is similar to other results obtained for CBLs simulatedby a large-eddy simulation, moreover these studies showvalues ranging from 0.2 to 0.25 for buoyancy driven atmo-spheric boundary layers (van Zanten et al., 1999). Theβ val-ues indicate that the turbulent eddies entrain warmer air fromthe free troposphere into the ABL. Since the reservoir layerconcentrations are lower than the mixed layer ones, the en-trained air is also cleaner (with lower concentrations of222Rnand its progeny).
The β ratios for 222Rn are ranging fromβ0=−0.5 toβ0=−2 and exhibits a maximum in absolute value at the timeof the maximum growth of the boundary layer (at aroundt=300 min). The sign of theβ0 indicates that, since222Rn isemitted at the surface, the surface and the entrainment fluxesare both upward fluxes and so reveals the importance of theventilation process at the top of the CBL. As can be clearlyseen in Fig. 12b, the222Rn mixed-layer concentration<S0>
exhibits two distinct periods. The first one (until 120 min)is characterized by the dominance of the emission from thesurface (with|β0| ≤1) and by the growth of the mixed layer
concentration. During the second period (after 2 h of simula-tion), the concentration is decreasing despite of the constantemission of222Rn at the surface and theβ0 show absolutevalues greater than 1. This correlation between the mixedlayer concentration andβ0 indicates that the main processresponsible for the decrease of<S0> is the mixing with low222Rn concentration air originating from the reservoir layer.In other words, the ventilation induced by the deepening ofthe boundary layer enhances the entrainment flux leading toa decrease of the mixed layer concentration.
6 Summary and conclusions
The capacity of large-eddy simulation to perform accuratesimulations of turbulent atmospheric boundary layers hasbeen used to provide a complete and comprehensive anal-ysis of the effect of turbulent transport on the distributionof 222Rn and its progeny. Studying how turbulent mixingcontrols the concentration and the distribution of decayingspecies with a wide range of half-lives allowed us to ad-dress the full range of atmospheric turbulent reacting flow,from slow to fast chemical regimes. Two representative casesare investigated: a steady state free convective atmosphericboundary layer and a CBL growing within a pre-existingreservoir layer.
Under steady state conditions, this analysis revealed thatthe concentrations are correlated with the half-life of the ra-dioactive compounds and that the short-lived daughters’ ver-tical distribution can be affected by the turbulent structure ofthe atmospheric boundary layer. Since the radioactive decayconsidered covers wide range of frequencies, even small ver-tical gradient of the concentrations can have important im-pact on the radioactive transformations due to the inefficientmixing of turbulence. In particular, the radioactive decaycontribution to214Bi exhibits a maximum 5% higher than thecontribution calculated at the surface in the upper boundarylayer. We showed that this profile was the result of the in-ability of turbulence to mix efficiently both218Po and214Pbin the CBL.
In addition, the fluxes of222Rn and210Pb have a linear pro-file whereas the ones of the other daughters show deviationsfrom the linear shape. The deviations are due to the radioac-tive decaying process that acts as a source term in the fluxbudget. Using the appropriate Damkohler number, i.e. fluxDamkohler number, assessed the relevance of radioactive de-cay contribution to the flux. This also allows classification ofthe daughters with respect to the effect of turbulent mixingon their vertical transport, e.g.214Pb and214Bi have simi-lar decay frequencies but only214Pb is significantly affectedby turbulence. This analysis was confirmed by the explicitcalculation of the different contributions to the flux budgetequation. We also found that the gradient contribution to theflux is the most affected term meaning that the radioactivedecay process is primary responsible for the relative decrease
Atmos. Chem. Phys., 7, 697–712, 2007 www.atmos-chem-phys.net/7/697/2007/

J.-F. Vinuesa and S. Galmarini: Turbulent transport of222Rn and its daughters 709
of the concentration gradient. The exact decomposition alsoreveals that while222Rn shows the typical bottom-up scalarflux behavior, the last daughter210Pb exhibits the one of atop-down scalar.
Under unsteady conditions,222Rn and its short-liveddaughter’s concentrations decrease while the boundary layerdeepens. This deepening leads to the increase of the turnovertime of the CBL. Therefore it takes more time for turbulenceto transport and mix the compounds all over the boundarylayer. The fluxes are also affected by the deepening of theCBL. In particular, while222Rn flux shows a maximum atthe surface in the fully developed CBL, it is moving upwardsunder unsteady conditions and reaches a maximum for thefastest boundary layer growth. The analysis of the entrain-ment flux to the surface flux ratio correlated to the mixed-layer concentration of222Rn showed that the growth of theboundary layer is inducing ventilation at the top of the CBL.The entrainment of cleaner air from the reservoir layer resultsin the decrease of the mixed layer concentrations.
From this comprehensive study, we can conclude that theturbulent properties of the atmospheric convective boundarylayers are of importance to study the dispersion and the trans-port of the222Rn family. The short-lived daughters are af-fected by the control exerts by turbulence on both their ra-dioactive decay and their turbulent transport. Therefore ac-curate modeling requires accounting for the turbulent prop-erties of the ABL. Finally, the turbulent and flux Damkohlernumbers have shown to be useful dimensionless numbers toclassify the effects of turbulent mixing on the concentrationand the vertical transport of reacting scalars.
Appendix A
Analytical solution for 222Rn and its progenyconcentrations
For the chain of reactions
Aλ1→ B
λ2→ C
λ3→ D
λ4→ E, (A1)
the chemical system that has to be solved is
dA
dt= −λ1A, (A2)
dB
dt= λ1A − λ2B, (A3)
dC
dt= λ2B − λ3C, (A4)
dD
dt= λ3C − λ4D, (A5)
dE
dt= λ4D. (A6)
For such a system witha0, b0, c0, d0 ande0 as initial con-centrations ofA, B, C, D andE respectively, the analyticalsolutions read
A = a0e−λ1t , (A7)
B = b0e−λ2t +
a0λ1
(λ2 − λ1)
(
e−λ1t − e−λ2t)
, (A8)
C = c0e−λ3t +
a0λ1λ2
(λ3 − λ1)(λ2 − λ1)
(
e−λ1t − e−λ3t)
+λ2
(λ3 − λ2)
(
b0 −a0λ1
(λ2 − λ1)
)(
e−λ2t − e−λ3t)
, (A9)
D=d0e−λ4t+
a0λ1λ2λ3
(λ4−λ1)(λ3−λ1)(λ2−λ1)
(
e−λ1t−e−λ4t)
+λ2λ3
(λ4−λ2)(λ3−λ2)
(
b0−a0λ1
(λ2−λ1)
)(
e−λ2t−e−λ4t)
+
[
c0−a0λ1λ2
(λ3−λ1)(λ2−λ1)−
λ2
(λ3−λ2)
(
b0−a0λ1
(λ2−λ1)
)]
×λ3
(λ4−λ3)
(
e−λ3t−e−λ4t)
, (A10)
E=e0+ (a0−A) + (b0−B) + (c0−C) + (d0−D) . (A11)
These analytical solutions have been used to initialize thevertical profiles of222Rn and its progeny in the reservoirlayer for the unsteady condition simulation. In the nocturnalboundary layer (NBL),222Rn is continuously emitted at thesurface and is assumed to be instantaneously mixed withinthe NBL of depthzi . In the previous system, this situationcorresponds to the injection of fresh material ofA, thusA
time evolution concentration now read
dA
dt= −
(
Fzi− Fs
)
zi
− λ1A, (A12)
where the vertical flux divergence is approximated by the ra-tio of the net flux, i.e. the difference between the surface fluxFs and the detrainment flux at the top of the CBLFzi
, tothe boundary layer depthzi . Assuming thatFzi
<<Fs , theanalytical solutions of the system become
A =Fs
λ1zi
+ αe−λ1t , (A13)
B =Fs
λ2zi
+ βe−λ2t +αλ1
(λ2 − λ1)
(
e−λ1t − e−λ2t)
, (A14)
C =Fs
λ3zi
+ χe−λ3t +αλ2λ1
(λ3 − λ1)(λ2 − λ1)
(
e−λ1t − e−λ3t)
+λ2
(λ3 − λ2)
(
β −αλ1
(λ2 − λ1)
)(
e−λ2t − e−λ3t)
,
(A15)
www.atmos-chem-phys.net/7/697/2007/ Atmos. Chem. Phys., 7, 697–712, 2007

710 J.-F. Vinuesa and S. Galmarini: Turbulent transport of222Rn and its daughters
D =Fs
λ4zi
+ δe−λ4t +αλ3λ2λ1
(λ4 − λ1)(λ3 − λ1)(λ2 − λ1)
(
e−λ1t − e−λ4t)
+λ3λ2
(λ4 − λ2)(λ3 − λ2)
[
β −αλ1
(λ2 − λ1)
](
e−λ2t − e−λ4t)
+
[
χ −αλ2λ1
(λ3 − λ1)(λ2 − λ1)−
λ2
(λ3 − λ2)
(
β −αλ1
(λ2 − λ1)
)]
×λ3
(λ4 − λ3)
(
e−λ3t − e−λ4t)
, (A16)
E = e0 +Fs
zi
t +αλ4λ3λ2
(λ4 − λ1)(λ3 − λ1)(λ2 − λ1)
(
e−λ1t − 1)
+λ4λ3
(λ4 − λ2)(λ3 − λ2)
(
β −αλ1
(λ2 − λ1)
)(
e−λ2t − 1)
+λ4
(λ4 − λ3)
[
χ −αλ2λ1
(λ3 − λ1)(λ2 − λ1)−
λ2
(λ3 − λ2)
(
β −αλ1
(λ2 − λ1)
)](
e−λ3t − 1)
−
λ3λ2
(λ4 − λ2)(λ3 − λ2)
(
β −αλ1
(λ2 − λ1)
)
+αλ3λ2λ1
(λ4 − λ1)(λ3 − λ1)(λ2 − λ1)
+λ3
(λ4 − λ3)
[
χ −αλ2λ1
(λ3 − λ1)(λ2 − λ1)−
λ2
(λ3 − λ2)
(
β −αλ1
(λ2 − λ1)
)]
+ δ
×(
e−λ4t − 1)
, (A17)
where
α = a0 −Fs
λ1zi
,
β = b0 −Fs
λ2zi
,
χ = c0 −Fs
λ3zi
,
δ = d0 −Fs
λ4zi
. (A18)
Acknowledgements. All computations were performed on theLinux cluster of the ECOMAR action of the Institute for Envi-ronment and Sustainability. The authors wish to thank A. Stipsand P. Simons who kindly provided the access to this facility. Theauthors are thankful to both referees, J. Vila-Guerau de Arellanoand A. G. Williams, for their comments and remarks.
Edited by: M. G. Lawrence
References
Allen, D. J., Rood, R. B., Thompson, A. M., and Hudson R. D.:Three-dimensional radon-222 calculations using assimilated me-teorological data and a convective mixing algorithm, J. Geophys.Res., 101, 6871–6881, 1996.
Beck, H. L. and Gogolak C. V.: Time dependent calculation of thevertical distribution of 222Rn and its decay products in the atmo-sphere, J. Geophys. Res., 84, 3139–3148, 1979.
Butterweck, G., Reineking, A., Kesten, J., and Porstendorfer J.: Theuse of the natural radioactive noble gases radon and thoron astracers for the study of the turbulent exchange in the atmosphericboundary layer case study in and above a wheat field, Atmos.Environ. 28, 1963-1969, 1994.
Clarke, R. H., Dyer, A. J., Brook, R. R., Reid, D. G., and Troup A.J.: The Wangara experiment: boundary layer data, Paper No. 19,Div. Meteorol. Phys., CSIRO, Australia, 1971.
Cuijpers, J. W. M. and Duynkerke P. G.: Large eddy simulations oftrade wind with cumulus clouds, J. Atmos. Sci. 50, 3894–3908,1993.
Cuijpers, J. W. M. and Holtslag A. A. M.: Impact of skewnessand nonlocal effects on scalar and buoyancy fluxes in convectiveboundary layers, J. Atmos. Sci., 55, 151–162, 1998.
Damkohler, G.: Influence of turbulence on the velocity flames ingas mixtures, Z. Elektrochem., 46, 601–626, 1940.
Deardorff, J. W.: Three-dimensional numerical study of turbulencein an entraining mixed layer, Bound.-Layer Meteorol., 7, 199–226, 1974.
Deardorff, J. W.: Prediction of convective mixed-layer entrainmentfor realistic capping inversion structure, J. Atmos. Sci., 36, 424–436, 1979.
Dentener, F., Feichter, J., and Jeuken A.: Simulation of the trans-port of Rn-222 using on-line and off-line global models at differ-ent horizontal resolutions: a detailed comparison with measure-ments, Tellus 51B, 573–602, 1999.
Druilhet, A. and Fontan J.: Determination des coefficients de dif-fusion verticale entre 0 et 100 ma laide du radon et du ThB,Bound.-Layer Meteorol., 3, 468-498, 1973a.
Druilhet, A. and Fontan J.: Utilisation du thoron pour ladetermination du coefficient vertical de diffusion turbulante presde sol, Tellus 25, 199-212, 1973b.
Fontan, J., Guedalia, D., Druilhet, A., and Lopez A.: Une methodede mesure de la stabilite verticale de latmosphere pres du sol,Bound.-Layer Meteorol., 17, 3–14, 1979.
Fujinami, N. and Esaka S.: Variations in Radon 222 daughter con-centrations in surface air with atmospheric stability, J. Geophys.Res., 92, 1041–1043, 1987.
Fujinami, N. and Esaka S.: A simple model for estimating the mix-ing depth from the diurnal variation of atmospheric 222Rn con-centration, Rad. Prot. Dos., 24, 88–91, 1988.
Galmarini, S.: One year of 222-Rn concentration in the atmosphericsurface layer, Atmos. Chem. Phys. 6, 2865–2887, 2006.
Gao, W. and Wesely M. L.: Numerical modelling of the turbu-lent fluxes of chemically reactive trace gases in the atmosphericboundary layer, J. Appl. Meteorol., 33, 835–847, 1994.
Guedalia, D., Allet, C., Fontan, J., Druilhet, A., and Assaf, G.:Lead-212, Rn, and vertical mixing in the lower atmosphere (100-2000 m), Tellus, 25, 381-385, 1973.
Guedalia, D., Allet, C., and Fontan J.: Vertical exchange measure-ments in the lower troposphere using ThB (212Pb) and radon(222Rn), J. Appl. Meteorol., 13, 27-39, 1974.
Guedalia, D., NTsila, A., Druilhet, A., and Fontan J.: Monitoring ofthe atmospheric stability above an urban and suburban site usingrodar and radon measurements, J. Appl. Meteorol., 19, 839-848,1980.
Gaudry, A., Polian, G., Ardouin, B., and Lambert G.:Radon-calibrated emissions of CO2 from South Africa, Tellus, 42B, 9-19, 1990.
Genthon, C. and Armengaud A.: Radon-222 as a comparative tracerof transport and mixing in 2 general-circulation models of theatmosphere, J. Geophys. Res., 100, 2849–2866, 1995.
Ikebe, Y.: Variation of radon and thoron concentrations in relationto the wind speed, J. Meteorol. Soc. Jpn., 48, 461-467, 1970.
Ikebe, Y. and Shimo M.: Estimation of the vertical turbulent diffu-sivity from thoron profiles, Tellus, 24, 29-37, 1972.
Jacob, D. J. and Prather M. J.: Radon-222 as a test of convective
Atmos. Chem. Phys., 7, 697–712, 2007 www.atmos-chem-phys.net/7/697/2007/

J.-F. Vinuesa and S. Galmarini: Turbulent transport of222Rn and its daughters 711
transport in a general circulation model, Tellus, 42B, 118-134,1990.
Jacob, D. J., Prather, M. J., Rasch, P. J., Shia, R. L., Balkanski, Y.J., Beagley, S. R., Bergmann, D. J., Blackshear, W. T., Brown,M., Chiba, M., Chipperfield, M. P., deGrandpre, J., Dignon, J.E., Feichter, J., Genthon, C., Grose, W. L., Kasibhatla, P. S.,Kohler, I., Kritz, M. A., Law, K., Penner, J. E., Ramonet, M.,Reeves, C. E., Rotman, D. A., Stockwell, D. Z., VanVelthoven,P. F. J., Verver, G., Wild, O., Yang, H., and Zimmermann P.:Evaluation and intercomparison of global atmospheric transportmodels using Rn-222 and other short-lived tracers, J. Geophys.Res., 102, 5953–5970, 1997.
Jacobi, W. and Andre K.: The vertical distribution of 222Rn, 220Rnand their decay products in the atmosphere, J. Geophys. Res., 68,3799–3814, 1963.
Jonker, H. J. J., Vila -Guerau de Arellano, J., and Duynkerke P. G.:Characteristic length scales of reactive species in a convectiveboundary layer, J. Atmos. Sci., 61, 41–56, 2004.
Kataoka, T., Yunoki, E., Shimizu, M., Mori, T., Tsukamoto, O.,Ohhashi, Y., Sahashi, K., Maitani, T., Miyashita, K., Fujikawa,Y., and Kudo A.: Diurnal variation in radon concentration andmixing-layer gepth, Bound.-Layer Meteorol., 89, 225-250, 1998.
Kataoka, T., Yunoki, E., Shimizu, M.,Mori, T., Tsukamoto, O.,Ohhashi, Y., Sahashi, K., Maitani, T.,Miyashita, K., Iwata, T.,Fujikawa, Y., Kudo, A., and Shaw R. H.: A study of the atmo-spheric boundary layer using raon and air pollutants as tracers,Bound.-Layer Meteorol., 101, 131-155, 2001.
Krol, M. C., Molemaker, M. J., and Vila-Guerau de Arellano J.: Ef-fects of turbulence and heterogeneous emissions on photochemi-cally active species in the convective boundary layer, J. Geophys.Res., 105, 6871–6884, 2000.
Larson, R. E., Lamontagne, R. A., and Wittmann W. I.: Radon-222,CO, CH4 and continental dust over the greenland and norwegianseas, Nature, 240, 345-347, 1972.
Li, Y. H. and Chang J. S.: A three-dimensional global episodictracer transport model. 1. Evaluation of its processes by radon222 simulations, J. Geophys. Res., 101, 25 931–25 947, 1996.
Lopez, A., Guedalia, D., Servant, J., and Fontan J.: Advantages ofthe use of radioactive tracers 222Rn and 212Pb for the study ofaitken nuclei within the lower troposphere, J. Geophys. Res., 79,1243-1252, 1974.
Mahowald, N. M., Rasch, P. J., Eaton, B. E., Whittlestone, S., andPrinn R. G.: Transport of (222)radon to the remote troposphereusing the model of atmospheric transport and chemistry and as-similated winds from ECMWF and the National Center for En-vironmental Prediction NCAR, J. Geophys. Res., 102, 28 139-28 151, 1997.
Moeng, C. H. and Wyngaard J. C.: Statistics of conservative scalarsin the convective boundary layer, J. Atmos. Sci., 41, 3161–3169,1984.
Molemaker, M. J. and Vila-Guerau de Arellano J.: Turbulent controlof chemical reactions in the convective boundary layer, J. Atmos.Sci., 55, 568–579, 1998.
Moses, H., Lucus Jr., H. F., and Zerbe G. A.: The Effect of Mete-orological Variables upon Radon concentration three feet abovethe ground, J. Air Pollut. Control. Assoc., 13, 12-19, 1963.
Patton, E. G., Davis, K. J., Barth, M. C., and Sullivan P. P. : De-caying scalars emitted by a forest canopy: a numerical study,Bound.-Layer Meteorol., 100, 91–129, 2001.
Pearson, J. E. and Moses H.: Atmospheric Radon-222 concentra-tion variation with height and time, J. Appl. Meteorol. 5, 175-181, 1966.
Petersen, A. C. and Holtslag A. A. M.: A first-order closure for co-variances and fluxes of reactive species in the convective bound-ary layer, J. Appl. Meteorol., 38, 1758–1776, 1999.
Petersen, A. C., Beets, C., van Dop, H., and Duynkerke P. G.: Mass-flux schemes for transport of non-reactive and reactive scalars inthe convective boundary layer, J. Atmos. Sci., 56, 37–56, 1999.
Petersen, A. C.: The impact of chemistry on flux estimates in theconvective boundary layer, J. Atmos. Sci., 57, 3398–3405, 2000.
Polian, G., Lambert, G., Ardouin, B., and Jegou A.: Long-rangetransport of continental radon in subantarctic and antarctic areas,Tellus, 38B, 178-189, 1986.
Porstendorfer, J.: Properties and behaviour of radon and thoron andtheir decay products in the air, J. Atmos. Sci., 25, 219–263, 1994.
Ramonet, M., Le Roulley, J. C., Bousquet, P., and Monfray P.:Radon-222 measurements during the Tropoz II campaign andcomparison with a global atmospheric transport model, J. Atmos.Chem., 23, 107-136, 1996.
Robe, M. C., Rannou, A., and Le Bronec J. Radon measurement inthe environment in France, Rad. Prot. Dos., 45, 455-457, 1992.
Schumann, U.: Large-eddy simulation of turbulent diffusion withchemical reactions in the convective boundary layer, Atmos. En-viron., 23, 1713–1729, 1989.
Sykes, R. I., Parker, S. F., Henn, D. S., and Lewellen W. S.: Tur-bulent mixing with chemical reactions in the planetary boundarylayer, J. Appl. Meteorol., 33, 825–834, 1994.
Sesana, L., Barbieri, L., Facchini, U., and Marcazzan G.M.: 222Rnas a tracer of atmospheric motions: a study in Milan, Rad. Prot.Dos., 78, 65–71, 1998.
Sesana, L., Ottobrini, B., Polla, G., and Facchini U.: 222Rn as in-dicator of atmospheric turbulence: measurements at Lake Mag-giore and on the pre-Alps, J. Env. Rad., 86, 271–288, 2006.
Siebesma, A. P. and Cuijpers J. W. M.: Evaluation of parametricassumptions for shallow cumulus convection, J. Atmos. Sci., 52,650–666, 1995.
Stockwell, D. Z., Kritz, M. A., Chipperfield, M. P., and Pyle J.A.: Validation of an off-line three dimensional chemical trans-port model using observed radon profiles – 2. Model results, J.Geophys. Res., 103, 8433-8445, 1998.
van Zanten, M., Duynkerke, P. G., and Cuijpers J. W. M.: Entrain-ment parameterizations in convective boundary layers, J. Atmos.Sci., 56, 813-828, 1999.
Verver, G. H. L., van Dop, H., and Holtslag A. A. M.: Turbu-lent mixing of reactive gases in the convective boundary layer,Bound.-Layer Meteorol., 85, 197–222, 1997.
Vil a-Guerau de Arellano, J., and Cuijpers J. W. M.: The chemistryof a dry cloud: the effects of radiation and turbulence, J. Atmos.Sci. 57, 1573–1584, 2000.
Vil a-Guerau de Arellano J.: Bridging the gap between atmosphericphysics and chemistry in studies of small-scale turbulence, Bull.Amer. Meteor. Soc., 84, 51–56, 2003.
Vinod Kumar, A., Sitaraman, V., Oza, R. B., and Krishamoorthy T.M.: Application of a numerical model for the planetary boundarylayer to the vertical distribution of radon and its daughter prod-ucts, Atmos. Environ., 33, 4717–4726, 1999.
Vinuesa, J.-F. and Vila -Guerau de Arellano J.: Fluxes and (co-)variances of reacting scalars in the convective boundary layer,
www.atmos-chem-phys.net/7/697/2007/ Atmos. Chem. Phys., 7, 697–712, 2007

712 J.-F. Vinuesa and S. Galmarini: Turbulent transport of222Rn and its daughters
Tellus, 55B, 935-949, 2003.Vinuesa, J.-F. and Vila -Guerau de Arellano J.: Introducing effective
reaction rates to account for the inefficient mixing of the convec-tive boundary layer, Atmos. Environ., 39, 445–461, 2005.
Wilkening M. H.: Radon 222 concentrations in the convective pat-terns of a mountain environment, J. Geophys. Res., 75, 1733–1740, 1970.
Wyngaard, J. C. and Brost R. A.: Top-down and bottom-up diffu-sion of a scalar in the convective boundary layer, J. Atmos. Sci.,41, 102–112, 1984.
Wyngaard J. C.: Structure of the planetary boundary layer and im-plications for its modeling, J. Clim. App. Meteorol., 24, 1131–1142, 1985.
Zahorowski, W., Chambers, S. D., and Henderson-Sellers, A.:Ground based radon-222 observations and their application toatmospheric studies, J. Env. Rad., 76, 3-33, 2004.
Atmos. Chem. Phys., 7, 697–712, 2007 www.atmos-chem-phys.net/7/697/2007/