characterization of the cuneiform signs by the use of a
TRANSCRIPT
Characterization of the cuneiform signs bythe use of a multifunctional optoelectronic device
Nazif Demoli, Hartmut Gruber, Uwe Dahms, and Gunther Wernicke
The cuneiform-inscription ~CI! signs recorded on the original clay tablet known as HS 158b from Nippur~1329 B.C.! have been characterized by the use of a multifunctional optoelectronic device. Propertiessuch as features in object and Fourier space or similarity measures between the CI sign samples wereinvestigated by the application of various numerical and experimental procedures. An overall algorithmof the experimental work is given, and the corresponding particular steps are described. For describingthe objects from the CI font numerically, a mathematical model is introduced. To decrease the sensi-tivity between different samples of a sign ~in-class objects! and to increase the discrimination of othersigns ~out-of-class objects!, we designed and implemented, besides digital techniques, a coherent opticaltechnique for averaging a training set of in-class objects. The preliminary correlation experimentsconducted on several CI signs illustrate the usefulness of the proposed approach. © 1996 OpticalSociety of America
Key words: Optical character recognition, correlation filters, coherent optical averaging.
1. Introduction
Character reading was often a matter of concern inthe field of optical pattern recognition, first as a de-monstrative example,1 and later for problems in read-ing, for example, the ancient handwritten Hebraiccharacters.2 More recently, for handwriting recog-nition, a hybrid incoherent optical processor wasmade that computes moments of images in realtime.3 For handwritten-signature verification, thesynthetic-discriminant-function approach was ap-plied.4 For the recognition of different styles of Chi-nese fonts, an optical character-recognition systemusing accumulated-stroke features has been devel-oped.5 Clay tablets that carry messages from theancient times in the form of cuneiform inscription~CI! have been recently analyzed.6–8The preliminary studies of clay tablets were con-
cerned with investigating the possibility of the utili-zation of holographic techniques for high-resolutionrecording and for characterizing the CI font. The
N. Demoli is with the Laboratory for Coherent Optics, Instituteof Physics, University of Zagreb, P.O. Box 304, Bijenicka 46, 41000Zagreb, Croatia; the other authors are with the Laboratory forCoherent Physics, Fachbereich Physik, Invalidenstrasse 110,10115 Berlin, Germany.Received 15 September 1995; revisedmanuscript received 6May
1996.0003-6935y96y295811-10$10.00y0© 1996 Optical Society of America
original CI signs are three-dimensional ~3-D! objectscomposed of wedge-shaped imprints that can vary innumber, size, and orientation from sign to sign.9The total collection of the CI tablets comprises ap-proximately half a million pieces spread all over theworld. Under present conditions, the world data-base of original CI tablets is endangered by natural orman-made destruction, so that the fine-structureinformation from many tablets is already hardly in-terpretable. Therefore, high-resolution archivalstorage6 is of interest owing to the possibility of laterretrieval of the complex 3-D information.On the other hand, although the cracks, scratches,
fractures, and other frequent unwanted artifacts canmake reading, as well as classifying, very difficult,these are not the only problems concerning the inter-pretation of the CI matter. The CI sign fonts canvary significantly because of differing writers or writ-ing schools, differing writing tools, or differing periodsof writing. But the CI sign samples can also varyeven if the objects were written by the same author,with the same tool, and on the same tablet. There-fore, the use of character-recognition methods forminimizing the sensitivity of an in-class group of ob-jects while maximizing the discrimination ability forother objects, usually called out-of-class objects, isindispensable. An additional problem is the largenumber of clay-tablet pieces. Thus, an efficientmethod, which also involves a statistical approach,for identification, characterization, and classificationof the CI signs is of interest.
10 October 1996 y Vol. 35, No. 29 y APPLIED OPTICS 5811
For the characterization of the CI signs a multi-functional extended optoelectronic correlator ~MEOC!device has been developed. Starting with the recog-nition experiments of a single wedge element typical ofall CI signs,6,7 we have carried out measurements onself-modeled 3-D scenes.8 In this paper we presentthe results obtained with the CI signs from an originalclay tablet. In Section 2 we describe our optical de-vice, the preprocessing procedures including a previ-ously introduced technique for the experimentalrealization of quasi-phase-only filters ~QPOF’s!,10 andthe correlation parameters. Sections 3 and 4 aremathematically oriented. Section 3 introduces a two-dimensional ~2-D! model for describing the CI signs,whereas Section 4 describes the mechanism of the co-herent optical-averaging method. An overall algo-rithm of the experimental work is outlined in Section5. The new CI characterization results are reportedin Section 6. Finally, the conclusions drawn are out-lined in Section 7.
2. Preliminaries
A. Experimental Device
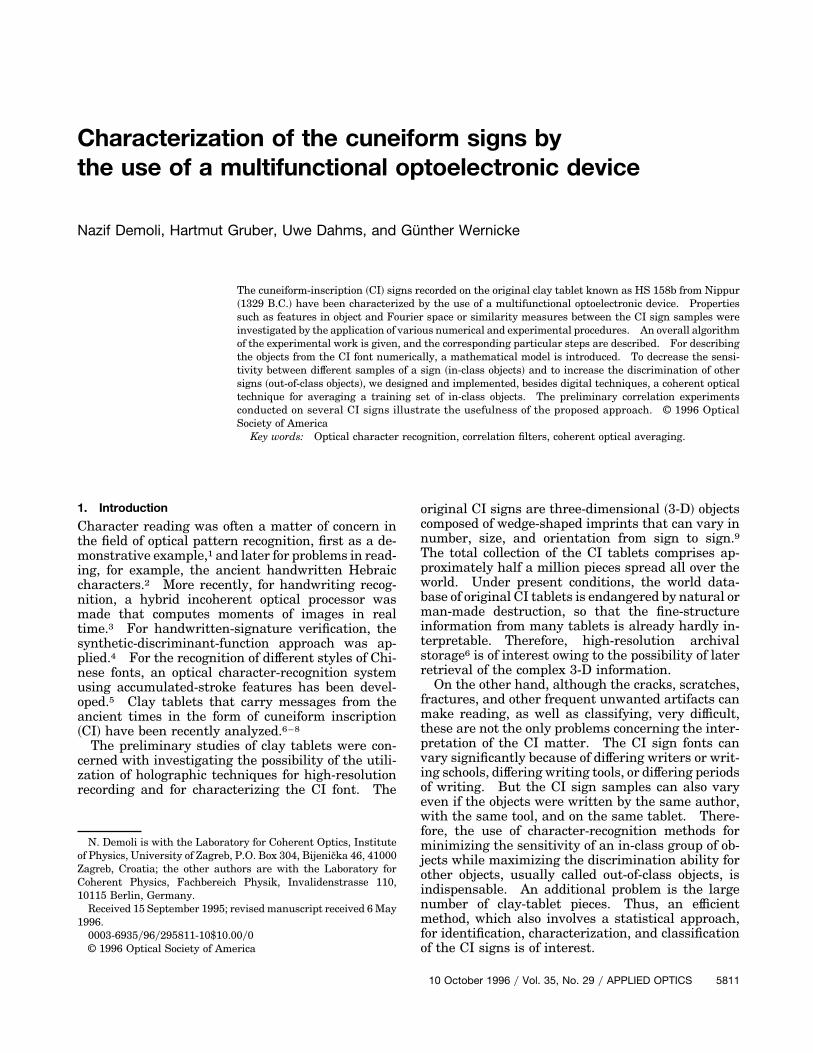
An experimental device called theMEOC systemwasadvanced, permitting the detection, Fourier analysis,feature enhancement, feature extraction, coherentoptical averaging, and correlation experiments to beperformed, including several preprocessing proce-dures. Correlation filters ~CF’s! are formed at planeP4 of the system, schematically shown in Fig. 1, whenthe Fourier transform ~FT! of a reference signalplaced at plane P1 is interfered with an off-axis colli-mated beam emerging from the P4 plane under theangle q. During correlation experiments the CF’swere positioned at P4, and the inputs at P1. PlanesP2 and P3 were used for optically prefiltering theinput signals. The optical system is supported by aCCD camera and a digital image-processing ~DIP!system. Placing a CCD at plane P4 yields an extended
Fig. 1. Schematic diagram of the multifunctional optoelectronicsystem. VBS, variable beam splitter; M, mirror; Col, collimator;FTL, Fourier-transform lens.
5812 APPLIED OPTICS y Vol. 35, No. 29 y 10 October 1996
optical Fourier analyzer system. An additional axis isused for carrying out the optical-averaging procedure.
B. Preprocessing Procedures
Optical preprocessing in the frequency space is per-formed at plane P2, whereas image prefiltering isperformed at plane P3. The 3f distances betweenplanes P1 and P2 and between planes P3 and P4 resultfrom the quadratic phase factor in the FT relation.Thus, the exact FT of an input signal is obtained atplane P4 of the system. If w1 denotes the input ap-erture, W2 the frequency–amplitude filter at P2, andw3 the image filter at P3, then the modified spectrumF9 of an input f is given by
F9 5 $@F ^ W1#W2% ^ W3, (1)
where the convolution operator ~R! denotes a 2-Dconvolution and capital letters denote the FT’s of thespatial functions. From Eq. ~1! it is seen that thespectrum modification can be described by the con-volution of the FT of the input signal with the FT ofthe input aperture, multiplied by the frequency-planespatial filter, and then followed by a further convo-lution with the image-plane spatial filter. The pre-processor is not only a spatial-frequency selector butalso an aperture modifier. Such prefiltering isneeded because, in many situations, the input infor-mation is disturbed by low-frequency contents ~orig-inating from the input aperture and unwantedartifacts like cracks, scratches, etc.! or by an additivestationary input noise.7To produce high-efficiency, high-sensitivity CF’s,
we have used the technique for synthesizingQPOF’s.10 Lowering the maxima of the power spec-trum of the reference signal was achieved with thehelp of an attenuation mask ~AM!. We can easily
Fig. 2. Block diagram of the algorithm summarizing the experi-mental work.

Fig. 3. Photographs of the original CI tablet, HS 158b: ~a! the front and ~b! the back sides.
realize an AM by exposing, developing, and reposi-tioning a photographic plate in the P2 plane of theexperimental device. Because of nonlinear record-ing, the low-power frequency components of inputsignals are practically not attenuated, whereas thepower spectrum maxima are lowered to the levelcontrolled by the AM recording parameters. The re-sulting negative transparency represents an idealhigh-resolution frequency-plane nonlinear attenua-tor. This permits a full-modulation adjustment ofthe CF over all high-power frequency components,thus making a significant increase in the CF effi-ciency possible.10
C. Correlation Parameters
We denote the coordinates of the input, filter, andcorrelation planes of a standard optical correlatorsystem by ~xi, yi!, ~u, v!, and ~x, y!, respectively. Up-percase letters are used to represent the FT of spatialfunctions, and FT$. . .% denotes the FT operator. Ifan input f ~xi, yi! is placed at plane P1 and the CF ofa reference signal h~xi, yi! at plane P4 of the systemshown in Fig. 1, then the amplitude of the correlationsignal c~x, y! at plane P5 is given by
c~x, y! 5 FT$F9~u, v!H*~u, v!%, (2)
where F9~u, v! denotes the prefiltered F~u, v!, accord-ing to Eq. ~1!, and the asterisk denotes the complex
conjugate. We measure the correlation-peak inten-sity value Icp as
Icp 5 **Ap
uc~x, y!u2dxdy, (3)
where Ap denotes the detector aperture and the totalintensity of the light entering the CF plane If is
If 5 ** uF9~u, v!u2dudv. (4)
From the measured quantities Icp and If it is easy tocalculate the similarity measure SM as
SM 5IcpIf, (5)
and the discrimination ability DA as
DA 5
1N (
i51
N
SMi
max@uc~x, y!u2#yIf. (6)
In Eq. ~6! the numerator represents the average SMof the in-class objects and the denominator is themaximum intensity in the correlation plane of anarbitrary object divided by the corresponding enter-ing intensity.
10 October 1996 y Vol. 35, No. 29 y APPLIED OPTICS 5813

3. Mathematical Model
Reducing the original 3-D information to 2-D datapermits the resulting 2-D CI patterns to be describedby the use of a simple mathematical model. Thetotal set of the CI signs, S, is given by
S 5 $sn; n 5 1, 2, . . . , N %, (7)
whereN is approximately equal to 600 for the MiddleBabylonian epoch.11 Although the considered setconsists of a large number of elements, the way inwhich the signs are formed permits a relatively sim-ple mathematical description. Each sign consists ofa finite number of wedges of different sizes, rotations,and locations, i.e.,
sn~x, y! 5 (i51
I
(j51
Ji
v~xij9, yij9! ^ d~x 2 x0ij, y 2 y0ij!, (8)
where I is the number of possible rotations of a singlewedge and Ji is the number of wedges with the ithrotation. The model is constrained by the require-ment that each wedge be able to be described as atransformation of one basic wedge v~x, y!. The scaleand rotation transformation can be expressed by a23 2 squarematrix, which is merely the transform ofcoordinates ~x, y! into other coordinates ~xij9, yij9!, i.e.,
Fxij9yij9G 5 F sxij cos ai
2sxij sin ai
syij sin ai
syij cos aiGFxyG , (9)
where s and a represent the scale and rotation pa-rameters, respectively.
4. Coherent Optical Averaging
In this section an experimental method for realizingthe average CF’s by means of coherent optical pro-cessing is described. First, a coherent imaging sys-tem is aligned; the system consists of the input planeP19, several small FT lenses placed in parallel, the FTplane P29, one large FT lens, and the output plane P39~see Fig. 1!. Suppose that the input amplitude dis-tribution of such a system consists of N samples ofin-class objects si~x, y!, with their positions arbi-trarily distributed. By Fourier-transforming eachsample independently and, in parallel, using smallFT lenses, and by then using one large lens, we canrecord a joint-image hologram ~JIH! at the outputplane of the setup. With the assumption of linearrecording, the amplitude transmittance of the devel-oped photomaterial,
t~x, y! } (n51
N
usn~x, y!u2 1 (n51
N
(nÞn,m51
N
sn~x, y!s*m~x, y!
3 exp$2i2p@~un 2 um!x 1 ~vn 2 vm!y#%, (10)
contains the desired first term on the right-hand sideof proportion ~10!, as well as the intermodulationterms.To record the average CF, the JIH is placed at the
input plane P1 of the correlator setup from Fig. 1.Taking the FT of the incident, coherent, collimatedlight modulated by the mask, the autocorrelation on-
5814 APPLIED OPTICS y Vol. 35, No. 29 y 10 October 1996
axis terms at plane P2 are spatially separated fromthe cross-correlation off-axis terms. Thus, in theprefiltering stage ~planes P2 and P3! all unwantedoff-axis terms are filtered out, and the remainder isthe sum of the sample intensities. For all inputsthat can be described with real functions the squar-ing operation is of no importance. The resulting am-plitude distribution is the average spectrum of thetraining objects, which is then Fourier transformedand holographically recorded at plane P4 of theMEOC system. The filter function is obtained in theform
H*~u, v! }1N (
n51
N
anS*n~u, v!, (11)
where an are the coefficients of a linear combinationof N training objects.
5. Multifunctional System Algorithm
To understand better the procedures undertakenduring the experimental work, the algorithm is sche-
Fig. 4. Preprocessed input scenes: ~a! scene 1 and ~b! scene 2.

Fig. 5. Characterization of the DI sign: ~a! the mathematical model, ~b! the DI numerical power spectrum, ~c! the preprocessed originalDIav sign, and ~d! the optical power spectrum of sign DIav.
matically shown in Fig. 2. The corresponding stepsare given in following.
~A! Input Transparencies1. Selecting the areas of interest on the original
CI tablet by the use of the CCD camera and the DIPsystem. This steps also includes the dimension re-duction ~3-D 3 2-D!.
2. Selecting the in-class and out-of-class ob-jects; digital preprocessing.
3. Isolating the training set of objects.4. Recording the selected inputs on photo-
graphic film.
~B! Training-Set Features1. Feature enhancement and feature extraction
by the use of the extended optical Fourier-analysisand DIP systems.
2. Analysis of the training-set features in theobject and Fourier domains.
3. Definition of various preprocessing parame-ters ~e.g., the dimensions of cross stops in the FTplane and apertures in the image plane, the exposureparameters for QPOF masks, etc.!.
~C! Preprocessing Procedures1. Digital preprocessing ~e.g., contrast en-
hancement, gray-scale level equilization, normaliza-tion, addition of images, etc.!.
2. In-line optical spatial prefiltering in both theimage and FT domains.
3. Implementation of coherent optical averag-ing of the selected set of in-class objects.
4. Synthesis of the power spectrum AM’s forQPOF’s.
~D! Correlation Filters: OpticalImplementation of Various Types of CF’s
1. CF’s of single wedges.2. CF’s of single signs.3. Multiplexed CF’s of in-class single-sign mod-
els.4. CF’s of optically and digitally averaged in-
class signs taken from the modeled CI tablet.5. CF’s of optically and digitally averaged in-
class signs taken from the original CI tablet.6. QPOF’s ~CF’s recorded with the use of the
AM! of optically and digitally averaged in-class signstaken from the original CI tablet.
10 October 1996 y Vol. 35, No. 29 y APPLIED OPTICS 5815

~E! Cuneiform-Inscription CharacterizationResults
1. Characterization on the basis of both the ob-ject and the Fourier features.
2. Characterization on the basis of the correla-tion results.
6. Results
Figures 3~a! and 3~b! show photographs of the origi-nal tablet, HS 158b ~Hilprecht–Sammlung Vordera-siatischer Altertumer Jena!, from Nippur, 1329 B.C.It can be seen that the front side of the tablet is ratherdamaged, containing cracks and other defects thatcause noise. Seven selected areas of interest werevertically illuminated, captured by a CCD camera,and stored in the DIP system memory. Two sets ofin-class objects were formed, one consisting of I signsamples and the other of DI sign samples. One set ofin-class objects $I1, I2, I3, I4% and a selected set ofout-of-class objects $DI, A-MI1, A-MI2% in thecontrast-enhanced scenes are indicated in Figs. 4~a!and 4~b!. Three I signs, $I1, I2, I3%, chosen to repre-sent the training set, were then isolated and normal-ized to give the same total power. All selected andpreprocessed inputs were then recorded on photo-graphic film. Furthermore, the signs from the train-ing set were used for synthesizing the average Ipattern.To implement experimentally the optical-
averaging technique described in Section 4, we firstorganized a holder for the three I signs from thetraining set. The signs were placed in the inputplane P19 of the MEOC system shown in Fig. 1.Three parallel optical axes were formed with threesmall FT lenses, and consequently the spatially sep-arated FT’s appeared at plane P29. Because a largeFT lens was used, the interference pattern of thethree I signs was obtained at plane P39. The correctpositioning of the small FT lenses was managed withthe help of a special self-constructed carrier and bythe observation of the overlapping pattern with theCCD camera and the DIP system. A JIH was thenrecorded by the use of standard photomaterials andphotoprocessing. The next step was to introduce theJIH into plane P1 of the MEOC system. By Fouriertransforming the light passing through the JIH, weobtained three reconstructions for each I sign, ofwhich one reconstruction for each sign was located onthe optical axis of the system. Therefore, six recon-structed off-axis patterns were filtered out easily inthe prefiltering stage of the MEOC system, while theon-axis overlapping patterns gave the average spec-trum of the set $I1, I2, I3% at plane P4 of the system.Keeping the JIH as an input and simply recording
only the part of the power spectrum at plane P2 thatwas centered on the optical axis, we obtained the AM.Several AM’s with different exposure times were re-corded. The QPOF’s were recorded holographicallyin plane P4 of theMEOC system, with the JIH kept inthe input plane and the AM selected and reposi-tioned. Positioning the AM, as well as the CF, is a
5816 APPLIED OPTICS y Vol. 35, No. 29 y 10 October 1996
standard procedure with an accuracy requirementthat is used for repositioning holograms; additionally,it was controlled by the use of the CCD camera andthe DIP system. The correlation experiments wereperformed with and without the AM.
A. Features in the Object and Fourier Domains
The 2-D appearance of the CI signs depends on theillumination conditions applied to the CI tablet.With perpendicular illumination, the resulting 2-Dobjects look like those shown in Figs. 4~a! and 4~b!.Such objects can be numerically described by the im-
Fig. 6. Scans of ~a! the FT structure of the DI sign over 180°, and~b! and ~c! of selected finer intervals.
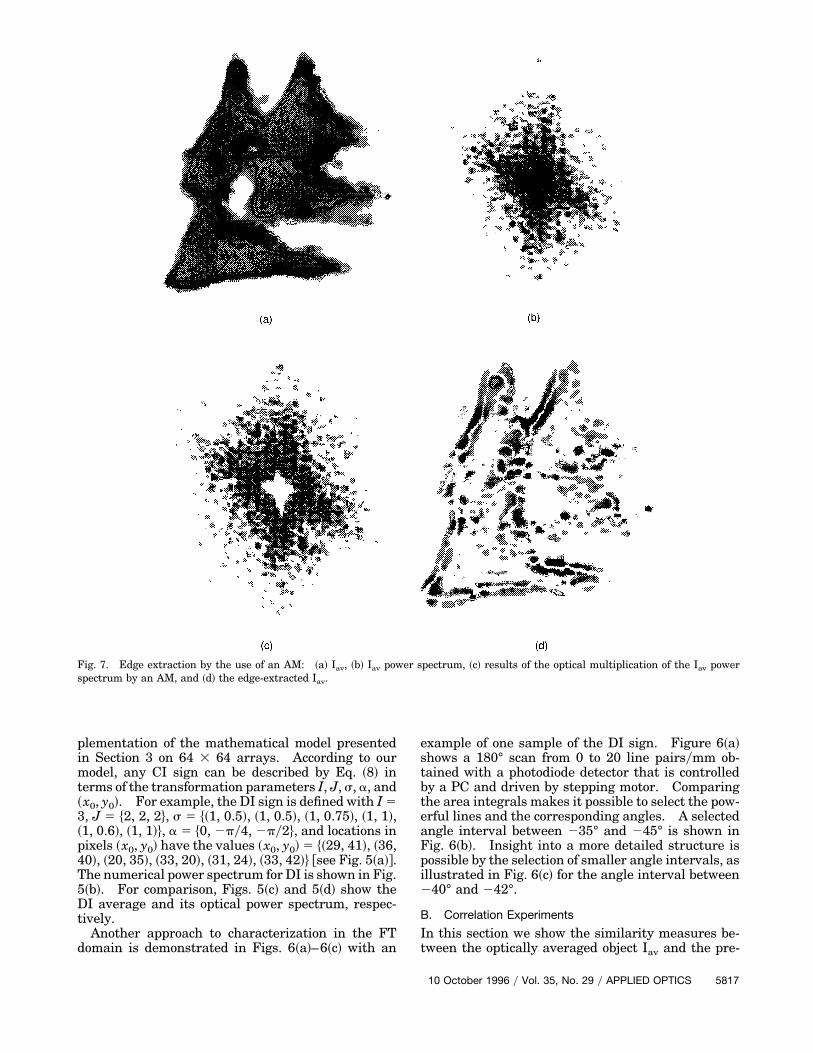
Fig. 7. Edge extraction by the use of an AM: ~a! Iav, ~b! Iav power spectrum, ~c! results of the optical multiplication of the Iav powerspectrum by an AM, and ~d! the edge-extracted Iav.
plementation of the mathematical model presentedin Section 3 on 64 3 64 arrays. According to ourmodel, any CI sign can be described by Eq. ~8! interms of the transformation parameters I, J, s, a, and~x0, y0!. For example, the DI sign is defined with I 53, J 5 $2, 2, 2%, s 5 $~1, 0.5!, ~1, 0.5!, ~1, 0.75!, ~1, 1!,~1, 0.6!, ~1, 1!%, a 5 $0, 2py4, 2py2%, and locations inpixels ~x0, y0! have the values ~x0, y0! 5 $~29, 41!, ~36,40!, ~20, 35!, ~33, 20!, ~31, 24!, ~33, 42!% @see Fig. 5~a!#.The numerical power spectrum for DI is shown in Fig.5~b!. For comparison, Figs. 5~c! and 5~d! show theDI average and its optical power spectrum, respec-tively.Another approach to characterization in the FT
domain is demonstrated in Figs. 6~a!–6~c! with an
example of one sample of the DI sign. Figure 6~a!shows a 180° scan from 0 to 20 line pairsymm ob-tained with a photodiode detector that is controlledby a PC and driven by stepping motor. Comparingthe area integrals makes it possible to select the pow-erful lines and the corresponding angles. A selectedangle interval between 235° and 245° is shown inFig. 6~b!. Insight into a more detailed structure ispossible by the selection of smaller angle intervals, asillustrated in Fig. 6~c! for the angle interval between240° and 242°.
B. Correlation Experiments
In this section we show the similarity measures be-tween the optically averaged object Iav and the pre-
10 October 1996 y Vol. 35, No. 29 y APPLIED OPTICS 5817
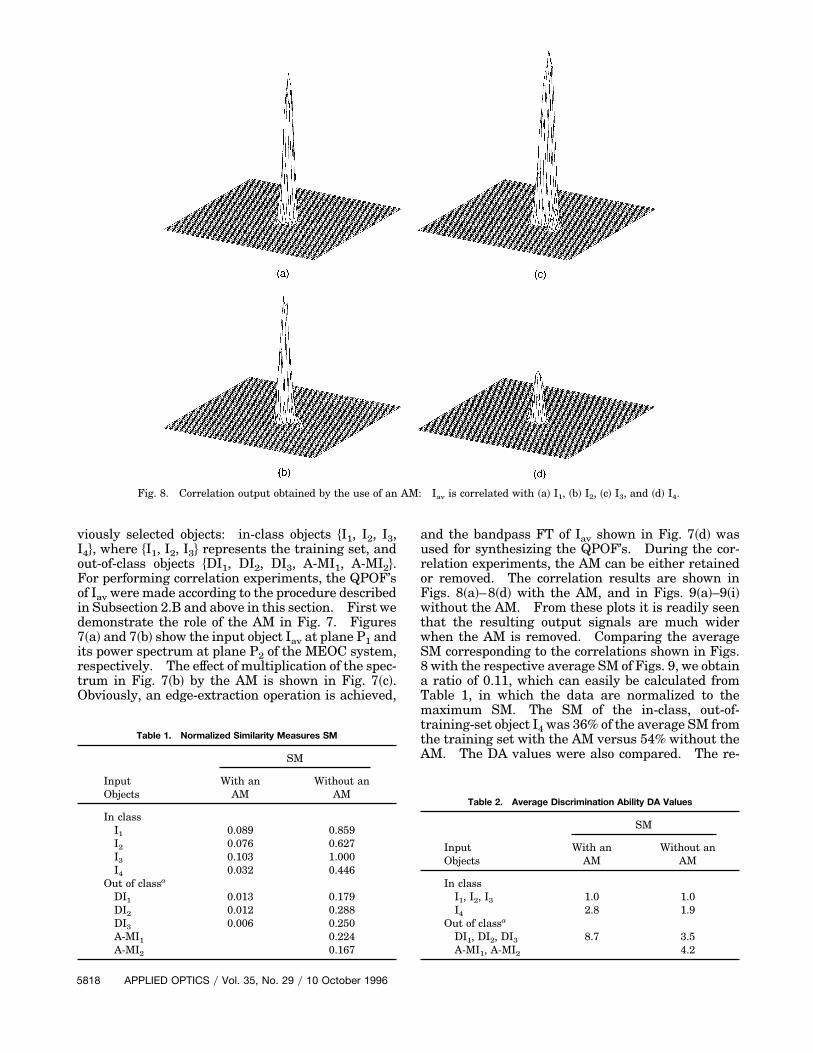
Fig. 8. Correlation output obtained by the use of an AM: Iav is correlated with ~a! I1, ~b! I2, ~c! I3, and ~d! I4.
viously selected objects: in-class objects $I1, I2, I3,I4%, where $I1, I2, I3% represents the training set, andout-of-class objects $DI1, DI2, DI3, A-MI1, A-MI2%.For performing correlation experiments, the QPOF’sof Iav were made according to the procedure describedin Subsection 2.B and above in this section. First wedemonstrate the role of the AM in Fig. 7. Figures7~a! and 7~b! show the input object Iav at plane P1 andits power spectrum at plane P2 of the MEOC system,respectively. The effect of multiplication of the spec-trum in Fig. 7~b! by the AM is shown in Fig. 7~c!.Obviously, an edge-extraction operation is achieved,
Table 1. Normalized Similarity Measures SM
InputObjects
SM
With anAM
Without anAM
In classI1 0.089 0.859I2 0.076 0.627I3 0.103 1.000I4 0.032 0.446
Out of classa
DI1 0.013 0.179DI2 0.012 0.288DI3 0.006 0.250A-MI1 0.224A-MI2 0.167
5818 APPLIED OPTICS y Vol. 35, No. 29 y 10 October 1996
and the bandpass FT of Iav shown in Fig. 7~d! wasused for synthesizing the QPOF’s. During the cor-relation experiments, the AM can be either retainedor removed. The correlation results are shown inFigs. 8~a!–8~d! with the AM, and in Figs. 9~a!–9~i!without the AM. From these plots it is readily seenthat the resulting output signals are much widerwhen the AM is removed. Comparing the averageSM corresponding to the correlations shown in Figs.8 with the respective average SM of Figs. 9, we obtaina ratio of 0.11, which can easily be calculated fromTable 1, in which the data are normalized to themaximum SM. The SM of the in-class, out-of-training-set object I4 was 36% of the average SM fromthe training set with the AM versus 54% without theAM. The DA values were also compared. The re-
Table 2. Average Discrimination Ability DA Values
InputObjects
SM
With anAM
Without anAM
In classI1, I2, I3 1.0 1.0I4 2.8 1.9
Out of classa
DI1, DI2, DI3 8.7 3.5A-MI1, A-MI2 4.2

Fig. 9. Correlation output obtained without the use of an AM: Iav is correlated with ~a! I1, ~b! I2, ~c! I3, ~d! I4, ~e! DI1, ~f ! DI2, ~g! DI3,~h! A-MI1, and ~i! A-MI2.
10 October 1996 y Vol. 35, No. 29 y APPLIED OPTICS 5819

sults presented in Table 2 show a much higher sen-sitivity for the SM when the AM is applied duringcorrelation experiments. For example, the DA forthe out-of-class $DI1, DI2, DI3% objects was equal to 8.7with the AM versus 3.5 without the AM.
7. Summary and Conclusions
To characterize the CI signs a multifunctional opto-electronic device was advanced that permits detec-tion, Fourier analysis, feature enhancement, featureextraction, coherent optical averaging, and correla-tion experiments to be performed, including variouspreprocessing procedures. A block diagram of theoverall algorithm and the corresponding experimen-tal steps are also provided. Preliminary character-ization results are given for several CI signs recordedon the original clay tablet from Nippur, 1329 B.C.To describe the CI signs numerically, a simple 2-D
mathematical model is introduced that is based ondescribing a CI sign as a linear combination of bothscale and rotation transformations of an elementarywedge. Thus, it was possible to emulate features ofapproximately 600 CI signs belonging to the MiddleBabylonian epoch. Alternatively, the features in theFT space of the preprocessed CI signs were measuredalong radial spatial-frequency components for se-lected gradual angle intervals. To decrease the sen-sitivity between different samples of a sign, wedesigned and implemented a coherent optical tech-nique for averaging in-class objects. For increasingthe diffraction efficiency of the CF’s, the QPOF’s havebeen synthesized and the corresponding correlationoutputs quantified.Used as described in this paper, the technique of
coherent optical averaging is time consuming be-cause the small FT lenses must be adjusted by handor photographic plates must be used for recording theQPOF’s and AM’s. Our future research will beaimed at improving such adjustment procedures andinclude optically or electronically addressable spatiallight modulators instead of photographic emulsions.Although applied to a statistically small sample, the
developed experimental device and techniques havebeen demonstrated to be a possible solution to the CIcharacterization problem. A detailed investigationinvolving many more samples is under preparation.
5820 APPLIED OPTICS y Vol. 35, No. 29 y 10 October 1996
This work was performed at the Institute of Phys-ics, Humboldt University of Berlin, Germany. Theauthors are grateful to the Bundesministerium furBildung, Wissenschaft, Forschung und Technologiefor financial support under contract 03-WE9HUB.N. Demoli is grateful to the German Academic Ex-change Service ~DAAD! for financial support. Theauthors are also thankful to S. Boseck and L. Be-gemann ~University of Bremen!, G. von Bally, A.Roshop, and F. Dreesen ~University of Munster!,and the reviewers of the manuscript for their con-tributions to this paper.
References1. A. VanderLugt, “Signal detection by spatial complex filtering,”
IEEE Trans. Inf. Theory IT-10, 139–145 ~1964!.2. J. M. Fournier, “Coherent and incoherent averaging of ancient
handwritten hebraic characters,” in Applications of Hologra-phy and Optical Data Processing, E. Marom, ●●●, eds., ~Per-gamon, London, 1977!, pp. 533–540.
3. J. Duvernoy and Y.-L. Sheng, “Effective optical processor forcomputing image moments at TV rate: use in handwritingrecognition,” Appl. Opt. 26, 2320–2327 ~1987!.
4. T. S. Wilkinson, D. A. Pender, and J. W. Goodman, “Use ofsynthetic discriminant functions for handwritten-signatureverification,” Appl. Opt. 30, 3345–3353 ~1991!.
5. B.-S. Jeng, “Optical Chinese character recognition using accu-mulated stroke features,” Opt. Eng. 28, 793–799 ~1989!.
6. G. von Bally, D. Vukicevic, N. Demoli, H. Bjelkhagen, G. Wer-nicke, U. Dahms, H. Gruber, andW. Sommerfeld, “Holographyand holographic pattern recognition for preservation and eval-uation of cultural-historic sources,” Naturwissenschaften 81,563–565 ~1994!.
7. N. Demoli, H. Gruber, U. Dahms, and G. Wernicke, “Holo-graphic technique application in analysing cuneiform inscrip-tions,” J. Mod. Opt. 42, 191–195 ~1995!.
8. N. Demoli, U. Dahms, H. Gruber, and G. Wernicke, “Use of amultifunctional extended optical correlator for cuneiform in-scription analysis,” in Photonics for Processors, Neural Net-works, and Memories II, J. L. Horner, B. Javidi, and S. T.Kowel, eds., Proc. SPIE 2297, 278–287 ~1994!.
9. C. B. F. Walker, Cuneiform ~Trustees of the British Museum,London, 1987!.
10. N. Demoli, “Quasiphase-only matched filtering,” Appl. Opt. 26,2058–2061 ~1987!.
11. R. Labat, Manual D’Epigraphie Akkadienne ~Librairie Orien-taliste Paul Guethner, S.A., Paris, 1977!.