characterization of the northeast and mid-atlantic bottom ... · northeast fisheries science center...
TRANSCRIPT
Northeast Fisheries Science Center Reference Document 07-15
U.S. DEPARTMENT OF COMMERCENational Oceanic and Atmospheric Administration
National Marine Fisheries ServiceNortheast Fisheries Science Center
Woods Hole, Massachusetts
September 2007
Characterization of the Northeast and Mid-Atlantic Bottom and Mid-water Trawl Fisheries
Based on Vessel Trip Report (VTR) Data
by Christopher D. Orphanides and Gisele M. Magnusson
National Marine Fisheries Serv, Woods Hole Lab, 166 Water St, Woods Hole MA 02543-1026

Northeast Fisheries Science Center Reference Documents
This series is a secondary scientific series designed to assure the long-term documentation and to enable the timely transmission of research results by Center and/or non-Center researchers, where such results bear upon the research mission of the Center (see the outside back cover for the mission statement). These documents receive internal scientific review, and most receive copy editing. The National Marine Fisheries Service does not endorse any proprietary material, process, or product mentioned in these documents. All documents issued in this series since April 2001, and several documents issued prior to that date, have been copublished in both paper and electronic versions. To access the electronic version of a document in this series, go to http://www.nefsc.noaa.gov/nefsc/publications/. The electronic version is available in PDF format to permit printing of a paper copy directly from the Internet. If you do not have Internet access, or if a desired document is one of the pre-April 2001 documents available only in the paper version, you can obtain a paper copy by contacting the senior Center author of the desired document. Refer to the title page of the document for the senior Center author’s name and mailing address. If there is no Center author, or if there is corporate (i.e., non-individualized) authorship, then contact the Center’s Woods Hole Labora-tory Library (166 Water St., Woods Hole, MA 02543-1026).
This document’s publication history is as follows: manuscript submitted for review September 1, 2006; manuscript accepted through technical review August 16, 2007; manuscript accepted through policy review August 17, 2007; and final copy submitted for publication August 17, 2007. This document may be cited as:
Orphanides CD, Magnusson GM. 2007. Characterization of the northeast and mid-Atlantic bottom and mid-water trawl fisheries based on vessel trip report (VTR) data. U.S. Dep. Commer., Northeast Fish. Sci. Cent. Ref. Doc. 07-15; 127 p. Available from: National Marine Fisheries Service, 166 Water Street, Woods Hole, MA 02543-1026.
iii
Table of Contents List of Acronyms ........................................................................................................................... ix UAbstract........................................................................................................................................... x UIntroduction..................................................................................................................................... 1 UBackground..................................................................................................................................... 2
UI. Variables important to assessing marine mammal bycatch in trawl fisheries .................... 2 UII. Relevant fisheries management actions, 1996–2004.......................................................... 3
Ui. Northeast Multispecies (groundfish) FMP....................................................................... 3 Uii. Atlantic Herring FMP ...................................................................................................... 4 Uiii. Monkfish FMP................................................................................................................. 4 Uiv. Atlantic Mackerel, Squid and Butterfish FMP ................................................................ 4 Uv. Summer Flounder, Scup and Black Sea Bass FMP ......................................................... 5
UData................................................................................................................................................. 5 UResults............................................................................................................................................. 8
UI. Bottom Trawl Fishery (OTF and OTO).............................................................................. 8 Ui. Effort characteristics ........................................................................................................ 8
Ua. Days fished.................................................................................................................... 8 Ub. Tow time and number of hauls ................................................................................... 10 Uc. Days absent ................................................................................................................. 10
Uii. Harvest characteristics ................................................................................................... 11 Ua. Species ........................................................................................................................ 11 Ub. Fishing regions............................................................................................................ 11 Uc. Port of landing............................................................................................................. 12
Uiii. Vessel characteristics ..................................................................................................... 12 Ua. Fleet............................................................................................................................. 12 Ub. Ton class ..................................................................................................................... 12
Uiv. Gear characteristics........................................................................................................ 13 Ua. Mesh size (codend) ..................................................................................................... 13 Ub. Gear size (footrope length) ......................................................................................... 14
Uv. Environmental and Habitat Characteristics ................................................................... 15 Ua. Sea Surface Temperature (SST).................................................................................. 15 Ub. Bottom Depth.............................................................................................................. 15 Uc. Bottom Slope .............................................................................................................. 16
UII. Mid-water Trawl Fishery (OTM and PTM)...................................................................... 16 Ui. Effort characteristics ...................................................................................................... 16
Ua. Days fished.................................................................................................................. 16 Ub. Tow time and number of hauls ................................................................................... 17 Uc. Days absent ................................................................................................................. 17
Uii. Harvest characteristics ................................................................................................... 18 a. Species .........................................................................................................................18 b. Fishing regions.............................................................................................................18 c. Port of landings ............................................................................................................18
Uiii. Vessel characteristics ..................................................................................................... 18 a. Fleet..............................................................................................................................19 b. Ton class ......................................................................................................................19

iv
Uiv. Gear characteristics........................................................................................................ 19 Ua. Mesh size (codend) ..................................................................................................... 20 Ub. Gear size (footrope length) ......................................................................................... 20
4v. Environmental and Habitat Characteristics ................................................................... 20 Ua. Sea Surface Temperature (SST).................................................................................. 20 Ub. Bottom depth and slope .............................................................................................. 21
UDiscussion..................................................................................................................................... 21 UAcknowledgements....................................................................................................................... 23 UReferences..................................................................................................................................... 24
AppendicesUAppendix A. List of Fishery Management Plans for the Northeast and Mid-Atlantic by
management body, and species covered ............................................................. 113 UAppendix B. Average monthly landings by fishing region and species for the U.S. Northeast
and Mid-Atlantic bottom trawl fishery, over period 1996–2004........................ 116 UAppendix C. The types and combinations of trawl gear used by bottom and mid-water trawl
vessels in 1996 and 2004 .................................................................................... 121 UAppendix D. Average monthly landings by fishing region and species for the U.S. Northeast
and Mid-Atlantic mid-water trawl fishery, over period 1996–2004................... 123
TablesUTable 1. Percent of records replaced by median values by type of data ................................... 25 UTable 2. Percentage, by species, of landed weight that was landed on main species trips for
that species for U.S. Northeast and Mid-Atlantic bottom and mid-water trawl fisheries, 1996–2004................................................................................................... 25
UTable 3. Total vessels and trips by year for bottom otter trawl fisheries in the U.S. Northeast and Mid-Atlantic, 1996–2004..................................................................................... 26
UTable 4. Days fished by fishing region for the U.S. Northeast and Mid-Atlantic bottom trawl fishery, 1996–2004 ..................................................................................................... 26
UTable 5. Mean days fished per trip by fishing region for U.S. Northeast and Mid-Atlantic bottom trawl fishery, 1996–2004................................................................................ 27
UTable 6. Total days fished by main species for U.S. Northeast and Mid-Atlantic bottom trawl fishery, 1996–2004 ..................................................................................................... 27
UTable 7. Percent of annual days fished by main species for U.S. Northeast and Mid-Atlantic bottom trawl fishery, 1996–2004................................................................................ 28
UTable 8. Total number of hauls by main species for U.S. Northeast and Mid-Atlantic bottom trawl fishery, 1996–2004 ............................................................................................ 29
UTable 9. Percent of total hauls by main species for U.S. Northeast and Mid-Atlantic bottom trawl fishery, 1996–2004 ............................................................................................ 30
UTable 10. Days absent by fishing region for U.S. Northeast and Mid-Atlantic bottom trawl fishery, 1996–2004 ..................................................................................................... 31
UTable 11. Mean and coefficient of variation of days absent per trip by month for U.S. Northeast and Mid-Atlantic bottom trawl fishery, over 1996–2004 ........................................... 31
UTable 12. Percent of trips assigned to main species categories for U.S. Northeast and Mid-Atlantic bottom trawl fishery, 1996–2004 .................................................................. 32
v
UTable 13. Total live weight kept by species for the U.S. Northeast and Mid-Atlantic bottom trawl fishery, 1996–2004 ............................................................................................ 33
UTable 14. Average annual nominal price for by species for U.S. Northeast and Mid-Atlantic bottom trawl fishery, 1996–2004................................................................................ 34
UTable 15. Average annual inflation adjusted price for principle species for U.S. Northeast and Mid-Atlantic bottom trawl fishery, 1996–2004 .......................................................... 35
UTable 16. Calculated nominal value by species for U.S. Northeast and Mid-Atlantic bottom trawl fishery, 1996–2004 ............................................................................................ 36
UTable 17. Inflation adjusted calculated value by species for U.S. Northeast and Mid-Atlantic bottom trawl fishery, 1996–2004................................................................................ 37
UTable 18. Total landings and calculated value by fishing region for U.S. Northeast and Mid-Atlantic bottom trawl fishery, 1996–2004 .................................................................. 38
UTable 19. Average annual landings by species by fishing region for U.S. Northeast and Mid-Atlantic bottom trawl fishery, 1996–2004 .................................................................. 39
UTable 20. Total landings and calculated value by state of landing for U.S. Northeast and Mid-Atlantic bottom trawl fishery, 1996–2004 .................................................................. 40
UTable 21. Average values per vessel including number of trips, days absent, days fished, landings per unit of effort, and value, for U.S. Northeast and Mid-Atlantic bottom trawl fishery, 1996–2004 ............................................................................................ 41
UTable 22. Number of vessels within each ton class for U.S. Northeast and Mid-Atlantic bottom trawl fishery, 1996–2004 ............................................................................................ 41
UTable 23. Mean vessel characteristics by ton class for U.S. Northeast and Mid-Atlantic bottom trawl vessels, 1996–2004............................................................................................ 42
UTable 24. Total effort measures by ton class for U.S. Northeast and Mid-Atlantic bottom trawl fishery, 1996–2004 ..................................................................................................... 43
UTable 25. Total landings and calculated value by ton class for U.S. Northeast and Mid-Atlantic bottom trawl fishery, 1996–2004................................................................................ 44
UTable 26. Mean annual landings by ton class for U.S. Northeast and Mid-Atlantic bottom trawl fishery, 1996–2004 ..................................................................................................... 45
UTable 27. Mean and CV for codend mesh size by fishing region for U.S. Northeast and Mid-Atlantic bottom trawl fishery, 1996–2004 .................................................................. 45
UTable 28. Average codend mesh size by ton class of vessel for U.S. Northeast and Mid-Atlantic bottom trawl fishery, 1996–2004................................................................................ 46
UTable 29. Average footrope length by fishing region for U.S. Northeast and Mid-Atlantic bottom trawl fishery, 1996–2004................................................................................ 46
UTable 30. Mean footrope length by ton class for U.S. Northeast and Mid-Atlantic bottom trawl fishery, 1996–2004 ..................................................................................................... 46
UTable 31. Total and annual distribution of days fished by SST groups for U.S. Northeast and Mid-Atlantic bottom trawl fishery, 1996–2004 .......................................................... 47
UTable 32. Total and annual distribution of hauls by SST groups for U.S. Northeast and Mid-Atlantic bottom trawl fishery, 1996–2004 .................................................................. 47
UTable 33. Total and annual distribution of days fished by bottom depth groups for U.S. Northeast and Mid-Atlantic bottom trawl fishery, 1996–2004................................... 48
UTable 34. Total and annual distribution of hauls by bottom depth groups for U.S. Northeast and Mid-Atlantic bottom trawl fishery, 1996–2004 .......................................................... 48

vi
UTable 35. Total and distribution of days fished by bottom slope groups for U.S. Northeast and Mid-Atlantic bottom trawl fishery, 1996–2004. ......................................................... 49
UTable 36. Total and annual distribution of hauls by bottom slope groups for U.S. Northeast and Mid-Atlantic bottom trawl fishery, 1996–2004. ......................................................... 49
UTable 37. Total vessels and trips by year for mid-water trawl fisheries in the U.S. Northeast and Mid-Atlantic, 1996–2004............................................................................................ 49
UTable 38. Days fished by fishing region for the U.S. Northeast and Mid-Atlantic mid-water trawl fishery, 1996–2004. ........................................................................................... 50
UTable 39. Mean days fished per trip by fishing region for U.S. Northeast and Mid-Atlantic mid-water trawl fishery, 1996–2004. ................................................................................. 50
UTable 40. Total days fished by main species for U.S. Northeast and Mid-Atlantic mid-water trawl fishery, 1996–2004. ........................................................................................... 51
UTable 41. Percent of annual days fished by main species for U.S. Northeast and Mid-Atlantic mid-water trawl fishery, 1996–2004........................................................................... 51
UTable 42. Total number of hauls by main species for U.S. Northeast and Mid-Atlantic mid-water trawl fishery, 1996–2004 .................................................................................. 51
UTable 43. Percent of total hauls by main species for U.S. Northeast and Mid-Atlantic mid-water trawl fishery, 1996–2004 ............................................................................................ 52
UTable 44. Days absent by fishing region for U.S. Northeast and Mid-Atlantic mid-water trawl fishery, 1996–2004 ..................................................................................................... 52
UTable 45. Mean and coefficient of variation of days absent per trip by month for U.S. Northeast and Mid-Atlantic mid-water trawl fishery, over 1996–2004...................................... 52
UTable 46. Percent of trips assigned to main species categories for U.S. Northeast and Mid-Atlantic mid-water trawl fishery, 1996–2004............................................................. 53
UTable 47. Total live weight kept by species for the U.S. Northeast and Mid-Atlantic mid-water trawl fishery, 1996–2004 ............................................................................................ 53
UTable 48. Average annual nominal price for by species for U.S. Northeast and Mid-Atlantic mid-water trawl fishery, 1996–2004........................................................................... 53
UTable 49. Average annual inflation adjusted price for principle species for U.S. Northeast and Mid-Atlantic mid-water trawl fishery, 1996–2004..................................................... 54
UTable 50. Calculated nominal value by species for U.S. Northeast and Mid-Atlantic mid-water trawl fishery, 1996–2004 ............................................................................................ 54
UTable 51. Inflation adjusted calculated value by species for U.S. Northeast and Mid-Atlantic mid-water trawl fishery, 1996–2004........................................................................... 54
UTable 52. Total landings and calculated value by fishing region for U.S. Northeast and Mid-Atlantic mid-water trawl fishery, 1996–2004............................................................. 55
UTable 53. Average annual landings by species by fishing region for U.S. Northeast and Mid-Atlantic mid-water trawl fishery, 1996–2004............................................................. 56
UTable 54. Total landings and calculated value by state of landing for U.S. Northeast and Mid-Atlantic mid-water trawl fishery, 1996–2004............................................................. 57
UTable 55. Average values per vessel including number of trips, days absent, days fished, landings per unit of effort, and value, for U.S. Northeast and Mid-Atlantic mid-water trawl fishery, 1996–2004 ............................................................................................ 58
UTable 56. Number of vessels within each ton class for U.S. Northeast and Mid-Atlantic mid-water trawl fishery, 1996–2004 .................................................................................. 59
vii
UTable 57. Mean vessel characteristics by ton class for U.S. Northeast and Mid-Atlantic mid-water trawl vessels, 1996–2004. ................................................................................. 60
UTable 58. Total effort measures by ton class for U.S. Northeast and Mid-Atlantic mid-water trawl fishery, 1996–2004 ..................................................................................................... 61
UTable 59. Total landings and calculated value by ton class for U.S. Northeast and Mid-Atlantic mid-water trawl fishery, 1996–2004........................................................................... 62
UTable 60. Mean annual landings by ton class for U.S. Northeast and Mid-Atlantic mid-water trawl fishery, 1996–2004. ........................................................................................... 63
UTable 61. Mean and CV for codend mesh size by fishing region for U.S. Northeast and Mid-Atlantic mid-water trawl fishery, 1996–2004............................................................. 63
UTable 62. Average codend mesh size by ton class of vessel for U.S. Northeast and Mid-Atlantic mid-water trawl fishery, 1996–2004........................................................................... 63
UTable 63. Average footrope length by fishing region for U.S. Northeast and Mid-Atlantic mid-water trawl fishery, 1996–2004 .................................................................................. 64
UTable 64. Mean footrope length by ton class for U.S. Northeast and Mid-Atlantic mid-water trawl fishery, 1996–2004 ............................................................................................ 64
UTable 65. Total and annual distribution of days fished by SST groups for U.S. Northeast and Mid-Atlantic mid-water trawl fishery, 1996–2004..................................................... 65
UTable 66. Total and annual distribution of hauls by SST groups for U.S. Northeast and Mid-Atlantic mid-water trawl fishery, 1996–2004............................................................. 65
UTable 67. Total and annual distribution of days fished by bottom depth groups for U.S. Northeast and Mid-Atlantic mid-water trawl fishery, 1996–2004 .............................................. 66
UTable 68. Total and annual distribution of hauls by bottom depth groups for U.S. Northeast and Mid-Atlantic mid-water trawl fishery, 1996–2004..................................................... 66
UTable 69. Total and distribution of days fished by bottom slope groups for U.S. Northeast and Mid-Atlantic mid-water trawl fishery, 1996–2004..................................................... 67
UTable 70. Total and annual distribution of hauls by bottom slope groups for U.S. Northeast and Mid-Atlantic mid-water trawl fishery, 1996–2004..................................................... 67
Figures
UFigure 1. Regulated Mesh Areas as defined under the Northeast Multispecies FMP including GOM, GB, Southern New England, and Mid-Atlantic RMAs................................... 68
UFigure 2. Seasonal closure areas defined under the Northeast Multispecies FMP including the GOM Rolling Closure Areas and GB Seasonal Closure Area.................................... 69
UFigure 3. Year-round closure areas under the Northeast Multispecies FMP including general closures and Essential Fish Habitat areas closed to bottom trawl gear....................... 70
UFigure 4. Atlantic Herring FMP management areas................................................................... 71 UFigure 5. Example VTR form used in instructions to vessel owners and operators .................. 72 UFigure 6. Data on bottom depth and bottom slope used to determine associated variables....... 73 UFigure 7. Fishing regions used with associated statistical areas and relationship to eco-
regions......................................................................................................................... 74 UFigure 8. Distribution of U.S. Northeast and Mid-Atlantic bottom trawl effort in days fished,
1996–2004................................................................................................................... 75 UFigure 9. Mean days fished per trip in the U.S. Northeast and Mid-Atlantic bottom trawl
fishery, 1996–2004 ..................................................................................................... 76
viii
UFigure 10. Mean days fished per trip by month for the U.S. Northeast and Mid-Atlantic bottom trawl fishery, using data from 1996–2004 .................................................................. 76
UFigure 11. Mean days fished per trip by month and main species for the U.S. Northeast and Mid-Atlantic bottom trawl fishery, 1996–2004 .................................................................. 77
UFigure 12. Distribution of U.S. Northeast and Mid-Atlantic bottom trawl effort in days fished, by main species shown as the 75% effort contour, 1996–2004....................................... 79
UFigure 13. Mean number of hauls per trip for the U.S. Northeast and Mid-Atlantic bottom trawl fishery, 1996–2004. .................................................................................................... 88
UFigure 14. Mean average tow time per haul for the U.S. Northeast and Mid-Atlantic bottom trawl fishery, 1996–2004 ............................................................................................ 88
UFigure 15. Mean hauls per trip by month over 1996–2004, for the U.S. Northeast and Mid-Atlantic bottom trawl fishery. ..................................................................................... 89
UFigure 16. Mean average tow time per haul by month over 1996–2004, for the U.S. Northeast and Mid-Atlantic bottom trawl fishery ....................................................................... 89
UFigure 17. Mean codend mesh size overall all trips for the U.S. Northeast and Mid-Atlantic bottom trawl fishery, 1996–2004, by year and month ................................................ 90
UFigure 18. Mean code end mesh size by month and species for the U.S. Northeast and Mid-Atlantic bottom trawl fishery ...................................................................................... 91
UFigure 19. Mean gear size in feet of footrope length for the U.S. Northeast and Mid-Atlantic bottom trawl fishery by year and month over 1996–2004.......................................... 93
UFigure 20. Mean gear size by month and species for the U.S. Northeast and Mid-Atlantic bottom trawl fishery ................................................................................................................ 94
UFigure 21. Mean SST for all trips for the U.S. Northeast and Mid-Atlantic bottom trawl fishery, 1996–2004, by year and month................................................................................... 96
UFigure 22. Distribution of U.S. Northeast and Mid-Atlantic bottom trawl effort shown as the 75% effort contour by quarter aggregated over 1996–2004, overlaid on 23-year monthly mean SST images ......................................................................................... 97
UFigure 23. Mean SST by month and species for the U.S. Northeast and Mid-Atlantic bottom trawl fishery ................................................................................................................ 99
UFigure 24. Distribution of U.S. Northeast and Mid-Atlantic mid-water trawl effort, over the period 1996–2004 ..................................................................................................... 101
UFigure 25. Mean days fished per trip for the U.S. Northeast and Mid-Atlantic mid-water trawl fishery, 1996–2004 ................................................................................................... 102
UFigure 26. Mean days fished per trip by month for the U.S. Northeast and Mid-Atlantic mid-water trawl fishery, using data from 1996–2004 ...................................................... 102
UFigure 27. Mean days fished per trip by month and main species for the U.S. Northeast and Mid-Atlantic mid-water trawl fishery, 1996–2004........................................................... 103
UFigure 28. Distribution of U.S. Northeast and Mid-Atlantic mid-water trawl effort for top species shown as the 75% effort contour for trips that caught more of identified species by live weight than any other species, 1996–2004 ........................................................ 104
UFigure 29. Mean codend mesh size for the U.S. Northeast and Mid-Atlantic mid-water trawl fishery by year and month over 1996–2004 ............................................................. 105
UFigure 30. Mean mesh size by month and species for the U.S. Northeast and Mid-Atlantic mid-water trawl fishery, over 1996–2004 ........................................................................ 106
U

ix
Figure 31. Mean gear size for the U.S. Northeast and Mid-Atlantic mid-water trawl fishery by year and month over 1996–2004............................................................................... 107
UFigure 32. Mean gear size by month and species for the U.S. Northeast and Mid-Atlantic mid-water trawl fishery over 1996–2004 ......................................................................... 108
UFigure 33. Mean SST for all trips for the U.S. Northeast and Mid-Atlantic mid-water trawl fishery, 1996–2004, by year and month.................................................................... 109
UFigure 34. Distribution of U.S. Northeast and Mid-Atlantic mid-water trawl effort shown as the 75% effort contour by quarter aggregated over 1996–2004, overlaid on 23-year monthly mean SST images ....................................................................................... 110
UFigure 35. Mean SST by month and species for the U.S. Northeast and Mid-Atlantic mid-water trawl fishery, over 1996–2004 .................................................................................. 112
List of Acronyms ASMFC = Atlantic States Marine Fisheries Council ATGTRT = Atlantic Trawl Gear Take Reduction Team CA = closed area CFDBS = Commercial Fisheries Dealer Database CV = coefficient of variation DAS = days at sea EFH = essential fish habitat FMA = fishery management area FMP = fishery management plan GB = Georges Bank GOM = Gulf of Maine GRT = gross registered tons MA = Mid-Atlantic MAFMC = Mid-Atlantic Fishery Management Council NEFMC = New England Fishery Management Council NERO = Northeast Regional Office NMFS = National Marine Fisheries Service NOAA = National Oceanic and Atmospheric Administration NSNE = North Southern New England OTF = otter trawl fish OTM = otter trawl mid-water OTO = otter trawl other PTM = paired mid-water trawl RMA = regulated mesh area SNE = Southern New England SSNE = South Southern New England TAC = total allowable catch TRP = take reduction plan
VHP = vessel horsepower VTR = vessel trip report
x
Abstract
An overview of the United States Northeast and Mid-Atlantic trawl fisheries was created to support the development of a Take Reduction Plan (TRP) by the Atlantic Trawl Gear Take Reduction Team (ATGTRT). The analysis focused on aspects of the fisheries that correlated with marine mammal bycatch and characterized the trawl fisheries from Maine to North Carolina for the period 1996 to 2004 by temporal and spatial effort distributions, harvest patterns, vessel characteristics, gear configurations, and environmental relationships. The primary data used were vessel trip reports (VTRs); additional data sources included remotely sensed data for environmental variables, federal commercial dealer records, and vessel permit data.
The number of vessels in the bottom trawl fishery declined by 28% between 1996 and 2004. Over the same period total trips declined by 15%, days absent declined by 26%, and days fished declined by 40%. Total landings varied from a low of 92,159 metric tons (live) in 2002 to a high of 116,911 metric tons in 2004. Based on a 9-year average of landings, the top 5 species were Loligo squid, silver hake, Illex squid, skates, and monkfish. Inflation adjusted value declined for the fishery, reaching a low in 2003 but increasing in 2004. Based on a 9-year average of adjusted values, the top 5 species were Loligo squid, fluke, monkfish, cod, and winter flounder. Over all years, the majority of bottom trawl effort occurred north and east of the Hudson Canyon, although some significant effort occurred along the shelf break south of Hudson Canyon. Effort shifted to the south during the winter. Southern regions tended to use nets with a smaller mesh than northern areas, while gear size, measured as foot rope length, was closely linked to vessel size.
The number of vessels in the mid-water trawl fishery declined by 18% between 1996 and 2004. Effort measured in trips declined by 1%, days absent declined by 5% and days fished declined by 38%. There were clear differences in data on the fishery after the implementation of the Atlantic Herring Fishery Management Plan in 2001. The 9-year average landings were composed of 80% herring and 18% mackerel, while herring accounted for 65% and mackerel 27% of the average inflation adjusted value. Total landings grew steadily and peaked in 2004; the inflation adjusted value doubled over the 9 years. The mackerel and herring fisheries had a small overlap in effort south of Rhode Island. Herring was harvested year round, with effort focused in the Gulf of Maine (GOM), the northern edge of Georges Bank (GB), and south of Rhode Island. Mackerel were fished from south of New England down through the mid-Atlantic from November through May with larger gear (foot rope length) and larger mesh size than herring.
Both fisheries landed the majority of their catch in Massachusetts; other important states included Rhode Island, Maine, New York, and New Jersey. Effort in both fisheries was concentrated in waters where the sea surface temperature (SST) was less than 10 °C, depth was less than 100 meters and bottom slope was less than 0.5°.
VTRs are compulsory for nearly all vessels participating in the U.S. Northeast and Mid-Atlantic bottom and mid-water trawl fisheries; thus, the records should nearly provide a census of fishing effort for the fisheries. Data accuracy, in particular with measures of effort, was examined; over 90% of the records fell within the norms for the variables. It appears that the VTR data provides a reasonably accurate overall picture of the trawl fishery.
1
Introduction
Bottom and mid-water trawl fisheries are a major component of the United States Northeast and Mid-Atlantic fisheries. In September 2006, the National Oceanic and Atmospheric Administration’s (NOAA) National Marine Fisheries Service (NMFS) convened the Atlantic Trawl Gear Take Reduction Team (ATGTRT) to address incidental takes of pilot whales (Globicephala spp.), common dolphins (Delphinus delphis), and white-sided dolphins (Lagenorhynchus acutus) in U.S. Atlantic trawl fisheries. The goal of the ATGTRT is to develop a Take Reduction Plan (TRP) to limit the serious injury and mortality of these marine mammals due to accidental entanglement in commercial fishing gear. This paper characterizes a subset of the U.S. Northeast and Mid-Atlantic trawl fisheries to aid in the development of a TRP. Specifically this paper aims to assess characteristics of the fishery that were identified as correlated to marine mammal bycatch. However, it is also expected that this characterization will be comprehensive enough to serve as a reference for other research on these fisheries.
The trawl fisheries have been the subject of much analysis; however, most studies have focused on subsets of the fisheries. As such, the recent literature lacks an overall characterization or description of the U.S. Northeast and Mid-Atlantic trawl fisheries for use by the ATGTRT. Studies within the peer-reviewed literature tend to focus on small subsets of the fisheries and issues may not be relevant for management considerations under a take reduction team process. A significant amount of information on the fisheries is contained in various fishery management plans (FMPs), 0
1 in particular the Northeast Multispecies FMP documents. However, trawl gear is one of several gear types examined and vessels identified for inclusion in the analysis may be limited to those that hold permits for the species of interest. Rountree (1997) summarized the spatial and temporal patterns for otter trawl vessels for 1982 to 1992. The age of the analysis limits comparisons with this study. 1
2 A study by Stevenson et al. (2004) focused on gear impacts on fish habitat, and mapped effort in days absent for bottom trawl vessels. The maps allow for partial validation of the results of this study; however, characteristics important to bycatch reduction are not examined. 2
3 Historically, reductions in bycatch have been achieved through methods such as gear
modifications and time and/or area closures, which require knowledge of the relationship between bycatch, the fleet, and fishing characteristics. Recent research suggests that trawl bycatch of pilot whales, common dolphins, and white-sided dolphins are primarily a function of the spatial and temporal aspects of fishing effort (Rossman [in prep]; Palka [in prep]). However, numerous other fishing characteristics such as gear fished, vessel characteristics, and species targeted have been shown to be correlated with bycatch and could play a role in mitigation measures. As such, this paper covers a broad range of characteristics including the spatial and temporal aspects of fishing effort, the gear fished, the species harvested, and the vessels
1 Sources for these documents include the New England Fishery Management Council (Hhttp://www.nefmc.orgH) and the Mid-Atlantic Fishery Management Council (Hhttp://www.mafmc.orgH). 2 Rountree (1997) summarized vessel level data for the otter trawl fishery for 1982-1992, prior to the availability of VTR data. Thus, her results are based on a combination of the commercial fisheries data and port agent reports. In 1992, a total of 1,012 vessels used otter trawl gear. 3 Stevenson et al. (2004) used VTRs to map total days at sea (days absent) from 1995-2001 by 10-minute square. For the bottom otter trawl (fish) gear type, activity was concentrated in the western part of the Gulf of Maine, along the northwest edge of Georges Bank, east of Long Island, and along the shelf edge south of Rhode Island and Massachusetts.

2
involved. In addition, this paper summarizes fishing effort and revenues to provide information that could help assess the impacts of proposed mitigation measures.
The organization of the paper is as follows. First, to provide context for the variables examined and the changes identified, information is provided on trawl bycatch calculations and relevant changes in management regimes. Second, fishing effort and variables correlated with bycatch are summarized for 1996 to 2004 and presented separately for bottom and mid-water trawl fisheries. Third, the discussion identifies data concerns and areas for future study.
Background
I. Variables important to assessing marine mammal bycatch in trawl fisheries
Studies on bycatch of marine mammals in the U.S. Northeast and Mid-Atlantic bottom and mid-water trawl fisheries were used to select the fishing characteristics summarized in this paper. The primary predictor variables identified varied by bycatch species and fishery. In the bottom trawl fishery the predictor variables were target species, 3
4 vessel horsepower, and bottom slope for pilot whale bycatch, SST, and bottom depth for white-sided dolphin bycatch, and statistical area for common dolphin bycatch (Rossman [in prep]). In the mid-water trawl fishery bottom depth and latitude were the most important factors in estimating white-sided dolphin and pilot whale bycatch (Palka [in prep]). The primary predictor variables were used to estimate bycatch rates that were expanded to estimate total bycatch using stratified effort measured in days fished.
In addition to the predictor variables, there were other variables that had significant correlations to bycatch rates but were not used as predictor variables. The correlations do not necessarily indicate a cause and effect relationship, but do point to possible research areas that could lead to effective ways to limit bycatch. The bycatch models use data from the NMFS observer database. The Observer records include many variables that are not included in the vessel trip reports (VTRs) or permit databases nor can they be derived from VTR data. For the bottom trawl fishery, 4
5 significant correlated variables in addition to the predictor variables mentioned above were:
� Latitude* 5
6 � Longitude* � Month* � Foot rope length* � Tow duration* � Gross vessel tons* � Vessel length*
For the mid-water trawl fishery, additional significant correlated variables included:
4 Target species is defined by the vessel captain prior to a fishing trip and is recorded in NMFS observer records. This differs from “main species” which is based on some measure of actual landings (e.g., greatest landed weight). 5 The bottom trawl analysis focused on those variables that were in both the observer and VTR or permit records or could be determined from data within those records (Rossman [in prep]) 6 Variables with an asterisk (*) are available in the VTR or permit databases or can be derived from information within those databases (e.g. SST is derived using date, latitude and longitude from VTR records).
3
� Bottom slope* � SST* � Region (Northeast vs. Mid-Atlantic)* � Longitude* � Date*, month*, and season* � Target species � Time of day
II. Relevant fisheries management actions, 1996–2004
Management actions have the potential to affect a number of variables examined in this report 6.
7 The diversity of harvest by the U.S. Northeast and Mid-Atlantic trawl fishery puts it in contact with a large body of management measures. Management authority for the species caught by the trawl fisheries resides with the New England Fishery Management Council (NEFMC), Mid-Atlantic Fishery Management Council (MAFMC), and the Atlantic States Marine Fisheries Council (ASMFC). There are 37 FMPs between the 3 organizations, covering about 60 species (Appendix A). As well, the national Highly Migratory Species Plan covers sharks, swordfish, tuna, and billfish. Despite this range of regulations, the principal species harvested suggests a smaller number of FMPs are of major importance to the U.S. Northeast and Mid-Atlantic trawl fishery; in particular, the FMPs for groundfish (multispecies), Atlantic herring, monkfish, mackerel/squid/butterfish, and summer flounder/scup/black sea bass. Aspects of these FMPs relevant to this report are described below.
i. Northeast Multispecies (Groundfish) FMP By 1996, some management measures were already in place under the Northeast
Multispecies FMP. These measures included a minimum mesh size (5.5”), a ban on the use of paired trawls, seasonal closures in the Gulf of Maine (GOM), Georges Bank (GB), and Southern New England (SNE), and year-round closures in Closed Area (CA) I, CA II, and the Nantucket Lightship CA. Amendment 5 (1996) placed a moratorium on new entrants to the fishery and developed a plan to reduce effort by decreasing historical days-at-sea (DAS) by 50%. Mandatory VTR and observer program requirements increased the information available on the fishery. Minimum mesh size for the GOM/GB Regulated Mesh Area (RMA) (Figure 1) was increased to 6.0”.
Closed areas have been expanding in size and duration since 1996, although the general locations were consistent; Figures 2 (seasonal) and 3 (year-round) represent groundfish closed areas as of 2007. Under Amendment 7 (1996), the GOM seasonal closures were expanded to cover all gear types, including trawl gear. The Cashes Ledge CA was implemented as a seasonal closure in 1998, but became year-round in 2002. The Western GOM year-round closure was implemented as a temporary measure in 1998, but remained beyond 2004. In 2004, Amendment 13 created 7 essential fish habitat (EFH) closure areas, which prohibited bottom trawl gear year-round.
Numerous amendments and framework adjustments continued to cap and reduce DAS for vessels. Amendment 13 (2004) resulted in significant changes to DAS, setting unrestricted DAS at 60% of the vessel’s baseline DAS. 7 For example, regulated minimum mesh sizes may create a truncated distribution when examined by species, and increases (decreases) in minimum mesh size may shift the mean value up (down).

4
Regulated changes in mesh size have been limited. In 1999, the minimum mesh size was increased to 6.5” square for the GOM, GB, and SNE RMAs. This has remained unchanged except for SNE where the minimum was increased to 7.0” square or 6.5” diamond in 2002. Amendment 13 (2004) clarified the mesh size requirements, indicating that vessels with large mesh permits were to have minimum mesh size of 8.5” diamond or square throughout the net in GOM, GB, and SNE RMA, and 7.5” in Mid-Atlantic RMA.
ii. Atlantic Herring FMP When the Atlantic Herring FMP was developed, the resource was considered under-
exploited (New England Fisheries Management Council 1999). The ASMFC Herring FMP was implemented in 2000, while the NEFMC Herring FMP was effective for the 2001 fishing year. Thus, prior to 2001, herring records are considered incomplete (New England Fisheries Management Council 2006), as not all herring vessels were engaged in other fisheries that had VTR requirements.
The FMP limited herring permitted vessels to less than 165 feet in length overall, less than 750 Gross Registered Tons (GRT) or with propulsion less than 3,000 shaft horsepower. The fishery was divided into 4 fishery management areas (FMAs; Figure 4). Each year a target total allowable catch (TAC) was determined for each management area. When catch reached 95% of the FMA’s TAC, targeted harvesting would be halted. Closures, in particular for FMA 1A, were common. In 2002, Framework Adjustment 1 created two quota periods in FMA 1A, winter/spring (January–May) and summer/fall (June–December), in an effort to increase the amount of quota available during the summer/fall peak demand period.
iii. Monkfish FMP The monkfish fishery is jointly managed by the NEFMC and the MAFMC. The monkfish
FMP came into effect November 1999, thus data may be incomplete for earlier years. Limited access permits differentiated between those in the directed fishery and those for which monkfish was primarily a bycatch (holders of multispecies and scallop DAS). Permit holders were each allocated 40 Monkfish DAS. The TAC was to be achieved through a combination of limited access and trip limits. The fishery was divided into the Northern FMA and the Southern FMA; the dividing line runs from the intersection of 70°W longitude and the south-facing shoreline of Cape Cod, MA southward along longitude 70°W to latitude 41°N, then eastward to the U.S.-Canada maritime boundary. Trip limits have been more restrictive in the Southern FMA. When using only a monkfish DAS (i.e., directed fishing), the minimum mesh size for trawls was set at 10” square or 12” diamond. 7
8 In May 2003, Framework Adjustment 2 increased trip limits for the Southern FMA for
monkfish-only vessels, while there remained no trip limit for the Northern FMA. The 2004 rule restricted use of a vessel’s DAS in the Southern FMA to a maximum of 28 DAS and reduced trip limits for the area.
iv. Atlantic Mackerel, Squid, and Butterfish FMP The MAFMC plan covers all Atlantic mackerel, butterfish, Loligo pealei (long-finned
squid), and Illex illecebrosus (short-finned squid) under U.S. jurisdiction. In May 1996, Amendment 5 included a joint moratorium permit for Loligo squid and butterfish, a minimum
8 If a vessel was using both a monkfish DAS and a multispecies DAS the mesh size must conform to the multispecies minimum mesh size.

5
mesh size of 1 7/8” diamond for Loligo vessels, and seasonal quotas for Loligo. Vessels fishing for Illex squid during June–September seaward of a line roughly matching the 50-fathom line were exempt from the minimum mesh size requirements; at that time the Illex squid fishery was considered underutilized. Closures for the directed fisheries in Loligo, Illex, butterfish, and mackerel are based on a percentage of the Domestic Annual Harvest level; the trigger is 80% for mackerel and 95% for all others. Over the years both Loligo and Illex squid fisheries have been closed as the triggers were reached.
In the late 1990s, mackerel was considered underutilized, and a declining annual allocation to joint venture processing sector was provided. Amendment 8 (1999) placed a size restriction on vessels that could fish in the Atlantic mackerel fishery to less than or equal to 165 feet in length and 750 GRT or less than or equal to 3,000 shaft horsepower.
v. Summer Flounder, Scup, and Black Sea Bass FMP The MAFMC was responsible for the summer flounder (fluke) FMP; in 1996, scup and
black sea bass were added to the FMP. Beginning in 1997, vessels issued permits for these species were required to submit VTRs.
All 3 species have been managed with commercial landings quotas that have resulted in closures of the fishery. Fluke used state level quotas, and state level closures have been frequent. Black sea bass initially operated under a coast-wide quarterly quota, but that was converted to a state level quota in 2003. Scup has operated under a coast-wide trimester quota.
Minimum mesh size requirements for trawl vessels differed by species. In 1997, trawls holding a scup moratorium permit were required to use nets with 4” or more diamond mesh. Black sea bass moratorium permit holders were required to use nets with a minimum of 4” diamond or 3.5” square mesh. For fluke, mesh had to be 5.5” diamond or 6.0” square mesh. In 1998, the scup minimum mesh size requirement was set at 4.5” diamond. In 2001, mesh size for black sea bass was increased to 4.5” diamond.
Data
The primary source of data for this analysis was the fishing VTR database. Additional data sources included the Commercial Fisheries Dealer Database (CFDBS), often termed “dealer data,” and the NMFS Northeast Regional Office’s (NERO) permit database.
The VTR is logbook information provided by fishermen, after completing a fishing trip. The number of vessels required to submit reports have grown over the years, and most federally managed fisheries in the Northeast required VTRs by 2004. 8
9 Owners or operators of federally permitted vessels are required to provide reports for all trips, including trips targeting species without VTR requirements and trips with no catch. A separate report is required for each portion of a trip when changes occur in gear (mesh or gear size) or location (based on chart or statistical area). Thus, a single trip may have multiple reports, or sub-trips. Each report (Figure 5) includes: (i) vessel and operator identification; (ii) dates of sailing and landing and port landed; (iii) type of trip; (iv) gear characteristics; (v) location fished; (vi) descriptors of effort; (vii) details on species caught, including kept and discarded, and (viii) to whom sold.
9 The lobster fishery is an exception.
6
VTR data from 1996 through 2004 was retrieved for otter trawl fish (OTF), otter trawl other (OTO), otter trawl mid-water (OTM), and paired mid-water trawl (PTM) gear types. These fisheries had documented marine mammal bycatch and were part of the ATGTRT.
Key variables, including gear size, mesh size, tow time, and number of hauls, were checked for errors, and unreasonable outliers were replaced with median values. Most outliers were determined using a table of reasonable expected values developed for data quality checks. The table of reasonable expected values was developed by examining both observer and VTR data to determine the real world maximum and minimum values for particular variables in each fishery. However, some variables, such as the number of hauls per trip, were not included in this table. In this case, the number of hauls per trip was examined through calculation of the number hauls per day, since the length of trips vary. After examining the distribution of both VTR and observer data, 10 was set as the maximum number of hauls per day. Tow hours and number of hauls were also compared to the amount of fish kept as a means of checking for invalid zero values. For example, if a trip had positive pounds kept but no hauls, then the number of hauls was replaced with a median value. Tow hours were dealt with in a similar manner; for instance, positive tow hours with no hauls were not considered valid.
To calculate median values, trips were stratified by hull number, gear type, FMP group, 9
10 year, and state; each unique combination of these variables had a matching median. Outliers were substituted with the stratified median values; each replaced value was representative of similar trips by the same vessel. In cases where an outlier needed to be replaced and no median was available based on the stratification, the hull number was dropped from the stratification criteria and a median was created based on the remaining variables. About 2% of the data for these variables were replaced with median values, although roughly 6% of the gear size observations were replaced (Table 1).
Two additional variables were created from existing VTR variables: “days fished” and “main species.” A “days fished” effort variable was created using tow hours, tow minutes, and number of hauls recorded. The average tow time per haul for a trip was converted to decimal days and multiplied by the number of hauls for that trip. A variable describing the “main species” landed on a trip was based on the species with the largest percentage of the trip’s live weight. 1
11 For example, if a trip caught more pounds of fluke than any other individual species, the characteristics of that trip were fully attributed to fluke. The implicit assumption was that vessel captains were targeting the species of which they caught the most, having modified gear, season, and location accordingly. The main species categorization was used to examine gear characteristics and effort measures. For some species (e.g., mackerel) more than 80% of the live weight reported in the VTR was harvested by trips where that species (e.g., mackerel) was identified as the main species (Table 2). However, for some species (e.g., cod, plaice, and witch flounder) less than 50% of the total reported live weight landed was harvested on trips where that species (i.e., cod, plaice or witch flounder) was identified as the main species. The impact of this difference on the summary statistics is unclear.
10 FMP group was determined by summing landings for all species within a FMP (Appendix A). If landings for a FMP group of species was greater than or equal to 50% of landings, the trips was assigned to that FMP. 11 From an economic perspective, it would be more reasonable to assume that the main species was that with the largest contribution to trip revenues. Historically, however, the bycatch analysis does not incorporate economic values, focusing instead on physical features such as weight. For consistency the same method was used in this study. This differs from target species, which is recorded in the observer data based on a vessel captain’s intentions at the beginning of the trip, but is not available for VTR records.
7
Environmental variables, including SST, bottom depth, and bottom slope, were created based on location information recorded in the VTR dataset. SST data for each trip was obtained from 5-day SST composites derived from several satellite imagery sources, or 5-day climatology images obtained from NASA’s Jet Propulsion Laboratory. 1
12 Satellite SST imagery sources included AVHRR Pathfinder Version 5, Modis Aqua, Modis Terra, and GOES satellites. 1
13 These sources were combined when available to create one 5-day median composite image for each day. A Visual Basic for Applications routine in ArcGIS 9.1 extracted SST values at point locations, and using a 3x3 cell window, for both the 5-day median composites and the climatology. The VTR data location variable is reported as the center point of a trip that occurs in one area and in which a consistent gear type and size was used. When choosing which SST to use in the analysis, the 5-day medians were preferred over the climatology, and point locations were preferred over the 3x3 cell medians. Lastly, the resulting SST value was compared to the climatology data to screen for incorrect temperature values.
Depth data for each sub-trip was obtained using bathymetry data acquired from the National Geophysical Data Center. 1
14 Like SST, bottom depth (Figure 6A) was sampled with ArcGIS at each fishing location recorded by the vessel log. This depth data was preferred over that reported in the VTR for its consistency both in location and in its source. 1
15 Bottom slope in degrees was calculated using the ArcGIS slope function after projecting the bathymetry data to a Lambert Conformal map projection customized for the area off the Northeast U.S. coast (Figure 6B). Bottom depth and bottom slope are closely correlated.
To estimate revenue, a price series was created from the CFDBS database. For each species, an average weighted price per live pound landed was calculated by year and month. The weighted price took into account the allocation of the species between different grades (e.g., round, dressed) and between ports of landing. For species where the majority of the landings were “unclassified” for a species group (e.g., skates) in the CFDBS, the VTR records were grouped similarly. The price is an average by month over all grade types and ports from Maine to North Carolina, so it does not reflect spatial price differences but does reflect seasonal differences. The value is referred to as the “calculated value” to indicate that it was calculated using the VTR data, rather than taken directly from the CFDBS which is considered a more accurate determination of trip value. Unless indicated, calculated values are in nominal dollars (i.e., not adjusted for inflation), meaning that averages across years are not appropriate. However, where indicated adjusted calculated values were adjusted for inflation using the annual GDP implicit price deflator 1
16 with a base year of 2000 (i.e., 2000=100). The NERO permit database was the source of information on vessel characteristics such
as GRT, vessel horsepower (VHP), and vessel length. While the majority of vessels within the
12 Additional information on the climatology data source can be found at: Hhttp://podaac.jpl.nasa.gov/products/product111.html 13 Additional information on the satellite data sources can be found at the following links: AVHRR: Hhttp://podaac.jpl.nasa.gov/products/product216.htmlH. MODIS Terra and Aqua, see products 162 and 184 (Hhttp://podaac.jpl.nasa.gov/products/product162.htmlH and http://podaac.jpl.nasa.gov/products/product184.html); GOES, see product 190 (http://podaac.jpl.nasa.gov/products/product190.html). 14 Bathymetry data was acquired from ETOPO Global 2’ Elevations CD, available from the National Geophysical Data Center. 15 There are also concerns about possible errors in the VTR depth data with regard to units. 16 Source: Hhttp://www.econstats.comH; accessed September 1, 2005. This is the same deflator used in the annual Fisheries of the United States publication by NMFS.

8
VTR dataset have associated records in the permit dataset, occasionally a match will not be found. Rather than exclude these vessels from the results, these records are identified separately.
To organize the data spatially, 5 fishing regions were defined by grouping statistical areas (Figure 7A). The regions are based on the fishing areas used by NERO and the NEFMC. The NEFMC regions are not exactly aligned with the statistical area boundaries, so adjustments were made. These adjustments were, in part, guided by the ecosystem regions (Figure 7B) identified based on fish communities (Gabriel 1992). The goal was to define regions that were meaningful from both management and ecosystems perspectives. The fishing regions include: GOM, GB, North Southern New England (NSNE), South Southern New England (SSNE), and Mid-Atlantic (MA). Records that lack location information are included in the “unknown” category rather than excluded. The fishing regions are very different in size, and are subject to different management regulations, so comparisons based on total values should be done with caution.
Results
The results are reported separately for the bottom trawl and mid-water trawl fisheries; however, each section follows a similar format. Each fishery is examined in terms of characteristics of effort, harvest, vessels, gear, and environmental variables.
I. Bottom Trawl Fishery (OTF and OTO)
Only vessels reporting the use of OTF and OTO gear on the VTRs are considered in this analysis. While most of these vessels indicate otter trawl gear on all their VTR records, vessels that occasionally report use of otter trawl gear are also included. The number of vessels using bottom (otter) trawl gear decreased between 1996 and 2004 from 944 to 732 (Table 3), a 23% decline. Despite an increase in the number of fisheries covered by VTR requirements during this period, the number of reported trips decreased from 38,748 in 1996 to 33,089 in 2004, a decline of 15%.
i. Effort characteristics Bycatch rates are multiplied by stratified effort to calculate total bycatch; thus, it is
important to understand the distribution of effort relative to factors correlated with bycatch rates. For the Atlantic trawl bycatch estimates, bycatch rates are expanded by days fished. “Days fished” is an encompassing measure of effort that accounts for tow time and hauls and, to some degree, days absent. The focus of this section is the general spatial and temporal distribution of effort, in terms of days fished and its components. Effort is also considered later when fishing and vessel characteristics are examined in other sections, to provide additional information that could be helpful in the assessment of impacts of proposed TRP mitigation measures.
a. Days fished Over the entire 9-year period, 1996 to 2004, effort in the bottom trawl fishery was
focused from the Hudson Canyon north, with areas of high density along the axis of the Hudson Canyon, along the shelf edge, on GB, and in the GOM, particularly off the Massachusetts coast in the transition zone between the GOM, and GB (Figure 8). Some effort extended south of the Hudson Canyon along the shelf break, and along the mid-coast of Virginia and North Carolina. This overall distribution illustrates some of the key fishing grounds for the bottom trawl fishery;
9
however, some of the discontinuities in the distribution of effort closely match closures for management purposes, discussed and illustrated above. The overall distribution of effort also masks changes over the 9 years in terms of the relative importance of areas.
Between 1996 and 2004, the total days fished by the bottom trawl fishery decreased from 37,381 to 22,324 (Table 4), a 40% decline. Days fished declined in all fishing regions, although the declines were not evenly distributed. The greatest impact was in the GOM, where days fished declined in all years except 2001; the total days fished decreased from 15,806 in 1996 to 8,262 in 2004, representing a 48% decline. This was followed closely by NSNE, where there was a decline in every year except 1998; the total days fished fell from 12,896 in 1996 to 6,926 in 2004, a decrease of 46%. The MA had moderate increases in days fished in 1998 and 2002, but still had an overall decrease from 2,328 to 1,522, for a total decline of 35% over the 9 years. The least affected region was GB, where there were slight increases in days fished in 6 of the 9 years; however, the total decreased between 1996 and 2004 from 5,871 to 5,565, a 5% decline.
As a result of the differences in the decline of days fished by fishing region, the relative importance of the regions in terms of effort has shifted (Table 4). In 1996, The GOM accounted for 42% of total bottom trawl effort (=15,806/37,381), NSNE for 34% (=12,896/37,381), and GB accounted for 16% (=5,871/37,381). By 2004, days fished in the GOM were 37% of the total (=8,262/22,324), NSNE accounted for 31% (=6,926/22,324), and GB accounted for 25% (=5,565/22,324).
The average amount of time spent fishing per trip, as measured by days fished per trip, declined by about 30% between 1996 and 2004 (Figure 9). This decline extended to all fishing regions (Table 5). The relative decline was greater in NSNE where mean days fished per trip decreased from 0.65 in 1996 to 0.36 in 2004, a 45% decline. The smallest decline was in GB, where mean days fished per trip decreased from 3.55 to 3.05, a 14% decline. On average, trips to GB fished the most, while vessels on trips in the NSNE fished the least amount of time per trip.
The amount of effort used in the pursuit of different species has declined overall (Table 6), with a few notable exceptions. Main species trips for haddock increased from 30 days fished in 1996 to 1,594 in 2004, a 52-fold increase, while days fished on Atlantic croaker main species trips doubled from 42 in 1996 to 86 in 2004. There were also small increases in the total days fished for yellowtail flounder and Loligo squid trips. The most significant declines in days fished were for American plaice trips, which declined by 90% from 4,517 days to 424 days between 1996 and 2004, and cod, which declined from 4,863 to 1,484 days, a 70% decline. Silver hake, winter flounder, and monkfish trips also exhibited declines in days fished between 1996 and 2004. These changes resulted in some shifts in the relative fishing effort between species (Table 7). In 1996 cod and monkfish main species trips both accounted for approximately 13% of effort in days fished, while American plaice was second at 12% and fluke third at 10% of days fished (Table 7). In 2004, monkfish accounted for 14% of the days fished, fluke accounted for 13%, and Loligo squid for 11%; cod had fallen to 7% and plaice to 2%.
Seasonality for the bottom trawl fishery is evident in the average days fished per trip by month (Figure 10). The highest means occurred in the first quarter, fell until July then increased through December; the average for February was almost twice that for July. This seasonality could be in part due to seasonal differences in the species targeted.
Disaggregating average days fished per trip by main species illustrates the high degree of variability within the broadly defined bottom trawl fishery (Figure 11). Differences exist between species, and within a species between months. Among the Northeast multispecies, witch flounder, silver hake (Figure 11A), and other groundfish (Figure 11D) exhibited the same
10
seasonal pattern as the overall fishery, while winter flounder (Figure 11A) had an opposite pattern. Haddock (Figure 11A) and monkfish (Figure 11C) had the highest days fished per trip, but with opposite seasonal patterns; thus, haddock was highest in the third and fourth quarters while monkfish was highest in the first 2 quarters.
The spatial distribution of days fished by main species (Figure 12) closely matches the distribution of the species. 1
17 An examination of the maps of effort indicates that the species harvested break into 5 groups spatially:
� croaker (Figure 12C) and Illex squid (Figure 12H) have a southern distribution; � butterfish (Figure 12A), scup (Figure 12M), fluke (figure 12E), Loligo squid (Figure
12I), and mackerel (Figure 12J) have a distribution from Rhode Island and southern GB and south;
� monkfish (Figure 12K), silver hake (Figure 12N), skate (Figure 12O), winter flounder (Figure 12P), and yellowtail flounder (Figure 12R) span between Rhode Island and GB up into the GOM;
� cod (Figure 12B), haddock (Figure 12F), American plaice (Figure 12L), and witch flounder (Figure 12Q) are primarily on the northern flank of GB and north into the GOM;
� dogfish (Figure 12D) and Atlantic herring (Figure 12G) are caught throughout the study region.
b. Tow time and number of hauls The examination of the haul and tow time variables was limited as they were used to
calculate the days fished variable, which was examined in detail above. The total number of hauls decreased from 301,241 to 191,032 between 1996 and 2004 (Table 8), a 37% decline. The number of hauls decreased for all main species, except for Atlantic croaker, witch flounder, yellowtail flounder, haddock, and scup. The allocation of hauls between species (Table 9) is similar to that for days fished by species. However, fluke trips generally have a higher percentage of hauls than days fished, while monkfish is the opposite (Table 9 and Table 7). This suggests that fluke tow times are shorter than average, and monkfish tow times are longer than average.
The mean number of hauls per trip declined by about 30% over the 9 years (Figure 13), while mean average tow time per haul both declined by about 10% (Figure 14). Both variables exhibited seasonality, although there were some differences. The mean number of hauls per trip peaked in February and was at its lowest level in July (Figure 15), with about a 40% difference between the two. Mean average tow time per haul was highest in March and lowest in July–September (Figure 16), with about a 30% difference.
c. Days absent “Days absent” is calculated from the VTR as the number of days between departure and
landing, rounded up to the nearest whole day. Days absent is a combination of steam time and fishing time. In the bottom trawl fishery, days absent declined from 101,790 in 1996 to 74,852 in
17 Information on the distribution of the individual species may be found in the Essential Fish Habitat Source Documents, which are part of the NOAA Technical Memorandum NMFS NE series. These documents are available through the NEFSC’s “EFH Source Documents: Life History and Habitat Characteristics” web page (Hhttp://www.nefsc.noaa.gov/nefsc/habitat/efh/H; accessed July 20, 2007).
11
2004 (Table 10), a 26% decline. This is less than the decline in days fished discussed above. Days absent could increase relative to days fished if vessels must travel further to fish.
The fishing regions had different patterns in terms of reported days absent (Table 10). The changes in days absent were not consistent between years or in direction; however, the overall trend was downward. The GOM exhibited the largest overall decline in days absent, from 35,635 in 1996 to 20,861 in 2004 (a 42% decline). In the NSNE region, days absent declined from 44,805 to 33,074 (26% decrease). The GB and MA regions both experienced small increases in days absent over the 9 years. The GB region’s days absent increased from 12,839 to 13,085, a 2% increase, while the MA went from 7,294 to 7,600, a 4% increase.
Seasonal variation in length of trips, measured by days absent, is evident (Table 11), however, high coefficient of variation (CV) values mean the differences are not statistically significant. Trips in the first quarter (January–March) were slightly longer, while trips in the second and third quarters were shorter. There appears to a less variation in the mean value, as measured by the CV, in January and February, when trip length is near its maximum mean value.
ii. Harvest characteristics Landings and value for the fishery are important from the perspective of potential
impacts from proposed TRP actions. The spatial and temporal patterns of harvest help identify groups of fishermen and regions that may be affected by TRP mitigation actions, while value provides an indication of the level of economic impacts.
a. SpeciesOver the 9-year period 1996 to 2004, the main species algorithm classified the majority
of the trips as fluke trips, followed by Loligo squid, cod, winter flounder, and silver hake trips (Table 12). The species making up the majority of the trip’s catch by live weight was considered the “main species.” These rankings differed from those based on total value and total kept weight, though the top species are similar. In terms of total kept weight (live) the top 5 species based on a 9-year average were Loligo squid, silver hake, Illex squid, skates, and monkfish (Table 13). The difference in ranking suggests that fluke, cod, and winter flounder trips may be frequent with a small harvest, and indeed there were small trips limits for each species over much of the time examined.
The importance of species by value is expected to differ from measures based on weight as many high volume species (e.g., herring, mackerel, skates, and Illex squid) have relatively lower prices per pound, either nominal (Table 14) or adjusted for inflation (Table 15). Nominal calculated value illustrates within-year differences in value (Table 16); however, to compare values between years the adjusted value must be used (Table 17). The top 5 species based on an average of adjusted values are Loligo squid, fluke, monkfish, cod, and winter flounder, respectively. Most species have lost real value over the years, although haddock and Illex squid posted gains.
b. Fishing regions The NSNE region, which encompasses the northern Mid-Atlantic Bight, has consistently
harvested the most fish by weight (Table 18). The second most productive region for the bottom trawl fishery was more variable, shifting between GB and the GOM. In terms of calculated value (Table 18), the ranking was consistent from 1996–2000, with NSNE first, followed by the GOM, GB, and the MA. Since 2001, the calculated values for the GOM, GB, and NSNE have been similar with each taking a turn at the top valued region.

12
As the fishing regions are based on ecosystem regions, one would expect differences in the species harvested by fishing region. All the top species were harvested in all fishing regions (Table 19) except for SSNE; however, the importance of individual species to the regional total harvests differed. For the GOM the top 5 species harvested were other groundfish, cod, plaice, monkfish, and winter flounder (Table 19). For GB the top 5 were silver hake, yellowtail flounder, cod, monkfish, and haddock (Table 19). For NSNE the top 5 were Loligo squid, Illexsquid, skates, silver hake, and mackerel, and for the MA the top 5 were croaker, Illex squid, fluke,mackerel, and Loligo squid (Table 19). The overlap in the top 5 between adjacent regions maybe partly explained by statistical areas that include more than one eco-region, but there is alsoseasonal movement by species. This becomes more apparent when landings by species are examined by region and month (Appendix B). Examination at the month-region-species level illustrates shifts between species that allow harvest levels to be maintained throughout the year.
c. Port of landing The top states in terms of landings are those closest to the GOM and the NSNE fishing
regions (Table 20), where effort is concentrated. Massachusetts was usually the top state for bottom trawl landings, with the exception of 1998 and 2004. In terms of inflation adjusted calculated value, Massachusetts was consistently the top state by a significant margin (Table 20). Over the 9-year period, the average adjusted value indicates Massachusetts was the top state, with almost twice the value of second place Rhode Island, followed by Maine as third, and New York and New Jersey nearly tied as fourth.
iii. Vessel characteristics Most bottom trawl vessels only report using OTF gear, and dependence on this single
gear increased between 1996 and 2004 (Appendix C). In 1996, of the 944 vessels reporting use OTF gear, 623 (66%) used only that gear type. By 2004, 588 of the 732 vessels (80%) reporting use of OTF used only that gear type. Only OTF and OTO VTR records are used in the calculation of the information in this report.
a. FleetMost average measures of effort and landings per vessel have remained steady across the
9 years, with small differences rendered insignificant by large CVs. While the number of vessels has steadily declined, the average number of trips increased from 42 per vessel per year to 45 (Table 21); however, the CV remained around 100% throughout the period. While the CVs for average days absent per year and days fished were below 100%, the small declines are insignificant (Table 21). All weight-based measures – including average landings per year (live weight), landings per day absent, and landings per day fished – increased (Table 21), although much of the gain occurred in the last year. Both nominal and inflation adjusted values increased over the years, despite drops in 2002–03 (Table 21). The real value per vessel (revenue, base year 2000) increased from $184,728 in 1996 to $222,160 in 2004 (Table 21), a 20% increase.
b. Ton class A possible reason for the large CVs for the averages per vessel, discussed above, is a high
degree of heterogeneity within the bottom trawl fishery. To address this heterogeneity, vessels may be categorized by a number of categories including size characteristics, depending on the type of analysis. The only “standard” set of categories is that for GRT; the ton class (TC) categories for vessels are: TC1 (1–4 GRT); TC2 (5–50 GRT); TC3 (51–150); TC4 (151–500
13
GRT); and TC5 (>500 GRT). The majority of bottom trawl vessels were of TC2 and TC3 (Table 22), with small numbers in TC4 and very few in TC1. The number of vessels within each class declined over the 9 years, although not equally.
Within TC categories, vessel size measures exhibited a high degree of homogeneity (Table 23). The average VHP had the highest overall level of variation within a TC; however the means were relatively stable over the years. Average vessel length was very stable within a TC, and had CVs below 20% for all groups except TC1, which had a slightly more erratic pattern. As with length, the average GRT within each class was very stable, both in terms of the mean and CV; the CV was larger for TC2 than TC3, which had more vessels.
Despite the number of vessels in TC2 being slightly smaller than TC3, the TC2 group has consistently taken more total trips than TC3 vessels (Table 24). The trips by TC2 vessels are substantially shorter than TC3 trips as the total number of days absent by TC3 vessels is nearly double that of the TC2 group. Additionally, the total days fished by the TC3 group are almost 3 times greater than that for the TC2 group. The small TC4 group has a higher number of total days absent and total days fished relative to the number of trips than any of the other size groups. The percentage of time spent fishing is greater for the larger TC groups. For example, in 2004 TC2 vessels spent 23% of days absent fishing (=4,950 days fished/21,054 days absent) while TC4 vessels spent 39% of the time fishing (4,546 days fished/11,748 days absent).
Differences in the proportion of time spent fishing may, in part, explain some of the differences in the distribution of harvest and revenues between the ton classes (Table 25). Vessels in TC3 landed 4–6 times the weight of fish as did the similar number of vessels in TC2, while the smaller group of vessels in TC4 vessels landed 3–5 times as much fish as the TC2 vessels. The pattern for nominal and inflation adjusted value (i.e., revenue) is similar (Table 25).
Differences in the species composition of landings by vessels in the TC categories (Table 26) may partly explain differences in both effort and landings. The TC4 vessels had higher averageannual landings of squid (Illex and Loligo), silver hake, and mackerel, relative to other species thandid other TC groups. For TC4 vessels the 4 species accounted for 57% (=7,504 + 6,682 + 4,606 + 3,759/39,778) of average kept live weight landings. For TC3 vessels, Loligo squid and silver hake are also important, but other top species include skates, other groundfish, monkfish, fluke, and yellowtail flounder, while the top species for TC2 vessels include skates, cod, plaice, fluke, monkfish, Loligo squid, and winter flounder. The smallest vessels, TC1, are almost fully dependent on groundfish, including cod, witch flounder, plaice, yellowtail flounder, monkfish, and other groundfish.
iv. Gear characteristics Two gear characteristics are available in the VTR records: codend mesh size, and gear
size as measured by footrope length. Mesh size is determined by target species and fishing method, which in turn are limited by regulations. Minimum mesh size restrictions have been in place for most species fished by the bottom trawl fishery for the entire 9-year period. While numerous exemptions exist for specific times, areas, and target species, one would anticipate that the self-reported data (i.e., VTRs) would closely follow the regulated sizes for the associated main species. In contrast, gear size in terms of footrope length for trawl nets for the most part is not regulated but is limited by fishing conditions and vessel characteristics.
a. Mesh size (codend) The mean codend mesh (inches) increased over the years (Figure 17A); however, the
total increase has been a little over 1/2 inch since the smallest average in 1998. There is a greater difference between months in average mesh size (Figure 17B), perhaps illustrating shifts in
14
targeted species. There are two peaks in mesh size; generally mesh size was large in the winter and early spring, and decreased in size from June through October (Figure 17B).
There is almost no seasonality present in codend mesh size for a given species (Figure 18), though differences are evident between species. Many of the northeast demersal species have mesh sizes of about 6 inches including haddock, yellowtail flounder, American plaice, winter flounder, witch flounder, cod (Figure 18A), monkfish, and skate (Figure 18B). Scup and fluke, which have distributions from Rhode Island and south, have average mesh sizes of roughly 4.5 and 5.5, respectively (Figure 18B). Spiny dogfish, whose distribution spans the Northeast and MA had a mesh size between 4–5 inches. Squid, herring, mackerel, and butterfish, which are more pelagic and are often caught together, had mesh sizes between 2–3 inches. Silver hake, which often feed on herring and young mackerel (Bigelow and Schroeder 1953), also had an average mesh size of about 3 inches.
When examined by fishing region, the GOM and GB used larger size mesh than NSNE and MA (Table 27). The SSNE region, which is primarily offshore, generally had the smallest mesh size. The general pattern is a decrease in size from north to south, which generally corresponds to the spatial pattern seen by species. All fishing regions except SSNE exhibited an increase in mesh size over the 9 years.
While mean mesh size appears to get smaller as the vessel size increases (Table 28), the differences are small and the CV is large enough to render the sizes indistinguishable. The relatively smaller CV in the TC1 group may suggest a more uniform targeting of species than in the TC4 group, which has a much larger CV.
b. Gear size (footrope length 1
18)The average footrope length for the bottom trawl fleet was about 84 feet from 1996–
1999; in 2000 there was a sharp increase to almost 88 feet followed by a steady decline to 85 feet in 2004 (Figure 19A). Seasonality was evident (Figure 19B), with larger footrope lengths in the first quarter, which drop sharply from March to the low in May, and followed by a steady increase in size until December. There are some differences in mean gear size between species (Figure 20). Compared to other species, gear size was smaller for trips that caught winter flounder, cod, yellowtail flounder (Figure 20A), fluke (Figure 20B), skate, dogfish, and Atlantic herring (Figure 20C). Trips that caught haddock (Figure 20A), Illex squid (Figure 20B), and monkfish (Figure 20C) tended to have larger gear. For most species, seasonal variation was limited (Figure 20). Seasonality was evident for witch flounder, American plaice (Figure 20A), scup, butterfish, both squid species (Figure 20B), and monkfish (Figure 20C).
Gear size varied by fishing region, with the largest gear used in GB, followed by GOM, NSNE, and MA (Table 29). Within each region the CV remained around 30% over the years. The GOM and GB both exhibited a steady increase in the gear size over the 9 years except for 2004, when the average size used decreased in GB region. The NSNE and MA regions had declines in gear size over the years, with the difference larger for the MA. The SSNE region exhibited no clear pattern for gear size, although this may be influenced by the limited number of trips in the fishing region.
The average size of gear (in feet of footrope) was larger for larger vessels (Table 30), and appears to have increased over the 9-year period for all categories.
18 Footrope length is also referred to as “sweep length” and is an indication of the width of the trawl opening.

15
v. Environmental and Habitat Characteristics Fish and marine mammals have particular habitat requirements which may depend in part
on environmental variables such as SST, water/bottom depth and bottom slope.
a. Sea Surface Temperature The annual mean SST for bottom trawl trips varied considerably over the 9-year period
from a low of about 13oC in 1996, 1997, and 1998, to a peak of 14oC in 2000 (Figure 21A). This could be the result of inter-annual variability, but may also reflect changes in the location of effort over time, which in turn is related to the species harvested. As one would anticipate, seasonal differences in water temperature were evident (Figure 21B); the monthly mean SST for trips was lowest in the first quarter, increased steadily until August, and then declined to the end of the year. This shift in SST occurred despite shifts in effort between the seasons (Figure 22). There was a greater concentration of effort in the south during the winter (Figure 22A), while during the spring (Figure 22B) and summer (Figure 22C) effort shifted north, and then began to shift back to the south in the fall (Figure 22D).
The mean monthly SST did not differ greatly between species (Figure 23), with patterns that closely reflect the overall seasonal pattern. During the winter and spring, trips that caught predominantly silver hake had a warmer temperature profile than the rest of the Northeast multispecies group (Figure 23A). The mean temperature signature for Illex squid (Figure 23B) and Atlantic croaker (Figure 23C) was warmer than almost all other species throughout the year; however, the series for croaker was discontinuous due to the limited number of main species trips. The Mid-Atlantic FMP species (Figure 23B) had warmer temperatures than most of the Northeast multispecies group (Figure 23A). Dogfish, herring, and monkfish (Figure 23C) all had similar temperature distributions, though dogfish had a slightly warmer signature than the other two species during the winter and spring. The temperature distribution for the “other finfish” category (Figure 23D) was warmer in the spring due to several species captured at the southern edge of the MA.
The effort within different SST groups has shifted over the years (Table 31), which in part explains the annual changes noted above. Between 1996 and 2004, the days fished in waters with a SST between 0–5 ºC declined from 9,010 to 3,984, a 56% decline. As effort overall was declining, other SST groups also saw declines in days fished; however, they were not as great as that for the 0–5 ºC group. The result was a shift in the distribution of effort to warmer waters (Table 31), which was more apparent in 2001 and 2002.
The number of hauls within each SST groups also declined and shifted (Table 32), with the 0–5 ºC group shifting from 24% of the total in 1996 to 14% in 2004. The shift from the lowest SST group to higher temperature groups is more pronounced when measured by hauls than by days fished, suggesting that tow time may have increased in the 0–5 ºC group, shortened in other SST groups, or both.
b. Bottom Depth The distribution of effort in days fished relative to bottom depth indicates that the
majority of effort is between 0 and 100 meters, but there was a shift over the 9-year period (Table 33). In 1996 42% of the days fished were in the 0–50 meter depth category, but by 2004 this had dropped to 33%. The majority of the effort shifted to the 50–100 meter category, which increased from 21% to 29% of effort; there was also a small increase in effort in the 200–2000 meter category.

16
The pattern of change was very similar for effort measured by number of hauls (Table 34), although hauls were more heavily concentrated in the 0–50 meter depth category than were days fished. In 1996, 51% of the hauls were in waters 0–50 meter deep. By 2004, the share had declined to 43%; the decline was matched by an increase in the 50–100 meter depth category. When considered by bottom depth categories, shallow waters (100 meters or less) had a higher percentage of hauls than days fished, suggesting that tow times were longer for trips in deeper waters.
c. Bottom Slope The sea floor has relatively little bottom slope over the continental shelf and significantly
more slope along the shelf break. The slope decreases again on the continental slope, though it generally is not as flat as on the continental shelf. Effort, in days fished, for the bottom trawl fishery overall and by species is concentrated on the continental shelf where bottom slope is slight. Almost 90% of days fished have been concentrated in the 0–0.5° slope category for the 9-year period (Table 35), and the pattern is similar for effort measured by hauls (Table 36).
II. Mid-water Trawl Fishery (OTM and PTM)
The mid-water trawl fishery consists of both single and pair mid-water trawl vessels. The fishery is smaller and its harvest less diverse than the bottom trawl fishery. All trip reports where the gear was listed as OTM or PTM were included in the analysis. This included vessels that also fished in other fisheries, including the bottom trawl; however, only the records relating to mid-water trawl activity are included.
The number of vessels participating in the mid-water trawl fishery declined from 40 in 1996 to 33 in 2004 (Table 37), an 18% decline. The decline in the number of trips was small, from 1,247 to 1,231 (Table 37), a 1% decline.
i. Effort characteristics Bycatch rates are multiplied by effort to calculate total bycatch; thus, it is important to
understand the distribution of effort relative factors correlated with bycatch rates. For the Atlantic trawl bycatch estimates, bycatch rates are expanded by days fished. “Days fished” is an encompassing measure of effort that accounts for tow time and hauls and, to some degree, days absent. The focus of this section is the general spatial and temporal distribution of effort, in terms of days fished and its components. Effort is also considered later when fishing and vessel characteristics are examined in other sections, to provide additional information that could be helpful in the assessment of impacts of proposed TRP mitigation measures.
a. Days fished Over the entire 9-year period of 1996–2004, effort in terms of days fished for the mid-
water trawl fishery was focused on the shelf south of New England, on the northeastern edge of GB, and in the western GOM (Figure 24). The total number of days fished by the mid-water trawl fishery declined from 484 in 1996 to 302 in 2004 (Table 38), a 38% decline. The decline has not been equal across fishing regions; in fact GB had an increase in days fished from 27 to 40 (Table 38), a 48% increase. However, GB remains a distant third in terms of days fished for the mid-water fishery. In 2001, the GOM became the most important region in terms of days fished, replacing the NSNE. The MA region, which accounted for about 20% of effort in 1996

17
(=94/484), declined to the point where by 2004 only 7% (=21/302) of days fished were in the region.
The mean days fished per trip for the fishery decreased after the late 1990s (Figure 25), although the true difference was only a little over 0.1 day fished or a little over 2 hours. This decline extended to all fishing regions (Table 39). Overall declines from 1996 to 2004 mask fairly steady days fished per trip for the top 3 regions, GOM, GB, and NSNE, since 2001. In 2004, trips to GB spent the most time fishing at 0.51 days per trip, while those in the GOM spent the least time fishing at 0.19 days per trip.
The amount of effort in days fished declined for all main species trips, except for mackerel, which increased from 35 to 71 from 1996 to 2004 (Table 40), a 106% increase. The mid-water fishery was a more diverse fishery in the 1990s when several different main species were evident. However, by 2004 herring and mackerel trips accounted for 93% (=70%+23%) of all days fished in the fishery (Table 41).
The mean number of days fished per trip varied with month (Figure 26). Fishing effort per trip peaked in March–April and September–October, and reaching lows during January and June. When considered by main species and month (Figure 27), the mean days fished per trip are fairly constant through out the year for Atlantic herring. Atlantic mackerel, however, shows a discontinuous series with a sharp increase in May.
The spatial distribution of effort, in days fished, for mid-water herring and mackerel are distinct, except for a small overlap south of Rhode Island (Figure 28). Herring was fished in the GOM, northern edge of GB and south of Rhode Island (Figure 28A), while mackerel was fished from south of New England down through the mid-Atlantic (Figure 28B).
b. Tow time and number of hauls The examination of the haul and tow time variables was limited as they were used to
calculate the days-fished variable, which was examined in detail above. The total number of hauls in the mid-water fishery decreased from 4,162 in 1996 to 2,632 in 2004 (Table 42), a 37% decline, which closely mirrors the decline in days fished. The distribution of hauls between main species trips (Table 43) shows increased concentration in the herring and mackerel fisheries. The distribution of hauls between fisheries is almost identical to that of days fished, suggesting tow times may not differ between herring or mackerel trips.
c. Days absent Days absent is calculated from the VTR as the number of days between departure and
landing, rounded up to the nearest whole day. In the mid-water trawl fishery, the total number of days absent declined from 3,534 in 1996 to 3,350 in 2004 (Table 44), a 5% decline. The decline in days absent was substantially less than that for days fished, suggesting less time was spent fishing in 2004 than in 1996. All fishing regions experienced declines in days absent except the GB region, which showed an increase (Table 44); however, in 2004 the GB region remained a region with limited use by mid-water trawls, with only 328 days absent of the total 3,350 or about 10% of the total.
There appear to be seasonal differences in the length of mid-water trawl trips, with shorter trips in the summer and early fall (Table 45); however, the high CV makes it unlikely that these differences are statistically significant. There appears to less variation in the mean value in August–September and November–December, when trip length is near the lower end of its range.
18
ii. Harvest characteristics
a. SpeciesBetween 1996 and 2004, nearly 83% of mid-water trawl trips were classified as Atlantic
herring main species trips (Table 46). The species making up the majority of the trip’s catch by live weight was considered the “main species.” Atlantic mackerel is the main species on almost 10% of the trips. Other species that are occasionally determined to be the main species on a trip include Atlantic croaker, bluefish, Illex squid, Loligo squid, and scup, although this is largely an artifact of data from 1996–2000. Landings have been quite volatile but have grown over the 9 years (Table 47), and herring has accounted from the majority of landings for the entire period. However, the dominance of herring began to erode in 2002, and by 2004 herring accounted for only 71,446 of the 124,493 metric tons (live weight) landed by the fleet, or 57% of the total. Mackerel landings accounted for an increasing share of the growing landings for the mid-water trawl fishery.
The price for mackerel was higher than that for herring throughout the 9-year period both in nominal (Table 48) and inflation-adjusted prices (Table 49), although the difference narrowed from 2001 onward. The nominal value of the mid-water trawl fishery showed a steady increase from almost $11 million in 1996 to almost $25 million in 2004 (Table 50), a 133% increase. In inflation-adjusted terms (2000=100), the value of the fishery doubled from a little over $11 million to a little over $22 million (Table 51). During this time the value of other species dropped to under $200,000, while the value of mackerel increased to nearly equal that of herring.
b. Fishing regions In terms of fishing regions, the share of landings from GB and MA has grown (Table 52);
however, the GOM and NSNE continue to be the major source of landings. Despite having similar landings in the last few years of the time series, the NSNE region provided a slightly higher share of calculated value than the GOM (Table 52). In nominal and real terms, the combined value of landings from GB and the MA have accounted for approximately one-third of value throughout the time series, with the GOM and NSNE accounting for approximately one-third each.
The species composition of landings by fishing region (Table 53) illustrates a north–south pattern. In the GOM and GB herring dominate. In the NSNE region, landings of herring and mackerel were similar. In the MA, mackerel is the dominant species harvested. Most of the Illex and Loligo squid was landed in NSNE, while the croaker was predominately landed in the MA. As well as spatial differences, there are seasonal differences in landings when examined by fishing region and month (Appendix D).
c. Port of landing The port location where mid-water trawl vessels landed their harvest was closely linked
to the location of the harvest, with the top states being those closest to the GOM and NSNE fishing regions, which includes Maine, Massachusetts, and Rhode Island (Table 54). On average over the 9-year period, Massachusetts was the top state in terms of landings and value for the mid-water trawl fishery (Table 54); however, the top state within a give year was variable.
iii. Vessel characteristics The majority of mid-water trawl vessels participate in other trawl fisheries, in particular
the bottom trawl fishery (Appendix C); however, by 2004 the majority of pair-trawl vessels used
19
only that gear type. The number and share of vessels dependent only on mid-water trawl has increased, even while the total number of vessels in the mid-water trawl fishery declined from 40 to 33 from 1996 to 2004 (Table 55), a 18% decline.
a. FleetMost average measures of effort and landings per vessel show a clear difference between
the periods from 1996–2000 and from 2001–2004 (Table 55). In 2001 the average number of trips per year taken by a mid-water trawl vessel increased from 29 to 36, while days absent increased from 65 to 94 (Table 55). Landings per vessel, per day absent, and per days fished all increased sharply, as did nominal and inflation-adjusted value per vessel. This suggests a sharp change in the fishery, and in 2001 the Atlantic Herring FMP came into effect, requiring VTRs from all vessels permitted for herring. The only measure that did not appear to change was the total days fished per year per vessel, which remained around 9–10 days from all periods after 1996 (Table 55).
b. Ton class Large CVs for these values may make the measures more apparent than significant. High
CVs can be a sign of a heterogeneous fleet. Categorizing vessels may provide for more uniform strata with smaller CV values. One standard set of categories is for GRT (see “Ton Class” under the “Bottom Trawl Fishery” section, above). The distribution of vessels between the size categories has changed between 1996 and 2004 (Table 56). There were no vessels in TC1 or TC5. The number of vessels in TC2 remained relatively constant, while those in TC3 declined and those in TC4 increased (Table 56). By 2004, 20 of the 33 vessels were in TC4, which accounted for over 60% of the mid-water fleet.
Vessel size measures have relatively low CV values within a TC (Table 57). While there is some variation between years, average VHP has increased for all 3 TCs represented. Average vessel length and average GRT have remained steady over the years within TC2 and TC3 (Table 57); however, both measures have increased for TC4. The CV for average length and GRT have been small and steady within TC2 and TC3, but growing in TC4.
Looking at total effort measures by ton class shows strong differences between the different groups of vessels (Table 58). Since 2001, vessels in TC2 have operated as day boats where the number of trips is equal to the number of days absent. There has also been a sharp contraction for TC3 vessels in the number of trips and days absent, which in part reflects a decrease in the number of vessels. Vessels in TC4 showed a decline in trips and days absent in the 1997–2000 period, but both measures increased since 2001. In terms of actual fishing effort, TC4 vessels dominate the fishery. As mentioned above, in 2004 vessels in TC4 made up 61% of the mid-water vessels; however, in 2004 they accounted for 1,089 of the 1,231 trips (88%), 3,078 of 3,332 days absent (92%), and 278 of 302 days fished (92%).
A similar pattern emerges when total landings and value are examined by ton class (Table 59); the TC4 vessels contributing the majority of landings and calculated value. Average landings by ton class illustrate those vessels in the largest class, TC4, predominately target herring while those in TC3 land a mix of herring and mackerel (Table 60).
iv. Gear characteristics There are two gear characteristics available in the VTR records, codend mesh size, and
gear size measured by footrope length.

20
a. Mesh size (codend) The mean codend mesh decreased by approximately 0.5 inches from a peak in 1998
(Figure 29A), although size was steady around 1.5 inches since 2001. Monthly mean mesh size was highest during the January–April period, was steady around 1.5 inches from May–October, then increased through November and December (Figure 29B). The reason for this seasonal pattern is evident when mesh size was examined by species (Figure 30). Atlantic mackerel was fished with larger mesh, and only occurred in the first 5 months of the year. Herring is fished throughout the year and uses a smaller mesh size.
Average mesh size by fishing region shows differences that are the result of species targeted (Table 61). In the GOM and GB, where herring is the principal species, mesh size is the smallest and has been steady over the years. In NSNE, where both herring and mackerel are landed the average mesh size is slightly larger and more variable, illustrating the different mix of landings over the years. In the MA, where mackerel is the principal species landed, average mesh size is considerably larger than in the other fishing regions.
Mean codend mesh size by TC illustrates the focus of the different groups of vessels between herring and mackerel (Table 62). Vessels in TC4 have the smallest average mesh size, and it was shown earlier that landings by these vessels are dominated by herring. The average mesh size for vessels in TC3 is larger than that for TC4 vessels, reflecting the greater role of mackerel in the landings for these vessels.
b. Gear size (footrope length) Gear size, measured as footrope length in feet, shows a sharp increase in 2000 (Figure
31A), after which it has been relatively stable around 200 feet. Footrope length showed a seasonal pattern (Figure 31B), with the shortest lengths in August, slowing increasing to January, sharply decreasing in February, and then slowly increasing to June. Atlantic mackerel trips were distinguished from Atlantic herring trips by their larger footrope length and their limited fishing season from January–May (Figure 32).
There have been changes in average gear size used in the fishing regions (Table 63), and much variation between years. In 1996, the shortest footrope was used in the MA and the longest in the NSNE region; by 2004, the shortest footrope was used in the GOM, and the longest in the MA.
The average footrope length is longer for larger vessels (Table 64), and increased over time for TC2 and TC4 vessels. Gear size appears to have decreased for TC3 vessels, although this group also has the highest CV values.
v. Environmental and Habitat Characteristics Fish and marine mammals have particular habitat requirements which may depend in part
on environmental variables such as SST, water/bottom depth and bottom slope.
a. Sea Surface Temperature As with the bottom trawl fishery, there was considerable variability in the mean SST by
year for the mid-water trawl fishery (Figure 33A). This similarity suggests that the variation by year was likely due to inter-annual variability of SST rather than changes in fishing practices. However, the mid-water trawl annual SST presents a cooler profile than the bottom trawl fishery, with a low of ~11 °C in 1999 and a high of 12 °C in 2000 (Figure 33A). The monthly average SST for the mid-water trawl harvest followed a pattern of declining temperatures from January–March, followed by a period of warming until August, then a decline for the remainder of the

21
year (Figure 33B). Effort within the fishery shifted north and south with the seasons, with most effort taking occurring in the SSNE and in the MA in the first quarter (Figure 34A), and in the GOM in other quarters (Figure 34B–D).
When examined by main species, the average SST followed a pattern similar to that for the entire fishery, with Atlantic mackerel showing a slightly warmer winter–spring temperature signature than herring (Figure 35). This is a result of the more southerly harvest areas for mackerel, identified above.
Between 1996 and 2004, effort in days fished decreased in waters less than 20 °C (Table 65), and was sustained in the colder waters below 10 °C. This resulted in a slight shift in the distribution of effort to colder waters (Table 65). The relationship between days fished and hauls is highly correlated for SST groups, resulting in a similar pattern when effort is examined by number of hauls (Table 66).
b. Bottom depth and slope Bottom depth and bottom slope are closely related, as illustrated earlier (Figure 6). In the
mid-water trawl fishery, Atlantic herring is caught primarily south of Rhode Island, along the northern edges of GB, and in the GOM. These areas are relatively shallow, with a flat to moderate bottom slope. Atlantic mackerel is primarily caught on the mid-Atlantic shelf, extending north to east of Long Island, especially in the area of the Hudson Canyon. The majority of these areas are less than 100 meters deep and have little bottom slope, except for the localized topography of the Hudson Canyon, where the walls are too close together to be well represented in the bottom slope data source used.
An examination of effort by bottom depth categories shows that the majority of effort in days fished is in waters less than 100 meters (Table 67), with about 60% of days fished. This has changed little over the 9-year period. When effort is measured by number of hauls, we see that effort is slightly more concentrated in the less than 100 meter categories (Table 68); this suggests shorter hauls in the more shallow waters.
Days fished by bottom slope categories shows that a vast majority of effort is concentrated in areas where slope is less than 0.5° (Table 69); this concentration has been growing. By 2004, 92% of days fished were in the category of slope less than 0.5° (Table 69), up from 69% in 1996. A very similar patter is evident when effort is measured based on the number of hauls (Table 70).
Discussion
Between 1996 and 2004, effort in the bottom trawl fishery decreased between 15% and 40%, depending on the unit of measure. Despite these declines, the total harvest kept (live weight) was relatively stable until 2004, when there was a substantial increase. The nominalvalue of the fishery increased by about 9% over this time; however, the inflation-adjusted value decreased by 5% and the inflation-adjusted value per vessel increased by about 20%. Relative shifts in effort meant that GB became a more important fishing region, and increased shares of effort were directed to yellowtail flounder, fluke, haddock, and Loligo squid trips compared to other species. These shifts were accompanied by a larger share of effort in deeper and warmer waters.
The mid-water trawl fishery data shows a sharp division in 2001, the year the Atlantic Herring FMP came into effect. The fishery focuses on herring and mackerel, which are spatially

22
distinct for most of the year. Both landings and value for the fishery have been increasing, although there is a high degree of inter-annual variability. In 2004, the value of the fishery was almost evenly split between herring and mackerel, although landings for herring were significantly higher. In contrast to the bottom trawl fishery, the GB region has become less important to the mid-water trawl fishery as the SSNE and MA regions have increased in importance both in landings and value. Large vessels (TC4) increasingly dominate the fishery, measured in effort, landings, and value.
In general, the results of this report will not surprise those who are in close contact with the bottom and mid-water trawl fishery. However, the members of the ATGTRT represent a broad cross-section of stakeholders including fishermen, environmental organizations, state agencies, and federal government representatives. Thus a disparate level of knowledge of the fishery may exist; even fishermen who are aware of changes within their fishery or region may be unaware of the broader picture. This report attempted to create a base level of information for all participants in the process. This report is presented at a high level of aggregation, and thus is limited in its ability to determine the potential impact from proposed actions. However, it does illustrate changes that are occurring within the fisheries that may help to identify priorities for actions. For example, shifts in effort to different regions, main species or depths could result in increases in bycatch which may need to be addressed proactively.
The data also highlight the importance of understanding changes in FMPs. Effort patterns within the bottom trawl fishery (Figure 8) illustrate the impact of year-round closures (Figure 3); while the closed areas themselves are clear of effort, effort is highly concentrated along their edges. The expansion of areas closed to bottom trawl gear with the creation of essential fish habitat (EFH) areas could have potential impacts on the location and intensity of bottom trawl effort, and potential bycatch. Similarly, the mid-water trawl fishery showed a high concentration of effort (Figure 24) in herring management area 1A (Figure 4); in the future mid-water trawls will be excluded from this area. The relocation of this effort could have implications for bycatch. This report cannot comment on how effort will shift with management actions, but highlights the need to support existing and future modeling efforts to capture these shifts.
The data presented in this paper was drawn primarily from VTRs. Because these trip reports are mandatory, this data source provides a theoretically complete survey of all bottom and mid-water trawl effort. However, data accuracy may not always be reliable. This may be due to errors on trip reports, data entry errors, or purposeful misrepresentation of trip data by the fishers themselves. We have taken steps to ensure data accuracy, though the true accuracy is unknown. Checks of gear size, mesh size, tow time, and number of hauls against reasonable expected values has shown that in most cases 98% of the data fell within expected limits (Table 1). Comparisons of recent VTR data against observer data have also shown a good match (Rago et al. 2005). Within the Northeast Fisheries Science Center and Regional Office, steps have been taken to improve the accuracy of both incoming and existing VTR data. Despite these efforts and generally good comparisons with other data sources, some data fields such as latitude and longitude were missing values, especially in earlier years, and given the size of the database some errors are nearly undetectable and unknowable. Given the available data, we believe that though each trip record may not be exactly correct, the VTR data are representative as a whole. Upcoming efforts to compare VTR data to dealer data (Magnusson in prep) and a more detailed comparison with observer data (Orphanides in prep) should shed light on this issue and provide a better framework for assessing the VTR data.
23
Assuming that the VTR data are generally representative, it is still possible to misrepresent the data. Much of the fisheries information was summarized according to what was termed the “main species” of a trip. This meant that if a trip landed more weight of a particular species than any other, then that trip was assigned to that main species and the trip variables were analyzed as being part of the group assigned to that particular species. Using this method each trip is only used once when summarizing variables by species. It is unclear whether this grouping method best represents trip variables for species that did not often make up the majority of the catch. An alternate method would be to summarize trips by all species caught on a particular trip; if a trip caught mostly haddock, but also contained cod and monkfish, then the trip would be included when summarizing variables for haddock, cod, and monkfish. Alternatively, the trips could be categorized based on the species with the highest value within a trip, based on the economic principle of revenue maximization. The question of interest however, is which version of “main species” most closely matches captains’ determination of “target species”; this requires additional comparisons with observer data.
It is also important to point out that the spatial and temporal distributions of fish catch shown in this paper may not necessarily reflect true fish distributions. Numerous regulations limit the times and areas where fishers can fish, particularly in the Northeast, and these regulations have changed over time. Regulations also affect the gear characteristics used in certain locations, times of the year, and target species. For example, the Northeast Multispecies FMP, perhaps the most important FMP for the bottom trawl fishery, has resulted in several changes in permitted mesh sizes, with spatial, temporal, and species exemptions. Limited access areas, days at sea, and trip limits have all been added to the FMP and changed over time. Several seasonal and year-round closed areas have been created, removed, and reconfigured resulting in a patchwork of year-round, seasonal, and rolling closed areas. These restrictions make it very difficult to determine the true species distribution from catch data. The ongoing changes in the regulations also make it difficult to compare catch data across years. In addition, these regulations have played a role in the decline of effort in trawl fisheries, which also makes it is difficult to compare across years. Despite all these changes, fishers still have managed to maintain or increase harvest and value.
The aim of this paper was to provide summary statistics on the bottom and mid-water trawl, so it lacks in-depth comparative statistical analysis. Given the size of the fisheries and the wealth of data available, we felt that this paper would best serve as a basis for subsequent analysis in other papers. Similarly, the biological and ecological reasons for the temporal, spatial, and environmental distributions of the fish were not discussed in this paper. Again, we felt that we had to limit the scope of this paper to provide baseline information for the take reduction team process and have left these topics for other possible subsequent papers.
Acknowledgements
First, we would like to thank the fishers for their honest reporting of their fishing effort, without which this study would not have been possible. We would also like to thank all who collected, edited, and archived these mammoth datasets. We would also like to thank D. Palka for her guidance and reviews during the preparation of this paper, K. Bisack for guidance in stratifying the data, and R. Merrick, F. Serchuk, and E. Thunberg for their helpful comments. All errors and omissions remain those of the authors.
24
References
Bigelow HB, Schroeder WC. 1953. Fishes of the Gulf of Maine. US Fish Wildl Serv, Fish Bull. 53; 577 p.
Gabriel WL. 1992. Persistence of demersal fish assemblages between Cape Hatteras and Nova Scotia, Northwest Atlantic. J Northw Atlant Fish Sci. 14:29-46.
Magnusson GM. [in prep]. A comparison of VTR and commercial fisheries landing data for the Atlantic trawl fishery. NOAA NMFS Northeast Fisheries Science Center, 166 Water St, Woods Hole MA 02543.
New England Fisheries Management Council. 1999. Final Atlantic Herring Fishery Management Plan Incorporating the Environmental Impact Statement and Regulatory Impact Review (Including the Regulatory Flexibility Analysis) - Vol I. Saugus (MA): NEFMC; p 376.
New England Fisheries Management Council. 2006. Final Amendment 1 to the Fishery Management Plan (FMP) for Atlantic Herring Including a Final Supplemental Environmental Impact Statement (FEIS) and Initial Regulatory Flexibility Analysis (IRFA) - Vol I. Newburyport (MA): NEFMC; p. 713.
Orphanides, CD. [in prep.] A comparison of observer and VTR records for the Atlantic trawl fishery. NOAA NMFS Northeast Fisheries Science Center, 166 Water St, Woods Hole MA 02543.
Palka DL. [in prep]. Mid-water trawl cetacean bycatch estimate. NOAA/NMFS/Northeast Fisheries Science Center, 166 Water St., Woods Hole MA 02543.
Rago PJ, Wigley SE, Fogarty MJ. 2005. NEFSC bycatch estimation methodology: allocation, precision, and accuracy. Northeast Fish Sci Cent Ref Doc. 05-09; p. 44.
Rossman M. [in prep]. Bottom trawl fishery cetacean bycatch estimates. NOAA NMFS Northeast Fisheries Science Center, 166 Water St, Woods Hole MA 02543.
Rountree BP. 1997. Individual Vessel Behavior in the Northeast Otter Trawl Fleet during 1982-92. NOAA Tech Memo NMFS NE 113; p. 50.
Stevenson D, Chiarella L, Stephan D, Reid R, Wilhelm K, McCarthy J, Pentony M. 2004. Characterization of the fishing practices and marine benthic ecosystems of the Northeast U.S. Shelf, and an evaluation of the potential effects of fishing on essential fish habitat. NOAA Tech Memo NMFS NE 181; p. 79.

25
Table 1. Percent of records replaced by median values by type of data
Source Hauls Soak Time Mesh Size Gear Size No change - original data used 97.75 98.34 98.11 93.95 Data replaced by first stratified mediana 1.56 1.12 1.18 2.8 Data replaced by second stratified medianb 0.57 0.54 0.71 3.25 Records set to zero 0.12 - - - a Median values were calculated by stratifying trips based on hull number (vessel), gear type, FMP, year, and state, so that each unique combination of these variables had a matching median. b Median values were calculated by stratifying trips based on gear type, FMP group, year, and state, so that each unique combination of these variables had a matching median. That is, the same stratification as for the first median, except vessel identification information (hull number) was removed. Table 2. Percentage, by species, of landed weight (live) landed on main speciesa trips for that speciesb for U.S. Northeast and Mid-Atlantic bottom and mid-water trawl fisheries, 1996–2004
1996 1997 1998 1999 2000 2001 2002 2003 2004 Bottom Trawl (%) Cod 6.29 7.13 3.63 4.81 5.82 6.58 7.89 7.09 5.74 Dogfish, Spiny 90.43 86.83 90.60 83.91 95.14 59.45 81.60 66.10 39.61 Flounder, Winter 63.76 76.54 69.49 64.70 65.59 66.20 58.94 57.09 56.48 Flounder, Witch 31.53 27.22 33.16 29.33 29.16 26.17 36.10 41.90 36.84 Flounder, Yellowtail 52.88 60.22 65.12 71.34 73.49 68.53 62.34 67.01 79.53 Fluke 84.45 75.93 79.75 74.60 78.22 76.35 79.49 80.97 78.31 Haddock 4.17 29.39 51.35 65.01 67.58 60.69 64.97 62.08 67.36 Hake, Silver 90.13 88.59 84.67 88.10 90.73 88.92 86.43 85.70 84.19 Herring, Atlantic 95.09 73.07 86.39 66.33 93.17 97.08 81.14 61.66 82.87 Mackerel, Atlantic 91.34 92.91 93.94 94.18 85.39 85.01 92.24 93.98 93.44 Monkfish 63.18 66.09 63.58 68.37 59.81 60.94 59.11 69.26 64.74 Plaice, American 52.79 44.04 47.07 42.71 51.42 43.21 32.82 23.73 17.92 Scup 69.60 67.98 77.94 79.83 71.67 82.24 75.27 81.86 73.59 Skates 88.58 88.25 86.70 85.48 81.16 78.30 78.22 78.72 82.06 Squid, Illex 98.68 97.64 99.38 95.36 97.62 95.12 95.02 94.31 99.72 Squid, Loligo 83.12 87.29 89.64 89.40 89.82 87.95 91.96 89.22 90.82 Mid-water Trawl (%) Herring, Atlantic 99.75 99.84 99.64 99.71 99.54 100.00 99.40 99.67 99.43 Mackerel, Atlantic 89.26 95.27 95.99 91.73 92.03 99.98 98.60 98.90 99.88 a Main species for a trip is defined as the species with the largest total weight (live) of landings. b For example, in 1996, 6.29% of all cod landings were from trips where cod was the main species, defined as the greatest live weight kept. The remaining 93.71% of cod was landed on trips where another species was the “main species.”

26
Table 3. Total vessels and trips by year for bottom otter trawl fisheries in the U.S. Northeast and Mid-Atlantic, 1996–2004
Total Vessels Total Trips 1996 944 38,748 1997 874 36,656 1998 892 38,209 1999 829 36,460 2000 807 36,006 2001 791 34,751 2002 762 35,197 2003 751 32,443 2004 732 33,089
Table 4. Days fished by fishing regiona for the U.S. Northeast and Mid-Atlantic bottom trawl fishery, 1996–2004
Gulf of Maine
Georges Bank
North Southern
New England
South Southern
New England
Mid-Atlantic
Unknown Total
1996 15,806 5,871 12,896 33 2,328 447 37,381 1997 12,041 4,722 12,613 33 1,625 382 31,417 1998 11,463 4,926 16,609 25 2,712 419 32,154 1999 10,477 4,966 12,825 25 2,514 289 31,095 2000 10,334 5,521 9,264 34 2,041 147 27,341 2001 11,334 5,849 8,905 5 1,735 41 27,869 2002 10,010 5,472 7,818 2 2,219 7 25,528 2003 9,113 5,880 6,464 22 1,833 0 23,312 2004 8,262 5,565 6,926 12 1,522 37 22,324
a Fishing region boundaries are illustrated in Figure 7.
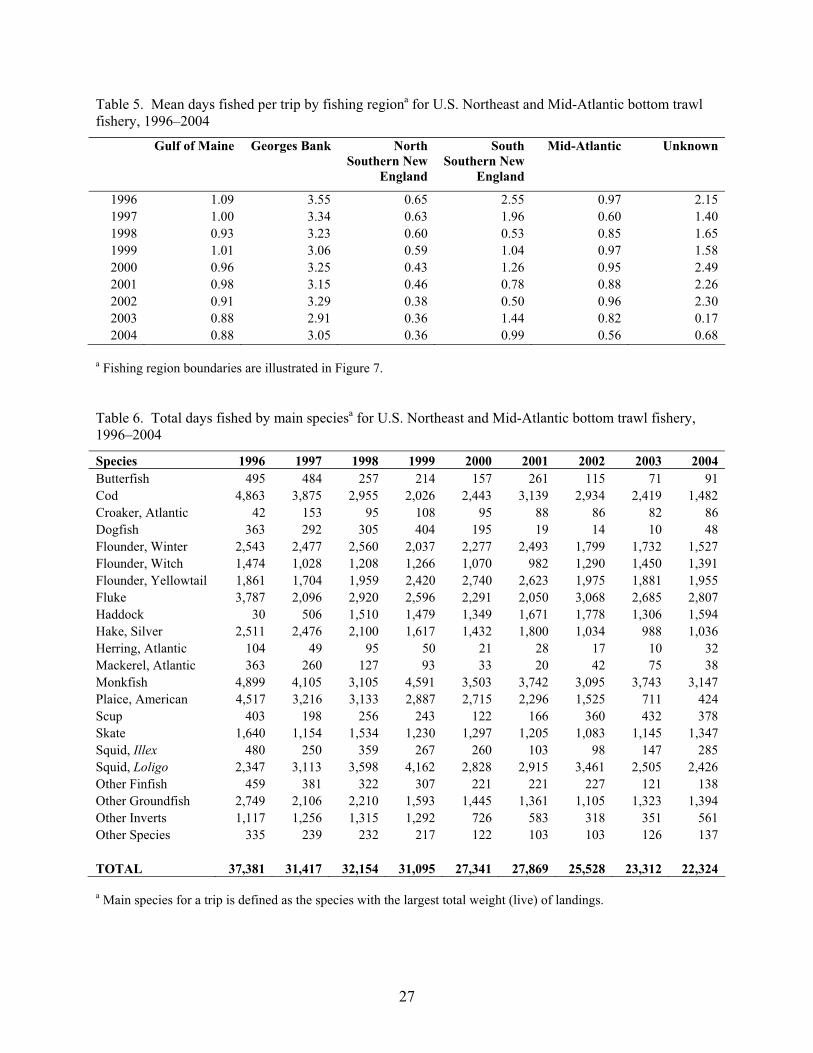
27
Table 5. Mean days fished per trip by fishing regiona for U.S. Northeast and Mid-Atlantic bottom trawl fishery, 1996–2004
Gulf of Maine Georges Bank North Southern New
England
South Southern New
England
Mid-Atlantic Unknown
1996 1.09 3.55 0.65 2.55 0.97 2.15 1997 1.00 3.34 0.63 1.96 0.60 1.40 1998 0.93 3.23 0.60 0.53 0.85 1.65 1999 1.01 3.06 0.59 1.04 0.97 1.58 2000 0.96 3.25 0.43 1.26 0.95 2.49 2001 0.98 3.15 0.46 0.78 0.88 2.26 2002 0.91 3.29 0.38 0.50 0.96 2.30 2003 0.88 2.91 0.36 1.44 0.82 0.17 2004 0.88 3.05 0.36 0.99 0.56 0.68
a Fishing region boundaries are illustrated in Figure 7. Table 6. Total days fished by main speciesa for U.S. Northeast and Mid-Atlantic bottom trawl fishery, 1996–2004
Species 1996 1997 1998 1999 2000 2001 2002 2003 2004 Butterfish 495 484 257 214 157 261 115 71 91 Cod 4,863 3,875 2,955 2,026 2,443 3,139 2,934 2,419 1,482 Croaker, Atlantic 42 153 95 108 95 88 86 82 86 Dogfish 363 292 305 404 195 19 14 10 48 Flounder, Winter 2,543 2,477 2,560 2,037 2,277 2,493 1,799 1,732 1,527 Flounder, Witch 1,474 1,028 1,208 1,266 1,070 982 1,290 1,450 1,391 Flounder, Yellowtail 1,861 1,704 1,959 2,420 2,740 2,623 1,975 1,881 1,955 Fluke 3,787 2,096 2,920 2,596 2,291 2,050 3,068 2,685 2,807 Haddock 30 506 1,510 1,479 1,349 1,671 1,778 1,306 1,594 Hake, Silver 2,511 2,476 2,100 1,617 1,432 1,800 1,034 988 1,036 Herring, Atlantic 104 49 95 50 21 28 17 10 32 Mackerel, Atlantic 363 260 127 93 33 20 42 75 38 Monkfish 4,899 4,105 3,105 4,591 3,503 3,742 3,095 3,743 3,147 Plaice, American 4,517 3,216 3,133 2,887 2,715 2,296 1,525 711 424 Scup 403 198 256 243 122 166 360 432 378 Skate 1,640 1,154 1,534 1,230 1,297 1,205 1,083 1,145 1,347 Squid, Illex 480 250 359 267 260 103 98 147 285 Squid, Loligo 2,347 3,113 3,598 4,162 2,828 2,915 3,461 2,505 2,426 Other Finfish 459 381 322 307 221 221 227 121 138 Other Groundfish 2,749 2,106 2,210 1,593 1,445 1,361 1,105 1,323 1,394 Other Inverts 1,117 1,256 1,315 1,292 726 583 318 351 561 Other Species 335 239 232 217 122 103 103 126 137 TOTAL 37,381 31,417 32,154 31,095 27,341 27,869 25,528 23,312 22,324 a Main species for a trip is defined as the species with the largest total weight (live) of landings.
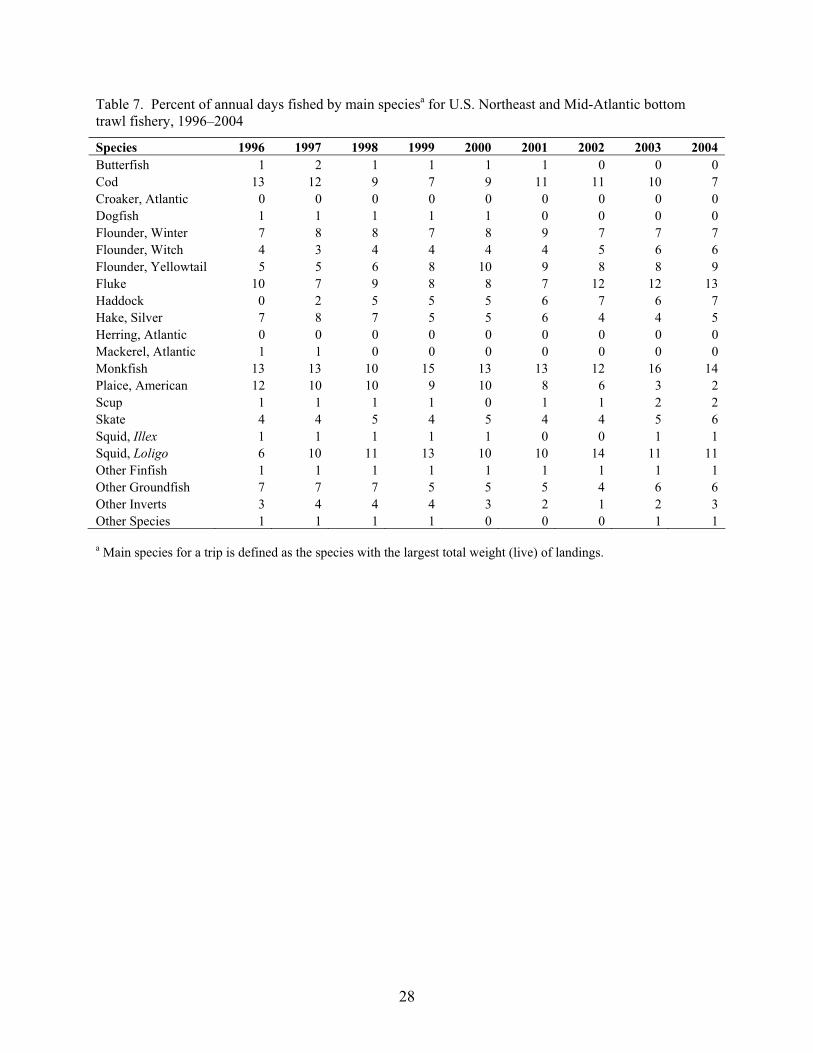
28
Table 7. Percent of annual days fished by main speciesa for U.S. Northeast and Mid-Atlantic bottom trawl fishery, 1996–2004 Species 1996 1997 1998 1999 2000 2001 2002 2003 2004 Butterfish 1 2 1 1 1 1 0 0 0 Cod 13 12 9 7 9 11 11 10 7 Croaker, Atlantic 0 0 0 0 0 0 0 0 0 Dogfish 1 1 1 1 1 0 0 0 0 Flounder, Winter 7 8 8 7 8 9 7 7 7 Flounder, Witch 4 3 4 4 4 4 5 6 6 Flounder, Yellowtail 5 5 6 8 10 9 8 8 9 Fluke 10 7 9 8 8 7 12 12 13 Haddock 0 2 5 5 5 6 7 6 7 Hake, Silver 7 8 7 5 5 6 4 4 5 Herring, Atlantic 0 0 0 0 0 0 0 0 0 Mackerel, Atlantic 1 1 0 0 0 0 0 0 0 Monkfish 13 13 10 15 13 13 12 16 14 Plaice, American 12 10 10 9 10 8 6 3 2 Scup 1 1 1 1 0 1 1 2 2 Skate 4 4 5 4 5 4 4 5 6 Squid, Illex 1 1 1 1 1 0 0 1 1 Squid, Loligo 6 10 11 13 10 10 14 11 11 Other Finfish 1 1 1 1 1 1 1 1 1 Other Groundfish 7 7 7 5 5 5 4 6 6 Other Inverts 3 4 4 4 3 2 1 2 3 Other Species 1 1 1 1 0 0 0 1 1 a Main species for a trip is defined as the species with the largest total weight (live) of landings.

29
Table 8. Total number of hauls by main speciesa for U.S. Northeast and Mid-Atlantic bottom trawl fishery, 1996–2004
Species 1996 1997 1998 1999 2000 2001 2002 2003 2004 Butterfish 6,311 6,446 3,125 2,619 2,039 3,556 1,574 914 1,412 Cod 31,588 24,140 20,206 14,341 17,987 24,082 21,520 18,027 10,875 Croaker, Atlantic 722 2,117 1,476 1,562 1,538 1,288 1,469 1,418 1,688 Dogfish 5,195 3,535 3,936 4,372 2,867 288 253 103 583 Flounder, Winter 25,776 24,718 25,215 20,616 22,539 24,324 18,394 16,829 15,197 Flounder, Witch 7,753 5,304 6,200 6,590 5,968 5,764 7,703 9,136 7,866 Flounder, Yellowtail 15,283 15,295 16,502 20,025 22,574 21,801 17,064 15,910 16,587 Fluke 37,952 23,364 28,617 25,371 22,445 21,499 30,804 27,962 31,023 Haddock 182 2,789 8,849 8,588 8,704 10,182 12,189 9,462 11,361 Hake, Silver 25,031 23,972 20,620 16,045 13,895 16,838 10,201 9,397 9,773 Herring, Atlantic 1,274 725 1,254 809 347 359 315 153 530 Mackerel, Atlantic 3,884 2,804 1,381 987 398 219 626 878 481 Monkfish 28,240 23,233 17,114 24,091 18,346 19,685 15,977 19,391 16,505 Plaice, American 23,159 16,995 16,019 14,662 13,714 11,466 7,262 3,740 2,418 Scup 4,551 2,428 3,124 2,997 1,593 2,481 4,987 6,216 5,430 Skate 16,601 12,169 15,681 13,303 13,427 12,618 11,688 11,573 13,346 Squid, Illex 4,021 2,180 3,172 1,996 1,918 815 848 1,262 2,899 Squid, Loligo 22,885 30,087 32,603 37,358 26,879 25,861 31,164 21,793 21,847 Other Finfish 4,997 4,282 3,757 3,485 2,635 2,993 3,093 1,729 2,074 Other Groundfish 19,785 14,993 15,681 12,144 11,167 9,874 7,161 8,476 8,237 Other Inverts 13,230 14,746 13,438 13,712 8,353 8,789 4,629 5,527 8,924 Other Species 2,821 2,393 2,378 2,002 1,492 1,308 1,357 1,660 1,976
Total 301,241 258,715 260,348 247,675 220,825 226,090 210,278 191,556 191,032
a Main species for a trip is defined as the species with the largest total weight (live) of landings.
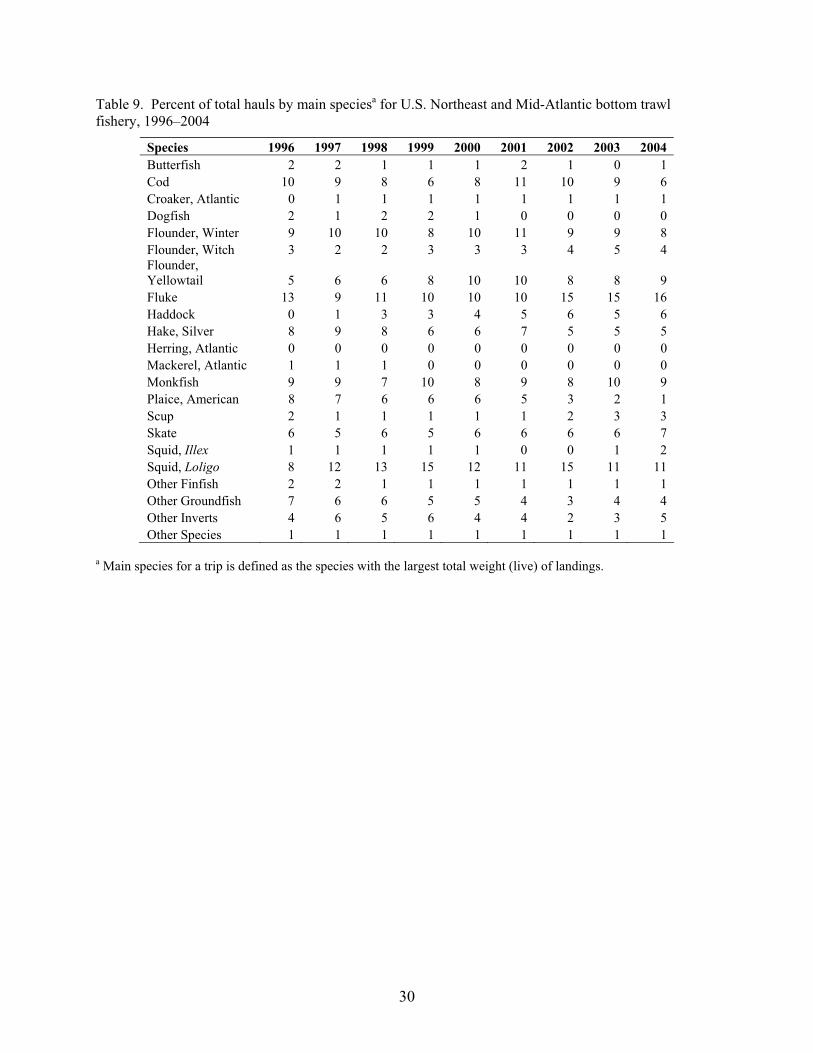
30
Table 9. Percent of total hauls by main speciesa for U.S. Northeast and Mid-Atlantic bottom trawl fishery, 1996–2004
Species 1996 1997 1998 1999 2000 2001 2002 2003 2004 Butterfish 2 2 1 1 1 2 1 0 1 Cod 10 9 8 6 8 11 10 9 6 Croaker, Atlantic 0 1 1 1 1 1 1 1 1 Dogfish 2 1 2 2 1 0 0 0 0 Flounder, Winter 9 10 10 8 10 11 9 9 8 Flounder, Witch 3 2 2 3 3 3 4 5 4 Flounder, Yellowtail 5 6 6 8 10 10 8 8 9 Fluke 13 9 11 10 10 10 15 15 16 Haddock 0 1 3 3 4 5 6 5 6 Hake, Silver 8 9 8 6 6 7 5 5 5 Herring, Atlantic 0 0 0 0 0 0 0 0 0 Mackerel, Atlantic 1 1 1 0 0 0 0 0 0 Monkfish 9 9 7 10 8 9 8 10 9 Plaice, American 8 7 6 6 6 5 3 2 1 Scup 2 1 1 1 1 1 2 3 3 Skate 6 5 6 5 6 6 6 6 7 Squid, Illex 1 1 1 1 1 0 0 1 2 Squid, Loligo 8 12 13 15 12 11 15 11 11 Other Finfish 2 2 1 1 1 1 1 1 1 Other Groundfish 7 6 6 5 5 4 3 4 4 Other Inverts 4 6 5 6 4 4 2 3 5 Other Species 1 1 1 1 1 1 1 1 1
a Main species for a trip is defined as the species with the largest total weight (live) of landings.

31
Table 10. Days absent by fishing regiona for U.S. Northeast and Mid-Atlantic bottom trawl fishery, 1996–2004
Gulf of Maine
Georges Bank
North Southern New England
South Southern New England
Mid-Atlantic
Unknown Total
1996 35,635 12,839 44,805 98 7,294 1,119 101,790 1997 28,273 10,286 42,215 90 6,385 1,059 88,308 1998 28,167 11,082 43,145 105 9,610 1,180 93,289 1999 25,261 11,572 43,160 90 8,347 790 89,220 2000 26,842 12,482 35,936 127 7,039 307 82,733 2001 30,093 13,562 34,231 35 6,246 128 84,295 2002 25,716 12,538 33,405 11 7,420 320 79,410 2003 23,506 14,046 29,313 69 6,941 329 74,204 2004 20,861 13,085 33,074 51 7,600 181 74,852
a Fishing region boundaries are illustrated in Figure 7. Table 11. Mean and CV of days absent per trip by month for U.S. Northeast and Mid-Atlantic bottom trawl fishery, over 1996–2004
Mean CV January 3.25 80.00 February 3.49 78.25 March 3.40 135.70 April 2.95 97.04 May 2.03 149.55 June 2.02 110.88 July 1.92 107.80 August 1.99 111.63 September 2.14 105.22 October 2.37 105.04 November 2.32 104.89 December 2.59 95.64
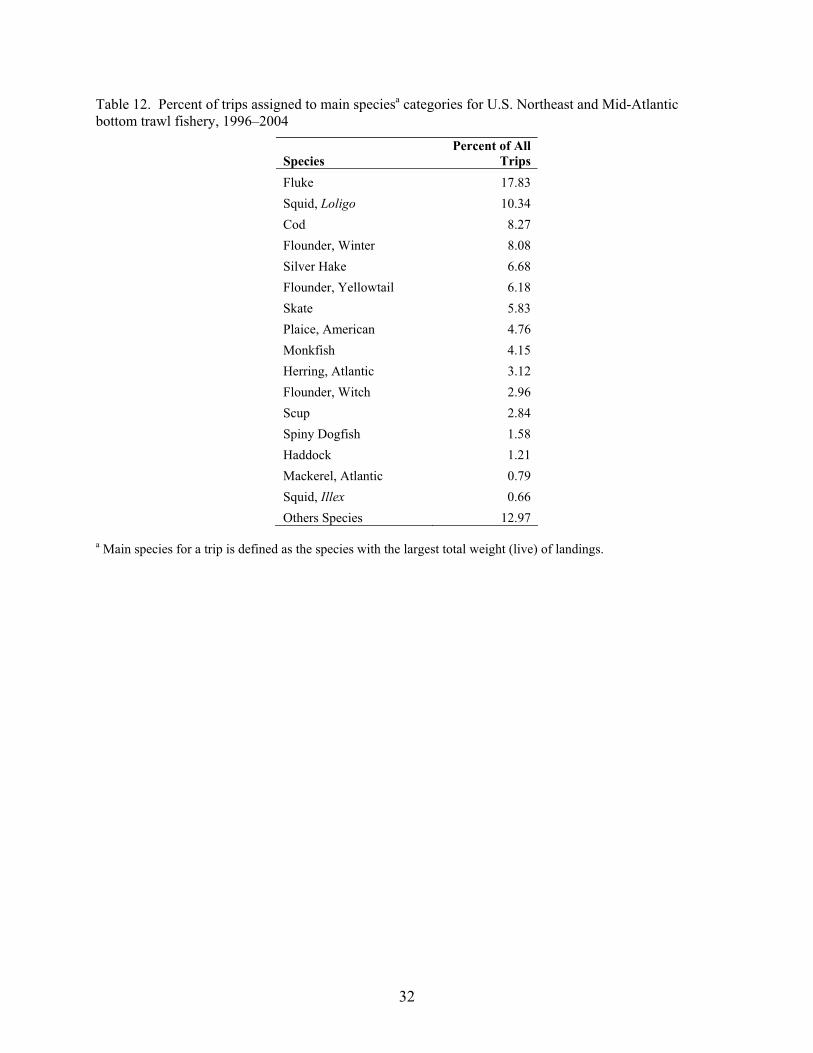
32
Table 12. Percent of trips assigned to main speciesa categories for U.S. Northeast and Mid-Atlantic bottom trawl fishery, 1996–2004
SpeciesPercent of All
TripsFluke 17.83 Squid, Loligo 10.34 Cod 8.27 Flounder, Winter 8.08 Silver Hake 6.68 Flounder, Yellowtail 6.18 Skate 5.83 Plaice, American 4.76 Monkfish 4.15 Herring, Atlantic 3.12 Flounder, Witch 2.96 Scup 2.84 Spiny Dogfish 1.58 Haddock 1.21 Mackerel, Atlantic 0.79 Squid, Illex 0.66 Others Species 12.97
a Main species for a trip is defined as the species with the largest total weight (live) of landings.
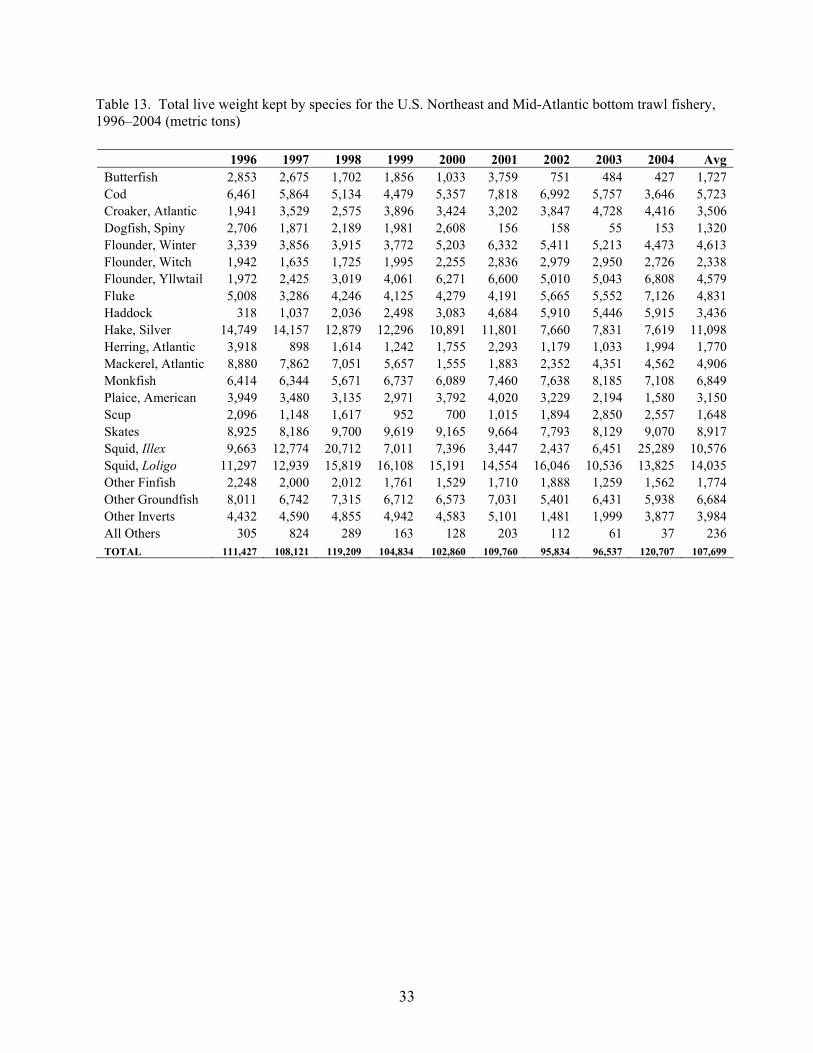
33
Table 13. Total live weight kept by species for the U.S. Northeast and Mid-Atlantic bottom trawl fishery, 1996–2004 (metric tons)
1996 1997 1998 1999 2000 2001 2002 2003 2004 Avg Butterfish 2,853 2,675 1,702 1,856 1,033 3,759 751 484 427 1,727 Cod 6,461 5,864 5,134 4,479 5,357 7,818 6,992 5,757 3,646 5,723 Croaker, Atlantic 1,941 3,529 2,575 3,896 3,424 3,202 3,847 4,728 4,416 3,506 Dogfish, Spiny 2,706 1,871 2,189 1,981 2,608 156 158 55 153 1,320 Flounder, Winter 3,339 3,856 3,915 3,772 5,203 6,332 5,411 5,213 4,473 4,613 Flounder, Witch 1,942 1,635 1,725 1,995 2,255 2,836 2,979 2,950 2,726 2,338 Flounder, Yllwtail 1,972 2,425 3,019 4,061 6,271 6,600 5,010 5,043 6,808 4,579 Fluke 5,008 3,286 4,246 4,125 4,279 4,191 5,665 5,552 7,126 4,831 Haddock 318 1,037 2,036 2,498 3,083 4,684 5,910 5,446 5,915 3,436 Hake, Silver 14,749 14,157 12,879 12,296 10,891 11,801 7,660 7,831 7,619 11,098 Herring, Atlantic 3,918 898 1,614 1,242 1,755 2,293 1,179 1,033 1,994 1,770 Mackerel, Atlantic 8,880 7,862 7,051 5,657 1,555 1,883 2,352 4,351 4,562 4,906 Monkfish 6,414 6,344 5,671 6,737 6,089 7,460 7,638 8,185 7,108 6,849 Plaice, American 3,949 3,480 3,135 2,971 3,792 4,020 3,229 2,194 1,580 3,150 Scup 2,096 1,148 1,617 952 700 1,015 1,894 2,850 2,557 1,648 Skates 8,925 8,186 9,700 9,619 9,165 9,664 7,793 8,129 9,070 8,917 Squid, Illex 9,663 12,774 20,712 7,011 7,396 3,447 2,437 6,451 25,289 10,576 Squid, Loligo 11,297 12,939 15,819 16,108 15,191 14,554 16,046 10,536 13,825 14,035 Other Finfish 2,248 2,000 2,012 1,761 1,529 1,710 1,888 1,259 1,562 1,774 Other Groundfish 8,011 6,742 7,315 6,712 6,573 7,031 5,401 6,431 5,938 6,684 Other Inverts 4,432 4,590 4,855 4,942 4,583 5,101 1,481 1,999 3,877 3,984 All Others 305 824 289 163 128 203 112 61 37 236 TOTAL 111,427 108,121 119,209 104,834 102,860 109,760 95,834 96,537 120,707 107,699
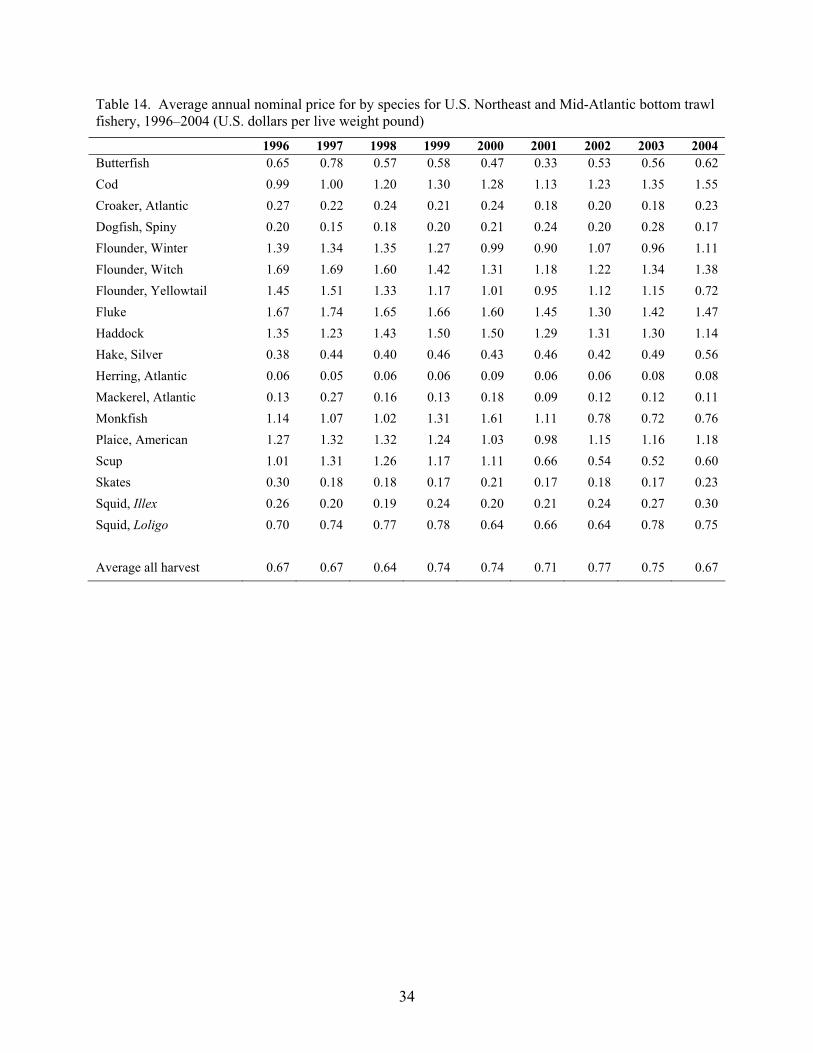
34
Table 14. Average annual nominal price for by species for U.S. Northeast and Mid-Atlantic bottom trawl fishery, 1996–2004 (U.S. dollars per live weight pound)
1996 1997 1998 1999 2000 2001 2002 2003 2004 Butterfish 0.65 0.78 0.57 0.58 0.47 0.33 0.53 0.56 0.62 Cod 0.99 1.00 1.20 1.30 1.28 1.13 1.23 1.35 1.55 Croaker, Atlantic 0.27 0.22 0.24 0.21 0.24 0.18 0.20 0.18 0.23 Dogfish, Spiny 0.20 0.15 0.18 0.20 0.21 0.24 0.20 0.28 0.17 Flounder, Winter 1.39 1.34 1.35 1.27 0.99 0.90 1.07 0.96 1.11 Flounder, Witch 1.69 1.69 1.60 1.42 1.31 1.18 1.22 1.34 1.38 Flounder, Yellowtail 1.45 1.51 1.33 1.17 1.01 0.95 1.12 1.15 0.72 Fluke 1.67 1.74 1.65 1.66 1.60 1.45 1.30 1.42 1.47 Haddock 1.35 1.23 1.43 1.50 1.50 1.29 1.31 1.30 1.14 Hake, Silver 0.38 0.44 0.40 0.46 0.43 0.46 0.42 0.49 0.56 Herring, Atlantic 0.06 0.05 0.06 0.06 0.09 0.06 0.06 0.08 0.08 Mackerel, Atlantic 0.13 0.27 0.16 0.13 0.18 0.09 0.12 0.12 0.11 Monkfish 1.14 1.07 1.02 1.31 1.61 1.11 0.78 0.72 0.76 Plaice, American 1.27 1.32 1.32 1.24 1.03 0.98 1.15 1.16 1.18 Scup 1.01 1.31 1.26 1.17 1.11 0.66 0.54 0.52 0.60 Skates 0.30 0.18 0.18 0.17 0.21 0.17 0.18 0.17 0.23 Squid, Illex 0.26 0.20 0.19 0.24 0.20 0.21 0.24 0.27 0.30 Squid, Loligo 0.70 0.74 0.77 0.78 0.64 0.66 0.64 0.78 0.75 Average all harvest 0.67 0.67 0.64 0.74 0.74 0.71 0.77 0.75 0.67
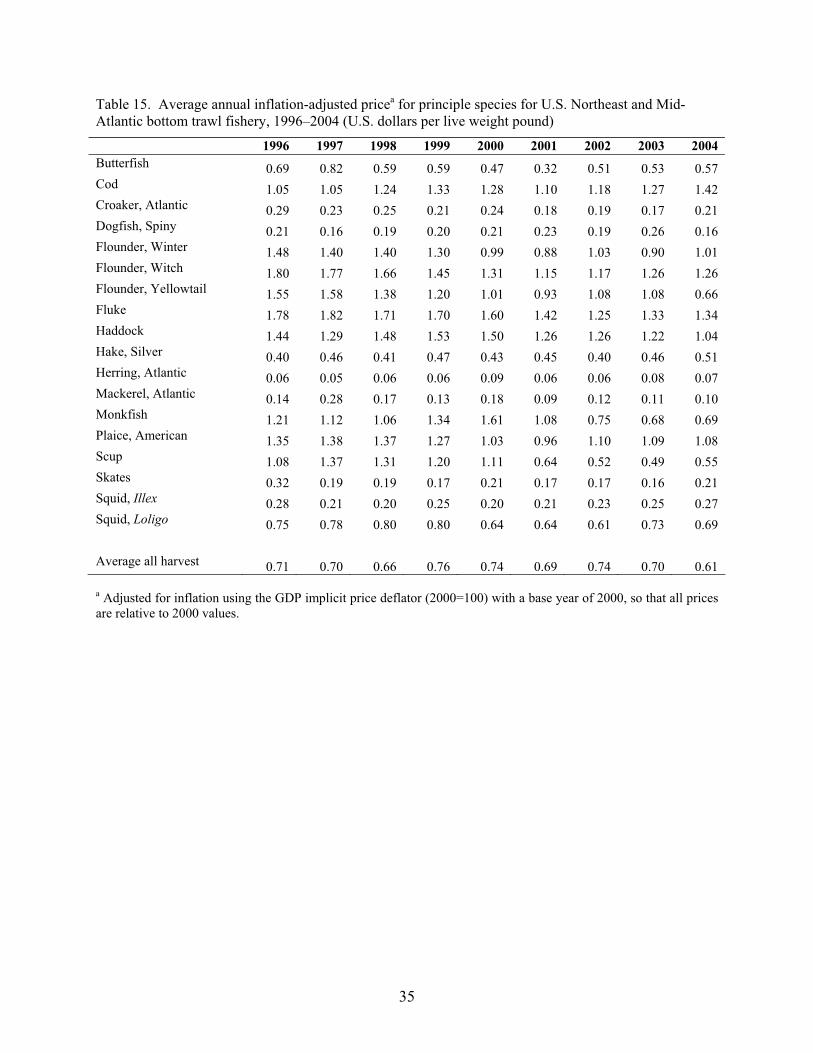
35
Table 15. Average annual inflation-adjusted pricea for principle species for U.S. Northeast and Mid-Atlantic bottom trawl fishery, 1996–2004 (U.S. dollars per live weight pound)
1996 1997 1998 1999 2000 2001 2002 2003 2004 Butterfish 0.69 0.82 0.59 0.59 0.47 0.32 0.51 0.53 0.57 Cod 1.05 1.05 1.24 1.33 1.28 1.10 1.18 1.27 1.42 Croaker, Atlantic 0.29 0.23 0.25 0.21 0.24 0.18 0.19 0.17 0.21 Dogfish, Spiny 0.21 0.16 0.19 0.20 0.21 0.23 0.19 0.26 0.16 Flounder, Winter 1.48 1.40 1.40 1.30 0.99 0.88 1.03 0.90 1.01 Flounder, Witch 1.80 1.77 1.66 1.45 1.31 1.15 1.17 1.26 1.26 Flounder, Yellowtail 1.55 1.58 1.38 1.20 1.01 0.93 1.08 1.08 0.66 Fluke 1.78 1.82 1.71 1.70 1.60 1.42 1.25 1.33 1.34 Haddock 1.44 1.29 1.48 1.53 1.50 1.26 1.26 1.22 1.04 Hake, Silver 0.40 0.46 0.41 0.47 0.43 0.45 0.40 0.46 0.51 Herring, Atlantic 0.06 0.05 0.06 0.06 0.09 0.06 0.06 0.08 0.07 Mackerel, Atlantic 0.14 0.28 0.17 0.13 0.18 0.09 0.12 0.11 0.10 Monkfish 1.21 1.12 1.06 1.34 1.61 1.08 0.75 0.68 0.69 Plaice, American 1.35 1.38 1.37 1.27 1.03 0.96 1.10 1.09 1.08 Scup 1.08 1.37 1.31 1.20 1.11 0.64 0.52 0.49 0.55 Skates 0.32 0.19 0.19 0.17 0.21 0.17 0.17 0.16 0.21 Squid, Illex 0.28 0.21 0.20 0.25 0.20 0.21 0.23 0.25 0.27 Squid, Loligo 0.75 0.78 0.80 0.80 0.64 0.64 0.61 0.73 0.69 Average all harvest 0.71 0.70 0.66 0.76 0.74 0.69 0.74 0.70 0.61 a Adjusted for inflation using the GDP implicit price deflator (2000=100) with a base year of 2000, so that all prices are relative to 2000 values.
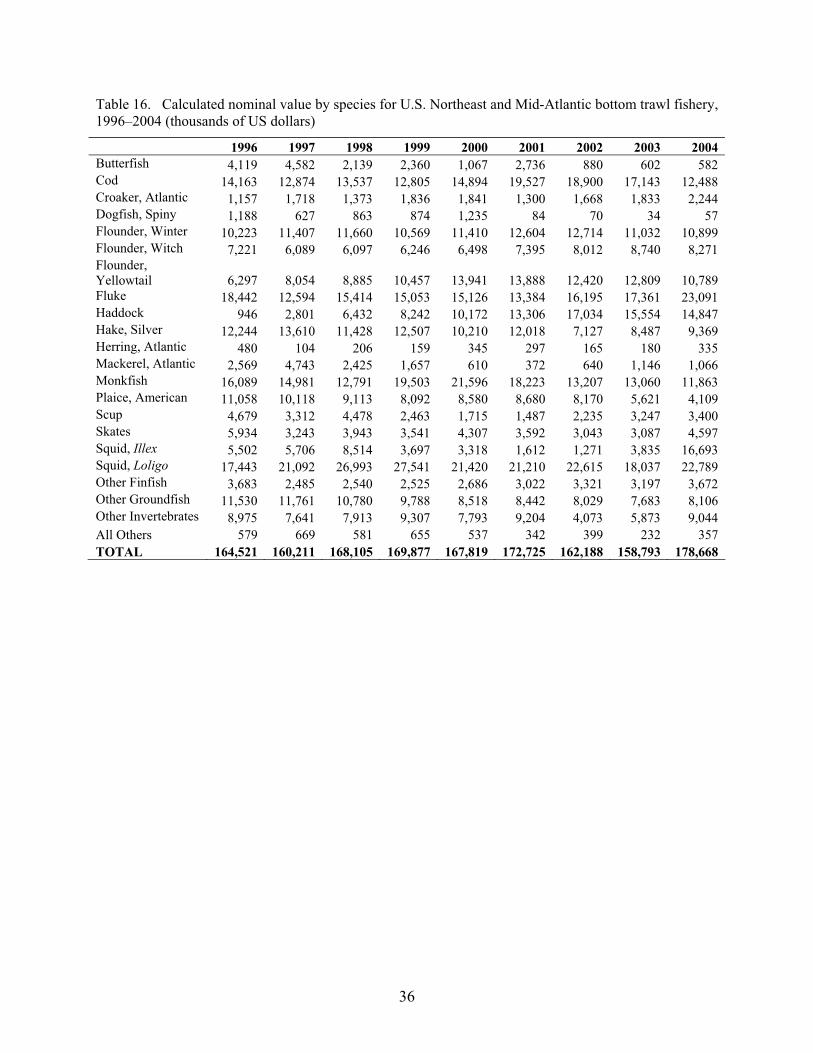
36
Table 16. Calculated nominal value by species for U.S. Northeast and Mid-Atlantic bottom trawl fishery, 1996–2004 (thousands of US dollars)
1996 1997 1998 1999 2000 2001 2002 2003 2004 Butterfish 4,119 4,582 2,139 2,360 1,067 2,736 880 602 582 Cod 14,163 12,874 13,537 12,805 14,894 19,527 18,900 17,143 12,488 Croaker, Atlantic 1,157 1,718 1,373 1,836 1,841 1,300 1,668 1,833 2,244 Dogfish, Spiny 1,188 627 863 874 1,235 84 70 34 57 Flounder, Winter 10,223 11,407 11,660 10,569 11,410 12,604 12,714 11,032 10,899 Flounder, Witch 7,221 6,089 6,097 6,246 6,498 7,395 8,012 8,740 8,271 Flounder, Yellowtail 6,297 8,054 8,885 10,457 13,941 13,888 12,420 12,809 10,789 Fluke 18,442 12,594 15,414 15,053 15,126 13,384 16,195 17,361 23,091 Haddock 946 2,801 6,432 8,242 10,172 13,306 17,034 15,554 14,847 Hake, Silver 12,244 13,610 11,428 12,507 10,210 12,018 7,127 8,487 9,369 Herring, Atlantic 480 104 206 159 345 297 165 180 335 Mackerel, Atlantic 2,569 4,743 2,425 1,657 610 372 640 1,146 1,066 Monkfish 16,089 14,981 12,791 19,503 21,596 18,223 13,207 13,060 11,863 Plaice, American 11,058 10,118 9,113 8,092 8,580 8,680 8,170 5,621 4,109 Scup 4,679 3,312 4,478 2,463 1,715 1,487 2,235 3,247 3,400 Skates 5,934 3,243 3,943 3,541 4,307 3,592 3,043 3,087 4,597 Squid, Illex 5,502 5,706 8,514 3,697 3,318 1,612 1,271 3,835 16,693 Squid, Loligo 17,443 21,092 26,993 27,541 21,420 21,210 22,615 18,037 22,789 Other Finfish 3,683 2,485 2,540 2,525 2,686 3,022 3,321 3,197 3,672 Other Groundfish 11,530 11,761 10,780 9,788 8,518 8,442 8,029 7,683 8,106 Other Invertebrates 8,975 7,641 7,913 9,307 7,793 9,204 4,073 5,873 9,044 All Others 579 669 581 655 537 342 399 232 357 TOTAL 164,521 160,211 168,105 169,877 167,819 172,725 162,188 158,793 178,668

37
Table 17. Inflation-adjusteda calculated value by species for U.S. Northeast and Mid-Atlantic bottom trawl fishery, 1996–2004 (thousands of US dollars)
1996 1997 1998 1999 2000 2001 2002 2003 2004 Avg Butterfish 4,389 4,802 2,217 2,412 1,067 2,672 845 566 532 2,167 Cod 15,092 13,493 14,033 13,085 14,894 19,070 18,141 16,112 11,413 15,037 Croaker, Atlantic 1,233 1,801 1,423 1,876 1,841 1,270 1,601 1,723 2,051 1,646 Dogfish, Spiny 1,266 657 895 893 1,235 82 67 32 52 575 Flounder, Winter 10,893 11,956 12,087 10,800 11,410 12,309 12,203 10,369 9,961 11,332 Flounder, Witch 7,694 6,382 6,320 6,382 6,498 7,222 7,690 8,215 7,559 7,107 Flounder, Yellowtail 6,710 8,441 9,210 10,685 13,941 13,563 11,921 12,039 9,860 10,708 Fluke 19,651 13,200 15,978 15,382 15,126 13,070 15,544 16,317 21,103 16,153 Haddock 1,008 2,936 6,667 8,422 10,172 12,994 16,350 14,619 13,569 9,637 Hake, Silver 13,047 14,265 11,846 12,780 10,210 11,736 6,841 7,977 8,562 10,807 Herring, Atlantic 511 109 214 162 345 290 158 169 306 252 Mackerel, Atlantic 2,737 4,971 2,514 1,693 610 363 614 1,077 974 1,728 Monkfish 17,144 15,702 13,259 19,929 21,597 17,796 12,676 12,275 10,842 15,691 Plaice, American 11,783 10,605 9,447 8,269 8,580 8,477 7,842 5,283 3,755 8,227 Scup 4,986 3,471 4,642 2,517 1,715 1,452 2,145 3,052 3,107 3,010 Skates 6,323 3,399 4,087 3,618 4,307 3,508 2,921 2,901 4,201 3,918 Squid, Illex 5,863 5,981 8,826 3,778 3,318 1,574 1,220 3,604 15,256 5,491 Squid, Loligo 18,587 22,107 27,981 28,143 21,421 20,713 21,707 16,953 20,827 22,049 Other Finfish 3,924 2,605 2,633 2,580 2,686 2,951 3,188 3,005 3,356 2,992 Other Groundfish 12,286 12,327 11,175 10,002 8,518 8,244 7,706 7,221 7,408 9,432 Other Invertebrates 9,563 8,009 8,203 9,510 7,793 8,988 3,909 5,520 8,265 7,751 All Others 617 701 602 669 537 334 383 218 326 488 TOTAL 175,308 167,918 174,260 173,588 167,824 168,678 155,673 149,246 163,288 166,198 a Adjusted for inflation using the GDP implicit price deflator (2000=100) with a base year of 2000, so that all prices are relative to 2000 values.

38
Table 18. Total landings (metric ton) and calculated value (thousand of dollars US) by fishing regiona for U.S. Northeast and Mid-Atlantic bottom trawl fishery, 1996–2004
a Fishing region boundaries are illustrated in Figure 7. b Adjusted for inflation using the GDP implicit price deflator (2000=100) with a base year of 2000, so that all prices are relative to 2000 values.
Gulf of
MaineGeorges
BankNorth
Southern New
England
South Southern
New England
Mid-Atlantic
Unknown Total
Total landings live weight (tonnes) 1996 24,967 15,452 55,707 164 13,876 1,261 111,427 1997 19,819 12,588 59,251 118 15,238 1,108 108,121 1998 18,867 14,966 64,580 94 18,664 2,038 119,209 1999 17,905 17,992 50,735 91 16,948 1,164 104,834 2000 22,142 19,332 45,707 197 14,958 524 102,860 2001 28,923 24,648 43,909 70 12,101 108 109,760 2002 25,781 22,320 37,066 5 10,639 22 95,834 2003 22,913 27,754 31,995 65 13,808 2 96,537 2004 20,538 26,725 58,630 109 14,511 194 120,707 Avg 22,428 20,198 49,731 102 14,527 713 107,699
Total nominal calculated value ($ ‘000) 1996 48,882 25,634 69,489 338 18,094 2,083 164,521 1997 43,675 24,644 74,990 168 14,798 1,938 160,213 1998 42,818 27,620 75,611 166 19,224 2,667 168,106 1999 42,887 34,967 71,774 175 18,116 1,958 169,877 2000 50,927 39,501 58,790 227 17,335 1,036 167,817 2001 57,802 44,160 55,861 71 14,695 138 172,725 2002 55,684 45,327 47,895 13 13,235 31 162,184 2003 48,528 52,459 42,290 111 15,401 5 158,794 2004 42,824 48,455 70,697 134 16,223 335 178,668
Total inflation adjustedb calculated value ($ ‘000, 2000=100) 1996 52,087 27,315 74,045 360 19,280 2,220 175,308 1997 45,776 25,829 78,598 176 15,510 2,031 167,921 1998 44,386 28,631 78,379 172 19,928 2,764 174,261 1999 43,824 35,731 73,342 179 18,512 2,001 173,588 2000 50,929 39,502 58,792 227 17,335 1,036 167,822 2001 56,447 43,125 54,552 69 14,351 134 168,679 2002 53,447 43,507 45,971 12 12,703 30 155,669 2003 45,611 49,305 39,748 105 14,475 5 149,247 2004 39,138 44,284 64,611 123 14,826 306 163,288
Avg 47,961 37,470 63,115 158 16,324 1,170 166,198

39
Table 19. Average annual landings by species by fishing regiona for U.S. Northeast and Mid-Atlantic bottom trawl fishery, 1996–2004 (live weight, metric tons)
a Fishing region boundaries are illustrated in Figure 7.
Gulf of
MaineGeorges
BankNorth
Southern New
England
South Southern
New England
Mid-Atlantic
Unknown Total
Bluefish 10 3 334 1 121 1 469 Butterfish 9 184 1,344 3 157 30 1,727 Cod 3,276 2,169 224 0 14 41 5,723 Croaker, Atlantic 3 3 241 0 3,257 3 3,506 Dogfish, Spiny 306 8 846 3 153 4 1,320 Flounder, Winter 1,826 1,514 1,239 0 12 21 4,613 Flounder, Witch 1,741 525 56 0 2 14 2,338 Flounder, Yllwtail 1,223 2,612 713 0 6 24 4,579 Fluke 26 76 2,429 15 2,264 22 4,831 Haddock 1,733 1,623 64 0 1 15 3,436 Hake, Silver 1,177 4,007 5,772 6 65 72 11,098 Herring, Atlantic 479 171 837 0 279 4 1,770 Mackerel, Atlantic 12 82 3,258 6 1,502 46 4,906 Monkfish 3,219 1,789 1,700 2 78 62 6,849 Plaice, American 2,290 805 30 0 2 23 3,150 Scup 2 6 1,513 3 119 5 1,648 Shad 12 0 126 0 10 0 148 Skates 1,326 1,590 5,814 5 157 26 8,917 Squid, Illex 2 45 7,290 13 3,123 103 10,576 Squid, Loligo 42 1,287 11,191 37 1,348 131 14,035 Other finfish 31 19 627 2 617 9 1,306 Other groundfish 3,442 1,332 1,786 1 78 43 6,684 Other pelagics 4 5 13 0 63 0 85 Other invertebrates 238 343 2,281 4 1,099 20 3,984 All others 0 0 1 0 0 0 1 Total Harvest 22,428 20,198 49,731 102 14,527 720 107,697

40
Table 20. Total landings and calculated value by state of landing for U.S. Northeast and Mid-Atlantic bottom trawl fishery, 1996–2004
1996 1997 1998 1999 2000 2001 2002 2003 2004 Avg Landings in live weight (metric tons)Maine 9,218 7,265 6,139 6,169 7,746 10,169 8,996 8,721 7,374 7,977 New Hampshire 791 717 827 618 739 895 899 657 810 773 Massachusetts 28,851 25,014 26,738 28,616 31,173 38,237 36,414 36,169 37,335 32,061 Rhode Island 28,093 34,646 33,779 28,745 25,460 27,155 23,319 25,145 31,510 28,650 Connecticut 4,266 3,821 3,591 4,837 4,857 4,514 3,033 3,110 2,971 3,889 New York 10,684 11,922 13,581 12,728 11,861 12,826 9,322 6,518 8,373 10,868 New Jersey 20,321 16,060 26,254 14,306 12,847 8,741 5,849 6,679 20,510 14,619 Maryland 1,142 990 616 593 622 499 613 416 609 678 Virginia 3,934 3,359 3,581 3,779 3,333 2,643 2,327 2,792 3,935 3,298 North Carolina 4,125 4,100 4,105 4,403 4,225 4,065 5,063 6,308 7,279 4,853 TOTAL 111,425 107,894 119,211 104,794 102,863 109,744 95,835 96,515 120,706 107,665 Nominal calculated value ($ ‘000 nominal) Maine 18,884 16,716 14,863 15,948 19,802 21,017 19,212 17,171 15,962 New Hampshire
1,201 974 1,182 923 1,682 1,698 1,954 1,366 1,744
Massachusetts 56,805 53,990 57,366 64,904 68,956 77,701 78,459 76,238 71,171 Rhode Island 32,223 38,415 36,176 35,883 28,452 29,244 25,453 26,235 32,435 Connecticut 5,067 4,790 4,508 5,573 6,134 5,643 3,750 3,797 4,019 New York 14,257 18,036 18,840 18,868 16,482 17,313 12,874 10,675 14,143 New Jersey 21,660 17,947 23,053 15,987 13,688 10,225 9,279 9,573 19,725 Maryland 1,365 1,015 751 727 909 791 850 833 1,133 Virginia 4,925 4,181 5,363 5,781 5,407 4,233 4,205 5,543 7,929 North Carolina
8,134 3,925 6,004 5,218 6,304 4,841 6,148 7,217 9,569
TOTAL 164,521 159,989 168,106 169,812 167,816 172,706 162,184 158,648 177,830 Inflation adjusteda calculated value ($ '000 adjusted for inflation with 2000=100)Maine 20,122 17,520 15,407 16,296 19,803 20,525 18,440 16,139 14,588 17,649 New Hampshire 1,280 1,021 1,225 943 1,682 1,658 1,876 1,284 1,594 1,396 Massachusetts 60,529 56,587 59,466 66,322 68,958 75,881 75,307 71,654 65,044 66,639 Rhode Island 34,336 40,263 37,501 36,667 28,453 28,559 24,431 24,658 29,643 31,612 Connecticut 5,399 5,020 4,673 5,695 6,134 5,511 3,599 3,569 3,673 4,808 New York 15,192 18,904 19,530 19,280 16,482 16,907 12,357 10,033 12,926 15,735 New Jersey 23,080 18,810 23,897 16,336 13,688 9,985 8,906 8,997 18,027 15,748 Maryland 1,454 1,064 778 743 909 772 816 783 1,035 928 Virginia 5,248 4,382 5,559 5,907 5,407 4,134 4,036 5,210 7,246 5,237 North Carolina 8,667 4,114 6,224 5,332 6,304 4,728 5,901 6,783 8,745 6,311 TOTAL 175,308 167,686 174,261 173,522 167,821 168,660 155,669 149,109 162,522 166,062 a Adjusted for inflation using the GDP implicit price deflator (2000=100) with a base year of 2000, so that all prices are relative to 2000 values.

41
Table 21. Average values per vessel including number of trips, days absent, days fished, landings per unit of effort, and value, for U.S. Northeast and Mid-Atlantic bottom trawl fishery, 1996–2004 (CV in parentheses)
1996 1997 1998 1999 2000 2001 2002 2003 2004 Number of vessels 944 874 892 829 807 791 762 751 732 Averages per vessel:
42 42 43 44 45 45 47 44 47 Trips (99) (97) (102) (100) (102) (102) (100) (103) (100) 111 104 106 109 104 109 108 103 107 Days absent (80) (77) (74) (68) (70) (69) (68) (73) (74)
39 36 36 38 34 35 33 31 30 Days fished (100) (94) (91) (87) (85) (87) (80) (84) (88)
272 295 316 291 302 332 304 318 414 Landings (live, '000 lbs) (185) (295) (279) (207) (213) (230) (191) (295) (353)
2,113 2,034 2,127 2,106 2,322 2,580 2,300 2,351 2,918 Landings per day absent (live lb/da) (209) (156) (192) (159) (129) (293) (117) (142) (198)
11,086 8,476 9,122 8,943 12,188 11,598 9,489 12,725 17,126 Landings per day fished (live lb/df) (448) (247) (341) (324) (511) (563) (244) (487) (402)
173,362 183,520 188,459 205,165 207,952 217,812 212,283 211,163 243,085 Nominal value ($) (134) (142) (133) (124) (113) (128) (107) (118) (137)
184,728 192,349 195,359 209,647 207,958 212,709 203,756 198,467 222,160 Inflation adjusteda value ($) (134) (142) (133) (124) (113) (128) (107) (118) (137) a Adjusted for inflation using the GDP implicit price deflator (2000=100) with a base year of 2000, so that all prices are relative to 2000 values. Table 22. Number of vessels within each ton classa for U.S. Northeast and Mid-Atlantic bottom trawl fishery, 1996–2004.
TC1 TC2 TC3 TC4 Total GRT
known
Unknown GRT
1996 13 377 429 125 944 0 1997 10 343 394 123 870 4 1998 11 363 382 125 881 11 1999 10 314 372 126 822 7 2000 7 310 358 122 797 10 2001 8 313 350 111 782 9 2002 8 299 340 102 749 13 2003 10 298 336 93 737 14 2004 7 287 328 94 716 16
a Ton classes are defined as: TC1 is 1-4 Gross Registered Tons (GRT), TC2 is 5-50 GRT, TC3 is 51-150 GRT, TC4 is 151-500 GRT and TC5 is greater than 500 GRT. There were no bottom trawl vessels in TC5. Vessels with unknown GRT include state registered vessels.

42
Table 23. Mean vessel characteristics by ton classa for U.S. Northeast and Mid-Atlantic bottom trawl vessels, 1996–2004
TC1 TC2 TC3 TC4 Mean CV Mean CV Mean CV Mean CVAverage Vessel Horsepower (VHP)
1996 200 49.4 301 35.2 482 40.5 872 29.1 1997 274 31.8 300 34.8 481 39.1 846 29.5 1998 278 27.1 301 35.4 473 39.9 863 29.2 1999 235 47.1 302 35.0 478 40.3 877 39.2 2000 241 29.6 299 36.8 475 40.4 862 34.4 2001 252 28.2 302 36.7 472 36.5 872 40.9 2002 244 37.1 306 36.5 476 36.6 857 34.7 2003 225 45.3 315 40.1 485 43.2 845 36.2 2004 263 30.4 309 33.4 486 38.2 867 35.2
Average Vessel Length (Feet) 1996 30 34.1 45 17.2 69 11.6 86 12.0 1997 36 18.8 45 16.5 69 11.8 85 11.5 1998 37 22.9 45 16.6 69 119.9 85 12.6 1999 34 31.7 45 16.1 69 11.8 85 12.8 2000 39 17.0 45 16.3 69 12.0 85 13.5 2001 40 16.1 45 15.6 69 11.8 85 12.4 2002 38 23.8 45 15.5 69 12.5 84 11.4 2003 35 30.3 45 15.4 69 12.5 83 11.4 2004 40 17.1 45 15.9 69 12.6 84 12.5
Average Gross Registered Tons (GRT) 1996 3 43.0 26 47.8 103 27.6 179 15.1 1997 4 19.4 27 16.9 104 27.3 177 14.1 1998 3 33.7 27 46.7 102 27.5 177 14.1 1999 3 38.6 27 45.7 102 27.4 179 20.3 2000 4 22.0 27 46.7 102 28.0 177 14.1 2001 4 20.5 27 47.3 102 27.8 177 19.1 2002 3 35.8 27 47.4 102 27.5 174 10.3 2003 3 32.3 27 46.7 102 27.4 172 8.1 2004 4 22.0 27 45.8 102 27.3 176 11.2
a Ton classes are defined as: TC1 is 1-4 Gross Registered Tons (GRT), TC2 is 5-50 GRT, TC3 is 51-150 GRT, TC4 is 151-500 GRT and TC5 is greater than 500 GRT. There were no bottom trawl vessels in TC5.
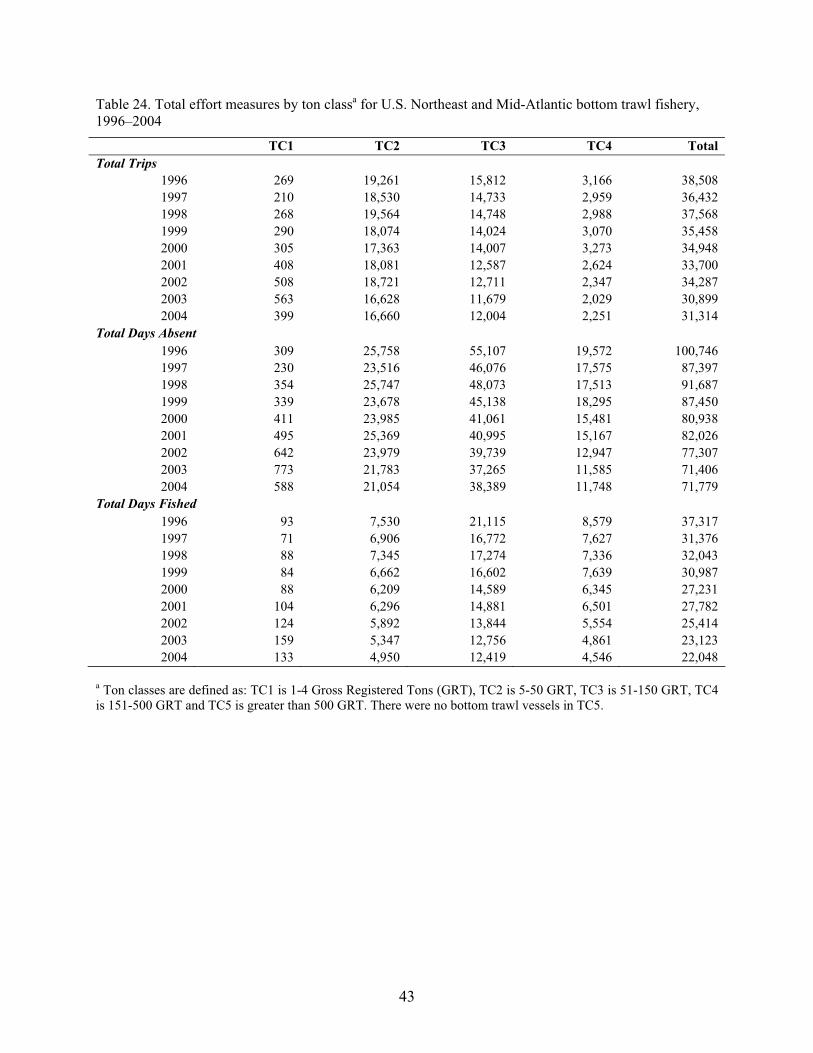
43
Table 24. Total effort measures by ton classa for U.S. Northeast and Mid-Atlantic bottom trawl fishery, 1996–2004
TC1 TC2 TC3 TC4 Total Total Trips
1996 269 19,261 15,812 3,166 38,508 1997 210 18,530 14,733 2,959 36,432 1998 268 19,564 14,748 2,988 37,568 1999 290 18,074 14,024 3,070 35,458 2000 305 17,363 14,007 3,273 34,948 2001 408 18,081 12,587 2,624 33,700 2002 508 18,721 12,711 2,347 34,287 2003 563 16,628 11,679 2,029 30,899 2004 399 16,660 12,004 2,251 31,314
Total Days Absent 1996 309 25,758 55,107 19,572 100,746 1997 230 23,516 46,076 17,575 87,397 1998 354 25,747 48,073 17,513 91,687 1999 339 23,678 45,138 18,295 87,450 2000 411 23,985 41,061 15,481 80,938 2001 495 25,369 40,995 15,167 82,026 2002 642 23,979 39,739 12,947 77,307 2003 773 21,783 37,265 11,585 71,406 2004 588 21,054 38,389 11,748 71,779
Total Days Fished 1996 93 7,530 21,115 8,579 37,317 1997 71 6,906 16,772 7,627 31,376 1998 88 7,345 17,274 7,336 32,043 1999 84 6,662 16,602 7,639 30,987 2000 88 6,209 14,589 6,345 27,231 2001 104 6,296 14,881 6,501 27,782 2002 124 5,892 13,844 5,554 25,414 2003 159 5,347 12,756 4,861 23,123 2004 133 4,950 12,419 4,546 22,048
a Ton classes are defined as: TC1 is 1-4 Gross Registered Tons (GRT), TC2 is 5-50 GRT, TC3 is 51-150 GRT, TC4 is 151-500 GRT and TC5 is greater than 500 GRT. There were no bottom trawl vessels in TC5.
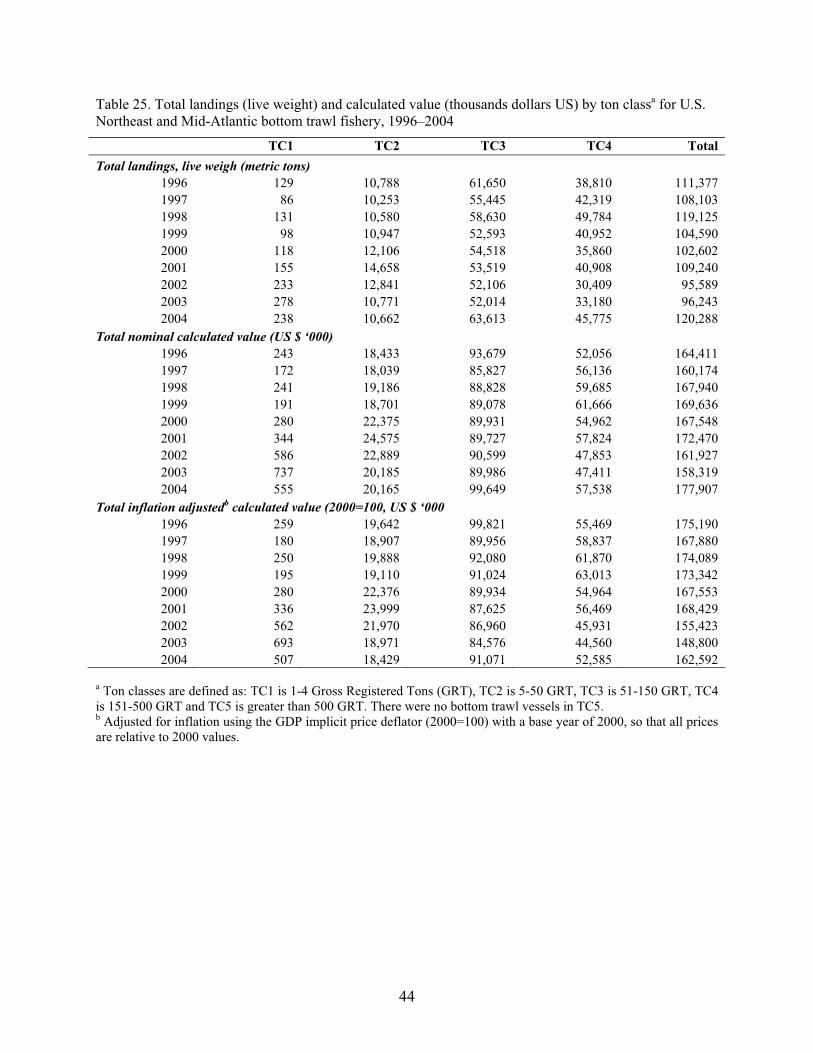
44
Table 25. Total landings (live weight) and calculated value (thousands dollars US) by ton classa for U.S. Northeast and Mid-Atlantic bottom trawl fishery, 1996–2004
TC1 TC2 TC3 TC4 Total Total landings, live weigh (metric tons)
1996 129 10,788 61,650 38,810 111,377 1997 86 10,253 55,445 42,319 108,103 1998 131 10,580 58,630 49,784 119,125 1999 98 10,947 52,593 40,952 104,590 2000 118 12,106 54,518 35,860 102,602 2001 155 14,658 53,519 40,908 109,240 2002 233 12,841 52,106 30,409 95,589 2003 278 10,771 52,014 33,180 96,243 2004 238 10,662 63,613 45,775 120,288
Total nominal calculated value (US $ ‘000) 1996 243 18,433 93,679 52,056 164,411 1997 172 18,039 85,827 56,136 160,174 1998 241 19,186 88,828 59,685 167,940 1999 191 18,701 89,078 61,666 169,636 2000 280 22,375 89,931 54,962 167,548 2001 344 24,575 89,727 57,824 172,470 2002 586 22,889 90,599 47,853 161,927 2003 737 20,185 89,986 47,411 158,319 2004 555 20,165 99,649 57,538 177,907
Total inflation adjustedb calculated value (2000=100, US $ ‘000 1996 259 19,642 99,821 55,469 175,190 1997 180 18,907 89,956 58,837 167,880 1998 250 19,888 92,080 61,870 174,089 1999 195 19,110 91,024 63,013 173,342 2000 280 22,376 89,934 54,964 167,553 2001 336 23,999 87,625 56,469 168,429 2002 562 21,970 86,960 45,931 155,423 2003 693 18,971 84,576 44,560 148,800 2004 507 18,429 91,071 52,585 162,592
a Ton classes are defined as: TC1 is 1-4 Gross Registered Tons (GRT), TC2 is 5-50 GRT, TC3 is 51-150 GRT, TC4 is 151-500 GRT and TC5 is greater than 500 GRT. There were no bottom trawl vessels in TC5. b Adjusted for inflation using the GDP implicit price deflator (2000=100) with a base year of 2000, so that all prices are relative to 2000 values.

45
Table 26. Mean annual landings (live weight) by ton classa for U.S. Northeast and Mid-Atlantic bottom trawl fishery, 1996–2004 (metric tons)
a Ton classes are defined as: TC1 is 1-4 Gross Registered Tons (GRT), TC2 is 5-50 GRT, TC3 is 51-150 GRT, TC4 is 151-500 GRT and TC5 is greater than 500 GRT. There were no bottom trawl vessels in TC5. Table 27. Mean and CV for codend mesh size (inches) by fishing regiona for U.S. Northeast and Mid-Atlantic bottom trawl fishery, 1996–2004
Gulf of Maine Georges Bank North Southern New
England
South Southern New
England
Mid-Atlantic Unknown
Mean CV Mean CV Mean CV Mean CV Mean CV Mean CV 1996 5.4 26.7 5.3 25.1 4.4 38.4 5.1 26.4 4.6 31.3 4.6 37.5 1997 5.5 23.6 5.3 25.4 4.4 39.8 4.4 39.5 4.5 30.2 4.7 35.4 1998 5.6 20.5 5.3 26.2 4.2 42.5 5.3 27.4 4.7 28.2 4.7 37.8 1999 5.6 22.2 5.3 25.7 4.3 40.7 4.9 24.7 4.7 28.6 4.6 43.2 2000 5.9 16.0 5.5 24.8 4.3 42.6 4.0 37.2 4.7 28.2 5.2 31.8 2001 5.8 17.3 5.3 26.6 4.5 38.1 4.6 36.1 4.8 26.6 3.2 50.2 2002 6.0 17.8 5.6 24.0 4.7 36.2 5.0 30.0 5.1 20.7 4.3 40.3 2003 6.2 15.2 5.5 28.5 4.9 34.4 5.5 16.3 5.1 19.8 4.7 37.8 2004 6.1 17.9 5.7 24.5 5.1 33.0 4.1 42.4 5.0 22.8 5.3 25.8 a Fishing region boundaries are illustrated in Figure 7.
TC1 TC2 TC3 TC4 Bluefish 0 86 264 100 Butterfish 0 145 642 920 Cod 59 863 2,909 1,891 Croaker, Atlantic 0 54 2,770 681 Dogfish, Spiny 6 275 958 80 Flounder, Winter 4 723 2,823 1,057 Flounder, Witch 19 612 1,227 479 Flounder, Yllwtail 13 580 3,124 862 Fluke 0 744 3,331 728 Haddock 7 80 1,729 1,620 Hake, Silver 5 606 5,881 4,606 Herring, Atlantic 6 173 328 1,218 Mackerel, Atlantic 2 56 1,088 3,759 Monkfish 10 744 3,583 2,512 Plaice, American 14 843 1,600 692 Scup 0 157 1,082 387 Shad 0 62 82 3 Skates 2 2,030 6,086 783 Squid, Illex 0 16 3,055 7,504 Squid, Loligo 0 729 6,620 6,682 Other finfish 0 192 765 334 Other groundfish 8 657 3,833 2,162 Other pelagics 0 5 51 29 Invertebrates 7 1,077 2,209 686 All others 0 0 1 0 TOTAL 163 11,512 56,043 39,778

46
Table 28. Average codend mesh size by ton classa of vessel for U.S. Northeast and Mid-Atlantic bottom trawl fishery, 1996–2004 (CV in parentheses)
TC1 TC2 TC3 TC4 1996 5.6 (21.6) 5.0 (30.3) 4.7 (36.5) 4.4 (41.5) 1997 5.9 (11.6) 5.1 (29.5) 4.6 (37.8) 4.3 (42.6) 1998 5.5 (21.6) 5.1 (29.8) 4.5 (39.7) 4.2 (44.9) 1999 5.2 (31.4) 5.0 (32.3) 4.7 (36.4) 4.3 (42.3) 2000 5.7 (17.2) 5.3 (26.3) 4.5 (27.0) 4.1 (22.2) 2001 5.8 (14.4) 5.3 (27.4) 4.8 (34.7) 4.5 (36.3) 2002 6.1 (15.1) 5.5 (27.0) 4.9 (33.3) 4.7 (36.1) 2003 6.3 (11.7) 5.7 (23.4) 5.2 (31.8) 4.7 (38.5) 2004 5.9 (26.1) 5.7 (24.3) 5.2 (31.5) 4.6 (39.5)
a Ton classes are defined as: TC1 is 1-4 Gross Registered Tons (GRT), TC2 is 5-50 GRT, TC3 is 51-150 GRT, TC4 is 151-500 GRT and TC5 is greater than 500 GRT. There were no bottom trawl vessels in TC5. Table 29. Average footrope length (feet) by fishing regiona for U.S. Northeast and Mid-Atlantic bottom trawl fishery, 1996–2004
Gulf of Maine Georges Bank North Southern New
England
South Southern New
England
Mid-Atlantic Unknown
1996 83.2 (31.7) 92.2 (28.6) 83.9 (31.6) 75.2 (33.3) 86.1 (31.1) 83.3 (38.1) 1997 83.1 (32.0) 94.8 (31.1) 82.8 (33.2) 114.6 (29.9) 87.7 (29.1) 82.9 (34.9) 1998 81.3 (31.7) 99.4 (32.0) 83.2 (34.1) 66.1 (51.3) 84.9 (33.0) 90.2 (38.4) 1999 84.0 (31.4) 103.7 (32.6) 82.7 (31.8) 128.7 (40.6) 86.4 (30.6) 96.4 (31.7) 2000 88.1 (33.1) 114.8 (31.4) 85.6 (32.3) 117.0 (31.8) 86.3 (28.6) 104.7 (34.0) 2001 88.4 (33.7) 117.3 (29.3) 83.1 (32.1) 104.7 (34.9) 84.1 (28.9) 81.8 (41.7) 2002 89.3 (32.0) 117.6 (28.6) 82.0 (29.5) 74.0 (31.1) 79.6 (27.0) 110.9 (33.0) 2003 90.0 (33.3) 117.1 (28.6) 80.8 (28.8) 75.1 (26.4) 77.4 (29.9) 107.5 (28.2) 2004 90.5 (33.6) 114.4 (29.0) 81.3 (31.5) 124.2 (27.1) 75.7 (34.8) 91.4 (27.0) a Fishing region boundaries are illustrated in Figure 7. Table 30. Mean footrope length (feet) by ton classa for U.S. Northeast and Mid-Atlantic bottom trawl fishery, 1996–2004 (CV in parentheses)
TC1 TC2 TC3 TC4 1996 74.9 (33.9) 71.2 (24.7) 93.0 (26.4) 119.1 (24.9) 1997 77.0 (38.9) 71.1 (25.3) 92.4 (27.5) 120.0 (26.5) 1998 65.4 (18.4) 71.2 (24.6) 92.2 (29.3) 124.3 (26.3) 1999 69.4 (41.8) 72.7 (25.0) 92.5 (27.0) 122.3 (26.1) 2000 67.9 (17.2) 74.6 (26.3) 96.8 (27.0) 129.8 (22.2) 2001 72.0 (13.0) 75.5 (26.2) 95.9 (28.2) 131.6 (23.1) 2002 73.5 (16.4) 75.1 (25.3) 95.1 (26.9) 128.7 (21.1) 2003 70.7 (19.8) 76.7 (26.4) 95.2 (27.9) 128.0 (23.5) 2004 73.9 (19.3) 75.1 (25.1) 95.3 (29.2) 129.9 (24.3)
a Ton classes are defined as: TC1 is 1-4 Gross Registered Tons (GRT), TC2 is 5-50 GRT, TC3 is 51-150 GRT, TC4 is 151-500 GRT and TC5 is greater than 500 GRT. There were no bottom trawl vessels in TC5.

47
Table 31. Total and annual distribution of days fished by SST groups (degrees Celsius) for U.S. Northeast and Mid-Atlantic bottom trawl fishery, 1996–2004
1996 1997 1998 1999 2000 2001 2002 2003 2004 Total days fished 0 – 5 9,010 7,783 8,499 6,730 4,065 2,339 2,906 4,258 3,984 5-10 10,136 8,671 8,692 9,322 8,265 10,212 9,840 7,169 6,610 10-15 8,523 5,828 6,761 5,959 6,076 6,379 5,032 5,073 4,937 15 – 20 7,839 6,885 5,976 6,669 6,817 6,900 5,385 5,402 5,092 20 – 25 1,607 1,977 2,130 2,383 1,915 2,158 2,179 1,382 1,387 > 25 61 43 52 158 41 57 89 80 63 TOTAL 37,175 31,186 32,110 31,221 27,178 28,045 25,431 23,363 22,073 Distribution (%) 0 – 5 24 25 26 22 15 8 11 18 18 5-10 27 28 30 30 36 39 31 30 10-15 23 19 21 19 22 23 20 22 22 15 – 20 21 22 19 21 25 25 21 23 23 20 – 25 4 6 7 8 7 8 9 6 6 > 25 0 0 0 1 0 0 0 0 0 Table 32. Total and annual distribution of hauls by SST groups (degrees Celsius) for U.S. Northeast and Mid-Atlantic bottom trawl fishery, 1996–2004
1996 1997 1998 1999 2000 2001 2002 2003 2004Total number of hauls 0 - 5 70,707 62,426 66,848 52,612 30,595 16,793 20,934 29,716 27,2975-10 77,076 68,521 66,612 69,569 61,796 76,756 75,090 55,984 52,49410-15 67,668 47,070 55,231 47,982 49,381 52,605 43,198 42,572 43,88815 - 20 66,847 59,020 49,874 54,482 57,052 58,273 46,665 47,439 47,49920 - 25 17,124 19,546 20,978 22,686 20,462 22,429 22,738 15,453 17,364> 25 489 412 518 1,183 357 571 887 724 768TOTAL 299,911 256,995 260,061 248,514 219,643 227,427 209,512 191,888 189,310Distribution (%) 0 - 5 24 24 26 21 14 7 10 15 145-10 26 27 26 28 28 34 36 29 2810-15 23 18 21 19 22 23 21 22 2315 - 20 22 23 19 22 26 26 22 25 2520 - 25 6 8 8 9 9 10 11 8 9> 25 0 0 0 0 0 0 0 0 0

48
Table 33. Total and annual distribution of days fished by bottom depth groups (meters) for U.S. Northeast and Mid-Atlantic bottom trawl fishery, 1996–2004
1996 1997 1998 1999 2000 2001 2002 2003 2004Total days fished 0 – 50 15,445 13,817 13,953 13,290 10,672 9,347 9,386 7,653 7,23950 – 100 7,907 6,929 7,130 6,617 7,117 7,332 6,650 6,311 6,376100 – 200 9,230 7,018 6,714 7,053 6,351 7,958 6,461 5,898 5,330200 - 2000 4,476 3,310 4,140 4,101 2,921 3,291 2,807 3,324 3,065> 2000 118 112 173 160 117 118 127 178 62TOTAL 37,175 31,186 32,110 31,221 27,178 28,045 25,431 23,363 22,073Distribution (%) 0 – 50 42 44 43 43 39 33 37 33 3350 – 100 21 22 22 21 26 26 26 27 29100 – 200 25 23 21 23 23 28 25 25 24200 - 2000 12 11 13 13 11 12 11 14 14> 2000 0 0 1 1 0 0 0 1 0 Table 34. Total and annual distribution of hauls by bottom depth groups (meters) for U.S. Northeast and Mid-Atlantic bottom trawl fishery, 1996–2004
1996 1997 1998 1999 2000 2001 2002 2003 2004 Total number of hauls 0 – 50 152,556 136,451 133,554 127,540 106,655 96,591 97,925 82,316 80,637 50 – 100 61,987 56,502 57,519 53,096 58,571 62,202 56,181 51,871 55,278 100 – 200 55,777 42,250 40,774 41,832 36,240 47,230 37,880 36,267 33,701 200 - 2000 28,621 20,802 26,877 24,786 17,241 20,363 16,565 20,007 19,125 > 2000 969 989 1,337 1,259 935 1,041 960 1,428 569 TOTAL 299,910 256,994 260,061 248,513 219,642 227,427 209,511 191,889 189,310 Distribution (%) 0 – 50 51 53 51 51 49 42 47 43 43 50 – 100 21 22 22 21 27 27 27 27 29 100 – 200 19 16 16 17 16 21 18 19 18 200 - 2000 10 8 10 10 8 9 8 10 10 > 2000 0 0 1 1 0 0 0 1 0

49
Table 35. Total and distribution of days fished by bottom slope groups (degree) for U.S. Northeast and Mid-Atlantic bottom trawl fishery, 1996–2004
1996 1997 1998 1999 2000 2001 2002 2003 2004 Total days fished 0 - 0.5 32,982 27,929 27,759 26,855 24,643 24,854 22,893 20,109 19,300 0.5 - 1.0. 1,629 1,071 1,406 1,283 904 1,398 1,113 1,376 1,155 1.0 - 4.0 2,092 1,813 2,449 2,527 1,375 1,522 1,190 1,624 1,342 > 4.0 472 373 496 556 257 271 235 254 275 TOTAL 37,175 31,186 32,110 31,221 27,178 28,045 25,431 23,363 22,073 Distribution (%) 0 - 0.5 89 90 86 86 91 89 90 86 87 0.5 - 1.0. 4 3 4 4 3 5 4 6 5 1.0 - 4.0 6 6 8 8 5 5 5 7 6 > 4.0 1 1 2 2 1 1 1 1 1 Table 36. Total and annual distribution of hauls by bottom slope groups (degree) for U.S. Northeast and Mid-Atlantic bottom trawl fishery, 1996–2004
1996 1997 1998 1999 2000 2001 2002 2003 2004 Total number of hauls 0 - 0.5 268,169 232,982 227,871 218,635 201,829 203,009 190,661 167,454 167,207 0.5 - 1.0. 11,347 7,686 9,933 8,922 6,350 10,162 7,837 9,613 8,445 1.0 - 4.0 16,631 13,391 18,206 16,989 9,325 11,974 9,192 12,816 11,173 > 4.0 3,762 2,935 4,051 3,967 2,139 2,281 1,820 2,006 2,484 TOTAL 299,909 256,994 260,061 248,513 219,643 227,426 209,510 191,889 189,309 Distribution (%) 0 - 0.5 89 91 88 88 92 89 91 87 88 0.5 - 1.0. 4 3 4 4 3 4 4 5 4 1.0 - 4.0 6 5 7 7 4 5 4 7 6 > 4.0 1 1 2 2 1 1 1 1 1 Table 37. Total vessels and trips by year for mid-water (single and paired) trawl fisheries in the U.S. Northeast and Mid-Atlantic, 1996–2004
Total Vessels Total Trips 1996 40 1,247 1997 37 1,039 1998 45 1,073 1999 35 983 2000 40 1,155 2001 36 1,274 2002 35 1,260 2003 35 1,234 2004 33 1,231
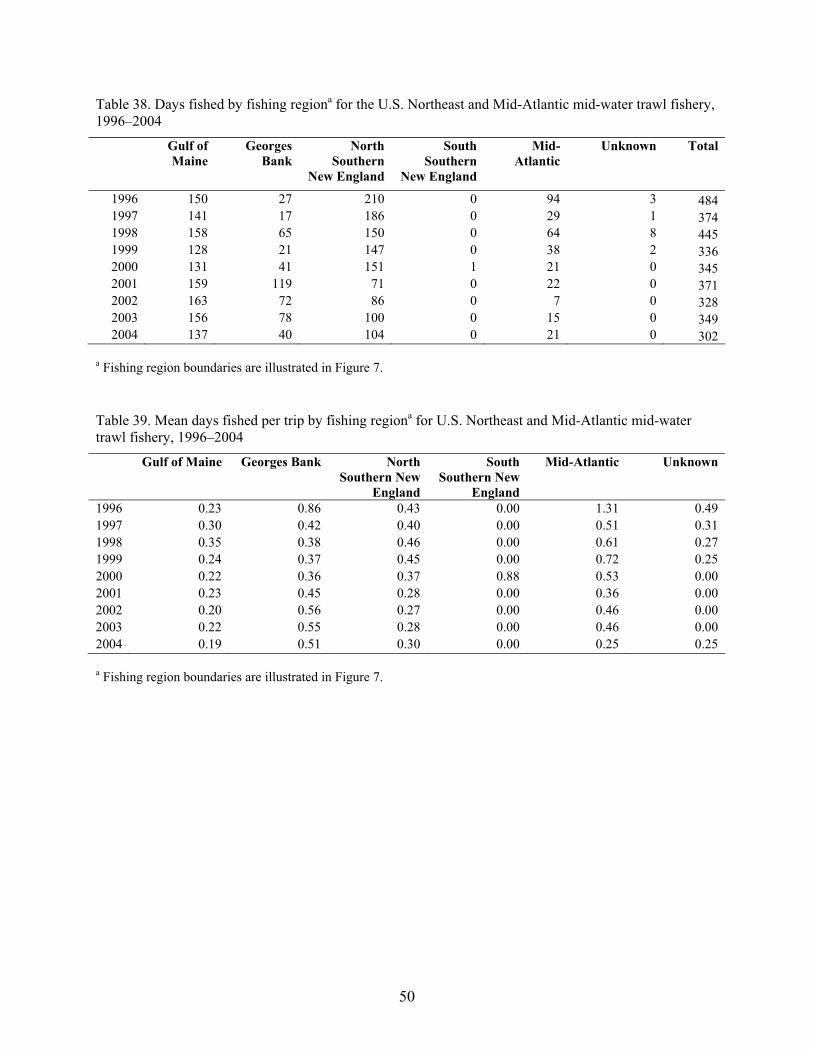
50
Table 38. Days fished by fishing regiona for the U.S. Northeast and Mid-Atlantic mid-water trawl fishery, 1996–2004
Gulf of Maine
Georges Bank
North Southern
New England
South Southern
New England
Mid-Atlantic
Unknown Total
1996 150 27 210 0 94 3 484 1997 141 17 186 0 29 1 374 1998 158 65 150 0 64 8 445 1999 128 21 147 0 38 2 336 2000 131 41 151 1 21 0 345 2001 159 119 71 0 22 0 371 2002 163 72 86 0 7 0 328 2003 156 78 100 0 15 0 349 2004 137 40 104 0 21 0 302
a Fishing region boundaries are illustrated in Figure 7. Table 39. Mean days fished per trip by fishing regiona for U.S. Northeast and Mid-Atlantic mid-water trawl fishery, 1996–2004
Gulf of Maine Georges Bank North Southern New
England
South Southern New
England
Mid-Atlantic Unknown
1996 0.23 0.86 0.43 0.00 1.31 0.49 1997 0.30 0.42 0.40 0.00 0.51 0.31 1998 0.35 0.38 0.46 0.00 0.61 0.27 1999 0.24 0.37 0.45 0.00 0.72 0.25 2000 0.22 0.36 0.37 0.88 0.53 0.00 2001 0.23 0.45 0.28 0.00 0.36 0.00 2002 0.20 0.56 0.27 0.00 0.46 0.00 2003 0.22 0.55 0.28 0.00 0.46 0.00 2004 0.19 0.51 0.30 0.00 0.25 0.25 a Fishing region boundaries are illustrated in Figure 7.
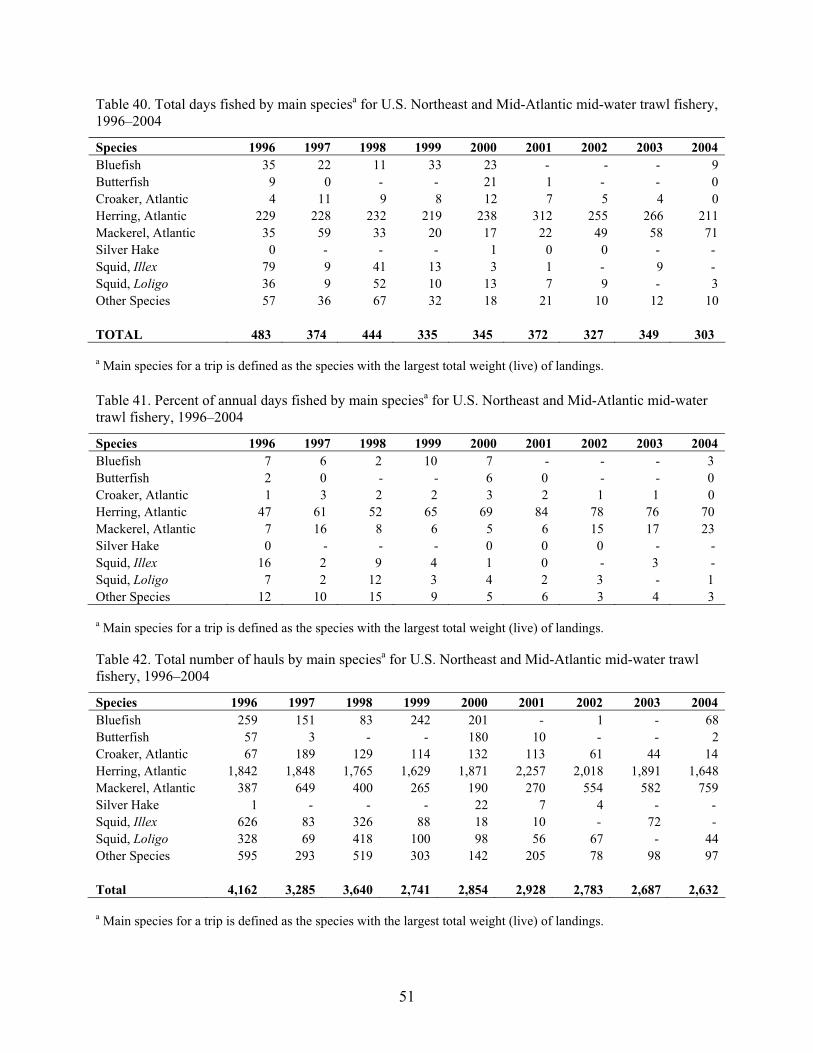
51
Table 40. Total days fished by main speciesa for U.S. Northeast and Mid-Atlantic mid-water trawl fishery, 1996–2004
Species 1996 1997 1998 1999 2000 2001 2002 2003 2004 Bluefish 35 22 11 33 23 - - - 9 Butterfish 9 0 - - 21 1 - - 0 Croaker, Atlantic 4 11 9 8 12 7 5 4 0 Herring, Atlantic 229 228 232 219 238 312 255 266 211 Mackerel, Atlantic 35 59 33 20 17 22 49 58 71 Silver Hake 0 - - - 1 0 0 - - Squid, Illex 79 9 41 13 3 1 - 9 - Squid, Loligo 36 9 52 10 13 7 9 - 3 Other Species 57 36 67 32 18 21 10 12 10 TOTAL 483 374 444 335 345 372 327 349 303 a Main species for a trip is defined as the species with the largest total weight (live) of landings. Table 41. Percent of annual days fished by main speciesa for U.S. Northeast and Mid-Atlantic mid-water trawl fishery, 1996–2004
Species 1996 1997 1998 1999 2000 2001 2002 2003 2004 Bluefish 7 6 2 10 7 - - - 3 Butterfish 2 0 - - 6 0 - - 0 Croaker, Atlantic 1 3 2 2 3 2 1 1 0 Herring, Atlantic 47 61 52 65 69 84 78 76 70 Mackerel, Atlantic 7 16 8 6 5 6 15 17 23 Silver Hake 0 - - - 0 0 0 - - Squid, Illex 16 2 9 4 1 0 - 3 - Squid, Loligo 7 2 12 3 4 2 3 - 1 Other Species 12 10 15 9 5 6 3 4 3 a Main species for a trip is defined as the species with the largest total weight (live) of landings. Table 42. Total number of hauls by main speciesa for U.S. Northeast and Mid-Atlantic mid-water trawl fishery, 1996–2004
Species 1996 1997 1998 1999 2000 2001 2002 2003 2004 Bluefish 259 151 83 242 201 - 1 - 68 Butterfish 57 3 - - 180 10 - - 2 Croaker, Atlantic 67 189 129 114 132 113 61 44 14 Herring, Atlantic 1,842 1,848 1,765 1,629 1,871 2,257 2,018 1,891 1,648 Mackerel, Atlantic 387 649 400 265 190 270 554 582 759 Silver Hake 1 - - - 22 7 4 - - Squid, Illex 626 83 326 88 18 10 - 72 - Squid, Loligo 328 69 418 100 98 56 67 - 44 Other Species 595 293 519 303 142 205 78 98 97 Total 4,162 3,285 3,640 2,741 2,854 2,928 2,783 2,687 2,632 a Main species for a trip is defined as the species with the largest total weight (live) of landings.
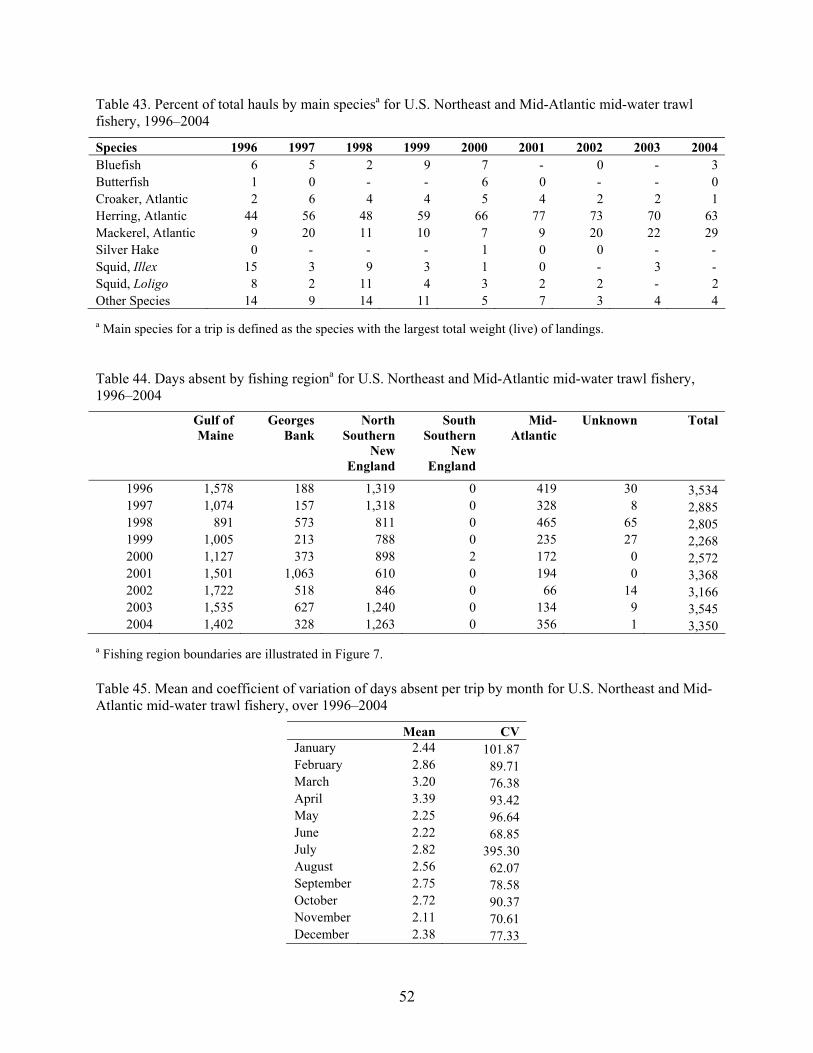
52
Table 43. Percent of total hauls by main speciesa for U.S. Northeast and Mid-Atlantic mid-water trawl fishery, 1996–2004
Species 1996 1997 1998 1999 2000 2001 2002 2003 2004 Bluefish 6 5 2 9 7 - 0 - 3 Butterfish 1 0 - - 6 0 - - 0 Croaker, Atlantic 2 6 4 4 5 4 2 2 1 Herring, Atlantic 44 56 48 59 66 77 73 70 63 Mackerel, Atlantic 9 20 11 10 7 9 20 22 29 Silver Hake 0 - - - 1 0 0 - - Squid, Illex 15 3 9 3 1 0 - 3 - Squid, Loligo 8 2 11 4 3 2 2 - 2 Other Species 14 9 14 11 5 7 3 4 4 a Main species for a trip is defined as the species with the largest total weight (live) of landings. Table 44. Days absent by fishing regiona for U.S. Northeast and Mid-Atlantic mid-water trawl fishery, 1996–2004
Gulf of Maine
Georges Bank
North Southern
New England
South Southern
New England
Mid-Atlantic
Unknown Total
1996 1,578 188 1,319 0 419 30 3,534 1997 1,074 157 1,318 0 328 8 2,885 1998 891 573 811 0 465 65 2,805 1999 1,005 213 788 0 235 27 2,268 2000 1,127 373 898 2 172 0 2,572 2001 1,501 1,063 610 0 194 0 3,368 2002 1,722 518 846 0 66 14 3,166 2003 1,535 627 1,240 0 134 9 3,545 2004 1,402 328 1,263 0 356 1 3,350
a Fishing region boundaries are illustrated in Figure 7. Table 45. Mean and coefficient of variation of days absent per trip by month for U.S. Northeast and Mid-Atlantic mid-water trawl fishery, over 1996–2004
Mean CV January 2.44 101.87 February 2.86 89.71 March 3.20 76.38 April 3.39 93.42 May 2.25 96.64 June 2.22 68.85 July 2.82 395.30 August 2.56 62.07 September 2.75 78.58 October 2.72 90.37 November 2.11 70.61 December 2.38 77.33

53
Table 46. Percent of trips assigned to main speciesa categories for U.S. Northeast and Mid-Atlantic mid-water trawl fishery, 1996–2004
SpeciesPercent of All
TripsAtlantic Herring 82.75 Atlantic Mackerel 9.62 Atlantic Croaker 1.39 Bluefish 1.27 Squid, Illex 1.20 Squid, Loligo 0.84 Scup 0.51 Other species 2.42
a Main species for a trip is defined as the species with the largest total weight (live) of landings.
Table 47. Total live weight kept by species for the U.S. Northeast and Mid-Atlantic mid-water trawl fishery, 1996–2004 (metric tons)
Table 48. Average annual nominal price for by species for U.S. Northeast and Mid-Atlantic mid-water trawl fishery, 1996–2004 (U.S. dollars per live weight pound)
1996 1997 1998 1999 2000 2001 2002 2003 2004 Herring, Atlantic 0.05 0.05 0.06 0.06 0.06 0.06 0.06 0.07 0.08 Mackerel, Atlantic 0.14 0.27 0.17 0.13 0.16 0.07 0.11 0.10 0.11 Average all harvest 0.08 0.09 0.09 0.07 0.07 0.06 0.08 0.08 0.09
1996 1997 1998 1999 2000 2001 2002 2003 2004 Avg Croaker, Atlantic 202 328 144 344 419 313 153 192 92 243 Herring, Atlantic 53,894 50,380 55,615 57,365 76,157 101,844 72,215 84,968 71,446 69,320 Mackerel, Atlantic 2,854 6,167 7,524 5,438 3,723 7,213 23,633 32,368 52,834 15,750 Scup 38 108 50 23 14 5 10 0 41 32 Squid, Illex 2,051 359 2,288 497 40 22 0 589 0 649 Squid, Loligo 663 192 622 76 90 99 94 3 24 207 All others 610 260 230 217 980 141 40 290 56 314 TOTAL 60,312 57,794 66,473 63,960 81,422 109,636 96,144 118,411 124,493 86,516

54
Table 49. Average annual inflation adjusted pricea for principle species for U.S. Northeast and Mid-Atlantic mid-water trawl fishery, 1996–2004 (U.S. dollars per live weight pound)
1996 1997 1998 1999 2000 2001 2002 2003 2004 Herring, Atlantic 0.05 0.05 0.06 0.06 0.06 0.06 0.06 0.07 0.07 Mackerel, Atlantic 0.15 0.28 0.18 0.13 0.16 0.07 0.11 0.09 0.10 Average all harvest 0.09 0.09 0.09 0.07 0.07 0.06 0.08 0.08 0.08 GDP implicit price deflatorb 93.85 95.41 96.47 97.86 100.00 102.40 104.19 106.40 109.42 a Adjusted for inflation using the GDP implicit price deflator (2000=100) with a base year of 2000, so that all prices are relative to 2000 values. b Source: HUhttp://www.econstats.comH Accessed September 1, 2005.
Table 50. Calculated nominal value by species for U.S. Northeast and Mid-Atlantic mid-water trawl fishery, 1996–2004 (thousands of US dollars)
1996 1997 1998 1999 2000 2001 2002 2003 2004 Herring, Atlantic
6,529 5,966 7,283 7,542 10,564 13,530 10,318 13,436 12,279
Mackerel, Atlantic
873 3,732 2,831 1,585 1,297 1,161 5,494 7,304 12,244
All Other 3,187 1,169 2,777 836 884 866 282 601 199 TOTAL 10,589 10,867 12,891 9,963 12,745 15,557 16,094 21,341 24,722 Table 51. Inflation adjusteda calculated value by species for U.S. Northeast and Mid-Atlantic mid-water trawl fishery, 1996–2004 (thousands of US dollars)
1996 1997 1998 1999 2000 2001 2002 2003 2004 Herring, Atlantic 6,957 6,253 7,550 7,707 10,564 13,213 9,904 12,628 11,222 Mackerel, Atlantic 930 3,912 2,935 1,620 1,297 1,134 5,273 6,865 11,190 All Other 3,396 1,225 2,879 854 884 846 271 565 182 TOTAL 11,283 11,390 13,363 10,181 12,745 15,193 15,448 20,058 22,594 a Adjusted for inflation using the GDP implicit price deflator (2000=100) with a base year of 2000, so that all prices are relative to 2000 values.
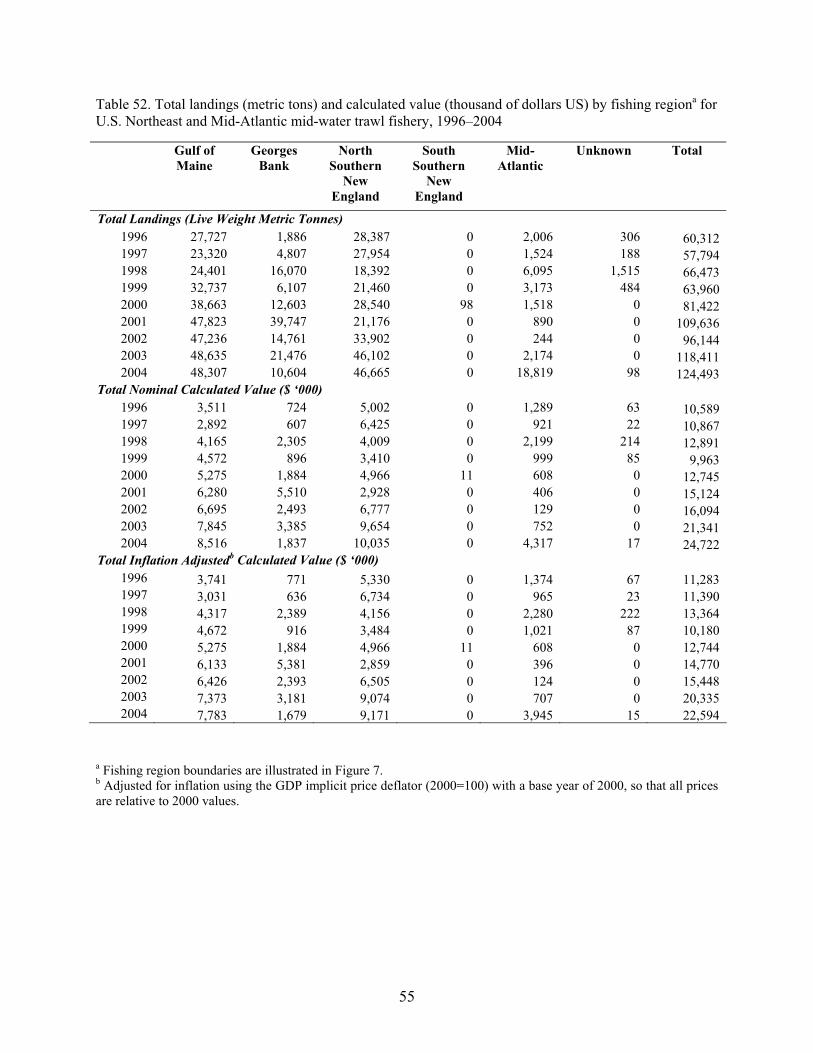
55
Table 52. Total landings (metric tons) and calculated value (thousand of dollars US) by fishing regiona for U.S. Northeast and Mid-Atlantic mid-water trawl fishery, 1996–2004
a Fishing region boundaries are illustrated in Figure 7. b Adjusted for inflation using the GDP implicit price deflator (2000=100) with a base year of 2000, so that all prices are relative to 2000 values.
Gulf of
MaineGeorges
BankNorth
Southern New
England
South Southern
New England
Mid-Atlantic
Unknown Total
Total Landings (Live Weight Metric Tonnes) 1996 27,727 1,886 28,387 0 2,006 306 60,312 1997 23,320 4,807 27,954 0 1,524 188 57,794 1998 24,401 16,070 18,392 0 6,095 1,515 66,473 1999 32,737 6,107 21,460 0 3,173 484 63,960 2000 38,663 12,603 28,540 98 1,518 0 81,422 2001 47,823 39,747 21,176 0 890 0 109,636 2002 47,236 14,761 33,902 0 244 0 96,144 2003 48,635 21,476 46,102 0 2,174 0 118,411 2004 48,307 10,604 46,665 0 18,819 98 124,493
Total Nominal Calculated Value ($ ‘000) 1996 3,511 724 5,002 0 1,289 63 10,589 1997 2,892 607 6,425 0 921 22 10,867 1998 4,165 2,305 4,009 0 2,199 214 12,891 1999 4,572 896 3,410 0 999 85 9,963 2000 5,275 1,884 4,966 11 608 0 12,745 2001 6,280 5,510 2,928 0 406 0 15,124 2002 6,695 2,493 6,777 0 129 0 16,094 2003 7,845 3,385 9,654 0 752 0 21,341 2004 8,516 1,837 10,035 0 4,317 17 24,722
Total Inflation Adjustedb Calculated Value ($ ‘000) 1996 3,741 771 5,330 0 1,374 67 11,283 1997 3,031 636 6,734 0 965 23 11,390 1998 4,317 2,389 4,156 0 2,280 222 13,364 1999 4,672 916 3,484 0 1,021 87 10,180 2000 5,275 1,884 4,966 11 608 0 12,744 2001 6,133 5,381 2,859 0 396 0 14,770 2002 6,426 2,393 6,505 0 124 0 15,448 2003 7,373 3,181 9,074 0 707 0 20,335 2004 7,783 1,679 9,171 0 3,945 15 22,594

56
Table 53. Average annual landings by species by fishing regiona for U.S. Northeast and Mid-Atlantic mid-water trawl fishery, 1996–2004 (live weight, metric tons)
a Fishing region boundaries are illustrated in Figure 7.
Gulf of
MaineGeorges
BankNorth
Southern New
England
South Southern
New England
Mid-Atlantic
Unknown Total
Bluefish 0 0 53 0 4 0 57 Butterfish 0 5 32 0 5 0 42 Cod 2 0 0 0 0 0 2 Croaker, Atlantic 0 0 6 0 230 6 242 Dogfish, Spiny 3 0 0 0 2 0 6 Flounder, Winter 0 0 0 0 0 0 0 Flounder, Witch 1 0 0 0 0 0 1 Flounder, Yllwtail 0 1 0 0 0 0 1 Fluke 0 0 1 0 2 0 4 Haddock 4 0 0 0 0 0 4 Hake, Silver 0 0 2 0 0 0 2 Herring, Atlantic 37,372 14,076 17,486 11 113 263 69,321 Mackerel, Atlantic 253 107 12,019 0 3,358 15 15,751 Monkfish 1 0 4 0 0 0 6 Plaice, American 1 1 0 0 0 0 2 Scup 0 0 29 0 3 0 32 Shad 1 0 63 0 2 0 66 Skates 0 0 0 0 0 0 0 Squid, Illex 0 16 426 0 207 1 650 Squid, Loligo 0 23 144 0 40 2 208 Other finfish 4 0 8 0 42 0 54 Other groundfish 7 0 2 0 0 0 9 Other pelagics 0 0 14 0 35 0 49 Invertebrates 0 0 1 0 6 0 7 All others 0 0 0 0 0 0 0 Total Harvest 37,650 14,229 30,289 11 4,049 288 86,516
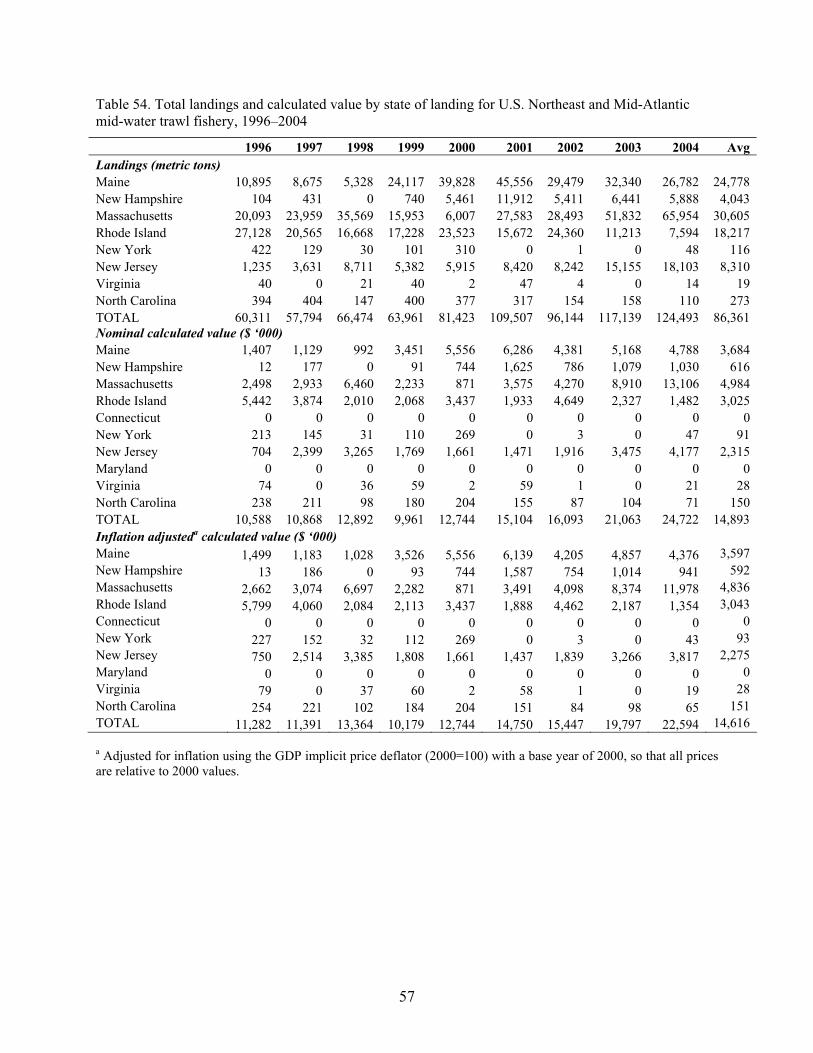
57
Table 54. Total landings and calculated value by state of landing for U.S. Northeast and Mid-Atlantic mid-water trawl fishery, 1996–2004
1996 1997 1998 1999 2000 2001 2002 2003 2004 Avg Landings (metric tons) Maine 10,895 8,675 5,328 24,117 39,828 45,556 29,479 32,340 26,782 24,778 New Hampshire 104 431 0 740 5,461 11,912 5,411 6,441 5,888 4,043 Massachusetts 20,093 23,959 35,569 15,953 6,007 27,583 28,493 51,832 65,954 30,605 Rhode Island 27,128 20,565 16,668 17,228 23,523 15,672 24,360 11,213 7,594 18,217 New York 422 129 30 101 310 0 1 0 48 116 New Jersey 1,235 3,631 8,711 5,382 5,915 8,420 8,242 15,155 18,103 8,310 Virginia 40 0 21 40 2 47 4 0 14 19 North Carolina 394 404 147 400 377 317 154 158 110 273 TOTAL 60,311 57,794 66,474 63,961 81,423 109,507 96,144 117,139 124,493 86,361 Nominal calculated value ($ ‘000) Maine 1,407 1,129 992 3,451 5,556 6,286 4,381 5,168 4,788 3,684 New Hampshire 12 177 0 91 744 1,625 786 1,079 1,030 616 Massachusetts 2,498 2,933 6,460 2,233 871 3,575 4,270 8,910 13,106 4,984 Rhode Island 5,442 3,874 2,010 2,068 3,437 1,933 4,649 2,327 1,482 3,025 Connecticut 0 0 0 0 0 0 0 0 0 0 New York 213 145 31 110 269 0 3 0 47 91 New Jersey 704 2,399 3,265 1,769 1,661 1,471 1,916 3,475 4,177 2,315 Maryland 0 0 0 0 0 0 0 0 0 0 Virginia 74 0 36 59 2 59 1 0 21 28 North Carolina 238 211 98 180 204 155 87 104 71 150 TOTAL 10,588 10,868 12,892 9,961 12,744 15,104 16,093 21,063 24,722 14,893 Inflation adjusteda calculated value ($ ‘000) Maine 1,499 1,183 1,028 3,526 5,556 6,139 4,205 4,857 4,376 3,597 New Hampshire 13 186 0 93 744 1,587 754 1,014 941 592 Massachusetts 2,662 3,074 6,697 2,282 871 3,491 4,098 8,374 11,978 4,836 Rhode Island 5,799 4,060 2,084 2,113 3,437 1,888 4,462 2,187 1,354 3,043 Connecticut 0 0 0 0 0 0 0 0 0 0 New York 227 152 32 112 269 0 3 0 43 93 New Jersey 750 2,514 3,385 1,808 1,661 1,437 1,839 3,266 3,817 2,275 Maryland 0 0 0 0 0 0 0 0 0 0 Virginia 79 0 37 60 2 58 1 0 19 28 North Carolina 254 221 102 184 204 151 84 98 65 151 TOTAL 11,282 11,391 13,364 10,179 12,744 14,750 15,447 19,797 22,594 14,616 a Adjusted for inflation using the GDP implicit price deflator (2000=100) with a base year of 2000, so that all prices are relative to 2000 values.
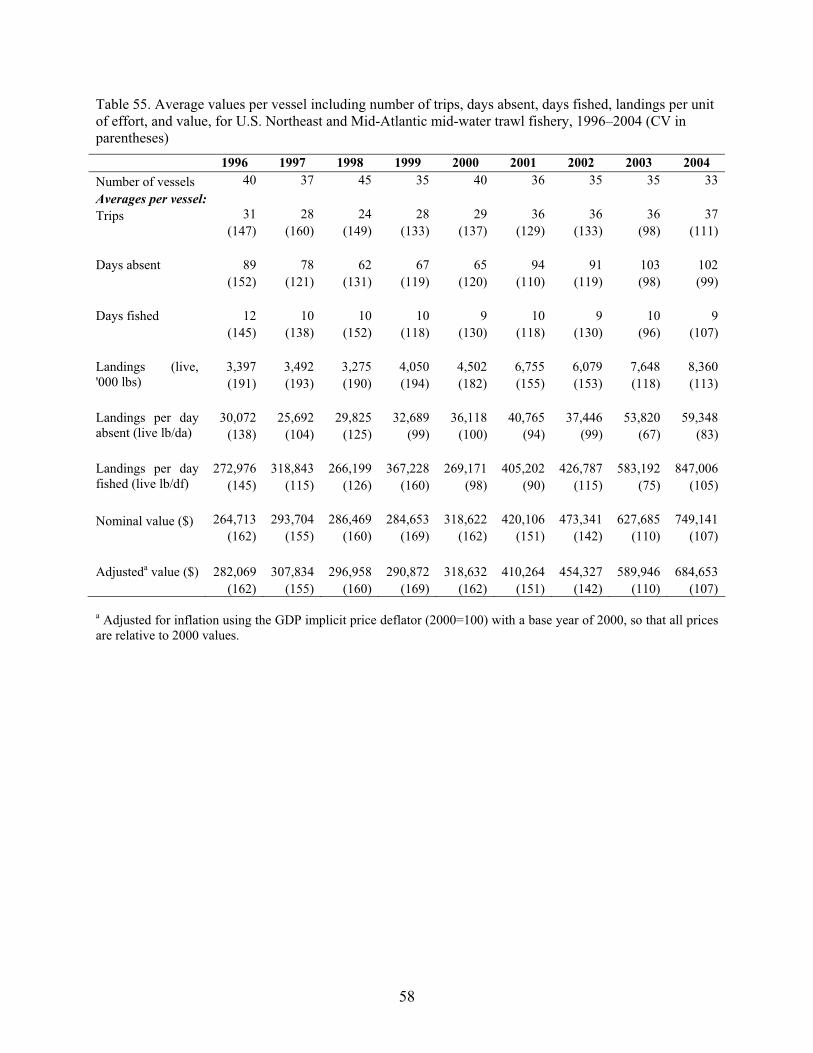
58
Table 55. Average values per vessel including number of trips, days absent, days fished, landings per unit of effort, and value, for U.S. Northeast and Mid-Atlantic mid-water trawl fishery, 1996–2004 (CV in parentheses)
1996 1997 1998 1999 2000 2001 2002 2003 2004 Number of vessels 40 37 45 35 40 36 35 35 33 Averages per vessel: Trips 31 28 24 28 29 36 36 36 37 (147) (160) (149) (133) (137) (129) (133) (98) (111)
89 78 62 67 65 94 91 103 102 Days absent (152) (121) (131) (119) (120) (110) (119) (98) (99)
12 10 10 10 9 10 9 10 9 Days fished
(145) (138) (152) (118) (130) (118) (130) (96) (107)
3,397 3,492 3,275 4,050 4,502 6,755 6,079 7,648 8,360 Landings (live, '000 lbs) (191) (193) (190) (194) (182) (155) (153) (118) (113)
30,072 25,692 29,825 32,689 36,118 40,765 37,446 53,820 59,348 Landings per day absent (live lb/da) (138) (104) (125) (99) (100) (94) (99) (67) (83)
272,976 318,843 266,199 367,228 269,171 405,202 426,787 583,192 847,006 Landings per day fished (live lb/df) (145) (115) (126) (160) (98) (90) (115) (75) (105) Nominal value ($) 264,713 293,704 286,469 284,653 318,622 420,106 473,341 627,685 749,141 (162) (155) (160) (169) (162) (151) (142) (110) (107) Adjusteda value ($) 282,069 307,834 296,958 290,872 318,632 410,264 454,327 589,946 684,653 (162) (155) (160) (169) (162) (151) (142) (110) (107) a Adjusted for inflation using the GDP implicit price deflator (2000=100) with a base year of 2000, so that all prices are relative to 2000 values.
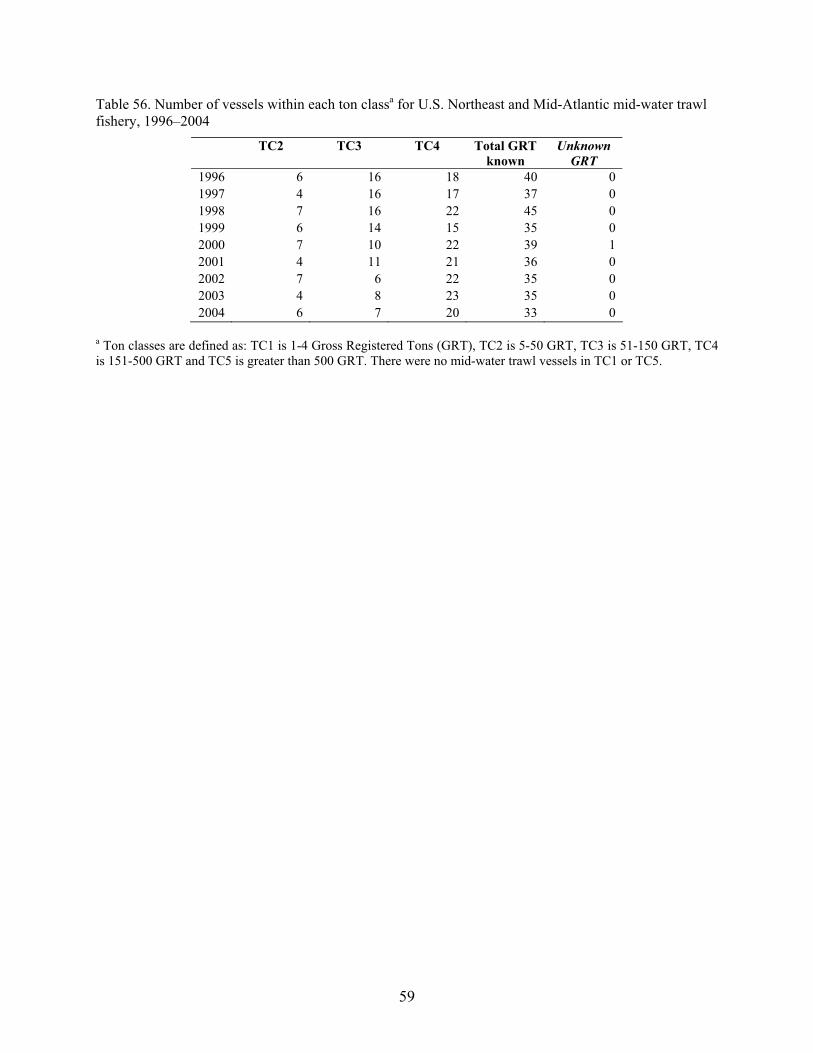
59
Table 56. Number of vessels within each ton classa for U.S. Northeast and Mid-Atlantic mid-water trawl fishery, 1996–2004
TC2 TC3 TC4 Total GRT known
Unknown GRT
1996 6 16 18 40 0 1997 4 16 17 37 0 1998 7 16 22 45 0 1999 6 14 15 35 0 2000 7 10 22 39 1 2001 4 11 21 36 0 2002 7 6 22 35 0 2003 4 8 23 35 0 2004 6 7 20 33 0
a Ton classes are defined as: TC1 is 1-4 Gross Registered Tons (GRT), TC2 is 5-50 GRT, TC3 is 51-150 GRT, TC4 is 151-500 GRT and TC5 is greater than 500 GRT. There were no mid-water trawl vessels in TC1 or TC5.

60
Table 57. Mean vessel characteristics by ton classa for U.S. Northeast and Mid-Atlantic mid-water trawl vessels, 1996–2004
TC2 TC3 TC4 Mean CV Mean CV Mean CV Average Vessel Horsepower (VHP)
1996 311 13 625 37 969 30 1997 285 18 632 75 957 32 1998 385 35 698 69 1,203 47 1999 427 31 709 72 1,152 53 2000 400 30 713 78 1,131 50 2001 431 46 649 81 1,281 50 2002 376 44 904 69 1,363 45 2003 411 29 802 70 1,315 48 2004 429 28 850 71 1,331 42
Average Vessel Length (Feet) 1996 42 22 75 8 93 20 1997 47 28 74 15 93 20 1998 45 12 75 15 98 19 1999 41 10 75 16 94 18 2000 39 10 78 14 94 17 2001 44 15 76 14 98 19 2002 40 17 81 17 102 22 2003 38 9 73 18 102 22 2004 39 8 75 19 104 22
Average Gross Registered Tons (GRT) 1996 25 54 118 17 181 8 1997 34 43 112 22 180 8 1998 31 35 118 20 197 35 1999 20 41 115 23 201 39 2000 17 53 121 17 198 35 2001 23 31 121 12 201 34 2002 18 20 127 11 204 38 2003 18 10 114 26 202 38 2004 19 17 117 26 206 39
a Ton classes are defined as: TC1 is 1-4 Gross Registered Tons (GRT), TC2 is 5-50 GRT, TC3 is 51-150 GRT, TC4 is 151-500 GRT and TC5 is greater than 500 GRT. There were no mid-water trawl vessels in TC1 or TC5.
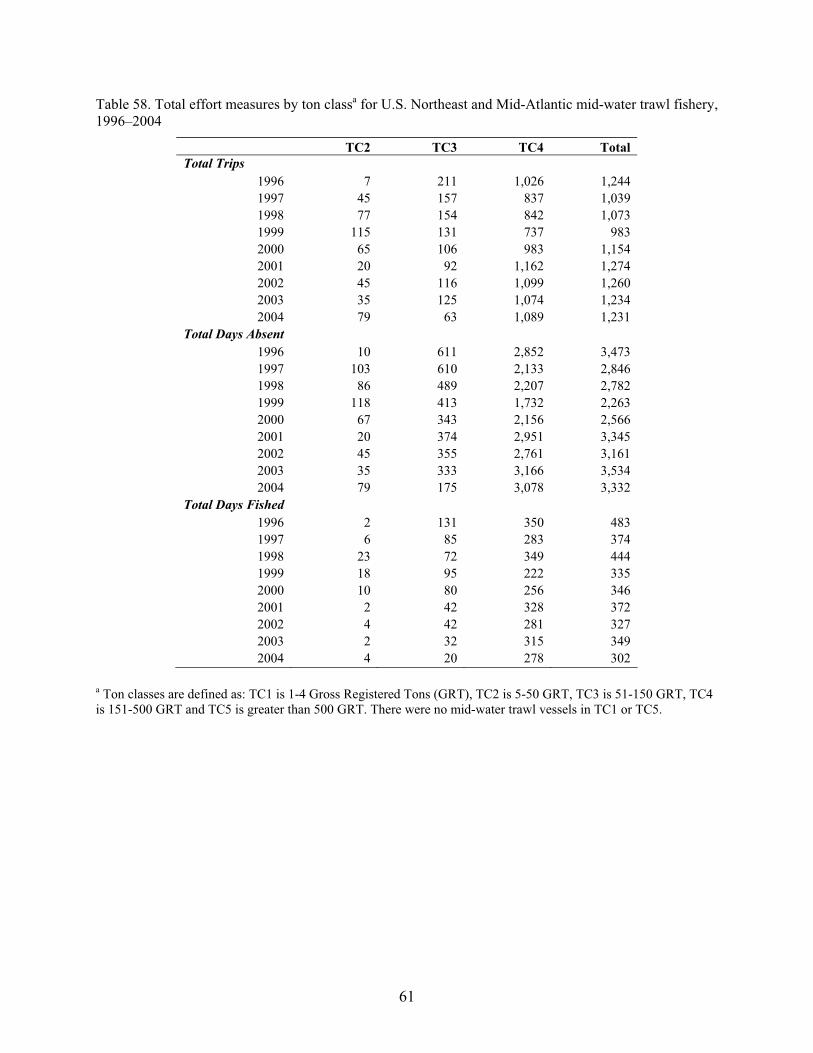
61
Table 58. Total effort measures by ton classa for U.S. Northeast and Mid-Atlantic mid-water trawl fishery, 1996–2004
TC2 TC3 TC4 Total Total Trips
1996 7 211 1,026 1,244 1997 45 157 837 1,039 1998 77 154 842 1,073 1999 115 131 737 983 2000 65 106 983 1,154 2001 20 92 1,162 1,274 2002 45 116 1,099 1,260 2003 35 125 1,074 1,234 2004 79 63 1,089 1,231
Total Days Absent 1996 10 611 2,852 3,473 1997 103 610 2,133 2,846 1998 86 489 2,207 2,782 1999 118 413 1,732 2,263 2000 67 343 2,156 2,566 2001 20 374 2,951 3,345 2002 45 355 2,761 3,161 2003 35 333 3,166 3,534 2004 79 175 3,078 3,332
Total Days Fished 1996 2 131 350 483 1997 6 85 283 374 1998 23 72 349 444 1999 18 95 222 335 2000 10 80 256 346 2001 2 42 328 372 2002 4 42 281 327 2003 2 32 315 349 2004 4 20 278 302
a Ton classes are defined as: TC1 is 1-4 Gross Registered Tons (GRT), TC2 is 5-50 GRT, TC3 is 51-150 GRT, TC4 is 151-500 GRT and TC5 is greater than 500 GRT. There were no mid-water trawl vessels in TC1 or TC5.

62
Table 59. Total landings (live weight) and calculated value (thousands dollars US) by ton classa for U.S. Northeast and Mid-Atlantic mid-water trawl fishery, 1996–2004
TC2 TC3 TC4 Total Total Harvest (live weight, metric tons)
1996 4 3,109 57,198 60,311 1997 769 2,845 54,180 57,794 1998 102 3,392 62,979 66,473 1999 325 3,822 59,813 63,960 2000 120 3,129 78,173 81,422 2001 23 6,375 103,238 109,636 2002 62 7,737 88,345 96,144 2003 43 9,247 109,121 118,411 2004 85 7,046 117,362 124,493
Total Nominal Calculated Value ($ ‘000) 1996 6 1,327 9,254 10,587 1997 101 1,522 9,243 10,866 1998 18 1,725 11,149 12,892 1999 49 1,281 8,633 9,963 2000 16 1,261 11,468 12,745 2001 3 1,214 13,907 15,124 2002 9 1,513 14,572 16,094 2003 7 1,956 19,378 21,341 2004 17 1,712 22,992 24,721
Total Inflation Adjustedb Calculated Value ($ ‘000)1996 6 1,414 9,861 11,281 1997 106 1,595 9,688 11,389 1998 19 1,788 11,557 13,364 1999 50 1,309 8,822 10,181 2000 16 1,261 11,468 12,745 2001 3 1,186 13,581 14,770 2002 9 1,452 13,987 15,448 2003 7 1,838 18,213 20,058 2004 16 1,565 21,013 22,593
a Ton classes are defined as: TC1 is 1-4 Gross Registered Tons (GRT), TC2 is 5-50 GRT, TC3 is 51-150 GRT, TC4 is 151-500 GRT and TC5 is greater than 500 GRT. There were no mid-water trawl vessels in TC1 or TC5. b Adjusted for inflation using the GDP implicit price deflator (2000=100) with a base year of 2000, so that all prices are relative to 2000 values.

63
Table 60. Mean annual landings (live weight) by ton classa for U.S. Northeast and Mid-Atlantic mid-water trawl fishery, 1996–2004 (metric tons)
TC2 TC3 TC4 Total Herring, Atlantic 169 2,029 67,123 69,320 Mackerel, Atlantic 0 2,391 13,360 15,750 All Other 2 765 674 1,441 Total 170 5,185 81,156 86,512
a Ton classes are defined as: TC1 is 1-4 Gross Registered Tons (GRT), TC2 is 5-50 GRT, TC3 is 51-150 GRT, TC4 is 151-500 GRT and TC5 is greater than 500 GRT. There were no mid-water trawl vessels in TC1 or TC5.
Table 61. Mean and CV for codend mesh size (inches) by fishing regiona for U.S. Northeast and Mid-Atlantic mid-water trawl fishery, 1996–2004.
Gulf of Maine
Georges Bank
North Southern
New England
South Southern
New England
Mid-Atlantic Unknown
1996 1.3 (42.3) 1.5 (41.7) 1.8 (38.7) - 3.6 (37.2) 1.2 (29.3) 1997 1.5 (35.1) 1.9 (97.1) 1.8 (43.5) - 3.7 (35.0) - 1998 1.8 (63.2) 1.4 (47.5) 1.9 (45.5) - 3.0 (47.9) 3.1 (68.6) 1999 1.4 (40.6) 1.1 (53.9) 2.2 (39.8) - 3.3 (50.3) 3.6 (0.0) 2000 1.5 (38.2) 1.5 (33.6) 1.9 (27.8) - 3.4 (42.9) - 2001 1.4 (42.0) 1.4 (27.1) 1.8 (30.2) - 3.4 (36.1) - 2002 1.4 (39.9) 1.5 (26.4) 1.6 (27.2) - 3.9 (17.3) 2.4 (-) 2003 1.4 (41.7) 1.3 (33.7) 1.7 (32.9) - 2.9 (72.9) - 2004 1.4 (43.8) 1.2 (22.7) 1.6 (33.0) - 2.2 (39.9) -
a Fishing region boundaries are illustrated in Figure 7.
Table 62. Average codend mesh size by ton classa of vessel for U.S. Northeast and Mid-Atlantic mid-water trawl fishery, 1996–2004 (CV in parentheses)
TC2 TC3 TC4 1996 5.1 (34.2) 2.8 (40.4) 1.3 (34.0) 1997 1.7 (44.9) 2.9 (44.6) 1.5 (39.6) 1998 2.3 (37.1) 2.8 (46.3) 1.7 (58.8) 1999 1.8 (32.2) 3.1 (37.3) 1.5 (46.3) 2000 2.0 (22.2) 2.9 (24.8) 1.5 (45.0) 2001 2.1 (15.1) 2.9 (35.2) 1.5 (47.6) 2002 1.9 (16.5) 2.1 (48.4) 1.4 (46.9) 2003 2.7 (56.1) 2.1 (48.5) 1.5 (43.6) 2004 2.5 (72.0) 2.7 (60.0) 1.4 (46.0)
a Ton classes are defined as: TC1 is 1-4 Gross Registered Tons (GRT), TC2 is 5-50 GRT, TC3 is 51-150 GRT, TC4 is 151-500 GRT and TC5 is greater than 500 GRT. There were no mid-water trawl vessels in TC1 or TC5.
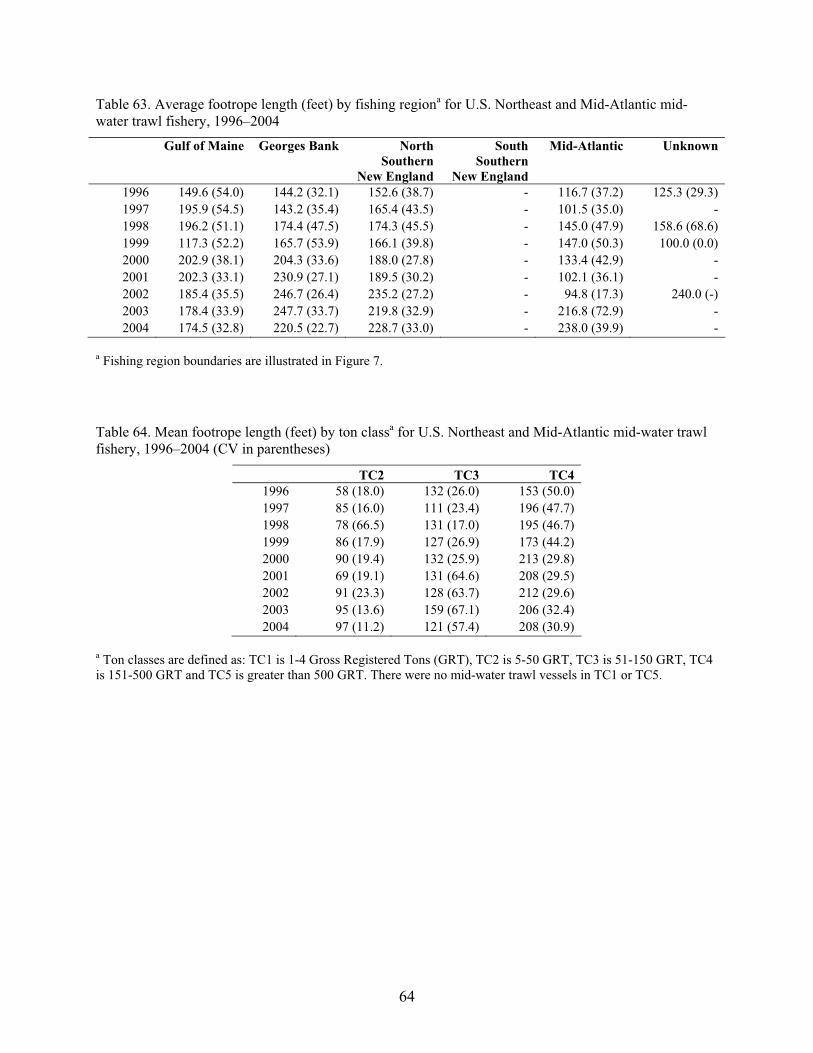
64
Table 63. Average footrope length (feet) by fishing regiona for U.S. Northeast and Mid-Atlantic mid-water trawl fishery, 1996–2004
Gulf of Maine Georges Bank North Southern
New England
South Southern
New England
Mid-Atlantic Unknown
1996 149.6 (54.0) 144.2 (32.1) 152.6 (38.7) - 116.7 (37.2) 125.3 (29.3) 1997 195.9 (54.5) 143.2 (35.4) 165.4 (43.5) - 101.5 (35.0) - 1998 196.2 (51.1) 174.4 (47.5) 174.3 (45.5) - 145.0 (47.9) 158.6 (68.6) 1999 117.3 (52.2) 165.7 (53.9) 166.1 (39.8) - 147.0 (50.3) 100.0 (0.0) 2000 202.9 (38.1) 204.3 (33.6) 188.0 (27.8) - 133.4 (42.9) - 2001 202.3 (33.1) 230.9 (27.1) 189.5 (30.2) - 102.1 (36.1) - 2002 185.4 (35.5) 246.7 (26.4) 235.2 (27.2) - 94.8 (17.3) 240.0 (-) 2003 178.4 (33.9) 247.7 (33.7) 219.8 (32.9) - 216.8 (72.9) - 2004 174.5 (32.8) 220.5 (22.7) 228.7 (33.0) - 238.0 (39.9) -
a Fishing region boundaries are illustrated in Figure 7. Table 64. Mean footrope length (feet) by ton classa for U.S. Northeast and Mid-Atlantic mid-water trawl fishery, 1996–2004 (CV in parentheses)
TC2 TC3 TC4 1996 58 (18.0) 132 (26.0) 153 (50.0) 1997 85 (16.0) 111 (23.4) 196 (47.7) 1998 78 (66.5) 131 (17.0) 195 (46.7) 1999 86 (17.9) 127 (26.9) 173 (44.2) 2000 90 (19.4) 132 (25.9) 213 (29.8) 2001 69 (19.1) 131 (64.6) 208 (29.5) 2002 91 (23.3) 128 (63.7) 212 (29.6) 2003 95 (13.6) 159 (67.1) 206 (32.4) 2004 97 (11.2) 121 (57.4) 208 (30.9)
a Ton classes are defined as: TC1 is 1-4 Gross Registered Tons (GRT), TC2 is 5-50 GRT, TC3 is 51-150 GRT, TC4 is 151-500 GRT and TC5 is greater than 500 GRT. There were no mid-water trawl vessels in TC1 or TC5.

65
Table 65. Total and annual distribution of days fished by SST groups (degrees Celsius) for U.S. Northeast and Mid-Atlantic mid-water trawl fishery, 1996–2004
1996 1997 1998 1999 2000 2001 2002 2003 2004 Total days fished 0 – 5 69 68 51 34 45 28 34 32 33 5-10 130 151 169 144 107 106 95 123 130 10-15 105 63 80 62 66 98 63 87 67 15 – 20 102 67 111 64 97 132 129 90 63 20 – 25 57 23 31 28 29 8 6 15 9 > 25 18 1 1 4 - 0 - 1 - TOTAL 481 373 443 335 345 372 327 349 302 Distribution (%) 0 – 5 14 18 12 10 13 8 10 9 11 5-10 27 40 38 43 31 28 29 35 43 10-15 22 17 18 19 19 26 19 25 22 15 – 20 21 18 25 19 28 36 40 26 21 20 – 25 12 6 7 8 8 2 2 4 3 > 25 4 0 0 1 - 0 - 0 -
Table 66. Total and annual distribution of hauls by SST groups (degrees Celsius) for U.S. Northeast and Mid-Atlantic mid-water trawl fishery, 1996–2004
1996 1997 1998 1999 2000 2001 2002 2003 2004 Total number of hauls 0 – 5 621 541 430 272 342 230 358 263 254 5-10 1,254 1,394 1,372 1,111 872 895 925 1,098 1,234 10-15 928 524 627 474 505 800 491 623 594 15 – 20 796 560 943 656 876 949 954 584 458 20 – 25 426 232 243 207 254 63 59 117 69 > 25 130 12 6 24 4 8 TOTAL 4,155 3,263 3,621 2,744 2,849 2,941 2,787 2,693 2,609 Distribution (%) 0 – 5 15 17 12 10 12 8 13 10 10 5-10 30 43 38 40 31 30 33 41 47 10-15 22 16 17 17 18 27 18 23 23 15 – 20 19 17 26 24 31 32 34 22 18 20 – 25 10 7 7 8 9 2 2 4 3 > 25 3 0 0 1 - 0 - 0 -

66
Table 67. Total and annual distribution of days fished by bottom depth groups (meters) for U.S. Northeast and Mid-Atlantic mid-water trawl fishery, 1996–2004
1996 1997 1998 1999 2000 2001 2002 2003 2004 Total days fished 0 – 50 153 126 158 120 152 89 65 84 100 50 – 100 131 132 126 111 85 141 131 146 107 100 – 200 125 93 129 92 97 134 116 109 89 200 - 2000 67 22 30 11 9 9 15 11 4 > 2000 4 1 1 2 TOTAL 481 373 443 335 345 372 327 349 302 Distribution (%) 0 – 50 32 34 36 36 44 24 20 24 33 50 – 100 27 35 28 33 25 38 40 42 35 100 – 200 26 25 29 27 28 36 35 31 29 200 - 2000 14 6 7 3 3 2 5 3 1 > 2000 1 - - 0 0 - - - 1
Table 68. Total and annual distribution of hauls by bottom depth groups (meters) for U.S. Northeast and Mid-Atlantic mid-water trawl fishery, 1996–2004
1996 1997 1998 1999 2000 2001 2002 2003 2004 Total number of hauls 0 - 50 1,442 1,217 1,429 994 1,344 861 670 699 816 50 - 100 1,090 1,170 985 954 659 1,097 1,140 1,134 1,040 100 - 200 1,012 732 955 691 769 899 877 774 672 200 - 2000 565 144 252 93 67 84 100 86 56 > 2000 46 . . 12 10 . . . 25 TOTAL 4,155 3,263 3,621 2,744 2,849 2,941 2,787 2,693 2,609 Distribution (%) 0 - 50 35 37 39 36 47 29 24 26 31 50 - 100 26 36 27 35 23 37 41 42 40 100 - 200 24 22 26 25 27 31 31 29 26 200 - 2000 14 4 7 3 2 3 4 3 2 > 2000 1 - - 0 0 - - - 1

67
Table 69. Total and distribution of days fished by bottom slope groups (degree) for U.S. Northeast and Mid-Atlantic mid-water trawl fishery, 1996–2004
1996 1997 1998 1999 2000 2001 2002 2003 2004 Total days fished 0 - 0.5 331 327 340 296 301 306 273 290 277 0.5 - 1.0. 52 26 54 27 33 55 42 47 21 1.0 - 4.0 68 14 40 6 4 9 10 11 3 > 4.0 30 6 9 6 6 3 2 1 1 TOTAL 481 373 443 335 345 372 327 349 302 Distribution (%) 0 - 0.5 69 88 77 88 87 82 83 83 92 0.5 - 1.0. 11 7 12 8 9 15 13 14 7 1.0 - 4.0 14 4 9 2 1 2 3 3 1 > 4.0 6 2 2 2 2 1 0 0 0 Table 70. Total and annual distribution of hauls by bottom slope groups (degree) for U.S. Northeast and Mid-Atlantic mid-water trawl fishery, 1996–2004.
1996 1997 1998 1999 2000 2001 2002 2003 2004 Total number of hauls 0 - 0.5 2,899 2,912 2,823 2,431 2,547 2,454 2,392 2,289 2,380 0.5 - 1.0. 407 182 401 202 222 367 304 295 148 1.0 - 4.0 622 122 317 54 36 83 79 106 63 > 4.0 227 47 80 57 44 37 12 3 18 TOTAL 4,155 3,263 3,621 2,744 2,849 2,941 2,787 2,693 2,609 Distribution (%) 0 - 0.5 70 89 78 89 89 83 86 85 91 0.5 - 1.0. 10 6 11 7 8 12 11 11 6 1.0 - 4.0 15 4 9 2 1 3 3 4 2 > 4.0 5 1 2 2 2 1 0 0 1

68
Figure 1. Regulated Mesh Areas (RMA) as defined under the Northeast Multispecies Fishery Management Plan (FMP) including Gulf of Maine (GOM) RMA, Georges Bank (GB) RMA, Southern New England (SNE) RMA and Mid-Atlantic (MA) RMA
Mid-AtlanticRMA
Southern New England
RMA
Georges BankRMA
Gulf of MaineRMA
66°0'W
66°0'W
67°0'W
67°0'W
68°0'W
68°0'W
69°0'W
69°0'W
70°0'W
70°0'W
71°0'W
71°0'W
72°0'W
72°0'W
73°0'W
73°0'W
74°0'W
74°0'W
75°0'W
75°0'W
76°0'W
76°0'W
77°0'W
77°0'W
45°0'N 45°0'N
44°0'N 44°0'N
43°0'N 43°0'N
42°0'N 42°0'N
41°0'N 41°0'N
40°0'N 40°0'N
39°0'N 39°0'N
38°0'N 38°0'N
37°0'N 37°0'N
36°0'N 36°0'N
35°0'N 35°0'N
34°0'N 34°0'N
33°0'N 33°0'N
EEZ
50-m contour
100-m contour ±0 100 20050 Miles

69
Figure 2. Seasonal closure areas defined under the Northeast Multispecies Fishery Management Plan (FMP) including the Gulf of Maine Rolling Closure Areas (RCA I – V) and Georges Bank Seasonal Closure Area
66°0'W
66°0'W
67°0'W
67°0'W
68°0'W
68°0'W
69°0'W
69°0'W
70°0'W
70°0'W
71°0'W
71°0'W
72°0'W
72°0'W
73°0'W
73°0'W
74°0'W
74°0'W
75°0'W
75°0'W
76°0'W
76°0'W
77°0'W
77°0'W
45°0'N 45°0'N
44°0'N 44°0'N
43°0'N 43°0'N
42°0'N 42°0'N
41°0'N 41°0'N
40°0'N 40°0'N
39°0'N 39°0'N
38°0'N 38°0'N
37°0'N 37°0'N
36°0'N 36°0'N
35°0'N 35°0'N
34°0'N 34°0'N
33°0'N 33°0'N
EEZ
50-m contour
100-m contour ±0 100 20050 Miles
Rolling Closure Area VOctober 1 - November 30
Closed Area
66°0'W
66°0'W
67°0'W
67°0'W
68°0'W
68°0'W
69°0'W
69°0'W
70°0'W
70°0'W
71°0'W
71°0'W
72°0'W
72°0'W
73°0'W
73°0'W
74°0'W
74°0'W
75°0'W
75°0'W
76°0'W
76°0'W
77°0'W
77°0'W
45°0'N 45°0'N
44°0'N 44°0'N
43°0'N 43°0'N
42°0'N 42°0'N
41°0'N 41°0'N
40°0'N 40°0'N
39°0'N 39°0'N
38°0'N 38°0'N
37°0'N 37°0'N
36°0'N 36°0'N
35°0'N 35°0'N
34°0'N 34°0'N
33°0'N 33°0'N
EEZ
50-m contour
100-m contour ±0 100 20050 Miles
Georges Bank Seasonal Closure Area
May 1 - 31
Closed Area
66°0'W
66°0'W
67°0'W
67°0'W
68°0'W
68°0'W
69°0'W
69°0'W
70°0'W
70°0'W
71°0'W
71°0'W
72°0'W
72°0'W
73°0'W
73°0'W
74°0'W
74°0'W
75°0'W
75°0'W
76°0'W
76°0'W
77°0'W
77°0'W
45°0'N 45°0'N
44°0'N 44°0'N
43°0'N 43°0'N
42°0'N 42°0'N
41°0'N 41°0'N
40°0'N 40°0'N
39°0'N 39°0'N
38°0'N 38°0'N
37°0'N 37°0'N
36°0'N 36°0'N
35°0'N 35°0'N
34°0'N 34°0'N
33°0'N 33°0'N
EEZ
50-m contour
100-m contour ±0 100 20050 Miles
Rolling Closure Area IMarch 1- 31
Closed Area
66°0'W
66°0'W
67°0'W
67°0'W
68°0'W
68°0'W
69°0'W
69°0'W
70°0'W
70°0'W
71°0'W
71°0'W
72°0'W
72°0'W
73°0'W
73°0'W
74°0'W
74°0'W
75°0'W
75°0'W
76°0'W
76°0'W
77°0'W
77°0'W
45°0'N 45°0'N
44°0'N 44°0'N
43°0'N 43°0'N
42°0'N 42°0'N
41°0'N 41°0'N
40°0'N 40°0'N
39°0'N 39°0'N
38°0'N 38°0'N
37°0'N 37°0'N
36°0'N 36°0'N
35°0'N 35°0'N
34°0'N 34°0'N
33°0'N 33°0'N
EEZ
50-m contour
100-m contour ±0 100 20050 Miles
Rolling Closure Area IIApril 1 - 30
Closed Area
66°0'W
66°0'W
67°0'W
67°0'W
68°0'W
68°0'W
69°0'W
69°0'W
70°0'W
70°0'W
71°0'W
71°0'W
72°0'W
72°0'W
73°0'W
73°0'W
74°0'W
74°0'W
75°0'W
75°0'W
76°0'W
76°0'W
77°0'W
77°0'W
45°0'N 45°0'N
44°0'N 44°0'N
43°0'N 43°0'N
42°0'N 42°0'N
41°0'N 41°0'N
40°0'N 40°0'N
39°0'N 39°0'N
38°0'N 38°0'N
37°0'N 37°0'N
36°0'N 36°0'N
35°0'N 35°0'N
34°0'N 34°0'N
33°0'N 33°0'N
EEZ
50-m contour
100-m contour ±0 100 20050 Miles
Rolling Closure Area IIIMay 1 - 31
Closed Area
66°0'W
66°0'W
67°0'W
67°0'W
68°0'W
68°0'W
69°0'W
69°0'W
70°0'W
70°0'W
71°0'W
71°0'W
72°0'W
72°0'W
73°0'W
73°0'W
74°0'W
74°0'W
75°0'W
75°0'W
76°0'W
76°0'W
77°0'W
77°0'W
45°0'N 45°0'N
44°0'N 44°0'N
43°0'N 43°0'N
42°0'N 42°0'N
41°0'N 41°0'N
40°0'N 40°0'N
39°0'N 39°0'N
38°0'N 38°0'N
37°0'N 37°0'N
36°0'N 36°0'N
35°0'N 35°0'N
34°0'N 34°0'N
33°0'N 33°0'N
EEZ
50-m contour
100-m contour ±0 100 20050 Miles
Rolling Closure Area IVJune 1 - 30
Closed Area

70
Figure 3. Year-round closure areas under the Northeast Multispecies Fishery Management Plan, including general (FMP) closures and Essential Fish Habitat (EFH) areas closed to bottom trawl gear
CA II
CA INantucket
Lightship CA
Western Gulf of Maine CA
Cashes Ledge CA
64°0'W
64°0'W
66°0'W
66°0'W
68°0'W
68°0'W
70°0'W
70°0'W
72°0'W
72°0'W
74°0'W
74°0'W
76°0'W
76°0'W
78°0'W
78°0'W
46°0'N 46°0'N
45°0'N 45°0'N
44°0'N 44°0'N
43°0'N 43°0'N
42°0'N 42°0'N
41°0'N 41°0'N
40°0'N 40°0'N
39°0'N 39°0'N
38°0'N 38°0'N
37°0'N 37°0'N
36°0'N 36°0'N
35°0'N 35°0'N
34°0'N 34°0'N
33°0'N 33°0'N
32°0'N 32°0'N
EEZ
50-m contour
100-m contour ±0 125 25062.5 Miles
Multispecies Closed Areas (CA)
Essential Fish Habitat Closed Areas
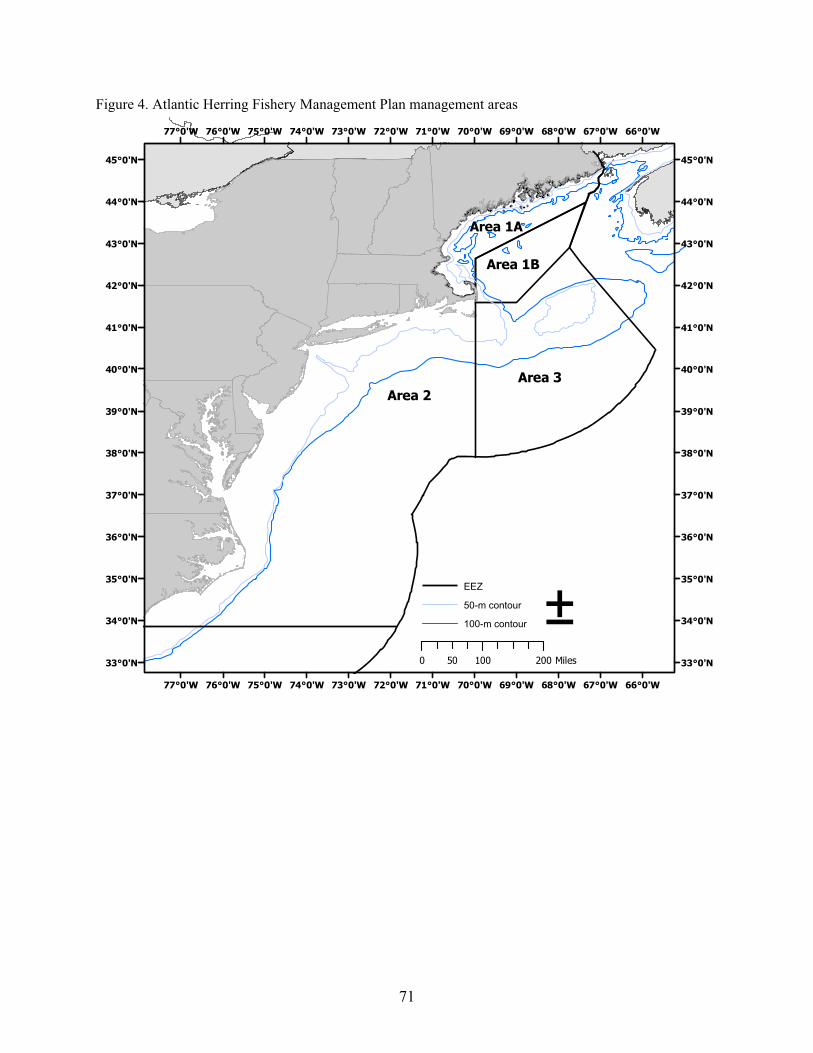
71
Figure 4. Atlantic Herring Fishery Management Plan management areas
Area 1A
Area 1B
Area 3Area 2
66°0'W
66°0'W
67°0'W
67°0'W
68°0'W
68°0'W
69°0'W
69°0'W
70°0'W
70°0'W
71°0'W
71°0'W
72°0'W
72°0'W
73°0'W
73°0'W
74°0'W
74°0'W
75°0'W
75°0'W
76°0'W
76°0'W
77°0'W
77°0'W
45°0'N 45°0'N
44°0'N 44°0'N
43°0'N 43°0'N
42°0'N 42°0'N
41°0'N 41°0'N
40°0'N 40°0'N
39°0'N 39°0'N
38°0'N 38°0'N
37°0'N 37°0'N
36°0'N 36°0'N
35°0'N 35°0'N
34°0'N 34°0'N
33°0'N 33°0'N
EEZ
50-m contour
100-m contour ±0 100 20050 Miles
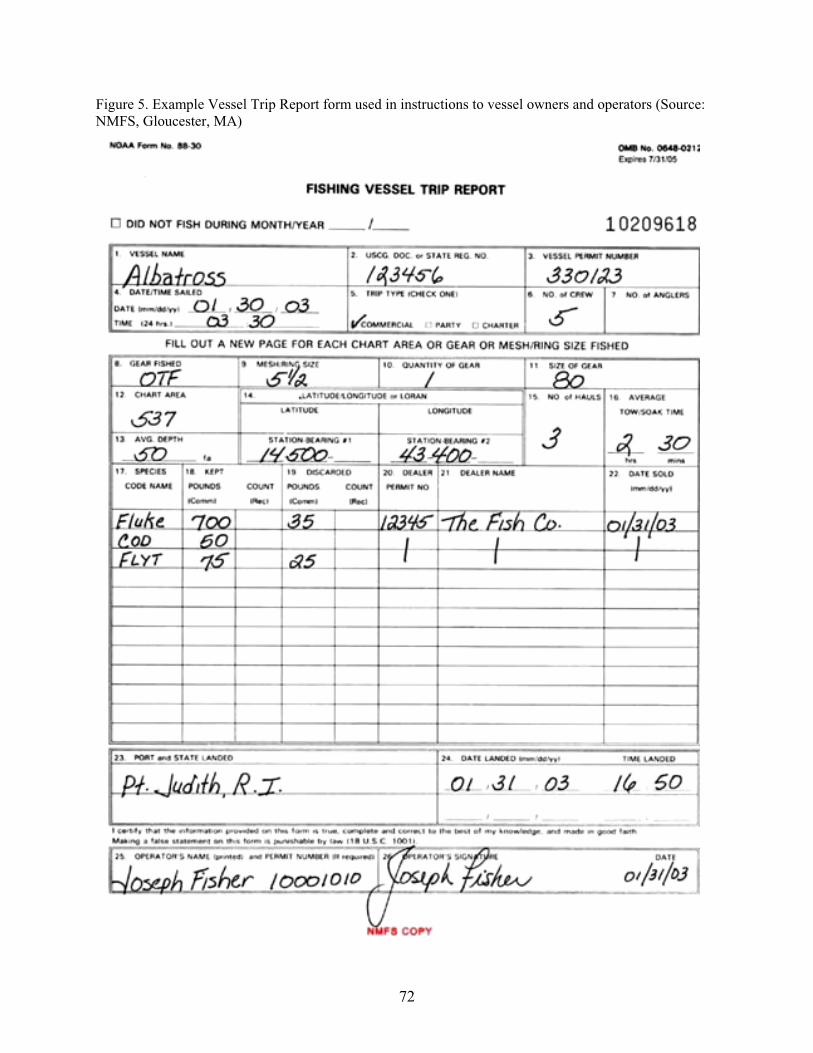
72
Figure 5. Example Vessel Trip Report form used in instructions to vessel owners and operators (Source: NMFS, Gloucester, MA)
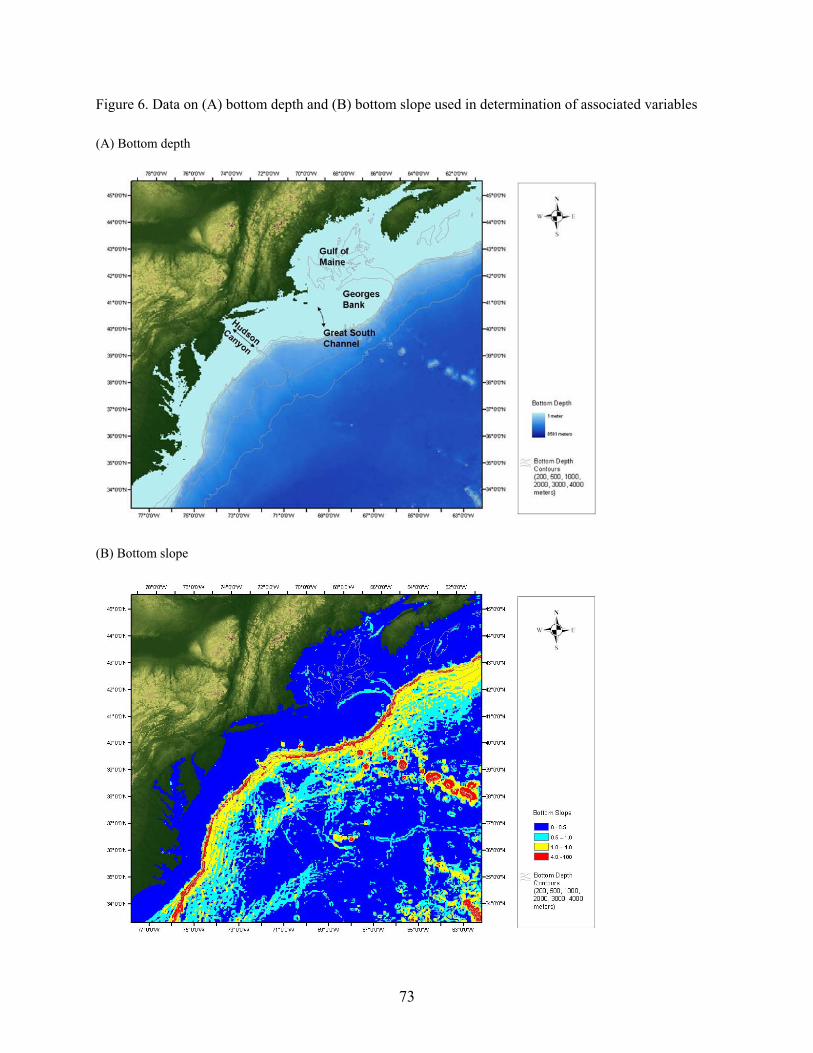
73
Figure 6. Data on (A) bottom depth and (B) bottom slope used in determination of associated variables (A) Bottom depth
(B) Bottom slope
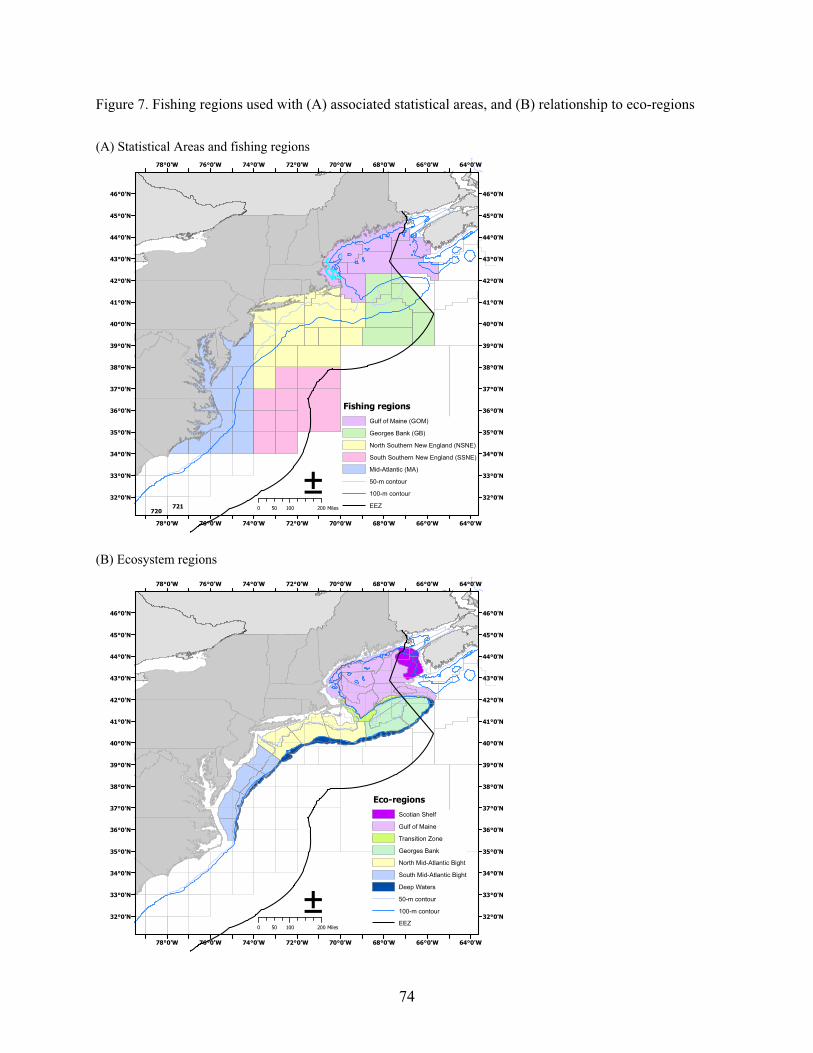
74
Figure 7. Fishing regions used with (A) associated statistical areas, and (B) relationship to eco-regions
(A) Statistical Areas and fishing regions
720721
64°0'W
64°0'W
66°0'W
66°0'W
68°0'W
68°0'W
70°0'W
70°0'W
72°0'W
72°0'W
74°0'W
74°0'W
76°0'W
76°0'W
78°0'W
78°0'W
46°0'N 46°0'N
45°0'N 45°0'N
44°0'N 44°0'N
43°0'N 43°0'N
42°0'N 42°0'N
41°0'N 41°0'N
40°0'N 40°0'N
39°0'N 39°0'N
38°0'N 38°0'N
37°0'N 37°0'N
36°0'N 36°0'N
35°0'N 35°0'N
34°0'N 34°0'N
33°0'N 33°0'N
32°0'N 32°0'N
Gulf of Maine (GOM)
Georges Bank (GB)
North Southern New England (NSNE)
South Southern New England (SSNE)
Mid-Atlantic (MA)
50-m contour
100-m contour
EEZ
±0 100 20050 Miles
Fishing regions
(B) Ecosystem regions
64°0'W
64°0'W
66°0'W
66°0'W
68°0'W
68°0'W
70°0'W
70°0'W
72°0'W
72°0'W
74°0'W
74°0'W
76°0'W
76°0'W
78°0'W
78°0'W
46°0'N 46°0'N
45°0'N 45°0'N
44°0'N 44°0'N
43°0'N 43°0'N
42°0'N 42°0'N
41°0'N 41°0'N
40°0'N 40°0'N
39°0'N 39°0'N
38°0'N 38°0'N
37°0'N 37°0'N
36°0'N 36°0'N
35°0'N 35°0'N
34°0'N 34°0'N
33°0'N 33°0'N
32°0'N 32°0'N
Scotian Shelf
Gulf of Maine
Transition Zone
Georges Bank
North Mid-Atlantic Bight
South Mid-Atlantic Bight
Deep Waters
50-m contour
100-m contour
EEZ
±0 100 20050 Miles
Eco-regions

75
Figure 8. Distribution of U.S. Northeast and Mid-Atlantic bottom trawl effort, in days fished, over the period 1996–2004
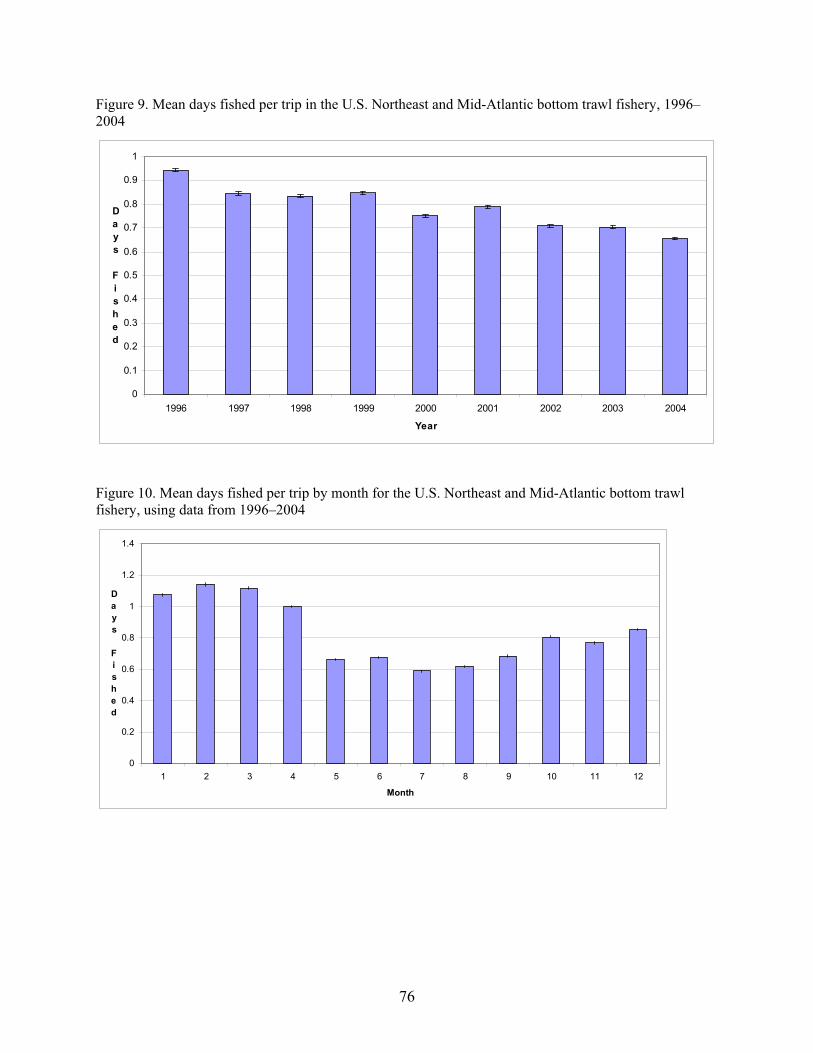
76
Figure 9. Mean days fished per trip in the U.S. Northeast and Mid-Atlantic bottom trawl fishery, 1996–2004
0
0.1
0.2
0.3
0.4
0.5
0.6
0.7
0.8
0.9
1
1996 1997 1998 1999 2000 2001 2002 2003 2004
Year
Days
Fished
Figure 10. Mean days fished per trip by month for the U.S. Northeast and Mid-Atlantic bottom trawl fishery, using data from 1996–2004
0
0.2
0.4
0.6
0.8
1
1.2
1.4
1 2 3 4 5 6 7 8 9 10 11 12
Month
Days
Fished
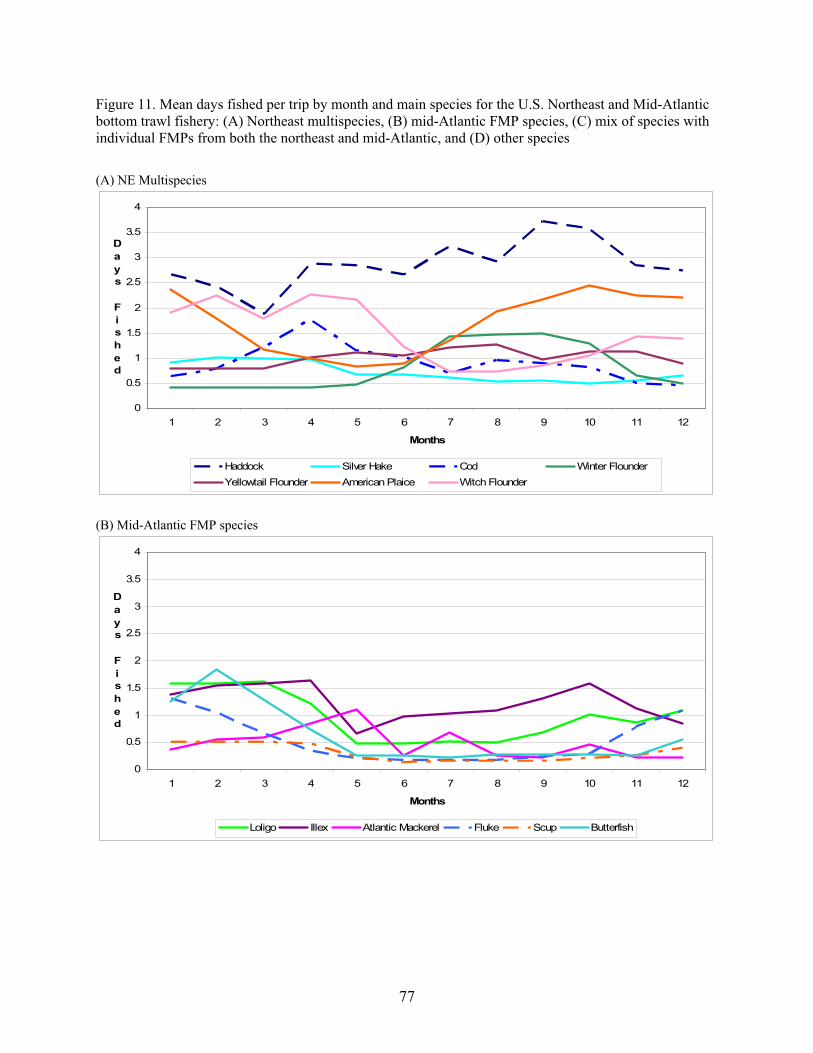
77
Figure 11. Mean days fished per trip by month and main species for the U.S. Northeast and Mid-Atlantic bottom trawl fishery: (A) Northeast multispecies, (B) mid-Atlantic FMP species, (C) mix of species with individual FMPs from both the northeast and mid-Atlantic, and (D) other species
(A) NE Multispecies
0
0.5
1
1.5
2
2.5
3
3.5
4
1 2 3 4 5 6 7 8 9 10 11 12
Months
Days
Fished
Haddock Silver Hake Cod Winter FlounderYellowtail Flounder American Plaice Witch Flounder
(B) Mid-Atlantic FMP species
0
0.5
1
1.5
2
2.5
3
3.5
4
1 2 3 4 5 6 7 8 9 10 11 12
Months
Days
Fished
Loligo Illex Atlantic Mackerel Fluke Scup Butterfish

78
Figure 11 continued. (C) Other FMP species
0
0.5
1
1.5
2
2.5
3
3.5
1 2 3 4 5 6 7 8 9 10 11 12
Months
Days
Fished
Dogfish (Spiny and Unidentified) Skates Monkfish Atlantic Herring Atlantic Croaker
(D) “Other” categories
0
0.5
1
1.5
2
2.5
3
3.5
4
1 2 3 4 5 6 7 8 9 10 11 12
Months
Days
Fished
Other Groundfish Other Finfish Other Invertebrates Other Species
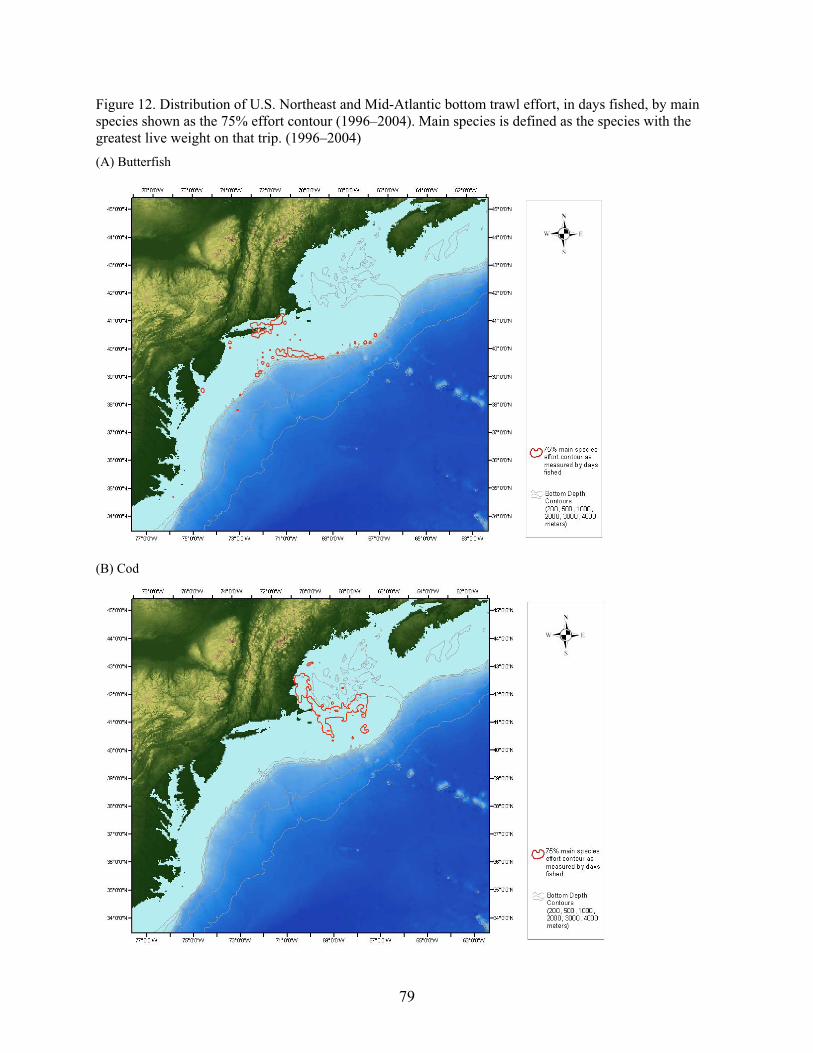
79
Figure 12. Distribution of U.S. Northeast and Mid-Atlantic bottom trawl effort, in days fished, by main species shown as the 75% effort contour (1996–2004). Main species is defined as the species with the greatest live weight on that trip. (1996–2004) (A) Butterfish
(B) Cod

80
Figure 12 continued. (C) Atlantic croaker
(D) Spiny dogfish
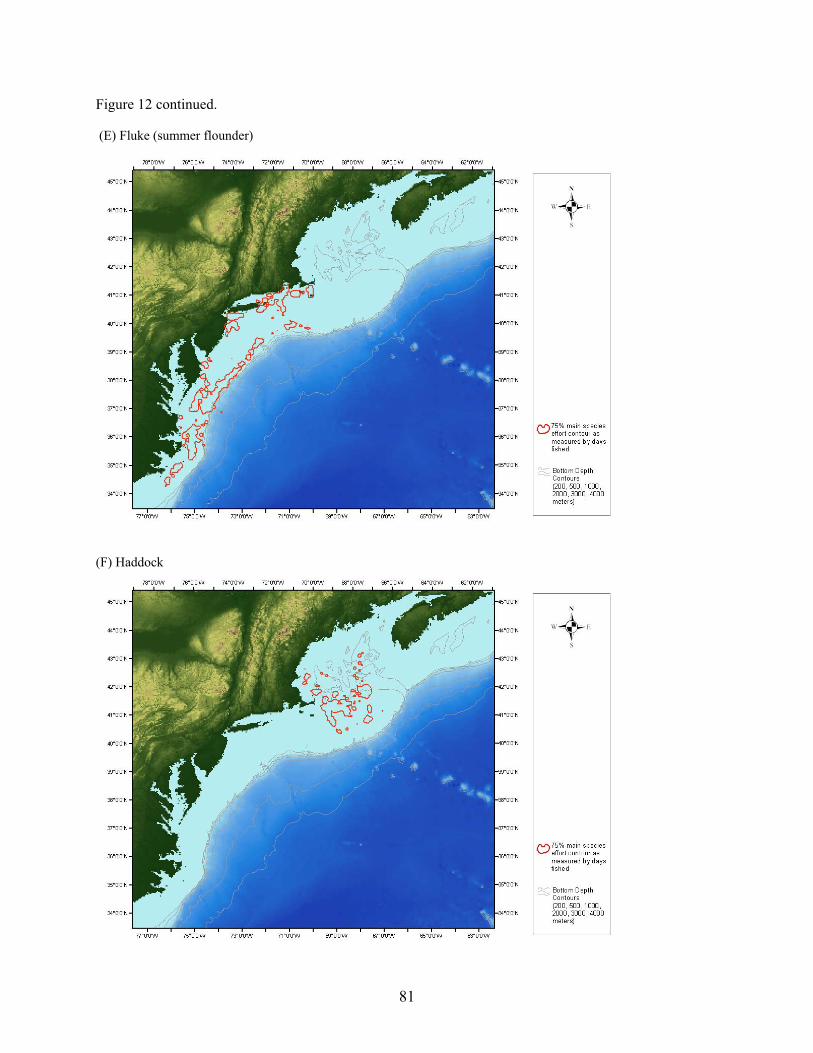
81
Figure 12 continued. (E) Fluke (summer flounder)
(F) Haddock

82
Figure 12 continued. (G) Atlantic herring
(H) Illex squid

83
Figure 12 continued. (I) Loligo squid
(J) Atlantic mackerel

84
Figure 12 continued. (K) Monkfish
(L) American plaice

85
Figure 12 continued. (M) Scup
(N) Silver hake
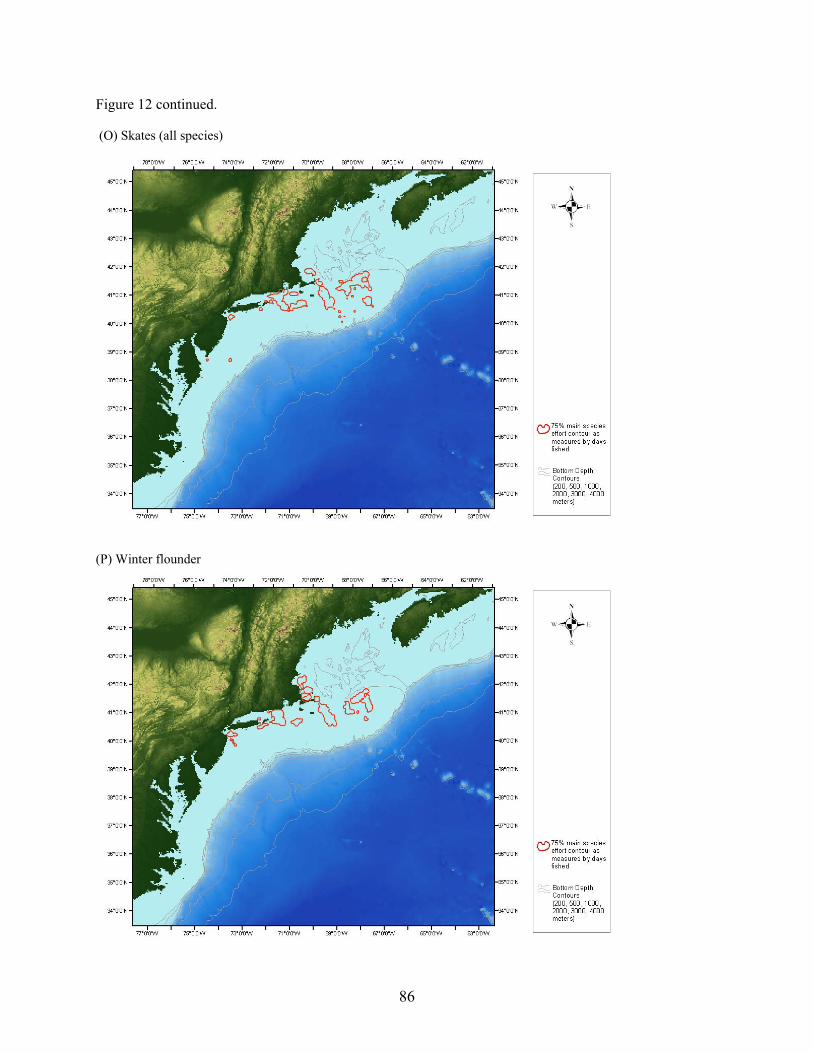
86
Figure 12 continued. (O) Skates (all species)
(P) Winter flounder

87
Figure 12 continued. (Q) Witch flounder
(R) Yellowtail flounder

88
Figure 13. Mean number of hauls per trip for the U.S. Northeast and Mid-Atlantic bottom trawl fishery, 1996–2004
0
1
2
3
4
5
6
7
8
9
1996 1997 1998 1999 2000 2001 2002 2003 2004
Year
Hauls
Figure 14. Mean average tow time per haul for the U.S. Northeast and Mid-Atlantic bottom trawl fishery, 1996–2004 (hours)
2.2
2.3
2.4
2.5
2.6
2.7
2.8
1996 1997 1998 1999 2000 2001 2002 2003 2004
Year
Tow
Time
(
hrs
)

89
Figure 15. Mean hauls per trip by month over 1996–2004, for the U.S. Northeast and Mid-Atlantic bottom trawl fishery
0
1
2
3
4
5
6
7
8
9
10
1 2 3 4 5 6 7 8 9 10 11 12
Month
Haul
s
Figure 16. Mean average tow time per haul by month over 1996–2004, for the U.S. Northeast and Mid-Atlantic bottom trawl fishery (hours)
0
0.5
1
1.5
2
2.5
3
3.5
1 2 3 4 5 6 7 8 9 10 11 12
Month
Tow
Time
(hrs
)
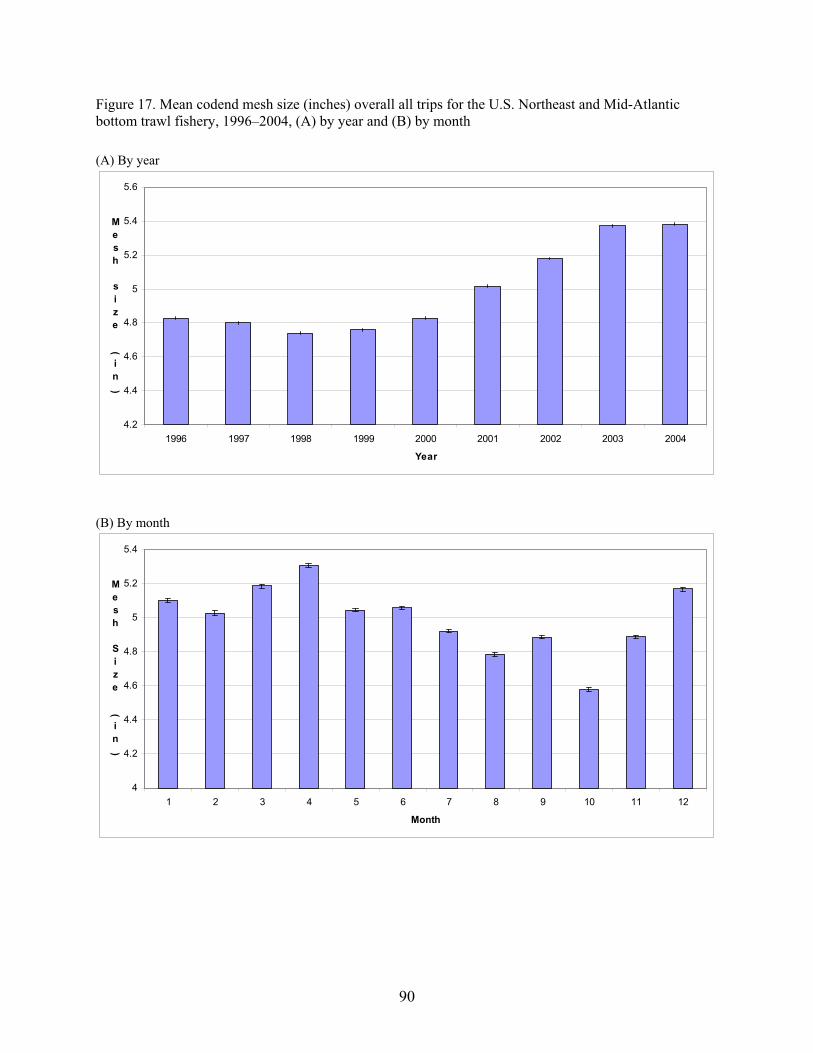
90
Figure 17. Mean codend mesh size (inches) overall all trips for the U.S. Northeast and Mid-Atlantic bottom trawl fishery, 1996–2004, (A) by year and (B) by month (A) By year
4.2
4.4
4.6
4.8
5
5.2
5.4
5.6
1996 1997 1998 1999 2000 2001 2002 2003 2004
Year
Mesh
size
(
in
)
(B) By month
4
4.2
4.4
4.6
4.8
5
5.2
5.4
1 2 3 4 5 6 7 8 9 10 11 12
Month
Mesh
Size
(
in
)
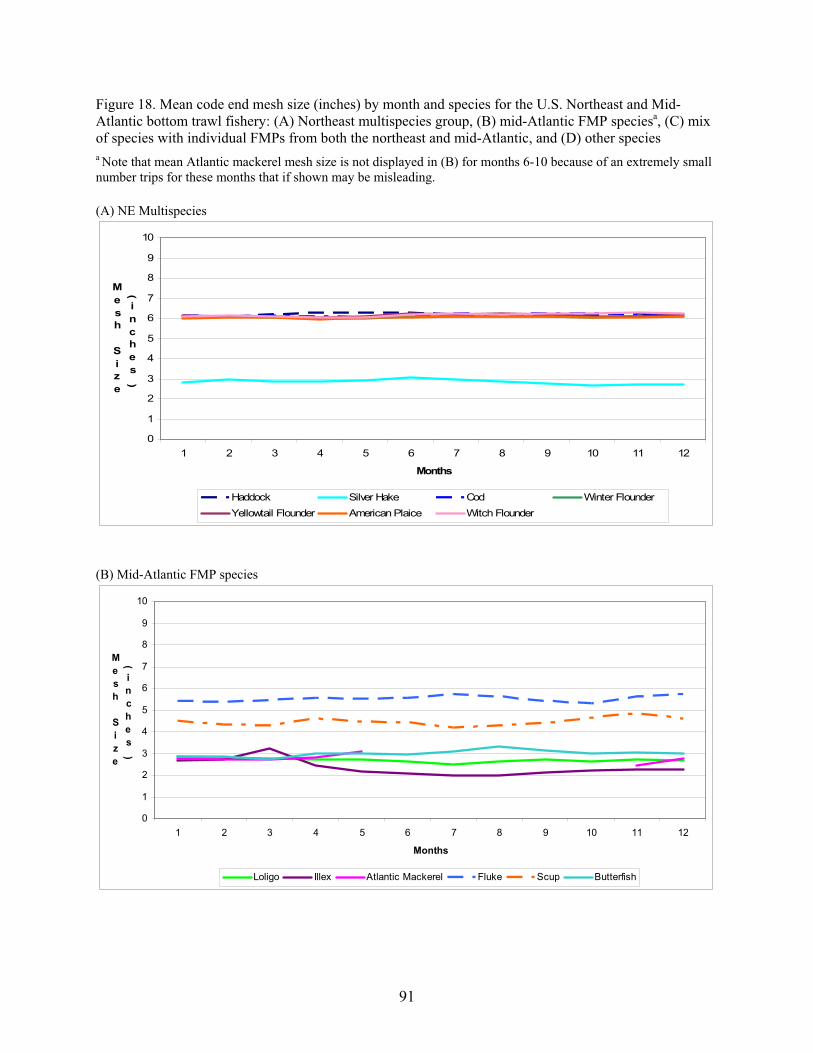
91
Figure 18. Mean code end mesh size (inches) by month and species for the U.S. Northeast and Mid-Atlantic bottom trawl fishery: (A) Northeast multispecies group, (B) mid-Atlantic FMP speciesa, (C) mix of species with individual FMPs from both the northeast and mid-Atlantic, and (D) other species a Note that mean Atlantic mackerel mesh size is not displayed in (B) for months 6-10 because of an extremely small number trips for these months that if shown may be misleading. (A) NE Multispecies
0
1
2
3
4
5
6
7
8
9
10
1 2 3 4 5 6 7 8 9 10 11 12
Months
Mesh
Size
(
inches
)
Haddock Silver Hake Cod Winter FlounderYellowtail Flounder American Plaice Witch Flounder
(B) Mid-Atlantic FMP species
0
1
2
3
4
5
6
7
8
9
10
1 2 3 4 5 6 7 8 9 10 11 12
Months
Mesh
Size
(inches
)
Loligo Illex Atlantic Mackerel Fluke Scup Butterfish

92
Figure 18 continued. (C) Other FMP species
0
1
2
3
4
5
6
7
8
9
10
1 2 3 4 5 6 7 8 9 10 11 12
Months
Mesh
Size
(
inches
)
Dogfish (Spiny and Unidentified) Skates Monkfish Atlantic Herring Atlantic Croaker
(D) “Other” categories
0
1
2
3
4
5
6
7
8
9
10
1 2 3 4 5 6 7 8 9 10 11 12
Months
Mesh
size
(
inches
)
Other Groundfish Other Finfish Other Invertebrates Other Species

93
Figure 19. Mean gear size in feet of footrope length for the U.S. Northeast and Mid-Atlantic bottom trawl fishery (A) by year and (B) by month over 1996–2004
(A) By year
80
81
82
83
84
85
86
87
88
89
1996 1997 1998 1999 2000 2001 2002 2003 2004
Year
Foot
Rope
Length
(
ft
)
(B) By Month
70
75
80
85
90
95
100
1 2 3 4 5 6 7 8 9 10 11 12
Month
Foot
Rope
Length
(ft
)

94
Figure 20. Mean gear size (footrope length in feet) by month and species for the U.S. Northeast and Mid-Atlantic bottom trawl fishery: (A) Northeast multispecies group, (B) mid-Atlantic FMP speciesa, (C) mix of species with individual FMPs from both the northeast and mid-Atlantic, and (D) other species a Note that mean Atlantic mackerel gear size is not displayed in (B) for months 6-10 because of an extremely small number trips for these months that if shown may be misleading. (A) NE multispecies
0
20
40
60
80
100
120
140
160
180
200
1 2 3 4 5 6 7 8 9 10 11 12
Months
Foot
Rope
Length
(
ft
)
Haddock Silver Hake Cod Winter FlounderYellowtail Flounder American Plaice Witch Flounder
(B) Mid-Atlantic FMP species
0
20
40
60
80
100
120
140
160
180
200
1 2 3 4 5 6 7 8 9 10 11 12
Months
Foot
Rope
Length
(
ft
)
Loligo Illex Atlantic Mackerel Fluke Scup Butterfish
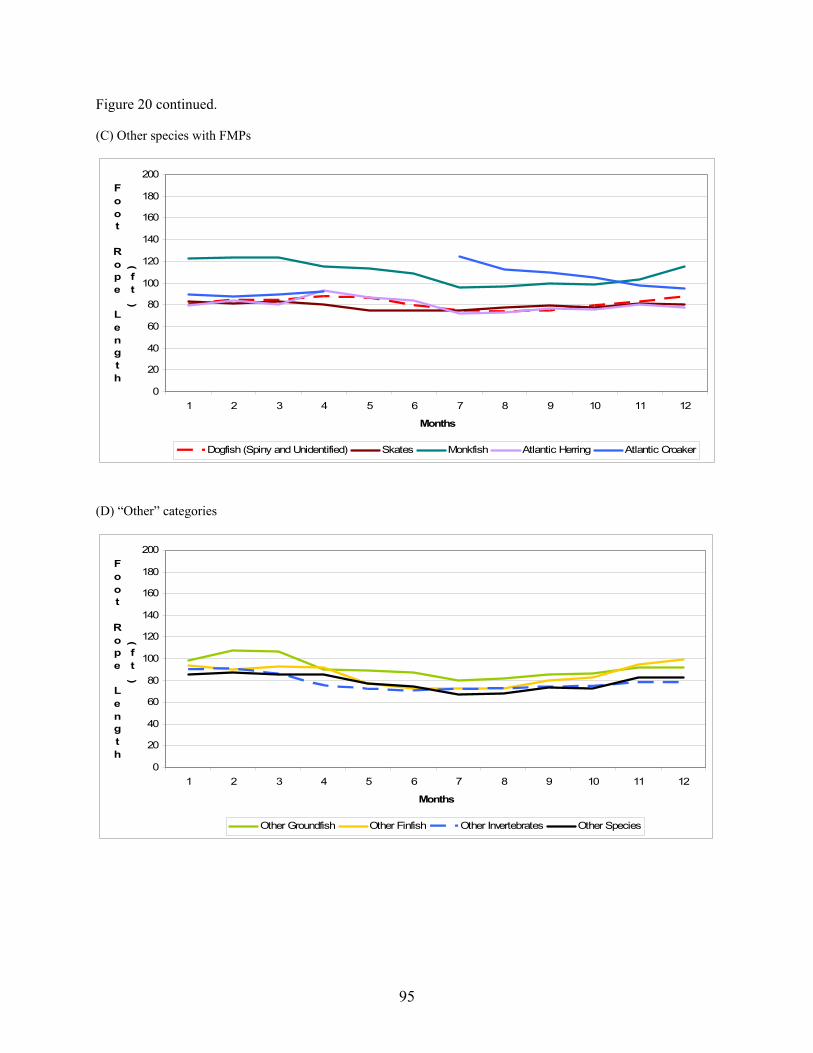
95
Figure 20 continued. (C) Other species with FMPs
0
20
40
60
80
100
120
140
160
180
200
1 2 3 4 5 6 7 8 9 10 11 12
Months
Foot
Rope
Length
(
ft
)
Dogfish (Spiny and Unidentified) Skates Monkfish Atlantic Herring Atlantic Croaker
(D) “Other” categories
0
20
40
60
80
100
120
140
160
180
200
1 2 3 4 5 6 7 8 9 10 11 12
Months
Foot
Rope
Length
(
ft
)
Other Groundfish Other Finfish Other Invertebrates Other Species
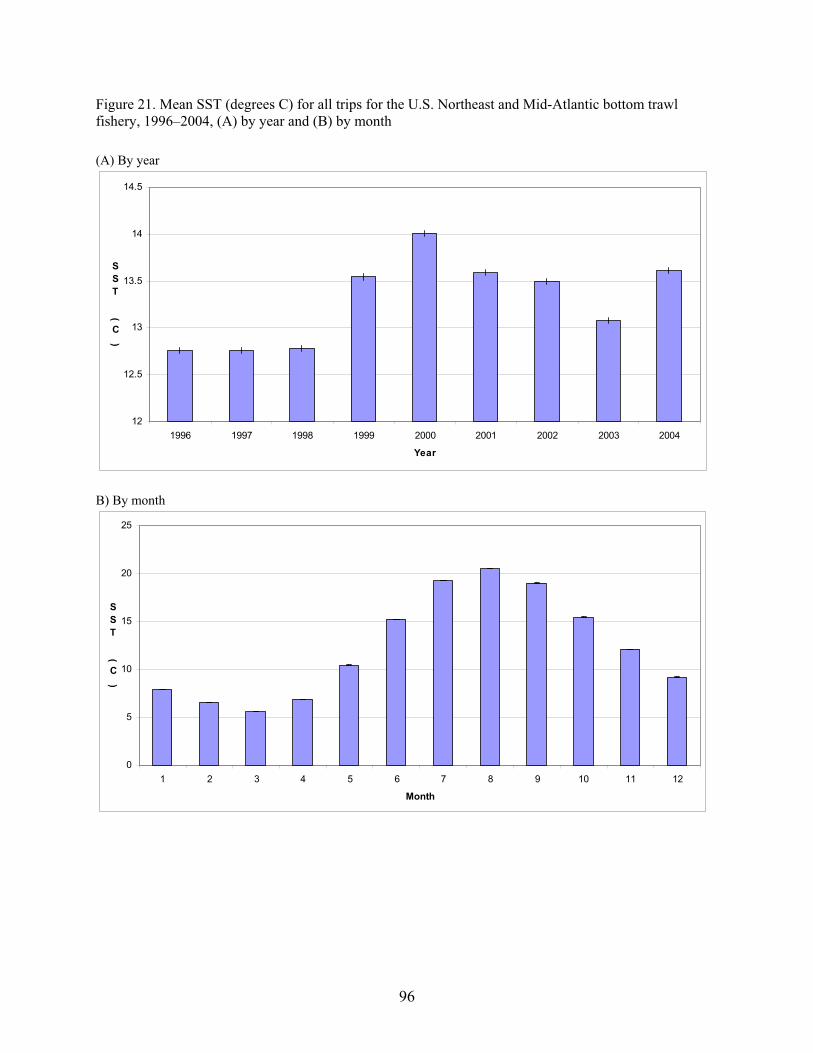
96
Figure 21. Mean SST (degrees C) for all trips for the U.S. Northeast and Mid-Atlantic bottom trawl fishery, 1996–2004, (A) by year and (B) by month (A) By year
12
12.5
13
13.5
14
14.5
1996 1997 1998 1999 2000 2001 2002 2003 2004
Year
SST
(
C
)
B) By month
0
5
10
15
20
25
1 2 3 4 5 6 7 8 9 10 11 12
Month
SST
(
C
)

97
Figure 22. Distribution of U.S. Northeast and Mid-Atlantic bottom trawl effort (days fished) shown as the 75% effort contour by quarter aggregated over 1996–2004, overlaid on 23-year monthly mean SST images: (A) First Quarter, (B) Second Quarter, (C) Third Quarter and (D) Fourth Quarter (A) First Quarter (Jan.-March.) bottom trawl, SST image from February
(B) Second Quarter (April-June) bottom trawl, SST image from May

98
Figure 22 continued. (C) Third Quarter (July-Sept.) bottom trawl, SST image from August
(D) Fourth Quarter (Oct.-Dec.) bottom trawl, SST image from November

99
Figure 23. Mean SST (degrees Celsius) by month and species for the U.S. Northeast and Mid-Atlantic bottom trawl fishery: (A) Northeast multispecies group, (B) mid-Atlantic FMP species, (C) mix of species with individual FMPs from both the northeast and mid-Atlantic, and (D) other species (A) NE Multispecies
0
5
10
15
20
25
30
1 2 3 4 5 6 7 8 9 10 11 12
Months
SST
(
C
)
Haddock Silver Hake Cod Winter FlounderYellowtail Flounder American Plaice Witch Flounder
(B) Mid-Atlantic FMP species
0
5
10
15
20
25
30
1 2 3 4 5 6 7 8 9 10 11 12
Months
SST
(
C
)
Loligo Illex Atlantic Mackerel Fluke Scup Butterfish

100
Figure 23 continued. (C) Other FMP species
0
5
10
15
20
25
30
1 2 3 4 5 6 7 8 9 10 11 12
Months
SST
(
C
)
Dogfish (Spiny and Unidentified) Skates Monkfish Atlantic Herring Atlantic Croaker
(D) “Other” categories
0
5
10
15
20
25
30
1 2 3 4 5 6 7 8 9 10 11 12
Months
SST
(
C
)
Other Groundfish Other Finfish Other Invertebrates Other Species

101
Figure 24. Distribution of U.S. Northeast and Mid-Atlantic mid-water trawl effort (days fished), over the period 1996–2004

102
Figure 25. Mean days fished per trip for the U.S. Northeast and Mid-Atlantic mid-water trawl fishery, 1996–2004
0
0.05
0.1
0.15
0.2
0.25
0.3
0.35
0.4
0.45
0.5
1996 1997 1998 1999 2000 2001 2002 2003
Year
Days
Fished
Figure 26. Mean days fished per trip by month for the U.S. Northeast and Mid-Atlantic mid-water trawl fishery, using data from 1996–2004
0
0.05
0.1
0.15
0.2
0.25
0.3
0.35
0.4
0.45
1 2 3 4 5 6 7 8 9 10 11 12
Month
Days
Fished

103
Figure 27. Mean days fished per trip by month and main species for the U.S. Northeast and Mid-Atlantic mid-water trawl fishery, 1996–2004
0
0.2
0.4
0.6
0.8
1
1.2
1.4
1.6
1 2 3 4 5 6 7 8 9 10 11 12
Months
Days
Fished
Herring Atlantic Mackerel
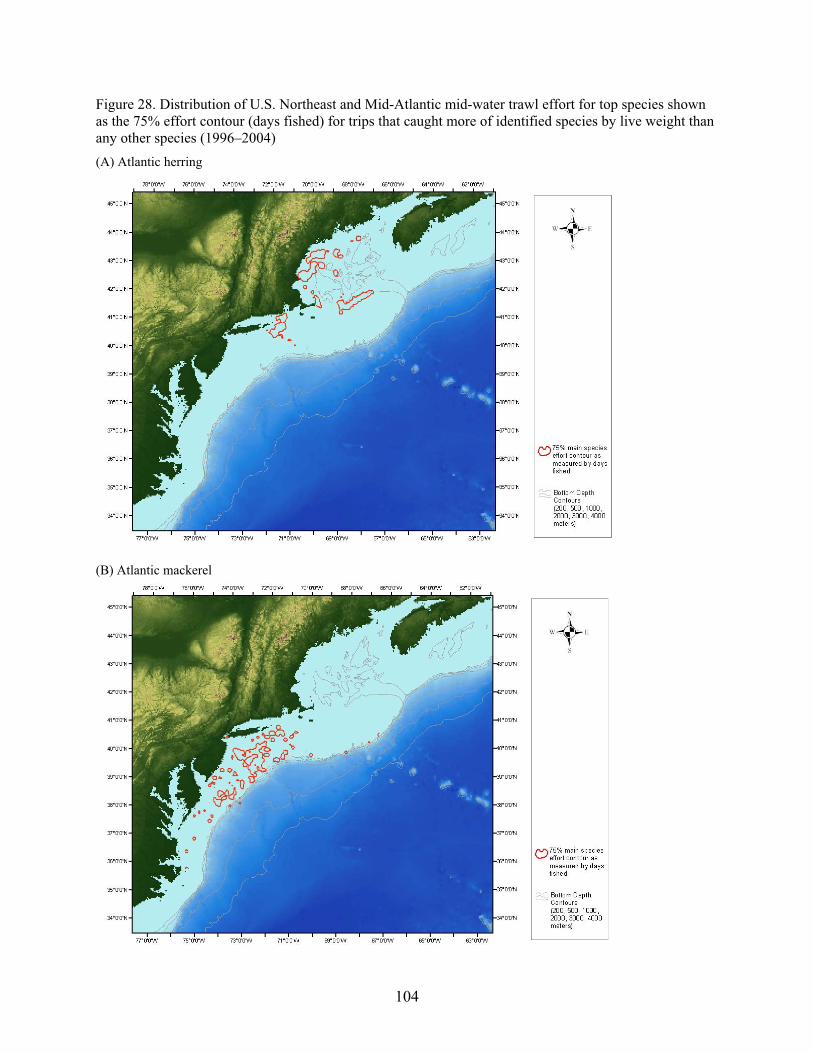
104
Figure 28. Distribution of U.S. Northeast and Mid-Atlantic mid-water trawl effort for top species shown as the 75% effort contour (days fished) for trips that caught more of identified species by live weight than any other species (1996–2004) (A) Atlantic herring
(B) Atlantic mackerel

105
Figure 29. Mean codend mesh size (in inches) for the U.S. Northeast and Mid-Atlantic mid-water trawl fishery (A) by year and (B) by month over 1996–2004
(A) By year
0
0.5
1
1.5
2
2.5
1996 1997 1998 1999 2000 2001 2002 2003 2004
Year
Mesh
Size
(
inches
)
(B) By month
0
0.5
1
1.5
2
2.5
1 2 3 4 5 6 7 8 9 10 11 12
Month
Mesh
Size
(
inches
)
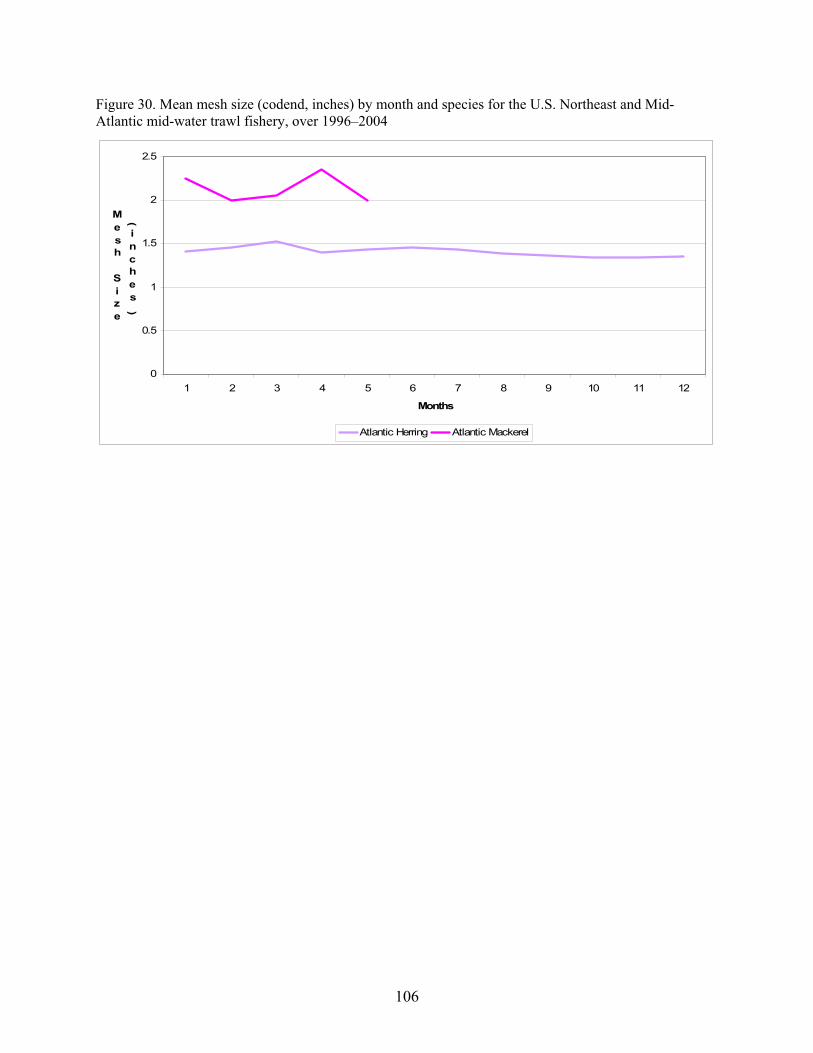
106
Figure 30. Mean mesh size (codend, inches) by month and species for the U.S. Northeast and Mid-Atlantic mid-water trawl fishery, over 1996–2004
0
0.5
1
1.5
2
2.5
1 2 3 4 5 6 7 8 9 10 11 12
Months
Mesh
Size
(
inches
)
Atlantic Herring Atlantic Mackerel
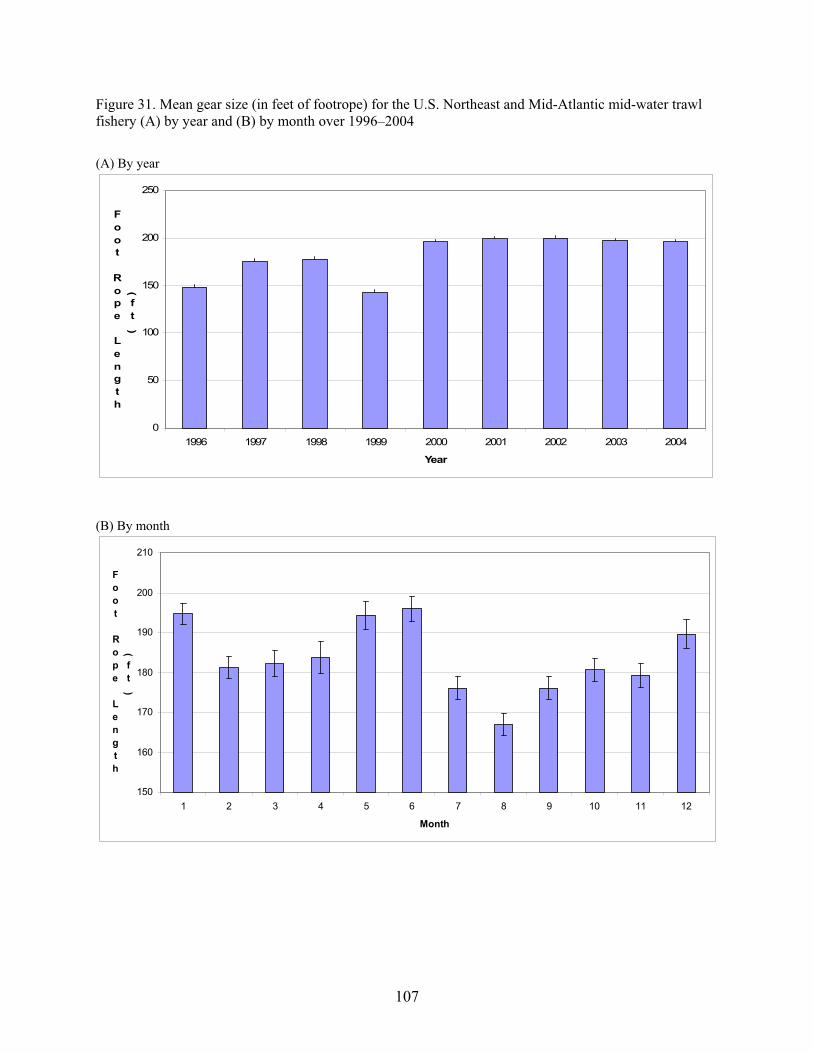
107
Figure 31. Mean gear size (in feet of footrope) for the U.S. Northeast and Mid-Atlantic mid-water trawl fishery (A) by year and (B) by month over 1996–2004
(A) By year
0
50
100
150
200
250
1996 1997 1998 1999 2000 2001 2002 2003 2004
Year
Foot
Rope
Length
(
ft
)
(B) By month
150
160
170
180
190
200
210
1 2 3 4 5 6 7 8 9 10 11 12
Month
Foot
Rope
Length
(
ft
)

108
Figure 32. Mean gear size (in feet of footrope) by month and species for the U.S. Northeast and Mid-Atlantic mid-water trawl fishery over 1996–2004
0
50
100
150
200
250
300
1 2 3 4 5 6 7 8 9 10 11 12
Months
Foot
Rope
Length
(
ft
)
Herring Atlantic Mackerel

109
Figure 33. Mean SST (degrees C) for all trips for the U.S. Northeast and Mid-Atlantic mid-water trawl fishery, 1996–2004, (A) by year and (B) by month
(A) By year
9
9.5
10
10.5
11
11.5
12
12.5
13
1996 1997 1998 1999 2000 2001 2002 2003 2004
Year
SST
(
C
)
(B) By Month
0
2
4
6
8
10
12
14
16
18
20
1 2 3 4 5 6 7 8 9 10 11 12
Month
SST
(C
)

110
Figure 34. Distribution of U.S. Northeast and Mid-Atlantic mid-water trawl effort (days fished) shown as the 75% effort contour by quarter aggregated over 1996–2004, overlaid on 23-year monthly mean SST images: (A) First Quarter, (B) Second Quarter, (C) Third Quarter and (D) Fourth Quarter (A) First Quarter (Jan.-March.) mid-water trawl, SST image from February
(B) Second Quarter (April-June) mid-water trawl, SST image from May

111
Figure 34 continued. (C) Third Quarter (July-Sept.) mid-water trawl, SST image from August
(D) Fourth Quarter (Oct.-Dec.) mid-water trawl, SST image from November

112
Figure 35. Mean SST by month and species for the U.S. Northeast and Mid-Atlantic mid-water trawl fishery, over 1996–2004
0
5
10
15
20
25
30
1 2 3 4 5 6 7 8 9 10 11 12
Months
SST
(
C
)
Atlantic Herring Atlantic Mackerel

113
APPENDIX A: List of Fishery Management Plans (FMPs) for the Northeast and Mid-Atlantic by management body, and species covered.
FMPs discussed in text are shaded gray. Management Body FMP Name Species Name ASMFC American Croaker Croaker, Atlantic ASMFC American Eel Eel, American ASMFC American Lobster Lobster, American ASMFC Atlantic Menhaden Menhaden ASMFC Atlantic Sturgeon Sturgeon, Atlantic ASMFC Horseshoe Crab Crab, Horseshoe ASMFC Northern Shrimp Shrimp, Atlantic & Gulf, Marine, Unknown ASMFC Northern Shrimp Shrimp, Atlantic & Gulf, Brown ASMFC Red Drum Drum, Red ASMFC Shad & River Herring Alewife ASMFC Shad & River Herring Herring, Blueback ASMFC Shad & River Herring Shad, Hickory ASMFC Shad & River Herring Shad, American ASMFC Spanish Mackerel Mackerel, Spanish ASMFC Spot Spot ASMFC Spotted Seatrout (Spotted Weakfish) Sea Trout, Spotted ASMFC Striped Bass Striped Bass ASMFC Tautog Tautog ASMFC Weakfish (Squeteague/Grey Seatrout) Sea Trout, Gray(Weakfish) MAFMC Bluefish Bluefish MAFMC Mackerel, Squid & Butterfish Butterfish MAFMC Mackerel, Squid & Butterfish Mackerel, Atlantic MAFMC Mackerel, Squid & Butterfish Squid, Long Finned (Loligo) MAFMC Mackerel, Squid & Butterfish Squid, Short Finned (Illex) MAFMC Mackerel, Squid & Butterfish Squids, Unknown MAFMC Quahogs & Surf Clams Clam, Ocean Quahog MAFMC Quahogs & Surf Clams Clam, Surf MAFMC Summer flounder, scup & Black sea bass Flounder, Summer (Fluke) MAFMC Summer flounder, scup & Black sea bass Scup MAFMC Summer flounder, scup & Black sea bass Sea Bass, Black MAFMC Tilefish Tilefish, Golden MAFMC & NEFMC Dogfish Dogfish, Spiny MAFMC & NEFMC Monkfish Goosefish NEFMC Herring Herring, Atlantic, Sea NEFMC Multispecies Cod, Atlantic NEFMC Multispecies Flounder, Winter NEFMC Multispecies Flounder, Witch (Gray Sole) NEFMC Multispecies Flounder, Yellowtail NEFMC Multispecies Flounder, Plaice, American (Dab) NEFMC Multispecies Flounder, Sand Dab (Windowpane) NEFMC Multispecies Haddock NEFMC Multispecies Hake, Atlantic, White NEFMC Multispecies Halibut ,Atlantic NEFMC Multispecies Ocean Perch,(Redfish)

114
Management Body FMP Name Species Name NEFMC Multispecies Ocean Pout NEFMC Multispecies Pollock, Atlantic NEFMC Red Crab Crab, Red At NEFMC Scallops Scallop, Sea NEFMC Skates Skate, Rosette NEFMC Skates Skates NEFMC Skates Skate, Little NEFMC Skates Skate, Winter NEFMC Skates Skate, Barndoor NEFMC Skates Skate, Smooth NEFMC Skates Skate, Thorny NEFMC Skates Skate, Clearnose NEFMC Small-mesh multispecies Hake, Atlantic, Red NEFMC Small-mesh multispecies Hake, Offshore, Unknown (Whiting, Black) NEFMC Small-mesh multispecies Hake, Silver, Unknown (Whiting) NEFMC Atlantic Salmon Salmon, Atlantic NMFS HMS Swordfish, Tuna, Billfish, and Shark Shark, Nurse NMFS HMS Swordfish, Tuna, Billfish, and Shark Shark, Sand Tiger NMFS HMS Swordfish, Tuna, Billfish, and Shark Dogfish, Unkown NMFS HMS Swordfish, Tuna, Billfish, and Shark Dogfish, Smooth NMFS HMS Swordfish, Tuna, Billfish, and Shark Shark, Thresher NMFS HMS Swordfish, Tuna, Billfish, and Shark Shark, Bigeye Thresher NMFS HMS Swordfish, Tuna, Billfish, and Shark Shark, Bonito(Shortfin Mako) NMFS HMS Swordfish, Tuna, Billfish, and Shark Shark, Mako Unknown NMFS HMS Swordfish, Tuna, Billfish, and Shark Shark, Longfin Mako NMFS HMS Swordfish, Tuna, Billfish, and Shark Shark, Unknown NMFS HMS Swordfish, Tuna, Billfish, and Shark Shark,Thresher, Unkown NMFS HMS Swordfish, Tuna, Billfish, and Shark Swordfish NMFS HMS Swordfish, Tuna, Billfish, and Shark Tuna, Blackfin NMFS HMS Swordfish, Tuna, Billfish, and Shark Tuna, Unkown NMFS HMS Swordfish, Tuna, Billfish, and Shark Tuna, Skipjack NMFS HMS Swordfish, Tuna, Billfish, and Shark Tuna, Bluefin NMFS HMS Swordfish, Tuna, Billfish, and Shark Tuna, Little (Tunny) NMFS HMS Swordfish, Tuna, Billfish, and Shark Tuna, Bigeye NMFS HMS Swordfish, Tuna, Billfish, and Shark Tuna, Albacore NMFS HMS Swordfish, Tuna, Billfish, and Shark Tuna, Yellowfin NMFS HMS Swordfish, Tuna, Billfish, and Shark Shark, Atlantic Angel NMFS HMS Swordfish, Tuna, Billfish, and Shark Shark, Scalloped Hammerhead NMFS HMS Swordfish, Tuna, Billfish, and Shark Shark, Smooth Hammerhead NMFS HMS Swordfish, Tuna, Billfish, and Shark Shark, White NMFS HMS Swordfish, Tuna, Billfish, and Shark Shark, Porbeagle NMFS HMS Swordfish, Tuna, Billfish, and Shark Shark, Sandbar NMFS HMS Swordfish, Tuna, Billfish, and Shark Shark, Bignose NMFS HMS Swordfish, Tuna, Billfish, and Shark Shark, Dusky NMFS HMS Swordfish, Tuna, Billfish, and Shark Shark, Silky NMFS HMS Swordfish, Tuna, Billfish, and Shark Shark, Night NMFS HMS Swordfish, Tuna, Billfish, and Shark Shark, Blacktip NMFS HMS Swordfish, Tuna, Billfish, and Shark Shark, Spinner NMFS HMS Swordfish, Tuna, Billfish, and Shark Shark, Bull
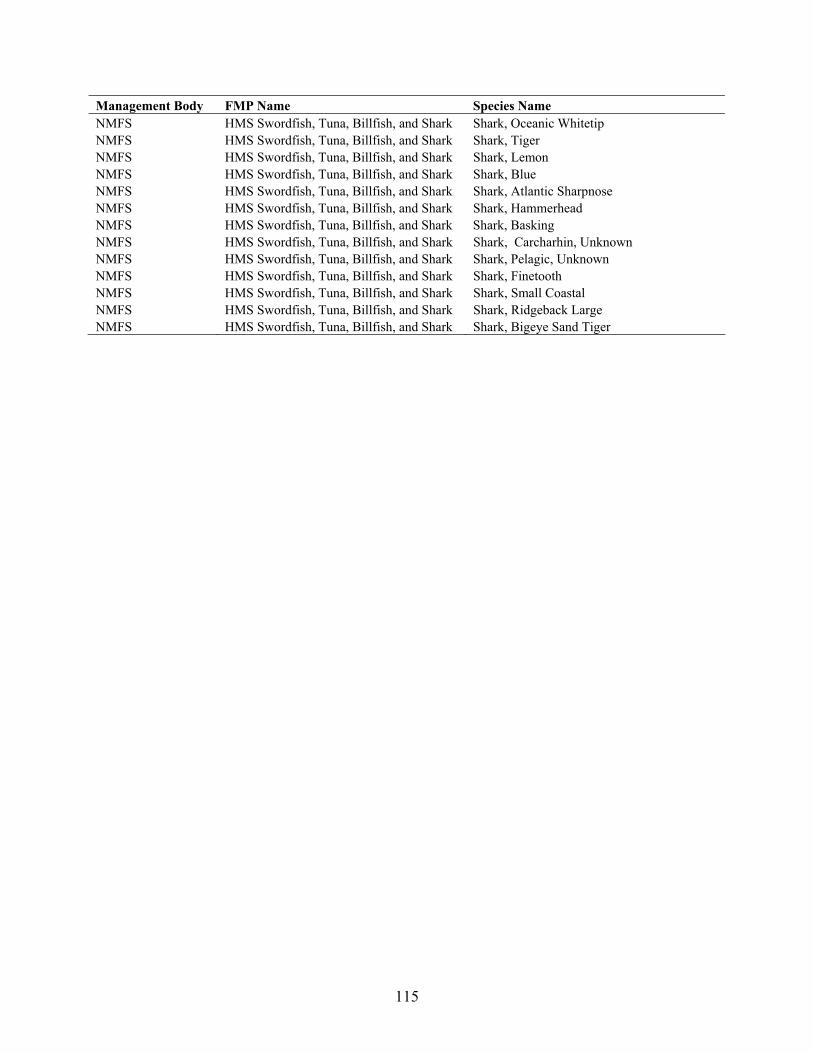
115
Management Body FMP Name Species Name NMFS HMS Swordfish, Tuna, Billfish, and Shark Shark, Oceanic Whitetip NMFS HMS Swordfish, Tuna, Billfish, and Shark Shark, Tiger NMFS HMS Swordfish, Tuna, Billfish, and Shark Shark, Lemon NMFS HMS Swordfish, Tuna, Billfish, and Shark Shark, Blue NMFS HMS Swordfish, Tuna, Billfish, and Shark Shark, Atlantic Sharpnose NMFS HMS Swordfish, Tuna, Billfish, and Shark Shark, Hammerhead NMFS HMS Swordfish, Tuna, Billfish, and Shark Shark, Basking NMFS HMS Swordfish, Tuna, Billfish, and Shark Shark, Carcharhin, Unknown NMFS HMS Swordfish, Tuna, Billfish, and Shark Shark, Pelagic, Unknown NMFS HMS Swordfish, Tuna, Billfish, and Shark Shark, Finetooth NMFS HMS Swordfish, Tuna, Billfish, and Shark Shark, Small Coastal NMFS HMS Swordfish, Tuna, Billfish, and Shark Shark, Ridgeback Large NMFS HMS Swordfish, Tuna, Billfish, and Shark Shark, Bigeye Sand Tiger
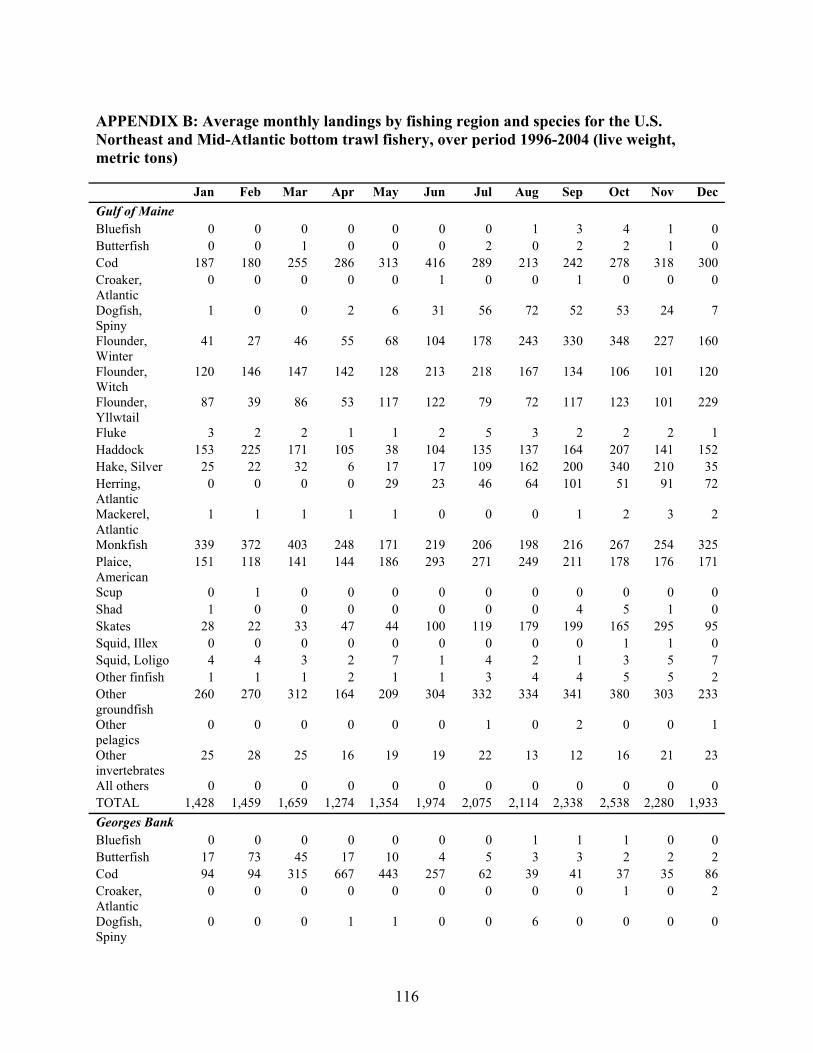
116
APPENDIX B: Average monthly landings by fishing region and species for the U.S. Northeast and Mid-Atlantic bottom trawl fishery, over period 1996-2004 (live weight, metric tons)
Jan Feb Mar Apr May Jun Jul Aug Sep Oct Nov Dec Gulf of Maine Bluefish 0 0 0 0 0 0 0 1 3 4 1 0 Butterfish 0 0 1 0 0 0 2 0 2 2 1 0 Cod 187 180 255 286 313 416 289 213 242 278 318 300 Croaker, Atlantic
0 0 0 0 0 1 0 0 1 0 0 0
Dogfish, Spiny
1 0 0 2 6 31 56 72 52 53 24 7
Flounder, Winter
41 27 46 55 68 104 178 243 330 348 227 160
Flounder, Witch
120 146 147 142 128 213 218 167 134 106 101 120
Flounder, Yllwtail
87 39 86 53 117 122 79 72 117 123 101 229
Fluke 3 2 2 1 1 2 5 3 2 2 2 1 Haddock 153 225 171 105 38 104 135 137 164 207 141 152 Hake, Silver 25 22 32 6 17 17 109 162 200 340 210 35 Herring, Atlantic
0 0 0 0 29 23 46 64 101 51 91 72
Mackerel, Atlantic
1 1 1 1 1 0 0 0 1 2 3 2
Monkfish 339 372 403 248 171 219 206 198 216 267 254 325 Plaice, American
151 118 141 144 186 293 271 249 211 178 176 171
Scup 0 1 0 0 0 0 0 0 0 0 0 0 Shad 1 0 0 0 0 0 0 0 4 5 1 0 Skates 28 22 33 47 44 100 119 179 199 165 295 95 Squid, Illex 0 0 0 0 0 0 0 0 0 1 1 0 Squid, Loligo 4 4 3 2 7 1 4 2 1 3 5 7 Other finfish 1 1 1 2 1 1 3 4 4 5 5 2 Other groundfish
260 270 312 164 209 304 332 334 341 380 303 233
Other pelagics
0 0 0 0 0 0 1 0 2 0 0 1
Other invertebrates
25 28 25 16 19 19 22 13 12 16 21 23
All others 0 0 0 0 0 0 0 0 0 0 0 0 TOTAL 1,428 1,459 1,659 1,274 1,354 1,974 2,075 2,114 2,338 2,538 2,280 1,933 Georges Bank Bluefish 0 0 0 0 0 0 0 1 1 1 0 0 Butterfish 17 73 45 17 10 4 5 3 3 2 2 2 Cod 94 94 315 667 443 257 62 39 41 37 35 86 Croaker, Atlantic
0 0 0 0 0 0 0 0 0 1 0 2
Dogfish, Spiny
0 0 0 1 1 0 0 6 0 0 0 0

117
Jan Feb Mar Apr May Jun Jul Aug Sep Oct Nov Dec Flounder, Winter
21 15 32 111 260 317 218 148 98 83 126 85
Flounder, Witch
23 23 60 65 51 68 41 40 51 42 33 28
Flounder, Yllwtail
213 178 267 307 329 288 229 198 65 87 170 283
Fluke 12 14 15 13 6 3 3 3 1 1 2 4 Haddock 117 106 150 316 211 252 112 78 94 69 31 87 Hake, Silver 123 115 179 259 462 534 687 706 514 171 152 104 Herring, Atlantic
0 0 2 5 3 2 8 33 26 90 2 0
Mackerel, Atlantic
1 4 6 38 14 2 3 5 3 1 2 2
Monkfish 96 126 269 205 115 152 108 120 180 182 126 108 Plaice, American
31 29 51 96 110 136 80 64 84 56 36 33
Scup 1 1 0 1 0 0 1 0 0 0 1 0 Shad 0 0 0 0 0 0 0 0 0 0 0 0 Skates 67 116 206 156 110 149 115 141 135 126 142 127 Squid, Illex 2 0 2 16 0 0 2 4 3 10 0 5 Squid, Loligo 367 184 126 94 14 1 2 2 2 15 188 291 Other finfish 1 1 2 5 2 2 2 1 0 1 1 1 Other groundfish
65 77 154 155 187 159 131 123 88 63 68 60
Other pelagics
1 0 0 0 0 0 0 0 0 0 3 0
Other invertebrates
28 29 48 41 18 34 33 32 21 18 20 21
All others 0 0 0 0 0 0 0 0 0 0 0 0 TOTAL 1,280 1,185 1,930 2,568 2,349 2,360 1,839 1,747 1,414 1,055 1,140 1,331 North Southern New England Bluefish 8 1 1 8 10 17 21 23 38 92 102 13 Butterfish 316 232 171 117 77 65 44 50 55 71 63 84 Cod 10 26 59 39 17 23 15 8 6 6 7 9 Croaker, Atlantic
44 47 30 0 0 0 0 4 5 21 35 57
Dogfish, Spiny
100 125 101 38 25 83 26 24 26 74 112 113
Flounder, Winter
55 58 77 184 216 142 99 98 47 47 98 118
Flounder, Witch
2 4 5 6 6 10 6 8 3 2 2 2
Flounder, Yllwtail
109 131 125 78 23 31 53 37 15 16 23 73
Fluke 545 363 223 149 141 131 165 135 214 87 132 144 Haddock 5 7 8 10 12 7 8 1 2 2 2 1 Hake, Silver 664 702 762 622 457 406 326 312 351 356 363 451 Herring, Atlantic
185 176 96 78 54 2 0 0 4 9 15 216
Mackerel, Atlantic
518 537 842 1,062 195 2 3 0 1 5 5 89
Monkfish 137 218 161 160 136 123 69 79 95 198 182 143

118
Jan Feb Mar Apr May Jun Jul Aug Sep Oct Nov Dec Plaice, American
2 2 4 4 4 4 3 2 1 1 1 2
Scup 352 268 183 145 89 29 19 11 16 39 262 101 Shad 34 34 8 2 1 4 1 0 2 3 5 32 Skates 240 217 224 303 316 542 837 877 736 671 512 339 Squid, Illex 22 16 19 40 422 1,540 2,063 2,076 699 347 22 24 Squid, Loligo 989 1,659 1,454 786 535 484 776 715 520 1,411 866 995 Other finfish 101 81 61 62 36 22 19 19 45 86 51 43 Other groundfish
164 179 198 181 167 166 139 129 140 118 88 116
Other pelagics
0 3 1 1 2 3 0 1 1 1 0 0
Other invertebrates
338 279 205 155 149 158 199 171 151 190 129 158
All others 0 0 0 0 0 0 0 0 0 0 0 0 TOTAL 4,942 5,364 5,017 4,229 3,089 3,993 4,891 4,781 3,175 3,851 3,076 3,321 South Southern New England Bluefish 0 0 0 0 0 0 0 1 0 0 0 0 Butterfish 0 0 0 0 0 0 0 0 5 0 0 0 Cod 0 0 0 0 0 0 0 0 0 0 0 0 Croaker, Atlantic
0 0 0 0 0 0 0 0 0 0 0 0
Dogfish, Spiny
1 2 1 0 0 0 0 0 0 0 1 0
Flounder, Winter
0 0 0 0 0 0 0 0 0 0 0 0
Flounder, Witch
0 0 0 0 0 1 0 0 0 0 0 0
Flounder, Yllwtail
0 0 0 0 0 0 0 0 0 0 0 0
Fluke 5 3 4 0 0 1 1 0 0 0 5 2 Haddock 0 0 0 0 0 0 0 0 0 0 0 0 Hake, Silver 0 1 0 0 0 0 0 5 3 1 0 0 Herring, Atlantic
0 0 0 0 0 0 0 0 0 0 0 0
Mackerel, Atlantic
0 0 0 8 0 0 0 0 0 0 0 0
Monkfish 0 0 0 0 0 0 0 1 3 0 0 0 Plaice, American
0 0 0 0 0 1 0 0 0 0 0 0
Scup 0 0 2 2 0 0 0 0 0 0 0 0 Shad 0 0 0 0 0 0 0 0 0 0 0 0 Skates 0 0 0 0 0 0 0 0 1 6 0 0 Squid, Illex 0 0 3 1 0 0 4 9 6 0 0 0 Squid, Loligo 14 1 5 3 0 0 0 3 2 15 4 7 Other finfish 0 0 1 0 0 0 0 0 0 0 0 0 Other groundfish
0 0 0 0 0 0 0 0 1 0 0 0
Other pelagics
0 0 0 0 0 0 0 0 0 0 0 0
Other invertebrates
0 0 0 0 0 0 0 2 0 4 1 0
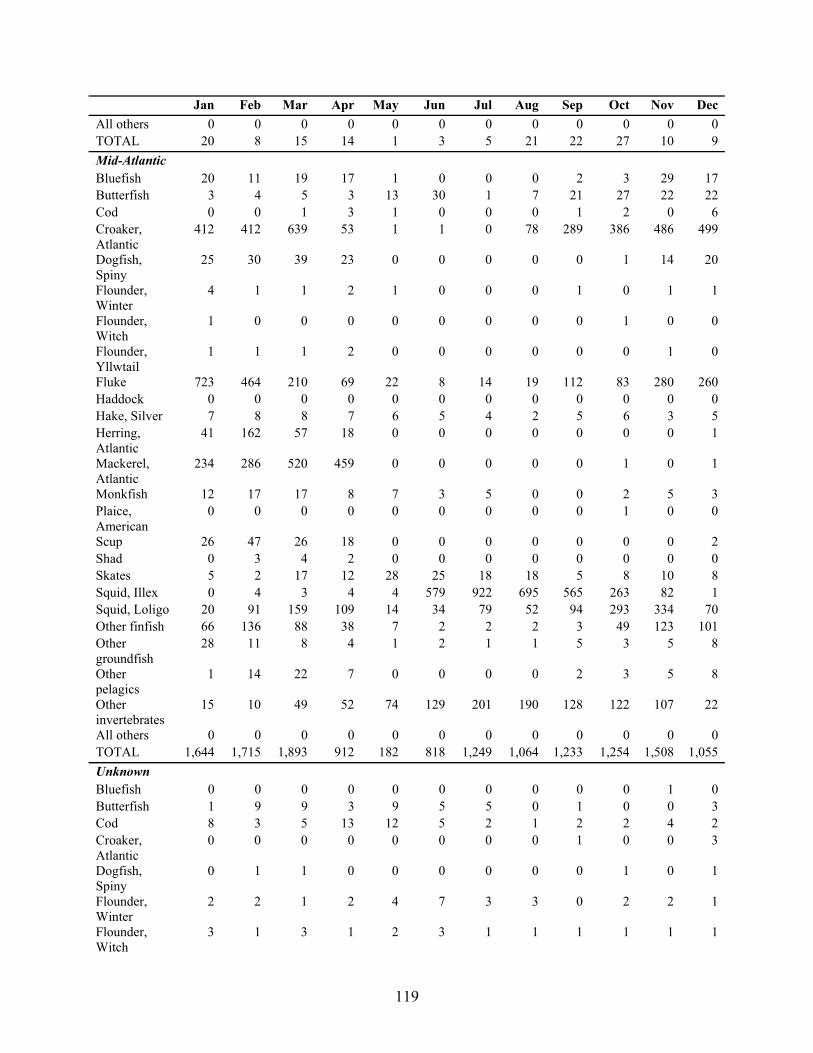
119
Jan Feb Mar Apr May Jun Jul Aug Sep Oct Nov Dec All others 0 0 0 0 0 0 0 0 0 0 0 0 TOTAL 20 8 15 14 1 3 5 21 22 27 10 9 Mid-Atlantic Bluefish 20 11 19 17 1 0 0 0 2 3 29 17 Butterfish 3 4 5 3 13 30 1 7 21 27 22 22 Cod 0 0 1 3 1 0 0 0 1 2 0 6 Croaker, Atlantic
412 412 639 53 1 1 0 78 289 386 486 499
Dogfish, Spiny
25 30 39 23 0 0 0 0 0 1 14 20
Flounder, Winter
4 1 1 2 1 0 0 0 1 0 1 1
Flounder, Witch
1 0 0 0 0 0 0 0 0 1 0 0
Flounder, Yllwtail
1 1 1 2 0 0 0 0 0 0 1 0
Fluke 723 464 210 69 22 8 14 19 112 83 280 260 Haddock 0 0 0 0 0 0 0 0 0 0 0 0 Hake, Silver 7 8 8 7 6 5 4 2 5 6 3 5 Herring, Atlantic
41 162 57 18 0 0 0 0 0 0 0 1
Mackerel, Atlantic
234 286 520 459 0 0 0 0 0 1 0 1
Monkfish 12 17 17 8 7 3 5 0 0 2 5 3 Plaice, American
0 0 0 0 0 0 0 0 0 1 0 0
Scup 26 47 26 18 0 0 0 0 0 0 0 2 Shad 0 3 4 2 0 0 0 0 0 0 0 0 Skates 5 2 17 12 28 25 18 18 5 8 10 8 Squid, Illex 0 4 3 4 4 579 922 695 565 263 82 1 Squid, Loligo 20 91 159 109 14 34 79 52 94 293 334 70 Other finfish 66 136 88 38 7 2 2 2 3 49 123 101 Other groundfish
28 11 8 4 1 2 1 1 5 3 5 8
Other pelagics
1 14 22 7 0 0 0 0 2 3 5 8
Other invertebrates
15 10 49 52 74 129 201 190 128 122 107 22
All others 0 0 0 0 0 0 0 0 0 0 0 0 TOTAL 1,644 1,715 1,893 912 182 818 1,249 1,064 1,233 1,254 1,508 1,055 Unknown Bluefish 0 0 0 0 0 0 0 0 0 0 1 0 Butterfish 1 9 9 3 9 5 5 0 1 0 0 3 Cod 8 3 5 13 12 5 2 1 2 2 4 2 Croaker, Atlantic
0 0 0 0 0 0 0 0 1 0 0 3
Dogfish, Spiny
0 1 1 0 0 0 0 0 0 1 0 1
Flounder, Winter
2 2 1 2 4 7 3 3 0 2 2 1
Flounder, Witch
3 1 3 1 2 3 1 1 1 1 1 1
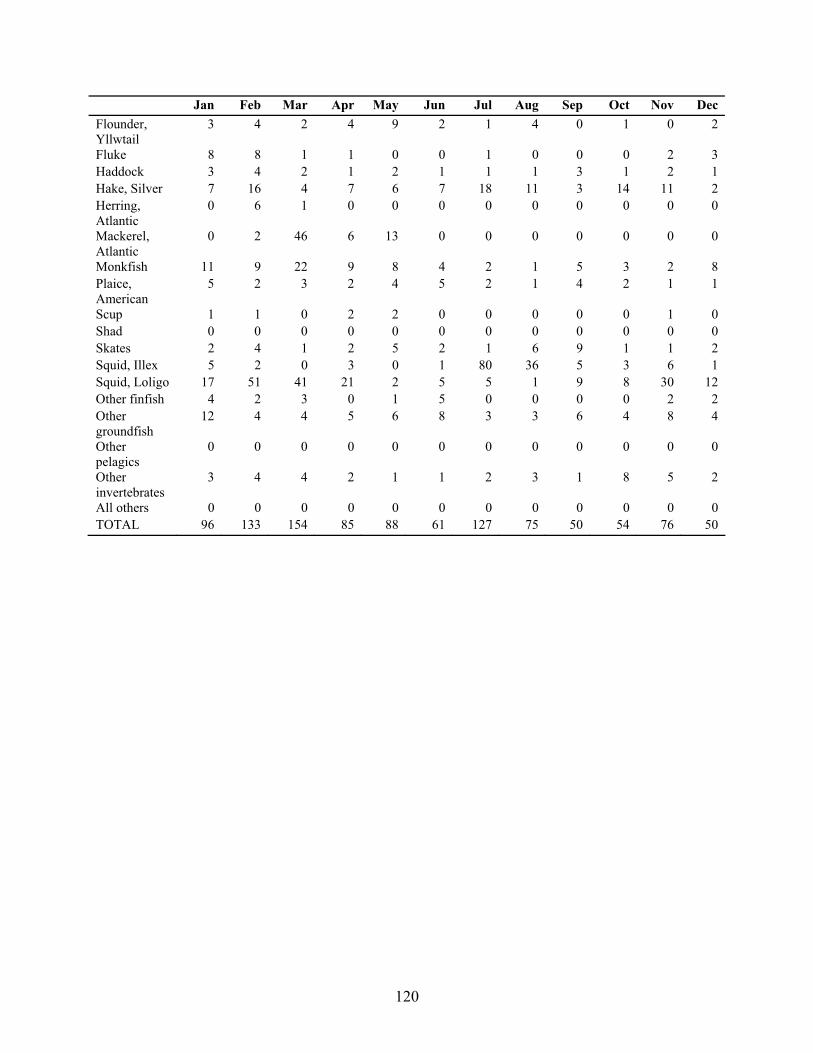
120
Jan Feb Mar Apr May Jun Jul Aug Sep Oct Nov Dec Flounder, Yllwtail
3 4 2 4 9 2 1 4 0 1 0 2
Fluke 8 8 1 1 0 0 1 0 0 0 2 3 Haddock 3 4 2 1 2 1 1 1 3 1 2 1 Hake, Silver 7 16 4 7 6 7 18 11 3 14 11 2 Herring, Atlantic
0 6 1 0 0 0 0 0 0 0 0 0
Mackerel, Atlantic
0 2 46 6 13 0 0 0 0 0 0 0
Monkfish 11 9 22 9 8 4 2 1 5 3 2 8 Plaice, American
5 2 3 2 4 5 2 1 4 2 1 1
Scup 1 1 0 2 2 0 0 0 0 0 1 0 Shad 0 0 0 0 0 0 0 0 0 0 0 0 Skates 2 4 1 2 5 2 1 6 9 1 1 2 Squid, Illex 5 2 0 3 0 1 80 36 5 3 6 1 Squid, Loligo 17 51 41 21 2 5 5 1 9 8 30 12 Other finfish 4 2 3 0 1 5 0 0 0 0 2 2 Other groundfish
12 4 4 5 6 8 3 3 6 4 8 4
Other pelagics
0 0 0 0 0 0 0 0 0 0 0 0
Other invertebrates
3 4 4 2 1 1 2 3 1 8 5 2
All others 0 0 0 0 0 0 0 0 0 0 0 0 TOTAL 96 133 154 85 88 61 127 75 50 54 76 50

121
APPENDIX C: The types and combinations of trawl gear used by bottom and mid-water trawl vessels (A) in 1996 and (B) 2004.
The number of vessels in a group reported the same combination of trawl gears. For example, in 1996, 8 vessels reported using OTF, OTS and OTM gear during the calendar year. (A) 1996
Gear type reported on VTR reporta
OTF OTC PTB OTS OTO PTM OTM OTB # gear types reported by
vessel
# vessels in group
(50) (52) (56) (58) (59) (170) (370) (350) 3+ 8 8 8 8
8 8 8 8 4 4 4 4 2 2 2 2 2 2 2 2 1 1 1 1
2 235 235 235 32 32 32 15 15 15 11 11 11 2 2 2 2 2 2 1 1 1 1 1 1 1 1 1
1 623 623 10 10 2 2 0 0
Total 944 42 2 258 22 4 38 0 a The gear codes: OTF-Otter Trawl Bottom, Fish; OTC-Otter Trawl Bottom, Scallop; PTB-Otter Trawl Bottom, Paired; OTS-Otter Trawl Bottom, Shrimp; OTO-Otter Trawl Bottom, Other; PTM-Mid-water Trawl, Paired; OTM-Mid-water Otter Trawl; OTB-Otter Trawl, Beam.

122
(B) 2004
Gear type reported on VTR reporta
OTF OTC PTB OTS OTO PTM OTM OTB # gear types
reported by vessel
# vessels in group
(50) (52) (56) (58) (59) (170) (370) (350) 3+ 9 9 9 9
5 5 5 5 1 1 1 1 1 1 1 1 1 1 1 1
2 89 89 89 19 19 19 10 10 10 5 5 5 4 4 4 2 2 2 1 1 1
1 588 588 11 11 3 3 0 0
Total 732 29 0 106 0 17 18 11 a The gear codes: OTF-Otter Trawl Bottom, Fish; OTC-Otter Trawl Bottom, Scallop; PTB-Otter Trawl Bottom, Paired; OTS-Otter Trawl Bottom, Shrimp; OTO-Otter Trawl Bottom, Other; PTM-Mid-water Trawl, Paired; OTM-Mid-water Otter Trawl; OTB-Otter Trawl, Beam.

123
APPENDIX D: Average monthly landings by fishing region and species for the U.S. Northeast and Mid-Atlantic mid-water trawl fishery, over period 1996-2004 (live weight, metric tons)
Jan Feb Mar Apr May Jun Jul Aug Sep Oct Nov Dec Gulf of Maine Bluefish 0 0 0 0 0 0 0 0 0 0 0 0 Butterfish 0 0 0 0 0 0 0 0 0 0 0 0 Cod 0 0 0 0 0 0 0 0 0 0 0 0 Croaker, Atlantic
0 0 0 0 0 0 0 0 0 0 0 0
Dogfish, Spiny
0 0 0 0 0 1 2 0 0 0 0 0
Flounder, Winter
0 0 0 0 0 0 0 0 0 0 0 0
Flounder, Witch
0 0 0 0 0 0 0 0 0 0 0 0
Flounder, Yllwtail
0 0 0 0 0 0 0 0 0 0 0 0
Fluke 0 0 0 0 0 0 0 0 0 0 0 0 Haddock 0 0 0 0 0 0 0 0 1 1 1 1 Hake, Silver 0 0 0 0 0 0 0 0 0 0 0 0 Herring, Atlantic
1,220 738 376 1,436 3,441 5,005 4,420 3,510 3,245 4,900 6,985 2,750
Mackerel, Atlantic
75 6 2 0 0 0 0 2 0 0 6 189
Monkfish 1 0 0 0 0 0 0 0 0 0 0 0 Plaice, American
0 0 0 0 0 0 0 0 0 0 0 0
Scup 0 0 0 0 0 0 0 0 0 0 0 0 Shad 0 0 0 0 0 0 0 0 1 0 0 0 Skates 0 0 0 0 0 0 0 0 0 0 0 0 Squid, Illex 0 0 0 0 0 0 0 0 0 0 0 0 Squid, Loligo
0 0 0 0 0 0 0 0 0 0 0 0
Other finfish 0 0 0 0 0 3 0 0 0 0 1 0 Other groundfish
0 0 1 0 0 0 0 0 1 2 2 1
Other pelagics
0 0 0 0 0 0 0 0 0 0 0 0
Other invertebrates
0 0 0 0 0 0 0 0 0 0 0 0
All others 0 0 0 0 0 0 0 0 0 0 0 0 TOTAL 1,296 744 380 1,436 3,441 5,009 4,423 3,512 3,247 4,903 6,996 2,942 Georges Bank Bluefish 0 0 0 0 0 0 0 0 0 0 0 0 Butterfish 0 9 1 7 0 0 0 0 0 0 0 0 Cod 0 0 0 0 0 0 0 0 0 0 0 0 Croaker, Atlantic 0 0 0 0 0 0 0 0 0 0 0 0

124
Jan Feb Mar Apr May Jun Jul Aug Sep Oct Nov Dec Dogfish, Spiny 0 0 0 0 0 0 0 0 0 0 0 0 Flounder, Winter 0 0 0 0 0 0 0 0 0 0 0 0 Flounder, Witch 0 0 0 0 0 0 0 0 0 0 0 0 Flounder, Yllwtail 0 0 0 0 1 0 0 0 0 0 0 0 Fluke 0 0 0 0 0 0 0 0 0 0 0 0 Haddock 0 0 0 0 0 0 0 0 0 0 0 0 Hake, Silver 0 0 0 0 0 0 0 0 0 0 0 0 Herring, Atlantic 589 0 223 382 451 1,202 3,338 4,137 3,595 2,468 131 0 Mackerel, Atlantic 13 16 18 31 110 0 0 0 2 15 0 0 Monkfish 0 0 0 0 0 0 0 0 0 0 0 0 Plaice, American 0 0 0 0 0 0 0 0 0 0 0 0 Scup 0 0 0 0 0 0 0 0 0 0 0 0 Shad 0 0 0 0 0 0 0 0 0 0 0 0 Skates 0 0 0 0 0 0 0 0 0 0 0 0 Squid, Illex 0 135 0 2 0 0 0 0 0 0 0 0 Squid, Loligo 0 0 21 25 0 0 0 0 0 0 0 0 Other finfish 0 0 0 0 0 0 0 0 0 0 0 0 Other groundfish 0 0 0 0 0 0 0 0 0 0 0 0 Other pelagics 0 0 0 0 0 0 0 0 0 0 0 0 Other invertebrates 0 0 0 0 0 0 0 0 0 0 0 0 All others 0 0 0 0 0 0 0 0 0 0 0 0 TOTAL 602 160 263 446 563 1,203 3,339 4,137 3,596 2,483 131 0 North Southern New England Bluefish 0 0 0 0 0 0 12 14 15 19 7 0 Butterfish 1 1 3 1 3 0 0 3 4 16 9 1 Cod 0 0 0 0 0 0 0 0 0 0 0 0 Croaker, Atlantic
0 6 0 0 0 0 0 0 0 0 0 0
Dogfish, Spiny
0 0 0 0 0 0 0 0 0 0 0 0
Flounder, Winter
0 0 0 0 0 0 0 0 0 0 0 0
Flounder, Witch
0 0 0 0 0 0 0 0 0 0 0 0
Flounder, Yllwtail
0 0 0 0 0 0 0 0 0 0 0 0
Fluke 1 0 0 0 0 0 0 0 0 0 0 0 Haddock 0 0 0 0 0 0 0 0 0 0 0 0 Hake, Silver 0 1 0 0 0 0 0 0 0 0 0 0 Herring, Atlantic
6,026 5,174 2,097 560 214 140 287 199 195 117 582 2,319

125
Jan Feb Mar Apr May Jun Jul Aug Sep Oct Nov Dec Mackerel, Atlantic
3,047 3,884 3,666 1,082 158 0 0 0 0 0 0 217
Monkfish 4 0 0 0 0 0 0 0 0 0 0 0 Plaice, American
0 0 0 0 0 0 0 0 0 0 0 0
Scup 3 10 4 11 0 0 0 0 0 0 0 1 Shad 30 8 25 0 0 0 0 0 0 0 0 0 Skates 0 0 0 0 0 0 0 0 0 0 0 0 Squid, Illex 0 8 0 3 79 177 141 91 20 40 0 0 Squid, Loligo
13 36 25 18 6 34 3 1 1 17 2 9
Other finfish 1 2 0 1 1 0 0 0 1 2 0 0 Other groundfish
0 0 0 1 0 0 0 0 0 0 0 0
Other pelagics
0 1 5 0 0 9 0 0 1 0 1 0
Other invertebrates
0 1 0 0 0 0 0 0 0 0 0 0
All others 0 0 0 0 0 0 0 0 0 0 0 0 TOTAL 9,125 9,134 5,826 1,677 462 361 444 310 238 214 603 2,547 South Southern New England Bluefish 0 0 0 0 0 0 0 0 0 0 0 0 Butterfish 0 0 0 0 0 0 0 0 0 0 0 0 Cod 0 0 0 0 0 0 0 0 0 0 0 0 Croaker, Atlantic
0 0 0 0 0 0 0 0 0 0 0 0
Dogfish, Spiny
0 0 0 0 0 0 0 0 0 0 0 0
Flounder, Winter
0 0 0 0 0 0 0 0 0 0 0 0
Flounder, Witch
0 0 0 0 0 0 0 0 0 0 0 0
Flounder, Yllwtail
0 0 0 0 0 0 0 0 0 0 0 0
Fluke 0 0 0 0 0 0 0 0 0 0 0 0 Haddock 0 0 0 0 0 0 0 0 0 0 0 0 Hake, Silver 0 0 0 0 0 0 0 0 0 0 0 0 Herring, Atlantic
0 11 0 0 0 0 0 0 0 0 0 0
Mackerel, Atlantic
0 0 0 0 0 0 0 0 0 0 0 0
Monkfish 0 0 0 0 0 0 0 0 0 0 0 0 Plaice, American
0 0 0 0 0 0 0 0 0 0 0 0
Scup 0 0 0 0 0 0 0 0 0 0 0 0 Shad 0 0 0 0 0 0 0 0 0 0 0 0 Skates 0 0 0 0 0 0 0 0 0 0 0 0 Squid, Illex 0 0 0 0 0 0 0 0 0 0 0 0 Squid, Loligo
0 0 0 0 0 0 0 0 0 0 0 0
Other finfish 0 0 0 0 0 0 0 0 0 0 0 0

126
Jan Feb Mar Apr May Jun Jul Aug Sep Oct Nov Dec Other groundfish
0 0 0 0 0 0 0 0 0 0 0 0
Other pelagics
0 0 0 0 0 0 0 0 0 0 0 0
Other invertebrates
0 0 0 0 0 0 0 0 0 0 0 0
All others 0 0 0 0 0 0 0 0 0 0 0 0 TOTAL 0 11 0 0 0 0 0 0 0 0 0 0 Mid-Atlantic Bluefish 0 0 0 1 0 0 0 0 0 0 2 1 Butterfish 0 0 0 0 0 0 1 0 2 1 2 1 Cod 0 0 0 0 0 0 0 0 0 0 0 0 Croaker, Atlantic
28 58 73 3 0 0 0 29 2 18 37 29
Dogfish, Spiny
0 0 0 0 0 0 0 0 0 0 0 2
Flounder, Winter
0 0 0 0 0 0 0 0 0 0 0 0
Flounder, Witch
0 0 0 0 0 0 0 0 0 0 0 0
Flounder, Yllwtail
0 0 0 0 0 0 0 0 0 0 0 0
Fluke 1 0 0 0 0 0 0 0 0 0 1 0 Haddock 0 0 0 0 0 0 0 0 0 0 0 0 Hake, Silver 0 0 0 0 0 0 0 0 0 0 0 0 Herring, Atlantic
63 4 8 23 0 0 0 0 0 0 11 21
Mackerel, Atlantic
214 281 2,521 703 0 0 0 0 0 0 0 23
Monkfish 0 0 0 0 0 0 0 0 0 0 0 0 Plaice, American
0 0 0 0 0 0 0 0 0 0 0 0
Scup 0 3 0 0 0 0 0 0 0 0 0 0 Shad 0 1 0 0 0 0 0 0 0 0 0 0 Skates 0 0 0 0 0 0 0 0 0 0 0 0 Squid, Illex 0 0 0 0 0 61 127 88 98 13 23 0 Squid, Loligo
0 3 11 6 0 1 1 1 4 18 7 1
Other finfish 3 11 5 1 1 0 0 5 0 6 8 12 Other groundfish
0 0 0 0 0 0 0 0 0 0 0 0
Other pelagics
0 6 6 3 0 25 0 12 0 0 0 0
Other invertebrates
0 0 0 0 3 7 0 0 0 0 0 0
All others 0 0 0 0 0 0 0 0 0 0 0 0 TOTAL 309 368 2,625 742 5 95 130 134 106 57 91 91 Unknown Bluefish 0 0 0 0 0 0 0 0 0 0 0 0 Butterfish 0 0 0 0 0 0 0 0 0 0 0 0 Cod 0 0 0 0 0 0 0 0 0 0 0 0
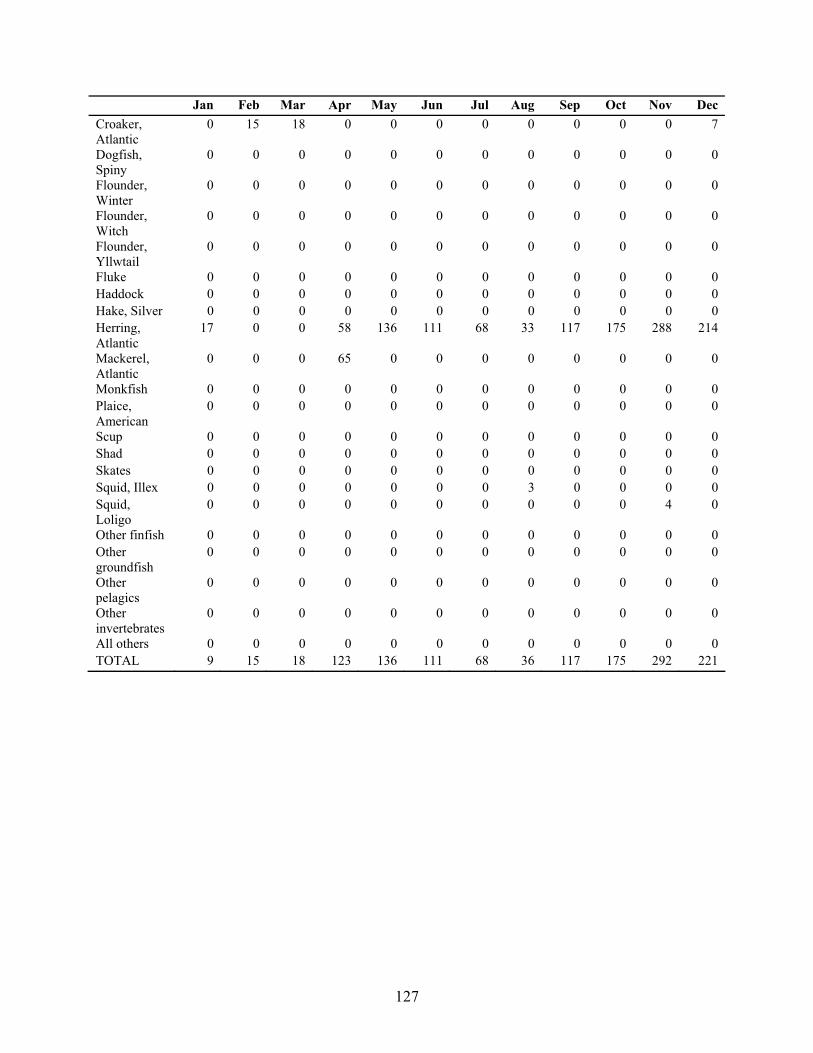
127
Jan Feb Mar Apr May Jun Jul Aug Sep Oct Nov Dec Croaker, Atlantic
0 15 18 0 0 0 0 0 0 0 0 7
Dogfish, Spiny
0 0 0 0 0 0 0 0 0 0 0 0
Flounder, Winter
0 0 0 0 0 0 0 0 0 0 0 0
Flounder, Witch
0 0 0 0 0 0 0 0 0 0 0 0
Flounder, Yllwtail
0 0 0 0 0 0 0 0 0 0 0 0
Fluke 0 0 0 0 0 0 0 0 0 0 0 0 Haddock 0 0 0 0 0 0 0 0 0 0 0 0 Hake, Silver 0 0 0 0 0 0 0 0 0 0 0 0 Herring, Atlantic
17 0 0 58 136 111 68 33 117 175 288 214
Mackerel, Atlantic
0 0 0 65 0 0 0 0 0 0 0 0
Monkfish 0 0 0 0 0 0 0 0 0 0 0 0 Plaice, American
0 0 0 0 0 0 0 0 0 0 0 0
Scup 0 0 0 0 0 0 0 0 0 0 0 0 Shad 0 0 0 0 0 0 0 0 0 0 0 0 Skates 0 0 0 0 0 0 0 0 0 0 0 0 Squid, Illex 0 0 0 0 0 0 0 3 0 0 0 0 Squid, Loligo
0 0 0 0 0 0 0 0 0 0 4 0
Other finfish 0 0 0 0 0 0 0 0 0 0 0 0 Other groundfish
0 0 0 0 0 0 0 0 0 0 0 0
Other pelagics
0 0 0 0 0 0 0 0 0 0 0 0
Other invertebrates
0 0 0 0 0 0 0 0 0 0 0 0
All others 0 0 0 0 0 0 0 0 0 0 0 0 TOTAL 9 15 18 123 136 111 68 36 117 175 292 221


Procedures for Issuing Manuscriptsin the
Northeast Fisheries Science Center Reference Document (CRD) Series
Clearance All manuscripts submitted for issuance as CRDs must have cleared the NEFSC’s manuscript/abstract/webpage review process. If any author is not a federal employee, he/she will be required to sign an “NEFSC Release-of-Copyright Form.” If your manuscript includes material from another work which has been copyrighted, then you will need to work with the NEFSC’s Editorial Office to arrange for permission to use that material by securing release signatures on the “NEFSC Use-of-Copyrighted-Work Permission Form.” For more information, NEFSC authors should see the NEFSC’s online publication policy manual, “Manu-script/abstract/webpage preparation, review, and dis-semination: NEFSC author’s guide to policy, process, and procedure,” located in the Publications/Manuscript Review section of the NEFSC intranet page.
Organization Manuscripts must have an abstract and table of contents, and (if applicable) lists of figures and tables. As much as possible, use traditional scientific manu-script organization for sections: “Introduction,” “Study Area” and/or ”Experimental Apparatus,” “Methods,” “Results,” “Discussion,” “Conclusions,” “Acknowl-edgments,” and “Literature/References Cited.”
Style The CRD series is obligated to conform with the style contained in the current edition of the United States Government Printing Office Style Manual. That style manual is silent on many aspects of scientific manuscripts. The CRD series relies more on the CSE Style Manual. Manuscripts should be prepared to conform with these style manuals. The CRD series uses the American Fisheries Soci-ety’s guides to names of fishes, mollusks, and decapod
crustaceans, the Society for Marine Mammalogy’s guide to names of marine mammals, the Biosciences Information Service’s guide to serial title abbreviations, and the ISO’s (International Standardization Organiza-tion) guide to statistical terms. For in-text citation, use the name-date system. A special effort should be made to ensure that all neces-sary bibliographic information is included in the list of cited works. Personal communications must include date, full name, and full mailing address of the con-tact.
Preparation Once your document has cleared the review pro-cess, the Editorial Office will contact you with publica-tion needs – for example, revised text (if necessary) and separate digital figures and tables if they are embedded in the document. Materials may be submitted to the Editorial Office as files on zip disks or CDs, email attachments, or intranet downloads. Text files should be in Microsoft Word, tables may be in Word or Excel, and graphics files may be in a variety of formats (JPG, GIF, Excel, PowerPoint, etc.).
Production and Distribution The Editorial Office will perform a copy-edit of the document and may request further revisions. The Editorial Office will develop the inside and outside front covers, the inside and outside back covers, and the title and bibliographic control pages of the docu-ment. Once both the PDF (print) and Web versions of the CRD are ready, the Editorial Office will contact you to review both versions and submit corrections or changes before the document is posted online. A number of organizations and individuals in the Northeast Region will be notified by e-mail of the availability of the document online.

Research Communications BranchNortheast Fisheries Science Center
National Marine Fisheries Service, NOAA166 Water St.
Woods Hole, MA 02543-1026
Publications and Reportsof the
Northeast Fisheries Science CenterThe mission of NOAA’s National Marine Fisheries Service (NMFS) is “stewardship of living marine resources for the benefit of the nation through their science-based conservation and management and promotion of the health of their environment.” As the research arm of the NMFS’s Northeast Region, the Northeast Fisheries Science Center (NEFSC) supports the NMFS mission by “conducting ecosystem-based research and assess-ments of living marine resources, with a focus on the Northeast Shelf, to promote the recovery and long-term sustainability of these resources and to generate social and economic opportunities and benefits from their use.” Results of NEFSC research are largely reported in primary scientific media (e.g., anonymously-peer-reviewed scientific journals). However, to assist itself in providing data, information, and advice to its constituents, the NEFSC occasionally releases its results in its own media. Currently, there are three such media:
NOAA Technical Memorandum NMFS-NE -- This series is issued irregularly. The series typically includes: data reports of long-term field or lab studies of important species or habitats; synthesis reports for important species or habitats; annual reports of overall assessment or monitoring programs; manuals describing program-wide surveying or experimental techniques; literature surveys of important species or habitat topics; proceedings and collected papers of scientific meetings; and indexed and/or annotated bibliographies. All issues receive internal scientific review and most issues receive technical and copy editing.
Northeast Fisheries Science Center Reference Document -- This series is issued irregularly. The series typically includes: data reports on field and lab studies; progress reports on experiments, monitoring, and assessments; background papers for, collected abstracts of, and/or summary reports of scientific meetings; and simple bibliographies. Issues receive internal scientific review and most issues receive copy editing.
Resource Survey Report (formerly Fishermen’s Report) -- This information report is a regularly-issued, quick-turnaround report on the distribution and relative abundance of selected living marine resources as derived from each of the NEFSC’s periodic research ves-sel surveys of the Northeast’s continental shelf. This report undergoes internal review, but receives no technical or copy editing.
TO OBTAIN A COPY of a NOAA Technical Memorandum NMFS-NE or a Northeast Fisheries Science Center Reference Document, either contact the NEFSC Editorial Office (166 Water St., Woods Hole, MA 02543-1026; 508-495-2350) or consult the NEFSC webpage on “Reports and Publications” (http://www.nefsc.noaa.gov/nefsc/publications/). To access Resource Survey Report, consult the Ecosystem Surveys Branch webpage (http://www.nefsc.noaa.gov/femad/ecosurvey/mainpage/).
ANY USE OF TRADE OR BRAND NAMES IN ANY NEFSC PUBLICATION OR REPORT DOES NOT IMPLY ENDORSE-MENT.
MEDIA MAIL