characterization, prevention and removal of particulate ... · characterization, prevention and...
TRANSCRIPT
Characterization, Prevention and Removal of Particulate Matter on Printed Circuit
Boards
Prabjit Singh
IBM Corporation
Poughkeepsie, NY, USA
Patrick Ruch and Sarmenio Saliba
IBM Research
Zurich, Switzerland
Christopher Muller
Purafil Inc.
Atlanta, GA, USA
Abstract
Particulate matter contamination is known to become wet and therefore ionically conductive and corrosive if the humidity in
the environment rises above the deliquescence relative humidity (DRH) of the particulate matter. In wet condition,
particulate matter can electrically bridge closely spaced features on printed circuit boards (PCBs), leading to their electrical
failure. Failures attributed to particulate matter have even been observed in data centers where the gaseous contamination
levels are low enough to meet the ANSI/ISA-71.04-2013 G1 severity level. The combination of miniaturization of electronic
components, the reduction of feature spacing on PCBs and the loosening of the data center temperature and humidity
envelope to save energy is making electronic hardware more prone to failure due to particulate matter. The characterization
of particulate matter on PCBs is challenging because of the small amount of particulate matter available for analysis. The
objective of this paper is to develop and describe a practical, routine means of measuring the DRH of minute quantities of
particulate matter (1 mg or less) found on PCBs. Data center particle filtration schemes and means of removing the
particulate matter from PCBs will also be presented.
Introduction
The physical environment surrounding a printed circuit board (PCB) is defined by the temperature, humidity and gaseous and
particulate contamination in the air. Environmental factors can cause PCBs to fail in two ways: First, electrical open circuits
can result from corrosion, such as the corrosion of silver terminations in surface mount components. Second, electrical short
circuits can be caused by (a) copper creep corrosion, (b) electrochemical reactions such as ion migration and cathodic-anodic
Filamentation or (c) settled, hygroscopic particulate matter contamination reducing the surface insulation resistance between
closely spaced features on PCBs. In 2006, the European Union’s RoHS directive banning the use of lead in solders led to
changes in PCB finishes and the elimination of lead from solders [1]. These changes dramatically increased the PCB failure
rates due to creep corrosion. Another common failure mode during this period was that of surface mount resistors suffering
open circuits due to the corrosion of their silver terminations. The information technology (IT) equipment manufacturers
have since learned to make their hardware robust against these two failure modes, which used to occur predominantly in
geographies with high levels of sulfur bearing gaseous contamination [2-4]. The failure mode that is much more difficult to
deal with and eliminate is that of the electrical short circuiting caused by the accumulated particulate matter in humid
environments. The difficulty arises from the intermittent electrical nature of these particles and that the failure leaves no
visible evidence besides the presence of deposited particulate matter [5, 6].
The rapid expansion of the IT equipment market in the polluted geographies of Asia that have high levels of fine particulate
matter in the ambient air and the increasing use of free cooling is introducing this new, often intermittent, short-circuit failure
mode due to particulate matter. The source of particulate matter is both natural and anthropogenic. In terms of size,
particulate matter can be divided into two categories: fine and coarse particles. Fine particles (<2.5µm), such as those found in
motor vehicle exhaust, diesel particulate matter (DPM), smoke and haze, are of two types: primary and secondary [7, 8]. The
primary fine particles are directly emitted from a source, such as a forest fire, volcanoes, construction sites, unpaved roads, fields or
smokestacks. The secondary fine particles, which make up most of the fine particulate pollution, are those formed as a result of
photochemical reactions in the atmosphere. This is generally due to the presence of oxides of nitrogen and sulfur emitted from
power plants, industries and automobiles. Sulfur dioxide and nitrogen dioxide interact with <0.1 µm size carbonaceous material
seed particles in a complex, multi-step photochemical process to produce sulfuric and nitric acids. These acids are neutralized by
ammonia from fertilizers, decay of biological materials and other sources to produce fine particles dominated by ammonium sulfate,
As originally published in the IPC APEX EXPO Conference Proceedings.
ammonium hydrogen sulfate and ammonium nitrate. The majority of these secondary fine particles would be considered
anthropogenic [9, 10]. Coarse particles, which are in the 2.5-15 µm size range, include sea salt, natural and artificial fibers, plant
pollens, and wind-blown dust. Their sources include erosion of soil and minerals and flaking of biological materials [11].
The nascent failure mode due to particulate matter contamination is the subject of this paper. Particle contamination that has
accumulated on PCBs causes electrical short-circuit failures because particulate matter’s electrical resistance decreases
sharply when the relative humidity of the surrounding air increases above the deliquescence relative humidity (DRH) of the
particulate matter [7]. The corrosion behavior of particulate matter is best characterized by its DRH, which is the relative
humidity of the air at which the particulate matter absorbs enough moisture from the air to dissolve in the absorbed water and
form an ionically conductive solution. This paper is devoted to the development of a practical DRH test method appropriate
for failure analysis of electronic hardware. The test method should be capable of testing 1 mg or less of available particulate
matter. Means of preventing particulate contamination from entering the data center and settling on IT equipment and means
of cleaning contaminated equipment are also presented.
Deliquescence relative humidity (DRH) test method development
There are many ways of measuring the DRH of particulate matter [12-14]. However, when the amount of particulate matter
available for analysis is limited to less than a milligram, the available analysis options reduce to electrical and gravimetric
methods. We chose to concentrate on developing an electrical method because our interest is the electrical conductivity of
the wetted particulate matter which can directly influence IT equipment reliability. Gravimetric tests were conducted to
interpret and support the electrical conductivity test results.
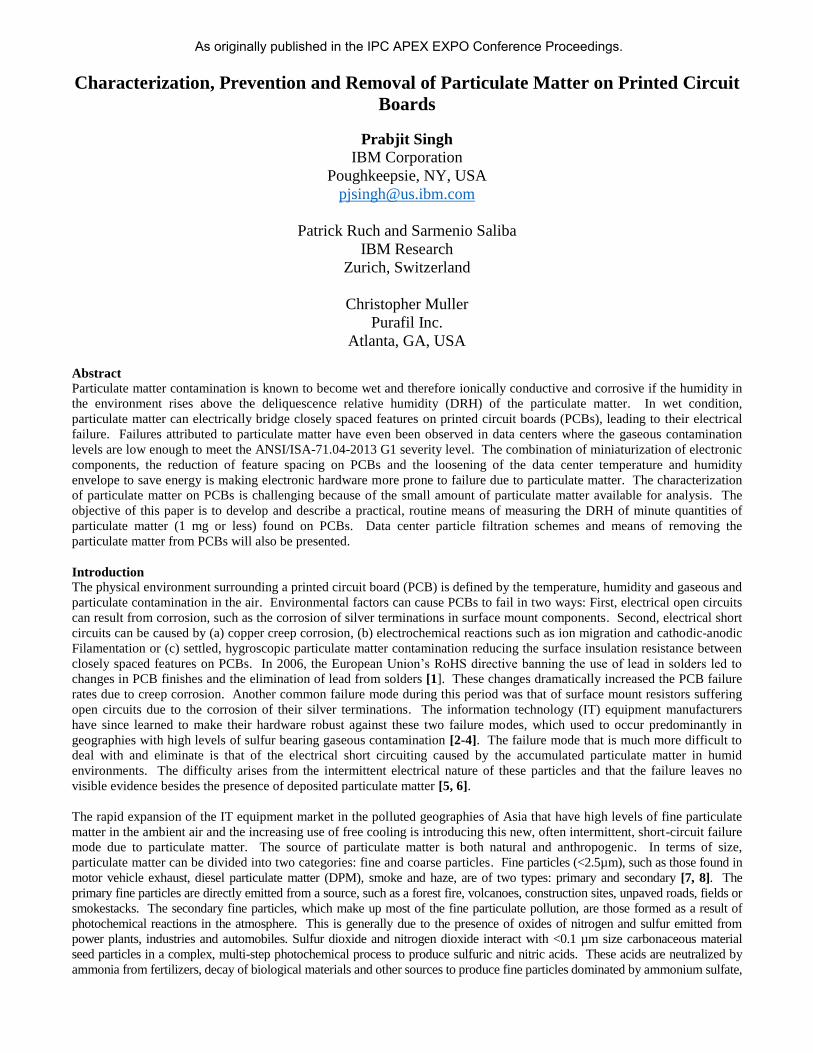
The electrical conductivity test method of measuring the DRH of particulate matter starts with dispensing the particulate
matter under test on an interdigitated combs pattern. The interdigitated combs coupons used in this work are industry
standard test boards IPC-B-24 Rev A, shown in Figure 1a. The interdigitated combs are separated by a gap of 0.5 mm which
the particulate matter has to bridge to conduct current between the combs. Each test board has 4 independent comb pattern
areas, allowing 4 particulate matter specimens to be tested simultaneously. Voltage is applied across the combs and the
leakage current through the particulate matter bridging the combs is measured and plotted as a function of relative humidity.
The DRH is obtained from the plot of leakage current versus relative humidity.
There are various ways to collect particulate matter and dispense it on an interdigitated combs pattern.
A soft brush can be used to sweep the dust into a clean plastic bag to transport to an analysis laboratory. The problem
with this approach is the difficulty of sweeping the fine dust off the surface into the plastic bag. Another problem is
that once in the bag, it is difficult to sprinkle the dust on to an interdigitated combs pattern in a controlled manner.
Witness interdigitated combs test boards can be placed in the data center under study for a period of time (e.g., one
month), to allow enough time for dust particles to settle on the test board. The contaminated boards are returned to a
laboratory for DRH measurement.
The third and the most convenient method of collecting particulate matter accumulated on a printed circuit board (PCB)
is to start with a contaminated PCB which is shipped to a laboratory where it is washed with a deionized water and
isopropyl alcohol solution and the wash liquid collected and concentrated by evaporation. Concentrated drops,
preferably 10 drops, each 10 µl in volume, are dispensed on an interdigitated combs pattern (Figure 1b) and dried.
(a) (b)
Figure 1: (a) Interdigitated combs coupon with four comb patterns as per IPC-B-24 Rev A; (b) 10
drops of salt solution on a silver-plated interdigitated combs pattern.
In the laboratory, the interdigitated combs coupon, with a uniform covering of particulate matter obtained by one of the
above methods, is placed in a precision humidity chamber at a constant temperature of interest, generally in the 25-30°C
range. The starting relative humidity in the chamber should be at the lower limit of the chamber capability. The relative
humidity is raised in 10% steps and the leakage current through the particulate matter, at a predetermined set voltage,
measured and plotted versus relative humidity. In published literature, the deliquescence relative humidity is vaguely defined
as the relative humidity at which there is a sudden rise in the electrical conductivity of the particulate matter [15].
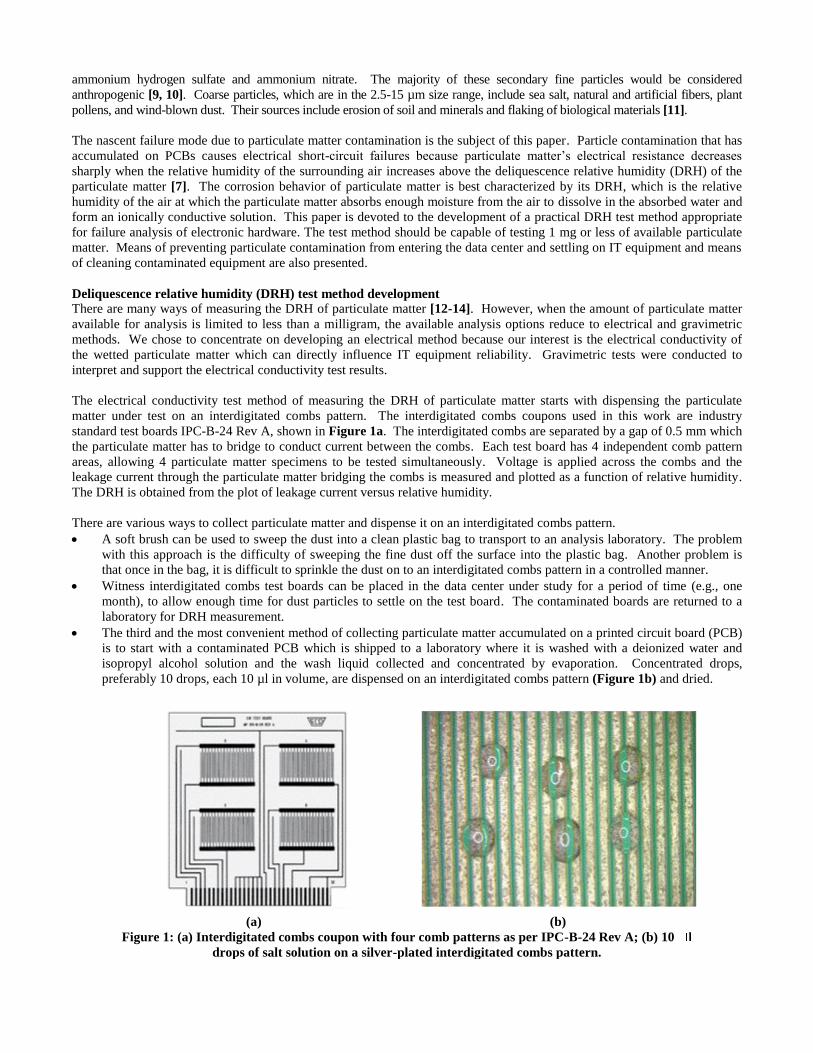
It is standard practice to measure conductivity of the particulate matter by applying a constant voltage, typically 10 Vdc,
across the interdigitated combs and measuring the leakage current through the particulate matter [15]. The results of one
such test are shown in Figure 2. Notice that each time the relative humidity was stepped up, there was a sudden rise in
leakage current followed by a decay of the current. Another interesting point to note is that stepping up from 75 to 83%
relative humidity caused a drop in leakage current instead of the expected rise. These observations can be explained on the
basis that continuous application of 10 Vdc across the combs causes electrochemical reactions in the inter-comb space that
deplete the mobile ions and could cause enough gas evolution to form vapor which is not electrically conductive.
Proposed procedure for measuring DRH: A potentiostat was used to measure the leakage current through the particulate
matter bridging the combs by applying a square waveform voltage across the combs. The potentiostat was capable of
measuring current accurately in the low nano-ampere range. The applied voltage was limited to two cycles lasting a total of 4
seconds to minimally disturb the electrochemistry of the particulate matter being tested.
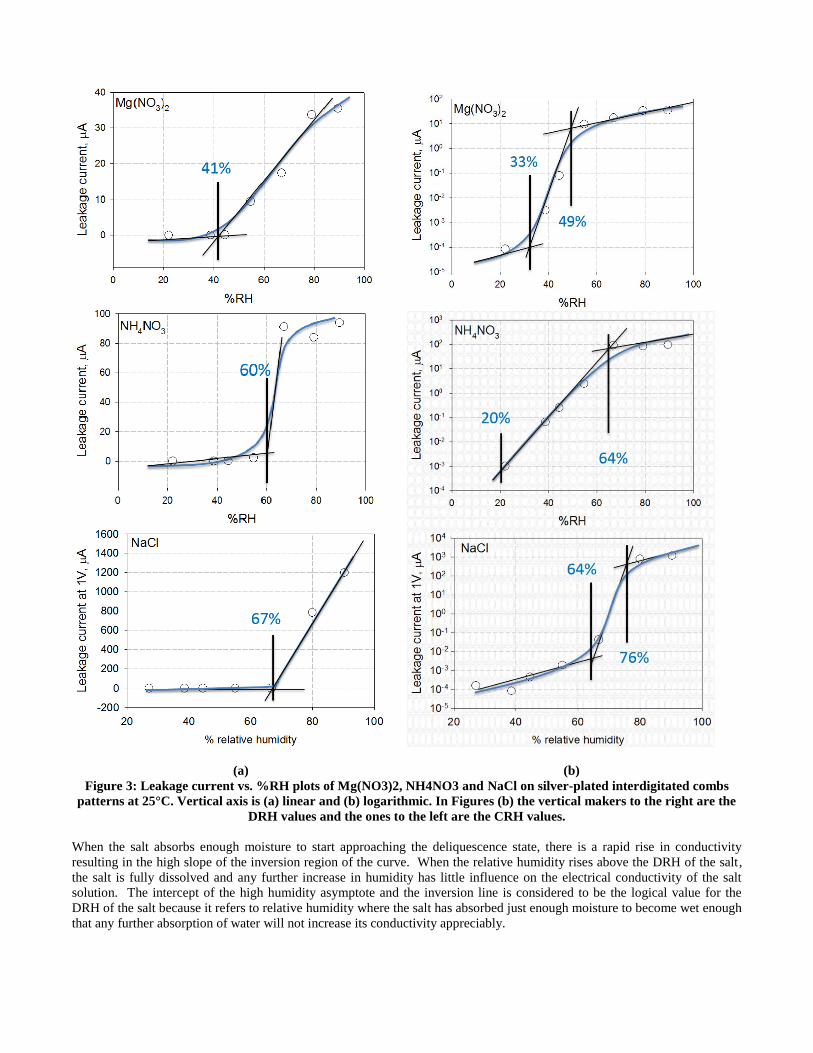
As a first step in the test development, three salts, magnesium nitrate [Mg(NO3)2], ammonium nitrate [NH4NO3] and sodium
chloride [NaCl], with published DRH values at 25°C of 53%, 62% and 75%, respectively, were studied [16]. Ten drops, each
10 µl in volume, of a 0.1 wt% salt solution were dispensed on each comb pattern and dried. The comb coupons were placed
in a temperature-humidity chamber and the humidity set at the lowest value the chamber could achieve, which was about
30%. The relative humidity was raised in steps of roughly 10% and the time at each %RH step was one hour. Leakage
current was measured at the end of each %RH step and plotted versus %RH for each salt as shown in Figure 3. It is tempting
to interpret the linear plots in terms of the intercepts of the low and high humidity asymptotes being the deliquescent relative
humidity of the salts. However, the problem is that the intercepts shown in Figures 3a do not coincide with published values
of the deliquescence relative humidity of the salts and they depend on the magnitude of the vertical scale. In order to extract
the deliquescence relative humidity values that agree with published values, other ways of plotting the leakage currents
needed to be explored.
In Figures 3b, the logarithm of the leakage currents for the three salts are plotted versus %RH. Notice that the curves are S-
shaped that can be made piece-wise linear by drawing straight lines covering the inversion region and the low and the high
relative humidity asymptotes. The high humidity asymptotes happen to intersect the inversion lines at values very close to
the published DRH values for these three salts. The physical origin of the S shape of the log (current leakage) versus %RH is
as follows: When the salt is in equilibrium with humidity in the low humidity range, a small increase in relative humidity
does not change the salt’s electrical conductivity significantly because the salt stays relatively dry.
(a) (b)
Figure 2: (a) Leakage current, measured at 10 Vdc, versus time with the relative humidity increased in steps, each
step lasting a day. (b) Leakage current versus %RH.
(a) (b)
Figure 3: Leakage current vs. %RH plots of Mg(NO3)2, NH4NO3 and NaCl on silver-plated interdigitated combs
patterns at 25°C. Vertical axis is (a) linear and (b) logarithmic. In Figures (b) the vertical makers to the right are the
DRH values and the ones to the left are the CRH values.
When the salt absorbs enough moisture to start approaching the deliquescence state, there is a rapid rise in conductivity
resulting in the high slope of the inversion region of the curve. When the relative humidity rises above the DRH of the salt,
the salt is fully dissolved and any further increase in humidity has little influence on the electrical conductivity of the salt
solution. The intercept of the high humidity asymptote and the inversion line is considered to be the logical value for the
DRH of the salt because it refers to relative humidity where the salt has absorbed just enough moisture to become wet enough
that any further absorption of water will not increase its conductivity appreciably.
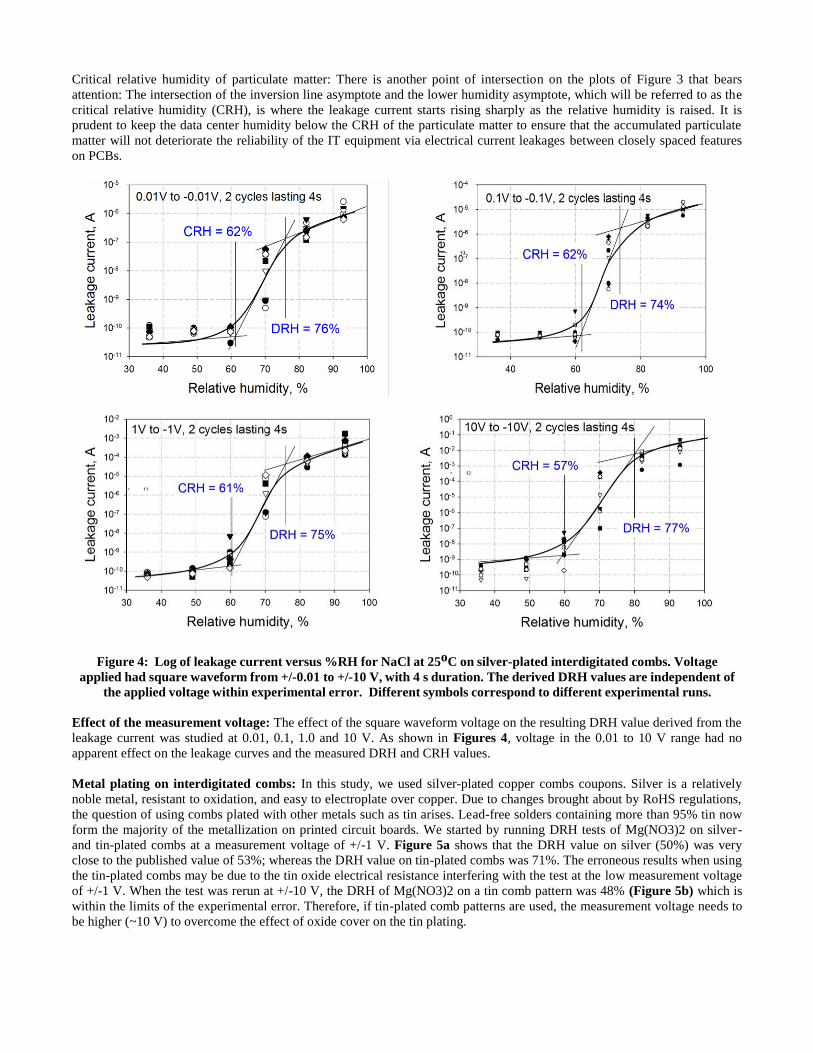
Critical relative humidity of particulate matter: There is another point of intersection on the plots of Figure 3 that bears
attention: The intersection of the inversion line asymptote and the lower humidity asymptote, which will be referred to as the
critical relative humidity (CRH), is where the leakage current starts rising sharply as the relative humidity is raised. It is
prudent to keep the data center humidity below the CRH of the particulate matter to ensure that the accumulated particulate
matter will not deteriorate the reliability of the IT equipment via electrical current leakages between closely spaced features
on PCBs.
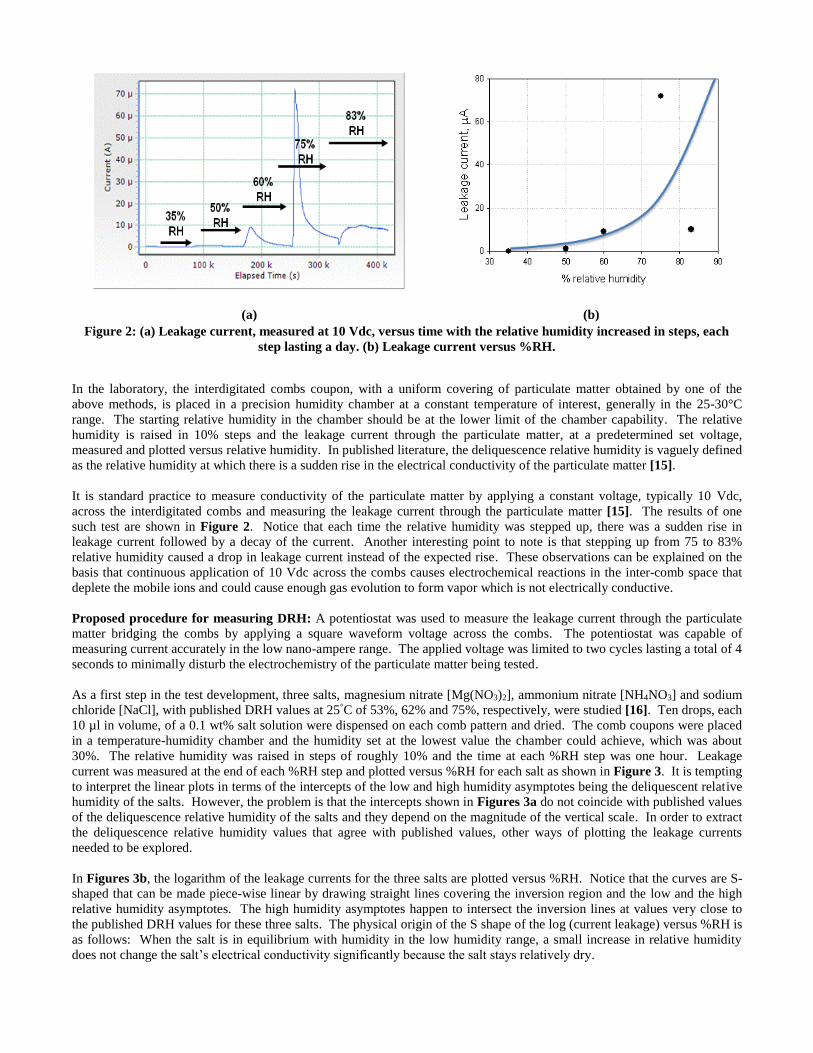
Figure 4: Log of leakage current versus %RH for NaCl at 25oC on silver-plated interdigitated combs. Voltage
applied had square waveform from +/-0.01 to +/-10 V, with 4 s duration. The derived DRH values are independent of
the applied voltage within experimental error. Different symbols correspond to different experimental runs.
Effect of the measurement voltage: The effect of the square waveform voltage on the resulting DRH value derived from the
leakage current was studied at 0.01, 0.1, 1.0 and 10 V. As shown in Figures 4, voltage in the 0.01 to 10 V range had no
apparent effect on the leakage curves and the measured DRH and CRH values.
Metal plating on interdigitated combs: In this study, we used silver-plated copper combs coupons. Silver is a relatively
noble metal, resistant to oxidation, and easy to electroplate over copper. Due to changes brought about by RoHS regulations,
the question of using combs plated with other metals such as tin arises. Lead-free solders containing more than 95% tin now
form the majority of the metallization on printed circuit boards. We started by running DRH tests of Mg(NO3)2 on silver-
and tin-plated combs at a measurement voltage of +/-1 V. Figure 5a shows that the DRH value on silver (50%) was very
close to the published value of 53%; whereas the DRH value on tin-plated combs was 71%. The erroneous results when using
the tin-plated combs may be due to the tin oxide electrical resistance interfering with the test at the low measurement voltage
of +/-1 V. When the test was rerun at +/-10 V, the DRH of Mg(NO3)2 on a tin comb pattern was 48% (Figure 5b) which is
within the limits of the experimental error. Therefore, if tin-plated comb patterns are used, the measurement voltage needs to
be higher (~10 V) to overcome the effect of oxide cover on the tin plating.
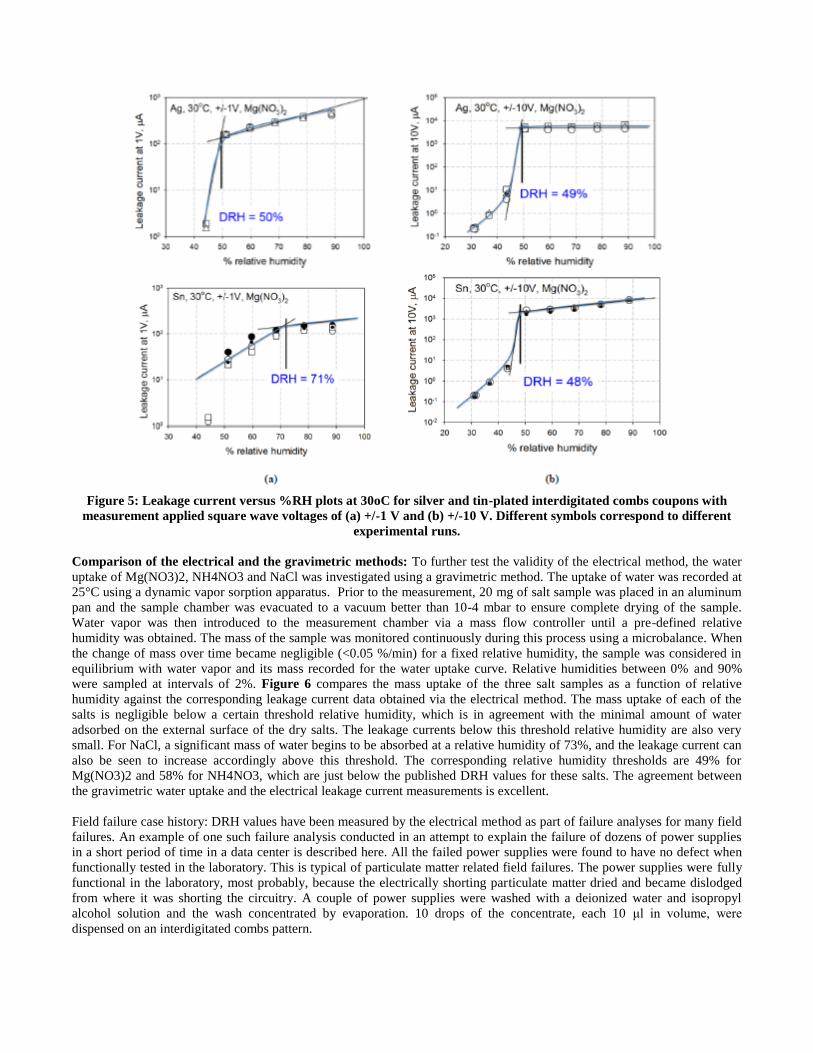
Figure 5: Leakage current versus %RH plots at 30oC for silver and tin-plated interdigitated combs coupons with
measurement applied square wave voltages of (a) +/-1 V and (b) +/-10 V. Different symbols correspond to different
experimental runs.
Comparison of the electrical and the gravimetric methods: To further test the validity of the electrical method, the water
uptake of Mg(NO3)2, NH4NO3 and NaCl was investigated using a gravimetric method. The uptake of water was recorded at
25°C using a dynamic vapor sorption apparatus. Prior to the measurement, 20 mg of salt sample was placed in an aluminum
pan and the sample chamber was evacuated to a vacuum better than 10-4 mbar to ensure complete drying of the sample.
Water vapor was then introduced to the measurement chamber via a mass flow controller until a pre-defined relative
humidity was obtained. The mass of the sample was monitored continuously during this process using a microbalance. When
the change of mass over time became negligible (<0.05 %/min) for a fixed relative humidity, the sample was considered in
equilibrium with water vapor and its mass recorded for the water uptake curve. Relative humidities between 0% and 90%
were sampled at intervals of 2%. Figure 6 compares the mass uptake of the three salt samples as a function of relative
humidity against the corresponding leakage current data obtained via the electrical method. The mass uptake of each of the
salts is negligible below a certain threshold relative humidity, which is in agreement with the minimal amount of water
adsorbed on the external surface of the dry salts. The leakage currents below this threshold relative humidity are also very
small. For NaCl, a significant mass of water begins to be absorbed at a relative humidity of 73%, and the leakage current can
also be seen to increase accordingly above this threshold. The corresponding relative humidity thresholds are 49% for
Mg(NO3)2 and 58% for NH4NO3, which are just below the published DRH values for these salts. The agreement between
the gravimetric water uptake and the electrical leakage current measurements is excellent.
Field failure case history: DRH values have been measured by the electrical method as part of failure analyses for many field
failures. An example of one such failure analysis conducted in an attempt to explain the failure of dozens of power supplies
in a short period of time in a data center is described here. All the failed power supplies were found to have no defect when
functionally tested in the laboratory. This is typical of particulate matter related field failures. The power supplies were fully
functional in the laboratory, most probably, because the electrically shorting particulate matter dried and became dislodged
from where it was shorting the circuitry. A couple of power supplies were washed with a deionized water and isopropyl
alcohol solution and the wash concentrated by evaporation. 10 drops of the concentrate, each 10 μl in volume, were
dispensed on an interdigitated combs pattern.
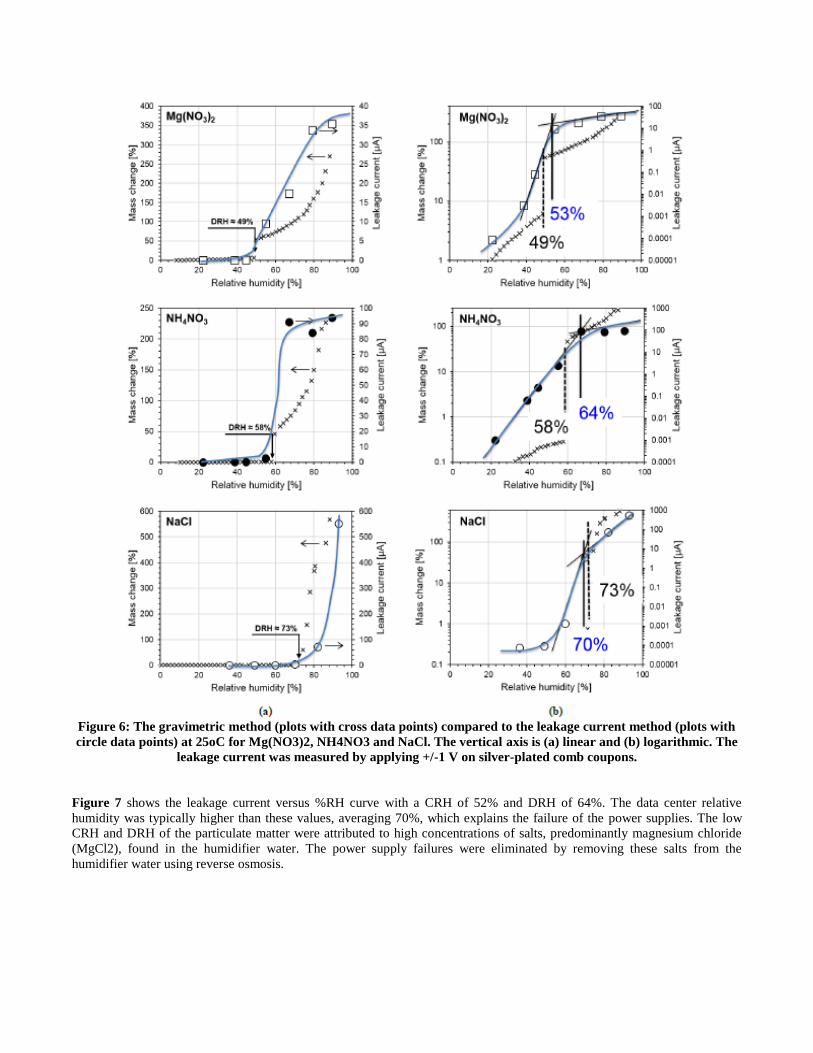
Figure 6: The gravimetric method (plots with cross data points) compared to the leakage current method (plots with
circle data points) at 25oC for Mg(NO3)2, NH4NO3 and NaCl. The vertical axis is (a) linear and (b) logarithmic. The
leakage current was measured by applying +/-1 V on silver-plated comb coupons.
Figure 7 shows the leakage current versus %RH curve with a CRH of 52% and DRH of 64%. The data center relative
humidity was typically higher than these values, averaging 70%, which explains the failure of the power supplies. The low
CRH and DRH of the particulate matter were attributed to high concentrations of salts, predominantly magnesium chloride
(MgCl2), found in the humidifier water. The power supply failures were eliminated by removing these salts from the
humidifier water using reverse osmosis.
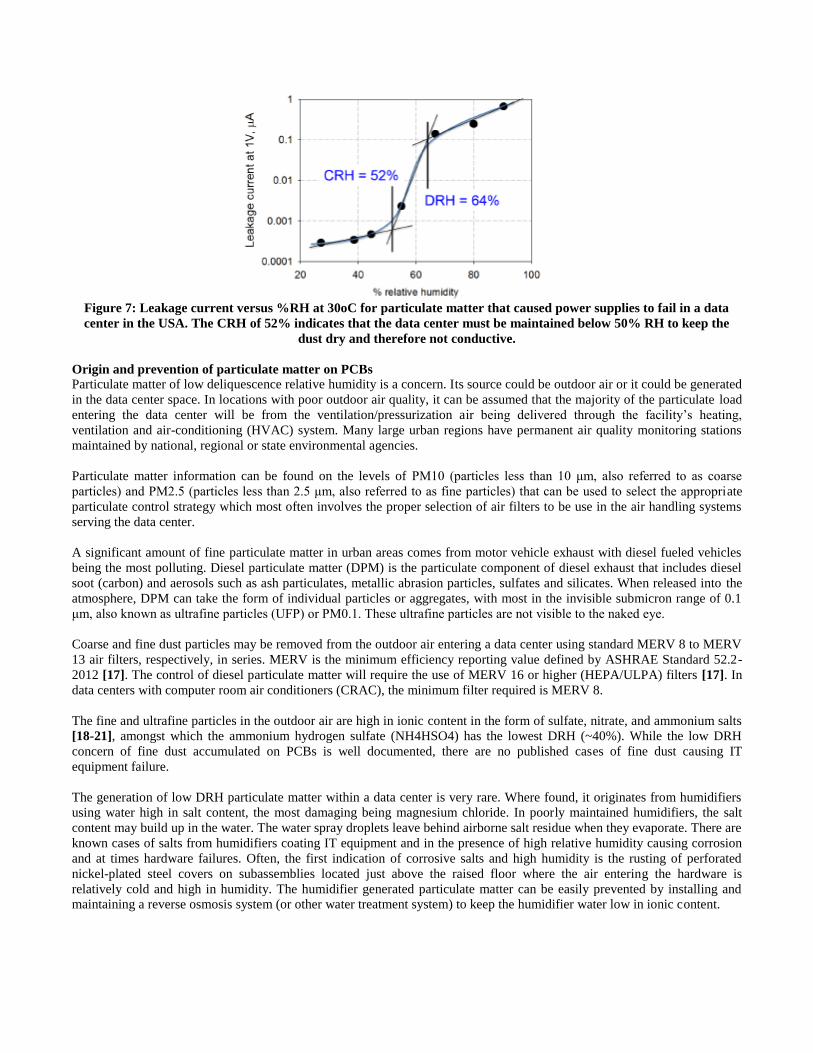
Figure 7: Leakage current versus %RH at 30oC for particulate matter that caused power supplies to fail in a data
center in the USA. The CRH of 52% indicates that the data center must be maintained below 50% RH to keep the
dust dry and therefore not conductive.
Origin and prevention of particulate matter on PCBs
Particulate matter of low deliquescence relative humidity is a concern. Its source could be outdoor air or it could be generated
in the data center space. In locations with poor outdoor air quality, it can be assumed that the majority of the particulate load
entering the data center will be from the ventilation/pressurization air being delivered through the facility’s heating,
ventilation and air-conditioning (HVAC) system. Many large urban regions have permanent air quality monitoring stations
maintained by national, regional or state environmental agencies.
Particulate matter information can be found on the levels of PM10 (particles less than 10 μm, also referred to as coarse
particles) and PM2.5 (particles less than 2.5 μm, also referred to as fine particles) that can be used to select the appropriate
particulate control strategy which most often involves the proper selection of air filters to be use in the air handling systems
serving the data center.
A significant amount of fine particulate matter in urban areas comes from motor vehicle exhaust with diesel fueled vehicles
being the most polluting. Diesel particulate matter (DPM) is the particulate component of diesel exhaust that includes diesel
soot (carbon) and aerosols such as ash particulates, metallic abrasion particles, sulfates and silicates. When released into the
atmosphere, DPM can take the form of individual particles or aggregates, with most in the invisible submicron range of 0.1
μm, also known as ultrafine particles (UFP) or PM0.1. These ultrafine particles are not visible to the naked eye.
Coarse and fine dust particles may be removed from the outdoor air entering a data center using standard MERV 8 to MERV
13 air filters, respectively, in series. MERV is the minimum efficiency reporting value defined by ASHRAE Standard 52.2-
2012 [17]. The control of diesel particulate matter will require the use of MERV 16 or higher (HEPA/ULPA) filters [17]. In
data centers with computer room air conditioners (CRAC), the minimum filter required is MERV 8.
The fine and ultrafine particles in the outdoor air are high in ionic content in the form of sulfate, nitrate, and ammonium salts
[18-21], amongst which the ammonium hydrogen sulfate (NH4HSO4) has the lowest DRH (~40%). While the low DRH
concern of fine dust accumulated on PCBs is well documented, there are no published cases of fine dust causing IT
equipment failure.
The generation of low DRH particulate matter within a data center is very rare. Where found, it originates from humidifiers
using water high in salt content, the most damaging being magnesium chloride. In poorly maintained humidifiers, the salt
content may build up in the water. The water spray droplets leave behind airborne salt residue when they evaporate. There are
known cases of salts from humidifiers coating IT equipment and in the presence of high relative humidity causing corrosion
and at times hardware failures. Often, the first indication of corrosive salts and high humidity is the rusting of perforated
nickel-plated steel covers on subassemblies located just above the raised floor where the air entering the hardware is
relatively cold and high in humidity. The humidifier generated particulate matter can be easily prevented by installing and
maintaining a reverse osmosis system (or other water treatment system) to keep the humidifier water low in ionic content.
Removal of particulate matter from PCBs IT equipment manufacturers are sometimes faced with the challenge of cleaning contaminated hardware in the field. The
challenges are as follows:
The contaminated subassemblies cannot be disassembled and cleaned in the field and put back into service without
first being functionally tested. Safety concerns require that subassemblies with high voltages must be tested by
applying high potential, commonly referred to as hipot testing, before putting back in to service.
Since the particulate matter of concern has low DRH, ionized compressed air alone will not blow away the tacky,
wet particles.
The logistics of removing, cleaning and installing subassemblies in a production data center facility are daunting.
There are two general methods of removing particulate matter from subassemblies:
1. Disassembling the subassemblies and washing in a solvent.
2. Blowing away the particulate matter from intact or disassembled subassemblies using ionized air guns.
Solvent cleaning is recommended only if it is done by the original equipment manufacturer (OEM) using qualified
procedures, followed by full functional and safety testing. The complexity of removing parts from a production data
center facility, shipping to the OEM facility and returning the cleaned parts is a daunting logistical challenge made more
so if the parts have to cross country borders and go through customs.
Ionized air gun cleaning may seem like a more viable and simpler approach that can be done at the data center facility
because no subassembly or post functional testing is required, but the tacky and wet nature of particulate matter with low
DRH requires that the cleaning be done in a very dry environment in which the dust particles become and stay dry. The
subassemblies need to be removed from the data center for cleaning in a designated and sealed room where the humidity is
lowered to well below the DRH of the dust. Ionized air guns using compressed air or nitrogen gas will remove
particulate matter from intact subassemblies. Since no disassembly was done, the cleaned hardware may be put back
into operation in the data center with no functional or safety testing requirement. The ionized air gun cleaning process
must be qualified and the guns periodically checked for proper functioning.
Discussion
The logarithm of leakage current versus %RH plots reveal for the first time that the curve is S shaped. The intersection of
the inversion line and the upper humidity asymptote very closely coincides with the published DRH values. Any deviations
from the published values are probably due to the error in the relative humidity measurement and control of the humidity in
the chamber.
The intersection of the inversion line and the lower humidity asymptote also bears attention. Above this humidity, the curve
rises sharply even when the leakage current is plotted on a logarithmic scale. This humidity value can be considered the
critical relative humidity (CRH) of the particulate matter. Data center relative humidity must be kept below the CRH of the
particulate matter in the data center to ensure that the particulate matter stays dry and electrically insulating.
The difference between the DRH and the CRH values of the Mg(NO3)2 and NaCl are quite small compared to that of
NH4NO3. The NH4NO3 CRH is about 20%, which is more than 40% less than its DRH value. So in the case of particulate
matter high in ammonium nitrate, using the DRH characteristic alone may be misleading because it becomes substantially
conductive well below its DRH. Another reason we should pay attention to CRH is the prevalence of ammonium salts,
including NH4NO3, in fine particulate matter.
Conclusions
In summary, the deliquescence relative humidity test procedure that has been developed for testing field-returned IT
equipment or witness coupons is as follows: The field returned hardware is washed with a deionized water and isopropyl
alcohol solution, the wash water concentrated by evaporation and 10 drops of the concentrate, 10 µl in volume, deposited on
a silver-plated comb pattern. A comb pattern witness coupon, on which data center dust settles directly, needs no further
treatment and can be transferred to a controlled humidity chamber as is. The humidity in the chamber is raised in steps of
roughly 10% RH and the leakage current measured at each humidity step using a +/-1 V square waveform with a 2 second
period for 2 cycles. The humidity range for which this method is valid is from 30 to 90% RH. The logarithm of the leakage
current is plotted versus relative humidity and the deliquescence relative humidity (DRH) is at the intercept of the inversion
line and the high humidity asymptote. The critical relative humidity (CRH) is the intercept of the inversion line and the low
humidity asymptote. The relative humidity of the air in the data center must be kept below the CRH of the accumulated
particulate matter on the IT equipment to avoid failures due to the particulate matter wet and therefore conductive.
References
[1] Directive 2002/95/EC of the European Parliament and of the Council of 27 January 2003 on the Restriction of the use
of Certain Hazardous Substances on Electrical and Electronic Equipment Official Journal L 037, February 13, 2003,
19-23.
[2] Fu, H., C. Chen, P. Singh, J. Zhang. A. Kurella, X. Chen, X. Jiang, J. Burlingame and S. Lee, Investigation of Factors
that Influence Creep Corrosion on Printed Circuit Boards,” SMTA Pan Pacific Microelectronics Symposium, Kauai,
14-16 Feb 2012.
[3] Fu, H., C. Chen, P. Singh, J. Zhang. A. Kurella, X. Chen, X. Jiang, J. Burlingame and S. Lee, Investigation of Factors
that Influence Creep Corrosion on Printed Circuit Boards, Part 2, SMTAI 2012.
[4] Cole, M., L. Hedlund. T; Kiraly, S. Nickel, P. Singh and T. Tofil, Harsh Environmental Impact on Resistor Reliability,
SMTA Int’l Conf, Proc., 24 Oct 2010.
[5] Burnett W. H., F. S. Sandroff and S. M. D’Egidio, “Circuit failure due to fine dust mode particulate air pollution,”
ISTFA ’92, The 18th Int’l Symposium for Testing & Failure Analysis, Los Angeles, CA, 17-23 Oct 1992, 329-333.
[6] Litvak, A., A. J. Gadgil, and W. J. Fisk. 2000. Hygroscopic Fine Mode Particle Deposition on Electronic Circuits and
Resulting Degradation of Circuit Performance: An Experimental Study, Indoor Air 2000, vol. 10, pg 47-56, 2000.
[7] Song B., M. H. Azarisn and M. G. Pecht, “Effect of temperature and relative humidity on the impedance degradation
of dust-contaminated electronics,” Journal of The Electrochemical Society, 160 (3), 2013, C97-C105.
[8] Seinfeld J. H. and S. N. Pandis, “Atmospheric Chemistry and Physics,” John Wiley & Sons, Inc, New York, NY.
[9] Zhao P. et al. “Characteristics of concentrations and chemical compositions for PM2.5 in the region of Beijing, Tianjin
and Hebei, China,” Atmos. Chem. Phys. Discuss., Vol. 2013, 863-901.
[10] U. S. Environmental Protection Agency. AIRTrends 1995 Summary – Nitrogen Dioxide (NO2). ONLINE. 2014.
Available: http://www.epa.gov/airtrends/aqtrnd95/no2.html [07 Oct. 2014].
[11] Comizzoli R. B.et al. “Corrosion of electronic materials and devices by submicron atmospheric particles,” The
Electrochemical Society Interface, Fall 1993, 27-33.
[12] Yang L., R. T. Pabalan and M. R. Juckett, “Deliquescence relative humidity measurements using an electrical
conductivity method,” Journal of Solution Chemistry, Vol. 35. No. 4, April 2006, 583-604
[13] Yang L., R. T. Pabalan and L. Browning, “Experimental determination of the deliquescence relative humidity and
conductivity of multicomponent salt mixtures,” Mat. Res. Soc., Symp. Proc., Vol. 713, 2002, JJ11.4.1-JJ11.4.8.
[14] Racine M., “The effects of temperature on the deliquescence of atmospheric aerosols,”
eduprograms.seas.harvard.edu/reu05_papers/Racine_Maryann.pdf, last accessed on Oct 4, 2014.
[15] ASHRAE, “Particulate and gaseous contamination in datacom environments, 2nd Edition,” Atlanta, GA, American
Society of Heating, Refrigeration and Air-Conditioning Engineers, Inc., 2013.
[16] Wexler A. and S. Hasegawa, Relative humidity-temperature relationships of some saturated salt solutions in the
temperature range
[17] ASHRAE Standard 52.2-2012, Method of testing general ventilation air-cleaning devices for removal efficiency by
particle size, Atlanta, GA, USA.
[18] Harrison R.M., et al. “Airborne Particulate Matter in the United Kingdom.” Third Report of the Quality of Urban Air
Review Group, May, 1996.
[19] Husar R., “Properties of Particulate Matter,” Washington University, St. Louis, 1999.
[20] Harrison R. and J. Yin, “Characterisation of Particulate Matter in the United Kingdom,” Report produced for Defra,
the National Assembly for Wales, the Department of the Environment in Northern Ireland and the Scottish Executive,
The University of Birmingham, March 2004.
[21] Čupr P., Z. Flegrová, J. Franců, L. Landlová, and J. Klánová, “Mineralogical, chemical and toxicological
characterization of urban air particles,” Environment International 54 (2013), 26–34.