characterizing language proficiency in hindi and · pdf file ·...
TRANSCRIPT
1
Characterizing language proficiency in Hindi and English language:
Implications for bilingual research
Running head: Bilingual Language proficiency
Tanya Dash and Bhoomika R. Kar*
Centre of Behavioural and Cognitive Sciences, University of Allahabad, Allahabad, UP, India.
*Correspondence:
Dr. Bhoomika R Kar
Centre of Behavioural and Cognitive Sciences
Senate hall campus
University of Allahabad
Allahabad-211002
Uttar Pradesh, India
Citation for this paper is as follows: Dash, T. & Kar, B. R. (In Press). Characterizing language
proficiency in Hindi and English language: Implications for bilingual research. International
Journal of Mind Brain and Cognition
2
Abstract
Bilingual context is characterized by linguistic diversity, different patterns of language
acquisition and variations in language use across contexts. We examined the nature of language
proficiency with one of the dominant language combinations (Hindi-English) in north India. The
present study is one of the first attempts to examine the nature of language proficiency in Indian
bilingual context. The organization of language skills was examined across the
spoken/understanding and reading/writing domains in Hindi (L1) and English (L2) languages, a
combination which follows different patterns of acquisition and use. The correspondence
between the subjective and objective measures of language proficiency was analyzed to
understand how language history would predict differences in proficiency levels. An indigenous
tool for testing language skills in Hindi and English was administered to 85 Hindi-English
bilingual adults along with a Language History Questionnaire. There was no significant
correlation between self reported information on age of acquisition and objective measures of
language proficiency. The factor structure of L1 showed task based and not domain based
clustering whereas L2 language skills showed clustering within and across domains. Greater
interdependence of L1 and L2 was observed for the reading/writing domain. Results of the
current study highlight the diversity within Indian Language combinations which ought to vary
from Western pattern of language acquisition i.e. simultaneous/sequential acquisition. Thus, use
of a comprehensive tool is justified for the bilingual and multicultural population. Present study
highlights the use of objective measures of language proficiency. Proficiency in L1 and L2
languages emerged as a continuous rather than a discrete or categorical variable. Findings of this
study have implications for participant selection procedures and interpretation of experimental
data in bilingual research particularly for language combinations where L1 is acquired informally
and L2 is learnt through formal instruction.
Keywords: Bilingualism, language proficiency, Hindi-English.
3
Introduction:
Bi/multilingualism is a multifaceted phenomenon. The complex nature of this phenomenon
requires greater understanding at the level of defining/profiling bilingual population, bilingual
language acquisition, measures of bilingualism, and language representation. Current knowledge
of bilingualism is predominantly based on Western norms which may not be applicable in a
bilingual context of India. Indian bilingual context is characterized by linguistic diversity,
various combinations of two languages, different patterns of acquisition (formal vs informal/
both languages acquired early or late), and different patterns of use across contexts. There is a
greater need to study the organization of bilingual language skills in Indian context (Vasanta,
2011). The present study is one of the first attempts to systematically profile bilinguals using
both subjective and objective measures.We examined the organization of language skills across
domains of speaking/understanding and reading/writing in Hindi-English bilingual individuals.
Such studies are important to determine the procedures for participant selection and for
interpretation of experimental results in bilingual research.
Research on second language (L2) acquisition has long been focusing on the age of
acquisition (AoA) and second language proficiency. Much evidence points to the notion that
AoA is a primary predictor for the L2 proficiency (Johnson & Newport, 1989; Stevens, 1999;
Weber-Fox & Neville, 1996). Many studies regarding L2 acquisition underline the importance of
other variables, such as use of the language and level of first language (L1) proficiency (Herman,
Bongaerts, De Bot & Schrender, 1998; Flege, Yeni-Komshian, & Liu, 1999). Karanth (2012) has
highlighted the differences in bilingual language acquisition in Indian context as compared to the
4
West. Language proficiency has emerged as a useful measure of bilingualism in recent past and it
refers to the degree to which an individual exhibits control over the rules of a language (i.e. levels
of language-phonology, semantics, syntax, pragmatics, metalinguistic knowledge). In the past,
there have been many studies which take into account different skills as a measure of language
proficiency, including confrontation naming, read aloud task (Oyama, 1976) grammaticality
judgment task (Johnson & Newport, 1989), verbal fluency, category generation task, oral
comprehension task (Bahrick, Hall, Goggin, Bahrick & Berger 1994) and self rated questionnaire
(Coppieters, 1987; Marian, Blumenfeld, & Kaushanskaya, 2007). Grosjean (1998) suggested
certain requirements as necessary while profiling bilinguals, which include language history and
language relationship, language stability, function/use of languages, language proficiency and
language modes. Bialystok (2001) pointed out that questions such as the nature of language
proficiency, its components, norms for language competence and the range of variation across
language skills have rarely been explicitly addressed by researchers. Such studies are certainly
needed in the Indian context and only recently such systematic efforts have been initiated to
understand bilingualism. One such study with Telegu-English bilinguals showed that language
exposure has a significant effect on language skills such as vowel consonant contrast
discrimination. The present study is one of the very few attempts in Indian context (Venkatesh &
Vasanta, 2010 as cited in Vasanta, 2011).
Language proficiency measures used in the non English speaking countries in the West
have been developed for English as L2 (or L1). Similar tools are not available for most of the
Indian languages. Even the tools developed and standardized for English language in the West
would not be applicable for Indian population as the acquisition, frequency of use, pattern of
5
use, nature of exposure, and the contexts in which the language is used varies in Indian context.
Exposure to English is mostly in terms of passive listening during the initial years in school and
gradually picks up as a spoken language. In contrast, L2 (English) can also be actively learnt and
used which can result in differences in language processing abilities. In the current study we
have employed both subjective (i.e. self report) and objective performance on language skills
tests to understand the organization of language skills. It is not only the variability in the
organisation of language skills in L2 but also in L1 that may influence bilingual language
processing. Moreover, language proficiency in bilingual research is frequently quantified with
the help of questionnaires, interview schedules as well as language tasks that tap naming skills/
fluency/ grammatical skills thus making such measures either highly subjective or open to
response bias or biased towards a particular language skill. One such questionnaire seeking
participants‟ self-reports of their language history across domains, provide information about the
nature of multilingualism in India (Vasanta, Suvarna, Sireesha, & Raju, 2010). Profiling a
bilingual individual can be adapted to a more comprehensive assessment of language proficiency
rather than relying on self reported information. Most of the studies have predominantly focused
on L2 proficiency and not much importance has been given to L1 proficiency. The assessment
tools that have been employed are based on the literature in the West and not based on any
objective data on the nature of bilingualism in Indian context. Hence, we examined both L1 and
L2 proficiencies to lay out the factor structure of L1 and L2 among Hindi-English bilingual
adults and its correspondence with self reported language history. It is important for participant
selection in bilingual research, to measure the differences in proficiency levels among bilinguals
as well as to understand the effect of proficiency based predictors on bilingual language
6
processing. In addition, L1 and L2 proficiency may influence each other particularly in the
context of such language combinations where L1 is acquired informally and L2 is primarily
learnt through formal instruction. The order of acquisition of language skills across the domains
of spoken/understanding and reading/writing is also different for both. For instance
spoken/understanding skills in L1 (Hindi) may be acquired first and reading writing skills may
be acquired later with formal schooling. On the other hand, L2 acquisition may begin with
literacy skills first with formal schooling and spoken/understanding skills may develop much
later and would mostly be associated with literacy skills.
Primitive bilingual research started with bilingualism as a consequence (Saer, 1923,
Darcy, 1946, cited in Bialystok, 2001). Since last 30 years, bilingual advantage over
monolinguals in various cognitive abilities has been appreciated (Ben- Zeev, 1977; Bialystok,
2012; Bialystok & Feng, 2009; Costa, Hernander & Sabastia-Galle, 2008; Peal & Lambert, 1962
as cited in Bialystok, 1997;; Siegal, Lozzi & Lurian, 2009;). From a methodological point of view
comparison groups have changed from time to time depending on the focus of the study. Many
recent studies in the field of cognitive science continue to compare monolinguals and bilinguals
(Bialystok & Feng, 2009; Costa, Hernander & Sabastia-Galle, 2008; Siegal, Iozzi & Lurian,
2009;). Hakuta and Suben (1985) in the past, highlighted the work by Ducan and De Avila (1979)
suggesting that comparison of sub groups within the samples of bilinguals could act as a valid
method of control in an experiment. Most of the work stated here has predominantly considered
bilinguals from two extreme populations varying with respect to a particular aspect (age of
acquisition: early vs. late, proficiency: balanced vs. unbalanced/ high vs. low proficient; or based
on use: i.e. to consider them as dominant bilinguals). Clinical research also requires information on
7
level of bilingualism and language status to provide sound base for assessment and rehabilitation of
various communication disorders.
To sum up, we aimed to analyze the relationship between objective measure of L1 and L2
language proficiency within and across language skills. Since, subjective measures provide
biased self reported information, justifying subjective information with some form of objective
measures could certainly strengthen the way bilingualism is considered in a particular study.
Independence as well as interdependence of language skills between L1 and L2 was expected in
case of Hindi and English, though the two languages follow different modes of acquisition. It is
expected that language proficiency would emerge as an important and a continuous rather than a
discrete measure of bilingualism.
Method
This study aimed to explore the nature of language proficiency in L1 (Hindi) and L2 (English)
through the use of modified version of Language Background Questionnaire (Vasanta, Suvarna,
Sireesha, & Bapi Raju, 2010) and indigenously developed test of language proficiency.
Organization of language skills across domains for Hindi and English was also examined.
Participants
Eighty-five Hindi-English Bilingual adults participated in the study (M=20.84 years,
range: 18 - 26 years; 52 males and 33 females). Only those participants were selected who had
completed a preliminary screening which indicated that their L1 was Hindi and L2 was English,
8
which was used on day to day basis and they had at least 7 years of basic education in both the
languages with no significant history of sensory, motor or neurological disorders. Participants
included student volunteers from Allahabad University and neighbouring Institutions.
Material
Language Background Questionnaire (Vasanta, Suvarna, Sireesha, & Bapi Raju, 2010) was
employed to collect information about the languages in use, frequency of use; self reported
proficiency, linguistic environment at home, work etc. Domains assessed in the questionnaire
include acquisition history (age of acquisition and at what age they became fluent), contexts of
acquisition (modality: oral/written/both; environment of acquisition: informal/formal/both),
precent language use (%), language preference (1-3 rating scale; where 1= never, 2= sometimes,
3=most of the time) and proficiency rating (0-10 rating scale). Apart from these questions
contribution of various other factors such as use of language with family, friends, extended
family, and neighbours were assessed by asking the participants to name the language
predominantly used and hours of usage (per day). Participants also indicated the medium of
instruction and self reported proficiency level in different domains (1-5 point rating).
An indigenous Test of Language proficiency in Hindi and English was employed to examine
language proficiency in Hindi and English. Proficiency in all domains of language function (i.e.
speaking, understanding, reading and writing) was examined.
9
Speaking/ Understanding domain
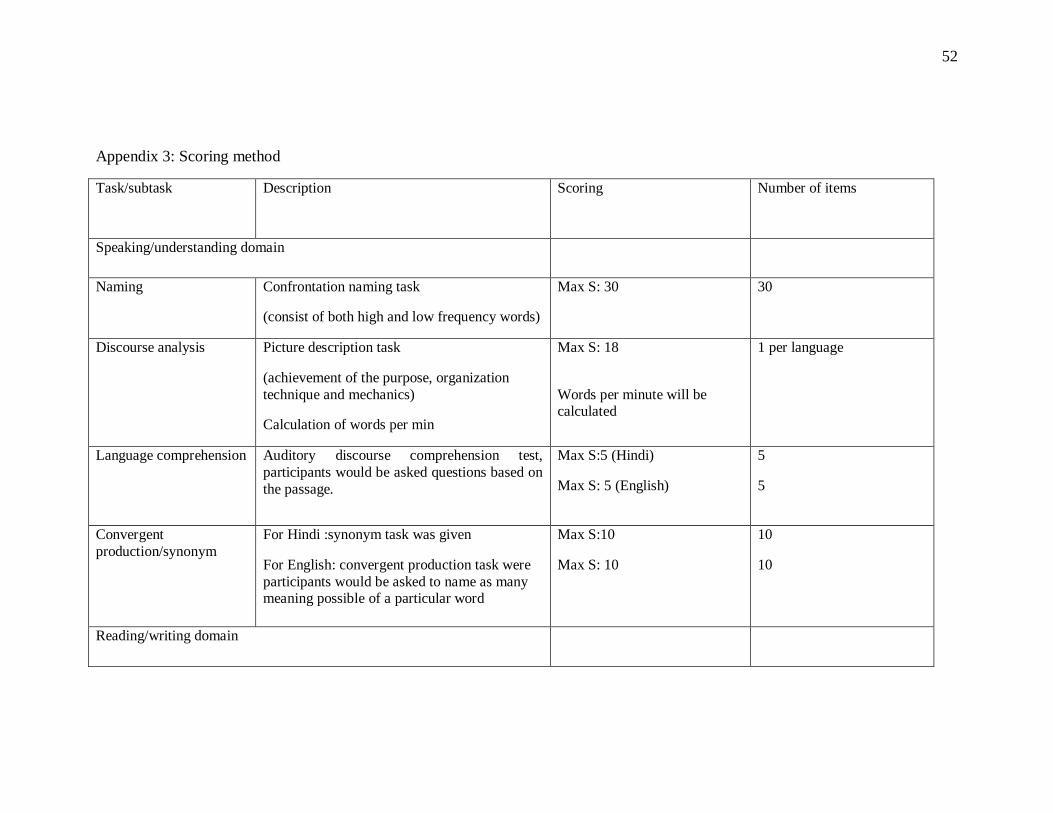
The goal of the tasks under this domain is to tap the crucial aspects of bilingual language
proficiency, in terms of speaking and understanding skills which indicates oral and aural
proficiency. Hindi and English versions were matched with respect to kind of task, number of
items as well as the scoring method. Appendix 1 presents the scoring process.
Confrontation Naming Task: In this task participants were provided with 30 pictures
consisting of high as well as low frequency nouns and were asked to name them. Pictures
used for confrontation naming were taken from IPNP (Abbate & LaChappelle, 1984),
developed by the UCSD.
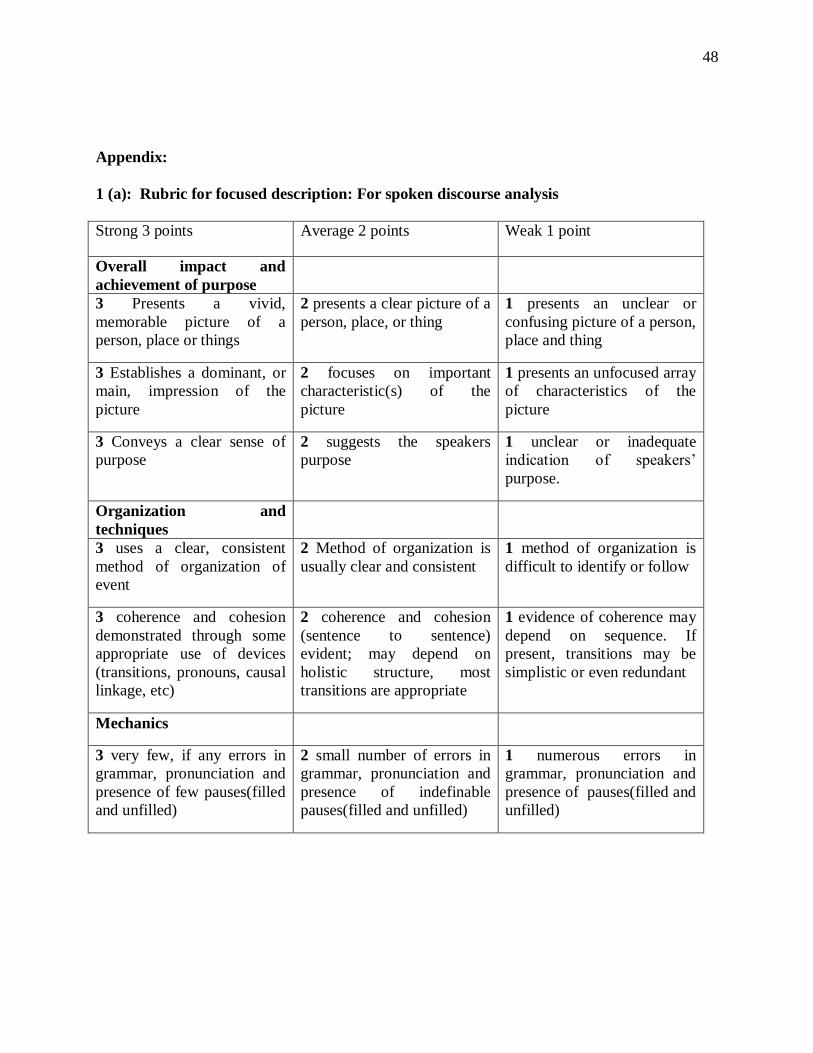
Spoken discourse task: In this task participants were instructed to describe a picture
carefully by focusing on the overall theme of the picture along with individual items in
that particular picture. A grand rubric score (Appendix 1a) is calculated by summing the
scores on the following aspects: overall impact and achievement of purpose (whether the
participant establishes main idea), organization and techniques (coherence and cohesion
with test, method of organization) and mechanics (focusing on grammar, pronunciation,
presence of pause). Pictures were selected from Boston Diagnostic Aphasia Examination
(Goodglass & Kaplan, 1983) and Western Aphasia Battery (Kertesz, 1987) for English
and Hindi respectively.
Auditory comprehension task: This task was chosen to assess participants‟ ability to
understand the content aurally. To assess, 5 questions were asked related to the passage
and the questions were formulated based on main idea of the passage, cause and effect
10
relationship and inference generated. Passages were selected from
www.en.wikipedia.org/wiki/2010_Commonwealth_Games and „Test of language
proficiency: Hindi‟ (Subbiah, 2005) for English and Hindi respectively.
Convergent production task/synonym task: This was the only section which had 2
different tasks for both Hindi and English versions with similar scoring process. The
English convergent production task required the participants to name as many words with
different meanings possible for a particular word (Thorum, 1986). E.g. By*/ bye/buy
have three different meanings. Hindi counterpart for this task was the synonym task
where the participants were asked to provide synonyms (at least 3) of a given word
(Subbiah, 2005). Though convergent production and synonym tasks are not the same yet
both demonstrate one‟s knowledge for word meaning.
Reading/ Writing domain
Reading comprehension task: This task assessed the ability of the participants to read and
understand what is stated or implied in a written passage, and then to answer questions
based on it. Each passage contains 159 and 208 words respectively in Hindi and English
(Shipley & McAfee, 2008; Pon Subbiah, 2005) which was followed by 5 questions. The
questions were formulated to tap the main idea of the passage, cause and effect
relationship and inference generated in the passage.
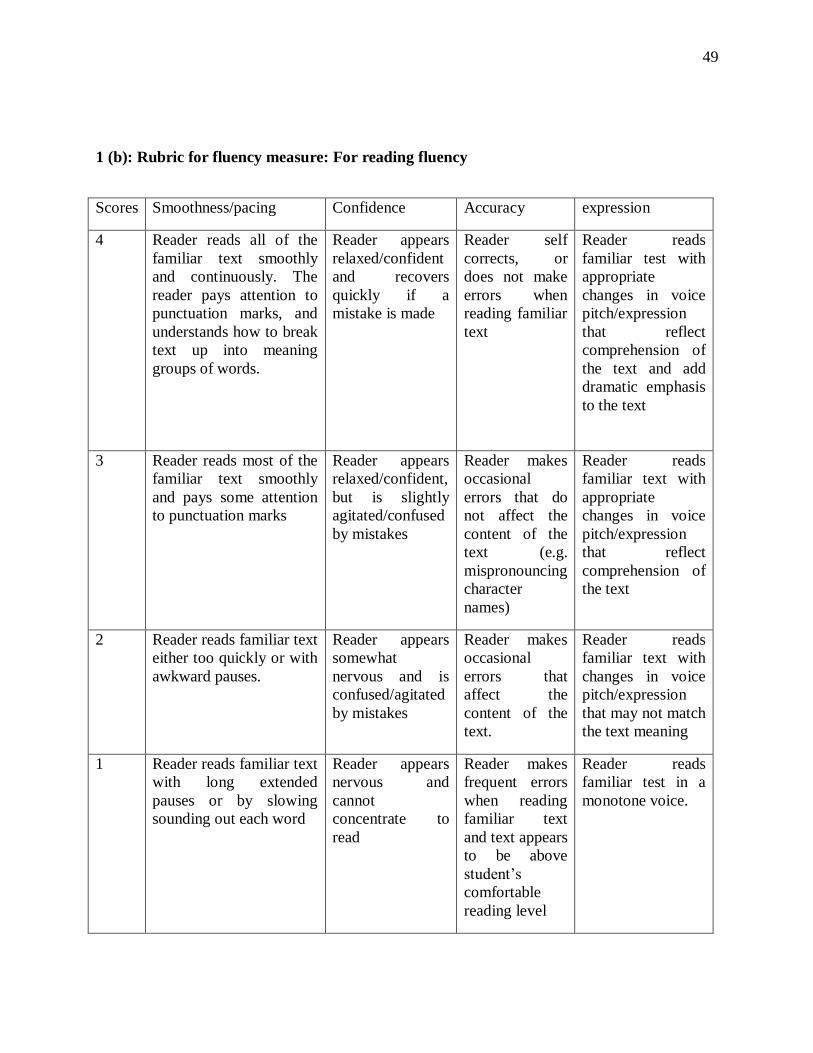
Reading fluency: The passage read in the previous task was used to assess reading
fluency by using the Fluency Rubric (Zutell & Rasinski, 1991). A grand rubric score was
calculated by summing-up the scores on the following aspects: smoothness and pacing
11
(punctuations and break), confidence, accuracy (with respect to pronunciation) and
expression (with respect to change in voice with content). (Appendix 1b supplementary
material)
Phonological awareness skills: Participants were asked to perform simple meta-linguistic
tasks at phonemic and syllabic levels. The tasks involved segmentation, blending,
rhyming and counting of sounds. In the segmentation task, participants were given a
word and were asked to segment into sounds and syllables. In the blending task
experimenter provided the sounds or syllables and participants were required to blend
them and form a word. In the counting task, participants were asked to count the sounds
and letters in the word. Number of letters and sounds could be different for English
whereas both were same for Hindi. Participants were given examples and practice with 1-
2 words before administering the task.
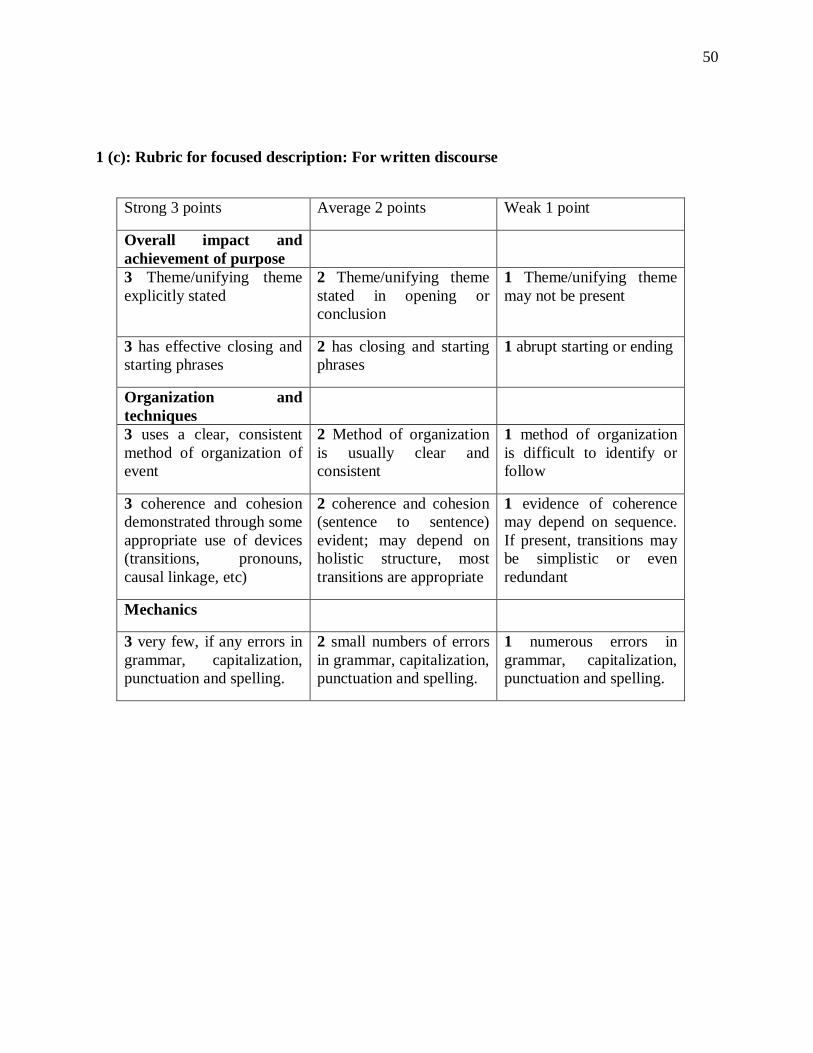
Written Discourse analysis: In this task participants were asked to write about a given
procedure. The participants were clearly instructed to write a paragraph with a good
beginning and end. A grand rubric score (appendix 1c) was calculated by summing the
scores on the following aspects: overall impact and achievement of purpose (whether the
participant establishes main idea), organization and techniques (coherence and cohesion
with test, method of organization) and mechanics (focusing on grammar, spelling
mistake).
Scoring method for each task is presented in Appendix 3.
12
Administration of the language background questionnaire and test of language
proficiency was completed in a quiet testing room. Order of administration was counterbalanced
across participants with respect to Hindi and English languages. Recording was done for the
discourse and reading sample. Total scores were calculated for the speaking and understanding
domain including spoken discourse score, confrontation naming score, convergent production
and auditory language comprehension score. Similarly total reading and writing score consisted
of reading comprehension, reading fluency score, phonological awareness score and written
discourse score.
Results
The present study aimed to characterize language proficiency in Hindi (L1) and English (L2)
language and to determine the correspondence between subjective and objective measures of
language skills. A modified version of Language Background Questionnaire (Vasanta et al 2010)
and indigenously developed Test of language proficiency were administered on H-E bilinguals.
Correlation and regression analysis were performed within and across languages as well as
between subjective (self report) and objective measures. Factor analysis was performed to
establish the factorial validity for the language proficiency test as well as to find out how
different tasks were correlated with each other within and across languages. Cronbach‟s alpha
was calculated as a measure of the reliability of the language proficiency test. Q-Q plots were
generated as a measure of normality in the language skills.
Language Background in L1 and L2
13
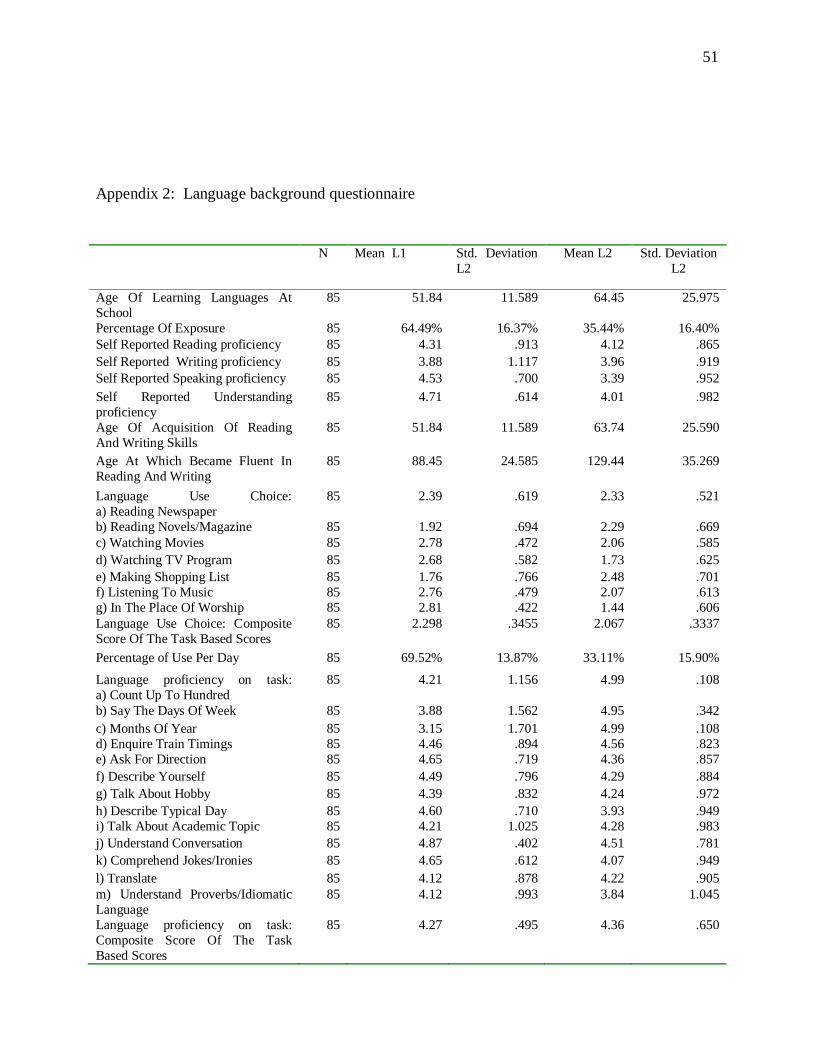
Information based on language background questionnaire was categorized as: a) age
related information which consisted of age of acquisition in school and age of fluency in reading
and writing skills; b) language use related information included task based scores, percentage of
exposure and use of a particular language; c) self reported proficiency ratings in reading, writing,
speaking and understanding skills. Descriptive analysis (means and standard deviations) based
on the questionnaire is presented in Appendix: 2.
Data based on language background information suggested that exposure to Hindi at
home was since birth, whereas English was predominantly introduced during the school years.
Participants reported predominant use of L1 in their day to day life (Mean (L1) = 69.52% Mean
(L2) = 33.11%). Age of learning L2 in school varied from 4 to 11 years (Mean (L1) = 4.32 years;
Mean (L2) =5.37 years). Variance among participants was more for both L1 and L2 while
reporting the age at which they became fluent in a particular language (Mean (L1) = 7.37 years
and (L2) = 10.78 years).
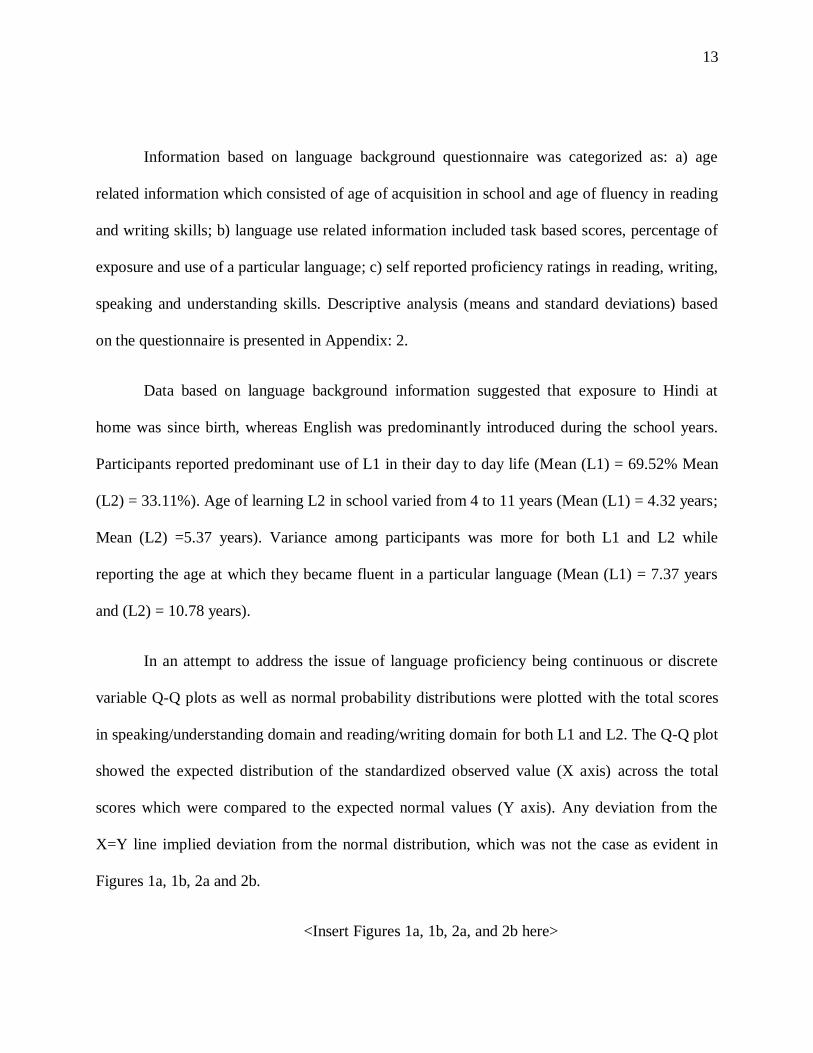
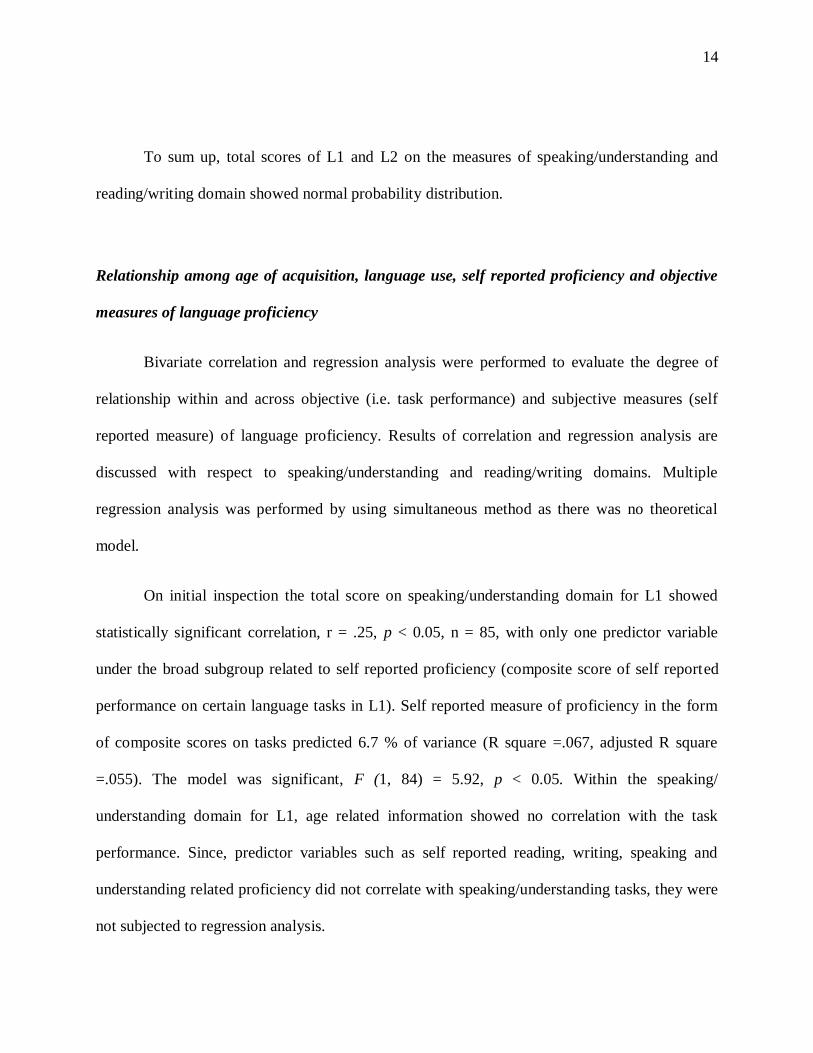
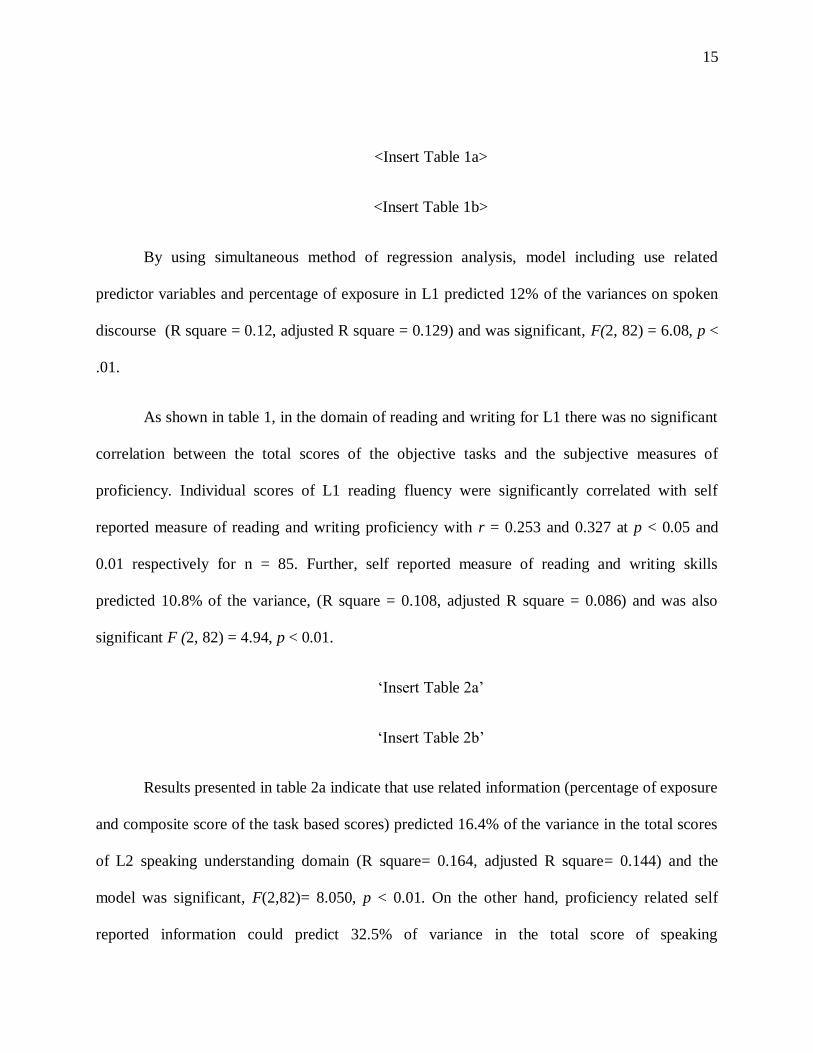
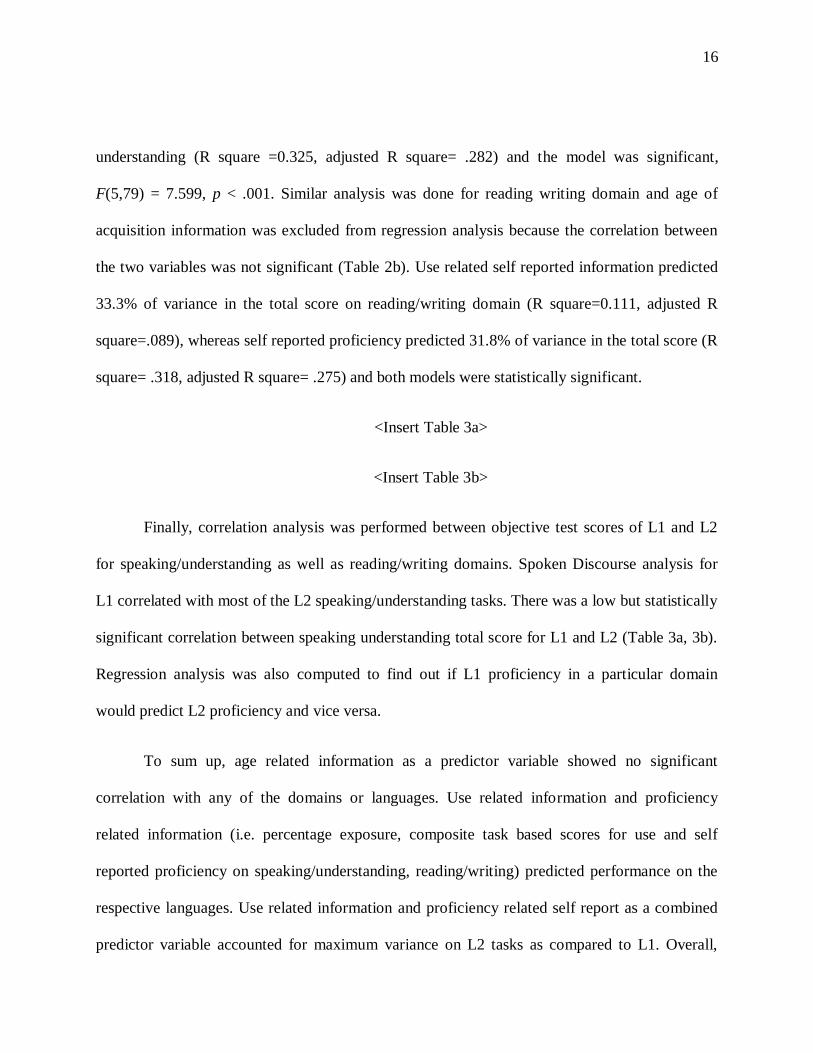
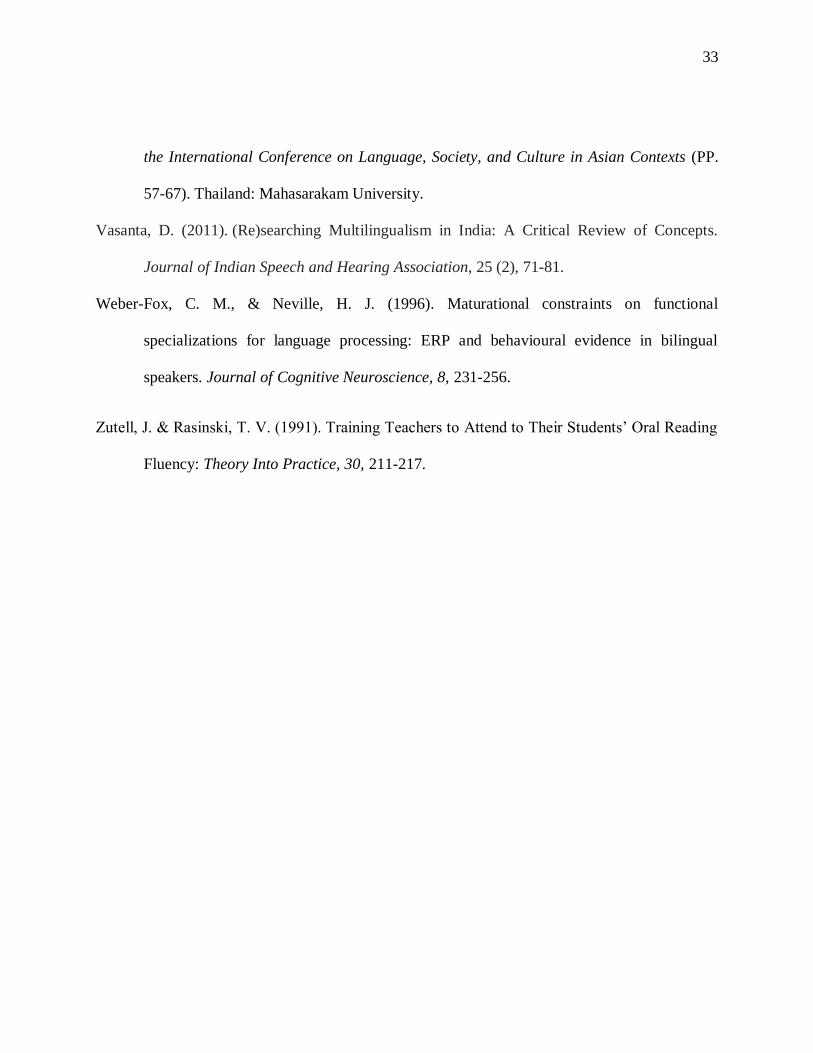
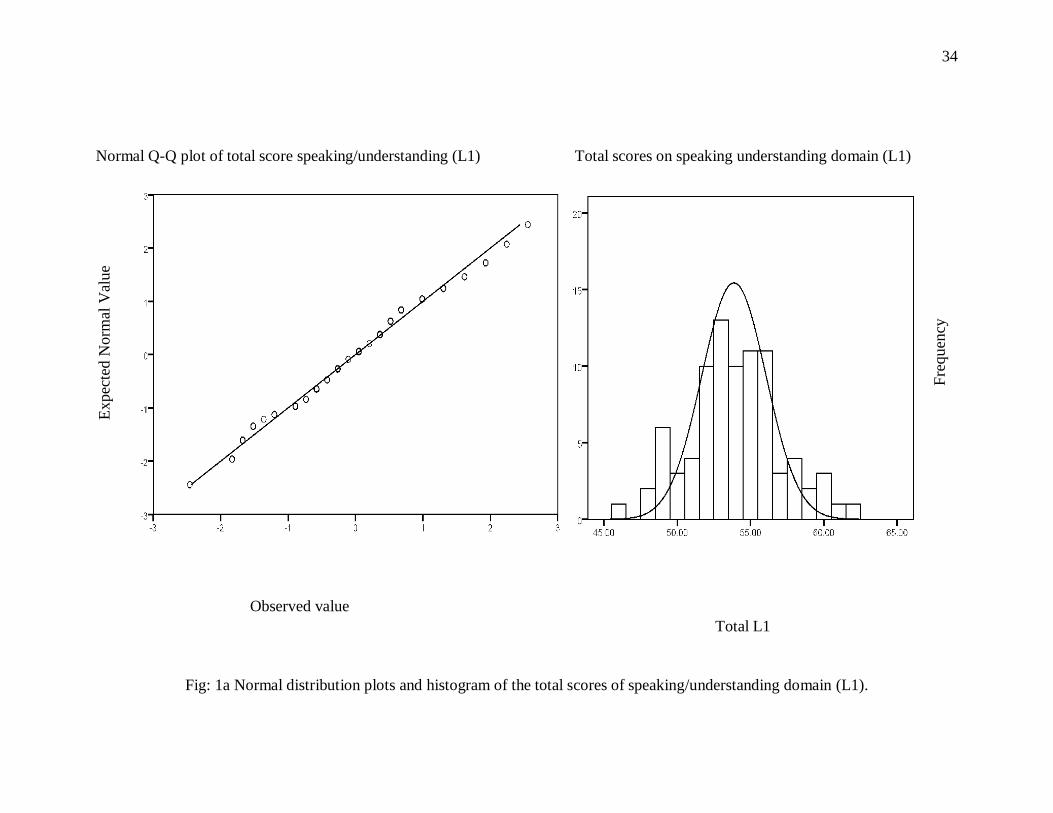
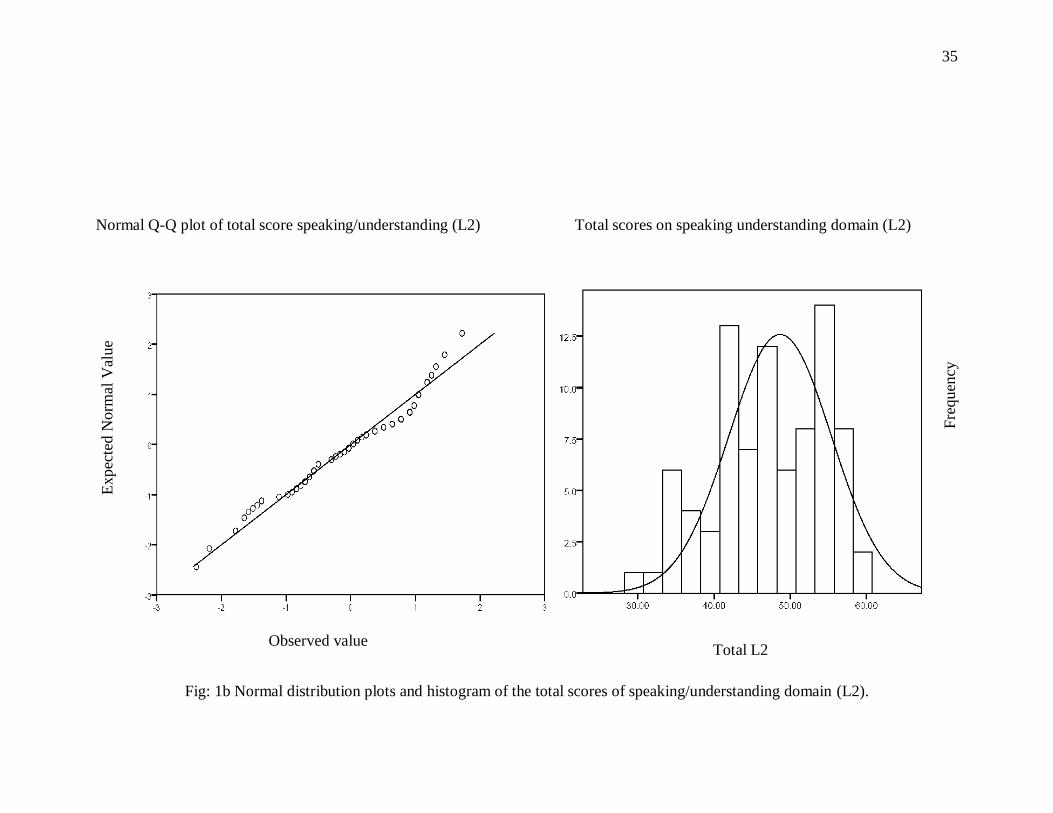
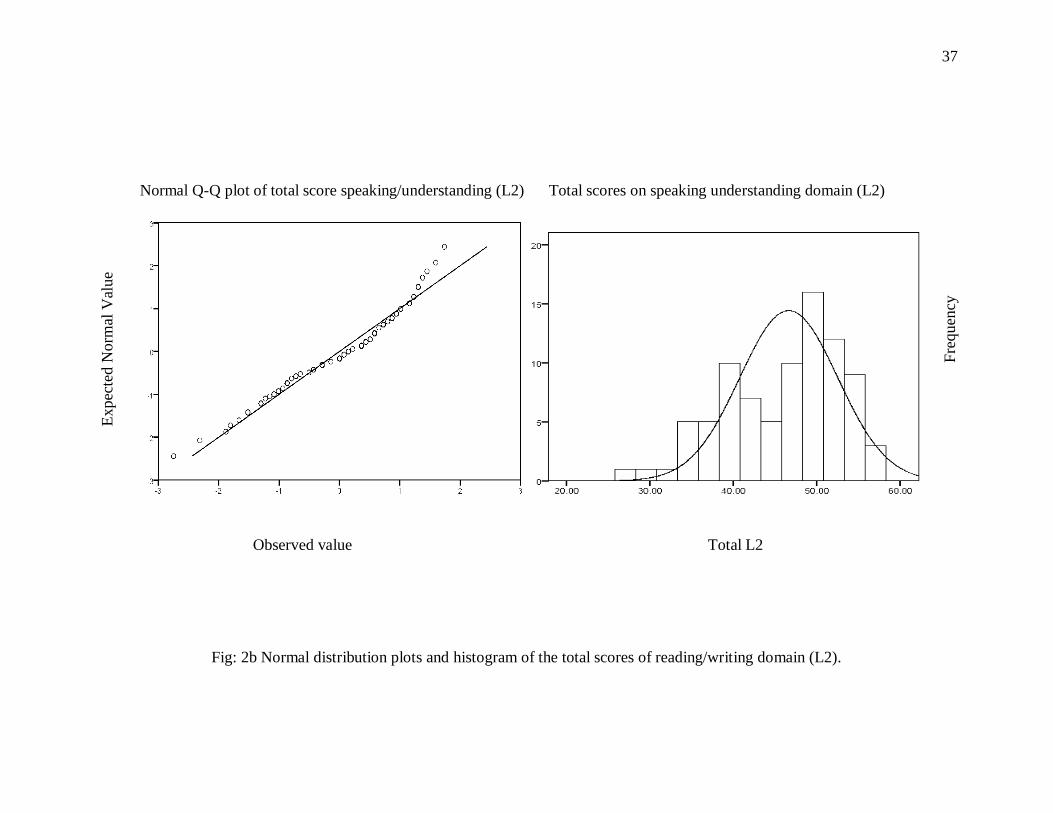
In an attempt to address the issue of language proficiency being continuous or discrete
variable Q-Q plots as well as normal probability distributions were plotted with the total scores
in speaking/understanding domain and reading/writing domain for both L1 and L2. The Q-Q plot
showed the expected distribution of the standardized observed value (X axis) across the total
scores which were compared to the expected normal values (Y axis). Any deviation from the
X=Y line implied deviation from the normal distribution, which was not the case as evident in
Figures 1a, 1b, 2a and 2b.
<Insert Figures 1a, 1b, 2a, and 2b here>
14
To sum up, total scores of L1 and L2 on the measures of speaking/understanding and
reading/writing domain showed normal probability distribution.
Relationship among age of acquisition, language use, self reported proficiency and objective
measures of language proficiency
Bivariate correlation and regression analysis were performed to evaluate the degree of
relationship within and across objective (i.e. task performance) and subjective measures (self
reported measure) of language proficiency. Results of correlation and regression analysis are
discussed with respect to speaking/understanding and reading/writing domains. Multiple
regression analysis was performed by using simultaneous method as there was no theoretical
model.
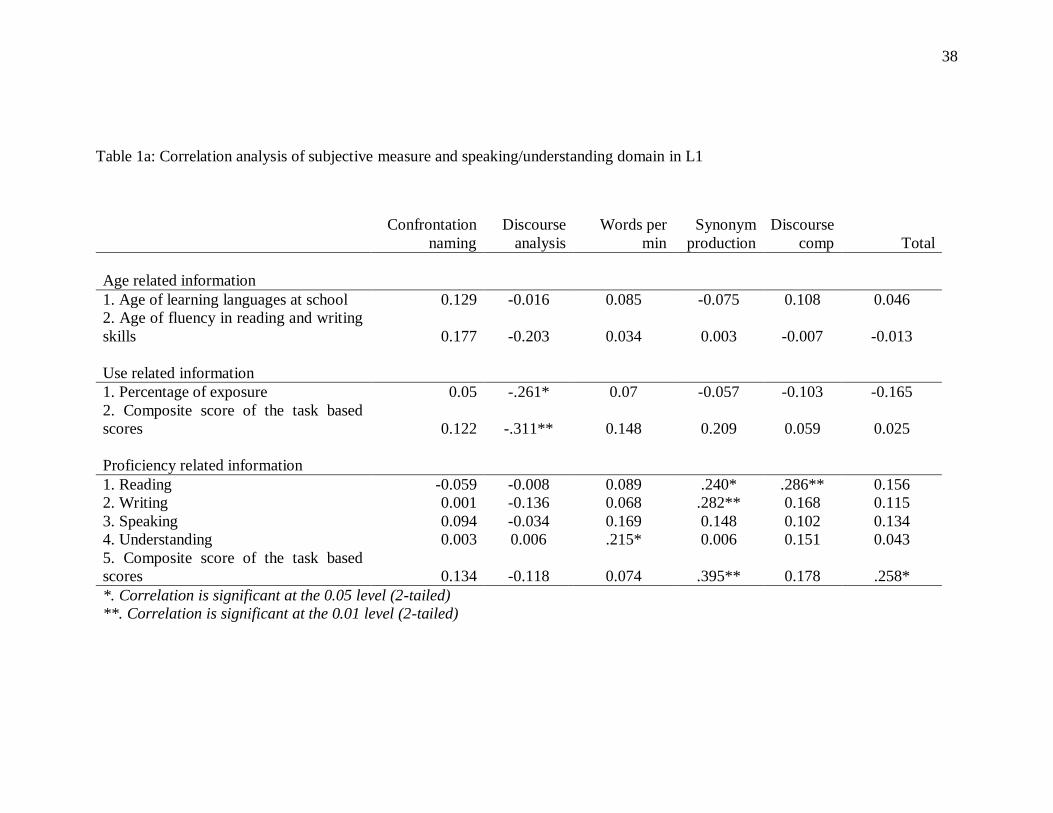
On initial inspection the total score on speaking/understanding domain for L1 showed
statistically significant correlation, r = .25, p < 0.05, n = 85, with only one predictor variable
under the broad subgroup related to self reported proficiency (composite score of self reported
performance on certain language tasks in L1). Self reported measure of proficiency in the form
of composite scores on tasks predicted 6.7 % of variance (R square =.067, adjusted R square
=.055). The model was significant, F (1, 84) = 5.92, p < 0.05. Within the speaking/
understanding domain for L1, age related information showed no correlation with the task
performance. Since, predictor variables such as self reported reading, writing, speaking and
understanding related proficiency did not correlate with speaking/understanding tasks, they were
not subjected to regression analysis.
15
<Insert Table 1a>
<Insert Table 1b>
By using simultaneous method of regression analysis, model including use related
predictor variables and percentage of exposure in L1 predicted 12% of the variances on spoken
discourse (R square = 0.12, adjusted R square = 0.129) and was significant, F(2, 82) = 6.08, p <
.01.
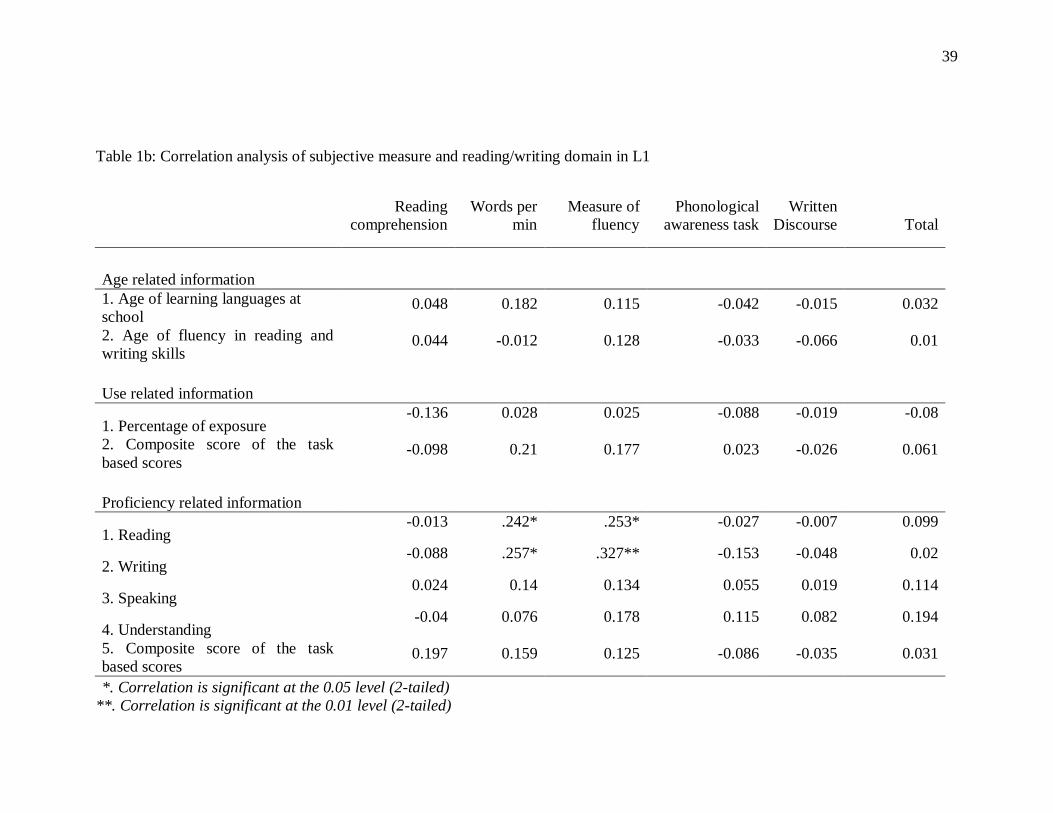
As shown in table 1, in the domain of reading and writing for L1 there was no significant
correlation between the total scores of the objective tasks and the subjective measures of
proficiency. Individual scores of L1 reading fluency were significantly correlated with self
reported measure of reading and writing proficiency with r = 0.253 and 0.327 at p < 0.05 and
0.01 respectively for n = 85. Further, self reported measure of reading and writing skills
predicted 10.8% of the variance, (R square = 0.108, adjusted R square = 0.086) and was also
significant F (2, 82) = 4.94, p < 0.01.
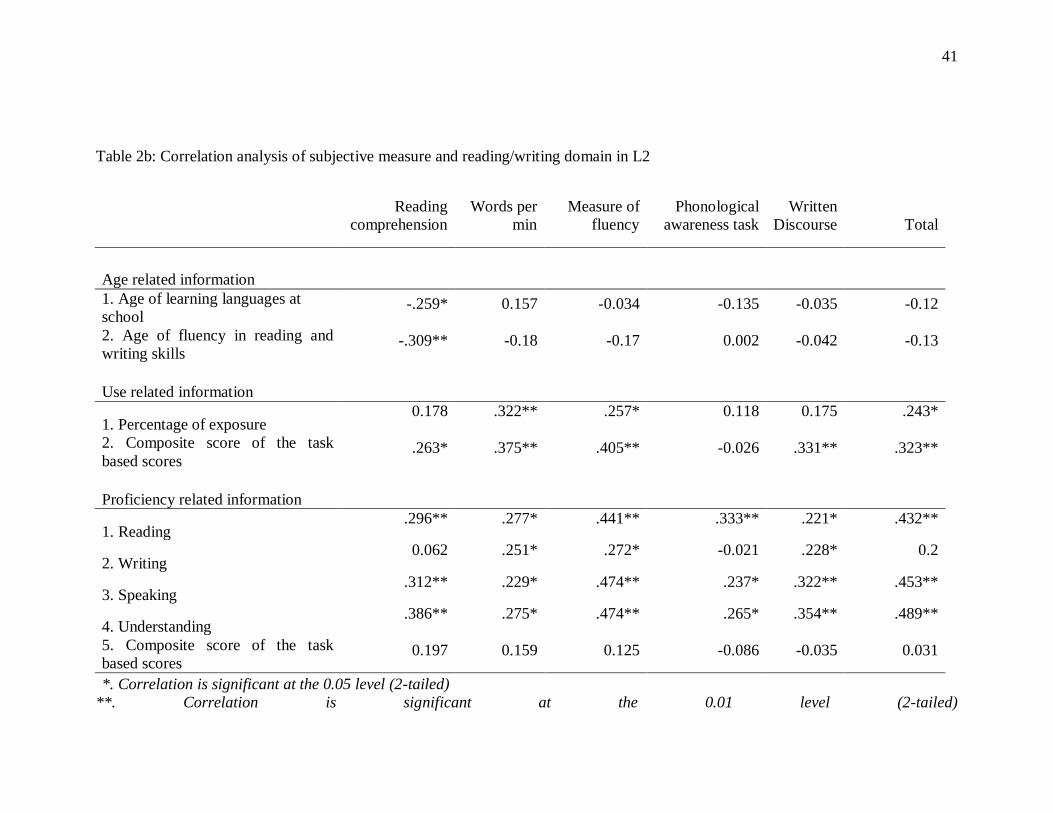
„Insert Table 2a‟
„Insert Table 2b‟
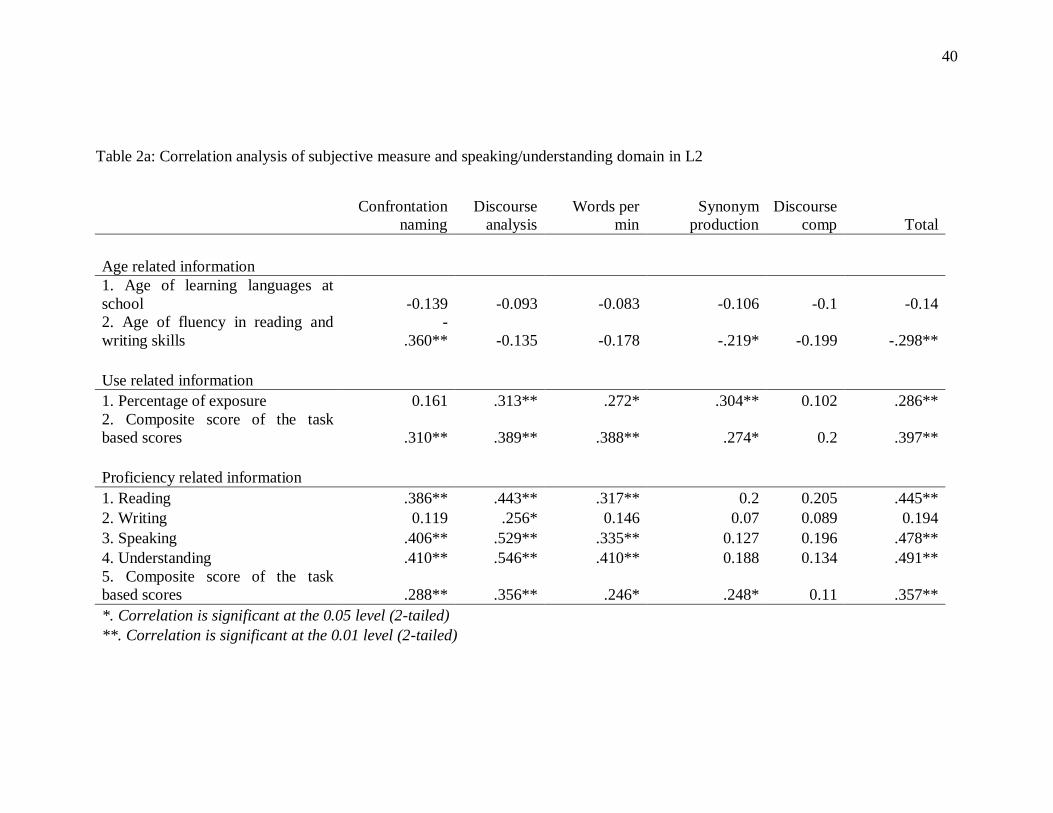
Results presented in table 2a indicate that use related information (percentage of exposure
and composite score of the task based scores) predicted 16.4% of the variance in the total scores
of L2 speaking understanding domain (R square= 0.164, adjusted R square= 0.144) and the
model was significant, F(2,82)= 8.050, p < 0.01. On the other hand, proficiency related self
reported information could predict 32.5% of variance in the total score of speaking
16
understanding (R square =0.325, adjusted R square= .282) and the model was significant,
F(5,79) = 7.599, p < .001. Similar analysis was done for reading writing domain and age of
acquisition information was excluded from regression analysis because the correlation between
the two variables was not significant (Table 2b). Use related self reported information predicted
33.3% of variance in the total score on reading/writing domain (R square=0.111, adjusted R
square=.089), whereas self reported proficiency predicted 31.8% of variance in the total score (R
square= .318, adjusted R square= .275) and both models were statistically significant.
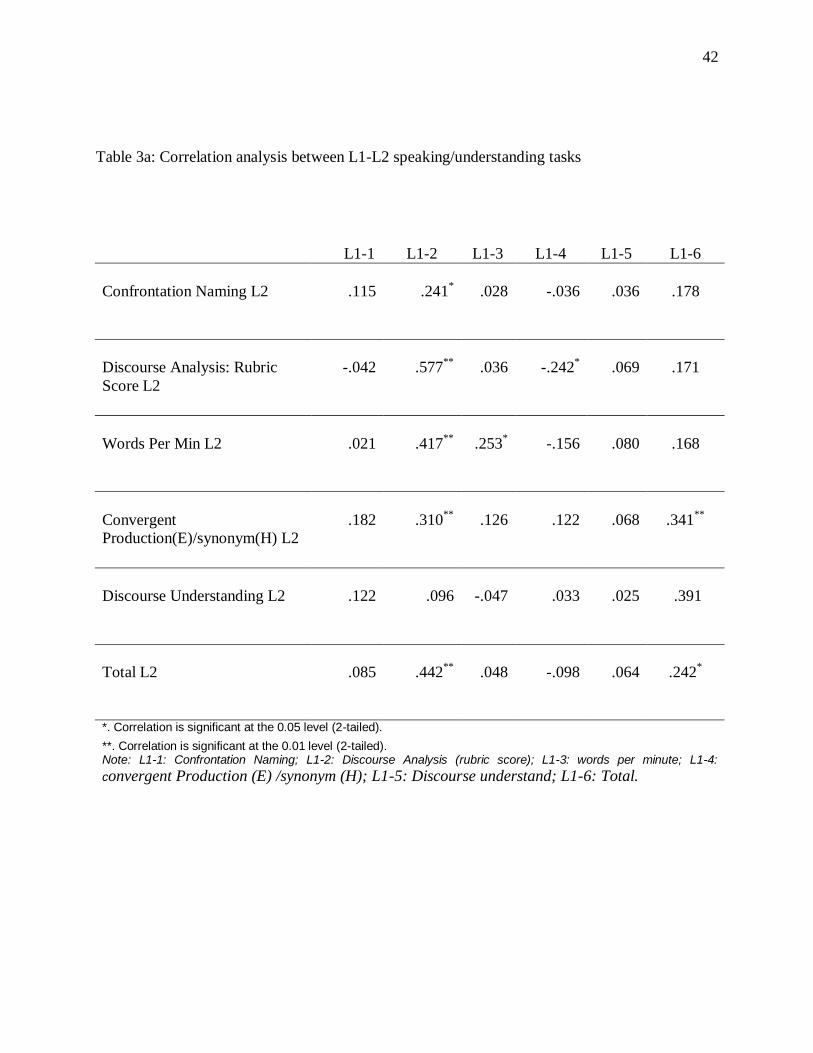
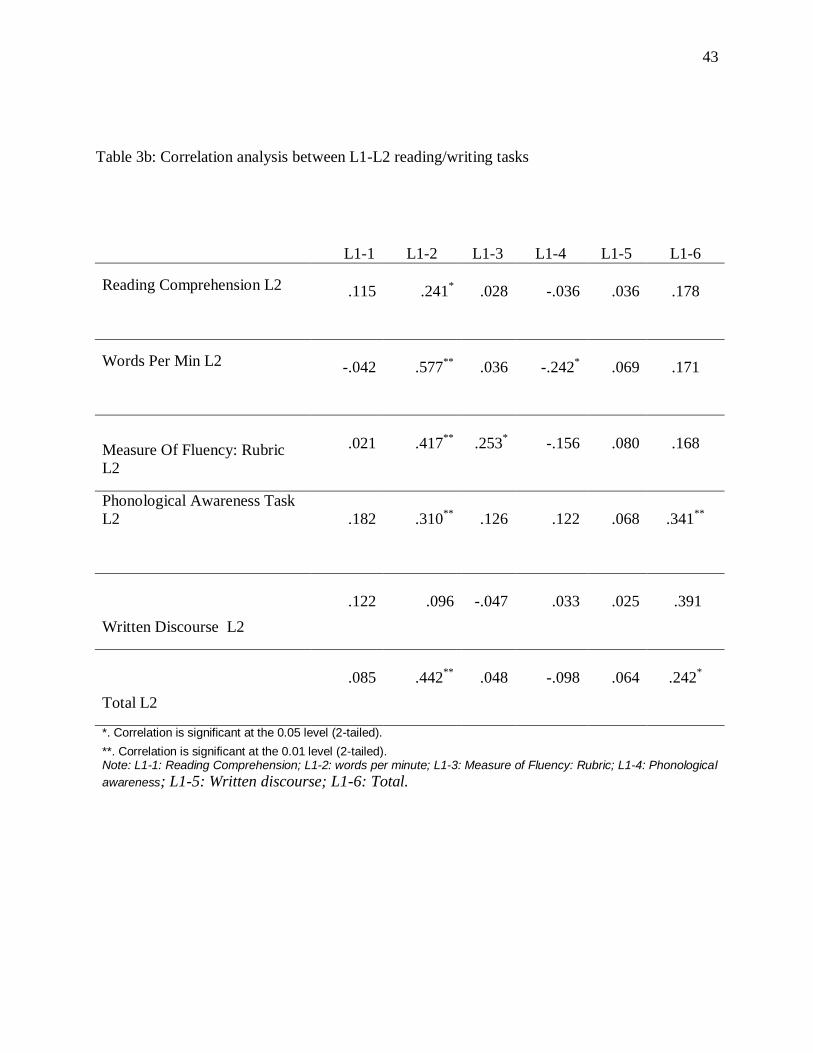
<Insert Table 3a>
<Insert Table 3b>
Finally, correlation analysis was performed between objective test scores of L1 and L2
for speaking/understanding as well as reading/writing domains. Spoken Discourse analysis for
L1 correlated with most of the L2 speaking/understanding tasks. There was a low but statistically
significant correlation between speaking understanding total score for L1 and L2 (Table 3a, 3b).
Regression analysis was also computed to find out if L1 proficiency in a particular domain
would predict L2 proficiency and vice versa.
To sum up, age related information as a predictor variable showed no significant
correlation with any of the domains or languages. Use related information and proficiency
related information (i.e. percentage exposure, composite task based scores for use and self
reported proficiency on speaking/understanding, reading/writing) predicted performance on the
respective languages. Use related information and proficiency related self report as a combined
predictor variable accounted for maximum variance on L2 tasks as compared to L1. Overall,
17
scores on the tests of the reading/writing domain were able to account for the variance more
appropriately as compared to the tests of the speaking/understanding domain.
Factor analysis across sub skills in L1 and L2
Factor analysis was performed to learn if the observed variables can be explained largely
or entirely in terms of factors which are a cluster of two or more individual variables by using
principle component analysis as extraction method. It would inform about the organization of
language skills and also whether the tasks across and within language domains as well as across
and within the two languages could be combined.
Within domain (i.e. speaking and understanding domain or reading and writing domain)
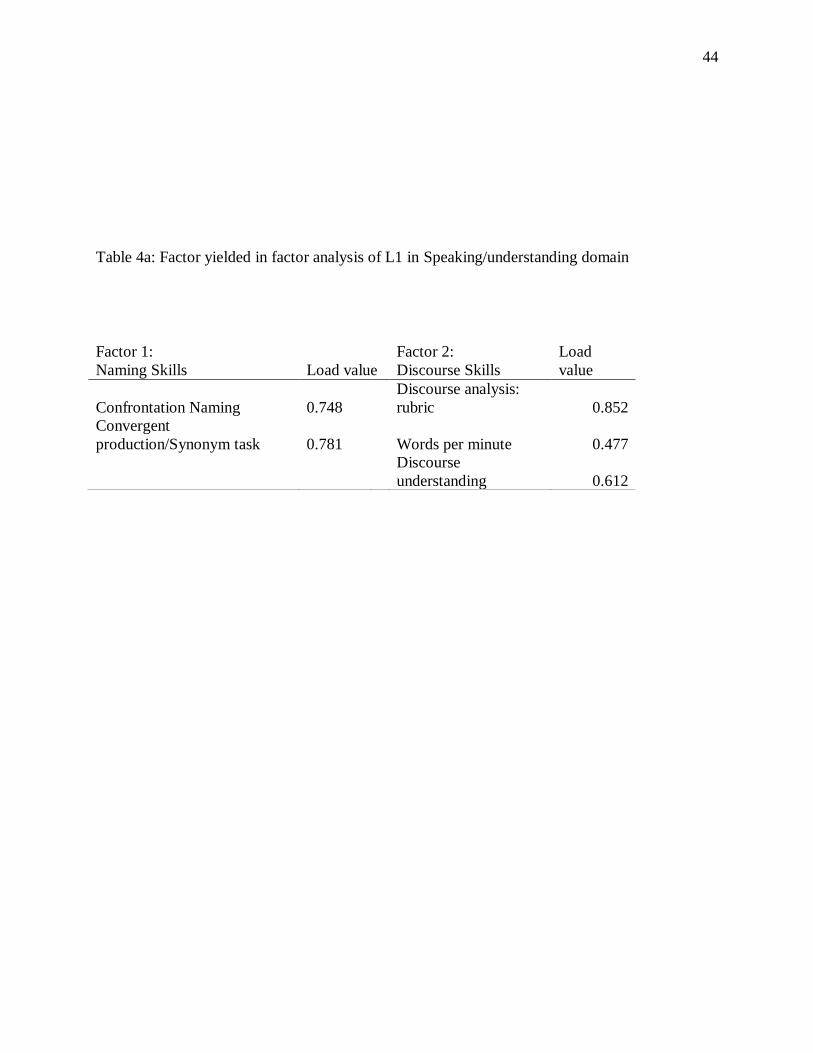
Under spoken-understanding domain for L1, 6 components were extracted from the data set by
means of factor analysis (Table 4a). Of these factors, the first 2 components had Eigen values
greater than 1 and accounted for 62.6 % of all variance. These components accounted for 33.04%
and 29.6% of variance respectively. Under the domain of speaking and understanding in L1,
tasks on oral and aural aspects of discourse were clustered under one factor and tasks on naming
skills (semantic aspects of language) clustered as the other. All the tasks under spoken-
understanding domain in L2 emerged as one component. Similar findings were also evident for
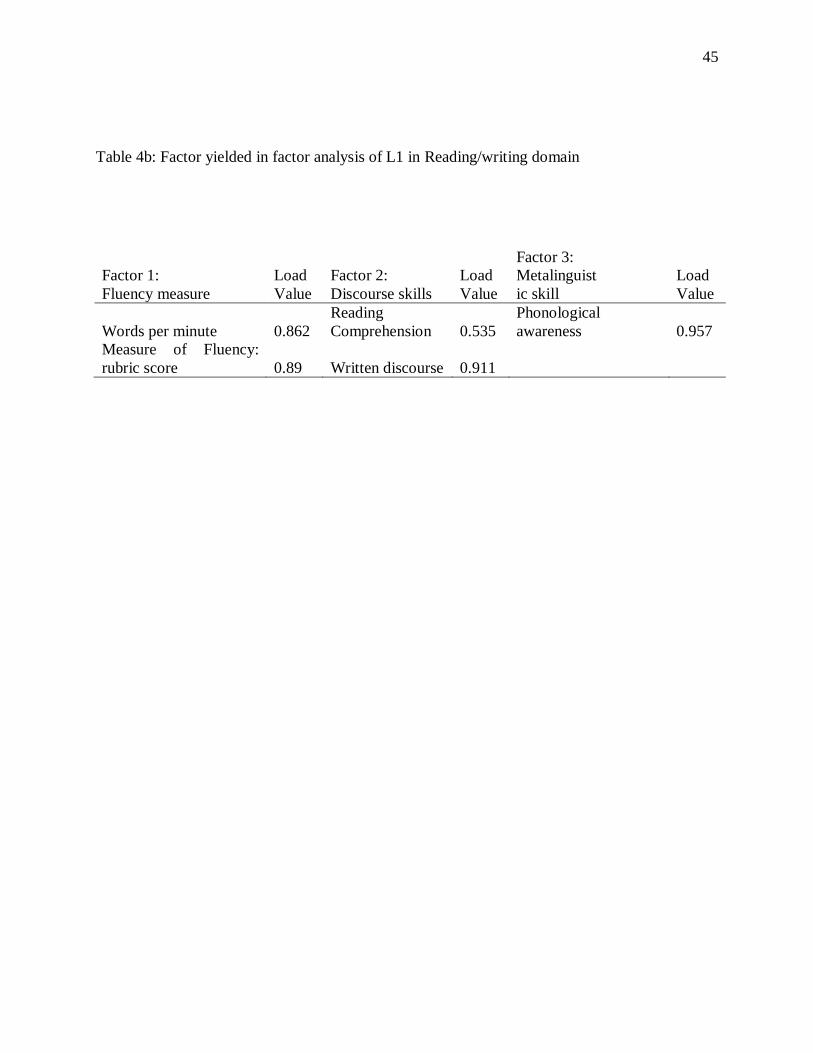
reading and writing domain, where L2 had one single component whereas factor analysis of L1
reading and writing tasks led to 3 components.
Out of the 6 initial components that were extracted, first 3 had Eigen values greater than
1 and accounted for 79.71% of variance. Table 4a presents all these components. 30.96%, 26.9%
18
and 21.76% were the respective variances of the 3 components for L1 reading and writing tasks.
Discourse tasks in reading writing domain also clustered together under one component. As the
phonological awareness task intends to measure the metalinguistic ability of the individual, its
presence as a separate component was probable. The within domain factor analysis of L1 showed
different components. Discourse skills (production and comprehension) and naming skills
(convergent production, confrontation naming) emerged as two components in
speaking/understanding domain. Discourse (reading and written discourse understanding),
reading fluency, speed and phonological awareness were separate components in the
reading/writing domain.
To sum up, L2 tasks clustered under one component for both speaking/ understanding
and reading/writing domains whereas L1 tasks showed clear distinction between different
language skills i.e. discourse skills, semantic skills (naming, convergent production), reading
skills (fluency and speed) and metalinguistic skills (phonological awareness).
<Insert Table 4a>
<Insert Table 4b>
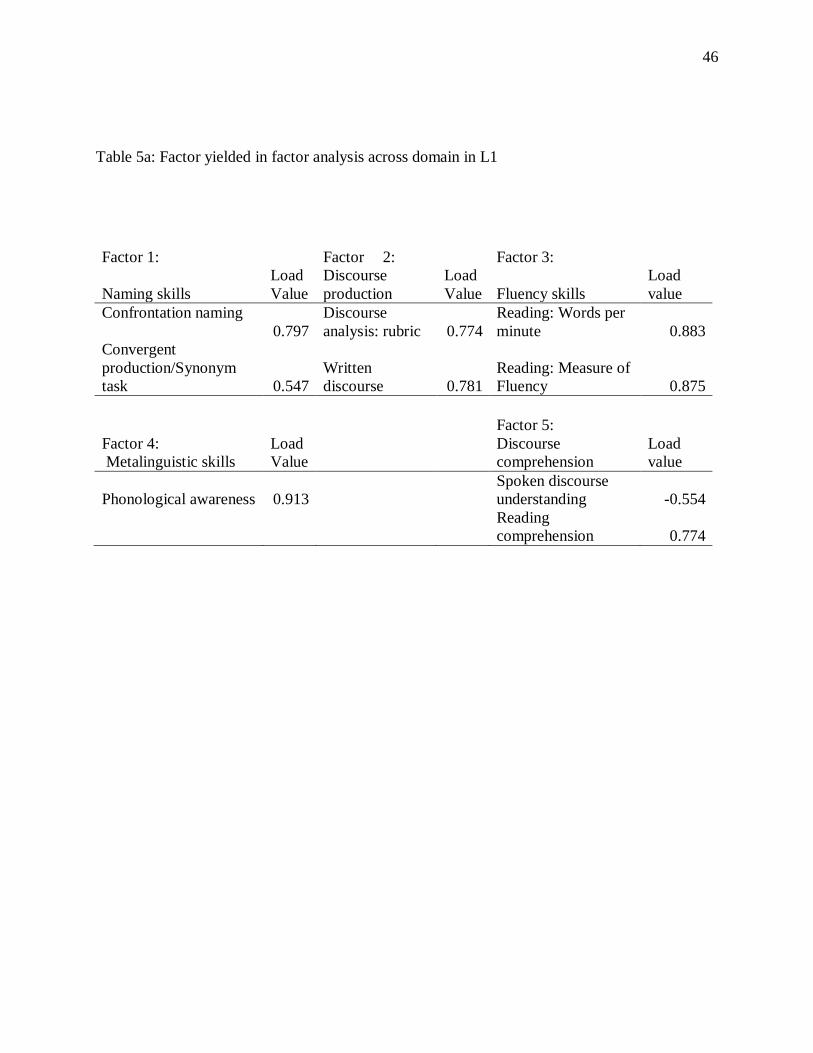
Across domains (speaking and understanding domain vs. reading and writing domain)
Twelve components were extracted from L1 data set. Of these factors, the first 5 components had
Eigen values greater than 1 and accounted for 74.71% of all variances. These 5 components were
assigned construct names indicative of characteristics and are listed in terms of variance in Table
5a. There was no segregation with respect to domains rather it was task specific for L1. L1
19
naming tasks were grouped under one component, whereas L1 discourse tasks were clustered
according to whether it was a production or an understanding task. Similarly, L1 showed more
scatter as compared to L2.
<Insert Table 5a>
<Insert Table 5b>
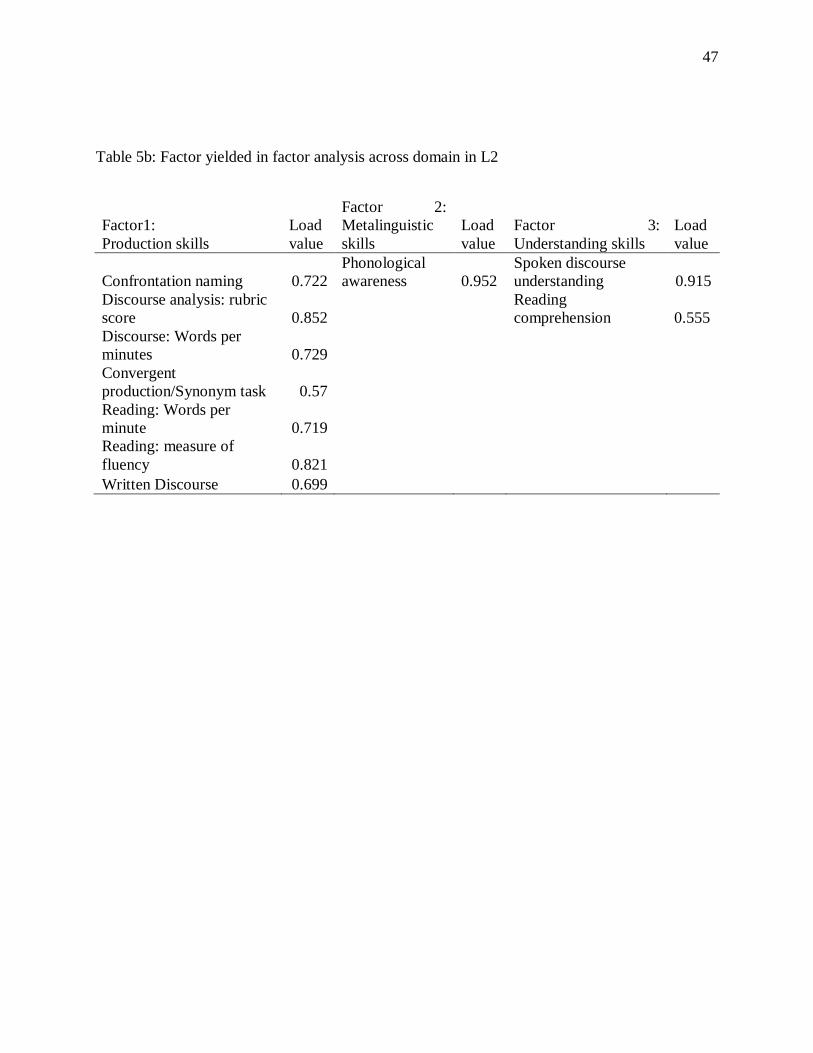
Tasks in L2 yielded 3 components. First component accounted for maximum of 43.41%
variance and included all the tasks of proficiency for L2 except for phonological awareness,
which was the only variable in 2nd
component explaining 14.88% of variance followed by the 3rd
component comprising of discourse understanding in both domains (Table 5b).
To sum up, for both the languages task specific grouping of variables was observed rather
than domain specific i.e. production tasks as one component and comprehension tasks as other.
Influence of L1 and L2 language skills on each other
In an attempt to find out the influence of both L1 and L2 on each other on the test of
language proficiency, regression analysis was conducted. On speaking understanding domain
total score of L2 was able to predict 21.2% of variance with respect to total score of L1(r= 0.461)
and the model was significant with F = 4.202, p=0.002. Same was not observed from L1 to L2
i.e. L1 total scores were not able to predict performance on L2 language proficiency tasks.
However, performance on L1 reading writing domain predicted performance on L2 and vice
versa. Total scores of L1 and L2 both showed high correlation with task of reading and writing
r= 0.512, r = 0.501 respectively.
20
Greater interdependence of L1 and L2 was observed for the reading writing domain as compared
to the speaking understanding domain.
Validity and reliability of the test of language proficiency
Factorial validity and reliability were also measured to assess the extent to which tasks
captured similar information (i.e. language proficiency). Factor analysis showed that grouping of
each task under different components makes intuitive sense i.e. L1 tasks clustered into
meaningful groups, which was evident through the grouping of discourse tasks as one common
component. Tasks requiring semantic information access were grouped together for L1 whereas
L2 tasks formed a single construct for both speaking/understanding as well as reading/writing
domain. Cronbach‟s alpha as a measure of internal consistency was found to be 0.646 for 24
items including both L1 and L2 tasks. This suggests a fair amount of reliability for the test of
language proficiency in Hindi and English.
Discussion
Research on bilingualism focusing on language representation, language processing,
second language acquisition, cognitive control (Bialystok, 2007; Chauncey, Holcomb &
Grainger, 2009; Colzato, et al., 2008; Kroll, Bobb, Misra & Guo, 2008; Van Hell & Tokowicz,
2010) and mechanisms of language recovery in bilingual Aphasia (Chengappa, 2009) requires
appropriate methods for profiling and selection of bilingual participants. Dearth of such data in
Indian languages, especially those language combinations which follow different modes and
patterns of acquisition, the current paper examined language history and proficiency across
language skills in Hindi and English. Moreover, language organization and interdependence of
21
L1 and L2 in the domains of speaking/understanding and reading/writing remain underspecified
in Indian bilingual context. Advantage of language proficiency is that it can be quantified, which
has been done in the past but only certain language skills (like confrontation naming/
comprehension/ translation) were considered (Bahrick et al 1994; Johnson & Newport, 1989;
Oyama, 1976 ). The present study examined language skills at semantic, syntactic and discourse
levels in both the languages.
It was evident in the current study that the expected level of proficiency varied across
language skills in the native language also in L2, which may be because of the varying patterns
of native language use. In today‟s bi/multilingual world effective communication demands for a
trade off between the languages which influences the language use pattern and this is subject to
individual variations. One would expect different levels of bilingualism based on the trade off
between domains as well as between languages. For example, one person would be categorized
as high proficient in spoken/understanding domain in both his languages and low proficient in
reading/writing domain in his second language. On the other hand, we may also have a bilingual
who is at the intermediate level of proficiency in native language and highly proficient in second
language. This sort of distinction would create a 6*2 matrix with individual language proficiency
levels (i.e. high, mid, low) across the two domains. This has been theoretically described in
Bialystok and Cummins‟ work, where Cummins (1991) accounts for two different types of
language proficiency: Basic Interpersonal Communication Skills and Cognitive Academic
Language Proficiency. Bialystok (2001) conceptualized bilingualism through cognitive
dimensions of language proficiency. She states the relationship among use of language and
22
underlying cognitive requirements, where analysis of representation, structure and control of
attention create the orthogonal axes.
Correspondence between subjective and objective measures of language proficiency
Our findings based on the language background questionnaire and assessment of
language proficiency in Hindi and English suggest that the information obtained with subjective
measures may or may not correspond with objective measures. Many of the
psycholinguistic/sociolinguistic studies define bilinguals only on the basis of questionnaire based
information (Coppieters, 1987; Marian et al, 2007). One such attempt by Marian et al (2007)
resulted in the development of Language Experience and Proficiency Questionnaire (LEAP –Q),
where they have probed separately for language proficiency, language dominance and language
preference. This questionnaire elicits proficiency ratings in speaking, listening, reading and
writing domains. The current study also assesses different language skills as a measure of
language proficiency.
One of the important findings of the current study is that age related information had no
significant correlation with objective performance on language proficiency tasks. This could be
because of the variability in language skills and poor reportability of L1 in particular. However,
the finding that age of acquisition did not predict objective performance on language proficiency
raises concerns about the use of age related information as a holistic measure while categorizing
bilinguals. On the other hand, use related information and self reported proficiency accounted for
less than 50% of the variance in performance on language proficiency tasks. There was a
correlation between speaking/understanding domain of L2 and age of fluency in reading and
23
writing which can be attributed to the fact that reading/writing fluency was achieved at a later
age resulting in better reportability for the same. It is also interesting to note that reportability of
native language is less than the language (L2) learnt in a structured setup. Our study shows that
self reported measures alone are not sufficient to reliably inform about all the aspects of
language skills and differences in proficiency levels.
The other salient finding is that correspondence between subjective measures and
language proficiency tasks in L1 (Hindi) showed different patterns as compared to that observed
for L2. For example, the correlation between language use (subjective measure) and discourse
skills (objective measure) in L1 could be due to the fact that discourse skills are based on our
ability to communicate, thereby, influencing the reportability of L1 use and its relationship with
performance on tasks like spoken discourse. Unlike L1, subjective measures predicted task
performance for most of the language skills in L2. Proficiency can indicate an individual‟s
language skills even if the use of L2 is limited.
Since we lack systematic efforts to look at the nature of language proficiency in Indian
context such data are important to determine the appropriate tool for language proficiency
assessment. For example, our study shows that discourse could be a valid tool for both Hindi and
English language as compared to the naming task as it has shown within and across domain
(discourse in the spoken and written domain) clustering as well as being strongly predicted by
self reported language use and overall proficiency. This is particularly important when we use
language both as an independent variable or a dependent variable in our experiments in bilingual
research. Our results also demonstrate greater interaction between the two languages with respect
24
to the reading/writing skills and discourse. Vasanta (2011) has addressed issues related to
bi/multilingualism and language processing abilities in Indian context primarily looking at
language learning environments. She points out that… “It is a common practice to assume that
first language (L1) is a static entity fixed in the minds‟ of bilinguals and it needs to be changed”.
We have found variability in language skills in L1 as evident in our results based on factor
analysis. In addition, data based on tests of sub-skills in oral and literacy skills in L1 were also
found to be normally distributed showing variability in performance, and not showing any
ceiling effects.
To sum up, out of all the tasks of language proficiency, confrontation naming, discourse
analysis and reading comprehension were found to be better correlated with subjective measures
and thus can be used as screening measures of language proficiency. Self report of L2
corresponds well with objective performance of L2 which is not the case with L1. Age related
factors do not predict performance on language skills across domains for L1; same was
predictive in case of L2 suggesting stronger reportability of age related factors for the language
which is learnt through instruction.
Organization of language skills in Hindi and English
The factor structure of Hindi as L1 and English as L2 showed that L2 tasks in the domain
of speaking/understanding as well as reading/writing were clustered under one common factor,
which was not the case for L1. Such kind of clustering could be because L1 is acquired and L2 is
learnt through instruction. In addition, use of L1 is more in the spoken/understanding domain
whereas use of L2 is more in the reading/writing domain for the population under study.
25
Language which is acquired has no strict way of experiential pattern. The dynamic nature of this
exposure leads to the variability in reportability of acquisition related information whereas
hierarchical increments in every grade add some sort of consistency while learning the second
language. Results based on factor analysis in L1 and L2 tasks imply that language organisation is
task specific (i.e. naming task, comprehension task) and reading/writing and
speaking/understanding as domains cannot be segregated as two broad domains. It indicates that
our language representation is interwoven within and across both the domains. Oral and aural
segregation in tasks may indicate difference at the level of language representation and
processing mechanisms. Experimental work with bilingualism may get influenced by such
findings in a way that researchers may expect a task specific (visual word recognition, spoken
production) correlation with a measure of language proficiency. We also find a lot of scatter in
the L1 tasks which justifies the use of a comprehensive tool including all language domains for
the determination of language proficiency in L1.
In addition, correlation between L1 and L2 on the discourse task suggests that knowing
L2 enhances the skills at discourse level for L1, which pertains to the organization of information
in L1. It‟s been implicated in many studies that L1 acquisition helps in L2 performance (Sparks,
Patton, Ganschow & Humbach, 2009). However, in the current study there was an overall
correlation of discourse task in L1 with all L2 tasks. Performance on L2 discourse task predicted
L1 task performance. Thus the ability to process two languages appears to enhance the higher
level language skills such as discourse production.
26
Findings of the current study have implications for bilingual research. Most of the
research on bilingualism focuses on L2 proficiency as a predictor variable, i.e. L2 proficiency
influences performance on experimental and non experimental non-linguistic/linguistic tasks.
But distinction observed in factor structure of L1 and L2 implies that proficiency in both the
languages could independently as well as interactively influence experimental results. Thus
proficiency as a predictor variable could have language specific, task specific or domain specific
effects. In our current studies we are empirically testing this hypothesis.
Language proficiency: categorical or continuous variable
The very nature of treating bilingualism as a categorical variable by manipulating
language proficiency, language use and/or age of acquisition related information creates similar
sort of selection bias while selecting bilingual participants. Common concerns include, what kind
of task should be prepared, selection criteria, basis of such selection etc. The comparison among
bilinguals with respect to levels of performance on language proficiency tasks (i.e. high vs. low,
balanced vs. unbalanced etc) is biased because it means comparing the extreme ends which are
ought to show a difference. Such a comparison is possible if assessment of all bilinguals on
certain aspects (AoA, proficiency and use) leads to a bimodal distribution. On the contrary, our
results suggest that language proficiency shows a normal probability distribution. It was not just
at the total score level but normal probability distribution was also seen on individual task
performance level. By doing so, researchers can assess a bilingual on desired aspects of language
proficiency and instead of grouping them, treat proficiency as a continuous variable. Grosjean
(1998) emphasized on the demerits of considering bilingualism as categorical variable and the
27
use of bilingual proficiency assessment as a covariate during analysis. Bialystok (2001) also
highlighted the continuous nature of bilingualism and the need to consider the type of language
proficiency (with respect to the domain) and degree of language proficiency in each language of
a given individual. However, this has not been empirically examined. Any method of dealing
with bilingualism should have the capability of ideally setting the boundaries of language
proficiency as well as acknowledge variability, thereby provide some sort of metric position of
the learner in certain skills. Thus, grouping individuals based on some arbitrary cut off point,
would automatically exclude certain individuals from the bilingual category though they have
certain amount of skills in both their languages (Bialystok, 2001; Grosjean, 1998). As language
proficiency varies on a continuum, it could be treated as a predictor variable and need not be
manipulated as a categorical/discrete variable. Another reason for this is to remove the
methodological bias which can be introduced by dichotomy. However, use of language
proficiency as continuous or categorical variable would rely heavily on the research question.
Future work needs to empirically test this proposition.
Conclusion
The present study is one of the first attempts to examine the nature of language
proficiency in Hindi-English bilinguals. The study highlights the need for proficiency assessment
for L1 and L2 language skills in view of the variability observed in the factor structure of the two
languages. Self reported information predicted objective performance for L2 but not L1. Greater
interdependence of L1 and L2 was observed for the reading/writing domain as compared to the
speaking/understanding domain. Continuous nature of language proficiency in bilingualism
28
demands for treating it as a predictor variable. Varying levels of proficiency across language
skills in L1 and L2 may interact with language processing mechanisms addressed in bilingual
research, particularly for certain language combinations where L1 and L2 vary with respect to
modes of acquisition, organization of language skills and language use.
Acknowledgement
We are thankful to the Department of Science and Technology, Government of India, for funding
this study as it is a part of our project on “Bilingualism and cognitive control” funded under the
multi-Institutional project on “Language and brain organization in normative multilingualism”
under the Cognitive Science Research Initiative of the DST.
29
References:
Abbate, M. S., & La Chappelle, N. B. (1984). Pictures, please! A language
supplement. Tucson, AZ: Communication Skill Builders.
Bahrick, H. P., Hall, L. K., Goggin, J. P., Bahrick, L. E., & Berger, S. A. (1994). Fifty years of
language maintenance and language dominance in bilingual Hispanic immigrants.
Journal of Experimental Psychology, 123, 264:283.
Ben-Zeev, S. (1977). The influence of bilingualism on cognitive strategy and cognitive
development. Child Development, 48, 1009–1018.
Bialystok, E. (1997).Consequence of bilingualism for cognitive development. In de Groot A. M.
B. and Kroll, J. F. Tutorials in Bilingualism: Psycholinguistic Perspectives, 279-300.
Bialystok, E. (2001). Bilingualism in development: Language, literacy, and cognition. New
York: Cambridge University Press.
Bialystok, E. (2007). Cognitive effects of bilingualism: How linguistic experience leads to
cognitive change. International Journal of Bilingual Education and Bilingualism, 10,
210-223.
Bialystok, E. & Feng, X. (2009). Language proficiency and executive control in proactive
interference: Evidence from monolingual and bilingual children and adults: Brain and
Language 109, (2009), 93–100.
Bialystok, E., Craik, F. I.M., & Gigi, L. (2012). Bilingualism: Consequences mind and brain.
Trends in Cognitive sciences, 6 (4).
30
Chauncey, K., Holcomb, P. J. & Grainger, J. (2009). Primed picture naming within and across
languages: An ERP investigation. Journal of Cognitive, Behavioral, and Affective
Neuroscience, 9, 286-303.
Chengappa, S. (2009. Bi/Multilinualism and issues in management of communication disorders
with emphasis on Indian perspectives. Language in India. 9:8 August 2009.
Colzato, L. S., Bajo, M. T., van den Wildenberg, W., Paolieri, D., Nieuwenhuis, S. T., La Heij,
W., & Hommel, B. (2008). How does bilingualism improve executive control? A
comparison of active and reactive inhibition mechanisms. Journal of Experimental
Psychology: Learning, Memory, and Cognition, 34, 302-312.
Coppieters, R. (1987). Competence differences between native and near native speakers.
Language, 63, 544-573.
Costa, A., Hernander, M., & Sabastia-Galle, N. (2008). Bilingualism aids conflict resolution:
Evidence from the ANT task. Cognition, 106 (2008), 59–86.
Cummins, J. (1991). Language Development and Academic Learning. In Malave, L. and
Duquette, G. Language, Culture and Cognition. Clevedon: Multilingual Matters.
Flege, J. E., Yeni-Komshian, G. H., & Liu, S. (1999) Age Constraints on Second-Language
Acquisition. Journal of Memory and Language, 41, 78–104.
Goodglass, H., & Kaplan, E. (1983). Boston Diagnostic Aphasia Examination (2nd
ed.).
Philadelphia: Lea & Febiger.
31
Grosjean, F. (1998). Studying bilinguals: Methodological and conceptual issues. Bilingualism:
Language and Cognition, 1, 131-149.
Hakuta, K., & Suben, J. (1985). Bilingualism and cognitive development. Annual review of
applied linguistics, 6, 35-45. Cambridge University Press.
Herman, D., Bongaerts, T., De Bot, K., & Schrender, R. (1998). Producing words in a foreign
language: Can speakers prevent interference from their first language? Bilingualism:
Language and Cognition, 1, 213-229.
Johnson, J. S., & Newport, E. L. (1989). Critical period effects in second language learning: The
influence of maturational state on the acquisition of English as a second language.
Cognitive psychology, 21, 60-99.
Karanth, P. (2012). Language acquisition, learning and learning disabilities in the Indian context.
In P. N Tandon, R C Tripathy and n Srinivasan (eds). Expanding horizons of the mind
science(s). p.p 309-325. New York: Nova Science publishers.
Kertesz, A. (1982). The Western Aphasia Battery. New York: Grune & Stratton.
Kroll, J. F., Bobb, S. C., Misra, M. & Guo, T. (2008). Language selection in bilingual speech:
Evidence for inhibitory processes. Acta Psychologica, 128, 416–430.
Marian, V., Blumenfeld, H. K., & Kaushanskaya, M. (2007). The Language Experience and
Proficiency Questionnaire: Assessing language profiles in bilinguals and multilinguals.
Journal of Speech Language and Hearing Research, 50, 940-967.
32
Oyama, S. (1976). A sensitive period for the acquisition of a non native phonological system.
Journal of Psycholinguistic Research, 5 (3), 261-283.
Shipley, K. G., & McAfee, J. G. (2008). Assessment in Speech-Language Pathology: A Resource
Manual. Cengage Learning.
Siegal,M., Iozzi, L and Lurian, S. (2009). Bilingualism and conversational understanding in
young children. Cognition, 110 (2009), 115–122.
Sparks, R., Patton, J., Ganschow, L., and Humbach, N. (2009). Long-term cross linguistic
transfer of skills from L1 to L2. Language learning, 59:1, pp 203-243.
Stevens, G. (1999). Age at immigration and second language proficiency among foreign-born
adults. Language in Society, 28, 555–578.
Subbiah (2005). Test of language proficiency: Hindi. Central Institute of Indian Languages,
Mysore, India.
Thorum, A. R. (1986). The Fullerton language test for adolescents professional manual.
Consulting Psychologists Press.
Van Hell, J. G., & Tokowicz, N. (2010). Event-related brain potentials and second language
learning: Syntactic processing in late L2 learners at different L2 proficiency levels.
Second Language Research, 26(1), 43-74.
Vasanta, D., Suvarna, A. Sireesha, J., & Bapi Raju, S. (2010). Language choice and language use
patterns among Telugu-Hindi/Urdu-English speakers in Hyderabad, India. Proceedings of
33
the International Conference on Language, Society, and Culture in Asian Contexts (PP.
57-67). Thailand: Mahasarakam University.
Vasanta, D. (2011). (Re)searching Multilingualism in India: A Critical Review of Concepts.
Journal of Indian Speech and Hearing Association, 25 (2), 71-81.
Weber-Fox, C. M., & Neville, H. J. (1996). Maturational constraints on functional
specializations for language processing: ERP and behavioural evidence in bilingual
speakers. Journal of Cognitive Neuroscience, 8, 231-256.
Zutell, J. & Rasinski, T. V. (1991). Training Teachers to Attend to Their Students‟ Oral Reading
Fluency: Theory Into Practice, 30, 211-217.
34
Normal Q-Q plot of total score speaking/understanding (L1) Total scores on speaking understanding domain (L1)
Fig: 1a Normal distribution plots and histogram of the total scores of speaking/understanding domain (L1).
Observed value
Expec
ted N
orm
al V
alue
Fre
quen
cy
Total L1
35
Normal Q-Q plot of total score speaking/understanding (L2) Total scores on speaking understanding domain (L2)
Fig: 1b Normal distribution plots and histogram of the total scores of speaking/understanding domain (L2).
Observed value
Expec
ted N
orm
al V
alue
Fre
quen
cy
Total L2
36
Normal Q-Q plot of total score speaking/understanding (L1) Total scores on speaking understanding domain (L1)
Fig: 2a Normal distribution plots and histogram of the total scores of reading/writing domain (L1).
Observed value
Expec
ted N
orm
al V
alue
Fre
quen
cy
Total L1
37
Normal Q-Q plot of total score speaking/understanding (L2) Total scores on speaking understanding domain (L2)
Fig: 2b Normal distribution plots and histogram of the total scores of reading/writing domain (L2).
Observed value
Expec
ted N
orm
al V
alue
Fre
quen
cy
Total L2
38
Table 1a: Correlation analysis of subjective measure and speaking/understanding domain in L1
Confrontation
naming
Discourse
analysis
Words per
min
Synonym
production
Discourse
comp Total
Age related information
1. Age of learning languages at school 0.129 -0.016 0.085 -0.075 0.108 0.046
2. Age of fluency in reading and writing
skills 0.177 -0.203 0.034 0.003 -0.007 -0.013
Use related information
1. Percentage of exposure 0.05 -.261* 0.07 -0.057 -0.103 -0.165
2. Composite score of the task based
scores 0.122 -.311** 0.148 0.209 0.059 0.025
Proficiency related information
1. Reading -0.059 -0.008 0.089 .240* .286** 0.156
2. Writing 0.001 -0.136 0.068 .282** 0.168 0.115
3. Speaking 0.094 -0.034 0.169 0.148 0.102 0.134
4. Understanding 0.003 0.006 .215* 0.006 0.151 0.043
5. Composite score of the task based
scores 0.134 -0.118 0.074 .395** 0.178 .258*
*. Correlation is significant at the 0.05 level (2-tailed)
**. Correlation is significant at the 0.01 level (2-tailed)
39
Table 1b: Correlation analysis of subjective measure and reading/writing domain in L1
Reading
comprehension
Words per
min
Measure of
fluency
Phonological
awareness task
Written
Discourse Total
Age related information
1. Age of learning languages at
school 0.048 0.182 0.115 -0.042 -0.015 0.032
2. Age of fluency in reading and
writing skills 0.044 -0.012 0.128 -0.033 -0.066 0.01
Use related information
1. Percentage of exposure -0.136 0.028 0.025 -0.088 -0.019 -0.08
2. Composite score of the task
based scores -0.098 0.21 0.177 0.023 -0.026 0.061
Proficiency related information
1. Reading -0.013 .242* .253* -0.027 -0.007 0.099
2. Writing -0.088 .257* .327** -0.153 -0.048 0.02
3. Speaking 0.024 0.14 0.134 0.055 0.019 0.114
4. Understanding -0.04 0.076 0.178 0.115 0.082 0.194
5. Composite score of the task
based scores 0.197 0.159 0.125 -0.086 -0.035 0.031
*. Correlation is significant at the 0.05 level (2-tailed)
**. Correlation is significant at the 0.01 level (2-tailed)
40
Table 2a: Correlation analysis of subjective measure and speaking/understanding domain in L2
Confrontation
naming
Discourse
analysis
Words per
min
Synonym
production
Discourse
comp Total
Age related information
1. Age of learning languages at
school -0.139 -0.093 -0.083 -0.106 -0.1 -0.14
2. Age of fluency in reading and
writing skills
-
.360** -0.135 -0.178 -.219* -0.199 -.298**
Use related information
1. Percentage of exposure 0.161 .313** .272* .304** 0.102 .286**
2. Composite score of the task
based scores .310** .389** .388** .274* 0.2 .397**
Proficiency related information
1. Reading .386** .443** .317** 0.2 0.205 .445**
2. Writing 0.119 .256* 0.146 0.07 0.089 0.194
3. Speaking .406** .529** .335** 0.127 0.196 .478**
4. Understanding .410** .546** .410** 0.188 0.134 .491**
5. Composite score of the task
based scores .288** .356** .246* .248* 0.11 .357**
*. Correlation is significant at the 0.05 level (2-tailed)
**. Correlation is significant at the 0.01 level (2-tailed)
41
Table 2b: Correlation analysis of subjective measure and reading/writing domain in L2
Reading
comprehension
Words per
min
Measure of
fluency
Phonological
awareness task
Written
Discourse Total
Age related information
1. Age of learning languages at
school -.259* 0.157 -0.034 -0.135 -0.035 -0.12
2. Age of fluency in reading and
writing skills -.309** -0.18 -0.17 0.002 -0.042 -0.13
Use related information
1. Percentage of exposure 0.178 .322** .257* 0.118 0.175 .243*
2. Composite score of the task
based scores .263* .375** .405** -0.026 .331** .323**
Proficiency related information
1. Reading .296** .277* .441** .333** .221* .432**
2. Writing 0.062 .251* .272* -0.021 .228* 0.2
3. Speaking .312** .229* .474** .237* .322** .453**
4. Understanding .386** .275* .474** .265* .354** .489**
5. Composite score of the task
based scores 0.197 0.159 0.125 -0.086 -0.035 0.031
*. Correlation is significant at the 0.05 level (2-tailed)
**. Correlation is significant at the 0.01 level (2-tailed)
42
Table 3a: Correlation analysis between L1-L2 speaking/understanding tasks
L1-1 L1-2 L1-3 L1-4 L1-5
L1-6
Confrontation Naming L2
.115
.241*
.028
-.036
.036
.178
Discourse Analysis: Rubric
Score L2
-.042
.577**
.036
-.242*
.069
.171
Words Per Min L2
.021
.417**
.253*
-.156
.080
.168
Convergent
Production(E)/synonym(H) L2
.182
.310**
.126
.122
.068
.341**
Discourse Understanding L2
.122
.096
-.047
.033
.025
.391
Total L2
.085
.442**
.048
-.098
.064
.242*
*. Correlation is significant at the 0.05 level (2-tailed).
**. Correlation is significant at the 0.01 level (2-tailed). Note: L1-1: Confrontation Naming; L1-2: Discourse Analysis (rubric score); L1-3: words per minute; L1-4:
convergent Production (E) /synonym (H); L1-5: Discourse understand; L1-6: Total.
43
Table 3b: Correlation analysis between L1-L2 reading/writing tasks
L1-1 L1-2 L1-3 L1-4 L1-5
L1-6
Reading Comprehension L2
.115
.241*
.028
-.036
.036
.178
Words Per Min L2
-.042
.577**
.036
-.242*
.069
.171
Measure Of Fluency: Rubric
L2
.021
.417**
.253*
-.156
.080
.168
Phonological Awareness Task
L2
.182
.310**
.126
.122
.068
.341**
Written Discourse L2
.122
.096
-.047
.033
.025
.391
Total L2
.085
.442**
.048
-.098
.064
.242*
*. Correlation is significant at the 0.05 level (2-tailed).
**. Correlation is significant at the 0.01 level (2-tailed). Note: L1-1: Reading Comprehension; L1-2: words per minute; L1-3: Measure of Fluency: Rubric; L1-4: Phonological
awareness; L1-5: Written discourse; L1-6: Total.
44
Table 4a: Factor yielded in factor analysis of L1 in Speaking/understanding domain
Factor 1:
Naming Skills Load value
Factor 2:
Discourse Skills
Load
value
Confrontation Naming 0.748
Discourse analysis:
rubric 0.852
Convergent
production/Synonym task 0.781 Words per minute 0.477
Discourse
understanding 0.612
45
Table 4b: Factor yielded in factor analysis of L1 in Reading/writing domain
Factor 1:
Fluency measure
Load
Value
Factor 2:
Discourse skills
Load
Value
Factor 3:
Metalinguist
ic skill
Load
Value
Words per minute 0.862
Reading
Comprehension 0.535
Phonological
awareness 0.957
Measure of Fluency:
rubric score 0.89 Written discourse 0.911
46
Table 5a: Factor yielded in factor analysis across domain in L1
Factor 1:
Naming skills
Load
Value
Factor 2:
Discourse
production
Load
Value
Factor 3:
Fluency skills
Load
value
Confrontation naming
0.797
Discourse
analysis: rubric 0.774
Reading: Words per
minute 0.883
Convergent
production/Synonym
task 0.547
Written
discourse 0.781
Reading: Measure of
Fluency 0.875
Factor 4:
Metalinguistic skills
Load
Value
Factor 5:
Discourse
comprehension
Load
value
Phonological awareness 0.913
Spoken discourse
understanding -0.554
Reading
comprehension 0.774
47
Table 5b: Factor yielded in factor analysis across domain in L2
Factor1:
Production skills
Load
value
Factor 2:
Metalinguistic
skills
Load
value
Factor 3:
Understanding skills
Load
value
Confrontation naming 0.722
Phonological
awareness 0.952
Spoken discourse
understanding 0.915
Discourse analysis: rubric
score 0.852
Reading
comprehension 0.555
Discourse: Words per
minutes 0.729
Convergent
production/Synonym task 0.57
Reading: Words per
minute 0.719
Reading: measure of
fluency 0.821
Written Discourse 0.699
48
Appendix:
1 (a): Rubric for focused description: For spoken discourse analysis
Strong 3 points Average 2 points Weak 1 point
Overall impact and
achievement of purpose
3 Presents a vivid,
memorable picture of a
person, place or things
2 presents a clear picture of a
person, place, or thing
1 presents an unclear or
confusing picture of a person,
place and thing
3 Establishes a dominant, or
main, impression of the
picture
2 focuses on important
characteristic(s) of the
picture
1 presents an unfocused array
of characteristics of the
picture
3 Conveys a clear sense of
purpose
2 suggests the speakers
purpose
1 unclear or inadequate
indication of speakers‟
purpose.
Organization and
techniques
3 uses a clear, consistent
method of organization of
event
2 Method of organization is
usually clear and consistent
1 method of organization is
difficult to identify or follow
3 coherence and cohesion
demonstrated through some
appropriate use of devices
(transitions, pronouns, causal
linkage, etc)
2 coherence and cohesion
(sentence to sentence)
evident; may depend on
holistic structure, most
transitions are appropriate
1 evidence of coherence may
depend on sequence. If
present, transitions may be
simplistic or even redundant
Mechanics
3 very few, if any errors in
grammar, pronunciation and
presence of few pauses(filled
and unfilled)
2 small number of errors in
grammar, pronunciation and
presence of indefinable
pauses(filled and unfilled)
1 numerous errors in
grammar, pronunciation and
presence of pauses(filled and
unfilled)
49
1 (b): Rubric for fluency measure: For reading fluency
Scores Smoothness/pacing Confidence Accuracy expression
4 Reader reads all of the
familiar text smoothly
and continuously. The
reader pays attention to
punctuation marks, and
understands how to break
text up into meaning
groups of words.
Reader appears
relaxed/confident
and recovers
quickly if a
mistake is made
Reader self
corrects, or
does not make
errors when
reading familiar
text
Reader reads
familiar test with
appropriate
changes in voice
pitch/expression
that reflect
comprehension of
the text and add
dramatic emphasis
to the text
3 Reader reads most of the
familiar text smoothly
and pays some attention
to punctuation marks
Reader appears
relaxed/confident,
but is slightly
agitated/confused
by mistakes
Reader makes
occasional
errors that do
not affect the
content of the
text (e.g.
mispronouncing
character
names)
Reader reads
familiar text with
appropriate
changes in voice
pitch/expression
that reflect
comprehension of
the text
2 Reader reads familiar text
either too quickly or with
awkward pauses.
Reader appears
somewhat
nervous and is
confused/agitated
by mistakes
Reader makes
occasional
errors that
affect the
content of the
text.
Reader reads
familiar text with
changes in voice
pitch/expression
that may not match
the text meaning
1 Reader reads familiar text
with long extended
pauses or by slowing
sounding out each word
Reader appears
nervous and
cannot
concentrate to
read
Reader makes
frequent errors
when reading
familiar text
and text appears
to be above
student‟s
comfortable
reading level
Reader reads
familiar test in a
monotone voice.
50
1 (c): Rubric for focused description: For written discourse
Strong 3 points Average 2 points Weak 1 point
Overall impact and
achievement of purpose
3 Theme/unifying theme
explicitly stated
2 Theme/unifying theme
stated in opening or
conclusion
1 Theme/unifying theme
may not be present
3 has effective closing and
starting phrases
2 has closing and starting
phrases
1 abrupt starting or ending
Organization and
techniques
3 uses a clear, consistent
method of organization of
event
2 Method of organization
is usually clear and
consistent
1 method of organization
is difficult to identify or
follow
3 coherence and cohesion
demonstrated through some
appropriate use of devices
(transitions, pronouns,
causal linkage, etc)
2 coherence and cohesion
(sentence to sentence)
evident; may depend on
holistic structure, most
transitions are appropriate
1 evidence of coherence
may depend on sequence.
If present, transitions may
be simplistic or even
redundant
Mechanics
3 very few, if any errors in
grammar, capitalization,
punctuation and spelling.
2 small numbers of errors
in grammar, capitalization,
punctuation and spelling.
1 numerous errors in
grammar, capitalization,
punctuation and spelling.
51
Appendix 2: Language background questionnaire
N Mean L1 Std. Deviation
L2
Mean L2 Std. Deviation
L2
Age Of Learning Languages At
School
85 51.84 11.589 64.45 25.975
Percentage Of Exposure 85 64.49% 16.37% 35.44% 16.40%
Self Reported Reading proficiency 85 4.31 .913 4.12 .865
Self Reported Writing proficiency 85 3.88 1.117 3.96 .919
Self Reported Speaking proficiency 85 4.53 .700 3.39 .952
Self Reported Understanding
proficiency
85 4.71 .614 4.01 .982
Age Of Acquisition Of Reading
And Writing Skills
85 51.84 11.589 63.74 25.590
Age At Which Became Fluent In
Reading And Writing
85 88.45 24.585 129.44 35.269
Language Use Choice:
a) Reading Newspaper
85 2.39 .619 2.33 .521
b) Reading Novels/Magazine 85 1.92 .694 2.29 .669
c) Watching Movies 85 2.78 .472 2.06 .585
d) Watching TV Program 85 2.68 .582 1.73 .625
e) Making Shopping List 85 1.76 .766 2.48 .701
f) Listening To Music 85 2.76 .479 2.07 .613
g) In The Place Of Worship 85 2.81 .422 1.44 .606
Language Use Choice: Composite
Score Of The Task Based Scores
85 2.298 .3455 2.067 .3337
Percentage of Use Per Day 85 69.52% 13.87% 33.11% 15.90%
Language proficiency on task:
a) Count Up To Hundred
85 4.21 1.156 4.99 .108
b) Say The Days Of Week 85 3.88 1.562 4.95 .342
c) Months Of Year 85 3.15 1.701 4.99 .108
d) Enquire Train Timings 85 4.46 .894 4.56 .823
e) Ask For Direction 85 4.65 .719 4.36 .857
f) Describe Yourself 85 4.49 .796 4.29 .884
g) Talk About Hobby 85 4.39 .832 4.24 .972
h) Describe Typical Day 85 4.60 .710 3.93 .949
i) Talk About Academic Topic 85 4.21 1.025 4.28 .983
j) Understand Conversation 85 4.87 .402 4.51 .781
k) Comprehend Jokes/Ironies 85 4.65 .612 4.07 .949
l) Translate 85 4.12 .878 4.22 .905
m) Understand Proverbs/Idiomatic
Language
85 4.12 .993 3.84 1.045
Language proficiency on task:
Composite Score Of The Task
Based Scores
85 4.27 .495 4.36 .650
52
Appendix 3: Scoring method
Task/subtask Description Scoring Number of items
Speaking/understanding domain
Naming Confrontation naming task
(consist of both high and low frequency words)
Max S: 30
30
Discourse analysis Picture description task
(achievement of the purpose, organization
technique and mechanics)
Calculation of words per min
Max S: 18
Words per minute will be calculated
1 per language
Language comprehension
Auditory discourse comprehension test,
participants would be asked questions based on
the passage.
Max S:5 (Hindi)
Max S: 5 (English)
5
5
Convergent
production/synonym
For Hindi :synonym task was given
For English: convergent production task were
participants would be asked to name as many meaning possible of a particular word
Max S:10
Max S: 10
10
10
Reading/writing domain
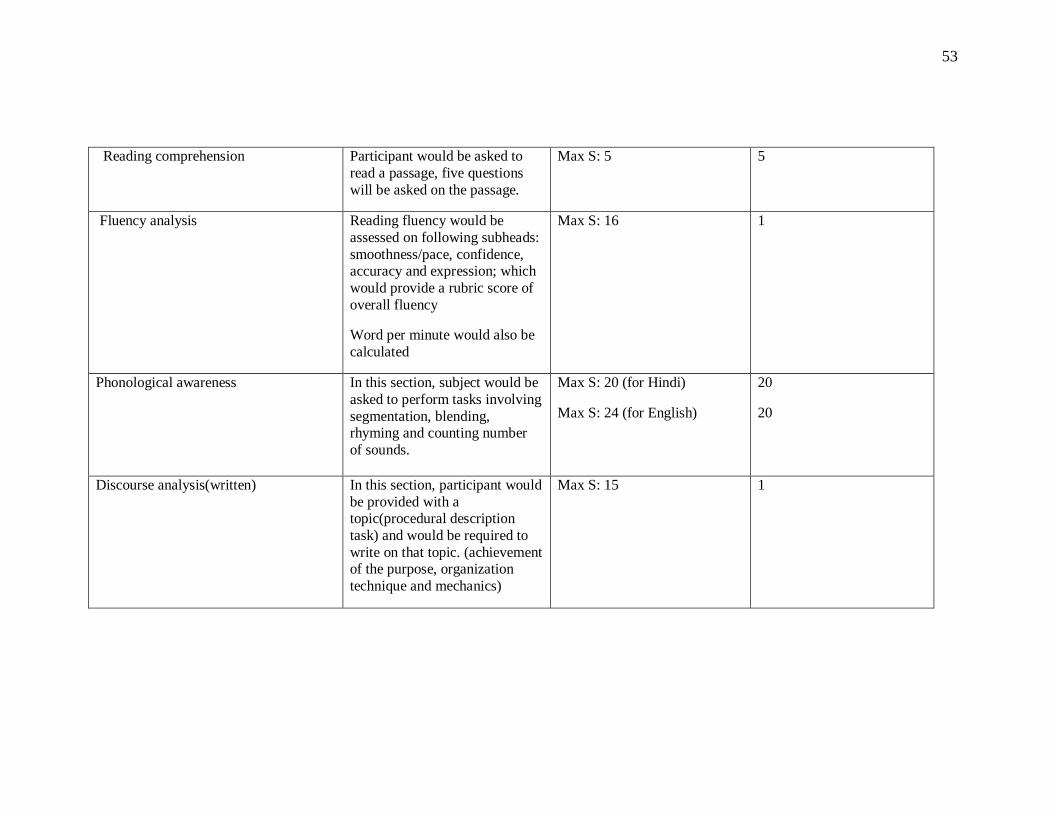
53
Reading comprehension Participant would be asked to
read a passage, five questions
will be asked on the passage.
Max S: 5 5
Fluency analysis Reading fluency would be
assessed on following subheads:
smoothness/pace, confidence, accuracy and expression; which
would provide a rubric score of
overall fluency
Word per minute would also be
calculated
Max S: 16 1
Phonological awareness In this section, subject would be
asked to perform tasks involving
segmentation, blending, rhyming and counting number
of sounds.
Max S: 20 (for Hindi)
Max S: 24 (for English)
20
20
Discourse analysis(written) In this section, participant would
be provided with a topic(procedural description
task) and would be required to
write on that topic. (achievement of the purpose, organization
technique and mechanics)
Max S: 15 1