characterizing local ems systems
TRANSCRIPT

DOT HS 811 824 August 2013
Characterizing Local EMSSystems
DISCLAIMER
This publication is distributed by the US Department of Transportation National Highway
and conclusions expressed in this publication are those of the authors and not necessarily those
The United States Government assumes no liability for its contents or use thereof If trade names
to the object of the publication and should not be construed as an endorsement The United States Government does not endorse products or manufacturers
Suggested APA Format Citation
MacKenzie EJ amp Carlini AR (2013 August) Characterizing local EMS systems (Report No DOT HS 811 824) Washington DC National Highway Traffic Safety Administration
Technical Report Documentation Page 1 Report No
DOT HS 811 824
2 Government Accession No
3 Recipients Catalog No
4 Title and Subtitle Characterizing Local EMS Systems
5 Report Date August 2013
6 Performing Organization Code
7 Author(s)
Ellen J MacKenzie Anthony R Carlini
8 Performing Organization Report No
9 Performing Organization Name and Address
Center for Injury Research and Policy Johns Hopkins Bloomberg School of Public Health 624 North Broadway 5th Floor Baltimore MD 21205
10 Work Unit No (TRAIS)
11 Contract or Grant No
DTNH22-08-H-00194
12 Sponsoring Agency Name and Address
US Department of Transportation National Highway Traffic Safety Administration 1200 New Jersey Avenue SE Washington DC 20590
13 Type of Report and Period Covered
14 Sponsoring Agency Code
15 Supplementary Notes
Ian Reagan served as the NHTSA Contracting Officers Technical Representative for the study
16 Abstract Emergency medical services (EMS) systems are configured differently depending on several factors including the size demographics geography and politics of the local communities they serve Although some information exists about the organization financing and delivery of EMS in the Nationrsquos 200 largest cities there is less information available about how services are organized outside large urban areas in which 75 percent of the nationrsquos population resides There is little evidence to support alternative system designs and configurations in terms of their impact on the effectiveness and efficiency of service delivery To this end there is a need to document the variation in system configurations so they may be evaluated on a common basis
22 Key Words
Emergency medical services (EMS)
EMS Systems
18 Distribution Statement
Document is available to the public from the National Technical Information Service wwwntisgov
19 Security Classif(of this report)
Unclassified
20 Security Classif(of this page)
Unclassified
21 No of Pages
104
22 Price
Form DOT F 17007 (8-72) Reproduction of completed page authorized
i
TABLE OF CONTENTS EXECUTIVE SUMMARY 1
INTRODUCTION AND OBJECTIVES 3
METHODS 4
Operationalizing the Definition of ldquoSystemrdquo 5
Interviews With State EMS Directors 6
Survey of Local Systems 7
RESULTS 9
Characterization of States 10
Identification of Systems and Rates of Participation in the Study 13
Characteristics of Systems by Rurality Geographic Region and Size 17
System Outlook by Characteristics of Systems 22
SUMMARY AND DISCUSSION 26
REFERENCES 38
TABLES 41
ii
Tables
A Characterization of States
Table A1 Characteristics of States ndash Demography Table A2 Characteristics of States ndash Mortality Rates
B Identification of Local Systems and Response Rates to Local Surveys
Table B1 Number of Local Systems Identified and Response (Participation) Rates by State
Table B2 Rates of Participation by Rurality and Geographic Region Table B3 Percent Distribution of Number of EMS Providers Annual Number of 911
Calls and Annual Number of EMS Responses by Rurality) Table B4 Percent Distribution of Number of EMS Providers Annual Number of 911
Calls and Annual Number of EMS Responses by Geographic Region
C System Characteristics by Rurality
Table C1 Primary Mission of First Response and Transport Agencies by Rurality Table C2 Primary Administration or Ownership of First Response and Transport
Agencies by Rurality Table C3 Emergency Call Taking Organizational Type of Agency by Rurality Table C4 Emergency Medical Dispatching Organizational Type of Agency by
Rurality Table C5 Most Common Level of First Response and Transport by Rurality Table C6 First Responder Policies and Practices (for areas of systems that use first
responders) by Rurality Table C7 Operating Procedures Regarding Dispatch and Transport (for areas of
systems that use first responders) by Rurality Table C8 Frequency of Out of Area Response to Calls by Rurality Table C9 EMS Provider Type by Rurality Table C10 911 System Access by Rurality Table C11 Timely Response to Incoming Calls by Rurality Table C12 Medical Direction by Rurality Table C13 System Financing by Rurality
D System Characteristics by Geographic Region
Table D1 Primary Mission of First Response and Transport Agencies by Geographic Region
Table D2 Administration or Ownership of First Response and Transport Agencies by Geographic Region
Table D3 Emergency Call Taking Organizational Type of Agency by Geographic Region
Table D4 Emergency Medical Dispatching Organizational Type of Agency by Geographic Region
iii
Table D5 Most Common Level of First Response and Transport by Geographic Region
Table D6 First Responder Policies and Practices (for areas of systems that use first responders) by Geographic Region
Table D7 Operating Procedures Regarding Dispatch and Transport (for areas of systems that use first responders) by Geographic Region
Table D8 Frequency of Out of Area Response to Calls by Geographic Region Table D9 EMS Provider Type by Geographic Region Table D10 911 System Access by Geographic Region Table D11 Timely Response to Incoming Calls by Geographic Region Table D12 Medical Direction by Geographic Region Table D13 System Financing by Geographic Region
E System Characteristics by Size of System (based on annual number of EMS responses)
Table E1 Primary Mission of First Response and Transport Agencies by Size of System
Table E2 Administration or Ownership of First Response and Transport Agencies by Size of System
Table E3 Emergency Call Taking Organizational Type of Agency by Size of System Table E 4 Emergency Medical Dispatching Organizational Type of Agency by Size of
System Table E5 Most Common Level of First Response and Transport by Size of System Table E6 First Responder Policies and Practices (for areas of systems that use first
responders) by Size of System Table E7 Operating Procedures Regarding Dispatch and Transport (for areas of
systems that use first responders) by Size of System Table E8 Frequency of Out of Area Response to Calls by Size of System Table E9 EMS Provider Type by Size of System Table E10 911 System Access by Size of System Table E11 Timely Response to Incoming Calls by Size of System Table E12 Medical Direction by Size of System Table E13 System Financing by Size of System
F Subjective Assessment of System Outlook by System Characteristics
Table F1 Responses to Opinion Questions by Rurality Table F2 Responses to Opinion Questions by Geographic Region Table F3 Responses to Opinion Questions by Size of Region Table F4 Eigenvalues and Proportion of Variance Explained Initial Principal
Components Analysis Table F5 Factor Loadings Varimax Rotation of Components Table F6 Mean Scores on Summary Measures by Rurality Geographic Region and
Size of the System Table F7 Regression Results Modeling Outlook Summary Measures by Selected
System Characteristics
iv
EXECUTIVE SUMMARY
An important first step in studying the impact of EMS system design on quality and outcomes is a more systematic characterization of local EMS systems While some data exist to characterize EMS services in 200 of the nationrsquos largest cities this information is incomplete and does not address how services are organized outside large urban areas The present study was designed to address this gap in our information
In a previous study the Center for Injury Research and Policy collected data with State and local EMS directors to characterize
bull Overall size of EMS systems bull Access to systems through 911 bull Provider and dispatch agency types bull Response configurations operating procedures and use of volunteers bull Mutual-aid agreements and response to calls outside the primary service area bull Medical control and bull Source of system funding
For the current study using the information gleaned from these surveys we investigated the variation in systems by geographic region of the country the rurality of the area serviced by the system and the overall size of the system as defined by the number of EMS calls responded to annually The survey also contained a series of subjective assessments focusing on adequacy of resource levels and system support extent to which bystanders were involved in EMS and adaptation of the system to change
In the broadest terms the most obvious difference noted was how each State related our operational definition of a local EMS system to itself States choose to organize local emergency medical services coordination in a variety of ways from hospital-centered models to county-based systems to larger regional entities Fifteen States identified systems that were at either a county or equivalent level although many States identified regional or multi-jurisdictional areas to survey States were consistent in how their areas were divided (eg county versus regional) although a few States did provide contact information for both types of areas as well as independent cities or miscellaneous systems such as hospitals or tribal authorities It is important to note that there were areas identified in ten States where no systems existed according to our operational definitions Conversations with the State EMS offices revealed that while there were EMS agencies operating in these areas they did not operate under a coordinated local administration
In addition to documenting overall variation in the organization and delivery of EMS across systems this study underscored the challenges faced by systems providing services in rural and wilderness areas of the country Most apparent (and of potential concern) are low percentages in rural and wilderness areas of full-time versus part-time and career versus volunteer EMS providers ALS versus BLS providers involved in
1
transport and dispatch agencies providing pre-arrival instructions In addition a higher percentage of systems in more ruralwilderness versus urbansuburban areas had no medical direction in place and or had some organized medical direction but with no one person with primary responsibility System financing was clearly a challenge for all systems but a slightly higher percentage of systems in rural and wilderness areas rely on fee for service as their primary source of funding
Variation across States is a ubiquitous theme in EMS and is well supported by the results of this study States have evolved quite differently in how they handle the oversight of EMS With such contrasting approaches in State regulation and policy along with differences in overall size demographics and geography it is not surprising that we saw variability in our data across these States
2
Characterizing Local EMS Systems in the United States Final Report
A Introduction and Objectives
Modern Emergency Medical Services (EMS) systems are generally thought to have begun with the release of Accidental Death and Disability The Neglected Disease of Modern Society by the National Academy of Sciences National Research Council in 1966 (also known as the ldquowhite paperrdquo) which called attention to the lack of coordinated care for the injured (1) The early Federal response to this report was the establishment of the Highway Safety Bureau including its critical EMS component and the development of National Standard Curricula for EMTrsquos and Paramedics
Increasing attention to the importance of EMS ultimately led to the passing of the Emergency Medical Services System Act of 1973 (2) which provided definition to the concept of a regionalized EMS system and planted the seed for development of infrastructure through increased Federal coordination and substantial funding to incentivize the creation of such systems System development during this era focused largely on functional components but did not prescribe how the system was to be implemented or which individuals or organizations would take on this role (3)
The 1970s saw the rapid expansion of regional EMS systems and advances in some overarching standards but Federal oversight of EMS system development waned over the following decades as funding shifted to block grant programs in the early 1980s placing oversight and prioritization efforts back in the hands of State and local authorities (4) Today EMS systems are innately seen as local entities (5) The coordination of such systems including the various roles of interdependent entities is inherently difficult (6) The result of such decentralization along with the steadily reduced funding streams and lack of a coordinated infrastructure is a highly fragmented system of care throughout the country (4)
Nearly half of a century after the creation of modern EMS systems there is still little consensus as to what comprises the ideal EMS system There are many approaches to EMS service delivery each with notable advantages and disadvantages (7) Additionally EMS systems continue to evolve in response to the overall changes within the health care system as well as in the marketplace (8) Overton and Stout (9) contend that there are more than 30 designs for providing EMS services and acknowledge the difficulty of more broadly comparing systems using traditional methods They and others point to the need to better understand how different EMS configurations impact the quality and outcome of service delivery Without the capability of determining what characteristics of EMS systems are most effective and efficient the National Highway Traffic Safety Administration (NHTSA) is unable to establish effective guidelines for EMS best practices that could be used by EMS providers to assess and ultimately improve their performance
An important first step in studying the impact of EMS system design on quality and outcomes is a more systematic characterization of local EMS systems While some data
3
exist to characterize EMS services in 200 of the nationrsquos largest cities (25) this information is incomplete and does not address how services are organized outside large urban areas
The present study was designed to address this gap in our information Through interviews with the State EMS directors we identified how EMS services were organized into systems of care at the local level Surveys were sent contacts representing these local systems and information obtained to characterize
bull Overall size of the system bull Access to the system through 911 bull Provider and dispatch agency types bull Response configurations operating procedures and use of volunteers bull Mutual-aid agreements and response to calls outside the primary service area bull Medical control and bull Source of funding for the system
Using the information gleaned from these surveys we investigated the variation in systems by geographic region of the country the rurality of the area serviced by the system and the overall size of the system as defined by the number of EMS calls responded to annually
The survey also contained a series of subjective assessments focusing on adequacy of resource levels and system support the extent to which bystanders were involved in EMS and adaptation of the system to change These opinions on the outlook of the system were summarized and correlations with system characteristics explored
B Methods
In this section we describe the methods used to identify and survey local EMS systems (our unit of analysis) The approach used is similar to that used by MacKenzie et al(10) in a pilot study designed to characterize EMS systems within the Mid-Atlantic region of the country (New Jersey Pennsylvania Delaware Maryland West Virginia the District of Columbia Virginia and North Carolina) The pilot study was successful in gathering descriptive information regarding system organization call volume first response and transport agency types 911 access medical control funding sources and mutual aid agreements Although the response rate was high (86) several limitations of the survey were identified In particular terms were not well defined leading to ambiguity in some of the responses In addition the pilot study did not adequately characterize EMS agencies by their mission and their administrative home or ownership
To create the survey used for the current analysis a national panel of experts was convened to discuss the pilot study and its results review the objectives of the current study assist in operationalizing the definition of ldquolocal systemrdquo and assist in refining the survey and methods used for eliciting participation in the study During the early stages of the project (and upon recommendation of the expert panel) support for the
4
project was sought from the National Association of State EMS Officials (NASEMSO) Additional guidance was garnered from the EMS Systems Subcommittee of the National EMS Advisory Council (NEMSAC) Members of the expert panel included
bull Robert Bass MD FACEP ndash Executive director Maryland Institute for Emergency Medical Services Systems
bull Karen Halupke RN MEd ndash Director Office of Emergency Medical Services (New Jersey)
bull Joseph Schmider ndash Director Bureau of Emergency Medical Services (Pennsylvania)
bull Dia Gainor MPA EMT-P (ret) ndash Chief Emergency Medical Services Bureau (Idaho)
bull Jim DeTienne - Supervisor EMS and Trauma Systems Section (Montana) bull Paul Patrick - Bureau director Emergency Medical Services and Preparedness
(Utah) bull Dan Manz ndash Director Vermont Emergency Medical Services bull N Clay Mann PhD MS ndash Principle investigator NEMSIS Technical
Assistance Center bull Drew Dawson ndash Director National Highway Traffic Safety Administration
Office of Emergency Medical Services bull Susan McHenry MS ndash EMS Specialist National Highway Traffic Safety
Administration Office of Emergency Medical Services
B1 Operationalizing the Definition of ldquoSystemrdquo
A first important step was the development of an operational definition of ldquolocal systemrdquo Traditionally an EMS system has been defined as a comprehensive coordinated arrangement of resources and functions organized to respond to medical emergencies in a timely manner (2) This definition performs well when looking at the broader functions or components of the system but falls short when attempting to identify system entities at the jurisdictional level For example a single provider agency (eg for call taking dispatch first response and transport) may be able to adequately act upon the 15 components originally outlined in the Emergency Medical Services Act of 1973 and later modified in the EMS Agenda for the Future (11) but this would only illustrate enough coordination to internally operate and often does not touch on broader issues such as policy development or regionalization of services
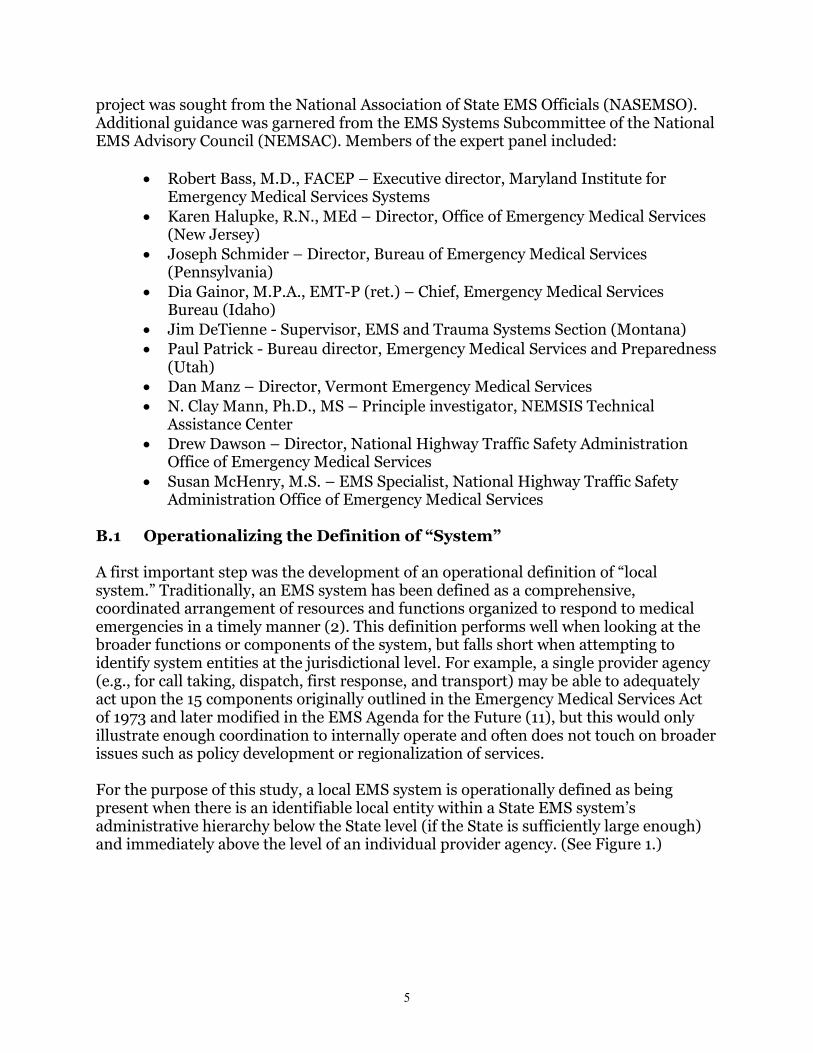
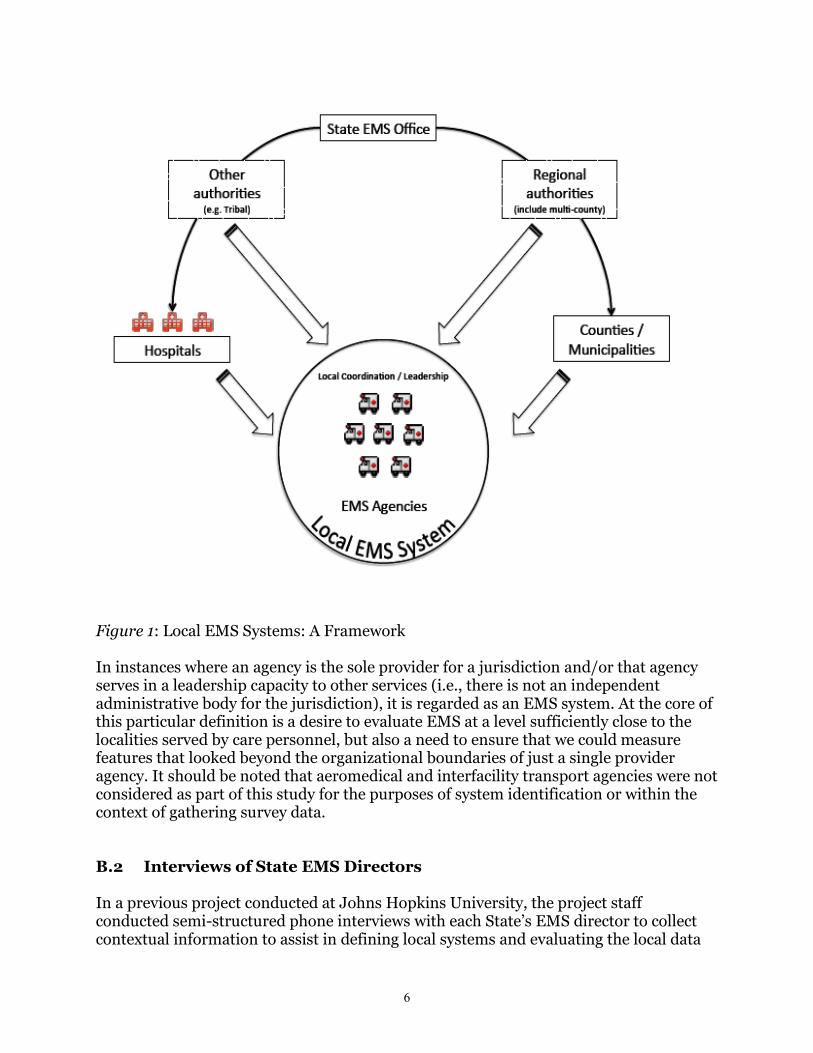
For the purpose of this study a local EMS system is operationally defined as being present when there is an identifiable local entity within a State EMS systemrsquos administrative hierarchy below the State level (if the State is sufficiently large enough) and immediately above the level of an individual provider agency (See Figure 1)
5
Figure 1 Local EMS Systems A Framework
In instances where an agency is the sole provider for a jurisdiction andor that agency serves in a leadership capacity to other services (ie there is not an independent administrative body for the jurisdiction) it is regarded as an EMS system At the core of this particular definition is a desire to evaluate EMS at a level sufficiently close to the localities served by care personnel but also a need to ensure that we could measure features that looked beyond the organizational boundaries of just a single provider agency It should be noted that aeromedical and interfacility transport agencies were not considered as part of this study for the purposes of system identification or within the context of gathering survey data
B2 Interviews of State EMS Directors
In a previous project conducted at Johns Hopkins University the project staff conducted semi-structured phone interviews with each Statersquos EMS director to collect contextual information to assist in defining local systems and evaluating the local data
6
collected from their States We began each interview with a brief description of the study and continued with questions about the Statersquos role in overseeing the EMS system and the presence of a regional EMS structure Additional questions prompted further description of the directorrsquos opinion on expected differences across his or her State and its regions as well as the role of local and regional authorities in EMS planning and evaluation We continued the interview with more structured questions that asked about the responsibilities for 15 EMS system functions at 7 different EMS system levels within the State (State regional countymunicipality agencyservice hospital tribal and other) (see Attachment A Structured Interview of State EMS Directors) Each interview concluded with a request for contact information to facilitate our follow up with local EMS systems meeting our definition Interviews with State EMS directors lasted an average of 30 minutes
Following the interview of each State EMS director project staff worked with each State EMS office to gather a list of contacts for systems identified per the definition provided during the interview process Contact information was collated as part of a Microsoft Access database used for the purposes of creating mailing lists for survey distribution as well as response tracking
B3 Survey of Local Systems
In the second phase of the data collection project we used the contact information provided by State EMS directors to survey local EMS systems All EMS systems meeting our specified criteria were mailed a 24-question survey along with a postage-paid return envelope The survey was accompanied by a cover letter indicating the nature of the project the support of the State EMS office and contained a URL that allowed the system administrators to complete the survey via the Web instead of by hard copy This package was sent to the contact identified by the State EMS office typically the director of EMS for the system The survey addressed the following topics
bull Overall size of the system as characterized by the annual number of EMS responses and transports as well as the total number of EMS personnel
bull Access to the system through 911 bull Provider and dispatch agency types bull Response configurations operating procedures and use of volunteers bull Mutual-aid agreements and response to calls outside the primary service area bull Medical control and bull Source of funding for the system
The survey also contained a series of subjective assessments focusing on adequacy of resource levels and system support extent to which bystanders were involved in EMS and adaptation of the system to change Finally respondents were given the opportunity to provide additional narrative to better describe any unusual system structure functions or arrangements
7
Non-respondents received up to three follow up mailings with pre-paid return envelopes as well as follow-up phone calls or faxes as needed The survey used for this study was based on the initial draft used in the pilot study with the following refinements bull Response categories were altered for several questions to provide more specificity
in responses bull When asked to describe a specific characteristic that pertains to the ldquomajorityrdquo of
services or personnel a definition of ldquomajorityrdquo was provided bull When characterizing agency types for first responder and transport agencies
present in the system the survey allowed for a broader classification of both ownership and mission
bull A question was added to better distinguish between call taking and dispatch agencies
bull A single response configuration question was broken out into three separate questions to better evaluate common responses for first response and transport separately
bull A question was added on non-emergency assessments bull A question was added to ascertain extent of out of area responses within own
jurisdiction bull Questions regarding types of volunteers medical direction and timely response
problems were refined
In the current project we entered the previously collected data into a Microsoft Access database and analyzed the data using the SAS statistical software package When necessary a research assistant contacted survey respondents to clarify logical inconsistencies in the data collected or to ensure proper data entry (eg due to illegibility) Analyses were primarily descriptive focusing on frequencies of characteristics and exploration of differences across the States
System characteristics were summarized for the country overall and by region of the country rurality of the area serviced by the system and self-reported system size of the area serviced by the system as measured by the annual number of EMS responses
bull Regions of the country were classified as Northeast Midwest South and West as defined by the US Census Bureau (12)
bull The size of the EMS system was based on self-report and categorized into four groups based on the distribution of annual number of EMS responses as reported by the systems themselves (Low le 999 calls Moderate = 1000 ndash 4999 calls High = 5000 ndash 9999 calls Very High = 10000 or more calls) Self-reported data on size were not available for 80 (100) of the participating systems
bull Classification of rurality was based on 2003 urban influence codes (13) and divided into four categories used in other EMS applications such as NEMSIS These data were obtained from the 2007 Area Resource File(14) and the categories defined as follows
Urban UIC1 In large metro area of 1+ million residents
8
UIC2 In small metro area of less than 1 million residents Suburban
UIC3 Micropolitan adjacent to large metro UIC5 Micropolitan adjacent to small metro
Rural UIC4 Noncore adjacent to large metro UIC6 Noncore adjacent to small metro with own town UIC8 Micropolitan not adjacent to a metro area UIC9 Noncore adjacent to micro with own town
Wilderness UIC7 Noncore adjacent to small metro with no own town UIC10 Noncore adjacent to micro with no own town UIC11 Noncore not adjacent to metro or micro with own town UIC12 Noncore not adjacent to metro or micro with no own town
(A Metropolitan Area is defined as having at least one urbanized area of 50000 or more population plus adjacent areas socially and economically tied to the core a Micropolitan Area as having at least one urban cluster of at least 10000 but less than 50000 population plus adjacent areas socially and economically tied to the core and a Noncore Area is defined as neither metropolitan nor micropolitan)
In instances where more than one urban influence code was associated with a participating system the system was classified according to the most urban value
C Results
In this Section we begin with a characterization of States to provide context for the results We then proceed in summarizing the identification of local systems by the State EMS offices and the extent to which local systems agreed to participate in the study and complete the survey We summarize the results of the survey with particular attention paid to variations in system characteristics by rurality and geographic region We end with summarizing the subjective assessments of the respondents on a number of factors relating to resource levels system support bystander involvement and adaptability to system change and exploring the correlates of these subjective assessments
The statistical significance of differences across geographic region rurality and system size were examined using chi-square analysis and Fisherrsquos exact tests for dichotomous and categorical variables and t-tests and analysis of variance (ANOVA) for continuous variables In instances where ANOVA results showed significant differences Duncanrsquos multiple range test (p = 005) was applied for post-hoc comparison of the means among the groups Regression analysis techniques were used to summarize the opinion data as a function of organizational and system level variables collected as part of the survey Additionally principal component analysis was used to reduce the opinion question data into summary scores for use in further regression analyses Maps were generated using ArcMap GIS software (15)
9
C1 Characterization of States
Tables A1 and A2 provide a summary of general State characteristics including geographic size population and demographics as well as age-adjusted estimates of mortality both overall and for the three major causes associated with a large percentage of EMS calls (injury stroke and heart disease) Data to characterize the States and their counties come from the 2007 Area Resource File (14) State mortality rates were obtained from the Centers for Disease Control and Prevention through its Web-Based Injury Statistics Query and Reporting System (WISQARS) (37) and the Wide-Ranging Online Data for Epidemiologic Research (WONDER) (38) reporting systems
The total percentage of the population who live in urban areas ranges across States from 100 (District of Columbia New Jersey and Rhode Island) to less than 40 (Montana Vermont and Wyoming) Twenty-one States have less than 1 of its population living in wilderness counties however there are 9 States where this percentage is greater than 10 and 4 States where it is greater than 20 (Montana 39 of 56 counties are categorized as wilderness 202 population South Dakota 41 of 66 counties 218 population Alaska 21 of 27 counties 244 population North Dakota 38 of 53 counties 248 population) A total of 1090 counties in the United States are categorized as urban 393 as suburban 963 as rural and 695 as wilderness
One-half of the States have no counties categorized as persistent poverty counties (defined as 20 or more of residents measured as poor in each of the 1970 1980 1990 and 2000 censuses) although this rate is as high as 622 in Mississippi and 500 in Louisiana Four States (District of Columbia Kansas Nebraska and North Dakota) have more than half its counties demonstrating population loss (defined as a decline in residents between the 1980 and 1990 censuses and between the 1990 and 2000 censuses) which is in contrast to 15 States where none of the counties meet this definition
Age-adjusted mortality rates due to injury range from 373 per 100000 population in New York to 1009 per 100000 population in New Mexico (Table A2) Deaths due to cerebrovascular disease are lowest in New York (274 per 100000 population) and highest in Alabama (554 per 100000 population) Minnesota has the lowest rates of deaths due to heart disease (1266 per 100000 population) but the rate is more than double this (2602 per 100000 population) in Mississippi Overall age adjusted mortality ranges from 5906 per 100000 population in Hawaii to 9585 per 100000 population in West Virginia
As indicated above we contacted State EMS representatives from all 50 States as well as the District of Columbia and asked them to participate in the study beginning with a brief personal interview Forty-nine of 51 (961) State EMS officials participated in the interview process (neither Georgia nor Wyoming participated) Each interviewee
10
provided an overview of EMS operations in his or her State as well as answered a set of questions outlining the levels within the State where responsibilities for 15 EMS system functions resided All States but Oregon provided contact data for a survey of local EMS systems Figure 2 provides an overview of system function responsibilities as reported by the State EMS director or his her designee
Table 1 Percentage of States reporting responsibility for system functions by level within the State
Overall State EMS offices engaged in wide variety of activities with more than half the responding States indicating that 11 of the 15 system functions listed occurred at their level At the State level the overwhelming majority of States indicated their offices had responsibilities in the areas of providing technical assistance as well as certifying and licensing EMS providers However most States did not have responsibilities directly related to the education of providers call taking dispatching or coordination of aeromedical dispatch A large majority of States (898) reported that counties or municipalities have responsibilities related to EMS funding Approximately two-thirds noted that dispatching (694) and call taking (673) also occur at this level Most States did not report having EMS agencies or services responsible for provider certification or licensure (both 306) and only 143 indicated that services in their States engage in providing technical assistance As expected most States indicated that their agencies or services have responsibilities related to funding (918) medical direction (816) and quality improvement activities (816)
Nationwide the majority of States indicated that a regional authority did not have responsibility for any of the system functions listed although a moderate number of
11
States indicated regions took on responsibilities for providing technical assistance (429) and medical direction (388) Similarly less than one quarter of the responding States indicated that hospitals had a role in any of the system functions and only medical direction and funding activities occur at the tribal level but in very few States
Most States indicated that EMS medical directors are identified primarily at the agencyservice and State levels Similarly these levels also had the largest roles in establishing treatment and triage protocols Both provider certification and licensure reside primarily at the State level for most States with agencies and services also taking on such roles in nearly one third of States Provider credentialing occurs in the majority of States at either the State or agencyservice level The education of EMS providers is often realized through the agencies or services they work for although nearly half the States indicated that the State also plays a role here
Three-quarters of responding States indicated that the State itself has responsibility for the creation and maintenance of the communications system although these functions also reside at other system levels for approximately 20 to 40 of the respondents Approximately two-thirds of the respondents indicated that dispatching functions occur through either the countymunicipality or agency service levels Over 60 of States indicated that EMS agencies and services had responsibilities for call taking activities and coordination of aeromedical dispatch
Funding sources to support local EMS operations included the agencies themselves (presumably from billing and fees) counties and municipalities (supported by a tax base) and State-level funding (State funds generated through fees and other programs) Development of patient care reports took place primarily at the State level although more than half of the States indicated that this also occurs at the service level
Quality improvement efforts occurred in more than 80 of States at the agencyservice level however States and regions also took on this role in 571 and 286 of responding States respectively The provision of technical assistance as expected was largely a State and regional responsibility in most States
Although several questions from the structured portion of the interview inquired about differences that might be present for a given system function when considering ALS and BLS levels of care only California New Jersey and South Dakota indicated any such differences existed In New Jersey these were in the areas of treatment protocol development provider education as well as the creation and maintenance of a communications system California indicated EMS agenciesservices had secondary responsibilities for BLS licensing and certification of providers In South Dakota the only reported differences were for treatment protocol development
On the whole responsibilities for many functions at particular system levels did not vary much However there were a few statistically significant differences observed across regions Reported rates of medical direction at the countymunicipality level were higher in both the South and West (688 and 500 respectively versus 184 and
12
83 in the Northeast and Midwest) Responsibilities for provider credentialing and dispatching functions at the regional level were higher in the Northeast and West (333 and 167 for credentialing 222 and 250 for dispatching respectively) while absent (00) in the other regions Similarly regional quality improvement responsibilities ranged from 250 to 556 of States from all regions except the Midwest where it was absent at the regional level
Treatment protocol development at the agencyservice level varied widely by geographic region with this function occurring in only 111 of Northeast States versus 917 of Midwest States Similarly triage protocol development ranged from 222 in the Northeast to 750 in the Midwest All States in the Northeast indicated the State had responsibilities for triage protocol development while this was only the case in one third of Midwestern States Call taking functions at the State level were lowest in the South at 63 while other regions noted this was a responsibility in 417 to 667 of States Finally medical direction at the tribal level was notably low in all regions (and completely absent in the Northeast) but present in 50 of the States in the West
When considering the number of system functions engaged in by the various system levels States and agencies seemed to have responsibility for many of the functions in the responding States (mean number of functions with State responsibility = 916 mean number of functions with agencyservice responsibility = 827) Conversely most States did not report many functions being conducted at tribal or other levels (mean number of functions 022 and 059 respectively) The number of functions by level was also explored by region of the country Statistically significant differences were observed in the number of functions engaged in at the State (Northeast higher than other regions) regional (Midwest below other regions) and tribal (West and Midwest have higher means than South and Northeast regions) levels
C2 Identification of Local Systems and Rate of Response to the Survey
Table B1 summarizes by State the number of local systems identified the number of surveys distributed and the rate of response to those surveys (ie rate of system participation in the study) Also indicated is the percentage of land in each State that is covered by the participating systems the percentage of the population in a State that is covered by the participating systems as well as both land and population coverage for the United States overall
Fifteen States identified systems that were at either a county or equivalent level although many States identified regional or multi-jurisdictional areas to survey States were consistent in how their areas were divided (eg county versus regional) although a few States did provide contact information for both types of areas as well as independent cities or miscellaneous systems such as hospitals or tribal authorities Rhode Island and Hawaii (respectively the first and fourth smallest States measured by land area not counting the District of Columbia) indicated the appropriate place for the local survey using our definition would be the State EMS office itself It is important to note that there were areas identified in 10 States where no systems existed according to our operational definitions (therefore potential land mass coverage would be less than
13
100) Conversations with the State EMS offices revealed that while there were EMS agencies operating in these areas they did not do so under a coordinated local administration As a result these EMS agencies operated almost completely independent of each other and would interact directly with the State EMS agency on any matters (eg protocols certification) that was outside the scope of its organizational walls
Overall 1268 local EMS systems in 48 States and the District of Columbia were identified and 1257 surveys were distributed for those systems where contact information was confirmed (note Oregon Wyoming and Georgia did not provide contacts for local systems) Of the 1257 surveys distributed 800 (636) were completed (Table B2) Participation rates varied by State with 646 of the States having response rates of more than 50 and 12 (250) States having response rates exceeding 75 (Table B2 and Figure 3)
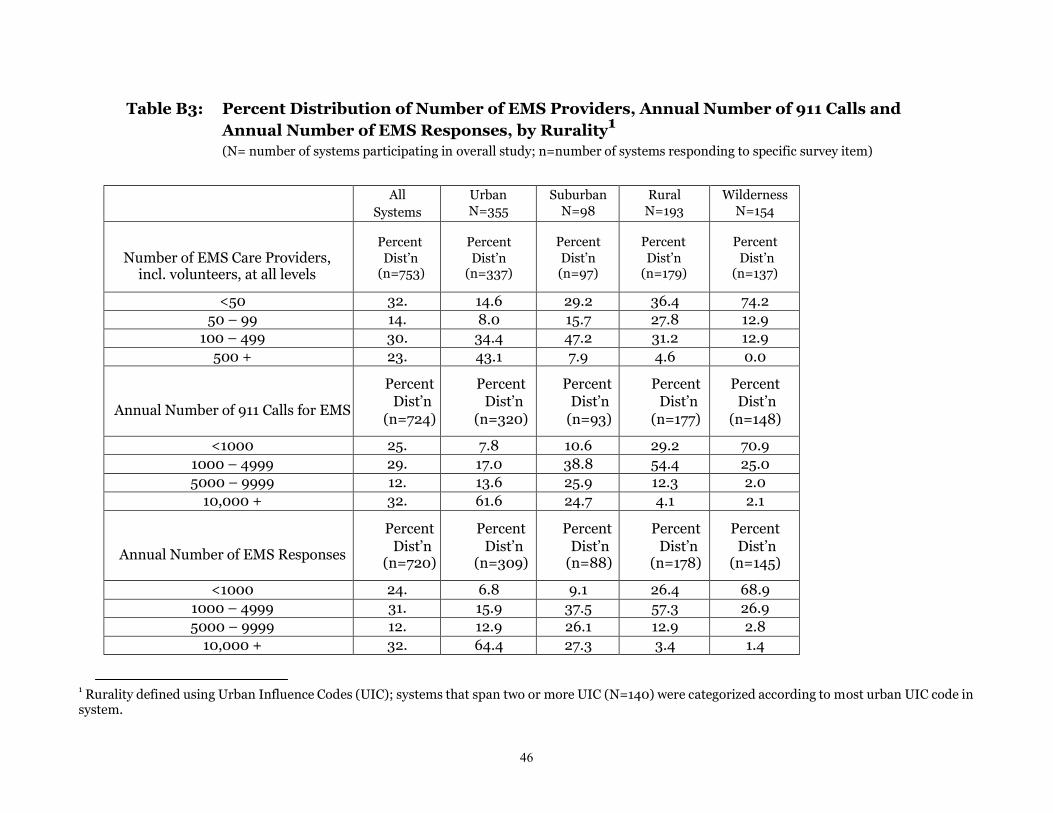
While the responding systems covered only 440 of the land in the United States they represented 636 of the US population Response rates did not differ significantly by geographic region of the country (X2= 331 p=035) or by rurality (X2= 186 p=060) Figure 4 displays the areas represented by the local EMS systems participating in the survey Figure 5 exhibits the percent of the population covered by the participating systems by State The distribution of participating systems by rurality and size is summarized in Table B3 and geographic region and size is summarized in Table B4
14
15
Figure 2 Percentage of systems participating in the survey by State
Figure 3 Land area covered by local systems participating in the survey
16
Figure 4 Percentage of the population covered by local systems participating in the survey
C3 Characteristics of Systems by Rurality Geographic Region and Size
In Tables C1- C13 we describe the characteristics of the 800 participating systems by Rurality in Tables D1-D13 by Geographic Region and in Tables E1- E13 by Size of the System (as defined by self-reported number of EMS responses per year) In each of these tables N refers to the total number of participating systems and the number of systems responding to any specific questions is noted by the (n) in parenthesis In the summary below we focus on differences by geographic region and rurality Due to the high correlation between system size and rurality classification (See Table B3) descriptions of variation by size would be largely redundant of those related to rurality and therefore excluded from the summary below
Mission and AdministrationOwnership of EMS Agencies Each participating system was provided the opportunity to characterize the first response and transport agencies that comprise the system using an organizational matrix Along one axis of the matrix
17
was the legal structure of administration or ownership for the systems entities This axis is divided into 9 items ranging from various governmental arrangements to private business structures (heretofore referred to as ldquoAdministration or Ownershiprdquo) The second axis of the matrix refers to the primary mission of the system entities representing the commitment to provide a certain type of service above all others (eg a fire department may incorporate EMS care into its role of serving the public but the organization as a whole is first and foremost organized around fire suppression services) This axis is organized into six different organizational missions (heretofore referred to as ldquoPrimary Missionrdquo)
Systems classified their EMS agencies according to both axes and could indicate if a particular type of agency handled more than 50 of the overall call volume if more than one type of agency was recorded For presentation data were further reduced by collapsing categories on each axis A primary administrativeownership type and primary mission type for the system was assigned if either the respondent indicated a single cell of the matrix as the primary agency type or if all the agency types recorded fell only within a particular administrative or mission category The primary mission and administrationownership of agencies responsible forfirst response andtransport are summarized in Tables C1-C2 D1-D2 and E1-E2
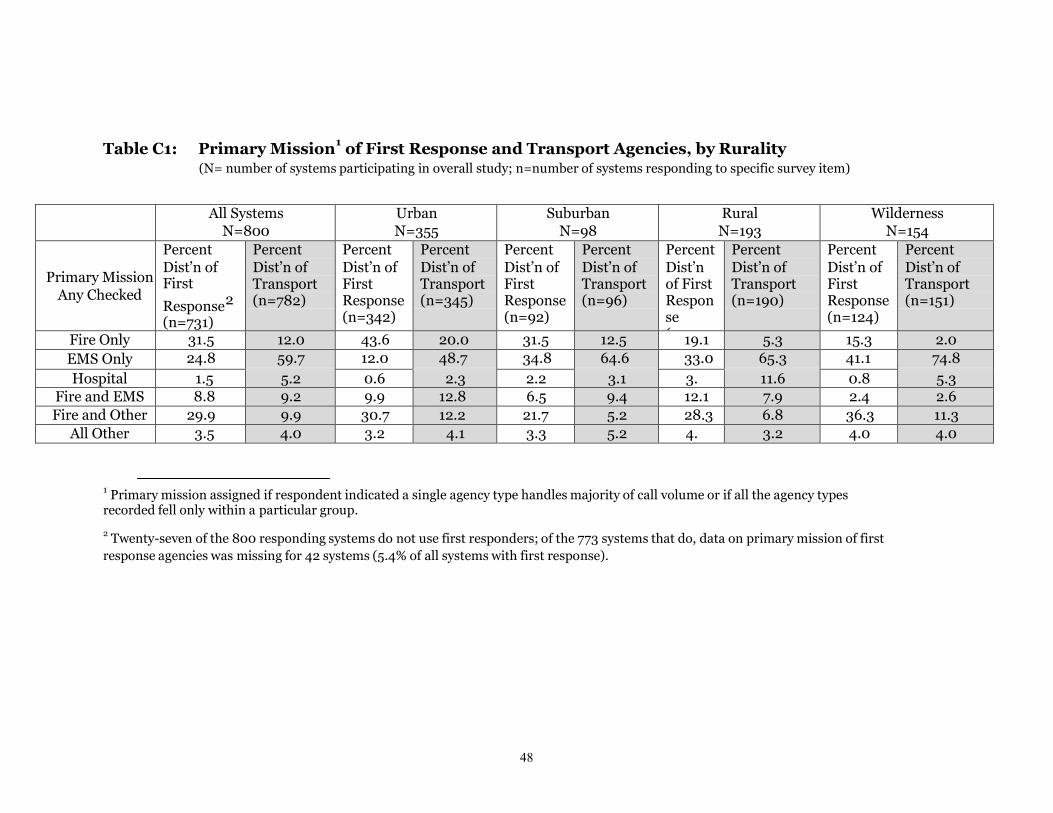
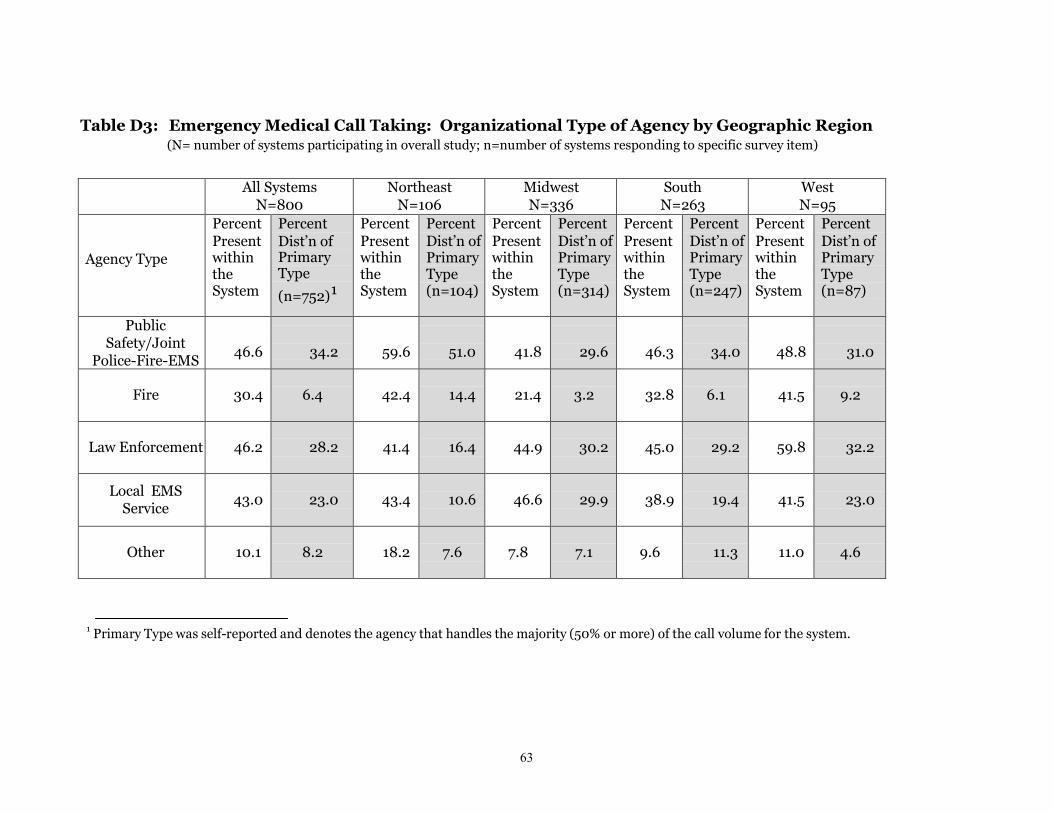
First Response Of the 800 participating systems 27 (33) did not use first responders Of those that did use first responders the primary mission of agencies providing first response varied across systems (315 fire only 248 EMS only 88 fire and EMS and 299 fire and other mission) while the majority of these systems (687) were administered strictly through State or local governments A chi-square test for differences in first response as a function of rurality was significant (χ2 = 9933 p lt 001) A larger percentage of the more urban systems had a primary mission of fire only whereas the more rural areas had a larger proportion of systems whose primary mission is EMS Only The relationship of primary mission by geographic region is less apparent but still statistically significant (χ2 = 2993 p lt 05)
Transport Agencies A majority of most systems (597) have agencies whose primary mission is EMS and 620 are administered strictly through State or local governments The percent of transport agencies with the primary mission of EMS only was higher in wilderness areas (748) compared to urban areas (487) and in the Midwest and South (603 and 657) compared to the West (567) and Northeast (462) (χ2 = 9217 p lt 001) The percentage of transport agencies administered strictly through Statelocal governments is significantly higher in the South (718) and Midwest (643) compared to the West (500) and Northeast (415) (χ2 = 8298 p lt 001) A higher percentage of agencies in the West are for profit (196) and a high percentage of agencies in the northeast are nonprofit (151)
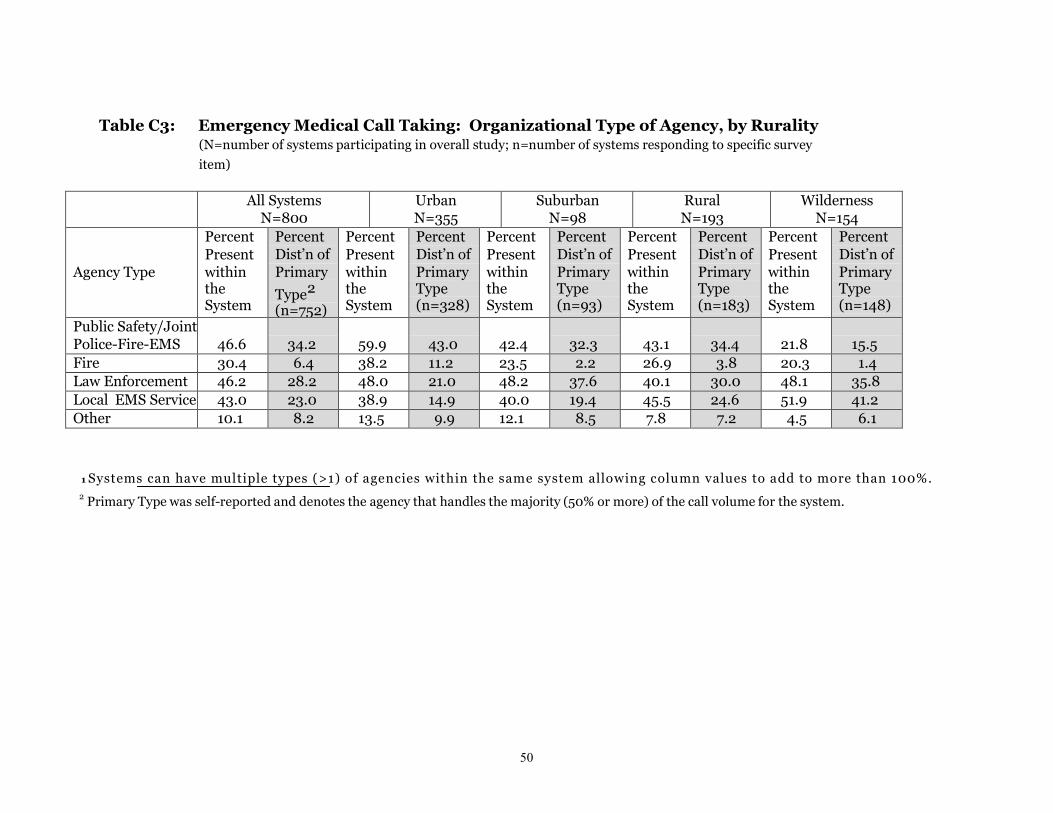
Emergency Call Taking As shown in Tables C3 D3 and E3 the primary type of agency that receives emergency calls varied across systems Over one third (342) were public safety (joint police-fire-EMS) 282 were law enforcement agencies and 230 were local EMS service providers) This distribution varied significantly by rurality (χ2 = 9082 p lt 001) with a higher percentage of urban systems handling emergency call
18
taking through public safety agencies (430 of urban systems compared to 323 344 and 155 of suburban rural and wilderness systems respectively) Administration of emergency call taking by local EMS services is more prevalent in the rural and wilderness systems (246 and 412 respectively) compared to urban and suburban systems (149 and 194 respectively)
Emergency Medical Dispatching Agencies responsible for emergency medical dispatching varied in a manner similar to emergency call taking (see Tables C4 D4 E4) Over all systems 398 listed their primary agency type as public safety (joint police-fire-EMS) and 372 were law enforcement agencies The chi-square that tested for differences in type of dispatching agency as a function of rurality was significant (χ2 = 9042 p lt 001) Far fewer wilderness systems indicated that the primary type of dispatching agency was public safety (234) whereas in urban areas a larger percent of dispatching agencies were public safety (456) Differences in agency type as a function of geographic region was also significant (χ2 =4961 p lt 001) Systems in the Northeast stood out as having more dispatch agencies administered through public safety (559) and a smaller percentage administered through law enforcement (186)
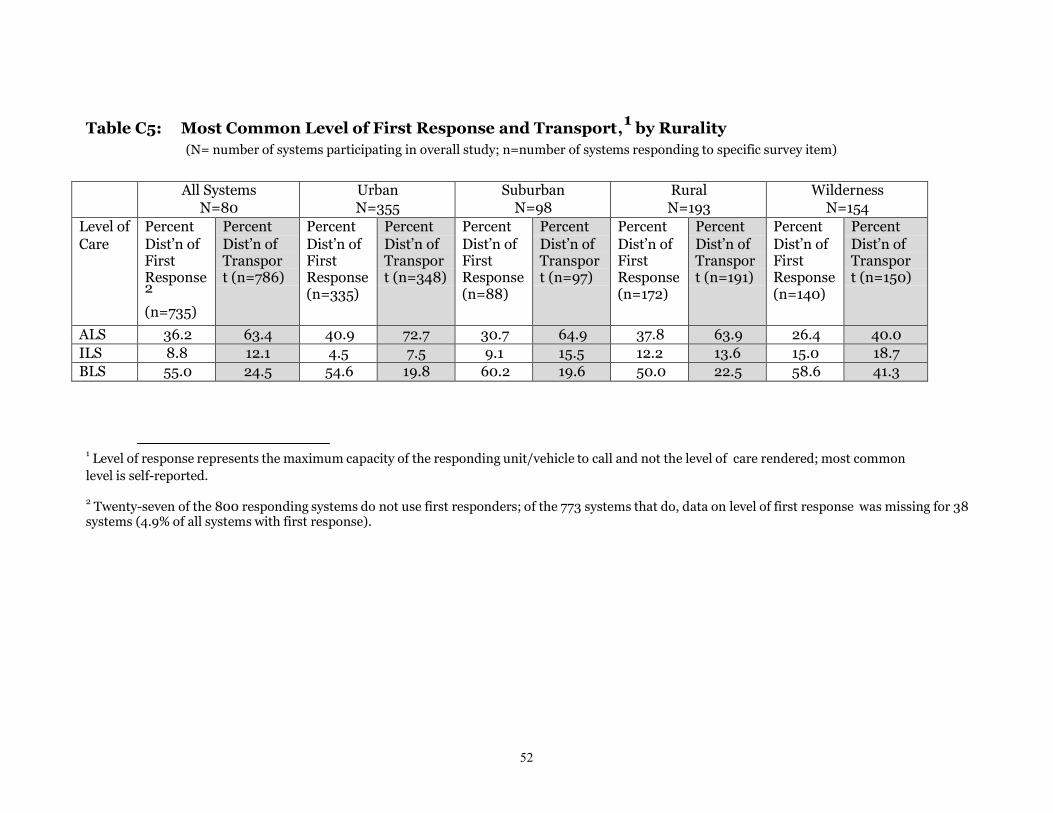
Level of Providers Nearly two-thirds (634) of the systems indicated that advanced life support (ALS) was the most common level of care provided by transport agencies (as defined by the maximum capacity of responding unitvehicles as opposed the actual level of care rendered) intermediate life support (ILS) was the most common levels of care for 121 and basic life support (BLS) for 245 of the systems Only 362 of systems indicated that ALS was the most common level of care provided by first response agencies (see Tables C5 D5 E5)
The most common level of care for transports varied significantly by rurality ( χ2 = 5221 p lt 0001) with a larger proportion of urban systems indicating ALS was the most common level of care (727) compared to wilderness areas (400) The level of care for transports also varied significantly by geographic region (χ2 = 8746 p lt 0001) a high percentage of agencies in the South (788) indicated ALS was the most common level of transport care (compared to 51-57 for all other regions)
Policies and Practices for First Response and Transport A little over one-half (549) of participating systems had a policy that sent first responders to all 911 calls (see Tables C6 D6 and E6) The chi-square statistics that tested for differences in having a policy as a function of both rurality and geographic region were significant (χ2 = 4996 p lt 0001 as a function of rurality and χ2 = 9767 p lt 0001 as a function of geographic region) The percentage of participating systems that had a policy that sent first responders to all 911 calls ranged from a low of 484 for urban systems to a high of 667 for rural systems and from 355 in the South to 712 in the West In the vast majority of systems (858) the most common practice was simultaneous first response and transport ambulance This percentage did not vary significantly by rurality or geographic region (χ2 = 1943 p=020 and χ2 = 2355 p=007 respectively)
As shown in Tables C7 D7 and E7 a large percentage of systems indicated that vehicles could respond to calls and transport patients without the use of lights and sirens (789
19
and 934 for response and transport respectively) with little variation in these percentages by rurality (χ2 = 115 p=076 and χ2 = 113 p=077 respectively) or by geographic region (χ2 = 435 p=023 and χ2 = 146 p=069 for response and transport respectively)
A far lower percentage (281) of systems indicated they allow providers to transport patients from the scene to non-hospital destinations although this percentage was higher in rural and wilderness areas (324 and 364 respectively) than in urban and suburban areas (224 and 276 respectively) (χ2 = 1269 plt001) Similarly the percentage of systems allowing dispatch of units to perform non-emergency assessment was low (374) and this practice was more common in the West (446) and South (456) compared to the Northeast (238) and the Midwest (334) (χ2 = 1989 plt001) The differences in the percentage of systems allowing dispatch of units to perform non-emergency assessment were not statistically significant (χ2 = 215 p=054)
As shown in Tables C7 D7 E7 513 of all systems indicated that all of their dispatch agencies offer pre-arrival instructions 290 indicated that some do and 197 indicated that none of their dispatch agencies offer pre-arrival instructions The percentage of systems that indicated that all of their dispatch agencies offer pre-arrival instructions varied significantly by rurality (χ2 = 7373 plt0001) this percentage was 613 for urban areas 592 for suburban 432 for rural systems and 331 for wilderness systems These percentages also varied significantly by geographic region (χ2
= 4320 plt0001) A higher percentage of systems in the Northeast (724) indicated that all of their dispatch agencies offer pre-arrival instructions compared to the rest of the country (4322 519 and 543 for the Midwest South and West respectively)
When asked how often the first response and transport agencies within the system responded to calls beyond the boundaries of their primary service areas 400 of the systems said their first response agencies responded sometimes or often to these calls 668 of the systems said their transport agencies responded sometimes or often (See Tables C8 D8 and E8) The frequency with which response and transport agencies within the system responded to calls beyond the boundaries of their primary service areas varied by rurality (χ2 = 1909 p lt 005 for response agencies and χ2 = 3749 p lt 0001 for transport agencies) with the major difference being that Wilderness areas indicated that their agencies responded to calls outside their jurisdictions less frequently (268 and 525 of first response and transport agencies respectively responding sometimes or often) The frequency with which response and transport agencies within the system responded to calls beyond the boundaries of their primary service areas also varied by geographic region (χ2 = 1966 p lt 005 for response agencies and χ2 = 5072 p lt 0001 for transport agencies) In the Northeast a larger percentage of systems indicate their transport agencies responded to calls beyond their jurisdiction sometimes or often (846 versus 640 for all other systems
Only one-third (337) of the systems indicated that other EMS systems responded to calls within their own jurisdictions sometimes or often The frequency with which other EMS systems responded to calls within their own jurisdictions varied significantly by
20
geographic region (χ2 = 3477 p lt 0001) but not by rurality (χ2 = 1378 p = 013) A larger percentage of agencies in the Northeast indicated that units outside their jurisdiction respond to calls within their system sometimes or often (524 versus 308 for all other systems)
Volunteer Versus Career Providers In over one-half (538) of the systems the primary type of provider (as defined by the provider type that represents 50 or more of all EMS personnel) was full-time career (see Tables C9 D9 E9) This percentage varied by rurality (χ2 = 10920 p lt 0001) and geographic region χ2 = 18575 p lt 0001) In only 296 of the systems in wilderness areas was the primary type of provider full-time career compared to 687 in urban areas In the South 800 of the systems reported full-time career providers as the primary type of provider compared to only 355 in the Midwest Across all systems the average percentage of all calls that are handled by volunteers was 380 this percentage ranged from 258 in urban systems to 356 in suburban systems 438 in rural system and 603 in wilderness systems A one-way ANOVA that tested for differences in percentage of calls handled as a function of rurality was significant F(3745) = 3295 p lt 001 Additionally Duncanrsquos multiple range test showed that these values differed significantly Only a small percentage (144) of volunteers typically responds to calls from fire or EMS station houses
911 System Access and Timely Response to Incoming Calls In nearly two-thirds (652) of the systems the highest level of 911 access was reported as wireless E911 (Tables C10 D10 and E10) Access via wireless E911 varied by rurality ranging from 723 and 755 in urban and suburban systems respectively to 573 and 517 in rural and wilderness systems respectively (χ2 = 2948 p lt 001) In wilderness areas the highest level of 911 access was wireless 911 in 153 of systems E911 in 228 and Basic 911 in 101 In only 574 of systems in the West had Wireless E911 compared to 668-695 in other geographic regions of the country although these differences were not statistically significant (χ2 = 366 p =030)
More than half (558) of the systems indicated that there were locations within their service areas that made timely responses problematic (see tables C11 D11 and E11) There was no significant variation in responses to this item by rurality (χ2 = 664 p = 016) although a significantly lower percentage of systems in the Midwest indicated timely response is a problem (444) compared to all other regions (641) (χ2 = 3095 p lt 0001) The primary factors associated with the lack of timely response were remote or distant geographic areas (564 systems listed this as the primary reason) and inadequate daytime staffing (262) Responses varied by rurality and geographic region Only 190 of regions in the Northeast listed remote areas as the primary reason compared to 445 of Midwest regions 745 of regions in the South and 776 regions in the West In the Northeast a larger percentage of systems listed daytime staffing as the primary reason (compared to 375 in the Midwest 134 in the South and 82 in the West)
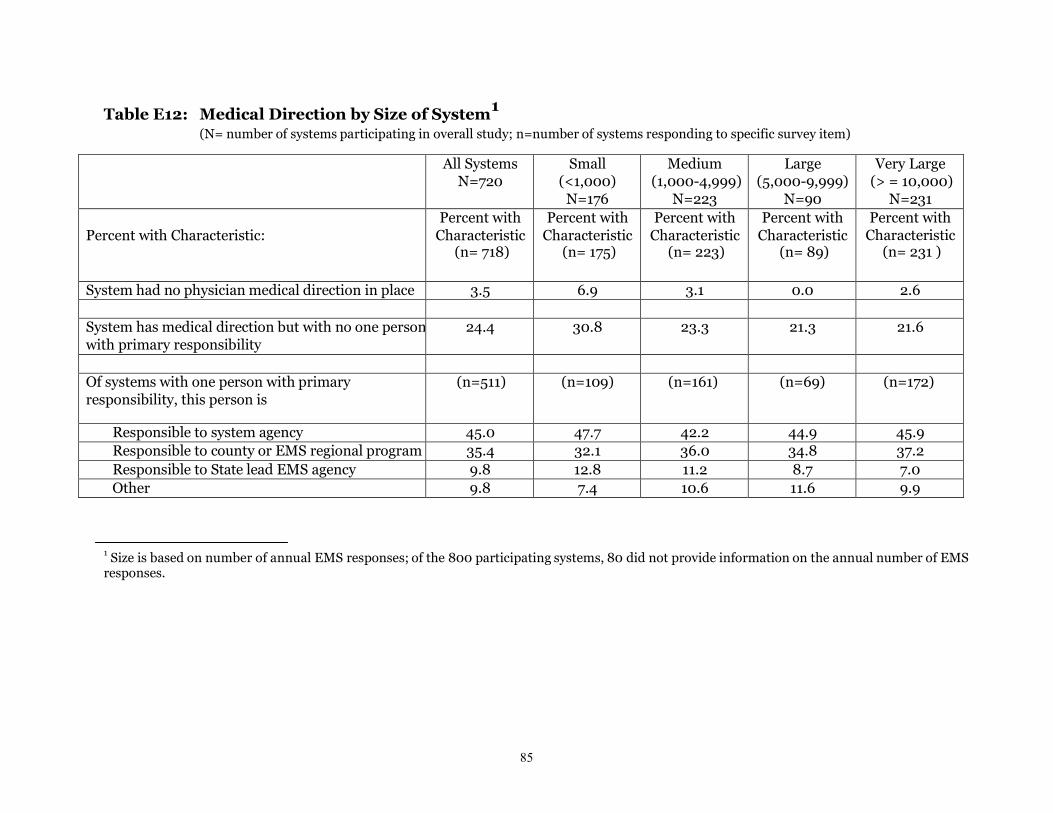
Medical Direction As shown in Tables C12 D12 and E12 almost all systems (959) had some physician medical direction in place although 256 of all systems had no one
21
person with the primary responsibility of overseeing medical direction A higher percentage of rural and wilderness systems (371 and 329) had no medical direction in place or medical direction with no one person with the primary responsibility) compared to urban or suburban systems (268 and 204) (χ2 = 1086 p lt 002) A higher percentage of systems in the Northeast and Midwest (438 and 347) had no medical direction in place or medical direction with no one person with the primary responsibility) compared to systems in the South and West (210 and 202) (χ2 = 2705 p lt 001)
Of those with one person with the primary responsibility of overseeing medical direction 449 of the systems indicated this person was responsible to the system agency 348 to the county or EMS regional program and only 103 to the State lead agency
System Financing We asked participants to think of their systems as a whole and indicate how EMS was financed They were asked to indicate which funding sources were present at all and to indicate the primary source of funding All systems tapped into a wide variety of funding sources as shown in tables C13 D13 and E13 Most systems indicated that fees for services and tax subsidies (at the State county or local level) were the primary types of funding for EMS (534 and 411 of systems respectively) These percentages did not vary significantly geographic region (χ2 = 715 p = 007) However rural and wilderness areas had a slightly higher percentage of systems indicating fees for services as their primary source of funding (618 and 574 respectively) compared to urban and suburban systems (480 and 506 systems respectively) (χ2 = 910 p lt 005)
C4 System Outlook by Characteristics of Systems
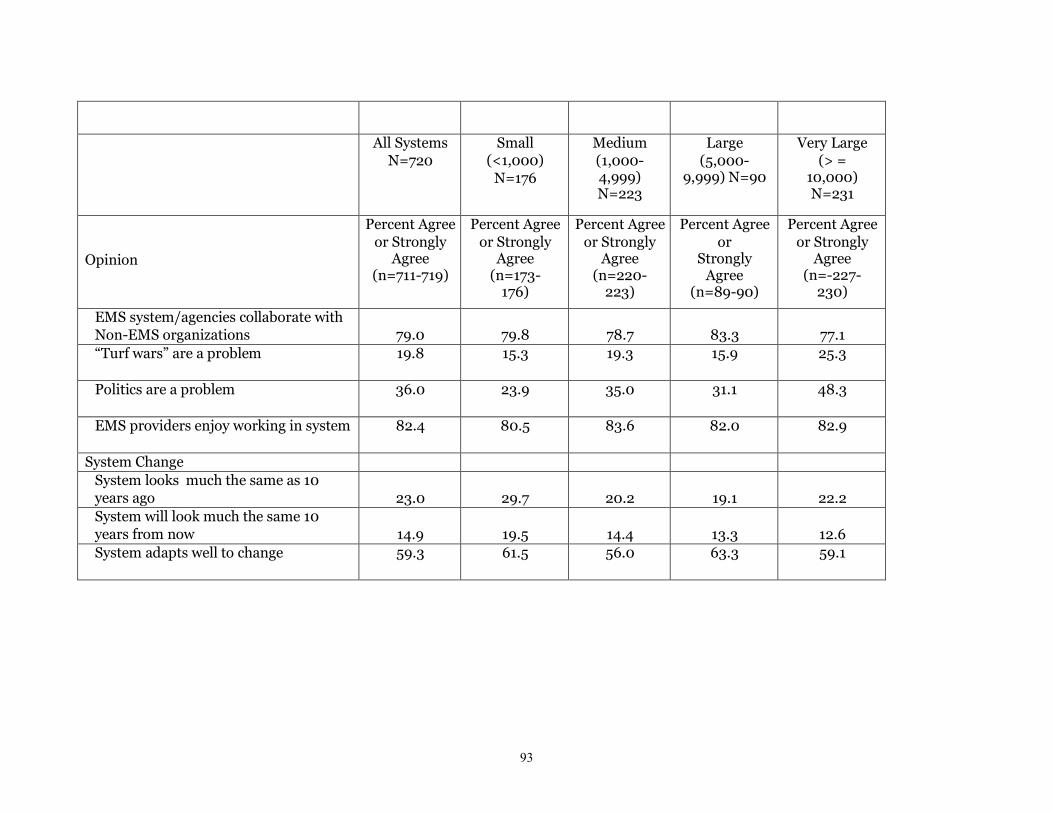
As described in the Methods above we asked participants to indicate the extent to which they agreed or disagreed with 16 statements designed to illicit their judgment as to the level of resources present in their system the extent of public participation the degree to which there is support of the system among physicians hospitals and non-EMS organizations the extent to which turf wars and politics are a problem for the system and the extent to which they feel the system adapts well to change The responses to these items are summarized in Tables F1 (by rurality) F2 (by geographic region) and F3 (by size of the system)
We performed a principal components analysis (PCA) to explore the extent to which the 13 of the 16 opinion statements clustered together to define independent factors (note we excluded 3 items from the PCA Item 23m EMS providers enjoy working within our EMS system Item 23n Our system looks much the same as 10 years ago and Item 23o Our system will look much the same 10 years from now)
The initial principal components analysis identified four independent factors with Eigen values greater than 10 (See Table F4) Together these four factors explained 58 of the variance An orthogonal transformation yielded four simple factors that were easily interpretable and appeared to measure different constructs (see Table F5) These four
22
factors were used to derive four factor-based summary scores (by adding the responses to the items in each factor (values range from 0 to 4) dividing by the number of items in that factor and standardizing to a 0 to 100 scale
The items included in each of the four factors are as follows
Factor 1 (System Support) 23g Our system has a high level of physician involvement 23h Hospitals in our systems are supportive of our EMS agenciesproviders 23i Patient handoffs between agencies and hospitals are generally smooth 23j Our EMS system participating agencies collaborate well with non-EMS organizations Factor 2 (System Resources) 23a Our system is adequately staffed to meet demand 23b Our system has enough resources (vehicles equipment) to meet demand 23c The population served by our system has a high level of EMS awareness participation or support Factor 3 (System Politics) - both items were reversed scored 23k ldquoTurf Warsrdquo are a problem for our EMS providers 23l Politics area problem within our EMS system Factor 4 (Bystander Action) 23d Defibrillators available for public access can be found in many public places without our system 23e Bystanders often provide CPR prior to EMS arrival at cardiac arrest calls
Two additional items dropped out of the four-factor model as they were correlated with more than one factor these items were analyzed as separate (binary) items
23f Public Satisfaction The public is satisfied with our EMS system 23p Adapts to change Our system adapts well to change
Mean item scores are summarized by rurality geographic region and size of the systems in Table F6
Summary of Subjective Assessments Overall and by Rurality Geographic Region and Size of the System Results are summarized here for each of the four main factors identified by the principal components analysis
System Support Most respondents (788) agreed or strongly agreed that hospitals in the system are supportive of the EMS personnel and agencies (See Table F1) A lower percentage of systems were satisfied with the level of physician involvement only 570 of respondents agreed or strongly agreed that their system had a high level of physician involvement Most respondents were positive with regard to collaboration with non-EMS organizations (774 agreed or strongly agreed that the EMS system collaborates with non-EMS organizations) Over three-quarters of the respondents (892) agreed that the flow of patients through the system is generally smooth The overall summary scores for System Support (715 on a scale from 0 to 100) did not vary significantly by
23
24
rurality (F(3771) = 148 p = 022) or by geographic region (F(3771) = 076 p = 052) but did vary by system size (F(3696) = 266 p = 005 Duncanrsquos multiple range test revealed there was a tendency for support to be higher for larger systems (5000 ndash 9999 calls and more than 10000 calls) versus smaller systems (less than 1000 and 1000 ndash 4999 calls) System Politics ldquoTurf warsrdquo were noted as a problem for less than one-fifth of the systems (198) Politics were noted as a problem for 361 of the systems (See Table F1)The overall summary score for System Politics (589 on a scale from 0 to 100) varied significantly with rurality (F(3788) = 1337 p lt 0001) geographic region (F(3788) = 835 p lt0001) and size of the system (F(3712) =1030 p lt0001) Duncanrsquos multiple range test indicated that the larger systems (10000 or more calls) were significantly more likely to report politics as a problem when compared to two of the other size groups (less than 1000 calls and 5000 ndash 9999 calls) Similar testing revealed that systems in urban and suburban areas as well as systems in the Northeast were significantly more likely to indicate that systems politics were a problem than all other groups
Resource Levels Only 423 of respondents across all systems agreed or strongly agreed that their systems had adequate staff to meet demand 622 agreed or strongly agreed they had adequate resources (vehicles equipment) to meet demands (See Table F1) Although 787 of the respondents agreed that the public is satisfied with EMS services most felt the public did not have a high level of awareness of the system (ie only 393 agreed or strongly agreed that the population served had a high level of EMS awareness participation or support) The overall summary score for System Resources (546 on a scale from 0 to 100) varied significantly by geographic region (F(3781) = 537 p lt 001) systems located in the South scored significantly lower (fewer resources) on the summary score for System Resources according to Duncanrsquos multiple range test There were no significant differences in opinions regarding system resources by rurality (F(3781) = 075 p = 052) or by size of the system (F(3706) = 055 p = 065)
Bystander Involvement Defibrillators could be found in many public places in 552 of the systems The percentage of systems in which bystanders often provided CPR prior to EMS arrival was low (363)The overall summary score for Bystander Action (542 on a scale from 0 to 100) varied significantly with rurality (F(3784) = 741 p lt 0001) geographic region (F(3784) = 980 p lt 0001) and size of the system (F(3710) = 704 p lt 0001) Duncanrsquos multiple range test showed that scores were significantly lower (lower bystander action) in wilderness areas when compared to all other rurality categories Similarly systems in the West were more likely than those in the Northeast and Midwest regions to have lower scores and smaller systems (less than 1000 calls and 5000 ndash 9999 calls) collectively had significantly lower scores than larger systems
Few respondents (235) agreed that their systems looked much the same as 10 years ago and even fewer (152) agreed that their systems will look much the same 10 years
into the future In contrast a majority of respondents (584) agreed or strongly indicated that their systems adapt well to change
Regression Analysis Multiple linear regressions were used to model the factor-based Summary Opinion Scores by rurality geographic region primary mission of the transport agency primary administrationownership of transport agency primary funding source for the system presence of medical direction with a single person responsible and the average percentage of providers in the system that are volunteer Regression coefficients are reported in Table F7 The two dichotomous opinions regarding ldquopublic satisfactionrdquo and ldquosystem adapts well to changerdquo were modeled using logistic regressions and adjusted odds ratios reported (Table F7) All independent variables were included in the models as categorical variables and the value of each variable used as the reference category denoted by REF in Table F7
The regression analyses confirmed most of the patterns noted above (regarding rurality and geographic region) and identified other factors that were associated with the subjective assessments of the respondents
It is worth noting that the only factor that was significant in predicting positive perceived system support was the presence of a single person with the primary responsibility of overseeing medical direction (b-coefficient = 439 p lt 001) having a single person responsible for medical direction was strongly and positively related to system support No other variables in the regression were significantly related to the summary opinions regarding system support
Rurality was a significant predictor of several opinion measures Compared to being from an urban system being from a wilderness system was significantly associated with lower perceived adequacy of resources (b-coefficient = -529 p lt 005) lower bystander action (b-coefficient = -1070 p lt 001) and lack of systems politics (b-coefficient = 1150 p lt 001) Being from a rural system (compared to an urban system) was also predictive of the lack of system politics (b-coefficient = 633 p lt 005)
Geographic region was a significant predictor of all the opinion measures Compared to systems in the Northeast systems in the Midwest scored higher on lack of system politics (b-coefficient = 714 p lt 005) and lower on bystander action (b-coefficient = -546 p lt 005) Systems in the South scored significantly lower on both adequacy of system resources (b-coefficient = -627 p lt 005) and bystander action (b-coefficient = -1360 p lt 001) Systems in the Northeast scored significantly higher on Bystander Action than all other systems (all coefficients are negative and significant at p lt001)
The odds that respondents rated pubic satisfaction as high was 270 (p lt001) and 250 (p lt005) times greater for systems in the Midwest and West compared to systems in the Northeast Systems in the Northeast were less likely to report they adapt well to change compared to systems in the Northeast the odds of systems reporting they adapt well to change was 259 (p lt 001) for systems in the Midwest and South and 270 for systems in the West (p lt001)
25
Primary Mission of the Transport Agencies in the system was predictive of only the publicrsquos satisfaction with EMS with the odds of reporting high satisfaction 043 less for systems that were labeled as ldquootherrdquo compared to those that were ldquoEMS Onlyrdquo The types of agencies falling into the ldquoother categoryrdquo included hospitals based services law enforcement and public safety agencies as well as systems with agencies operating under a variety of organization missions (ie no primary mission) The Administration of the Transport Agency was also associated with Public Satisfaction (p lt 005) with the odds of reporting high satisfaction 058 less for systems that wereldquo ldquofor profit or otherrdquo compared to those that were administered through State or local government Systems whose primary transport agencies wereldquo ldquofor profit or otherrdquo also scored lower on the Lack of System Politics ie they were more likely to indicate system politics were a problem when compared to systems administered through State or local government (b-coefficient = -548 p lt 005)
The percentage of providers who are volunteers was highly predictive of the adequacy of system resources (b-coefficient = 512 p lt 001) level of bystander action (b-coefficient = 296 p lt 005) public satisfaction with EMS (adjusted odds ratio =238 plt001) and ability to adapt to change (adjusted odds ratio=196 p lt 001) In each case systems with fewer volunteers (50 or less of system staff) indicated positive summary ratings for these four system outlook factors Perceived system support and system politics were not associated with level of volunteer staffing (b-coefficient = 512 p gt 010 for system support and b-coefficient = 149 p gt 010 for lack of system politics)
D Summary and Discussion
D1 Summary and Interpretation of the Results
EMS systems are configured differently depending on several factors including the size organization demographics and geography of the local communities they serve Although some information exists about the organization financing and delivery of EMS in 200 of the nationrsquos largest cities (16) this information is incomplete and does not provide any information on how services are organized outside large urban areas in which 75 of the nationrsquos population resides Even less is known about how different EMS configurations impact the effectiveness and efficiency of service delivery
Without the capability of determining what characteristics of EMS systems are most effective and efficient NHTSA is unable to establish guidelines for EMS best practices that EMS providers may use to assess and ultimately improve their performance Furthermore efforts at health care reform have underscored the importance of demonstrating how critical differences in the inputs and processes of health care delivery impact system performance and patient outcomes Every sector of health care including EMS is being challenged to demonstrate the value of services provided and to make head to head comparisons of alternative services and systems of care Figure 6 presents a model that summarizes how these inputs and processes of EMS care may affect system outputs and patient outcomes
26
Inputs
Environment Geographic
Access Population Density
Call Volume
Processes
Response Processes
911 Access First Response Ambulance Dispatch Production Method -
Screening Refusal Full Service or Not
Staffing Patterns Deployment Unit Hour Utilization
Outputs
Outcomes
bull
-------
Response Time Reliability Clinical Quality Transport
Survival (Mortality) Morbidity
Structure Standards Accountability
Economic legal Political
Clinical Processes
Bystander Action Pre-arrival Instructions
First Response Ambulance Service Online Medical Direction Hospital Interface Customer Service
Figure 5 A conceptual model of EMS quality
27
Adapted from A study of the political and economic obstacles to improvement of emergency medical service systems Stephen Dean unpublished dissertation 2004
An important first step in making head-to-head comparisons and understanding what components of EMS systems work well is the development of a characterization of system structure (inputs) and processes so that systems can be evaluated on a common basis This study was designed to develop such a characterization of EMS systems around the country The development of the characterization may also assist in establishing a common EMS language and provide the basis for tracking progress in the development of EMS systems into the future The need for these data has never been more critical In its efforts to better prepare for mass casualties and disasters the nation must have a better understanding as to how EMS systems are organized and delivered at the local level so that these services are appropriately integrated in to an overall systems response capability
Much of the existing information about local EMS system design across the nation is anecdotal incomplete or drawn together from national or State level resources However a few key previous efforts provided a knowledge base that helped shape and allow comparisons with the current project These efforts include the following
bull For more than two decades the 200-City Survey (16) published annually by the Journal of Emergency Medical Services characterizes individual EMS agencies (specifically agencies responsible for first response andor transport) in Nationrsquos 200 most populous cities The 200-City Survey has varied its focus on specific topics over the years but issues related to system design including first responder and transport provider types and response configurations have been part of this annual effort While the survey continues to be a valuable resource for evaluating the urban EMS landscape it does not provide insight into rural areas of the country and has limitations in both its scope and response rate In the most recent survey 455 leaders of first responder and transport agencies were asked to participate in an online survey consisting of 118 questions only 97 (213) of those surveyed completed the survey Although this represents 97 (485) of the 200 largest cities in the United States the response rate remains low making it difficult to generalize beyond the sampling frame
bull In an effort to assess the complex EMS landscape and identify priority areas for improvement Mears (17) gathered extensive information about State and local EMS structures and functions in a survey of State EMS offices The survey had a 100 response rate (although not every respondent answered every question) and provided an accounting of local systems personnel resources and procedures The results indicated wide variation across the country as a whole and the author acknowledged the challenges in system comparison stemming from the differences in definitions used by States The data collected by Mears originated at the State level and provided valuable information although not directly from a local perspective Additionally this effort calculated the number of EMS systems using a definition most commonly resembling individual provider agencies
bull The Federal Interagency Committee on EMS (FICEMS) recently sponsored The National EMS Assessment (18) which is a comprehensive effort to describe EMS
28
throughout the United States using existing data sources Using data primarily from the NASEMSO 2011 Industry Snapshot and National EMS Information System (NEMSIS) (wwwnemsisorg) along with feedback from expert panels the report provided an accurate portrayal of EMS in the United States and identified areas for improvement in data systems (19) Key recommendations from the Assessment included the creation of data systems that adequately differentiate rural and urban areas and uniform definitions associated with EMS agencies and volunteers to promote data aggregation and analysis at the national level The Assessment tallied the number of EMS agencies nationally and showed variation in the size of the smallest geographic service areas recognized by States for licensure of EMS agencies Regarding regionalization of EMS services only 20 of States credential systems comprising multiple EMS agencies functioning together in a given area
bull In 2006 and 2007 with funding from the Federal Office of Rural Health Policy the North Carolina Health Research and Policy Analysis Center conducted a survey of 2500 local EMS directors The survey was distributed by mail to a stratified (based on rurality) random sample of local community-based EMS agency directors derived from a list of licensed EMS agencies maintained by the National Association of EMS Officials Surveys were received from 1425 (572) EMS directors across 47 States The survey identified interesting findings between metropolitan and non-metropolitan entities with regard to general characteristics (20) and medical direction (21) However the final number of respondents represented less than 10 of the list from which it was originally drawn so generalization is again problematic
Comparison with Other Studies Findings of the current study align with several key conclusions of the previous efforts The National EMS Assessment (18) indicated ldquoThere is a wide variation in how EMS Agencies are definedrdquo and ldquothere does not appear to be a common political boundary used for EMS system credentialingrdquo Results from the present study support these conclusions The National EMS Assessment also revealed that only 10 States credential EMS systems composed of multiple EMS agencies and the authors questioned if regionalization of pre-hospital care may take another form in States that do not credential or license EMS systems One might argue that the operational definition used as part of the present study represents such a form of regionalization as a matter of practice if not exclusively based on licensing or credentialing processes
Due to differences in definitions and study design it was not possible to make a direct comparison between our study and the National EMS Assessment with regard to organizational types However our study of EMS systems reflected roughly similar ratios regarding the organizational types reported for agencies in the National EMS Assessment Overall 312 of the transport agencies in our study had a single or dual organizational mission associated with the fire service compared to 40 in the National EMS Assessment Comparing our study to the National EMS Assessment similar percentages were found for hospital-based agencies (52 versus 6) and EMS Only (non-hospital non-fire) agencies (597 versus 46) The National EMS
29
Assessment indicated that half (51) of licensed agencies function at the EMT-Basic level and 38 function at the EMT-Paramedic level This is consistent with our findings for first response systems (ALS 362 BLS 550) but not for level of response for transport (ALS 634 BLS 243) This difference was surprising since we expect first responders to be largely basic life support saving more limited ALS resources for transport However this contrast could be the result of evaluating first response and transport separately or other measurement differences between the two studies
Freeman et al (20) noted that a higher percentage of urban EMS organizations were part of the fire department In contrast the authors note that free standing and hospital based organizations tended to be from rural areas These findings align quite well with our data Additionally Freeman and colleagues noted that metropolitan entities reported higher levels of use of ALS and ILS providers as opposed to their non-metropolitan counterparts This finding is consistent with our study as well increased levels of urbanicity were associated with increased use of ALS in response for transport
The annual JEMS 200-City Survey is still the most comprehensive and well-known assessment of urban EMS issues to date although it has limited generalizability to the nation particularly with regard to rural and wilderness areas The following is a list of comparisons between our data and the last several years of this JEMS effort (16 22-25)
bull The last five iterations (2007-2011) of the JEMS survey consistently showed that private companies and the fire service were the top two providers of transportation services and often close in percentage of respondents Our data support the finding that both fire and private organizations play a significant role in providing transportation services However our data indicate a slightly larger role for the non-fire governmental (third service) organizational type in the urban setting This may be in part due the operational definition of a local EMS system used for our study (ie our systems often extend beyond the borders of a single city)
bull The 2008 and 2009 releases of the survey stated that fire departments were the primary organizations for providing emergency medical dispatch with public safety organizations ranking second Our data suggest that although the fire department is providing such services in nearly 40 of urban systems its role as the primary dispatch organization type lags far behind public safety and law enforcement organizations This difference in finding may also be due to the use of a local system definition that often extends beyond the borders of a single city
bull There was a high degree of correspondence between the current results and the JEMS data with regard to first response services The fire department is the provider of the majority of first response services in our survey (842) and the 2008 JEMS survey (946) The 2008 and 2010 JEMS surveys noted that nearly half of responding cities (464 and 474 respectively) still send first responders to all 911 calls This practice was observed in 484 of urban systems participating in our study Sending first response and transport vehicles simultaneously was reported by 789 of cities in the JEMS 2007 survey while this percentage is 861 in our study
30
bull The 2007 JEMS report noted that 504 of cities respond to calls with ALS first response and ALS transport and 427 respond with BLS first response and ALS transport Our data indicate that BLS is the most common level of first response (reported by 546 of responding urban systems)
bull The JEMS 2008 annual survey reported that 564 of cities respond to calls with lights and sirens only in instances where the patient is believed to be at risk of death (with 355 of cities responding to every call with lights and sirens) Our data show that a higher percentage of EMS systems have the ability to respond to calls without lights and sirens (798 of urban systems) and transport without lights and sirens (943 of urban systems) These numbers were universally high in our study group regardless of rurality These high percentages however may reflect the policy as opposed to what actually happens in practice
An overwhelming majority (915) of respondents to the 2011 JEMS survey agreed or strongly agreed that their local EMS systems were integrated into the greater healthcare system This was up from 650 of respondents in the 2008 survey when half of the respondents indicated formal partnerships with public health or social services organizations Our study shows that systems (across levels of rurality) generally agree that there are high levels of physician involvement hospital support smoothness of patient handoffs and collaboration with non-EMS organizations
Variations Within and Across States A formal analysis of differences across States was not possible in this study primarily due to variations in response rates However given our knowledge about responding systems and States as a whole it is reasonable to infer that many potential variations exist The National EMS Assessment (18) noted that the number of EMS agencies per State ranges from 7 to 1555 and that a majority of States credential multiple categories of agencies (by level of service organizational type) vehicles and personnel Additionally variations within a State would be expected to result from geographic demographic and political differences Our data indicate that variations within States exist more broadly but more importantly are exhibited across groups such as rurality and even at the individual system level (ie many respondents checked multiple categories for questions where prompted to ldquocheck all that applyrdquo)
Variation across States is a ubiquitous theme in EMS and is well supported by documents such as the National EMS Assessment States have evolved quite differently in how they handle the oversight of EMS With such contrasting approaches in State regulation and policy along with differences in overall size demographics and geography it is not surprising that we see variability in our data across these States As part of this study representatives from State EMS offices were interviewed providing information on how States were organized and where responsibility for various EMS system functions was held Figure 1 shows that functions are often addressed at multiple system levels and the percentage of States indicating responsibility for a particular function at any given level varies widely In the broadest terms the most obvious difference noted is how each State related to our operational definition of a local EMS system to itself Table B1 establishes that States choose to organize local emergency medical services coordination in a variety of ways from hospital-centered models to county based systems to larger regional entities We did find sizeable differences by
31
rurality system size and census region all of which are related in many ways to how States are organized Below we discuss our results in the context of rurality
Variations by Rurality EMS has developed very differently throughout the country based on varied histories economics policies and local needs Perhaps the most pronounced demarcation of such differences is with respect to the rurality of a systemrsquos service area Urban suburban rural and wilderness area vary greatly with regard to population demographics industry and economics Such diversity has led to equally varied expectations of an EMS system within those areas
A report by National Conference of State Legislatures (26) noted four sweeping dynamics from the Federal Office of Rural Health Policy (OHRP) that have wide impact on rural EMS issues These include 1 low population density and large geographic areas that raise the cost of providing EMS 2 State and local governments have lower capacity for funding through a tax base 3 difficult economies in these areas have challenges in maintaining public services and managing change and 4 rural areas have less volume and profit potential to lure private EMS services to their region Priorities for rural and wilderness EMS systems continue to center around recruitment and retention (including the role of volunteers) reimbursement and subsidization and medical oversight (27)
In urban areas systems are likely to have higher call volumes use volunteers less frequently support greater use of a tiered response structure and non-response vehicles rely more on increased non-emergent use and have a more developed administrative structure (28) Additionally we expect that urban EMS systems would have a high representation from fire-based organizations as opposed to freestanding or hospital-based in other settings (16 20) Rural jurisdictions often must rely on volunteer personnel have longer response times face high personnel turnover and service coverage issues lack quality medical direction and may lack access to advanced prehospital care Further these areas often encounter greater financial constraints and sometimes even lack the infrastructure needed to ensure complete public access to the emergency care system (4 27 and 29) This is particularly important for medical oversight where recruitment of a dedicated medical director can be particularly difficult (21) Additionally in urban and suburban areas where multiple agency types are used the need for improved coordination and integration among disparate agencies increases (30)
When evaluated by level of rurality our data support many of the differences noted above The mean number of EMS responses was significantly higher for more urban systems and the use of volunteers was higher for systems that were more rural It was not surprising to find that the primary organizational missions for first response and transportation agencies were mostly fire-based in urban systems while an ldquoEMS onlyrdquo mission was more prevalent in more rural areas When it comes to both call taking and dispatching agencies combined public safety agencies (police fire and EMS) have a larger role in urban settings as opposed to more rural systems Our findings seem reasonable when considering first response transport call taking and dispatch entities Specifically urban systems are often larger have a greater tax base to draw from and
32
have robust and well sized agencies from which to draw economies of scale It is also not surprising that urban systems report a higher prevalence of response configurations that involve advanced life support units for the same reasons
In rural and wilderness systems sending first responders to all calls is a more prevalent practice likely due to lower volumes overall (less possibility of taking away a resource from a higher priority) as well as the need to deliver resources for the most emergent cases over greater distances more quickly We expected to find greater differences in the prevalence of responses and patient transports without the use of lights and sirens but the results indicate the distribution of each was relatively flat (and present in a sizable percentage of systems) when examining variations by rurality However a higher percentage of more rural systems reported having a policy that allowed for non-hospital destinations for transport (not related to interfacility services) This finding was expected and particularly important when considering that more rural areas often have less access to acute care facilities Given this fact it was intriguing that the ability to dispatch units to conduct non-emergency assessments did not vary significantly by rurality More urban systems reported higher rates of having all of its dispatch agencies providing pre-arrival instructions which may be due to having a greater number of NAEMD accredited or technically sophisticated dispatch agencies
When considering career versus volunteer EMS personnel urban and suburban systems predictably had higher levels of full time career providers when compared to rural and wilderness systems Similarly the percentage of personnel operating in some capacity as a volunteer as well as the percentage of calls handled by volunteers was substantially higher in the more rural systems Such findings were not only in line with expectations but also convincingly demonstrated how crucial volunteer participation is to sustaining EMS operations in more remote areas
The technological sophistication of public access to the EMS system differed significantly by rurality This is an important issue for more rural areas and our data indicate this difference to be largely dependent on the availability of wireless E911 access It is notable that despite this variation nearly 90 of wilderness systems and over 95 of rural systems still provided access through at least enhanced 911 technologies
There are nominal differences by rurality when evaluating consistent response problems Remote and geographically distant areas as well as daytime staffing were consistently the top two difficulties cited by systems among all rurality levels although remote areas are far and away the most prevalent concern in wilderness areas
One of the most pressing issues for rural and wilderness EMS is medical direction Our data indicate that a higher percentage of rural and wilderness systems either did not have a dedicated medical director in place or did not have a single person responsible for fulfilling that role Furthermore rural and wilderness areas report a lower level of physician involvement (as measured by respondent opinion) These are in line with the findings of Slifkin et al (21) and likely caused by the difficulties in recruiting a medical director including a lower availability of physicians the lack of desire for providers to
33
take on such a role as well as less available funds to pay for these services While more urban systems are often larger and use ALS to a greater extent the need for rural medical direction remains vitally important to system leadership and operations
There were few differences by rurality when considering the primary mechanism for system finance Rural and wilderness systems rely more heavily on fees and billing for service than suburban and urban systems This finding is not surprising given such areas often have less of a tax base from which to draw System resources particularly staffing were reported to be adequate more frequently in less rural systems based on respondent opinions EMS agencies often feel significant financial pressures regardless of location although these challenges are particularly pronounced in rural and wilderness areas Call volumes are low and amount of geography to cover is high making the cost of providing emergency medical services an expensive proposition The financing of EMS which is largely related to the cost associated with standby capabilities does not translate well to a bill for service model in rural areas which typically pays only for transported patients and often at a lower rate than in urban settings These circumstances further compound the difficulties of attracting private services to a given area and intensify the need to rely on volunteer personnel
Perception of bystander action (ie availability of defibrillators and bystander provision of CPR) is lower in more rural areas likely due to lower population densities and less feasibility in implementing public access defibrillation programs Systems in rural and wilderness areas are less likely to report that system politics and turf wars are a problem And while two-thirds of all respondents (regardless of rurality) indicated they feel they had enough resources (as measured in terms of vehicles and equipment) to meet demands a significantly lower percentage of rural and wilderness systems agreed that their systems were adequately staffed to meet demands A high percentage of systems (regardless of rurality) agreed that the public is satisfied with EMS services
D2 Implications of the Study Results and Future Application to NEMSIS
Following a surge of activity in the 1960s and 1970s Federal support of EMS systems has steadily declined leaving State and local governments to take the lead in program development and system design This shift created a fragmented system of care nationwide and continues to promote regional and local approaches to system design (4 33)
Given this fragmentation local EMS systems are complex entities and difficult to describe in a uniform manner Some systems are small and others large encompassing disparate geographic areas and populations Some systems are rigidly tied to well-defined political boundaries and others are defined by a vaguely defined catchment area for a particular hospital At opposite ends of the spectrum are North Carolina which defines (through regulation) the minimum service area of an EMS system to be one county and States such as Idaho where some areas are organized at the county level while others have active EMS agencies with less than county-wide coverage andor no centralized authority Very large land areas such as the region-based systems in Texas are difficult to classify with regard to demography and geography irrespective of the
34
EMS being provided As Mears (17) convincingly stated ldquoThe definition of an EMS system varies from State to State which makes any analysis of EMS systems impossiblerdquo This study attempted to standardize the definition of an EMS system to promote more fluid analyses but in doing so we may have created artificial boundaries for any given system
Notwithstanding this limitation it is abundantly clear that within a local system as we have defined it there is significant variation in how services are organized and delivered Even within a single countywide system fire departments private agencies government and volunteer organizations may all be providing services at a variety of levels in a multitude of ways EMS can vary from town to town even within a highly organized system
This variation is not inherently inappropriate although it raises important questions about the effectiveness and efficiency of alternative approaches These questions cannot be addressed in this study Opportunities do exist however to link the descriptive characterization of systems (and the counties they represent) to data being collected as part of the National EMS Information System (NEMSIS) (wwwnemsisorg) Such a linkage will allow for evaluations of different system designs and system performance measures as being defined and standardized within the context of the Performance Measures Project (wwwnasemsoorgProjectsPerformanceMeasures)
NEMSIS was designed for the purpose of creating a uniform national EMS dataset with standard terms definitions and values as well as a database of data aggregated from across the country There are many benefits expected to stem from this effort including the facilitation of national benchmarking comparison of local system performance exploration of variations across a number of constructs (including rurality) and better description of the nationrsquos EMS system as a whole (32) As of May 4 2012 35 States were contributing data to NEMSIS with several more actively working with the NEMSIS Technical Assistance Center to contribute data in the near future (33) NEMSIS contains many useful data elements including an array of EMS agency characteristics such as geography population served call volume level and type of service and organizational characteristics (34)
NEMSIS is an increasingly powerful data resource that can be used to help verify and validate some of our findings Incident-level data as well as EMS agency characteristics from NEMSIS can be linked using geographic identifiers to the data collected as part of this project This can help better distill system characteristics to evaluate the uniformity of various systems and system types The most obvious potential benefit in connecting these data would be to evaluate performance on a local EMS system level Such an undertaking would help generate an evidence-based approach to local State and national EMS policy and planning efforts
In addition to documenting overall variation in the organization and delivery of EMS across systems this study clearly underscored the challenges faced by systems providing services in rural and wilderness areas of the country Most apparent (and of potential concern) are low percentages in rural and wilderness areas of full-time versus part-time
35
and career versus volunteer EMS providers ALS versus BLS providers involved in transport and dispatch agencies providing pre-arrival instructions In addition a higher percentage of systems in more ruralwilderness versus urbansuburban areas had no medical direction in place and or had some organized medical direction but with no one person with primary responsibility System financing was clearly a challenge for all systems but a slightly higher percentage of systems in rural and wilderness areas rely on fee for service as their primary source of funding
D3 Limitations of the Study
This study has a number of limitations which can be grouped into three types 1 potential response bias 2 instrument design and 3 respondent and system comparability
Potential Response Bias The overall rate of participation in the study was modest (636) and lower than that achieved in the pilot study (86) Despite the less than ideal response rate participation did not differ significantly by geographic region of the country or by rurality Overall the participating systems covered only 440 of the land in the United States but represented 636 of the U S population While a survey that covers practices serving nearly two-thirds of the U S population is informative caution is needed in interpreting the data as the potential for response bias exists The variation in response rates by State made a State-by-State comparison difficult
Limitations Related to Instrument Design The survey instrument contained 24 questions some of which were fairly complex to answer or relied on estimation on the part of the respondent The desire to keep the survey short and straightforward as possible led to using fewer and broader questions about a particular concept Quantitative data (eg call volume) were self-reported and opinion questions may present a greater bias depending on the person serving as the systemrsquos proxy respondent Non-standard definitions also could potentially be reflected in the self-reported data based on the local system variations (eg how to count call volume)
The widespread use of different terminology in the EMS field may have presented some challenges for some respondents on certain questions For example a straightforward question regarding the number of EMS ldquoprovidersrdquo was interpreted by the majority of respondents to be equivalent to ldquopersonnelrdquo (based on the surrounding question language) but we determined (by way of a data quality assurance follow up phone call) that at least one large regional system to have answered as if this was the number of EMS agencies Finally we determined the questions regarding the administrative structure and organizational mission of first responder and transport agencies were challenging for some respondents The difficulties became apparent through follow up calls to several respondents as well as based on the handwritten mark up of returned hard copy surveys
Finally while the survey was designed to be broad and generic in nature to ensure brevity and answerability it is by no means complete in terms of what should be asked of an EMS system The questions address many of the key facets of system structure and
36
environment but some specific areas require further inquiry and there is a need to examine yet another class of quantitative and performance variables to assess the relative value of any given configuration While the system as an entity works to improve the operations it governs the effective administration of an EMS system requires a different perspective and knowledge base than is found in field operations
Respondent and System Comparability Perhaps the most challenging aspect of this study is the variability in the size and geography of the systems we surveyed Despite our efforts to apply a uniform definition of ldquosystemrdquo there are still differences to be expected when considering each system as a unit This is true for the individual completing the survey as well As reported above most States had types of organizations that met our definition within their own borders but the type and level of these organizations did vary across States For example some States provided contacts at the county or municipality level while others were regional or hospital-based The State EMS offices themselves completed local system surveys for both Hawaii and Rhode Island It is possible that there may be differences present in the data based on the formal organizational roles level of system engagement and experience of each respondent particularly for opinion-based questions
Airport tribal or military EMS systems also present challenges Atypical systems while important to their respective State EMS structures and likely fairly homogeneous as individual units may prove difficult to compare with the majority of jurisdictional systems
There are many ways to classify rurality each with strengths and weaknesses based on their definitions data availability and the purposes for which they are needed Further there is no universally accepted approach that meets the needs of every analytical effort (35) Large ldquomultiple ruralityrdquo systems can be extremely diverse in their makeup but this alone does not illuminate all the potential inconsistencies when considering rurality Based on the geographic units of measurement and design rurality taxonomies can mask the heterogeneity of a particular area (eg a single county) in many ways (36) and the county-based urban influence codes used to classify systems in this study are no exception
Due to the variable size and geography of the systems we surveyed we were often challenged in defining the ldquoruralityrdquo of the system There were several participating systems that encompassed within their boundaries multiple urban influence codes and 63 (79) that even spanned across our four-category scheme For example the Southwest Texas Regional Advisory Council is charged with the development and implementation of the regional trauma and emergency healthcare system for a 22-county region of over 26000 square miles It contains both Bexar County (19th most populous county in the nation population density of 1375sq mi home to San Antonio the nations 7th largest city) as well as Real County (700 square mile frontier area with population 3309 and a population density of less than 5sq mi) The size and complexity of our participating systems limited the options for classifying rurality in a different manner although our categorization was still similar to that used in NEMSIS
37
E References
1 National Academy Press (1966) Accidental death and disability The neglected disease of modern society Washington DC National Academy of Sciences
2 Emergency Medical Services Systems Act (public law 93-154) (1973)
3 Narad R A (1990 February) Emergency medical services system design Emerg Med Clin North Am 8(1)1-15
4 Institute of Medicine (2007) Future of emergency care Emergency medical services at the crossroads Washington DC National Academies Press
5 General Accounting Office (2001) Emergency medical services Reported needs are wide-ranging with a growing focus on lack of data (Report No GAO-2-28) Washington DC Author
6 Narad R A (1998) Coordination of the EMS system An organizational theory approach Prehosp Emerg Care2(2)145-52
7 Fitch J J (2005) EMS in critical condition Meeting the challenge (Report No Volume 37 Number 5) Washington DC International CityCounty Management Association
8 Narad R A (2000) Emerging organizational structures in the ambulance industry in the United States Prehosp Disaster Med15(1)49-56
9 Overton J amp Stout J (2002) System design In A E Kuehl (ed) Prehospital systems and medical oversight 3rd ed Dubuque IA KendallHunt Publishing Company
10 Mackenzie E J amp Carlini A R (2008 March) Configurations of EMS systems A pilot study (Report No DOT HS 810 911) Washington DC National Highway Traffic Safety Administration
11 National Highway Traffic Safety Administration (1996) EMS agenda for the future (Report No DOT HS 808 441) Washington DC Author Available at wwwnremtorgnremtdownloadsEMS20Agenda20for20the20Futurep df
12 Census regions and divisions of the United States Accessed March 9 2012 from wwwcensusgovgeowwwus_regdivpdf [Site no longer displays this page]
13 Ghelfi L M amp Parker T S (2004) Developing a county measure of urban influence Amber Waves [U S Dept of Agriculturersquos Economic Research Service monthly electronic newsletter 2(2)47
14 Department of Health and Human Services Area resource file 2007
15 Esri ArcMap 2002
16 Ragone M (2012 February) Evolution or revolution EMS industry faces difficult changes JEMS37(2)34-9
17 Mears G (2004) 2003 national emergency medical services survey Chapel Hill NC University of North Carolina
38
18 Mears G Armstrong B Fernandez A R Mann N C McGinnis K Mears C R hellip amp Shofer F S (2012 December) 2011 National EMS Assessment (Report No DOT HS 811 723) Washington DC National Highway Traffic Safety Administration Available at wwwnhtsagovstaticfilesntiemspdf811723pdf
19 Erich J (2012 March) Self-portrait What does the national EMS assessment tell us about ourselves EMS World41(3)49-53
20 Freeman V A Slifkin R T amp Patterson P D (2009) Recruitment and retention in rural and urban EMS Results from a national survey of local EMS directors J Public Health Manag Pract 15(3)246-52
21 Slifkin R T Freeman V A amp Patterson P D (2009) Designated medical directors for emergency medical services Recruitment and roles J Rural Health 25(4)392-8
22 Ragone M (2011 February) Are we ready for the future Where EMS stands now amp where its prepared to go JEMS36(2)38-43
23 Williams D M amp Ragone M (2010 February) 2009 JEMS 200-city survey Zeroing in on what matters JEMS35(2)38-42
24 Williams D M (2009 February) Jems 2008 200 city survey The future is your choice JEMS34(2)36-51
25 Williams D M (2008 February) 200-city survey Is the status quo acceptable JEMS33(2)48-65
26 Goodwin K (2002) Keeping rural emergency medical services afloat (Report No NCSL State Legislative Report Volume 27 Number 15) Denver CO National Conference of State Legislatures
27 McGinnis K K (2004) Rural and frontier emergency medical services agenda for the future Kansas City National Rural Health Association
28 Giordano L M amp Davidson SJ (1994) Urban systems In A E Kuehl ed Prehospital Systems and Medical Oversight 2nd ed Baltimore MD Mosby Lifeline
29 Garnett F G amp Spoor J E (1994) Rural systems In A E Kuehl ed Prehospital Systems and Medical Oversight 2nd ed Baltimore MD Mosby Lifeline
30 Local EMS system components and current issues (2006) (Presentation slides) Available at wwwiomeduFileaspxID=20952 Accessed September 5 2006
31 Shah M N (2006 March) The formation of the emergency medical services system Am J Public Health 96(3)414-23
32 Dawson D E (2006) National emergency medical services information system (NEMSIS) Prehosp Emerg Care 10(3)314-6
33 NHTSA (na) NEMSIS Version 3 Overview 2011 NASEMSO Annual Meeting (PowerPoint Presentation Washington DC National Highway Traffic Safety Administration Available at
39
wwwnemsisorgdocumentsNEMSISOverviewBriefingpdf Accessed March 9 2012
34 NHTSA (na) NEMSIS data dictionary version 320 Washington DC National Highway Traffic Safety Administration Available at httpnemsisorg_nemsis_v32001202012dataDictionary Accessed March 9 2012
35 Vanderboom CP amp Madigan EA (2007 April) Federal definitions of rurality and the impact on nursing research Res Nurs Health 30(2)175-84
36 Hart L G Larson E H amp Lishner D M (2005 July) Rural definitions for health policy and research Am J Public Health 95(7)1149-55
37 Centers for Disease Control and Prevention (2012 September) Web-Based Injury Statistics Query and Reporting System (WISQARS) Atlanta GA Author Available at wwwcdcgovinjurywisqarsindexhtml
38 CDC (na) Wide-Ranging Online Data for Epidemiologic Research (WONDER) Atlanta GA Author Available at httpwondercdcgov
40
Table A1 Characteristics of States ndash Demography Number () of Counties by Rurality
State Total Land Area
(sq mi)
Population (2007
Estimate)
Population Density
(popsq mi)
Total Number of Counties
Number () of Counties in
Persistent Poverty1
Urban Suburban Rural Wilderness
AK 571951 683478 12 27 4 (52) 3 (673) 0 3 (83) 21 (244) AL 50744 4627851 912 67 22 (119) 28 (713) 11 (151) 18 (100) 10 (36) AR 52068 2834797 544 75 17 (132) 20 (595) 6 (82) 36 (257) 13 (66) AZ 113635 6338755 558 15 2 (29) 6 (896) 4 (66) 5 (38) 0 CA 155959 36553215 2344 58 0 (00) 37 (977) 5 (10) 12 (10) 4 (02) CO 103717 4861515 469 64 4 (07) 17 (862) 3 (26) 13 (65) 31 (48) CT 4845 3502309 7229 8 0 (00) 6 (913) 2 (87) 0 0 DC 61 588292 95813 1 0 (00) 1 (1000) 0 0 0 DE 1954 864764 4427 3 0 (00) 2 (787) 1 (213) 0 0 FL 53927 18251243 3384 67 4 (17) 38 (937) 11 (42) 10 (15) 8 (07) GA 57906 9544750 1648 159 50 (95) 70 (813) 20 (79) 46 (83) 23 (25) HI 6423 1283388 1998 5 1 (00) 1 (706) 0 4 (294) 0 IA 55869 2988046 535 99 0 (00) 20 6 (69) 53 20 (71) ID 82747 1499402 181 44 0 (00) 12 (654) 6 (120) 12 (164) 14 (62) IL 55584 12852548 2312 102 3 (06) 36 14 (48) 44 (77) 8 (05) IN 35867 6345289 1769 92 0 (00) 46 (781) 21 (131) 23 (84) 2 (05) KS 81815 2775997 339 105 0 (00) 17 (637) 7 (74) 34 (222) 47 (68) KY 39728 4241474 1068 120 43 (184) 35 (573) 10 (80) 45 (233) 30 (115) LA 43562 4293204 986 64 32 (289) 29 (736) 16 (186) 13 (63) 6 (16) MA 7840 6449755 8227 14 0 (00) 12 (996) 0 0 2 (04) MD 9774 5618344 5748 24 0 (00) 17 (947) 4 (39) 2 (09) 1 (05) ME 30862 1317207 427 16 0 (00) 5 (584) 1 (92) 7 (219) 3 (106) MI 56804 10071822 1773 83 0 (00) 26 (816) 8 (56) 27 (85) 22 (43) MN 79610 5197621 653 87 0 (00) 21 (729) 8 (65) 40 (179) 18 (27) MO 68886 5878415 853 115 16 (100) 34 (734) 10 (62) 46 (168) 25 (36) MS 46907 2918785 622 82 51 (421) 17 (438) 7 (100) 42 16 (60)
1 Persistent poverty defined as 20 percent or more of residents measured as poor in each of the 1970 1980 1990 and 2000 censuses
41
( )
Table A1 cont Characteristics of States ndash Demography
Number () of Counties by Rurality State Total
Land Area (sq mi)
Population (2007
Estimate)
Population Density
(popsq mi)
Total Number of Counties
Number () of Counties in
Persistent Poverty1
Urban Suburban Rural Wilderness
MT 145552 957861 66 56 3 (34) 4 (352) 0 13 (446) 39 NC 48711 9061032 1860 100 10 (55) 40 (701) 25 (196) 18 (71) 17 (32) ND 68976 639715 93 53 5 (45) 4 (481) 1 (26) 10 (245) 38 NE 76872 1774571 231 93 1 (04) 9 (580) 2 (33) 30 (257) 52 (130) NH 8968 1315828 1467 10 0 3 (624) 3 (218) 4 (158) 0 NJ 7417 8685920 11710 21 0 21 (1000) 0 0 0 NM 121356 1969915 162 33 12 (301) 7 (660) 7 (140) 13 (186) 6 (14) NV 109826 2565382 234 17 0 4 (897) 3 (45) 7 (49) 3 (10) NY 47214 19297729 4087 62 0 36 12 (45) 12 (33) 2 (01) OH 40948 11466917 2800 88 0 40 28 (146) 17 (44) 3 (04) OK 68667 3617316 527 77 14 (64) 17 (637) 8 (119) 35 17 (44) OR 95997 3747455 390 36 0 11 (777) 9 (119) 9 (95) 7 (09) PA 44817 12432792 2774 67 0 32 (841) 19 (119) 11 (32) 5 (07) RI 1045 1057832 10124 5 0 5 (1000) 0 0 0 SC 30109 4407709 1464 46 12 (86) 21 (761) 13 (144) 11 (93) 1 (02) SD 75885 796214 105 66 13 (91) 7 (454) 3 (51) 15 (278) 41 (218) TN 41217 6156719 1494 95 9 (31) 38 (732) 15 (118) 31 (129) 11 (20) TX 261797 2390438 913 254 46 (121) 77 (875) 29 (43) 94 (70) 54 (11) UT 82144 2645330 322 29 1 (05) 10 (890) 2 (35) 6 (44) 11 (31) VA 39591 7712091 1948 134 2 (05) 80 5 (24) 28 (77) 21 (42) VT 9250 621254 672 14 0 3 (334) 2 (154) 7 (429) 2 (84) WA 66544 6468424 972 39 0 17 (877) 8 (78) 8 (38) 6 (08) WI 54310 5601640 1031 72 0 25 (728) 12 (134) 22 (104) 13 (34) WV 24078 1812035 753 55 9 (74) 21 (554) 5 (124) 14 (205) 15 (117) WY 97100 522830 54 23 0 2 (302) 1 (62) 13 (500) 7 (136) U S 3537435 301621157 853 3141 386 1090 393 963 (76) 695 (21)
42
Table A2 Characteristics of States ndash Mortality Rates
State Rates for All
Injury Causes
Rates for Cerebrovascular
Disease
Rates for Heart
Disease
Rates for All
Causes
Alabama 7741 5542 23310 93023
Alaska 8894 4289 14539 74202
Arizona 6918 3006 14565 65370
Arkansas 7797 5197 22622 89964
California 4689 3972 17019 66030
Colorado 6834 3691 14096 70899
Connecticut 4961 3306 17089 69136
Delaware 6087 3675 17945 78075
District of Columbia 6292 3601 22917 85001
Florida 6727 3196 15695 67913
Georgia 5973 4716 19053 83187
Hawaii 4483 3840 14099 59063
Idaho 6413 4042 15304 72304
Illinois 4939 4258 19188 77094
Indiana 6139 4521 19845 83527
Iowa 5490 4279 18222 74418
Kansas 5701 4764 17236 78486
Kentucky 7667 4590 21784 90236
Louisiana 8046 4665 23042 92213
Maine 5996 4062 16527 76481
Maryland 5558 4143 19552 77172
Massachusetts 3980 3505 16381 70594
Michigan 5644 4335 22027 81194
Minnesota 5152 3768 12656 67540
Mississippi 8547 5190 26019 95009
Missouri 7078 4771 21443 84715
Montana 8638 3980 16980 78693
43
Table A2 cont Characteristics of States ndash Mortality Rates
State Rates for All
Injury Causes
Rates for Cerebrovascular
Disease
Rates for Heart
Disease
Rates for All
Causes
Nebraska 5253 4013 15949 74142
Nevada 7229 3919 19573 80863
New Hampshire 5062 3363 16484 71247
New Jersey 3869 3297 19061 71720
New Mexico 10086 3562 15186 75864
New York 3732 2741 21891 67596
North Carolina 6680 5019 18489 82564
North Dakota 6322 3662 15876 71317
Ohio 6048 4507 20634 84410
Oklahoma 8073 5149 24221 93103
Oregon 6096 4379 14955 74859
Pennsylvania 6079 4153 19995 79653
Rhode Island 5410 3440 19520 74941
South Carolina 7118 5000 18600 83953
South Dakota 6263 3755 16082 70876
Tennessee 7637 5102 22011 88882
Texas 5756 4672 18329 77605
Utah 6313 3677 13804 65908
Vermont 6270 3827 16593 72192
Virginia 5376 4330 17656 76274
Washington 5868 4145 16101 72366
West Virginia 8695 4721 22813 95849
Wisconsin 5765 3997 17179 72994
Wyoming 9232 4329 16939 77336
44
Table B2 Participation Rates by Rurality and Geographic Region
Participation Rates
Number of Systems
Number of Systems
Participating In Study
Percent of Systems
Participating
Percent of Land
Covered by Participating
Systems
Percent of Population Covered by
Participating Systems
ALL REGIONS 1268 800 631 440 636
RURALITY 1
Urban 581 355 611 487 641 Suburban 150 98 653 391 479 Rural 298 193 648 316 393 Wilderness 239 154 644 380 426
GEOGRAPHIC Northeast 182 106 582 729 766 Midwest 531 336 633 428 522 South west 409 263 643 425 541 West 146 95 651 327 660
1 Rurality defined using Urban Influence Codes (UIC) systems that span two or more UIC (N=140) were categorized according to most urban UIC code in system
45
Table B3 Percent Distribution of Number of EMS Providers Annual Number of 911 Calls and Annual Number of EMS Responses by Rurality1
(N= number of systems participating in overall study n=number of systems responding to specific survey item)
All Systems
Urban N=355
Suburban N=98
Rural N=193
Wilderness N=154
Number of EMS Care Providers incl volunteers at all levels
Percent Distrsquon
(n=753)
Percent Distrsquon
(n=337)
Percent Distrsquon (n=97)
Percent Distrsquon
(n=179)
Percent Distrsquon
(n=137)
lt50 32 146 292 364 742 50 ndash 99 14 80 157 278 129
100 ndash 499 30 344 472 312 129 500 + 23 431 79 46 00
Annual Number of 911 Calls for EMS
Percent Distrsquon
(n=724)
Percent Distrsquon
(n=320)
Percent Distrsquon
(n=93)
Percent Distrsquon
(n=177)
Percent Distrsquon
(n=148)
lt1000 25 78 106 292 709 1000 ndash 4999 29 170 388 544 250 5000 ndash 9999 12 136 259 123 20
10000 + 32 616 247 41 21
Annual Number of EMS Responses
Percent Distrsquon
(n=720)
Percent Distrsquon
(n=309)
Percent Distrsquon
(n=88)
Percent Distrsquon
(n=178)
Percent Distrsquon
(n=145)
lt1000 24 68 91 264 689 1000 ndash 4999 31 159 375 573 269 5000 ndash 9999 12 129 261 129 28
10000 + 32 644 273 34 14
1 Rurality defined using Urban Influence Codes (UIC) systems that span two or more UIC (N=140) were categorized according to most urban UIC code in system
46
Table B4 Percent Distribution of Number of EMS Providers Annual Number of 911 Calls and Annual Number of EMS Responses by Geographic Region
(N= number of systems participating in overall study n=number of systems responding to specific survey item)
All Systems N=80
Northeast N=106
Midwest N=336
West N=263
South N=95
Number of EMS Care Providers incl volunteers at all levels
Percent Distrsquon
(n=753)
Percent Distrsquon
(n=101)
Percent Distrsquon
(n=317)
Percent Distrsquon
(n=260)
Percent Distrsquon
(n=73)
lt50 321 50 467 250 270 50 ndash 99 145 50 177 163 133
100 ndash 499 302 376 233 283 369 500 + 232 525 123 304 228
Annual Number of 911 Calls for EMS Percent Distrsquon (n=724)
Percent Distrsquon
(n=89)
Percent Distrsquon (n=306)
Percent Distrsquon (n=252)
Percent Distrsquon
(n=70)
lt1000 258 23 360 262 80 1000 ndash 4999 293 191 310 250 324 5000 ndash 9999 120 169 96 83 147
10000 + 329 618 134 405 450
Annual Number of EMS Responses Percent
Distrsquon (n=720)
Percent Distrsquon
(n=89)
Percent Distrsquon (n=305)
Percent Distrsquon (n=238)
Percent Distrsquon
(n=88)
lt1000 244 22 436 80 250 1000 ndash 4999 310 225 357 307 239 5000 ndash 9999 125 169 89 168 91
10000 + 321 584 118 445 420
47
Table C1 Primary Mission1 of First Response and Transport Agencies by Rurality (N= number of systems participating in overall study n=number of systems responding to specific survey item)
All Systems N=800
Urban N=355
Suburban N=98
Rural N=193
Wilderness N=154
Primary Mission Any Checked
Percent Distrsquon of First
Response2
(n=731)
Percent Distrsquon of Transport (n=782)
Percent Distrsquon of First Response (n=342)
Percent Distrsquon of Transport (n=345)
Percent Distrsquon of First Response (n=92)
Percent Distrsquon of Transport (n=96)
Percent Distrsquon of First Respon se (
Percent Distrsquon of Transport (n=190)
Percent Distrsquon of First Response (n=124)
Percent Distrsquon of Transport (n=151)
Fire Only 315 120 436 200 315 125 191 53 153 20 EMS Only 248 597
52 120 487
23 348 646
31 330 653
116 411 748
53Hospital 15 06 22 3 08 Fire and EMS 88 92 99 128 65 94 121 79 24 26 Fire and Other 299 99 307 122 217 52 283 68 363 113
All Other 35 40 32 41 33 52 4 32 40 40
1 Primary mission assigned if respondent indicated a single agency type handles majority of call volume or if all the agency types recorded fell only within a particular group
2 Twenty-seven of the 800 responding systems do not use first responders of the 773 systems that do data on primary mission of first response agencies was missing for 42 systems (54 of all systems with first response)
48
Table C2 Primary Administration or Ownership1 of First Response and Transport Agencies by Rurality (N= number of systems participating in overall study n=number of systems responding to specific survey item)
All Systems N=80
Urban N=355
Suburban N=98
Rural N=193
Wilderness N=154
Agency Type Percent Distrsquon of First Response2
(n=731)
Percent Distrsquon of Transpor t (n=782)
Percent Distrsquon of First Response (n=342)
Percent Distrsquon of Transpor t (n=345)
Percent Distrsquon of First Response (n=92)
Percent Distrsquon of Transpor t (n=96)
Percent Distrsquon of First Response (n=173)
Percent Distrsquon of Transpor t (n=190)
Percent Distrsquon of First Response (n=124)
Percent Distrsquon of Transpor t (n=151)
StateLocal Govrsquot 687 620 672 562 663 677 699 653 726 676
For Profit (FP) 27 81 20 99 76 73 29 89 08 33
Not for Profit (NFP)
56 107 41 96 76 104 58 100 81 146
Govrsquot amp NFP 71 61 61 61 76 42 75 58 89 79
Govrsquot amp FP 66 45 73 55 44 31 87 47 32 26
All Other 93 86 132 127 65 73 52 53 64 40
1 Primary administration or ownership assigned if respondent indicated a single agency type handles majority of call volume or if all the agency types recorded fell only within a particular group
2 Twenty-seven of the 800 responding systems do not use first responders of the 773 systems that do data on primary mission of first response agencies was missing for 42 systems (54 of all systems with first response)
49
Table C3 Emergency Medical Call Taking Organizational Type of Agency by Rurality (N=number of systems participating in overall study n=number of systems responding to specific survey
item)
All Systems Urban Suburban Rural Wilderness N=800 N=355 N=98 N=193 N=154
Percent Percent Percent Percent Percent Percent Percent Percent Percent Percent Present Distrsquon of Present Distrsquon of Present Distrsquon of Present Distrsquon of Present Distrsquon of
Agency Type within the System
Primary
Type2
(n=752)
within the System
Primary Type (n=328)
within the System
Primary Type (n=93)
within the System
Primary Type (n=183)
within the System
Primary Type (n=148)
Public SafetyJoint Police-Fire-EMS 466 342 599 430 424 323 431 344 218 155 Fire 304 64 382 112 235 22 269 38 203 14 Law Enforcement 462 282 480 210 482 376 401 300 481 358 Local EMS Service 430 230 389 149 400 194 455 246 519 412 Other 101 82 135 99 121 85 78 72 45 61
1 S y s t ems c a n h a v e mu l t i p l e t y p es ( gt 1 ) o f a g e n c i e s w i t h i n t h e s a m e s y s t em a llo w i n g c olu m n v a lu e s t o a d d t o m o r e t h a n 1 0 0 2 Primary Type was self-reported and denotes the agency that handles the majority (50 or more) of the call volume for the system
50
Table C4 Emergency Medical Dispatching Organizational Type of Agency by Rurality (N= number of systems participating in overall study n=number of systems responding to specific survey item)
All Systems Urban Suburban Rural Wilderness N=80 N=355 N=98 N=193 N=154
Agency Type Percent Percent Percent Percent Percent Percent Percent Percent Percent Percent Present Distrsquon of Present Distrsquon of Present Distrsquon of Present Distrsquon of Present Distrsquon of within the System
Primary
Type1
(n=741)
within the System
Primary Type (n=333)
within the System
Primary Type (n=91)
within the System
Primary Type (n=176)
within the System
Primary Type (n=141)
Public SafetyJoint Police-Fire-EMS 498 398 586 456 411 374 517 432 306 234 Fire 214 50 322 99 123 11 116 11 116 07 Law Enforcement 493 372 414 228 548 506 517 426 628 560 Local EMS Service 31 12 39 21 14 00 20 00 33 14 Other 194 168 227 196 131 109 156 131 190 185
1 Primary Type was self-reported and denotes the agency that handles the majority (50 or more) of the call volume for the system
51
1Table C5 Most Common Level of First Response and Transport by Rurality (N= number of systems participating in overall study n=number of systems responding to specific survey item)
All Systems Urban Suburban Rural Wilderness N=80 N=355 N=98 N=193 N=154
Level of Percent Percent Percent Percent Percent Percent Percent Percent Percent Percent Care Distrsquon of Distrsquon of Distrsquon of Distrsquon of Distrsquon of Distrsquon of Distrsquon of Distrsquon of Distrsquon of Distrsquon of
First Response2
Transpor t (n=786)
First Response (n=335)
Transpor t (n=348)
First Response (n=88)
Transpor t (n=97)
First Response (n=172)
Transpor t (n=191)
First Response (n=140)
Transpor t (n=150)
(n=735)
ALS 362 634 409 727 307 649 378 639 264 400 ILS 88 121 45 75 91 155 122 136 150 187 BLS 550 245 546 198 602 196 500 225 586 413
1 Level of response represents the maximum capacity of the responding unitvehicle to call and not the level of care rendered most common level is self-reported
2 Twenty-seven of the 800 responding systems do not use first responders of the 773 systems that do data on level of first response was missing for 38 systems (49 of all systems with first response)
52
Table C6 First Responder Policies and Practices by Rurality (for areas of systems that use first responders) (N= number of systems participating in overall study n=number of systems responding to specific survey item)
All Systems N=80
Urban N=355
Suburban N=98
Rural N=193
Wilderness N=154
Percent with PolicyPractic
e (n=643)1
Percent with PolicyPractic
e
Percent with PolicyPractic
e
Percent with PolicyPractic
e
Percent with PolicyPractic
e Policy Used to Send First Responders
First Responders Sent to all 911 Calls 549 484 530 667 582 First Responders Sent only to calls based on priority dispatch or other call taking 355 451 386 218 245 Other 96 65 84 115 173
Most Common Practice (based on percentage of total calls)
Percent with PolicyPractic
e (n=643)1
Percent with PolicyPractic
e
Percent with PolicyPractic
e
Percent with PolicyPractic
e
Percent with PolicyPractic
e First Response followed by transport ambulance as 31 23 24 39 51 Simultaneous First Response and transport ambulance 858 861 857 863 837 It varies based on protocol 82 97 59 65 82 Other 29 19 60 33 30
1 Twenty-seven of the 800 responding systems do not use first responders of the 773 systems that do data on policies and practices were missing for 130 systems
53
Table C7 Operating Procedures Regarding Dispatch and Transport by Rurality (N= number of systems participating in overall study n=number of systems responding to specific survey item)
All Systems N=800
Urban N=355
Suburban N=98
Rural N=193
Wilderness N=154
Percent of systems that
Allow vehicles to respond to calls without use of lights and sirens
789 (n=782)
798 (n=347)
794 (n=97)
795 (n=190)
757 (n=148)
Allow vehicles to transport non-emergent patients without use of lights and sirens
934 (n=788)
943 (n=350)
939 (n=98)
926 (n=191)
920 (n=151)
Allow providers to transport patients from the
scene to non-hospital destinations
281 (n=789)
224 (n=349)
276 (n=98)
325 (n=191)
364 (n=151)
Have units that can be dispatched to perform non-emergency assessments
374 (n=788)
369 (n=352)
423 (n=97)
389 (n=190)
336 (n=149)
How many dispatch agencies offer pre-arrival instructions to callers for certain types of calls
(n= 783) (n=349) (n=98) (n=185) (n=151)
All 513 613 592 432 331
Some 290 304 235 249 344
None 197 83 173 319 325
54
Table C8 Frequency of Out of Area Response to Calls by Rurality (N= number of systems participating in overall study n=number of systems responding to specific survey item)
All Systems N=80
Urban N=355
Suburban N=98
Rural N=193
Wilderness N=154
How often do your first response agencies respond to calls beyond the boundaries of their primary service areas
(n=677) (n=322) (n=85) (n=158) (n=112)
Never 158 155 141 152 187 Seldom 442 429 400 418 545 Sometimes 332 335 329 392 241 Often 68 81 129 38 27
How often do your transport agencies respond to calls beyond the boundaries of their primary service areas
(n=770) (n=344) ( n=98) (n=185) (n=143)
Never 29 23 10 16 70 Seldom 304 244 357 308 405 Sometimes 494 509 429 535 448 Often 174 224 204 141 77
How often do units from other EMS systems respond to calls within your own jurisdiction (n=792) (n=352) (n=98) (n=191) (n=151)
Never 68 51 71 63 113 Seldom 595 574 612 607 616 Sometimes 287 307 255 298 245 Often 50 68 61 31 26
55
Table C9 EMS Provider Type by Rurality (N= number of systems participating in overall study n=number of systems responding to specific survey item)
Type of Provid
All Systems Urban Suburban Rural Wilderness
N=800 N=355 N=98 N=193 N=154
er Percent Percent Percent Percent Percent Percent Percent Percent Percent Percent Present Distrsquon of Present Distrsquon of Present Distrsquon of Present Distrsquon of Present Distrsquon of
within Primary within Primary within Primary within Primary within Primary the 1 the Type the Type the Type the Type Type
System System (n=332) System (n=92) System (n=181) System (n=142) (n=747)
Volunteer Compensated 565 222 515 87 547 163 608 304 641 472
Non-compensated 611 193 692 190 642 217 624 199 380 176 Career
Part time 612 47 692 36 642 33 618 66 394 56 Full time 845 538 944 687 916 587 801 431 620 296
Average of providers who serve 474 365 467 553 625
as volunteers (N=768) (N=338) (N=94) (N=186) (N=150) (compensated or not)
Average of total calls that are handled by
volunteers 380 258 356 438 603 (compensated or (N=749) (N=329) (N=94) (N=183) (N=143)
not)
Average of Volunteers
who typically respond 144 230 78 99 42 to calls from Fire or (N=751) (N=335) (N=90) (N=182) (N=144) EMS station houses
1Primary Type is self-reported and denotes the provider type that represent the majority (50 or more) of E MS personnel in the system
56
Table C10 911 System Access by Rurality (N= number of systems participating in overall study n=number of systems responding to specific survey item)
All Systems N=80
Urban N=355
Suburban N=98
Rural N=193
Wilderness N=154
Type of Provider
Percent Present within the System
Percent Distrsquon of Highest Level (n=779)
Percent Present within the System
Percent Distrsquon of Highest Level (n=347)
Percent Present within the System
Percent Distrsquon of Highest Level (n=98)
Percent Present within the System
Percent Distrsquon of Highest Level (n=185)
Percent Present within the System
Percent Distrsquon of Highest Level (n=149)
Wireless E 911 652 652 723 723 755 755 573 573 517 517 Wireless E 911 390 137 501 161 245 51 324 124 309 154 E 911 927 168 951 95 980 174 924 254 839 228 Basic 911 307 41 340 17 296 20 243 49 315 101 7 or 10 Digit Number 295 01 352 03 245 00 249 00 255 00
57
Table C11 Timely Response to Incoming Calls by Rurality (N= number of systems participating in overall study n=number of systems responding to specific survey item)
All Systems
Urba n
Suburban N=98
Rural N=193
Wilderness N=154
Percent indicating timely response to incoming calls a consistent problem
558 (n=786)
553 (n=349)
612 (n=98)
599 (n=187)
487 (n=152)
Of those with consistent problems response
difficulties due to
Percent Any Listed
Percent Distrsquon of Primary
Difficulty1
(n=786)
Percent Any Listed
Percent Distrsquon of Primary
Difficulty (n=349)
Percent Any Listed
Percent Distrsquon of Primary
Difficulty (n=98)
Percent Any Listed
Percent Distrsquon of Primary
Difficulty (n=187)
Percent Any Listed
Percent Distrsquon of Primary
Difficulty (n=152)
Daytime Staffing 529 262 538 272 579 291 538 316 451 125 Night time staffing 296 53 337 50 246 54 240 31 310 94 Remote or distant geographic areas
791 564 783 528 807 546 740 561 873 688
Exceptionally high demand
171 25 266 44 140 36 77 00 84 00
Provider retention 380 40 446 39 351 18 375 51 239 47 Provider recruitment 404 33 429 33 439 36 404 31 310 31 Other 53 23 54 33 35 18 38 10 84 16
1 Primary difficulty is self-reported and is the one difficulty identified as the primary difficulty selected from list
58
Table C12 Medical Direction by Rurality (N= number of systems participating in overall study n=number of systems responding to specific survey item)
All Systems N=80
Urban N=355
Suburban N=98
Rural N=193
Wilderness N=154
Percent with Characteristic
(n=786)
Percent with Characteristic
(n=350)
Percent with Characteristic
(n=98)
Percent with Characteristic
(n=186)
Percent with Characteristic
(n=152)
System had no physician medical direction in place
41 40 20 38 59
System has medical direction but with no one person with primary responsibility 256 228 184 333 270
Of systems with one person with primary responsibility this person is
Responsible to system agency 449 464 480 400 441
Responsible to county or EMS regional program
348 357 325 365 324
Responsible to State lead EMS agency 103 79 91 130 137
Other 100 100 104 105 98
59
Table C13 System Financing by Rurality (N= number of systems participating in overall study n=number of systems responding to a specific
survey item)
All Systems N=800
Urban N=355
Suburban N=98
Rural N=193
Wilderness N=154
Funding Sources
Percent Present within the System
Percent Distrsquon of Primary Type
(n=686) 1
Percent Present within the System
Percent Distrsquon of Primary Type (n=308)
Percent Present within the System
Percent Distrsquon of Primary Type (n=85)
Percent Present within the System
Percent Distrsquon of Primary Type (n=157)
Percent Present within the System
Percent Distrsquon of Primary Type (n=136)
Tax Subsidies State 185 16 234 26 184 00 154 06 115 15 County 598 249 559 230 653 271 566 198 689 338 Local 474 146 601 201 449 165 396 115 297 44
Fees for Services 909 534 917 480 908 506 912 618 885 574 Homeland Security Grants 337 01 382 00 265 00 302 00 324 00 Other Grants 473 09 488 06 398 00 522 19 426 07 Donationsfundraiser 504 26 473 19 510 47 528 32 540 22 Other 471 19 482 38 408 11 506 12 446 00
1 Primary source is self-reported and identified as primary source of funding selected from list
60
1Table D1 Primary Mission of First Response and Transport Agencies by Geographic Region (N= number of systems participating in overall study n=number of systems responding to specific survey item)
All Systems N=80
Northeast N=106
Midwest N=336
South N=263
West N=95
Primary Mission Percent Distrsquon of First Response
(n=731) 2
Percent Distrsquon of Transpor t (n=782)
Percent Distrsquon of First Response (n=105)
Percent Distrsquon of Transpor t (n=106)
Percent Distrsquon of First Response (n=294)
Percent Distrsquon of Transpor t (n=328)
Percent Distrsquon of First Response (n=245)
Percent Distrsquon of Transpor t (n=256)
Percent Distrsquon of First Response (n=87)
Percent Distrsquon of Transpor t (n=92)
Fire 315 120 343 170 211 76 379 133 448 184 EMS Only 248 597
52 181 462
09 299 603
88 233 656
31 195 565
33Hospital 15 38 10 12 12 Fire and EMS 88 92 124 208 78 92 82 39 92 109 Fire and Other 299 99 276 132 354 92 265 94 241 98 All Other 35 40 38 19 48 49 29 47 12 11
1 Primary mission assigned if respondent indicated a single agency type handles majority of call volume or if all the agency types recorded fell only within a particular group
2 Twenty-seven of the 800 responding systems do not use first responders of the 773 systems that do data on primary mission of first response agencies was missing for 42 systems (54 of all systems with first response)
61
1Table D2 Primary Administration or Ownership of First Response and Transport Agencies by Geographic Region
(N = number of systems participating in overall study n=number of systems responding to specific survey item)
All Systems N=80
Northeast N=106
Midwest N=336
South N=263
West N=95
Agency Type Percent Distrsquon of First Response
(n=731)2
Percent Distrsquon of Transpor t (n=782)
Percent Distrsquon of First Response (n=105)
Percent Distrsquon of Transpor t (n=106)
Percent Distrsquon of First Response (n=294)
Percent Distrsquon of Transpor t (n=328)
Percent Distrsquon of First Response (n=245)
Percent Distrsquon of Transpor t (n=256)
Percent Distrsquon of First Response (n=87)
Percent Distrsquon of Transpor t (n=92)
StateLocal Govrsquot 687 620 495 415 711 643 739 718 690 500 For Profit (FP) 27 81 67 123 17 52 33 59 00 196 Not for Profit (NFP) 56 107
61 105 151
94 44 128
79 61 94
39 23 22
22Govrsquot amp NFP 71 124 85 49 23 Govrsquot amp FP 66 45 57 47 75 31 57 47 69 87 All Other 93 86 152 170 68 67 61 43 195 174
1 Primary administration or ownership assigned if respondent indicated a single agency type handles majority of call volume or if all the agency types recorded fell only within a particular group
2 Twenty-seven of the 800 responding systems do not use first responders of the 773 systems that do data on primary mission of first response agencies was missing for 42 systems (54 of all systems with first response)
62
Table D3 Emergency Medical Call Taking Organizational Type of Agency by Geographic Region (N= number of systems participating in overall study n=number of systems responding to specific survey item)
All Systems Northeast Midwest South West N=800 N=106 N=336 N=263 N=95
Agency Type
Percent Present within the System
Percent Distrsquon of Primary Type
(n=752) 1
Percent Present within the System
Percent Distrsquon of Primary Type (n=104)
Percent Present within the System
Percent Distrsquon of Primary Type (n=314)
Percent Present within the System
Percent Distrsquon of Primary Type (n=247)
Percent Present within the System
Percent Distrsquon of Primary Type (n=87)
Public SafetyJoint
Police-Fire-EMS 466 342 596 510 418 296 463 340 488 310
Fire 304 64 424 144 214 32 328 61 415 92
Law Enforcement 462 282 414 164 449 302 450 292 598 322
Local EMS Service
430 230 434 106 466 299 389 194 415 230
Other 101 82 182 76 78 71 96 113 110 46
1 Primary Type was self-reported and denotes the agency that handles the majority (50 or more) of the call volume for the system
63
Table D4 Emergency Medical Dispatching Organizational Type of Agency by Geographic Region (N= number of systems participating in overall study n=number of systems responding to specific survey item)
All Systems Northeast Midwest South West N=80 N=106 N=336 N=263 N=95
Agency Type
Percent Present within the System
Percent Distrsquon Primary Type
(n=741)1
Percent Present within the System
Percent Distrsquon Primary Type (n=102)
Percent Present within the System
Percent Distrsquon Primary Type (n=308)
Percent Present within the System
Percent Distrsquon Primary Type (n=240)
Percent Present within the System
Percent Distrsquon Primary Type (n=91)
Public SafetyJoint Police-Fire-EMS
498 398 674 559 426 334 532 429 440 352
Fire 214 50 337 108 140 19 239 62 250 55
Law Enforcement 493 372 337 186 562 461 418 304 631 462
Local EMS Service 31 12 32 20 30 10 45 17 00 00
Other 194 168 221 127 208 176 174 188 167 131
1 Primary Type was self-reported and denotes the agency that handles the majority (50 or more) of the call volume for the system
64
1Table D5 Most Common Level of First Response and Transport by Geographic Region (N= number of systems participating in overall study n=number of systems responding to specific survey item)
All Systems Northeast Midwest South West N=80 N=106 N=336 N=263 N=95
Level of Percent Percent Percent Percent Percent Percent Percent Percent Percent Percent Care Distrsquon of Distrsquon of Distrsquon of Distrsquon of Distrsquon of Distrsquon of Distrsquon of Distrsquon of Distrsquon of Distrsquon of
First Response
(n=735) 2
Transpor t (n=786)
First Response (n=102)
Transpor t (n=104)
First Response (n=304)
Transpor t (n=331)
First Response (n=240)
Transpor t (n=259)
First Response (n=89)
Transpor t (n= 92)
ALS 362 634 186 519 309 574 479 788 427 544 ILS 88 121 118 115 89 106 33 66 202 337 BLS 550 245 696 366 602 320 488 146 371 119
1 Level of response represents the maximum capacity of the responding unitvehicle to call and not the level of care rendered most common level is self-reported
2 Twenty-seven of the 800 responding systems do not use first responders of the 773 systems that do data on level of first response was missing for 38 systems (49 of all systems with first response)
65
t
Table D6 First Responder Policies and Practices by Geographic Region (N= number of systems participating in overall study n=number of systems responding to specific survey item)
All Systems N=800
Northeast N=106
Midwest N=336
South N=263
West N=95
Policy used to Send First Responders Percent with PolicyPractice
(n=643) 1
Percent with PolicyPractice
(n=94)
Percent with PolicyPractice
(n=253)
Percent with PolicyPractice
(n=223)
Percent with PolicyPractice
(n=73)
First Responders Sent to all 911 Calls 549 553 676 350 712 First Responders Sent only to calls based on priority dispatch or other call taking 355 351 217 560 206 Other 96 96 107 90 82
Most Common Practice (based on percentage of total calls)
Percent with PolicyPractice
(n=643)1
Percent with PolicyPractice
(n=94)
Percent with PolicyPractice
(n=253)
Percent with PolicyPractice
(n=223)
Percent with PolicyPractice
(n=73)
First Response followed by transport ambulance as necessary 31 53 35 22 14 Simultaneous First Response and transport ambulance 858 884 882 803 905 It varies based on protocol 82 42 59 130 68 Other 29 21 24 45 13
1 Twenty-seven of the 800 responding systems do not use first responders of the 773 systems that do data on policies and practices were missing for 130 systems (168 of all systems with first response)
66
Table D7 Operating Procedures Regarding Dispatch and Transport by Geographic Region (N= number of systems participating in overall study n=number of systems responding to specific survey item)
Percent of systems that All Systems
N=800 Northeast
N=106 Midwest N=336
South N=263
West N=95
Allow vehicles to respond to calls without use of lights and sirens
789 (n=782)
808 (n=104)
796 (n=328)
752 (n=258)
848 (n=92)
Allow vehicles to transport non-emergent patients without use of lights and sirens
934 (n=788)
943 (=105)
924 (n=331)
934 (n=258)
957 (n=94)
Allow providers to transport patients from the scene to non-hospital destinations
281 (n=789)
171 (=105)
294 (n=330)
296 (n=260)
319 (n=94)
Have units that can be dispatched to perform non-emergency assessments
374 (n=788)
238 (n=105)
334 (n=332)
456 (n=259)
446 (n=92)
How many dispatch agencies offer pre-arrival instructions to callers for certain types of calls
(n= 783) (n=105) (n=326) (n=258) (n=94)
All 513 724 432 519 543
Some 290 257 347 229 298
None 197 19 221 252 159
67
Table D8 Frequency of Out of Area Response to Calls by Geographic Region (N= number of systems participating in overall study n=number of systems responding to specific survey item)
All Systems N=80
Northeast N=106
Midwest N=336
South N=263
West N=95
How often do your first response agencies respond to calls beyond the boundaries of their primary service areas
(n=677) (n=95) (n=273) (n=231) (n=78)
Never 158 263 172 125 77 Seldom 442 379 462 442 449 Sometimes 332 263 322 351 397 Often 68 95 44 82 77
How often do your transport agencies respond to calls beyond the boundaries of their primary service areas
(n=770) (n=104) (n=322) (n=256) (n=88)
Never 29 00 37 35 11 Seldom 304 154 354 312 273 Sometimes 494 461 497 496 511 Often 174 385 112 156 205
How often do units from other EMS systems respond to calls within your own jurisdiction
(n=792) (n=105) (n=333) (n=260) (n=94)
Never 68 09 63 100 64 Seldom 595 467 673 534 628 Sometimes 287 457 222 308 266 Often 50 67 42 58 43
68
Table D9 Percent Distribution of EMS Provider Type by Geographic Region
(N= number of systems participating in overall study n=number of systems responding to specific survey item)
All Systems
N=800 Northeast
N=106 Midwest
N=336 South
N=263 West N=95
Type of Provider
Percent Present within
the System
Percent Distrsquon of Primary
1 Type (n=747)
Percent Present within
the System
Percent Distrsquon of Primary Type (n=97)
Percent Present within
the System
Percent Distrsquon of Primary Type
(n=318)
Percent Present within
the System
Percent Distrsquon of Primary Type
(n=245)
Percent Present within
the System
Percent Distrsquon of Primary Type (n=87)
Volunteer Compensated 565 222 500 52 735 390 327 45 721 299
Non-compensated 611 193 856 433 492 201 685 118 535 103 Career
Part time 612 47 856 72 495 54 669 37 581 23
Full time 845 538 962 443 716 355 968 800 814 575 Average of providers
who serve as volunteers (compensated or not)
474
(n=768)
548
(n=101)
595
(n=322)
311
(n=252)
413
(n=93)
Average of total calls that are handled by
volunteers (compensated or not)
380
(n=749)
409 (n=98)
500 (n=319)
214 (n=244)
372 (n=88)
Average of volunteers who typically respond to
calls from Fire or EMS station houses
144
(n=751)
144
(n=104)
79
(n=315)
246
(n=240)
98
(n=92)
1 Primary type is self-reported and denotes the provider type that represents the majority (50 or more) of EMS personnel in the system
69
Table D10 911 System Access by Geographic Region (N= number of systems participating in overall study n=number of systems responding to specific survey item)
All Systems N=800
Northeast N=106
Midwest N=336
South N=263
West N=95
Type of Provider
Percent Present within the System
Percent Distrsquon of Highest Level (n=779)
Percent Present within the System
Percent Distrsquon of Highest Level (n=105)
Percent Present within the System
Percent Distrsquon of Highest Level (n=324)
Percent Present within the System
Percent Distrsquon of Highest Level (n=256)
Percent Present within the System
Percent Distrsquon of Highest Level (n=94)
Wireless E 911 652 652 695 695 648 648 668 668 574 574
Wireless E 911 390 137 448 162 367 111 348 121 521 245
E 911 927 168 962 143 923 188 934 168 883 128
Basic 911 307 41 314 00 296 52 285 43 394 43
7 or 10 Digit Number 295 01 352 00 272 00 293 00 319 10
70
Table D11 Timely Response to Incoming Calls by Geographic Region (N= number of systems participating in overall study n=number of systems responding to specific survey item)
All Systems N=800
Northeast N=106
Midwest N=336
South N=263
West N=95
Percent indicating timely response to incoming
calls a consistent problem
558 (n=786)
648 (n=105)
444 (n=329)
652 (n=259)
602 (n=93)
Of those with consistent problems response
difficulties primarily due to
Percent Any Listed
Percent Distrsquon of Primary Difficulty
(n=786) 1
Percent Any Listed
Percent Distrsquon of Primary Difficulty (n=105)
Percent Any Listed
Percent Distrsquon of Primary Difficulty (n=329)
Percent Any Listed
Percent Distrsquon of Primary Difficulty (n=259)
Percent Any Listed
Percent Distrsquon of Primary Difficulty (n=93)
Daytime Staffing 529 262 794 492 647 375 362 134 385 82 Night time staffing 296 53 559 95 198 47 262 45 308 41
Remote or distant geographic areas
791 564 574 190 684 445 938 745 904 776
Exceptionally high demand
171 25 265 32 88 16 206 38 154 00
Provider retention 380 40 691 64 382 39 231 25 423 61 Provider recruitment 404 33 676 111 463 39 231 00 423 20
Other 53 23 44 16 74 39 50 13 19 20
1 Primary difficulty is self-reported and is the one difficulty identified as the primary difficulty selected from list
71
Table D12 Medical Direction by Geographic Region (N= number of systems participating in overall study n=number of systems responding to specific survey item)
All Systems N=800
Northeast N=106
Midwest N=336
South N=263
West N=95
Percent with Characteristic Percent with
Characteristic (n=786)
Percent with Characteristic
(n=105)
Percent with Characteristic
(n=329)
Percent with Characteristic
(n=258)
Percent with Characteristic
(n=94)
System had no physician medical direction in place 41 67 43 43 00
System has medical direction but with no one person with primary responsibility 256 371 304 167 202
Of systems with one person with primary responsibility this person is
Responsible to system agency 449 293 444 490 473 Responsible to county or EMS regional program 348 397 299 365 405 Responsible to State lead EMS agency 103 86 131 90 68 Other 100 224 126 55 54
72
Table D13 Percent Distribution of Funding Sources for System by Geographic Region (N= number of systems participating in overall study n=number of systems responding to specific survey item)
All Systems N=800
Northeast N=106
Midwest N=336
South N=263
West N=95
Funding Sources
Percent Present within the System
Percent Distrsquon of Primary Source (n=686) 1
Percent Present within the System
Percent Distrsquon of Primary Source (n=93)
Percent Present within the System
Percent Distrsquon of Primary Source (n=289)
Percent Present within the System
Percent Distrsquon of Primary Source (n=222)
Percent Present within the System
Percent Distrsquon of Primary Source (n=82)
Tax Subsidies State 185 16 144 11 159 07 190 18 315 49 County 598 249 135 21 623 214 742 396 640 232 Local 474 146 856 290 489 142 306 90 449 146
Fees for Services 909 534 942 591 922 574 905 473 832 488 Homeland Security Grants 337 01 365 00 315 00 318 00 438 12 Other Grants 473 09 394 11 461 07 472 04 607 24 Donationsfundraisers 504 26 779 75 595 35 321 00 371 12 Other 471 19 365 01 464 21 464 19 640 37
1 Primary source is self-reported and identified as primary source of funding selected from list
73
Table E1 Primary Mission1 of First Response and Transport Agencies by Size of System2
(N= number of systems participating in overall study n=number of systems responding to specific survey item)
All Systems N=720
Small (lt1000)
N=176
Medium (1000-4999)
N=223
Large (5000-9999)
N=90
Very Large (gt = 10000)
N=231
Primary Mission Percent Distrsquon of First Response
(n=657)3
Percent Distrsquon of Transport (n=708)
Percent Distrsquon of First Response (n=142)
Percent Distrsquon of Transport (n=172)
Percent Distrsquon of First Response (n=204)
Percent Distrsquon of Transport (n=220)
Percent Distrsquon of First Response (n=87)
Percent Distrsquon of Transport (n=90)
Percent Distrsquon of First Response (n=224)
Percent Distrsquon of Transport (n=226)
Fire 326 120 99 35 294 86 356 167 487 199 EMS Only 254 602
49 430 704
93 319 668
64 219 545
33 98 482
09Hospital 12 28 10 00 09 Fire and EMS 88 95 35 46 64 95 172 133 112 115 Fire and Other 289 95 366 93 269 46 230 89 281 146 All Other 31 39 42 29 44 41 23 33 13 49
1 Primary mission assigned if respondent indicated a single agency type handles majority of call volume or if all the agency types recorded fell only within a particular group
2 Size is based on number of annual EMS responses of the 800 participating systems 80 did not provide information on the annual number of EMS responses
3 Twenty-seven of the 720 systems who provided information on the size of their system do not use first responders Of the 693 systems that do data on mission of first response agencies was missing for 36 systems (52 of all systems with first response)
74
1Table E2 Primary Administration or Ownership of First Response and Transport Agencies 2
by Size of System(N = number of systems participating in overall study n=number of systems responding to specific survey item)
All Systems N=720
Small (lt1000)
N=176
Medium (1000-4999)
N=223
Large (5000-9999)
N=90
Very Large (gt = 10000)
N=231 Agency Type Percent
Distrsquon of First Response (n=657) 3
Percent Distrsquon of Transport (n=708)
Percent Distrsquon of First Response (n=142)
Percent Distrsquon of Transport (n=172)
Percent Distrsquon of First Response (n=204)
Percent Distrsquon of Transport (n=220)
Percent Distrsquon of First Response (n=87)
Percent Distrsquon of Transport (n=90)
Percent Distrsquon of First Response (n=224)
Percent Distrsquon of Transport (n=226)
StateLocal Govrsquot 705 632 747 698 711 677 678 688 683 518
For Profit (FP) 23 78 21 35 29 82 35 78 13 106
Not for Profit (NFP) 59 110
57
92 140
64
59 114
54
69 89
56
35 93
53Govrsquot amp NFP 67 56 88 69 54 Govrsquot amp FP 56 40 35 17 54 27 103 33 54 71
All Other 90 83 49 46 59 46 46 56 161 159
1 Primary administration or ownership assigned if respondent indicated a single agency type handles majority of call volume or if all the agency types recorded fell only within a particular group
2 Size is based on number of annual EMS responses of the 800 participating systems 80 did not provide information on the annual number of EMS responses
3 Twenty-seven of the 720 systems who provided information on the size of their system do not use first responders Of the 693 systems that do data on ownershipadministration of first response agencies was missing for 36 systems (52 of all systems with first response)
75
76
1 Table E3 Emergency Medical Call Taking Organizational Type of Agency by Size of System (N= number of systems participating in overall study n=number of systems responding to specific survey item)
All Systems Small (lt1000) Medium Large Very Large N=720 N=176 (1000-4999) (5000-9999) (gt = 10000)
N=223 N=90 N=231 Percent Percent Percent Percent Percent Percent Percent Percent Percent Percent Present Distrsquon of Present Distrsquon of Present Distrsquon of Present Distrsquon of Present Distrsquon of
Agency Type within Primary within Primary within Primary within the Primary within the Primary the Type the Type the Type System Type System Type
System (n=682) 2 System (n=167) System (n=218) (n=86) (n=211)
Public SafetyJoint 461 336 309 210 333 239 474 395 676 512
Police-Fire-EMS
Fire 295 67 230 30 280 55 184 47 394 118
Law Enforcement 468 295 467 341 503 383 395 267 449 175
Local EMS 411 223 487 377 429 243 276 140 389 114 Service
Other 109 79 53 42 79 78 79 151 185 81
1 Size is based on number of a nnual EMS responses of the 800 participating systems 80 did not provide information on the annual number of EMS responses
2 Primary Type was self-reported and denotes the agency that handles the majority (50 or more) of t he call volume for t he system
1Table E4 Emergency Medical Dispatching Organizational Type of Agency by Size of System(N= number of systems participating in overall study n=number of systems responding to specific survey item)
All Systems Small (lt1000) Medium (1000-4999) Large (5000- Very Large (gt = 10000) N=720 N=176 N=223 9999) N=231
N=90
Agency Type
Percent Present within the System
Percent Distrsquon Primary Type (n=667) 2
Percent Present within the System
Percent Distrsquon Primary Type (n=162)
Percent Present within the System
Percent Distrsquon Primary Type (n=204)
Percent Present within the System
Percent Distrsquon Primary Type (n=84)
Percent Present within the System
Percent Distrsquon Primary Type (n=217)
Public SafetyJoint Police-Fire-EMS 492 391 345 272 429 353 521 429 630 503
Fire 204 53 144 25 118 15 141 36 332 115
Law Enforcement 492 387 640 574 571 495 409 345 361 161
Local EMS Service 28 09 36 12 00 00 42 00 38 18
Other 190 160 129 117 168 137 183 190 250 203
1 Size is based on number of annual EMS responses of the 800 participating systems 80 did not provide information on the annual number of EMS responses
2 Primary Type was self-reported and denotes the agency that handles the majority (50 or more) of the call volume for the system
77
1 2Table E5 Most Common Level of First Response and Transport by Size of System(N= number of systems participating in overall study n=number of systems responding to specific survey item)
All Systems Small Medium (1000- Large (5000- Very Large (gt = N=720 (lt1000) 4999) 9999) 10000)
N=176 N=223 N=90 N=231
Level of Care
Percent Distrsquon of First Response (n=664) 3
Percent Distrsquon of Transport (n=709)
Percent Distrsquon of First Response (n=154)
Percent Distrsquon of Transport (n=170)
Percent Distrsquon of First Response (n=204)
Percent Distrsquon of Transport (n=220)
Percent Distrsquon of First Response (n=84)
Percent Distrsquon of Transport (n=90)
Percent Distrsquon of First Response (n=222)
Percent Distrsquon of Transport (n= 229)
ALS 365 638 188 323 426 696 464 767 392 764
ILS 87 118 176 212 108 136 48 100 22 39
BLS 548 244 636 465 466 168 488 133 586 197
1 Level of response represents the maximum capacity of the responding unitvehicle to call and not the level of care rendered
2 Size is based on number of annual EMS responses of the 800 participating systems 80 did not provide information on the annual number of EMS responses
3Twenty-seven of the 720 systems who provided information on the size of their system do not use first responders
78
79
Table E6 1 First Responder Policies and Practices by Size of System (N= number of systems participating in overall study n=number of systems responding to specific survey item)
All Systems
N=720 Small
(lt1000) N=176
Medium (1000-4999)
N=223
Large (5000-9999)
N=90
Very Large (gt = 10000)
N=231
Percent with Percent with Percent with Percent with Percent with
Policy used to Send First Responders PolicyPractice (n=576) 2
PolicyPractice (n=112)
PolicyPractice (n=178)
PolicyPractice (n=78)
PolicyPractice (n=208)
First Responders Sent to all 911 Calls 536 670 629 500 399 First Responders Sent only to calls based on
priority dispatch or other call taking system
368
179
264 410 543
Other 96 151 107 90 58
Most Common Practice (based on percentage of total calls)
Percent with PolicyPractice
(n=576)1
Percent with PolicyPractice
(n=112)
Percent with PolicyPractice
(n=178)
Percent with PolicyPractice
(n=78)
Percent with PolicyPractice
(n=208)
First Response followed by transport ambulance 33 46 39 25 24 as necessary
Simultaneous First Response and transport ambulance
858 864 836 864 871
It varies based on protocol 80 46 90 99 81 Other 29 74 35 12 24
1 Size is based on number of annual EMS responses of t he 800 participating systems 80 did not provide information on the annual number of E MS responses
2 Twenty-seven of the 720 systems who provided information on the size of their system do not use first responders
1Table E7 Operating Procedures Regarding Dispatch and Transport by Size of System(N= number of systems participating in overall study n=number of systems responding to specific survey item)
Percent of systems that All Systems N=720
Small (lt1000)
N=176
Medium (1000-4999)
N=223
Large (5000-9999)
N=90
Very Large (gt = 10000)
N=231
Allow vehicles to respond to calls without use of lights and sirens
802 (n=703)
749 (n=169)
788 (n=217)
811 (n=90)
859 (n=227)
Allow vehicles to transport non-emergent patients without use of lights and sirens
941 (n=710)
890 (n=173)
949 (n=218)
955 (n=89)
965 (n=230)
Allow providers to transport patients from the scene to non-hospital destinations
276 (n=711)
301 (n=173)
314 (n=220)
278 (n=90)
219 (n=228)
Have units that can be dispatched to perform non-emergency assessments
382 (n=709)
343 (n=169)
430 (n=221)
411 (n=90)
356 (n=229)
How many dispatch agencies offer pre-arrival instructions to callers for certain types of calls (n=718) (n=175) (n=222) (n=90) (n=231)
All 521 309 460 722 662
Some 279 331 252 156 312
None 200 360 288 122 26
1 Size is based on number of annual EMS responses of the 800 participating systems 80 did not provide information on the annual number of EMS responses
80
1Table E8 Frequency of Out of Area Response to Calls by Size of System(N= number of systems participating in overall study n=number of systems responding to specific survey item)
All Systems N=720
Small (lt1000) N=176
Medium (1000-4999)
N=223
Large (5000-9999)
N=90
Very Large (gt = 10000)
N=231
How often do your first response agencies respond to calls beyond the boundaries of their primary service areas
(n=605) (n=120) (n=192) (n=77) (n=216)
Never 164 150 172 130 176 Seldom 440 525 411 506 393 Sometimes 332 258 365 338 343 Often 64 67 52 26 88
How often do your transport agencies respond to calls beyond the boundaries of their primary service areas
(n=695) (n=163) (n=216) (n=89) (n=227)
Never 26 43 23 11 22 Seldom 306 393 338 281 225 Sometimes 495 466 495 562 489 Often 173 98 144 146 264
How often do units from other EMS systems respond to calls within your own jurisdiction (n=714) (n=173) (n=223) (n=90) (n=228)
Never 71 64 85 33 79 Seldom 595 613 610 589 570 Sometimes 290 277 283 311 298 Often 44 46 22 67 53
1 Size is based on number of annual EMS responses of the 800 participating systems 80 did not provide information on the annual number of EMS responses
81
1Table E9 Percent Distribution of EMS Provider Type by Size of System(N= number of systems participating in overall study n=number of systems responding to specific survey item)
All Systems N=720
Small (lt1000)
N=176
Medium (1000-4999)
N=223
Large (5000-9999)
N=90
Very Large (gt =10000)
N=231
Type of Provider
Percent Present within the System
Percent Distrsquon of Primary
Type 2
(n=673)
Percent Present within the System
Percent Distrsquon of Primary Type (n=165)
Percent Present within the System
Percent Distrsquon of Primary Type (n=206)
Percent Present within the System
Percent Distrsquon of Primary Type (n=85)
Percent Present within the System
Percent Distrsquon of Primary Type (n=217)
Volunteer Compensated 565 233 720 570 545 204 471 94 509 60 Non-compensated 600 184 329 182 626 214 690 176 737 161
Career Part time 606 45 317 48 649 68 690 00 741 37 Full time 839 538 516 200 891 514 966 729 973 742
Average of providers who serve as volunteers (compensated or not)
476 (n=696)
717 (n=172)
463 (n=220)
428 (n=85)
317 (n=219)
Average of total calls that are handled by volunteers (compensated or not)
376 (n=681)
659 (n=167)
354 (n=213)
329 (n=86)
196 (n=215)
Average of volunteers who typically respond to calls from Fire or EMS station houses
144 (n=675)
54 (n=167)
77 (n=207)
146 (n=82)
274 (n=219)
1 Size is based on number of annual EMS responses of the 800 participating systems 80 did not provide information on the annual number of EMS responses 2 Primary type is self-reported and denotes the provider type that represents the majority (50 or more) of EMS personnel in the system
82
1Table E10 911 System Access by Size of System(N= number of systems participating in overall study n=number of systems responding to specific survey item)
All Systems N=720
Small (lt1000) N=176
Medium (1000-4999)
N=223
Large (5000-9999)
N=90
Very Large (gt = 10000)
N=231
Type of Provider
Percent Present within the System
Percent Distrsquon of Highest Level (n= 713)
Percent Present within the System
Percent Distrsquon of Highest Level (n= 173)
Percent Present within the System
Percent Distrsquon of Highest Level (n= 221)
Percent Present within the System
Percent Distrsquon of Highest Level (n= 90)
Percent Present within the System
Percent Distrsquon of Highest Level (n=229)
Wireless E 911 658 658 526 526 620 619 722 722 769 769
Wireless E 911 391 142 295 133 366 122 311 145 520 166
E 911 931 163 867 254 928 218 967 122 969 56
Basic 911 294 36 301 81 253 41 211 11 362 09
7 or 10 Digit Number 293 01 278 06 244 00 233 00 376 00
1 Size is based on number of annual EMS responses of the 800 participating systems 80 did not provide information on the annual number of EMS responses
83
1Table E11 Timely Response to Incoming Calls by Size of System(N= number of systems participating in overall study n=number of systems responding to specific survey item)
All Systems N=720
Small (lt1000) N=176
Medium (1000-4999)
N=223
Large (5000-9999)
N=90
Very Large (gt = 10000)
N=231
Percent indicating timely response to incoming calls a consistent problem
558 (n= 717)
425 (n=174)
601 (n=223)
600 (n=90)
600 (n=230)
Of those with consistent problems response difficulties primarily due to
Percent Any
Listed
Percent Distrsquon of Primary
Difficulty (n=364) 2
Percent Any
Listed
Percent Distrsquon of Primary
Difficulty (n=70)
Percent Any
Listed
Percent Distrsquon of Primary
Difficulty (n=112)
Percent Any
Listed
Percent Distrsquon of Primary
Difficulty (n=50)
Percent Any
Listed
Percent Distrsquon of Primary
Difficulty (n=132)
Daytime Staffing 518 250 571 200 528 304 532 200 478 250 Night time staffing 288 58 300 86 240 54 298 80 324 38 Remote or distant geographic areas
791 574 771 614 760 598 766 560 838 538
Exceptionally high demand
182 27 4 3
00 136 00 149 20 309 68
Provider retention 365 36 214 14 368 18 383 120 434 30 Provider recruitment 394 33 357 57 392 18 383 20 419 38 Other 53 22 8 29 2 08 21 00 74 38
1 Size is based on number of annual EMS responses of the 800 participating systems 80 did not provide information on the annual number of EMS responses 2 Primary difficulty is self-reported and is the one difficulty identified as the primary difficulty selected from list
84
1Table E12 Medical Direction by Size of System(N= number of systems participating in overall study n=number of systems responding to specific survey item)
All Systems N=720
Small (lt1000)
N=176
Medium (1000-4999)
N=223
Large (5000-9999)
N=90
Very Large (gt = 10000)
N=231
Percent with Characteristic Percent with
Characteristic (n= 718)
Percent with Characteristic
(n= 175)
Percent with Characteristic
(n= 223)
Percent with Characteristic
(n= 89)
Percent with Characteristic
(n= 231 )
System had no physician medical direction in place 35 69 31 00 26
System has medical direction but with no one person with primary responsibility
244 308 233 213 216
Of systems with one person with primary responsibility this person is
(n=511) (n=109) (n=161) (n=69) (n=172)
Responsible to system agency 450 477 422 449 459 Responsible to county or EMS regional program 354 321 360 348 372 Responsible to State lead EMS agency 98 128 112 87 70 Other 98 74 106 116 99
1 Size is based on number of annual EMS responses of the 800 participating systems 80 did not provide information on the annual number of EMS responses
85
86
1Table E13 Percent Distribution of Funding Sources for System by Size of System
(N= number of systems participating in overall study n=number of systems responding to specific survey item)
Small Medium Large Very Large All Systems
(lt1000) (1000-4999) (5000-9999) (gt = 10000) N=720 N=176 N=223 N=90 N=231
Percent Percent Percent Percent Percent Percent Percent Percent Percent Percent Present Distrsquon of Present Distrsquon of Present Distrsquon of Present Distrsquon of Present Distrsquon of Funding Sources within Primary within Primary within Primary within Primary within Primary
the Source the Source the Source the Source the Source System (n=632)2
System (n=163) System (n=187) System (n=82 ) System (n=200)
Tax Subsidies
State 181 16 124 00 146 16 149 12 268 30 County 611 256 659 301 604 209 632 281 576 255 Local 457 141 324 86 415 144 529 195 567 160
Fees for Services 911 532 859 546 939 583 885 463 935 500 Homeland Security 336 00 329 00 274 00 253 00 429 00 Grants Other Grants 481 09 512 12 453 11 414 12 511 05 Donationsfundraisers 499 28 600 37 481 27 425 24 468 25 Other 479 18 524 18 443 10 414 13 502 25
1 Size is based on number of annual EMS responses of the 800 participating systems 80 did not provide information on the annual number of EMS re
2
sponses
Primary source is self-reported and identified as primary source of funding selected from list
Table F1 Responses to Opinion Questions by Rurality (N= number of systems participating in overall study n=number of systems responding to specific survey item)
All Systems N=800
Urban N=355
Suburban N=98
Rural N=193
Wilderness N=154
Opinion
Percent Agree or Strongly
Agree (n=787-795)
Percent Agree or Strongly
Agree (n=349-352)
Percent Agree or Strongly
Agree (n=96-98)
Percent Agree or Strongly
Agree (n=188-193)
Percent Agree or Strongly
Agree (n=153-154)
Resource Levels System is adequately staffed to meet demand 423 483 454 370 331 System has enough resources (vehicles Equipment) to meet demand 622 624 629 617 617
Public Participation Poprsquon has high level of EMS awareness participation support 396 341 385 464 444 AEDs can be found in many public places 552 614 526 557 421 Bystanders often provide CPR prior to EMS arrival 363 361 350 416 312
The public is satisfied with EMS services 787 792 722 780 824
System Support System has high level of physician involvement 570 648 649 466 471 Hospitals are supportive of EMS agenciesproviders 788 796 794 755 809 Patient Handoffs between agencies and hospitals are generally smooth 829 808 865 833 840 EMS system agencies collaborate with Non-EMS organizations 774 754 763 805 788
87
All Systems (n=800)
Urban (N=355)
Suburban (N=98)
Rural (N=193)
Wilderness (N=154)
Opinion
Percent Agree or Strongly
Agree (n=787-
795)
Percent Agree or Strongly
Agree (n=349-
352)
Percent Agree or Strongly
Agree (n=96-98)
Percent Agree or Strongly
Agree (n=188-193)
Percent Agree or Strongly
Agree (n=153-154)
ldquoTurf warsrdquo are a problem 198 239 289 163 91
Politics are a problem 361 443 392 297 234
EMS providers enjoy working in system 813 817 812 831 784
System Change
System looks much the same as 10 years ago 235 210 260 245 261
System will look much the same 10 years from now 152 136 144 153 190
Our system adapts well to change 584 594 484 576 634
88
Table F2 Responses to Opinion Questions by Geographic Region (N= number of systems participating in overall study n=number of systems responding to specific survey item)
All Systems N=800
Northeast N=106
Midwest N=336
South N=263
West N=95
Opinion
Percent Agree or Strongly
Agree (n=787-
795)
Percent Agree or Strongly
Agree (n=104-
105)
Percent Agree or Strongly
Agree (n=329-
333)
Percent Agree or Strongly
Agree (n=259-
262)
Percent Agree or
Strongly Agree
(n=93-95)
Resource Levels System is adequately staffed to meet demand 423 381 411 401 558 System has enough resources (vehicles Equipment) to meet demand 622 738 675 504 632
Public Participation Poprsquon has high level of EMS awareness participation support 396 248 486 342 394 AEDs can be found in many public places 552 800 593 455 415 Bystanders often provide CPR prior to EMS arrival 363 375 376 335 383 The public is satisfied with EMS services 787 676 855 720 853
System Support System has high level of physician involvement 570 481 546 605 653 Hospitals are supportive of EMS agenciesproviders 788 838 801 762 758 Patient Handoffs between agencies and hospitals are generally smooth 829 817 878 767 842 EMS system agencies collaborate with Non-EMS organizations 774 672 821 753 777
89
All Systems N=800
Northeast N=106
Midwest N=336
South N=263
West N=95
Opinion
Percent Agree or Strongly
Agree (n=787-
795)
Percent Agree or Strongly
Agree (n=104-
105)
Percent Agree or Strongly
Agree (n=329-
333)
Percent Agree or Strongly
Agree (n=259-
262)
Percent Agree or Strongly
Agree (n=93-95)
ldquoTurf warsrdquo are a problem 198 305 172 177 232 Politics are a problem 361 533 306 363 358 EMS providers enjoy working in system 813 654 839 831 849
System Change System looks much the same as 10 years ago 235 267 252 188 253
System will look much the same 10 years from now 152 95 163 146 189
Out system adapts well to change 584 362 599 634 638
90
1Table F3 Responses to Opinion Questions by Size of System(N = number of systems participating in overall study n = number of systems responding to specific survey item)
All Systems N=720
Small (lt1000) N=176
Medium (1000-4999) N=223
Large (5000-9999) N=90
Very Large (gt =
10000) N=231
Opinion
Percent Agree or Strongly
Agree (n=711-719)
Percent Agree or Strongly
Agree (n=173-
176)
Percent Agree or Strongly
Agree (n=220-
223)
Percent Agree or Strongly
Agree (n=89-
90)
Percent Agree or Strongly
Agree (n=-227-
230)
Resource Levels
System is adequately staffed to meet Demand 421 318 399 433 517 System has enough resources (vehicles Equipment) to meet demand 629 648 600 622 646
Public Participation Poprsquon has high level of EMS awareness participation support 409 486 395 449 348 AEDs can be found in many public places 547 466 482 578 661 Bystanders often provide CPR prior to EMS arrival 373 358 353 472 367
The public is satisfied with EMS services 802 833 780 832 787
System Support System has high level of physician involvement 578 451 522 656 697 Hospitals are supportive of EMS agenciesproviders 795 789 740 865 826
91
Patient Handoffs between agencies and hospitals are generally smooth 835 862 830 833 819
1 Size is based on number of annual EMS responses of the 800 participating systems 80 did not provide information on the annual number of EMS responses
92
All Systems Small Medium Large Very Large N=720 (lt1000)
N=176 (1000-4999) N=223
(5000-9999) N=90
(gt = 10000) N=231
Opinion
Percent Agree or Strongly
Agree (n=711-719)
Percent Agree or Strongly
Agree (n=173-
176)
Percent Agree or Strongly
Agree (n=220-
223)
Percent Agree or
Strongly Agree
(n=89-90)
Percent Agree or Strongly
Agree (n=-227-
230)
EMS systemagencies collaborate with Non-EMS organizations 790 798 787 833 771 ldquoTurf warsrdquo are a problem 198 153 193 159 253
Politics are a problem 360 239 350 311 483
EMS providers enjoy working in system 824 805 836 820 829
System Change System looks much the same as 10 years ago 230 297 202 191 222 System will look much the same 10 years from now 149 195 144 133 126 System adapts well to change 593 615 560 633 591
93
12 Table F4 Mean Scores on Summary Measures by Rurality Geographic Region and Size of the System
Mean Score (0-100) Percent Satisfied
System Support
Lack of System Politics
System Resources
Bystander Action
Public Satisfaction
Adapts Well to Change
All Systems 715 589 546 542 787 584
Rurality Urban 728 543 553 569 792 594 Suburban 741 538 571 543 722 484 Rural 707 629 558 562 788 576 Wilderness 708 679 522 474 824 634
Geographic Region Northeast 709 485 549 642 676 362 Midwest 726 627 571 556 855 599 South 713 598 514 513 720 634 West 732 557 576 496 853 638
Size of System lt1000 703 673 545 504 833 615 1000-4999 709 581 539 516 780 560 5000-9999 749 602 567 587 832 633 gt=10000 732 533 558 588 787 591
1 Size is based on number of annual EMS responses of the 800 participating systems 80 did not provide information on the annual number of EMS responses
2 + p lt010 plt 005 plt 001
94
Table F5 Regressions Results Modeling Opinion Summary Measures by Selected System Characteristics
Regression Coefficients from Multiple Linear Odds Ratios from
Multiple Positive System Support
Lack of System Politics
Adequate System
Resources
Bystander Action
Public Satisfaction
Adapts Well to Change
Rurality Urban REF REF REF REF REF REF Suburban -052 -198 094 -354 063 058 Rural -226 633 -063 -089 083 086 Wilderness -248 1150 -529 -107 084 110
Geographic Region Northeast REF REF REF REF REF REF Midwest 322 + 714 324 -546 270 259 South 018 564 + -627 -1360 073 259 West 231 436 280 -1210 250 270
Mission of Transport Agency EMS Only REF REF REF REF REF REF Fire Fire amp EMS Fire amp Another -104 -340 -339 + -159 079 098 All other 298 -062 -524 + -066 043 083
Admin Ownership of Transport Agency State or Local Government REF REF REF REF REF REF Not For Profit -223 058 -130 -012 093 087 For Profit and All others 075 -548 -197 -277 058 116
Primary Funding Source All Other REF REF REF REF REF REF Tax Subsidies (State or local) -215 + 270 -273 -249 107 080
Medical Direction All Other (including none) REF REF REF REF REF REF Single Person Responsible 439 043 275 069 147 + 119
of Providers that are Volunteer gt 50 REF REF REF REF REF REF
lt=50 092 149 512 296 238 196 + p lt010 plt 005 plt 001
95
96
DOT HS 811 824 August 2013
9785-111413-v2

DISCLAIMER
This publication is distributed by the US Department of Transportation National Highway
and conclusions expressed in this publication are those of the authors and not necessarily those
The United States Government assumes no liability for its contents or use thereof If trade names
to the object of the publication and should not be construed as an endorsement The United States Government does not endorse products or manufacturers
Suggested APA Format Citation
MacKenzie EJ amp Carlini AR (2013 August) Characterizing local EMS systems (Report No DOT HS 811 824) Washington DC National Highway Traffic Safety Administration
Technical Report Documentation Page 1 Report No
DOT HS 811 824
2 Government Accession No
3 Recipients Catalog No
4 Title and Subtitle Characterizing Local EMS Systems
5 Report Date August 2013
6 Performing Organization Code
7 Author(s)
Ellen J MacKenzie Anthony R Carlini
8 Performing Organization Report No
9 Performing Organization Name and Address
Center for Injury Research and Policy Johns Hopkins Bloomberg School of Public Health 624 North Broadway 5th Floor Baltimore MD 21205
10 Work Unit No (TRAIS)
11 Contract or Grant No
DTNH22-08-H-00194
12 Sponsoring Agency Name and Address
US Department of Transportation National Highway Traffic Safety Administration 1200 New Jersey Avenue SE Washington DC 20590
13 Type of Report and Period Covered
14 Sponsoring Agency Code
15 Supplementary Notes
Ian Reagan served as the NHTSA Contracting Officers Technical Representative for the study
16 Abstract Emergency medical services (EMS) systems are configured differently depending on several factors including the size demographics geography and politics of the local communities they serve Although some information exists about the organization financing and delivery of EMS in the Nationrsquos 200 largest cities there is less information available about how services are organized outside large urban areas in which 75 percent of the nationrsquos population resides There is little evidence to support alternative system designs and configurations in terms of their impact on the effectiveness and efficiency of service delivery To this end there is a need to document the variation in system configurations so they may be evaluated on a common basis
22 Key Words
Emergency medical services (EMS)
EMS Systems
18 Distribution Statement
Document is available to the public from the National Technical Information Service wwwntisgov
19 Security Classif(of this report)
Unclassified
20 Security Classif(of this page)
Unclassified
21 No of Pages
104
22 Price
Form DOT F 17007 (8-72) Reproduction of completed page authorized
i
TABLE OF CONTENTS EXECUTIVE SUMMARY 1
INTRODUCTION AND OBJECTIVES 3
METHODS 4
Operationalizing the Definition of ldquoSystemrdquo 5
Interviews With State EMS Directors 6
Survey of Local Systems 7
RESULTS 9
Characterization of States 10
Identification of Systems and Rates of Participation in the Study 13
Characteristics of Systems by Rurality Geographic Region and Size 17
System Outlook by Characteristics of Systems 22
SUMMARY AND DISCUSSION 26
REFERENCES 38
TABLES 41
ii
Tables
A Characterization of States
Table A1 Characteristics of States ndash Demography Table A2 Characteristics of States ndash Mortality Rates
B Identification of Local Systems and Response Rates to Local Surveys
Table B1 Number of Local Systems Identified and Response (Participation) Rates by State
Table B2 Rates of Participation by Rurality and Geographic Region Table B3 Percent Distribution of Number of EMS Providers Annual Number of 911
Calls and Annual Number of EMS Responses by Rurality) Table B4 Percent Distribution of Number of EMS Providers Annual Number of 911
Calls and Annual Number of EMS Responses by Geographic Region
C System Characteristics by Rurality
Table C1 Primary Mission of First Response and Transport Agencies by Rurality Table C2 Primary Administration or Ownership of First Response and Transport
Agencies by Rurality Table C3 Emergency Call Taking Organizational Type of Agency by Rurality Table C4 Emergency Medical Dispatching Organizational Type of Agency by
Rurality Table C5 Most Common Level of First Response and Transport by Rurality Table C6 First Responder Policies and Practices (for areas of systems that use first
responders) by Rurality Table C7 Operating Procedures Regarding Dispatch and Transport (for areas of
systems that use first responders) by Rurality Table C8 Frequency of Out of Area Response to Calls by Rurality Table C9 EMS Provider Type by Rurality Table C10 911 System Access by Rurality Table C11 Timely Response to Incoming Calls by Rurality Table C12 Medical Direction by Rurality Table C13 System Financing by Rurality
D System Characteristics by Geographic Region
Table D1 Primary Mission of First Response and Transport Agencies by Geographic Region
Table D2 Administration or Ownership of First Response and Transport Agencies by Geographic Region
Table D3 Emergency Call Taking Organizational Type of Agency by Geographic Region
Table D4 Emergency Medical Dispatching Organizational Type of Agency by Geographic Region
iii
Table D5 Most Common Level of First Response and Transport by Geographic Region
Table D6 First Responder Policies and Practices (for areas of systems that use first responders) by Geographic Region
Table D7 Operating Procedures Regarding Dispatch and Transport (for areas of systems that use first responders) by Geographic Region
Table D8 Frequency of Out of Area Response to Calls by Geographic Region Table D9 EMS Provider Type by Geographic Region Table D10 911 System Access by Geographic Region Table D11 Timely Response to Incoming Calls by Geographic Region Table D12 Medical Direction by Geographic Region Table D13 System Financing by Geographic Region
E System Characteristics by Size of System (based on annual number of EMS responses)
Table E1 Primary Mission of First Response and Transport Agencies by Size of System
Table E2 Administration or Ownership of First Response and Transport Agencies by Size of System
Table E3 Emergency Call Taking Organizational Type of Agency by Size of System Table E 4 Emergency Medical Dispatching Organizational Type of Agency by Size of
System Table E5 Most Common Level of First Response and Transport by Size of System Table E6 First Responder Policies and Practices (for areas of systems that use first
responders) by Size of System Table E7 Operating Procedures Regarding Dispatch and Transport (for areas of
systems that use first responders) by Size of System Table E8 Frequency of Out of Area Response to Calls by Size of System Table E9 EMS Provider Type by Size of System Table E10 911 System Access by Size of System Table E11 Timely Response to Incoming Calls by Size of System Table E12 Medical Direction by Size of System Table E13 System Financing by Size of System
F Subjective Assessment of System Outlook by System Characteristics
Table F1 Responses to Opinion Questions by Rurality Table F2 Responses to Opinion Questions by Geographic Region Table F3 Responses to Opinion Questions by Size of Region Table F4 Eigenvalues and Proportion of Variance Explained Initial Principal
Components Analysis Table F5 Factor Loadings Varimax Rotation of Components Table F6 Mean Scores on Summary Measures by Rurality Geographic Region and
Size of the System Table F7 Regression Results Modeling Outlook Summary Measures by Selected
System Characteristics
iv
EXECUTIVE SUMMARY
An important first step in studying the impact of EMS system design on quality and outcomes is a more systematic characterization of local EMS systems While some data exist to characterize EMS services in 200 of the nationrsquos largest cities this information is incomplete and does not address how services are organized outside large urban areas The present study was designed to address this gap in our information
In a previous study the Center for Injury Research and Policy collected data with State and local EMS directors to characterize
bull Overall size of EMS systems bull Access to systems through 911 bull Provider and dispatch agency types bull Response configurations operating procedures and use of volunteers bull Mutual-aid agreements and response to calls outside the primary service area bull Medical control and bull Source of system funding
For the current study using the information gleaned from these surveys we investigated the variation in systems by geographic region of the country the rurality of the area serviced by the system and the overall size of the system as defined by the number of EMS calls responded to annually The survey also contained a series of subjective assessments focusing on adequacy of resource levels and system support extent to which bystanders were involved in EMS and adaptation of the system to change
In the broadest terms the most obvious difference noted was how each State related our operational definition of a local EMS system to itself States choose to organize local emergency medical services coordination in a variety of ways from hospital-centered models to county-based systems to larger regional entities Fifteen States identified systems that were at either a county or equivalent level although many States identified regional or multi-jurisdictional areas to survey States were consistent in how their areas were divided (eg county versus regional) although a few States did provide contact information for both types of areas as well as independent cities or miscellaneous systems such as hospitals or tribal authorities It is important to note that there were areas identified in ten States where no systems existed according to our operational definitions Conversations with the State EMS offices revealed that while there were EMS agencies operating in these areas they did not operate under a coordinated local administration
In addition to documenting overall variation in the organization and delivery of EMS across systems this study underscored the challenges faced by systems providing services in rural and wilderness areas of the country Most apparent (and of potential concern) are low percentages in rural and wilderness areas of full-time versus part-time and career versus volunteer EMS providers ALS versus BLS providers involved in
1
transport and dispatch agencies providing pre-arrival instructions In addition a higher percentage of systems in more ruralwilderness versus urbansuburban areas had no medical direction in place and or had some organized medical direction but with no one person with primary responsibility System financing was clearly a challenge for all systems but a slightly higher percentage of systems in rural and wilderness areas rely on fee for service as their primary source of funding
Variation across States is a ubiquitous theme in EMS and is well supported by the results of this study States have evolved quite differently in how they handle the oversight of EMS With such contrasting approaches in State regulation and policy along with differences in overall size demographics and geography it is not surprising that we saw variability in our data across these States
2
Characterizing Local EMS Systems in the United States Final Report
A Introduction and Objectives
Modern Emergency Medical Services (EMS) systems are generally thought to have begun with the release of Accidental Death and Disability The Neglected Disease of Modern Society by the National Academy of Sciences National Research Council in 1966 (also known as the ldquowhite paperrdquo) which called attention to the lack of coordinated care for the injured (1) The early Federal response to this report was the establishment of the Highway Safety Bureau including its critical EMS component and the development of National Standard Curricula for EMTrsquos and Paramedics
Increasing attention to the importance of EMS ultimately led to the passing of the Emergency Medical Services System Act of 1973 (2) which provided definition to the concept of a regionalized EMS system and planted the seed for development of infrastructure through increased Federal coordination and substantial funding to incentivize the creation of such systems System development during this era focused largely on functional components but did not prescribe how the system was to be implemented or which individuals or organizations would take on this role (3)
The 1970s saw the rapid expansion of regional EMS systems and advances in some overarching standards but Federal oversight of EMS system development waned over the following decades as funding shifted to block grant programs in the early 1980s placing oversight and prioritization efforts back in the hands of State and local authorities (4) Today EMS systems are innately seen as local entities (5) The coordination of such systems including the various roles of interdependent entities is inherently difficult (6) The result of such decentralization along with the steadily reduced funding streams and lack of a coordinated infrastructure is a highly fragmented system of care throughout the country (4)
Nearly half of a century after the creation of modern EMS systems there is still little consensus as to what comprises the ideal EMS system There are many approaches to EMS service delivery each with notable advantages and disadvantages (7) Additionally EMS systems continue to evolve in response to the overall changes within the health care system as well as in the marketplace (8) Overton and Stout (9) contend that there are more than 30 designs for providing EMS services and acknowledge the difficulty of more broadly comparing systems using traditional methods They and others point to the need to better understand how different EMS configurations impact the quality and outcome of service delivery Without the capability of determining what characteristics of EMS systems are most effective and efficient the National Highway Traffic Safety Administration (NHTSA) is unable to establish effective guidelines for EMS best practices that could be used by EMS providers to assess and ultimately improve their performance
An important first step in studying the impact of EMS system design on quality and outcomes is a more systematic characterization of local EMS systems While some data
3
exist to characterize EMS services in 200 of the nationrsquos largest cities (25) this information is incomplete and does not address how services are organized outside large urban areas
The present study was designed to address this gap in our information Through interviews with the State EMS directors we identified how EMS services were organized into systems of care at the local level Surveys were sent contacts representing these local systems and information obtained to characterize
bull Overall size of the system bull Access to the system through 911 bull Provider and dispatch agency types bull Response configurations operating procedures and use of volunteers bull Mutual-aid agreements and response to calls outside the primary service area bull Medical control and bull Source of funding for the system
Using the information gleaned from these surveys we investigated the variation in systems by geographic region of the country the rurality of the area serviced by the system and the overall size of the system as defined by the number of EMS calls responded to annually
The survey also contained a series of subjective assessments focusing on adequacy of resource levels and system support the extent to which bystanders were involved in EMS and adaptation of the system to change These opinions on the outlook of the system were summarized and correlations with system characteristics explored
B Methods
In this section we describe the methods used to identify and survey local EMS systems (our unit of analysis) The approach used is similar to that used by MacKenzie et al(10) in a pilot study designed to characterize EMS systems within the Mid-Atlantic region of the country (New Jersey Pennsylvania Delaware Maryland West Virginia the District of Columbia Virginia and North Carolina) The pilot study was successful in gathering descriptive information regarding system organization call volume first response and transport agency types 911 access medical control funding sources and mutual aid agreements Although the response rate was high (86) several limitations of the survey were identified In particular terms were not well defined leading to ambiguity in some of the responses In addition the pilot study did not adequately characterize EMS agencies by their mission and their administrative home or ownership
To create the survey used for the current analysis a national panel of experts was convened to discuss the pilot study and its results review the objectives of the current study assist in operationalizing the definition of ldquolocal systemrdquo and assist in refining the survey and methods used for eliciting participation in the study During the early stages of the project (and upon recommendation of the expert panel) support for the
4
project was sought from the National Association of State EMS Officials (NASEMSO) Additional guidance was garnered from the EMS Systems Subcommittee of the National EMS Advisory Council (NEMSAC) Members of the expert panel included
bull Robert Bass MD FACEP ndash Executive director Maryland Institute for Emergency Medical Services Systems
bull Karen Halupke RN MEd ndash Director Office of Emergency Medical Services (New Jersey)
bull Joseph Schmider ndash Director Bureau of Emergency Medical Services (Pennsylvania)
bull Dia Gainor MPA EMT-P (ret) ndash Chief Emergency Medical Services Bureau (Idaho)
bull Jim DeTienne - Supervisor EMS and Trauma Systems Section (Montana) bull Paul Patrick - Bureau director Emergency Medical Services and Preparedness
(Utah) bull Dan Manz ndash Director Vermont Emergency Medical Services bull N Clay Mann PhD MS ndash Principle investigator NEMSIS Technical
Assistance Center bull Drew Dawson ndash Director National Highway Traffic Safety Administration
Office of Emergency Medical Services bull Susan McHenry MS ndash EMS Specialist National Highway Traffic Safety
Administration Office of Emergency Medical Services
B1 Operationalizing the Definition of ldquoSystemrdquo
A first important step was the development of an operational definition of ldquolocal systemrdquo Traditionally an EMS system has been defined as a comprehensive coordinated arrangement of resources and functions organized to respond to medical emergencies in a timely manner (2) This definition performs well when looking at the broader functions or components of the system but falls short when attempting to identify system entities at the jurisdictional level For example a single provider agency (eg for call taking dispatch first response and transport) may be able to adequately act upon the 15 components originally outlined in the Emergency Medical Services Act of 1973 and later modified in the EMS Agenda for the Future (11) but this would only illustrate enough coordination to internally operate and often does not touch on broader issues such as policy development or regionalization of services
For the purpose of this study a local EMS system is operationally defined as being present when there is an identifiable local entity within a State EMS systemrsquos administrative hierarchy below the State level (if the State is sufficiently large enough) and immediately above the level of an individual provider agency (See Figure 1)
5
Figure 1 Local EMS Systems A Framework
In instances where an agency is the sole provider for a jurisdiction andor that agency serves in a leadership capacity to other services (ie there is not an independent administrative body for the jurisdiction) it is regarded as an EMS system At the core of this particular definition is a desire to evaluate EMS at a level sufficiently close to the localities served by care personnel but also a need to ensure that we could measure features that looked beyond the organizational boundaries of just a single provider agency It should be noted that aeromedical and interfacility transport agencies were not considered as part of this study for the purposes of system identification or within the context of gathering survey data
B2 Interviews of State EMS Directors
In a previous project conducted at Johns Hopkins University the project staff conducted semi-structured phone interviews with each Statersquos EMS director to collect contextual information to assist in defining local systems and evaluating the local data
6
collected from their States We began each interview with a brief description of the study and continued with questions about the Statersquos role in overseeing the EMS system and the presence of a regional EMS structure Additional questions prompted further description of the directorrsquos opinion on expected differences across his or her State and its regions as well as the role of local and regional authorities in EMS planning and evaluation We continued the interview with more structured questions that asked about the responsibilities for 15 EMS system functions at 7 different EMS system levels within the State (State regional countymunicipality agencyservice hospital tribal and other) (see Attachment A Structured Interview of State EMS Directors) Each interview concluded with a request for contact information to facilitate our follow up with local EMS systems meeting our definition Interviews with State EMS directors lasted an average of 30 minutes
Following the interview of each State EMS director project staff worked with each State EMS office to gather a list of contacts for systems identified per the definition provided during the interview process Contact information was collated as part of a Microsoft Access database used for the purposes of creating mailing lists for survey distribution as well as response tracking
B3 Survey of Local Systems
In the second phase of the data collection project we used the contact information provided by State EMS directors to survey local EMS systems All EMS systems meeting our specified criteria were mailed a 24-question survey along with a postage-paid return envelope The survey was accompanied by a cover letter indicating the nature of the project the support of the State EMS office and contained a URL that allowed the system administrators to complete the survey via the Web instead of by hard copy This package was sent to the contact identified by the State EMS office typically the director of EMS for the system The survey addressed the following topics
bull Overall size of the system as characterized by the annual number of EMS responses and transports as well as the total number of EMS personnel
bull Access to the system through 911 bull Provider and dispatch agency types bull Response configurations operating procedures and use of volunteers bull Mutual-aid agreements and response to calls outside the primary service area bull Medical control and bull Source of funding for the system
The survey also contained a series of subjective assessments focusing on adequacy of resource levels and system support extent to which bystanders were involved in EMS and adaptation of the system to change Finally respondents were given the opportunity to provide additional narrative to better describe any unusual system structure functions or arrangements
7
Non-respondents received up to three follow up mailings with pre-paid return envelopes as well as follow-up phone calls or faxes as needed The survey used for this study was based on the initial draft used in the pilot study with the following refinements bull Response categories were altered for several questions to provide more specificity
in responses bull When asked to describe a specific characteristic that pertains to the ldquomajorityrdquo of
services or personnel a definition of ldquomajorityrdquo was provided bull When characterizing agency types for first responder and transport agencies
present in the system the survey allowed for a broader classification of both ownership and mission
bull A question was added to better distinguish between call taking and dispatch agencies
bull A single response configuration question was broken out into three separate questions to better evaluate common responses for first response and transport separately
bull A question was added on non-emergency assessments bull A question was added to ascertain extent of out of area responses within own
jurisdiction bull Questions regarding types of volunteers medical direction and timely response
problems were refined
In the current project we entered the previously collected data into a Microsoft Access database and analyzed the data using the SAS statistical software package When necessary a research assistant contacted survey respondents to clarify logical inconsistencies in the data collected or to ensure proper data entry (eg due to illegibility) Analyses were primarily descriptive focusing on frequencies of characteristics and exploration of differences across the States
System characteristics were summarized for the country overall and by region of the country rurality of the area serviced by the system and self-reported system size of the area serviced by the system as measured by the annual number of EMS responses
bull Regions of the country were classified as Northeast Midwest South and West as defined by the US Census Bureau (12)
bull The size of the EMS system was based on self-report and categorized into four groups based on the distribution of annual number of EMS responses as reported by the systems themselves (Low le 999 calls Moderate = 1000 ndash 4999 calls High = 5000 ndash 9999 calls Very High = 10000 or more calls) Self-reported data on size were not available for 80 (100) of the participating systems
bull Classification of rurality was based on 2003 urban influence codes (13) and divided into four categories used in other EMS applications such as NEMSIS These data were obtained from the 2007 Area Resource File(14) and the categories defined as follows
Urban UIC1 In large metro area of 1+ million residents
8
UIC2 In small metro area of less than 1 million residents Suburban
UIC3 Micropolitan adjacent to large metro UIC5 Micropolitan adjacent to small metro
Rural UIC4 Noncore adjacent to large metro UIC6 Noncore adjacent to small metro with own town UIC8 Micropolitan not adjacent to a metro area UIC9 Noncore adjacent to micro with own town
Wilderness UIC7 Noncore adjacent to small metro with no own town UIC10 Noncore adjacent to micro with no own town UIC11 Noncore not adjacent to metro or micro with own town UIC12 Noncore not adjacent to metro or micro with no own town
(A Metropolitan Area is defined as having at least one urbanized area of 50000 or more population plus adjacent areas socially and economically tied to the core a Micropolitan Area as having at least one urban cluster of at least 10000 but less than 50000 population plus adjacent areas socially and economically tied to the core and a Noncore Area is defined as neither metropolitan nor micropolitan)
In instances where more than one urban influence code was associated with a participating system the system was classified according to the most urban value
C Results
In this Section we begin with a characterization of States to provide context for the results We then proceed in summarizing the identification of local systems by the State EMS offices and the extent to which local systems agreed to participate in the study and complete the survey We summarize the results of the survey with particular attention paid to variations in system characteristics by rurality and geographic region We end with summarizing the subjective assessments of the respondents on a number of factors relating to resource levels system support bystander involvement and adaptability to system change and exploring the correlates of these subjective assessments
The statistical significance of differences across geographic region rurality and system size were examined using chi-square analysis and Fisherrsquos exact tests for dichotomous and categorical variables and t-tests and analysis of variance (ANOVA) for continuous variables In instances where ANOVA results showed significant differences Duncanrsquos multiple range test (p = 005) was applied for post-hoc comparison of the means among the groups Regression analysis techniques were used to summarize the opinion data as a function of organizational and system level variables collected as part of the survey Additionally principal component analysis was used to reduce the opinion question data into summary scores for use in further regression analyses Maps were generated using ArcMap GIS software (15)
9
C1 Characterization of States
Tables A1 and A2 provide a summary of general State characteristics including geographic size population and demographics as well as age-adjusted estimates of mortality both overall and for the three major causes associated with a large percentage of EMS calls (injury stroke and heart disease) Data to characterize the States and their counties come from the 2007 Area Resource File (14) State mortality rates were obtained from the Centers for Disease Control and Prevention through its Web-Based Injury Statistics Query and Reporting System (WISQARS) (37) and the Wide-Ranging Online Data for Epidemiologic Research (WONDER) (38) reporting systems
The total percentage of the population who live in urban areas ranges across States from 100 (District of Columbia New Jersey and Rhode Island) to less than 40 (Montana Vermont and Wyoming) Twenty-one States have less than 1 of its population living in wilderness counties however there are 9 States where this percentage is greater than 10 and 4 States where it is greater than 20 (Montana 39 of 56 counties are categorized as wilderness 202 population South Dakota 41 of 66 counties 218 population Alaska 21 of 27 counties 244 population North Dakota 38 of 53 counties 248 population) A total of 1090 counties in the United States are categorized as urban 393 as suburban 963 as rural and 695 as wilderness
One-half of the States have no counties categorized as persistent poverty counties (defined as 20 or more of residents measured as poor in each of the 1970 1980 1990 and 2000 censuses) although this rate is as high as 622 in Mississippi and 500 in Louisiana Four States (District of Columbia Kansas Nebraska and North Dakota) have more than half its counties demonstrating population loss (defined as a decline in residents between the 1980 and 1990 censuses and between the 1990 and 2000 censuses) which is in contrast to 15 States where none of the counties meet this definition
Age-adjusted mortality rates due to injury range from 373 per 100000 population in New York to 1009 per 100000 population in New Mexico (Table A2) Deaths due to cerebrovascular disease are lowest in New York (274 per 100000 population) and highest in Alabama (554 per 100000 population) Minnesota has the lowest rates of deaths due to heart disease (1266 per 100000 population) but the rate is more than double this (2602 per 100000 population) in Mississippi Overall age adjusted mortality ranges from 5906 per 100000 population in Hawaii to 9585 per 100000 population in West Virginia
As indicated above we contacted State EMS representatives from all 50 States as well as the District of Columbia and asked them to participate in the study beginning with a brief personal interview Forty-nine of 51 (961) State EMS officials participated in the interview process (neither Georgia nor Wyoming participated) Each interviewee
10
provided an overview of EMS operations in his or her State as well as answered a set of questions outlining the levels within the State where responsibilities for 15 EMS system functions resided All States but Oregon provided contact data for a survey of local EMS systems Figure 2 provides an overview of system function responsibilities as reported by the State EMS director or his her designee
Table 1 Percentage of States reporting responsibility for system functions by level within the State
Overall State EMS offices engaged in wide variety of activities with more than half the responding States indicating that 11 of the 15 system functions listed occurred at their level At the State level the overwhelming majority of States indicated their offices had responsibilities in the areas of providing technical assistance as well as certifying and licensing EMS providers However most States did not have responsibilities directly related to the education of providers call taking dispatching or coordination of aeromedical dispatch A large majority of States (898) reported that counties or municipalities have responsibilities related to EMS funding Approximately two-thirds noted that dispatching (694) and call taking (673) also occur at this level Most States did not report having EMS agencies or services responsible for provider certification or licensure (both 306) and only 143 indicated that services in their States engage in providing technical assistance As expected most States indicated that their agencies or services have responsibilities related to funding (918) medical direction (816) and quality improvement activities (816)
Nationwide the majority of States indicated that a regional authority did not have responsibility for any of the system functions listed although a moderate number of
11
States indicated regions took on responsibilities for providing technical assistance (429) and medical direction (388) Similarly less than one quarter of the responding States indicated that hospitals had a role in any of the system functions and only medical direction and funding activities occur at the tribal level but in very few States
Most States indicated that EMS medical directors are identified primarily at the agencyservice and State levels Similarly these levels also had the largest roles in establishing treatment and triage protocols Both provider certification and licensure reside primarily at the State level for most States with agencies and services also taking on such roles in nearly one third of States Provider credentialing occurs in the majority of States at either the State or agencyservice level The education of EMS providers is often realized through the agencies or services they work for although nearly half the States indicated that the State also plays a role here
Three-quarters of responding States indicated that the State itself has responsibility for the creation and maintenance of the communications system although these functions also reside at other system levels for approximately 20 to 40 of the respondents Approximately two-thirds of the respondents indicated that dispatching functions occur through either the countymunicipality or agency service levels Over 60 of States indicated that EMS agencies and services had responsibilities for call taking activities and coordination of aeromedical dispatch
Funding sources to support local EMS operations included the agencies themselves (presumably from billing and fees) counties and municipalities (supported by a tax base) and State-level funding (State funds generated through fees and other programs) Development of patient care reports took place primarily at the State level although more than half of the States indicated that this also occurs at the service level
Quality improvement efforts occurred in more than 80 of States at the agencyservice level however States and regions also took on this role in 571 and 286 of responding States respectively The provision of technical assistance as expected was largely a State and regional responsibility in most States
Although several questions from the structured portion of the interview inquired about differences that might be present for a given system function when considering ALS and BLS levels of care only California New Jersey and South Dakota indicated any such differences existed In New Jersey these were in the areas of treatment protocol development provider education as well as the creation and maintenance of a communications system California indicated EMS agenciesservices had secondary responsibilities for BLS licensing and certification of providers In South Dakota the only reported differences were for treatment protocol development
On the whole responsibilities for many functions at particular system levels did not vary much However there were a few statistically significant differences observed across regions Reported rates of medical direction at the countymunicipality level were higher in both the South and West (688 and 500 respectively versus 184 and
12
83 in the Northeast and Midwest) Responsibilities for provider credentialing and dispatching functions at the regional level were higher in the Northeast and West (333 and 167 for credentialing 222 and 250 for dispatching respectively) while absent (00) in the other regions Similarly regional quality improvement responsibilities ranged from 250 to 556 of States from all regions except the Midwest where it was absent at the regional level
Treatment protocol development at the agencyservice level varied widely by geographic region with this function occurring in only 111 of Northeast States versus 917 of Midwest States Similarly triage protocol development ranged from 222 in the Northeast to 750 in the Midwest All States in the Northeast indicated the State had responsibilities for triage protocol development while this was only the case in one third of Midwestern States Call taking functions at the State level were lowest in the South at 63 while other regions noted this was a responsibility in 417 to 667 of States Finally medical direction at the tribal level was notably low in all regions (and completely absent in the Northeast) but present in 50 of the States in the West
When considering the number of system functions engaged in by the various system levels States and agencies seemed to have responsibility for many of the functions in the responding States (mean number of functions with State responsibility = 916 mean number of functions with agencyservice responsibility = 827) Conversely most States did not report many functions being conducted at tribal or other levels (mean number of functions 022 and 059 respectively) The number of functions by level was also explored by region of the country Statistically significant differences were observed in the number of functions engaged in at the State (Northeast higher than other regions) regional (Midwest below other regions) and tribal (West and Midwest have higher means than South and Northeast regions) levels
C2 Identification of Local Systems and Rate of Response to the Survey
Table B1 summarizes by State the number of local systems identified the number of surveys distributed and the rate of response to those surveys (ie rate of system participation in the study) Also indicated is the percentage of land in each State that is covered by the participating systems the percentage of the population in a State that is covered by the participating systems as well as both land and population coverage for the United States overall
Fifteen States identified systems that were at either a county or equivalent level although many States identified regional or multi-jurisdictional areas to survey States were consistent in how their areas were divided (eg county versus regional) although a few States did provide contact information for both types of areas as well as independent cities or miscellaneous systems such as hospitals or tribal authorities Rhode Island and Hawaii (respectively the first and fourth smallest States measured by land area not counting the District of Columbia) indicated the appropriate place for the local survey using our definition would be the State EMS office itself It is important to note that there were areas identified in 10 States where no systems existed according to our operational definitions (therefore potential land mass coverage would be less than
13
100) Conversations with the State EMS offices revealed that while there were EMS agencies operating in these areas they did not do so under a coordinated local administration As a result these EMS agencies operated almost completely independent of each other and would interact directly with the State EMS agency on any matters (eg protocols certification) that was outside the scope of its organizational walls
Overall 1268 local EMS systems in 48 States and the District of Columbia were identified and 1257 surveys were distributed for those systems where contact information was confirmed (note Oregon Wyoming and Georgia did not provide contacts for local systems) Of the 1257 surveys distributed 800 (636) were completed (Table B2) Participation rates varied by State with 646 of the States having response rates of more than 50 and 12 (250) States having response rates exceeding 75 (Table B2 and Figure 3)
While the responding systems covered only 440 of the land in the United States they represented 636 of the US population Response rates did not differ significantly by geographic region of the country (X2= 331 p=035) or by rurality (X2= 186 p=060) Figure 4 displays the areas represented by the local EMS systems participating in the survey Figure 5 exhibits the percent of the population covered by the participating systems by State The distribution of participating systems by rurality and size is summarized in Table B3 and geographic region and size is summarized in Table B4
14
15
Figure 2 Percentage of systems participating in the survey by State
Figure 3 Land area covered by local systems participating in the survey
16
Figure 4 Percentage of the population covered by local systems participating in the survey
C3 Characteristics of Systems by Rurality Geographic Region and Size
In Tables C1- C13 we describe the characteristics of the 800 participating systems by Rurality in Tables D1-D13 by Geographic Region and in Tables E1- E13 by Size of the System (as defined by self-reported number of EMS responses per year) In each of these tables N refers to the total number of participating systems and the number of systems responding to any specific questions is noted by the (n) in parenthesis In the summary below we focus on differences by geographic region and rurality Due to the high correlation between system size and rurality classification (See Table B3) descriptions of variation by size would be largely redundant of those related to rurality and therefore excluded from the summary below
Mission and AdministrationOwnership of EMS Agencies Each participating system was provided the opportunity to characterize the first response and transport agencies that comprise the system using an organizational matrix Along one axis of the matrix
17
was the legal structure of administration or ownership for the systems entities This axis is divided into 9 items ranging from various governmental arrangements to private business structures (heretofore referred to as ldquoAdministration or Ownershiprdquo) The second axis of the matrix refers to the primary mission of the system entities representing the commitment to provide a certain type of service above all others (eg a fire department may incorporate EMS care into its role of serving the public but the organization as a whole is first and foremost organized around fire suppression services) This axis is organized into six different organizational missions (heretofore referred to as ldquoPrimary Missionrdquo)
Systems classified their EMS agencies according to both axes and could indicate if a particular type of agency handled more than 50 of the overall call volume if more than one type of agency was recorded For presentation data were further reduced by collapsing categories on each axis A primary administrativeownership type and primary mission type for the system was assigned if either the respondent indicated a single cell of the matrix as the primary agency type or if all the agency types recorded fell only within a particular administrative or mission category The primary mission and administrationownership of agencies responsible forfirst response andtransport are summarized in Tables C1-C2 D1-D2 and E1-E2
First Response Of the 800 participating systems 27 (33) did not use first responders Of those that did use first responders the primary mission of agencies providing first response varied across systems (315 fire only 248 EMS only 88 fire and EMS and 299 fire and other mission) while the majority of these systems (687) were administered strictly through State or local governments A chi-square test for differences in first response as a function of rurality was significant (χ2 = 9933 p lt 001) A larger percentage of the more urban systems had a primary mission of fire only whereas the more rural areas had a larger proportion of systems whose primary mission is EMS Only The relationship of primary mission by geographic region is less apparent but still statistically significant (χ2 = 2993 p lt 05)
Transport Agencies A majority of most systems (597) have agencies whose primary mission is EMS and 620 are administered strictly through State or local governments The percent of transport agencies with the primary mission of EMS only was higher in wilderness areas (748) compared to urban areas (487) and in the Midwest and South (603 and 657) compared to the West (567) and Northeast (462) (χ2 = 9217 p lt 001) The percentage of transport agencies administered strictly through Statelocal governments is significantly higher in the South (718) and Midwest (643) compared to the West (500) and Northeast (415) (χ2 = 8298 p lt 001) A higher percentage of agencies in the West are for profit (196) and a high percentage of agencies in the northeast are nonprofit (151)
Emergency Call Taking As shown in Tables C3 D3 and E3 the primary type of agency that receives emergency calls varied across systems Over one third (342) were public safety (joint police-fire-EMS) 282 were law enforcement agencies and 230 were local EMS service providers) This distribution varied significantly by rurality (χ2 = 9082 p lt 001) with a higher percentage of urban systems handling emergency call
18
taking through public safety agencies (430 of urban systems compared to 323 344 and 155 of suburban rural and wilderness systems respectively) Administration of emergency call taking by local EMS services is more prevalent in the rural and wilderness systems (246 and 412 respectively) compared to urban and suburban systems (149 and 194 respectively)
Emergency Medical Dispatching Agencies responsible for emergency medical dispatching varied in a manner similar to emergency call taking (see Tables C4 D4 E4) Over all systems 398 listed their primary agency type as public safety (joint police-fire-EMS) and 372 were law enforcement agencies The chi-square that tested for differences in type of dispatching agency as a function of rurality was significant (χ2 = 9042 p lt 001) Far fewer wilderness systems indicated that the primary type of dispatching agency was public safety (234) whereas in urban areas a larger percent of dispatching agencies were public safety (456) Differences in agency type as a function of geographic region was also significant (χ2 =4961 p lt 001) Systems in the Northeast stood out as having more dispatch agencies administered through public safety (559) and a smaller percentage administered through law enforcement (186)
Level of Providers Nearly two-thirds (634) of the systems indicated that advanced life support (ALS) was the most common level of care provided by transport agencies (as defined by the maximum capacity of responding unitvehicles as opposed the actual level of care rendered) intermediate life support (ILS) was the most common levels of care for 121 and basic life support (BLS) for 245 of the systems Only 362 of systems indicated that ALS was the most common level of care provided by first response agencies (see Tables C5 D5 E5)
The most common level of care for transports varied significantly by rurality ( χ2 = 5221 p lt 0001) with a larger proportion of urban systems indicating ALS was the most common level of care (727) compared to wilderness areas (400) The level of care for transports also varied significantly by geographic region (χ2 = 8746 p lt 0001) a high percentage of agencies in the South (788) indicated ALS was the most common level of transport care (compared to 51-57 for all other regions)
Policies and Practices for First Response and Transport A little over one-half (549) of participating systems had a policy that sent first responders to all 911 calls (see Tables C6 D6 and E6) The chi-square statistics that tested for differences in having a policy as a function of both rurality and geographic region were significant (χ2 = 4996 p lt 0001 as a function of rurality and χ2 = 9767 p lt 0001 as a function of geographic region) The percentage of participating systems that had a policy that sent first responders to all 911 calls ranged from a low of 484 for urban systems to a high of 667 for rural systems and from 355 in the South to 712 in the West In the vast majority of systems (858) the most common practice was simultaneous first response and transport ambulance This percentage did not vary significantly by rurality or geographic region (χ2 = 1943 p=020 and χ2 = 2355 p=007 respectively)
As shown in Tables C7 D7 and E7 a large percentage of systems indicated that vehicles could respond to calls and transport patients without the use of lights and sirens (789
19
and 934 for response and transport respectively) with little variation in these percentages by rurality (χ2 = 115 p=076 and χ2 = 113 p=077 respectively) or by geographic region (χ2 = 435 p=023 and χ2 = 146 p=069 for response and transport respectively)
A far lower percentage (281) of systems indicated they allow providers to transport patients from the scene to non-hospital destinations although this percentage was higher in rural and wilderness areas (324 and 364 respectively) than in urban and suburban areas (224 and 276 respectively) (χ2 = 1269 plt001) Similarly the percentage of systems allowing dispatch of units to perform non-emergency assessment was low (374) and this practice was more common in the West (446) and South (456) compared to the Northeast (238) and the Midwest (334) (χ2 = 1989 plt001) The differences in the percentage of systems allowing dispatch of units to perform non-emergency assessment were not statistically significant (χ2 = 215 p=054)
As shown in Tables C7 D7 E7 513 of all systems indicated that all of their dispatch agencies offer pre-arrival instructions 290 indicated that some do and 197 indicated that none of their dispatch agencies offer pre-arrival instructions The percentage of systems that indicated that all of their dispatch agencies offer pre-arrival instructions varied significantly by rurality (χ2 = 7373 plt0001) this percentage was 613 for urban areas 592 for suburban 432 for rural systems and 331 for wilderness systems These percentages also varied significantly by geographic region (χ2
= 4320 plt0001) A higher percentage of systems in the Northeast (724) indicated that all of their dispatch agencies offer pre-arrival instructions compared to the rest of the country (4322 519 and 543 for the Midwest South and West respectively)
When asked how often the first response and transport agencies within the system responded to calls beyond the boundaries of their primary service areas 400 of the systems said their first response agencies responded sometimes or often to these calls 668 of the systems said their transport agencies responded sometimes or often (See Tables C8 D8 and E8) The frequency with which response and transport agencies within the system responded to calls beyond the boundaries of their primary service areas varied by rurality (χ2 = 1909 p lt 005 for response agencies and χ2 = 3749 p lt 0001 for transport agencies) with the major difference being that Wilderness areas indicated that their agencies responded to calls outside their jurisdictions less frequently (268 and 525 of first response and transport agencies respectively responding sometimes or often) The frequency with which response and transport agencies within the system responded to calls beyond the boundaries of their primary service areas also varied by geographic region (χ2 = 1966 p lt 005 for response agencies and χ2 = 5072 p lt 0001 for transport agencies) In the Northeast a larger percentage of systems indicate their transport agencies responded to calls beyond their jurisdiction sometimes or often (846 versus 640 for all other systems
Only one-third (337) of the systems indicated that other EMS systems responded to calls within their own jurisdictions sometimes or often The frequency with which other EMS systems responded to calls within their own jurisdictions varied significantly by
20
geographic region (χ2 = 3477 p lt 0001) but not by rurality (χ2 = 1378 p = 013) A larger percentage of agencies in the Northeast indicated that units outside their jurisdiction respond to calls within their system sometimes or often (524 versus 308 for all other systems)
Volunteer Versus Career Providers In over one-half (538) of the systems the primary type of provider (as defined by the provider type that represents 50 or more of all EMS personnel) was full-time career (see Tables C9 D9 E9) This percentage varied by rurality (χ2 = 10920 p lt 0001) and geographic region χ2 = 18575 p lt 0001) In only 296 of the systems in wilderness areas was the primary type of provider full-time career compared to 687 in urban areas In the South 800 of the systems reported full-time career providers as the primary type of provider compared to only 355 in the Midwest Across all systems the average percentage of all calls that are handled by volunteers was 380 this percentage ranged from 258 in urban systems to 356 in suburban systems 438 in rural system and 603 in wilderness systems A one-way ANOVA that tested for differences in percentage of calls handled as a function of rurality was significant F(3745) = 3295 p lt 001 Additionally Duncanrsquos multiple range test showed that these values differed significantly Only a small percentage (144) of volunteers typically responds to calls from fire or EMS station houses
911 System Access and Timely Response to Incoming Calls In nearly two-thirds (652) of the systems the highest level of 911 access was reported as wireless E911 (Tables C10 D10 and E10) Access via wireless E911 varied by rurality ranging from 723 and 755 in urban and suburban systems respectively to 573 and 517 in rural and wilderness systems respectively (χ2 = 2948 p lt 001) In wilderness areas the highest level of 911 access was wireless 911 in 153 of systems E911 in 228 and Basic 911 in 101 In only 574 of systems in the West had Wireless E911 compared to 668-695 in other geographic regions of the country although these differences were not statistically significant (χ2 = 366 p =030)
More than half (558) of the systems indicated that there were locations within their service areas that made timely responses problematic (see tables C11 D11 and E11) There was no significant variation in responses to this item by rurality (χ2 = 664 p = 016) although a significantly lower percentage of systems in the Midwest indicated timely response is a problem (444) compared to all other regions (641) (χ2 = 3095 p lt 0001) The primary factors associated with the lack of timely response were remote or distant geographic areas (564 systems listed this as the primary reason) and inadequate daytime staffing (262) Responses varied by rurality and geographic region Only 190 of regions in the Northeast listed remote areas as the primary reason compared to 445 of Midwest regions 745 of regions in the South and 776 regions in the West In the Northeast a larger percentage of systems listed daytime staffing as the primary reason (compared to 375 in the Midwest 134 in the South and 82 in the West)
Medical Direction As shown in Tables C12 D12 and E12 almost all systems (959) had some physician medical direction in place although 256 of all systems had no one
21
person with the primary responsibility of overseeing medical direction A higher percentage of rural and wilderness systems (371 and 329) had no medical direction in place or medical direction with no one person with the primary responsibility) compared to urban or suburban systems (268 and 204) (χ2 = 1086 p lt 002) A higher percentage of systems in the Northeast and Midwest (438 and 347) had no medical direction in place or medical direction with no one person with the primary responsibility) compared to systems in the South and West (210 and 202) (χ2 = 2705 p lt 001)
Of those with one person with the primary responsibility of overseeing medical direction 449 of the systems indicated this person was responsible to the system agency 348 to the county or EMS regional program and only 103 to the State lead agency
System Financing We asked participants to think of their systems as a whole and indicate how EMS was financed They were asked to indicate which funding sources were present at all and to indicate the primary source of funding All systems tapped into a wide variety of funding sources as shown in tables C13 D13 and E13 Most systems indicated that fees for services and tax subsidies (at the State county or local level) were the primary types of funding for EMS (534 and 411 of systems respectively) These percentages did not vary significantly geographic region (χ2 = 715 p = 007) However rural and wilderness areas had a slightly higher percentage of systems indicating fees for services as their primary source of funding (618 and 574 respectively) compared to urban and suburban systems (480 and 506 systems respectively) (χ2 = 910 p lt 005)
C4 System Outlook by Characteristics of Systems
As described in the Methods above we asked participants to indicate the extent to which they agreed or disagreed with 16 statements designed to illicit their judgment as to the level of resources present in their system the extent of public participation the degree to which there is support of the system among physicians hospitals and non-EMS organizations the extent to which turf wars and politics are a problem for the system and the extent to which they feel the system adapts well to change The responses to these items are summarized in Tables F1 (by rurality) F2 (by geographic region) and F3 (by size of the system)
We performed a principal components analysis (PCA) to explore the extent to which the 13 of the 16 opinion statements clustered together to define independent factors (note we excluded 3 items from the PCA Item 23m EMS providers enjoy working within our EMS system Item 23n Our system looks much the same as 10 years ago and Item 23o Our system will look much the same 10 years from now)
The initial principal components analysis identified four independent factors with Eigen values greater than 10 (See Table F4) Together these four factors explained 58 of the variance An orthogonal transformation yielded four simple factors that were easily interpretable and appeared to measure different constructs (see Table F5) These four
22
factors were used to derive four factor-based summary scores (by adding the responses to the items in each factor (values range from 0 to 4) dividing by the number of items in that factor and standardizing to a 0 to 100 scale
The items included in each of the four factors are as follows
Factor 1 (System Support) 23g Our system has a high level of physician involvement 23h Hospitals in our systems are supportive of our EMS agenciesproviders 23i Patient handoffs between agencies and hospitals are generally smooth 23j Our EMS system participating agencies collaborate well with non-EMS organizations Factor 2 (System Resources) 23a Our system is adequately staffed to meet demand 23b Our system has enough resources (vehicles equipment) to meet demand 23c The population served by our system has a high level of EMS awareness participation or support Factor 3 (System Politics) - both items were reversed scored 23k ldquoTurf Warsrdquo are a problem for our EMS providers 23l Politics area problem within our EMS system Factor 4 (Bystander Action) 23d Defibrillators available for public access can be found in many public places without our system 23e Bystanders often provide CPR prior to EMS arrival at cardiac arrest calls
Two additional items dropped out of the four-factor model as they were correlated with more than one factor these items were analyzed as separate (binary) items
23f Public Satisfaction The public is satisfied with our EMS system 23p Adapts to change Our system adapts well to change
Mean item scores are summarized by rurality geographic region and size of the systems in Table F6
Summary of Subjective Assessments Overall and by Rurality Geographic Region and Size of the System Results are summarized here for each of the four main factors identified by the principal components analysis
System Support Most respondents (788) agreed or strongly agreed that hospitals in the system are supportive of the EMS personnel and agencies (See Table F1) A lower percentage of systems were satisfied with the level of physician involvement only 570 of respondents agreed or strongly agreed that their system had a high level of physician involvement Most respondents were positive with regard to collaboration with non-EMS organizations (774 agreed or strongly agreed that the EMS system collaborates with non-EMS organizations) Over three-quarters of the respondents (892) agreed that the flow of patients through the system is generally smooth The overall summary scores for System Support (715 on a scale from 0 to 100) did not vary significantly by
23
24
rurality (F(3771) = 148 p = 022) or by geographic region (F(3771) = 076 p = 052) but did vary by system size (F(3696) = 266 p = 005 Duncanrsquos multiple range test revealed there was a tendency for support to be higher for larger systems (5000 ndash 9999 calls and more than 10000 calls) versus smaller systems (less than 1000 and 1000 ndash 4999 calls) System Politics ldquoTurf warsrdquo were noted as a problem for less than one-fifth of the systems (198) Politics were noted as a problem for 361 of the systems (See Table F1)The overall summary score for System Politics (589 on a scale from 0 to 100) varied significantly with rurality (F(3788) = 1337 p lt 0001) geographic region (F(3788) = 835 p lt0001) and size of the system (F(3712) =1030 p lt0001) Duncanrsquos multiple range test indicated that the larger systems (10000 or more calls) were significantly more likely to report politics as a problem when compared to two of the other size groups (less than 1000 calls and 5000 ndash 9999 calls) Similar testing revealed that systems in urban and suburban areas as well as systems in the Northeast were significantly more likely to indicate that systems politics were a problem than all other groups
Resource Levels Only 423 of respondents across all systems agreed or strongly agreed that their systems had adequate staff to meet demand 622 agreed or strongly agreed they had adequate resources (vehicles equipment) to meet demands (See Table F1) Although 787 of the respondents agreed that the public is satisfied with EMS services most felt the public did not have a high level of awareness of the system (ie only 393 agreed or strongly agreed that the population served had a high level of EMS awareness participation or support) The overall summary score for System Resources (546 on a scale from 0 to 100) varied significantly by geographic region (F(3781) = 537 p lt 001) systems located in the South scored significantly lower (fewer resources) on the summary score for System Resources according to Duncanrsquos multiple range test There were no significant differences in opinions regarding system resources by rurality (F(3781) = 075 p = 052) or by size of the system (F(3706) = 055 p = 065)
Bystander Involvement Defibrillators could be found in many public places in 552 of the systems The percentage of systems in which bystanders often provided CPR prior to EMS arrival was low (363)The overall summary score for Bystander Action (542 on a scale from 0 to 100) varied significantly with rurality (F(3784) = 741 p lt 0001) geographic region (F(3784) = 980 p lt 0001) and size of the system (F(3710) = 704 p lt 0001) Duncanrsquos multiple range test showed that scores were significantly lower (lower bystander action) in wilderness areas when compared to all other rurality categories Similarly systems in the West were more likely than those in the Northeast and Midwest regions to have lower scores and smaller systems (less than 1000 calls and 5000 ndash 9999 calls) collectively had significantly lower scores than larger systems
Few respondents (235) agreed that their systems looked much the same as 10 years ago and even fewer (152) agreed that their systems will look much the same 10 years
into the future In contrast a majority of respondents (584) agreed or strongly indicated that their systems adapt well to change
Regression Analysis Multiple linear regressions were used to model the factor-based Summary Opinion Scores by rurality geographic region primary mission of the transport agency primary administrationownership of transport agency primary funding source for the system presence of medical direction with a single person responsible and the average percentage of providers in the system that are volunteer Regression coefficients are reported in Table F7 The two dichotomous opinions regarding ldquopublic satisfactionrdquo and ldquosystem adapts well to changerdquo were modeled using logistic regressions and adjusted odds ratios reported (Table F7) All independent variables were included in the models as categorical variables and the value of each variable used as the reference category denoted by REF in Table F7
The regression analyses confirmed most of the patterns noted above (regarding rurality and geographic region) and identified other factors that were associated with the subjective assessments of the respondents
It is worth noting that the only factor that was significant in predicting positive perceived system support was the presence of a single person with the primary responsibility of overseeing medical direction (b-coefficient = 439 p lt 001) having a single person responsible for medical direction was strongly and positively related to system support No other variables in the regression were significantly related to the summary opinions regarding system support
Rurality was a significant predictor of several opinion measures Compared to being from an urban system being from a wilderness system was significantly associated with lower perceived adequacy of resources (b-coefficient = -529 p lt 005) lower bystander action (b-coefficient = -1070 p lt 001) and lack of systems politics (b-coefficient = 1150 p lt 001) Being from a rural system (compared to an urban system) was also predictive of the lack of system politics (b-coefficient = 633 p lt 005)
Geographic region was a significant predictor of all the opinion measures Compared to systems in the Northeast systems in the Midwest scored higher on lack of system politics (b-coefficient = 714 p lt 005) and lower on bystander action (b-coefficient = -546 p lt 005) Systems in the South scored significantly lower on both adequacy of system resources (b-coefficient = -627 p lt 005) and bystander action (b-coefficient = -1360 p lt 001) Systems in the Northeast scored significantly higher on Bystander Action than all other systems (all coefficients are negative and significant at p lt001)
The odds that respondents rated pubic satisfaction as high was 270 (p lt001) and 250 (p lt005) times greater for systems in the Midwest and West compared to systems in the Northeast Systems in the Northeast were less likely to report they adapt well to change compared to systems in the Northeast the odds of systems reporting they adapt well to change was 259 (p lt 001) for systems in the Midwest and South and 270 for systems in the West (p lt001)
25
Primary Mission of the Transport Agencies in the system was predictive of only the publicrsquos satisfaction with EMS with the odds of reporting high satisfaction 043 less for systems that were labeled as ldquootherrdquo compared to those that were ldquoEMS Onlyrdquo The types of agencies falling into the ldquoother categoryrdquo included hospitals based services law enforcement and public safety agencies as well as systems with agencies operating under a variety of organization missions (ie no primary mission) The Administration of the Transport Agency was also associated with Public Satisfaction (p lt 005) with the odds of reporting high satisfaction 058 less for systems that wereldquo ldquofor profit or otherrdquo compared to those that were administered through State or local government Systems whose primary transport agencies wereldquo ldquofor profit or otherrdquo also scored lower on the Lack of System Politics ie they were more likely to indicate system politics were a problem when compared to systems administered through State or local government (b-coefficient = -548 p lt 005)
The percentage of providers who are volunteers was highly predictive of the adequacy of system resources (b-coefficient = 512 p lt 001) level of bystander action (b-coefficient = 296 p lt 005) public satisfaction with EMS (adjusted odds ratio =238 plt001) and ability to adapt to change (adjusted odds ratio=196 p lt 001) In each case systems with fewer volunteers (50 or less of system staff) indicated positive summary ratings for these four system outlook factors Perceived system support and system politics were not associated with level of volunteer staffing (b-coefficient = 512 p gt 010 for system support and b-coefficient = 149 p gt 010 for lack of system politics)
D Summary and Discussion
D1 Summary and Interpretation of the Results
EMS systems are configured differently depending on several factors including the size organization demographics and geography of the local communities they serve Although some information exists about the organization financing and delivery of EMS in 200 of the nationrsquos largest cities (16) this information is incomplete and does not provide any information on how services are organized outside large urban areas in which 75 of the nationrsquos population resides Even less is known about how different EMS configurations impact the effectiveness and efficiency of service delivery
Without the capability of determining what characteristics of EMS systems are most effective and efficient NHTSA is unable to establish guidelines for EMS best practices that EMS providers may use to assess and ultimately improve their performance Furthermore efforts at health care reform have underscored the importance of demonstrating how critical differences in the inputs and processes of health care delivery impact system performance and patient outcomes Every sector of health care including EMS is being challenged to demonstrate the value of services provided and to make head to head comparisons of alternative services and systems of care Figure 6 presents a model that summarizes how these inputs and processes of EMS care may affect system outputs and patient outcomes
26
Inputs
Environment Geographic
Access Population Density
Call Volume
Processes
Response Processes
911 Access First Response Ambulance Dispatch Production Method -
Screening Refusal Full Service or Not
Staffing Patterns Deployment Unit Hour Utilization
Outputs
Outcomes
bull
-------
Response Time Reliability Clinical Quality Transport
Survival (Mortality) Morbidity
Structure Standards Accountability
Economic legal Political
Clinical Processes
Bystander Action Pre-arrival Instructions
First Response Ambulance Service Online Medical Direction Hospital Interface Customer Service
Figure 5 A conceptual model of EMS quality
27
Adapted from A study of the political and economic obstacles to improvement of emergency medical service systems Stephen Dean unpublished dissertation 2004
An important first step in making head-to-head comparisons and understanding what components of EMS systems work well is the development of a characterization of system structure (inputs) and processes so that systems can be evaluated on a common basis This study was designed to develop such a characterization of EMS systems around the country The development of the characterization may also assist in establishing a common EMS language and provide the basis for tracking progress in the development of EMS systems into the future The need for these data has never been more critical In its efforts to better prepare for mass casualties and disasters the nation must have a better understanding as to how EMS systems are organized and delivered at the local level so that these services are appropriately integrated in to an overall systems response capability
Much of the existing information about local EMS system design across the nation is anecdotal incomplete or drawn together from national or State level resources However a few key previous efforts provided a knowledge base that helped shape and allow comparisons with the current project These efforts include the following
bull For more than two decades the 200-City Survey (16) published annually by the Journal of Emergency Medical Services characterizes individual EMS agencies (specifically agencies responsible for first response andor transport) in Nationrsquos 200 most populous cities The 200-City Survey has varied its focus on specific topics over the years but issues related to system design including first responder and transport provider types and response configurations have been part of this annual effort While the survey continues to be a valuable resource for evaluating the urban EMS landscape it does not provide insight into rural areas of the country and has limitations in both its scope and response rate In the most recent survey 455 leaders of first responder and transport agencies were asked to participate in an online survey consisting of 118 questions only 97 (213) of those surveyed completed the survey Although this represents 97 (485) of the 200 largest cities in the United States the response rate remains low making it difficult to generalize beyond the sampling frame
bull In an effort to assess the complex EMS landscape and identify priority areas for improvement Mears (17) gathered extensive information about State and local EMS structures and functions in a survey of State EMS offices The survey had a 100 response rate (although not every respondent answered every question) and provided an accounting of local systems personnel resources and procedures The results indicated wide variation across the country as a whole and the author acknowledged the challenges in system comparison stemming from the differences in definitions used by States The data collected by Mears originated at the State level and provided valuable information although not directly from a local perspective Additionally this effort calculated the number of EMS systems using a definition most commonly resembling individual provider agencies
bull The Federal Interagency Committee on EMS (FICEMS) recently sponsored The National EMS Assessment (18) which is a comprehensive effort to describe EMS
28
throughout the United States using existing data sources Using data primarily from the NASEMSO 2011 Industry Snapshot and National EMS Information System (NEMSIS) (wwwnemsisorg) along with feedback from expert panels the report provided an accurate portrayal of EMS in the United States and identified areas for improvement in data systems (19) Key recommendations from the Assessment included the creation of data systems that adequately differentiate rural and urban areas and uniform definitions associated with EMS agencies and volunteers to promote data aggregation and analysis at the national level The Assessment tallied the number of EMS agencies nationally and showed variation in the size of the smallest geographic service areas recognized by States for licensure of EMS agencies Regarding regionalization of EMS services only 20 of States credential systems comprising multiple EMS agencies functioning together in a given area
bull In 2006 and 2007 with funding from the Federal Office of Rural Health Policy the North Carolina Health Research and Policy Analysis Center conducted a survey of 2500 local EMS directors The survey was distributed by mail to a stratified (based on rurality) random sample of local community-based EMS agency directors derived from a list of licensed EMS agencies maintained by the National Association of EMS Officials Surveys were received from 1425 (572) EMS directors across 47 States The survey identified interesting findings between metropolitan and non-metropolitan entities with regard to general characteristics (20) and medical direction (21) However the final number of respondents represented less than 10 of the list from which it was originally drawn so generalization is again problematic
Comparison with Other Studies Findings of the current study align with several key conclusions of the previous efforts The National EMS Assessment (18) indicated ldquoThere is a wide variation in how EMS Agencies are definedrdquo and ldquothere does not appear to be a common political boundary used for EMS system credentialingrdquo Results from the present study support these conclusions The National EMS Assessment also revealed that only 10 States credential EMS systems composed of multiple EMS agencies and the authors questioned if regionalization of pre-hospital care may take another form in States that do not credential or license EMS systems One might argue that the operational definition used as part of the present study represents such a form of regionalization as a matter of practice if not exclusively based on licensing or credentialing processes
Due to differences in definitions and study design it was not possible to make a direct comparison between our study and the National EMS Assessment with regard to organizational types However our study of EMS systems reflected roughly similar ratios regarding the organizational types reported for agencies in the National EMS Assessment Overall 312 of the transport agencies in our study had a single or dual organizational mission associated with the fire service compared to 40 in the National EMS Assessment Comparing our study to the National EMS Assessment similar percentages were found for hospital-based agencies (52 versus 6) and EMS Only (non-hospital non-fire) agencies (597 versus 46) The National EMS
29
Assessment indicated that half (51) of licensed agencies function at the EMT-Basic level and 38 function at the EMT-Paramedic level This is consistent with our findings for first response systems (ALS 362 BLS 550) but not for level of response for transport (ALS 634 BLS 243) This difference was surprising since we expect first responders to be largely basic life support saving more limited ALS resources for transport However this contrast could be the result of evaluating first response and transport separately or other measurement differences between the two studies
Freeman et al (20) noted that a higher percentage of urban EMS organizations were part of the fire department In contrast the authors note that free standing and hospital based organizations tended to be from rural areas These findings align quite well with our data Additionally Freeman and colleagues noted that metropolitan entities reported higher levels of use of ALS and ILS providers as opposed to their non-metropolitan counterparts This finding is consistent with our study as well increased levels of urbanicity were associated with increased use of ALS in response for transport
The annual JEMS 200-City Survey is still the most comprehensive and well-known assessment of urban EMS issues to date although it has limited generalizability to the nation particularly with regard to rural and wilderness areas The following is a list of comparisons between our data and the last several years of this JEMS effort (16 22-25)
bull The last five iterations (2007-2011) of the JEMS survey consistently showed that private companies and the fire service were the top two providers of transportation services and often close in percentage of respondents Our data support the finding that both fire and private organizations play a significant role in providing transportation services However our data indicate a slightly larger role for the non-fire governmental (third service) organizational type in the urban setting This may be in part due the operational definition of a local EMS system used for our study (ie our systems often extend beyond the borders of a single city)
bull The 2008 and 2009 releases of the survey stated that fire departments were the primary organizations for providing emergency medical dispatch with public safety organizations ranking second Our data suggest that although the fire department is providing such services in nearly 40 of urban systems its role as the primary dispatch organization type lags far behind public safety and law enforcement organizations This difference in finding may also be due to the use of a local system definition that often extends beyond the borders of a single city
bull There was a high degree of correspondence between the current results and the JEMS data with regard to first response services The fire department is the provider of the majority of first response services in our survey (842) and the 2008 JEMS survey (946) The 2008 and 2010 JEMS surveys noted that nearly half of responding cities (464 and 474 respectively) still send first responders to all 911 calls This practice was observed in 484 of urban systems participating in our study Sending first response and transport vehicles simultaneously was reported by 789 of cities in the JEMS 2007 survey while this percentage is 861 in our study
30
bull The 2007 JEMS report noted that 504 of cities respond to calls with ALS first response and ALS transport and 427 respond with BLS first response and ALS transport Our data indicate that BLS is the most common level of first response (reported by 546 of responding urban systems)
bull The JEMS 2008 annual survey reported that 564 of cities respond to calls with lights and sirens only in instances where the patient is believed to be at risk of death (with 355 of cities responding to every call with lights and sirens) Our data show that a higher percentage of EMS systems have the ability to respond to calls without lights and sirens (798 of urban systems) and transport without lights and sirens (943 of urban systems) These numbers were universally high in our study group regardless of rurality These high percentages however may reflect the policy as opposed to what actually happens in practice
An overwhelming majority (915) of respondents to the 2011 JEMS survey agreed or strongly agreed that their local EMS systems were integrated into the greater healthcare system This was up from 650 of respondents in the 2008 survey when half of the respondents indicated formal partnerships with public health or social services organizations Our study shows that systems (across levels of rurality) generally agree that there are high levels of physician involvement hospital support smoothness of patient handoffs and collaboration with non-EMS organizations
Variations Within and Across States A formal analysis of differences across States was not possible in this study primarily due to variations in response rates However given our knowledge about responding systems and States as a whole it is reasonable to infer that many potential variations exist The National EMS Assessment (18) noted that the number of EMS agencies per State ranges from 7 to 1555 and that a majority of States credential multiple categories of agencies (by level of service organizational type) vehicles and personnel Additionally variations within a State would be expected to result from geographic demographic and political differences Our data indicate that variations within States exist more broadly but more importantly are exhibited across groups such as rurality and even at the individual system level (ie many respondents checked multiple categories for questions where prompted to ldquocheck all that applyrdquo)
Variation across States is a ubiquitous theme in EMS and is well supported by documents such as the National EMS Assessment States have evolved quite differently in how they handle the oversight of EMS With such contrasting approaches in State regulation and policy along with differences in overall size demographics and geography it is not surprising that we see variability in our data across these States As part of this study representatives from State EMS offices were interviewed providing information on how States were organized and where responsibility for various EMS system functions was held Figure 1 shows that functions are often addressed at multiple system levels and the percentage of States indicating responsibility for a particular function at any given level varies widely In the broadest terms the most obvious difference noted is how each State related to our operational definition of a local EMS system to itself Table B1 establishes that States choose to organize local emergency medical services coordination in a variety of ways from hospital-centered models to county based systems to larger regional entities We did find sizeable differences by
31
rurality system size and census region all of which are related in many ways to how States are organized Below we discuss our results in the context of rurality
Variations by Rurality EMS has developed very differently throughout the country based on varied histories economics policies and local needs Perhaps the most pronounced demarcation of such differences is with respect to the rurality of a systemrsquos service area Urban suburban rural and wilderness area vary greatly with regard to population demographics industry and economics Such diversity has led to equally varied expectations of an EMS system within those areas
A report by National Conference of State Legislatures (26) noted four sweeping dynamics from the Federal Office of Rural Health Policy (OHRP) that have wide impact on rural EMS issues These include 1 low population density and large geographic areas that raise the cost of providing EMS 2 State and local governments have lower capacity for funding through a tax base 3 difficult economies in these areas have challenges in maintaining public services and managing change and 4 rural areas have less volume and profit potential to lure private EMS services to their region Priorities for rural and wilderness EMS systems continue to center around recruitment and retention (including the role of volunteers) reimbursement and subsidization and medical oversight (27)
In urban areas systems are likely to have higher call volumes use volunteers less frequently support greater use of a tiered response structure and non-response vehicles rely more on increased non-emergent use and have a more developed administrative structure (28) Additionally we expect that urban EMS systems would have a high representation from fire-based organizations as opposed to freestanding or hospital-based in other settings (16 20) Rural jurisdictions often must rely on volunteer personnel have longer response times face high personnel turnover and service coverage issues lack quality medical direction and may lack access to advanced prehospital care Further these areas often encounter greater financial constraints and sometimes even lack the infrastructure needed to ensure complete public access to the emergency care system (4 27 and 29) This is particularly important for medical oversight where recruitment of a dedicated medical director can be particularly difficult (21) Additionally in urban and suburban areas where multiple agency types are used the need for improved coordination and integration among disparate agencies increases (30)
When evaluated by level of rurality our data support many of the differences noted above The mean number of EMS responses was significantly higher for more urban systems and the use of volunteers was higher for systems that were more rural It was not surprising to find that the primary organizational missions for first response and transportation agencies were mostly fire-based in urban systems while an ldquoEMS onlyrdquo mission was more prevalent in more rural areas When it comes to both call taking and dispatching agencies combined public safety agencies (police fire and EMS) have a larger role in urban settings as opposed to more rural systems Our findings seem reasonable when considering first response transport call taking and dispatch entities Specifically urban systems are often larger have a greater tax base to draw from and
32
have robust and well sized agencies from which to draw economies of scale It is also not surprising that urban systems report a higher prevalence of response configurations that involve advanced life support units for the same reasons
In rural and wilderness systems sending first responders to all calls is a more prevalent practice likely due to lower volumes overall (less possibility of taking away a resource from a higher priority) as well as the need to deliver resources for the most emergent cases over greater distances more quickly We expected to find greater differences in the prevalence of responses and patient transports without the use of lights and sirens but the results indicate the distribution of each was relatively flat (and present in a sizable percentage of systems) when examining variations by rurality However a higher percentage of more rural systems reported having a policy that allowed for non-hospital destinations for transport (not related to interfacility services) This finding was expected and particularly important when considering that more rural areas often have less access to acute care facilities Given this fact it was intriguing that the ability to dispatch units to conduct non-emergency assessments did not vary significantly by rurality More urban systems reported higher rates of having all of its dispatch agencies providing pre-arrival instructions which may be due to having a greater number of NAEMD accredited or technically sophisticated dispatch agencies
When considering career versus volunteer EMS personnel urban and suburban systems predictably had higher levels of full time career providers when compared to rural and wilderness systems Similarly the percentage of personnel operating in some capacity as a volunteer as well as the percentage of calls handled by volunteers was substantially higher in the more rural systems Such findings were not only in line with expectations but also convincingly demonstrated how crucial volunteer participation is to sustaining EMS operations in more remote areas
The technological sophistication of public access to the EMS system differed significantly by rurality This is an important issue for more rural areas and our data indicate this difference to be largely dependent on the availability of wireless E911 access It is notable that despite this variation nearly 90 of wilderness systems and over 95 of rural systems still provided access through at least enhanced 911 technologies
There are nominal differences by rurality when evaluating consistent response problems Remote and geographically distant areas as well as daytime staffing were consistently the top two difficulties cited by systems among all rurality levels although remote areas are far and away the most prevalent concern in wilderness areas
One of the most pressing issues for rural and wilderness EMS is medical direction Our data indicate that a higher percentage of rural and wilderness systems either did not have a dedicated medical director in place or did not have a single person responsible for fulfilling that role Furthermore rural and wilderness areas report a lower level of physician involvement (as measured by respondent opinion) These are in line with the findings of Slifkin et al (21) and likely caused by the difficulties in recruiting a medical director including a lower availability of physicians the lack of desire for providers to
33
take on such a role as well as less available funds to pay for these services While more urban systems are often larger and use ALS to a greater extent the need for rural medical direction remains vitally important to system leadership and operations
There were few differences by rurality when considering the primary mechanism for system finance Rural and wilderness systems rely more heavily on fees and billing for service than suburban and urban systems This finding is not surprising given such areas often have less of a tax base from which to draw System resources particularly staffing were reported to be adequate more frequently in less rural systems based on respondent opinions EMS agencies often feel significant financial pressures regardless of location although these challenges are particularly pronounced in rural and wilderness areas Call volumes are low and amount of geography to cover is high making the cost of providing emergency medical services an expensive proposition The financing of EMS which is largely related to the cost associated with standby capabilities does not translate well to a bill for service model in rural areas which typically pays only for transported patients and often at a lower rate than in urban settings These circumstances further compound the difficulties of attracting private services to a given area and intensify the need to rely on volunteer personnel
Perception of bystander action (ie availability of defibrillators and bystander provision of CPR) is lower in more rural areas likely due to lower population densities and less feasibility in implementing public access defibrillation programs Systems in rural and wilderness areas are less likely to report that system politics and turf wars are a problem And while two-thirds of all respondents (regardless of rurality) indicated they feel they had enough resources (as measured in terms of vehicles and equipment) to meet demands a significantly lower percentage of rural and wilderness systems agreed that their systems were adequately staffed to meet demands A high percentage of systems (regardless of rurality) agreed that the public is satisfied with EMS services
D2 Implications of the Study Results and Future Application to NEMSIS
Following a surge of activity in the 1960s and 1970s Federal support of EMS systems has steadily declined leaving State and local governments to take the lead in program development and system design This shift created a fragmented system of care nationwide and continues to promote regional and local approaches to system design (4 33)
Given this fragmentation local EMS systems are complex entities and difficult to describe in a uniform manner Some systems are small and others large encompassing disparate geographic areas and populations Some systems are rigidly tied to well-defined political boundaries and others are defined by a vaguely defined catchment area for a particular hospital At opposite ends of the spectrum are North Carolina which defines (through regulation) the minimum service area of an EMS system to be one county and States such as Idaho where some areas are organized at the county level while others have active EMS agencies with less than county-wide coverage andor no centralized authority Very large land areas such as the region-based systems in Texas are difficult to classify with regard to demography and geography irrespective of the
34
EMS being provided As Mears (17) convincingly stated ldquoThe definition of an EMS system varies from State to State which makes any analysis of EMS systems impossiblerdquo This study attempted to standardize the definition of an EMS system to promote more fluid analyses but in doing so we may have created artificial boundaries for any given system
Notwithstanding this limitation it is abundantly clear that within a local system as we have defined it there is significant variation in how services are organized and delivered Even within a single countywide system fire departments private agencies government and volunteer organizations may all be providing services at a variety of levels in a multitude of ways EMS can vary from town to town even within a highly organized system
This variation is not inherently inappropriate although it raises important questions about the effectiveness and efficiency of alternative approaches These questions cannot be addressed in this study Opportunities do exist however to link the descriptive characterization of systems (and the counties they represent) to data being collected as part of the National EMS Information System (NEMSIS) (wwwnemsisorg) Such a linkage will allow for evaluations of different system designs and system performance measures as being defined and standardized within the context of the Performance Measures Project (wwwnasemsoorgProjectsPerformanceMeasures)
NEMSIS was designed for the purpose of creating a uniform national EMS dataset with standard terms definitions and values as well as a database of data aggregated from across the country There are many benefits expected to stem from this effort including the facilitation of national benchmarking comparison of local system performance exploration of variations across a number of constructs (including rurality) and better description of the nationrsquos EMS system as a whole (32) As of May 4 2012 35 States were contributing data to NEMSIS with several more actively working with the NEMSIS Technical Assistance Center to contribute data in the near future (33) NEMSIS contains many useful data elements including an array of EMS agency characteristics such as geography population served call volume level and type of service and organizational characteristics (34)
NEMSIS is an increasingly powerful data resource that can be used to help verify and validate some of our findings Incident-level data as well as EMS agency characteristics from NEMSIS can be linked using geographic identifiers to the data collected as part of this project This can help better distill system characteristics to evaluate the uniformity of various systems and system types The most obvious potential benefit in connecting these data would be to evaluate performance on a local EMS system level Such an undertaking would help generate an evidence-based approach to local State and national EMS policy and planning efforts
In addition to documenting overall variation in the organization and delivery of EMS across systems this study clearly underscored the challenges faced by systems providing services in rural and wilderness areas of the country Most apparent (and of potential concern) are low percentages in rural and wilderness areas of full-time versus part-time
35
and career versus volunteer EMS providers ALS versus BLS providers involved in transport and dispatch agencies providing pre-arrival instructions In addition a higher percentage of systems in more ruralwilderness versus urbansuburban areas had no medical direction in place and or had some organized medical direction but with no one person with primary responsibility System financing was clearly a challenge for all systems but a slightly higher percentage of systems in rural and wilderness areas rely on fee for service as their primary source of funding
D3 Limitations of the Study
This study has a number of limitations which can be grouped into three types 1 potential response bias 2 instrument design and 3 respondent and system comparability
Potential Response Bias The overall rate of participation in the study was modest (636) and lower than that achieved in the pilot study (86) Despite the less than ideal response rate participation did not differ significantly by geographic region of the country or by rurality Overall the participating systems covered only 440 of the land in the United States but represented 636 of the U S population While a survey that covers practices serving nearly two-thirds of the U S population is informative caution is needed in interpreting the data as the potential for response bias exists The variation in response rates by State made a State-by-State comparison difficult
Limitations Related to Instrument Design The survey instrument contained 24 questions some of which were fairly complex to answer or relied on estimation on the part of the respondent The desire to keep the survey short and straightforward as possible led to using fewer and broader questions about a particular concept Quantitative data (eg call volume) were self-reported and opinion questions may present a greater bias depending on the person serving as the systemrsquos proxy respondent Non-standard definitions also could potentially be reflected in the self-reported data based on the local system variations (eg how to count call volume)
The widespread use of different terminology in the EMS field may have presented some challenges for some respondents on certain questions For example a straightforward question regarding the number of EMS ldquoprovidersrdquo was interpreted by the majority of respondents to be equivalent to ldquopersonnelrdquo (based on the surrounding question language) but we determined (by way of a data quality assurance follow up phone call) that at least one large regional system to have answered as if this was the number of EMS agencies Finally we determined the questions regarding the administrative structure and organizational mission of first responder and transport agencies were challenging for some respondents The difficulties became apparent through follow up calls to several respondents as well as based on the handwritten mark up of returned hard copy surveys
Finally while the survey was designed to be broad and generic in nature to ensure brevity and answerability it is by no means complete in terms of what should be asked of an EMS system The questions address many of the key facets of system structure and
36
environment but some specific areas require further inquiry and there is a need to examine yet another class of quantitative and performance variables to assess the relative value of any given configuration While the system as an entity works to improve the operations it governs the effective administration of an EMS system requires a different perspective and knowledge base than is found in field operations
Respondent and System Comparability Perhaps the most challenging aspect of this study is the variability in the size and geography of the systems we surveyed Despite our efforts to apply a uniform definition of ldquosystemrdquo there are still differences to be expected when considering each system as a unit This is true for the individual completing the survey as well As reported above most States had types of organizations that met our definition within their own borders but the type and level of these organizations did vary across States For example some States provided contacts at the county or municipality level while others were regional or hospital-based The State EMS offices themselves completed local system surveys for both Hawaii and Rhode Island It is possible that there may be differences present in the data based on the formal organizational roles level of system engagement and experience of each respondent particularly for opinion-based questions
Airport tribal or military EMS systems also present challenges Atypical systems while important to their respective State EMS structures and likely fairly homogeneous as individual units may prove difficult to compare with the majority of jurisdictional systems
There are many ways to classify rurality each with strengths and weaknesses based on their definitions data availability and the purposes for which they are needed Further there is no universally accepted approach that meets the needs of every analytical effort (35) Large ldquomultiple ruralityrdquo systems can be extremely diverse in their makeup but this alone does not illuminate all the potential inconsistencies when considering rurality Based on the geographic units of measurement and design rurality taxonomies can mask the heterogeneity of a particular area (eg a single county) in many ways (36) and the county-based urban influence codes used to classify systems in this study are no exception
Due to the variable size and geography of the systems we surveyed we were often challenged in defining the ldquoruralityrdquo of the system There were several participating systems that encompassed within their boundaries multiple urban influence codes and 63 (79) that even spanned across our four-category scheme For example the Southwest Texas Regional Advisory Council is charged with the development and implementation of the regional trauma and emergency healthcare system for a 22-county region of over 26000 square miles It contains both Bexar County (19th most populous county in the nation population density of 1375sq mi home to San Antonio the nations 7th largest city) as well as Real County (700 square mile frontier area with population 3309 and a population density of less than 5sq mi) The size and complexity of our participating systems limited the options for classifying rurality in a different manner although our categorization was still similar to that used in NEMSIS
37
E References
1 National Academy Press (1966) Accidental death and disability The neglected disease of modern society Washington DC National Academy of Sciences
2 Emergency Medical Services Systems Act (public law 93-154) (1973)
3 Narad R A (1990 February) Emergency medical services system design Emerg Med Clin North Am 8(1)1-15
4 Institute of Medicine (2007) Future of emergency care Emergency medical services at the crossroads Washington DC National Academies Press
5 General Accounting Office (2001) Emergency medical services Reported needs are wide-ranging with a growing focus on lack of data (Report No GAO-2-28) Washington DC Author
6 Narad R A (1998) Coordination of the EMS system An organizational theory approach Prehosp Emerg Care2(2)145-52
7 Fitch J J (2005) EMS in critical condition Meeting the challenge (Report No Volume 37 Number 5) Washington DC International CityCounty Management Association
8 Narad R A (2000) Emerging organizational structures in the ambulance industry in the United States Prehosp Disaster Med15(1)49-56
9 Overton J amp Stout J (2002) System design In A E Kuehl (ed) Prehospital systems and medical oversight 3rd ed Dubuque IA KendallHunt Publishing Company
10 Mackenzie E J amp Carlini A R (2008 March) Configurations of EMS systems A pilot study (Report No DOT HS 810 911) Washington DC National Highway Traffic Safety Administration
11 National Highway Traffic Safety Administration (1996) EMS agenda for the future (Report No DOT HS 808 441) Washington DC Author Available at wwwnremtorgnremtdownloadsEMS20Agenda20for20the20Futurep df
12 Census regions and divisions of the United States Accessed March 9 2012 from wwwcensusgovgeowwwus_regdivpdf [Site no longer displays this page]
13 Ghelfi L M amp Parker T S (2004) Developing a county measure of urban influence Amber Waves [U S Dept of Agriculturersquos Economic Research Service monthly electronic newsletter 2(2)47
14 Department of Health and Human Services Area resource file 2007
15 Esri ArcMap 2002
16 Ragone M (2012 February) Evolution or revolution EMS industry faces difficult changes JEMS37(2)34-9
17 Mears G (2004) 2003 national emergency medical services survey Chapel Hill NC University of North Carolina
38
18 Mears G Armstrong B Fernandez A R Mann N C McGinnis K Mears C R hellip amp Shofer F S (2012 December) 2011 National EMS Assessment (Report No DOT HS 811 723) Washington DC National Highway Traffic Safety Administration Available at wwwnhtsagovstaticfilesntiemspdf811723pdf
19 Erich J (2012 March) Self-portrait What does the national EMS assessment tell us about ourselves EMS World41(3)49-53
20 Freeman V A Slifkin R T amp Patterson P D (2009) Recruitment and retention in rural and urban EMS Results from a national survey of local EMS directors J Public Health Manag Pract 15(3)246-52
21 Slifkin R T Freeman V A amp Patterson P D (2009) Designated medical directors for emergency medical services Recruitment and roles J Rural Health 25(4)392-8
22 Ragone M (2011 February) Are we ready for the future Where EMS stands now amp where its prepared to go JEMS36(2)38-43
23 Williams D M amp Ragone M (2010 February) 2009 JEMS 200-city survey Zeroing in on what matters JEMS35(2)38-42
24 Williams D M (2009 February) Jems 2008 200 city survey The future is your choice JEMS34(2)36-51
25 Williams D M (2008 February) 200-city survey Is the status quo acceptable JEMS33(2)48-65
26 Goodwin K (2002) Keeping rural emergency medical services afloat (Report No NCSL State Legislative Report Volume 27 Number 15) Denver CO National Conference of State Legislatures
27 McGinnis K K (2004) Rural and frontier emergency medical services agenda for the future Kansas City National Rural Health Association
28 Giordano L M amp Davidson SJ (1994) Urban systems In A E Kuehl ed Prehospital Systems and Medical Oversight 2nd ed Baltimore MD Mosby Lifeline
29 Garnett F G amp Spoor J E (1994) Rural systems In A E Kuehl ed Prehospital Systems and Medical Oversight 2nd ed Baltimore MD Mosby Lifeline
30 Local EMS system components and current issues (2006) (Presentation slides) Available at wwwiomeduFileaspxID=20952 Accessed September 5 2006
31 Shah M N (2006 March) The formation of the emergency medical services system Am J Public Health 96(3)414-23
32 Dawson D E (2006) National emergency medical services information system (NEMSIS) Prehosp Emerg Care 10(3)314-6
33 NHTSA (na) NEMSIS Version 3 Overview 2011 NASEMSO Annual Meeting (PowerPoint Presentation Washington DC National Highway Traffic Safety Administration Available at
39
wwwnemsisorgdocumentsNEMSISOverviewBriefingpdf Accessed March 9 2012
34 NHTSA (na) NEMSIS data dictionary version 320 Washington DC National Highway Traffic Safety Administration Available at httpnemsisorg_nemsis_v32001202012dataDictionary Accessed March 9 2012
35 Vanderboom CP amp Madigan EA (2007 April) Federal definitions of rurality and the impact on nursing research Res Nurs Health 30(2)175-84
36 Hart L G Larson E H amp Lishner D M (2005 July) Rural definitions for health policy and research Am J Public Health 95(7)1149-55
37 Centers for Disease Control and Prevention (2012 September) Web-Based Injury Statistics Query and Reporting System (WISQARS) Atlanta GA Author Available at wwwcdcgovinjurywisqarsindexhtml
38 CDC (na) Wide-Ranging Online Data for Epidemiologic Research (WONDER) Atlanta GA Author Available at httpwondercdcgov
40
Table A1 Characteristics of States ndash Demography Number () of Counties by Rurality
State Total Land Area
(sq mi)
Population (2007
Estimate)
Population Density
(popsq mi)
Total Number of Counties
Number () of Counties in
Persistent Poverty1
Urban Suburban Rural Wilderness
AK 571951 683478 12 27 4 (52) 3 (673) 0 3 (83) 21 (244) AL 50744 4627851 912 67 22 (119) 28 (713) 11 (151) 18 (100) 10 (36) AR 52068 2834797 544 75 17 (132) 20 (595) 6 (82) 36 (257) 13 (66) AZ 113635 6338755 558 15 2 (29) 6 (896) 4 (66) 5 (38) 0 CA 155959 36553215 2344 58 0 (00) 37 (977) 5 (10) 12 (10) 4 (02) CO 103717 4861515 469 64 4 (07) 17 (862) 3 (26) 13 (65) 31 (48) CT 4845 3502309 7229 8 0 (00) 6 (913) 2 (87) 0 0 DC 61 588292 95813 1 0 (00) 1 (1000) 0 0 0 DE 1954 864764 4427 3 0 (00) 2 (787) 1 (213) 0 0 FL 53927 18251243 3384 67 4 (17) 38 (937) 11 (42) 10 (15) 8 (07) GA 57906 9544750 1648 159 50 (95) 70 (813) 20 (79) 46 (83) 23 (25) HI 6423 1283388 1998 5 1 (00) 1 (706) 0 4 (294) 0 IA 55869 2988046 535 99 0 (00) 20 6 (69) 53 20 (71) ID 82747 1499402 181 44 0 (00) 12 (654) 6 (120) 12 (164) 14 (62) IL 55584 12852548 2312 102 3 (06) 36 14 (48) 44 (77) 8 (05) IN 35867 6345289 1769 92 0 (00) 46 (781) 21 (131) 23 (84) 2 (05) KS 81815 2775997 339 105 0 (00) 17 (637) 7 (74) 34 (222) 47 (68) KY 39728 4241474 1068 120 43 (184) 35 (573) 10 (80) 45 (233) 30 (115) LA 43562 4293204 986 64 32 (289) 29 (736) 16 (186) 13 (63) 6 (16) MA 7840 6449755 8227 14 0 (00) 12 (996) 0 0 2 (04) MD 9774 5618344 5748 24 0 (00) 17 (947) 4 (39) 2 (09) 1 (05) ME 30862 1317207 427 16 0 (00) 5 (584) 1 (92) 7 (219) 3 (106) MI 56804 10071822 1773 83 0 (00) 26 (816) 8 (56) 27 (85) 22 (43) MN 79610 5197621 653 87 0 (00) 21 (729) 8 (65) 40 (179) 18 (27) MO 68886 5878415 853 115 16 (100) 34 (734) 10 (62) 46 (168) 25 (36) MS 46907 2918785 622 82 51 (421) 17 (438) 7 (100) 42 16 (60)
1 Persistent poverty defined as 20 percent or more of residents measured as poor in each of the 1970 1980 1990 and 2000 censuses
41
( )
Table A1 cont Characteristics of States ndash Demography
Number () of Counties by Rurality State Total
Land Area (sq mi)
Population (2007
Estimate)
Population Density
(popsq mi)
Total Number of Counties
Number () of Counties in
Persistent Poverty1
Urban Suburban Rural Wilderness
MT 145552 957861 66 56 3 (34) 4 (352) 0 13 (446) 39 NC 48711 9061032 1860 100 10 (55) 40 (701) 25 (196) 18 (71) 17 (32) ND 68976 639715 93 53 5 (45) 4 (481) 1 (26) 10 (245) 38 NE 76872 1774571 231 93 1 (04) 9 (580) 2 (33) 30 (257) 52 (130) NH 8968 1315828 1467 10 0 3 (624) 3 (218) 4 (158) 0 NJ 7417 8685920 11710 21 0 21 (1000) 0 0 0 NM 121356 1969915 162 33 12 (301) 7 (660) 7 (140) 13 (186) 6 (14) NV 109826 2565382 234 17 0 4 (897) 3 (45) 7 (49) 3 (10) NY 47214 19297729 4087 62 0 36 12 (45) 12 (33) 2 (01) OH 40948 11466917 2800 88 0 40 28 (146) 17 (44) 3 (04) OK 68667 3617316 527 77 14 (64) 17 (637) 8 (119) 35 17 (44) OR 95997 3747455 390 36 0 11 (777) 9 (119) 9 (95) 7 (09) PA 44817 12432792 2774 67 0 32 (841) 19 (119) 11 (32) 5 (07) RI 1045 1057832 10124 5 0 5 (1000) 0 0 0 SC 30109 4407709 1464 46 12 (86) 21 (761) 13 (144) 11 (93) 1 (02) SD 75885 796214 105 66 13 (91) 7 (454) 3 (51) 15 (278) 41 (218) TN 41217 6156719 1494 95 9 (31) 38 (732) 15 (118) 31 (129) 11 (20) TX 261797 2390438 913 254 46 (121) 77 (875) 29 (43) 94 (70) 54 (11) UT 82144 2645330 322 29 1 (05) 10 (890) 2 (35) 6 (44) 11 (31) VA 39591 7712091 1948 134 2 (05) 80 5 (24) 28 (77) 21 (42) VT 9250 621254 672 14 0 3 (334) 2 (154) 7 (429) 2 (84) WA 66544 6468424 972 39 0 17 (877) 8 (78) 8 (38) 6 (08) WI 54310 5601640 1031 72 0 25 (728) 12 (134) 22 (104) 13 (34) WV 24078 1812035 753 55 9 (74) 21 (554) 5 (124) 14 (205) 15 (117) WY 97100 522830 54 23 0 2 (302) 1 (62) 13 (500) 7 (136) U S 3537435 301621157 853 3141 386 1090 393 963 (76) 695 (21)
42
Table A2 Characteristics of States ndash Mortality Rates
State Rates for All
Injury Causes
Rates for Cerebrovascular
Disease
Rates for Heart
Disease
Rates for All
Causes
Alabama 7741 5542 23310 93023
Alaska 8894 4289 14539 74202
Arizona 6918 3006 14565 65370
Arkansas 7797 5197 22622 89964
California 4689 3972 17019 66030
Colorado 6834 3691 14096 70899
Connecticut 4961 3306 17089 69136
Delaware 6087 3675 17945 78075
District of Columbia 6292 3601 22917 85001
Florida 6727 3196 15695 67913
Georgia 5973 4716 19053 83187
Hawaii 4483 3840 14099 59063
Idaho 6413 4042 15304 72304
Illinois 4939 4258 19188 77094
Indiana 6139 4521 19845 83527
Iowa 5490 4279 18222 74418
Kansas 5701 4764 17236 78486
Kentucky 7667 4590 21784 90236
Louisiana 8046 4665 23042 92213
Maine 5996 4062 16527 76481
Maryland 5558 4143 19552 77172
Massachusetts 3980 3505 16381 70594
Michigan 5644 4335 22027 81194
Minnesota 5152 3768 12656 67540
Mississippi 8547 5190 26019 95009
Missouri 7078 4771 21443 84715
Montana 8638 3980 16980 78693
43
Table A2 cont Characteristics of States ndash Mortality Rates
State Rates for All
Injury Causes
Rates for Cerebrovascular
Disease
Rates for Heart
Disease
Rates for All
Causes
Nebraska 5253 4013 15949 74142
Nevada 7229 3919 19573 80863
New Hampshire 5062 3363 16484 71247
New Jersey 3869 3297 19061 71720
New Mexico 10086 3562 15186 75864
New York 3732 2741 21891 67596
North Carolina 6680 5019 18489 82564
North Dakota 6322 3662 15876 71317
Ohio 6048 4507 20634 84410
Oklahoma 8073 5149 24221 93103
Oregon 6096 4379 14955 74859
Pennsylvania 6079 4153 19995 79653
Rhode Island 5410 3440 19520 74941
South Carolina 7118 5000 18600 83953
South Dakota 6263 3755 16082 70876
Tennessee 7637 5102 22011 88882
Texas 5756 4672 18329 77605
Utah 6313 3677 13804 65908
Vermont 6270 3827 16593 72192
Virginia 5376 4330 17656 76274
Washington 5868 4145 16101 72366
West Virginia 8695 4721 22813 95849
Wisconsin 5765 3997 17179 72994
Wyoming 9232 4329 16939 77336
44
Table B2 Participation Rates by Rurality and Geographic Region
Participation Rates
Number of Systems
Number of Systems
Participating In Study
Percent of Systems
Participating
Percent of Land
Covered by Participating
Systems
Percent of Population Covered by
Participating Systems
ALL REGIONS 1268 800 631 440 636
RURALITY 1
Urban 581 355 611 487 641 Suburban 150 98 653 391 479 Rural 298 193 648 316 393 Wilderness 239 154 644 380 426
GEOGRAPHIC Northeast 182 106 582 729 766 Midwest 531 336 633 428 522 South west 409 263 643 425 541 West 146 95 651 327 660
1 Rurality defined using Urban Influence Codes (UIC) systems that span two or more UIC (N=140) were categorized according to most urban UIC code in system
45
Table B3 Percent Distribution of Number of EMS Providers Annual Number of 911 Calls and Annual Number of EMS Responses by Rurality1
(N= number of systems participating in overall study n=number of systems responding to specific survey item)
All Systems
Urban N=355
Suburban N=98
Rural N=193
Wilderness N=154
Number of EMS Care Providers incl volunteers at all levels
Percent Distrsquon
(n=753)
Percent Distrsquon
(n=337)
Percent Distrsquon (n=97)
Percent Distrsquon
(n=179)
Percent Distrsquon
(n=137)
lt50 32 146 292 364 742 50 ndash 99 14 80 157 278 129
100 ndash 499 30 344 472 312 129 500 + 23 431 79 46 00
Annual Number of 911 Calls for EMS
Percent Distrsquon
(n=724)
Percent Distrsquon
(n=320)
Percent Distrsquon
(n=93)
Percent Distrsquon
(n=177)
Percent Distrsquon
(n=148)
lt1000 25 78 106 292 709 1000 ndash 4999 29 170 388 544 250 5000 ndash 9999 12 136 259 123 20
10000 + 32 616 247 41 21
Annual Number of EMS Responses
Percent Distrsquon
(n=720)
Percent Distrsquon
(n=309)
Percent Distrsquon
(n=88)
Percent Distrsquon
(n=178)
Percent Distrsquon
(n=145)
lt1000 24 68 91 264 689 1000 ndash 4999 31 159 375 573 269 5000 ndash 9999 12 129 261 129 28
10000 + 32 644 273 34 14
1 Rurality defined using Urban Influence Codes (UIC) systems that span two or more UIC (N=140) were categorized according to most urban UIC code in system
46
Table B4 Percent Distribution of Number of EMS Providers Annual Number of 911 Calls and Annual Number of EMS Responses by Geographic Region
(N= number of systems participating in overall study n=number of systems responding to specific survey item)
All Systems N=80
Northeast N=106
Midwest N=336
West N=263
South N=95
Number of EMS Care Providers incl volunteers at all levels
Percent Distrsquon
(n=753)
Percent Distrsquon
(n=101)
Percent Distrsquon
(n=317)
Percent Distrsquon
(n=260)
Percent Distrsquon
(n=73)
lt50 321 50 467 250 270 50 ndash 99 145 50 177 163 133
100 ndash 499 302 376 233 283 369 500 + 232 525 123 304 228
Annual Number of 911 Calls for EMS Percent Distrsquon (n=724)
Percent Distrsquon
(n=89)
Percent Distrsquon (n=306)
Percent Distrsquon (n=252)
Percent Distrsquon
(n=70)
lt1000 258 23 360 262 80 1000 ndash 4999 293 191 310 250 324 5000 ndash 9999 120 169 96 83 147
10000 + 329 618 134 405 450
Annual Number of EMS Responses Percent
Distrsquon (n=720)
Percent Distrsquon
(n=89)
Percent Distrsquon (n=305)
Percent Distrsquon (n=238)
Percent Distrsquon
(n=88)
lt1000 244 22 436 80 250 1000 ndash 4999 310 225 357 307 239 5000 ndash 9999 125 169 89 168 91
10000 + 321 584 118 445 420
47
Table C1 Primary Mission1 of First Response and Transport Agencies by Rurality (N= number of systems participating in overall study n=number of systems responding to specific survey item)
All Systems N=800
Urban N=355
Suburban N=98
Rural N=193
Wilderness N=154
Primary Mission Any Checked
Percent Distrsquon of First
Response2
(n=731)
Percent Distrsquon of Transport (n=782)
Percent Distrsquon of First Response (n=342)
Percent Distrsquon of Transport (n=345)
Percent Distrsquon of First Response (n=92)
Percent Distrsquon of Transport (n=96)
Percent Distrsquon of First Respon se (
Percent Distrsquon of Transport (n=190)
Percent Distrsquon of First Response (n=124)
Percent Distrsquon of Transport (n=151)
Fire Only 315 120 436 200 315 125 191 53 153 20 EMS Only 248 597
52 120 487
23 348 646
31 330 653
116 411 748
53Hospital 15 06 22 3 08 Fire and EMS 88 92 99 128 65 94 121 79 24 26 Fire and Other 299 99 307 122 217 52 283 68 363 113
All Other 35 40 32 41 33 52 4 32 40 40
1 Primary mission assigned if respondent indicated a single agency type handles majority of call volume or if all the agency types recorded fell only within a particular group
2 Twenty-seven of the 800 responding systems do not use first responders of the 773 systems that do data on primary mission of first response agencies was missing for 42 systems (54 of all systems with first response)
48
Table C2 Primary Administration or Ownership1 of First Response and Transport Agencies by Rurality (N= number of systems participating in overall study n=number of systems responding to specific survey item)
All Systems N=80
Urban N=355
Suburban N=98
Rural N=193
Wilderness N=154
Agency Type Percent Distrsquon of First Response2
(n=731)
Percent Distrsquon of Transpor t (n=782)
Percent Distrsquon of First Response (n=342)
Percent Distrsquon of Transpor t (n=345)
Percent Distrsquon of First Response (n=92)
Percent Distrsquon of Transpor t (n=96)
Percent Distrsquon of First Response (n=173)
Percent Distrsquon of Transpor t (n=190)
Percent Distrsquon of First Response (n=124)
Percent Distrsquon of Transpor t (n=151)
StateLocal Govrsquot 687 620 672 562 663 677 699 653 726 676
For Profit (FP) 27 81 20 99 76 73 29 89 08 33
Not for Profit (NFP)
56 107 41 96 76 104 58 100 81 146
Govrsquot amp NFP 71 61 61 61 76 42 75 58 89 79
Govrsquot amp FP 66 45 73 55 44 31 87 47 32 26
All Other 93 86 132 127 65 73 52 53 64 40
1 Primary administration or ownership assigned if respondent indicated a single agency type handles majority of call volume or if all the agency types recorded fell only within a particular group
2 Twenty-seven of the 800 responding systems do not use first responders of the 773 systems that do data on primary mission of first response agencies was missing for 42 systems (54 of all systems with first response)
49
Table C3 Emergency Medical Call Taking Organizational Type of Agency by Rurality (N=number of systems participating in overall study n=number of systems responding to specific survey
item)
All Systems Urban Suburban Rural Wilderness N=800 N=355 N=98 N=193 N=154
Percent Percent Percent Percent Percent Percent Percent Percent Percent Percent Present Distrsquon of Present Distrsquon of Present Distrsquon of Present Distrsquon of Present Distrsquon of
Agency Type within the System
Primary
Type2
(n=752)
within the System
Primary Type (n=328)
within the System
Primary Type (n=93)
within the System
Primary Type (n=183)
within the System
Primary Type (n=148)
Public SafetyJoint Police-Fire-EMS 466 342 599 430 424 323 431 344 218 155 Fire 304 64 382 112 235 22 269 38 203 14 Law Enforcement 462 282 480 210 482 376 401 300 481 358 Local EMS Service 430 230 389 149 400 194 455 246 519 412 Other 101 82 135 99 121 85 78 72 45 61
1 S y s t ems c a n h a v e mu l t i p l e t y p es ( gt 1 ) o f a g e n c i e s w i t h i n t h e s a m e s y s t em a llo w i n g c olu m n v a lu e s t o a d d t o m o r e t h a n 1 0 0 2 Primary Type was self-reported and denotes the agency that handles the majority (50 or more) of the call volume for the system
50
Table C4 Emergency Medical Dispatching Organizational Type of Agency by Rurality (N= number of systems participating in overall study n=number of systems responding to specific survey item)
All Systems Urban Suburban Rural Wilderness N=80 N=355 N=98 N=193 N=154
Agency Type Percent Percent Percent Percent Percent Percent Percent Percent Percent Percent Present Distrsquon of Present Distrsquon of Present Distrsquon of Present Distrsquon of Present Distrsquon of within the System
Primary
Type1
(n=741)
within the System
Primary Type (n=333)
within the System
Primary Type (n=91)
within the System
Primary Type (n=176)
within the System
Primary Type (n=141)
Public SafetyJoint Police-Fire-EMS 498 398 586 456 411 374 517 432 306 234 Fire 214 50 322 99 123 11 116 11 116 07 Law Enforcement 493 372 414 228 548 506 517 426 628 560 Local EMS Service 31 12 39 21 14 00 20 00 33 14 Other 194 168 227 196 131 109 156 131 190 185
1 Primary Type was self-reported and denotes the agency that handles the majority (50 or more) of the call volume for the system
51
1Table C5 Most Common Level of First Response and Transport by Rurality (N= number of systems participating in overall study n=number of systems responding to specific survey item)
All Systems Urban Suburban Rural Wilderness N=80 N=355 N=98 N=193 N=154
Level of Percent Percent Percent Percent Percent Percent Percent Percent Percent Percent Care Distrsquon of Distrsquon of Distrsquon of Distrsquon of Distrsquon of Distrsquon of Distrsquon of Distrsquon of Distrsquon of Distrsquon of
First Response2
Transpor t (n=786)
First Response (n=335)
Transpor t (n=348)
First Response (n=88)
Transpor t (n=97)
First Response (n=172)
Transpor t (n=191)
First Response (n=140)
Transpor t (n=150)
(n=735)
ALS 362 634 409 727 307 649 378 639 264 400 ILS 88 121 45 75 91 155 122 136 150 187 BLS 550 245 546 198 602 196 500 225 586 413
1 Level of response represents the maximum capacity of the responding unitvehicle to call and not the level of care rendered most common level is self-reported
2 Twenty-seven of the 800 responding systems do not use first responders of the 773 systems that do data on level of first response was missing for 38 systems (49 of all systems with first response)
52
Table C6 First Responder Policies and Practices by Rurality (for areas of systems that use first responders) (N= number of systems participating in overall study n=number of systems responding to specific survey item)
All Systems N=80
Urban N=355
Suburban N=98
Rural N=193
Wilderness N=154
Percent with PolicyPractic
e (n=643)1
Percent with PolicyPractic
e
Percent with PolicyPractic
e
Percent with PolicyPractic
e
Percent with PolicyPractic
e Policy Used to Send First Responders
First Responders Sent to all 911 Calls 549 484 530 667 582 First Responders Sent only to calls based on priority dispatch or other call taking 355 451 386 218 245 Other 96 65 84 115 173
Most Common Practice (based on percentage of total calls)
Percent with PolicyPractic
e (n=643)1
Percent with PolicyPractic
e
Percent with PolicyPractic
e
Percent with PolicyPractic
e
Percent with PolicyPractic
e First Response followed by transport ambulance as 31 23 24 39 51 Simultaneous First Response and transport ambulance 858 861 857 863 837 It varies based on protocol 82 97 59 65 82 Other 29 19 60 33 30
1 Twenty-seven of the 800 responding systems do not use first responders of the 773 systems that do data on policies and practices were missing for 130 systems
53
Table C7 Operating Procedures Regarding Dispatch and Transport by Rurality (N= number of systems participating in overall study n=number of systems responding to specific survey item)
All Systems N=800
Urban N=355
Suburban N=98
Rural N=193
Wilderness N=154
Percent of systems that
Allow vehicles to respond to calls without use of lights and sirens
789 (n=782)
798 (n=347)
794 (n=97)
795 (n=190)
757 (n=148)
Allow vehicles to transport non-emergent patients without use of lights and sirens
934 (n=788)
943 (n=350)
939 (n=98)
926 (n=191)
920 (n=151)
Allow providers to transport patients from the
scene to non-hospital destinations
281 (n=789)
224 (n=349)
276 (n=98)
325 (n=191)
364 (n=151)
Have units that can be dispatched to perform non-emergency assessments
374 (n=788)
369 (n=352)
423 (n=97)
389 (n=190)
336 (n=149)
How many dispatch agencies offer pre-arrival instructions to callers for certain types of calls
(n= 783) (n=349) (n=98) (n=185) (n=151)
All 513 613 592 432 331
Some 290 304 235 249 344
None 197 83 173 319 325
54
Table C8 Frequency of Out of Area Response to Calls by Rurality (N= number of systems participating in overall study n=number of systems responding to specific survey item)
All Systems N=80
Urban N=355
Suburban N=98
Rural N=193
Wilderness N=154
How often do your first response agencies respond to calls beyond the boundaries of their primary service areas
(n=677) (n=322) (n=85) (n=158) (n=112)
Never 158 155 141 152 187 Seldom 442 429 400 418 545 Sometimes 332 335 329 392 241 Often 68 81 129 38 27
How often do your transport agencies respond to calls beyond the boundaries of their primary service areas
(n=770) (n=344) ( n=98) (n=185) (n=143)
Never 29 23 10 16 70 Seldom 304 244 357 308 405 Sometimes 494 509 429 535 448 Often 174 224 204 141 77
How often do units from other EMS systems respond to calls within your own jurisdiction (n=792) (n=352) (n=98) (n=191) (n=151)
Never 68 51 71 63 113 Seldom 595 574 612 607 616 Sometimes 287 307 255 298 245 Often 50 68 61 31 26
55
Table C9 EMS Provider Type by Rurality (N= number of systems participating in overall study n=number of systems responding to specific survey item)
Type of Provid
All Systems Urban Suburban Rural Wilderness
N=800 N=355 N=98 N=193 N=154
er Percent Percent Percent Percent Percent Percent Percent Percent Percent Percent Present Distrsquon of Present Distrsquon of Present Distrsquon of Present Distrsquon of Present Distrsquon of
within Primary within Primary within Primary within Primary within Primary the 1 the Type the Type the Type the Type Type
System System (n=332) System (n=92) System (n=181) System (n=142) (n=747)
Volunteer Compensated 565 222 515 87 547 163 608 304 641 472
Non-compensated 611 193 692 190 642 217 624 199 380 176 Career
Part time 612 47 692 36 642 33 618 66 394 56 Full time 845 538 944 687 916 587 801 431 620 296
Average of providers who serve 474 365 467 553 625
as volunteers (N=768) (N=338) (N=94) (N=186) (N=150) (compensated or not)
Average of total calls that are handled by
volunteers 380 258 356 438 603 (compensated or (N=749) (N=329) (N=94) (N=183) (N=143)
not)
Average of Volunteers
who typically respond 144 230 78 99 42 to calls from Fire or (N=751) (N=335) (N=90) (N=182) (N=144) EMS station houses
1Primary Type is self-reported and denotes the provider type that represent the majority (50 or more) of E MS personnel in the system
56
Table C10 911 System Access by Rurality (N= number of systems participating in overall study n=number of systems responding to specific survey item)
All Systems N=80
Urban N=355
Suburban N=98
Rural N=193
Wilderness N=154
Type of Provider
Percent Present within the System
Percent Distrsquon of Highest Level (n=779)
Percent Present within the System
Percent Distrsquon of Highest Level (n=347)
Percent Present within the System
Percent Distrsquon of Highest Level (n=98)
Percent Present within the System
Percent Distrsquon of Highest Level (n=185)
Percent Present within the System
Percent Distrsquon of Highest Level (n=149)
Wireless E 911 652 652 723 723 755 755 573 573 517 517 Wireless E 911 390 137 501 161 245 51 324 124 309 154 E 911 927 168 951 95 980 174 924 254 839 228 Basic 911 307 41 340 17 296 20 243 49 315 101 7 or 10 Digit Number 295 01 352 03 245 00 249 00 255 00
57
Table C11 Timely Response to Incoming Calls by Rurality (N= number of systems participating in overall study n=number of systems responding to specific survey item)
All Systems
Urba n
Suburban N=98
Rural N=193
Wilderness N=154
Percent indicating timely response to incoming calls a consistent problem
558 (n=786)
553 (n=349)
612 (n=98)
599 (n=187)
487 (n=152)
Of those with consistent problems response
difficulties due to
Percent Any Listed
Percent Distrsquon of Primary
Difficulty1
(n=786)
Percent Any Listed
Percent Distrsquon of Primary
Difficulty (n=349)
Percent Any Listed
Percent Distrsquon of Primary
Difficulty (n=98)
Percent Any Listed
Percent Distrsquon of Primary
Difficulty (n=187)
Percent Any Listed
Percent Distrsquon of Primary
Difficulty (n=152)
Daytime Staffing 529 262 538 272 579 291 538 316 451 125 Night time staffing 296 53 337 50 246 54 240 31 310 94 Remote or distant geographic areas
791 564 783 528 807 546 740 561 873 688
Exceptionally high demand
171 25 266 44 140 36 77 00 84 00
Provider retention 380 40 446 39 351 18 375 51 239 47 Provider recruitment 404 33 429 33 439 36 404 31 310 31 Other 53 23 54 33 35 18 38 10 84 16
1 Primary difficulty is self-reported and is the one difficulty identified as the primary difficulty selected from list
58
Table C12 Medical Direction by Rurality (N= number of systems participating in overall study n=number of systems responding to specific survey item)
All Systems N=80
Urban N=355
Suburban N=98
Rural N=193
Wilderness N=154
Percent with Characteristic
(n=786)
Percent with Characteristic
(n=350)
Percent with Characteristic
(n=98)
Percent with Characteristic
(n=186)
Percent with Characteristic
(n=152)
System had no physician medical direction in place
41 40 20 38 59
System has medical direction but with no one person with primary responsibility 256 228 184 333 270
Of systems with one person with primary responsibility this person is
Responsible to system agency 449 464 480 400 441
Responsible to county or EMS regional program
348 357 325 365 324
Responsible to State lead EMS agency 103 79 91 130 137
Other 100 100 104 105 98
59
Table C13 System Financing by Rurality (N= number of systems participating in overall study n=number of systems responding to a specific
survey item)
All Systems N=800
Urban N=355
Suburban N=98
Rural N=193
Wilderness N=154
Funding Sources
Percent Present within the System
Percent Distrsquon of Primary Type
(n=686) 1
Percent Present within the System
Percent Distrsquon of Primary Type (n=308)
Percent Present within the System
Percent Distrsquon of Primary Type (n=85)
Percent Present within the System
Percent Distrsquon of Primary Type (n=157)
Percent Present within the System
Percent Distrsquon of Primary Type (n=136)
Tax Subsidies State 185 16 234 26 184 00 154 06 115 15 County 598 249 559 230 653 271 566 198 689 338 Local 474 146 601 201 449 165 396 115 297 44
Fees for Services 909 534 917 480 908 506 912 618 885 574 Homeland Security Grants 337 01 382 00 265 00 302 00 324 00 Other Grants 473 09 488 06 398 00 522 19 426 07 Donationsfundraiser 504 26 473 19 510 47 528 32 540 22 Other 471 19 482 38 408 11 506 12 446 00
1 Primary source is self-reported and identified as primary source of funding selected from list
60
1Table D1 Primary Mission of First Response and Transport Agencies by Geographic Region (N= number of systems participating in overall study n=number of systems responding to specific survey item)
All Systems N=80
Northeast N=106
Midwest N=336
South N=263
West N=95
Primary Mission Percent Distrsquon of First Response
(n=731) 2
Percent Distrsquon of Transpor t (n=782)
Percent Distrsquon of First Response (n=105)
Percent Distrsquon of Transpor t (n=106)
Percent Distrsquon of First Response (n=294)
Percent Distrsquon of Transpor t (n=328)
Percent Distrsquon of First Response (n=245)
Percent Distrsquon of Transpor t (n=256)
Percent Distrsquon of First Response (n=87)
Percent Distrsquon of Transpor t (n=92)
Fire 315 120 343 170 211 76 379 133 448 184 EMS Only 248 597
52 181 462
09 299 603
88 233 656
31 195 565
33Hospital 15 38 10 12 12 Fire and EMS 88 92 124 208 78 92 82 39 92 109 Fire and Other 299 99 276 132 354 92 265 94 241 98 All Other 35 40 38 19 48 49 29 47 12 11
1 Primary mission assigned if respondent indicated a single agency type handles majority of call volume or if all the agency types recorded fell only within a particular group
2 Twenty-seven of the 800 responding systems do not use first responders of the 773 systems that do data on primary mission of first response agencies was missing for 42 systems (54 of all systems with first response)
61
1Table D2 Primary Administration or Ownership of First Response and Transport Agencies by Geographic Region
(N = number of systems participating in overall study n=number of systems responding to specific survey item)
All Systems N=80
Northeast N=106
Midwest N=336
South N=263
West N=95
Agency Type Percent Distrsquon of First Response
(n=731)2
Percent Distrsquon of Transpor t (n=782)
Percent Distrsquon of First Response (n=105)
Percent Distrsquon of Transpor t (n=106)
Percent Distrsquon of First Response (n=294)
Percent Distrsquon of Transpor t (n=328)
Percent Distrsquon of First Response (n=245)
Percent Distrsquon of Transpor t (n=256)
Percent Distrsquon of First Response (n=87)
Percent Distrsquon of Transpor t (n=92)
StateLocal Govrsquot 687 620 495 415 711 643 739 718 690 500 For Profit (FP) 27 81 67 123 17 52 33 59 00 196 Not for Profit (NFP) 56 107
61 105 151
94 44 128
79 61 94
39 23 22
22Govrsquot amp NFP 71 124 85 49 23 Govrsquot amp FP 66 45 57 47 75 31 57 47 69 87 All Other 93 86 152 170 68 67 61 43 195 174
1 Primary administration or ownership assigned if respondent indicated a single agency type handles majority of call volume or if all the agency types recorded fell only within a particular group
2 Twenty-seven of the 800 responding systems do not use first responders of the 773 systems that do data on primary mission of first response agencies was missing for 42 systems (54 of all systems with first response)
62
Table D3 Emergency Medical Call Taking Organizational Type of Agency by Geographic Region (N= number of systems participating in overall study n=number of systems responding to specific survey item)
All Systems Northeast Midwest South West N=800 N=106 N=336 N=263 N=95
Agency Type
Percent Present within the System
Percent Distrsquon of Primary Type
(n=752) 1
Percent Present within the System
Percent Distrsquon of Primary Type (n=104)
Percent Present within the System
Percent Distrsquon of Primary Type (n=314)
Percent Present within the System
Percent Distrsquon of Primary Type (n=247)
Percent Present within the System
Percent Distrsquon of Primary Type (n=87)
Public SafetyJoint
Police-Fire-EMS 466 342 596 510 418 296 463 340 488 310
Fire 304 64 424 144 214 32 328 61 415 92
Law Enforcement 462 282 414 164 449 302 450 292 598 322
Local EMS Service
430 230 434 106 466 299 389 194 415 230
Other 101 82 182 76 78 71 96 113 110 46
1 Primary Type was self-reported and denotes the agency that handles the majority (50 or more) of the call volume for the system
63
Table D4 Emergency Medical Dispatching Organizational Type of Agency by Geographic Region (N= number of systems participating in overall study n=number of systems responding to specific survey item)
All Systems Northeast Midwest South West N=80 N=106 N=336 N=263 N=95
Agency Type
Percent Present within the System
Percent Distrsquon Primary Type
(n=741)1
Percent Present within the System
Percent Distrsquon Primary Type (n=102)
Percent Present within the System
Percent Distrsquon Primary Type (n=308)
Percent Present within the System
Percent Distrsquon Primary Type (n=240)
Percent Present within the System
Percent Distrsquon Primary Type (n=91)
Public SafetyJoint Police-Fire-EMS
498 398 674 559 426 334 532 429 440 352
Fire 214 50 337 108 140 19 239 62 250 55
Law Enforcement 493 372 337 186 562 461 418 304 631 462
Local EMS Service 31 12 32 20 30 10 45 17 00 00
Other 194 168 221 127 208 176 174 188 167 131
1 Primary Type was self-reported and denotes the agency that handles the majority (50 or more) of the call volume for the system
64
1Table D5 Most Common Level of First Response and Transport by Geographic Region (N= number of systems participating in overall study n=number of systems responding to specific survey item)
All Systems Northeast Midwest South West N=80 N=106 N=336 N=263 N=95
Level of Percent Percent Percent Percent Percent Percent Percent Percent Percent Percent Care Distrsquon of Distrsquon of Distrsquon of Distrsquon of Distrsquon of Distrsquon of Distrsquon of Distrsquon of Distrsquon of Distrsquon of
First Response
(n=735) 2
Transpor t (n=786)
First Response (n=102)
Transpor t (n=104)
First Response (n=304)
Transpor t (n=331)
First Response (n=240)
Transpor t (n=259)
First Response (n=89)
Transpor t (n= 92)
ALS 362 634 186 519 309 574 479 788 427 544 ILS 88 121 118 115 89 106 33 66 202 337 BLS 550 245 696 366 602 320 488 146 371 119
1 Level of response represents the maximum capacity of the responding unitvehicle to call and not the level of care rendered most common level is self-reported
2 Twenty-seven of the 800 responding systems do not use first responders of the 773 systems that do data on level of first response was missing for 38 systems (49 of all systems with first response)
65
t
Table D6 First Responder Policies and Practices by Geographic Region (N= number of systems participating in overall study n=number of systems responding to specific survey item)
All Systems N=800
Northeast N=106
Midwest N=336
South N=263
West N=95
Policy used to Send First Responders Percent with PolicyPractice
(n=643) 1
Percent with PolicyPractice
(n=94)
Percent with PolicyPractice
(n=253)
Percent with PolicyPractice
(n=223)
Percent with PolicyPractice
(n=73)
First Responders Sent to all 911 Calls 549 553 676 350 712 First Responders Sent only to calls based on priority dispatch or other call taking 355 351 217 560 206 Other 96 96 107 90 82
Most Common Practice (based on percentage of total calls)
Percent with PolicyPractice
(n=643)1
Percent with PolicyPractice
(n=94)
Percent with PolicyPractice
(n=253)
Percent with PolicyPractice
(n=223)
Percent with PolicyPractice
(n=73)
First Response followed by transport ambulance as necessary 31 53 35 22 14 Simultaneous First Response and transport ambulance 858 884 882 803 905 It varies based on protocol 82 42 59 130 68 Other 29 21 24 45 13
1 Twenty-seven of the 800 responding systems do not use first responders of the 773 systems that do data on policies and practices were missing for 130 systems (168 of all systems with first response)
66
Table D7 Operating Procedures Regarding Dispatch and Transport by Geographic Region (N= number of systems participating in overall study n=number of systems responding to specific survey item)
Percent of systems that All Systems
N=800 Northeast
N=106 Midwest N=336
South N=263
West N=95
Allow vehicles to respond to calls without use of lights and sirens
789 (n=782)
808 (n=104)
796 (n=328)
752 (n=258)
848 (n=92)
Allow vehicles to transport non-emergent patients without use of lights and sirens
934 (n=788)
943 (=105)
924 (n=331)
934 (n=258)
957 (n=94)
Allow providers to transport patients from the scene to non-hospital destinations
281 (n=789)
171 (=105)
294 (n=330)
296 (n=260)
319 (n=94)
Have units that can be dispatched to perform non-emergency assessments
374 (n=788)
238 (n=105)
334 (n=332)
456 (n=259)
446 (n=92)
How many dispatch agencies offer pre-arrival instructions to callers for certain types of calls
(n= 783) (n=105) (n=326) (n=258) (n=94)
All 513 724 432 519 543
Some 290 257 347 229 298
None 197 19 221 252 159
67
Table D8 Frequency of Out of Area Response to Calls by Geographic Region (N= number of systems participating in overall study n=number of systems responding to specific survey item)
All Systems N=80
Northeast N=106
Midwest N=336
South N=263
West N=95
How often do your first response agencies respond to calls beyond the boundaries of their primary service areas
(n=677) (n=95) (n=273) (n=231) (n=78)
Never 158 263 172 125 77 Seldom 442 379 462 442 449 Sometimes 332 263 322 351 397 Often 68 95 44 82 77
How often do your transport agencies respond to calls beyond the boundaries of their primary service areas
(n=770) (n=104) (n=322) (n=256) (n=88)
Never 29 00 37 35 11 Seldom 304 154 354 312 273 Sometimes 494 461 497 496 511 Often 174 385 112 156 205
How often do units from other EMS systems respond to calls within your own jurisdiction
(n=792) (n=105) (n=333) (n=260) (n=94)
Never 68 09 63 100 64 Seldom 595 467 673 534 628 Sometimes 287 457 222 308 266 Often 50 67 42 58 43
68
Table D9 Percent Distribution of EMS Provider Type by Geographic Region
(N= number of systems participating in overall study n=number of systems responding to specific survey item)
All Systems
N=800 Northeast
N=106 Midwest
N=336 South
N=263 West N=95
Type of Provider
Percent Present within
the System
Percent Distrsquon of Primary
1 Type (n=747)
Percent Present within
the System
Percent Distrsquon of Primary Type (n=97)
Percent Present within
the System
Percent Distrsquon of Primary Type
(n=318)
Percent Present within
the System
Percent Distrsquon of Primary Type
(n=245)
Percent Present within
the System
Percent Distrsquon of Primary Type (n=87)
Volunteer Compensated 565 222 500 52 735 390 327 45 721 299
Non-compensated 611 193 856 433 492 201 685 118 535 103 Career
Part time 612 47 856 72 495 54 669 37 581 23
Full time 845 538 962 443 716 355 968 800 814 575 Average of providers
who serve as volunteers (compensated or not)
474
(n=768)
548
(n=101)
595
(n=322)
311
(n=252)
413
(n=93)
Average of total calls that are handled by
volunteers (compensated or not)
380
(n=749)
409 (n=98)
500 (n=319)
214 (n=244)
372 (n=88)
Average of volunteers who typically respond to
calls from Fire or EMS station houses
144
(n=751)
144
(n=104)
79
(n=315)
246
(n=240)
98
(n=92)
1 Primary type is self-reported and denotes the provider type that represents the majority (50 or more) of EMS personnel in the system
69
Table D10 911 System Access by Geographic Region (N= number of systems participating in overall study n=number of systems responding to specific survey item)
All Systems N=800
Northeast N=106
Midwest N=336
South N=263
West N=95
Type of Provider
Percent Present within the System
Percent Distrsquon of Highest Level (n=779)
Percent Present within the System
Percent Distrsquon of Highest Level (n=105)
Percent Present within the System
Percent Distrsquon of Highest Level (n=324)
Percent Present within the System
Percent Distrsquon of Highest Level (n=256)
Percent Present within the System
Percent Distrsquon of Highest Level (n=94)
Wireless E 911 652 652 695 695 648 648 668 668 574 574
Wireless E 911 390 137 448 162 367 111 348 121 521 245
E 911 927 168 962 143 923 188 934 168 883 128
Basic 911 307 41 314 00 296 52 285 43 394 43
7 or 10 Digit Number 295 01 352 00 272 00 293 00 319 10
70
Table D11 Timely Response to Incoming Calls by Geographic Region (N= number of systems participating in overall study n=number of systems responding to specific survey item)
All Systems N=800
Northeast N=106
Midwest N=336
South N=263
West N=95
Percent indicating timely response to incoming
calls a consistent problem
558 (n=786)
648 (n=105)
444 (n=329)
652 (n=259)
602 (n=93)
Of those with consistent problems response
difficulties primarily due to
Percent Any Listed
Percent Distrsquon of Primary Difficulty
(n=786) 1
Percent Any Listed
Percent Distrsquon of Primary Difficulty (n=105)
Percent Any Listed
Percent Distrsquon of Primary Difficulty (n=329)
Percent Any Listed
Percent Distrsquon of Primary Difficulty (n=259)
Percent Any Listed
Percent Distrsquon of Primary Difficulty (n=93)
Daytime Staffing 529 262 794 492 647 375 362 134 385 82 Night time staffing 296 53 559 95 198 47 262 45 308 41
Remote or distant geographic areas
791 564 574 190 684 445 938 745 904 776
Exceptionally high demand
171 25 265 32 88 16 206 38 154 00
Provider retention 380 40 691 64 382 39 231 25 423 61 Provider recruitment 404 33 676 111 463 39 231 00 423 20
Other 53 23 44 16 74 39 50 13 19 20
1 Primary difficulty is self-reported and is the one difficulty identified as the primary difficulty selected from list
71
Table D12 Medical Direction by Geographic Region (N= number of systems participating in overall study n=number of systems responding to specific survey item)
All Systems N=800
Northeast N=106
Midwest N=336
South N=263
West N=95
Percent with Characteristic Percent with
Characteristic (n=786)
Percent with Characteristic
(n=105)
Percent with Characteristic
(n=329)
Percent with Characteristic
(n=258)
Percent with Characteristic
(n=94)
System had no physician medical direction in place 41 67 43 43 00
System has medical direction but with no one person with primary responsibility 256 371 304 167 202
Of systems with one person with primary responsibility this person is
Responsible to system agency 449 293 444 490 473 Responsible to county or EMS regional program 348 397 299 365 405 Responsible to State lead EMS agency 103 86 131 90 68 Other 100 224 126 55 54
72
Table D13 Percent Distribution of Funding Sources for System by Geographic Region (N= number of systems participating in overall study n=number of systems responding to specific survey item)
All Systems N=800
Northeast N=106
Midwest N=336
South N=263
West N=95
Funding Sources
Percent Present within the System
Percent Distrsquon of Primary Source (n=686) 1
Percent Present within the System
Percent Distrsquon of Primary Source (n=93)
Percent Present within the System
Percent Distrsquon of Primary Source (n=289)
Percent Present within the System
Percent Distrsquon of Primary Source (n=222)
Percent Present within the System
Percent Distrsquon of Primary Source (n=82)
Tax Subsidies State 185 16 144 11 159 07 190 18 315 49 County 598 249 135 21 623 214 742 396 640 232 Local 474 146 856 290 489 142 306 90 449 146
Fees for Services 909 534 942 591 922 574 905 473 832 488 Homeland Security Grants 337 01 365 00 315 00 318 00 438 12 Other Grants 473 09 394 11 461 07 472 04 607 24 Donationsfundraisers 504 26 779 75 595 35 321 00 371 12 Other 471 19 365 01 464 21 464 19 640 37
1 Primary source is self-reported and identified as primary source of funding selected from list
73
Table E1 Primary Mission1 of First Response and Transport Agencies by Size of System2
(N= number of systems participating in overall study n=number of systems responding to specific survey item)
All Systems N=720
Small (lt1000)
N=176
Medium (1000-4999)
N=223
Large (5000-9999)
N=90
Very Large (gt = 10000)
N=231
Primary Mission Percent Distrsquon of First Response
(n=657)3
Percent Distrsquon of Transport (n=708)
Percent Distrsquon of First Response (n=142)
Percent Distrsquon of Transport (n=172)
Percent Distrsquon of First Response (n=204)
Percent Distrsquon of Transport (n=220)
Percent Distrsquon of First Response (n=87)
Percent Distrsquon of Transport (n=90)
Percent Distrsquon of First Response (n=224)
Percent Distrsquon of Transport (n=226)
Fire 326 120 99 35 294 86 356 167 487 199 EMS Only 254 602
49 430 704
93 319 668
64 219 545
33 98 482
09Hospital 12 28 10 00 09 Fire and EMS 88 95 35 46 64 95 172 133 112 115 Fire and Other 289 95 366 93 269 46 230 89 281 146 All Other 31 39 42 29 44 41 23 33 13 49
1 Primary mission assigned if respondent indicated a single agency type handles majority of call volume or if all the agency types recorded fell only within a particular group
2 Size is based on number of annual EMS responses of the 800 participating systems 80 did not provide information on the annual number of EMS responses
3 Twenty-seven of the 720 systems who provided information on the size of their system do not use first responders Of the 693 systems that do data on mission of first response agencies was missing for 36 systems (52 of all systems with first response)
74
1Table E2 Primary Administration or Ownership of First Response and Transport Agencies 2
by Size of System(N = number of systems participating in overall study n=number of systems responding to specific survey item)
All Systems N=720
Small (lt1000)
N=176
Medium (1000-4999)
N=223
Large (5000-9999)
N=90
Very Large (gt = 10000)
N=231 Agency Type Percent
Distrsquon of First Response (n=657) 3
Percent Distrsquon of Transport (n=708)
Percent Distrsquon of First Response (n=142)
Percent Distrsquon of Transport (n=172)
Percent Distrsquon of First Response (n=204)
Percent Distrsquon of Transport (n=220)
Percent Distrsquon of First Response (n=87)
Percent Distrsquon of Transport (n=90)
Percent Distrsquon of First Response (n=224)
Percent Distrsquon of Transport (n=226)
StateLocal Govrsquot 705 632 747 698 711 677 678 688 683 518
For Profit (FP) 23 78 21 35 29 82 35 78 13 106
Not for Profit (NFP) 59 110
57
92 140
64
59 114
54
69 89
56
35 93
53Govrsquot amp NFP 67 56 88 69 54 Govrsquot amp FP 56 40 35 17 54 27 103 33 54 71
All Other 90 83 49 46 59 46 46 56 161 159
1 Primary administration or ownership assigned if respondent indicated a single agency type handles majority of call volume or if all the agency types recorded fell only within a particular group
2 Size is based on number of annual EMS responses of the 800 participating systems 80 did not provide information on the annual number of EMS responses
3 Twenty-seven of the 720 systems who provided information on the size of their system do not use first responders Of the 693 systems that do data on ownershipadministration of first response agencies was missing for 36 systems (52 of all systems with first response)
75
76
1 Table E3 Emergency Medical Call Taking Organizational Type of Agency by Size of System (N= number of systems participating in overall study n=number of systems responding to specific survey item)
All Systems Small (lt1000) Medium Large Very Large N=720 N=176 (1000-4999) (5000-9999) (gt = 10000)
N=223 N=90 N=231 Percent Percent Percent Percent Percent Percent Percent Percent Percent Percent Present Distrsquon of Present Distrsquon of Present Distrsquon of Present Distrsquon of Present Distrsquon of
Agency Type within Primary within Primary within Primary within the Primary within the Primary the Type the Type the Type System Type System Type
System (n=682) 2 System (n=167) System (n=218) (n=86) (n=211)
Public SafetyJoint 461 336 309 210 333 239 474 395 676 512
Police-Fire-EMS
Fire 295 67 230 30 280 55 184 47 394 118
Law Enforcement 468 295 467 341 503 383 395 267 449 175
Local EMS 411 223 487 377 429 243 276 140 389 114 Service
Other 109 79 53 42 79 78 79 151 185 81
1 Size is based on number of a nnual EMS responses of the 800 participating systems 80 did not provide information on the annual number of EMS responses
2 Primary Type was self-reported and denotes the agency that handles the majority (50 or more) of t he call volume for t he system
1Table E4 Emergency Medical Dispatching Organizational Type of Agency by Size of System(N= number of systems participating in overall study n=number of systems responding to specific survey item)
All Systems Small (lt1000) Medium (1000-4999) Large (5000- Very Large (gt = 10000) N=720 N=176 N=223 9999) N=231
N=90
Agency Type
Percent Present within the System
Percent Distrsquon Primary Type (n=667) 2
Percent Present within the System
Percent Distrsquon Primary Type (n=162)
Percent Present within the System
Percent Distrsquon Primary Type (n=204)
Percent Present within the System
Percent Distrsquon Primary Type (n=84)
Percent Present within the System
Percent Distrsquon Primary Type (n=217)
Public SafetyJoint Police-Fire-EMS 492 391 345 272 429 353 521 429 630 503
Fire 204 53 144 25 118 15 141 36 332 115
Law Enforcement 492 387 640 574 571 495 409 345 361 161
Local EMS Service 28 09 36 12 00 00 42 00 38 18
Other 190 160 129 117 168 137 183 190 250 203
1 Size is based on number of annual EMS responses of the 800 participating systems 80 did not provide information on the annual number of EMS responses
2 Primary Type was self-reported and denotes the agency that handles the majority (50 or more) of the call volume for the system
77
1 2Table E5 Most Common Level of First Response and Transport by Size of System(N= number of systems participating in overall study n=number of systems responding to specific survey item)
All Systems Small Medium (1000- Large (5000- Very Large (gt = N=720 (lt1000) 4999) 9999) 10000)
N=176 N=223 N=90 N=231
Level of Care
Percent Distrsquon of First Response (n=664) 3
Percent Distrsquon of Transport (n=709)
Percent Distrsquon of First Response (n=154)
Percent Distrsquon of Transport (n=170)
Percent Distrsquon of First Response (n=204)
Percent Distrsquon of Transport (n=220)
Percent Distrsquon of First Response (n=84)
Percent Distrsquon of Transport (n=90)
Percent Distrsquon of First Response (n=222)
Percent Distrsquon of Transport (n= 229)
ALS 365 638 188 323 426 696 464 767 392 764
ILS 87 118 176 212 108 136 48 100 22 39
BLS 548 244 636 465 466 168 488 133 586 197
1 Level of response represents the maximum capacity of the responding unitvehicle to call and not the level of care rendered
2 Size is based on number of annual EMS responses of the 800 participating systems 80 did not provide information on the annual number of EMS responses
3Twenty-seven of the 720 systems who provided information on the size of their system do not use first responders
78
79
Table E6 1 First Responder Policies and Practices by Size of System (N= number of systems participating in overall study n=number of systems responding to specific survey item)
All Systems
N=720 Small
(lt1000) N=176
Medium (1000-4999)
N=223
Large (5000-9999)
N=90
Very Large (gt = 10000)
N=231
Percent with Percent with Percent with Percent with Percent with
Policy used to Send First Responders PolicyPractice (n=576) 2
PolicyPractice (n=112)
PolicyPractice (n=178)
PolicyPractice (n=78)
PolicyPractice (n=208)
First Responders Sent to all 911 Calls 536 670 629 500 399 First Responders Sent only to calls based on
priority dispatch or other call taking system
368
179
264 410 543
Other 96 151 107 90 58
Most Common Practice (based on percentage of total calls)
Percent with PolicyPractice
(n=576)1
Percent with PolicyPractice
(n=112)
Percent with PolicyPractice
(n=178)
Percent with PolicyPractice
(n=78)
Percent with PolicyPractice
(n=208)
First Response followed by transport ambulance 33 46 39 25 24 as necessary
Simultaneous First Response and transport ambulance
858 864 836 864 871
It varies based on protocol 80 46 90 99 81 Other 29 74 35 12 24
1 Size is based on number of annual EMS responses of t he 800 participating systems 80 did not provide information on the annual number of E MS responses
2 Twenty-seven of the 720 systems who provided information on the size of their system do not use first responders
1Table E7 Operating Procedures Regarding Dispatch and Transport by Size of System(N= number of systems participating in overall study n=number of systems responding to specific survey item)
Percent of systems that All Systems N=720
Small (lt1000)
N=176
Medium (1000-4999)
N=223
Large (5000-9999)
N=90
Very Large (gt = 10000)
N=231
Allow vehicles to respond to calls without use of lights and sirens
802 (n=703)
749 (n=169)
788 (n=217)
811 (n=90)
859 (n=227)
Allow vehicles to transport non-emergent patients without use of lights and sirens
941 (n=710)
890 (n=173)
949 (n=218)
955 (n=89)
965 (n=230)
Allow providers to transport patients from the scene to non-hospital destinations
276 (n=711)
301 (n=173)
314 (n=220)
278 (n=90)
219 (n=228)
Have units that can be dispatched to perform non-emergency assessments
382 (n=709)
343 (n=169)
430 (n=221)
411 (n=90)
356 (n=229)
How many dispatch agencies offer pre-arrival instructions to callers for certain types of calls (n=718) (n=175) (n=222) (n=90) (n=231)
All 521 309 460 722 662
Some 279 331 252 156 312
None 200 360 288 122 26
1 Size is based on number of annual EMS responses of the 800 participating systems 80 did not provide information on the annual number of EMS responses
80
1Table E8 Frequency of Out of Area Response to Calls by Size of System(N= number of systems participating in overall study n=number of systems responding to specific survey item)
All Systems N=720
Small (lt1000) N=176
Medium (1000-4999)
N=223
Large (5000-9999)
N=90
Very Large (gt = 10000)
N=231
How often do your first response agencies respond to calls beyond the boundaries of their primary service areas
(n=605) (n=120) (n=192) (n=77) (n=216)
Never 164 150 172 130 176 Seldom 440 525 411 506 393 Sometimes 332 258 365 338 343 Often 64 67 52 26 88
How often do your transport agencies respond to calls beyond the boundaries of their primary service areas
(n=695) (n=163) (n=216) (n=89) (n=227)
Never 26 43 23 11 22 Seldom 306 393 338 281 225 Sometimes 495 466 495 562 489 Often 173 98 144 146 264
How often do units from other EMS systems respond to calls within your own jurisdiction (n=714) (n=173) (n=223) (n=90) (n=228)
Never 71 64 85 33 79 Seldom 595 613 610 589 570 Sometimes 290 277 283 311 298 Often 44 46 22 67 53
1 Size is based on number of annual EMS responses of the 800 participating systems 80 did not provide information on the annual number of EMS responses
81
1Table E9 Percent Distribution of EMS Provider Type by Size of System(N= number of systems participating in overall study n=number of systems responding to specific survey item)
All Systems N=720
Small (lt1000)
N=176
Medium (1000-4999)
N=223
Large (5000-9999)
N=90
Very Large (gt =10000)
N=231
Type of Provider
Percent Present within the System
Percent Distrsquon of Primary
Type 2
(n=673)
Percent Present within the System
Percent Distrsquon of Primary Type (n=165)
Percent Present within the System
Percent Distrsquon of Primary Type (n=206)
Percent Present within the System
Percent Distrsquon of Primary Type (n=85)
Percent Present within the System
Percent Distrsquon of Primary Type (n=217)
Volunteer Compensated 565 233 720 570 545 204 471 94 509 60 Non-compensated 600 184 329 182 626 214 690 176 737 161
Career Part time 606 45 317 48 649 68 690 00 741 37 Full time 839 538 516 200 891 514 966 729 973 742
Average of providers who serve as volunteers (compensated or not)
476 (n=696)
717 (n=172)
463 (n=220)
428 (n=85)
317 (n=219)
Average of total calls that are handled by volunteers (compensated or not)
376 (n=681)
659 (n=167)
354 (n=213)
329 (n=86)
196 (n=215)
Average of volunteers who typically respond to calls from Fire or EMS station houses
144 (n=675)
54 (n=167)
77 (n=207)
146 (n=82)
274 (n=219)
1 Size is based on number of annual EMS responses of the 800 participating systems 80 did not provide information on the annual number of EMS responses 2 Primary type is self-reported and denotes the provider type that represents the majority (50 or more) of EMS personnel in the system
82
1Table E10 911 System Access by Size of System(N= number of systems participating in overall study n=number of systems responding to specific survey item)
All Systems N=720
Small (lt1000) N=176
Medium (1000-4999)
N=223
Large (5000-9999)
N=90
Very Large (gt = 10000)
N=231
Type of Provider
Percent Present within the System
Percent Distrsquon of Highest Level (n= 713)
Percent Present within the System
Percent Distrsquon of Highest Level (n= 173)
Percent Present within the System
Percent Distrsquon of Highest Level (n= 221)
Percent Present within the System
Percent Distrsquon of Highest Level (n= 90)
Percent Present within the System
Percent Distrsquon of Highest Level (n=229)
Wireless E 911 658 658 526 526 620 619 722 722 769 769
Wireless E 911 391 142 295 133 366 122 311 145 520 166
E 911 931 163 867 254 928 218 967 122 969 56
Basic 911 294 36 301 81 253 41 211 11 362 09
7 or 10 Digit Number 293 01 278 06 244 00 233 00 376 00
1 Size is based on number of annual EMS responses of the 800 participating systems 80 did not provide information on the annual number of EMS responses
83
1Table E11 Timely Response to Incoming Calls by Size of System(N= number of systems participating in overall study n=number of systems responding to specific survey item)
All Systems N=720
Small (lt1000) N=176
Medium (1000-4999)
N=223
Large (5000-9999)
N=90
Very Large (gt = 10000)
N=231
Percent indicating timely response to incoming calls a consistent problem
558 (n= 717)
425 (n=174)
601 (n=223)
600 (n=90)
600 (n=230)
Of those with consistent problems response difficulties primarily due to
Percent Any
Listed
Percent Distrsquon of Primary
Difficulty (n=364) 2
Percent Any
Listed
Percent Distrsquon of Primary
Difficulty (n=70)
Percent Any
Listed
Percent Distrsquon of Primary
Difficulty (n=112)
Percent Any
Listed
Percent Distrsquon of Primary
Difficulty (n=50)
Percent Any
Listed
Percent Distrsquon of Primary
Difficulty (n=132)
Daytime Staffing 518 250 571 200 528 304 532 200 478 250 Night time staffing 288 58 300 86 240 54 298 80 324 38 Remote or distant geographic areas
791 574 771 614 760 598 766 560 838 538
Exceptionally high demand
182 27 4 3
00 136 00 149 20 309 68
Provider retention 365 36 214 14 368 18 383 120 434 30 Provider recruitment 394 33 357 57 392 18 383 20 419 38 Other 53 22 8 29 2 08 21 00 74 38
1 Size is based on number of annual EMS responses of the 800 participating systems 80 did not provide information on the annual number of EMS responses 2 Primary difficulty is self-reported and is the one difficulty identified as the primary difficulty selected from list
84
1Table E12 Medical Direction by Size of System(N= number of systems participating in overall study n=number of systems responding to specific survey item)
All Systems N=720
Small (lt1000)
N=176
Medium (1000-4999)
N=223
Large (5000-9999)
N=90
Very Large (gt = 10000)
N=231
Percent with Characteristic Percent with
Characteristic (n= 718)
Percent with Characteristic
(n= 175)
Percent with Characteristic
(n= 223)
Percent with Characteristic
(n= 89)
Percent with Characteristic
(n= 231 )
System had no physician medical direction in place 35 69 31 00 26
System has medical direction but with no one person with primary responsibility
244 308 233 213 216
Of systems with one person with primary responsibility this person is
(n=511) (n=109) (n=161) (n=69) (n=172)
Responsible to system agency 450 477 422 449 459 Responsible to county or EMS regional program 354 321 360 348 372 Responsible to State lead EMS agency 98 128 112 87 70 Other 98 74 106 116 99
1 Size is based on number of annual EMS responses of the 800 participating systems 80 did not provide information on the annual number of EMS responses
85
86
1Table E13 Percent Distribution of Funding Sources for System by Size of System
(N= number of systems participating in overall study n=number of systems responding to specific survey item)
Small Medium Large Very Large All Systems
(lt1000) (1000-4999) (5000-9999) (gt = 10000) N=720 N=176 N=223 N=90 N=231
Percent Percent Percent Percent Percent Percent Percent Percent Percent Percent Present Distrsquon of Present Distrsquon of Present Distrsquon of Present Distrsquon of Present Distrsquon of Funding Sources within Primary within Primary within Primary within Primary within Primary
the Source the Source the Source the Source the Source System (n=632)2
System (n=163) System (n=187) System (n=82 ) System (n=200)
Tax Subsidies
State 181 16 124 00 146 16 149 12 268 30 County 611 256 659 301 604 209 632 281 576 255 Local 457 141 324 86 415 144 529 195 567 160
Fees for Services 911 532 859 546 939 583 885 463 935 500 Homeland Security 336 00 329 00 274 00 253 00 429 00 Grants Other Grants 481 09 512 12 453 11 414 12 511 05 Donationsfundraisers 499 28 600 37 481 27 425 24 468 25 Other 479 18 524 18 443 10 414 13 502 25
1 Size is based on number of annual EMS responses of the 800 participating systems 80 did not provide information on the annual number of EMS re
2
sponses
Primary source is self-reported and identified as primary source of funding selected from list
Table F1 Responses to Opinion Questions by Rurality (N= number of systems participating in overall study n=number of systems responding to specific survey item)
All Systems N=800
Urban N=355
Suburban N=98
Rural N=193
Wilderness N=154
Opinion
Percent Agree or Strongly
Agree (n=787-795)
Percent Agree or Strongly
Agree (n=349-352)
Percent Agree or Strongly
Agree (n=96-98)
Percent Agree or Strongly
Agree (n=188-193)
Percent Agree or Strongly
Agree (n=153-154)
Resource Levels System is adequately staffed to meet demand 423 483 454 370 331 System has enough resources (vehicles Equipment) to meet demand 622 624 629 617 617
Public Participation Poprsquon has high level of EMS awareness participation support 396 341 385 464 444 AEDs can be found in many public places 552 614 526 557 421 Bystanders often provide CPR prior to EMS arrival 363 361 350 416 312
The public is satisfied with EMS services 787 792 722 780 824
System Support System has high level of physician involvement 570 648 649 466 471 Hospitals are supportive of EMS agenciesproviders 788 796 794 755 809 Patient Handoffs between agencies and hospitals are generally smooth 829 808 865 833 840 EMS system agencies collaborate with Non-EMS organizations 774 754 763 805 788
87
All Systems (n=800)
Urban (N=355)
Suburban (N=98)
Rural (N=193)
Wilderness (N=154)
Opinion
Percent Agree or Strongly
Agree (n=787-
795)
Percent Agree or Strongly
Agree (n=349-
352)
Percent Agree or Strongly
Agree (n=96-98)
Percent Agree or Strongly
Agree (n=188-193)
Percent Agree or Strongly
Agree (n=153-154)
ldquoTurf warsrdquo are a problem 198 239 289 163 91
Politics are a problem 361 443 392 297 234
EMS providers enjoy working in system 813 817 812 831 784
System Change
System looks much the same as 10 years ago 235 210 260 245 261
System will look much the same 10 years from now 152 136 144 153 190
Our system adapts well to change 584 594 484 576 634
88
Table F2 Responses to Opinion Questions by Geographic Region (N= number of systems participating in overall study n=number of systems responding to specific survey item)
All Systems N=800
Northeast N=106
Midwest N=336
South N=263
West N=95
Opinion
Percent Agree or Strongly
Agree (n=787-
795)
Percent Agree or Strongly
Agree (n=104-
105)
Percent Agree or Strongly
Agree (n=329-
333)
Percent Agree or Strongly
Agree (n=259-
262)
Percent Agree or
Strongly Agree
(n=93-95)
Resource Levels System is adequately staffed to meet demand 423 381 411 401 558 System has enough resources (vehicles Equipment) to meet demand 622 738 675 504 632
Public Participation Poprsquon has high level of EMS awareness participation support 396 248 486 342 394 AEDs can be found in many public places 552 800 593 455 415 Bystanders often provide CPR prior to EMS arrival 363 375 376 335 383 The public is satisfied with EMS services 787 676 855 720 853
System Support System has high level of physician involvement 570 481 546 605 653 Hospitals are supportive of EMS agenciesproviders 788 838 801 762 758 Patient Handoffs between agencies and hospitals are generally smooth 829 817 878 767 842 EMS system agencies collaborate with Non-EMS organizations 774 672 821 753 777
89
All Systems N=800
Northeast N=106
Midwest N=336
South N=263
West N=95
Opinion
Percent Agree or Strongly
Agree (n=787-
795)
Percent Agree or Strongly
Agree (n=104-
105)
Percent Agree or Strongly
Agree (n=329-
333)
Percent Agree or Strongly
Agree (n=259-
262)
Percent Agree or Strongly
Agree (n=93-95)
ldquoTurf warsrdquo are a problem 198 305 172 177 232 Politics are a problem 361 533 306 363 358 EMS providers enjoy working in system 813 654 839 831 849
System Change System looks much the same as 10 years ago 235 267 252 188 253
System will look much the same 10 years from now 152 95 163 146 189
Out system adapts well to change 584 362 599 634 638
90
1Table F3 Responses to Opinion Questions by Size of System(N = number of systems participating in overall study n = number of systems responding to specific survey item)
All Systems N=720
Small (lt1000) N=176
Medium (1000-4999) N=223
Large (5000-9999) N=90
Very Large (gt =
10000) N=231
Opinion
Percent Agree or Strongly
Agree (n=711-719)
Percent Agree or Strongly
Agree (n=173-
176)
Percent Agree or Strongly
Agree (n=220-
223)
Percent Agree or Strongly
Agree (n=89-
90)
Percent Agree or Strongly
Agree (n=-227-
230)
Resource Levels
System is adequately staffed to meet Demand 421 318 399 433 517 System has enough resources (vehicles Equipment) to meet demand 629 648 600 622 646
Public Participation Poprsquon has high level of EMS awareness participation support 409 486 395 449 348 AEDs can be found in many public places 547 466 482 578 661 Bystanders often provide CPR prior to EMS arrival 373 358 353 472 367
The public is satisfied with EMS services 802 833 780 832 787
System Support System has high level of physician involvement 578 451 522 656 697 Hospitals are supportive of EMS agenciesproviders 795 789 740 865 826
91
Patient Handoffs between agencies and hospitals are generally smooth 835 862 830 833 819
1 Size is based on number of annual EMS responses of the 800 participating systems 80 did not provide information on the annual number of EMS responses
92
All Systems Small Medium Large Very Large N=720 (lt1000)
N=176 (1000-4999) N=223
(5000-9999) N=90
(gt = 10000) N=231
Opinion
Percent Agree or Strongly
Agree (n=711-719)
Percent Agree or Strongly
Agree (n=173-
176)
Percent Agree or Strongly
Agree (n=220-
223)
Percent Agree or
Strongly Agree
(n=89-90)
Percent Agree or Strongly
Agree (n=-227-
230)
EMS systemagencies collaborate with Non-EMS organizations 790 798 787 833 771 ldquoTurf warsrdquo are a problem 198 153 193 159 253
Politics are a problem 360 239 350 311 483
EMS providers enjoy working in system 824 805 836 820 829
System Change System looks much the same as 10 years ago 230 297 202 191 222 System will look much the same 10 years from now 149 195 144 133 126 System adapts well to change 593 615 560 633 591
93
12 Table F4 Mean Scores on Summary Measures by Rurality Geographic Region and Size of the System
Mean Score (0-100) Percent Satisfied
System Support
Lack of System Politics
System Resources
Bystander Action
Public Satisfaction
Adapts Well to Change
All Systems 715 589 546 542 787 584
Rurality Urban 728 543 553 569 792 594 Suburban 741 538 571 543 722 484 Rural 707 629 558 562 788 576 Wilderness 708 679 522 474 824 634
Geographic Region Northeast 709 485 549 642 676 362 Midwest 726 627 571 556 855 599 South 713 598 514 513 720 634 West 732 557 576 496 853 638
Size of System lt1000 703 673 545 504 833 615 1000-4999 709 581 539 516 780 560 5000-9999 749 602 567 587 832 633 gt=10000 732 533 558 588 787 591
1 Size is based on number of annual EMS responses of the 800 participating systems 80 did not provide information on the annual number of EMS responses
2 + p lt010 plt 005 plt 001
94
Table F5 Regressions Results Modeling Opinion Summary Measures by Selected System Characteristics
Regression Coefficients from Multiple Linear Odds Ratios from
Multiple Positive System Support
Lack of System Politics
Adequate System
Resources
Bystander Action
Public Satisfaction
Adapts Well to Change
Rurality Urban REF REF REF REF REF REF Suburban -052 -198 094 -354 063 058 Rural -226 633 -063 -089 083 086 Wilderness -248 1150 -529 -107 084 110
Geographic Region Northeast REF REF REF REF REF REF Midwest 322 + 714 324 -546 270 259 South 018 564 + -627 -1360 073 259 West 231 436 280 -1210 250 270
Mission of Transport Agency EMS Only REF REF REF REF REF REF Fire Fire amp EMS Fire amp Another -104 -340 -339 + -159 079 098 All other 298 -062 -524 + -066 043 083
Admin Ownership of Transport Agency State or Local Government REF REF REF REF REF REF Not For Profit -223 058 -130 -012 093 087 For Profit and All others 075 -548 -197 -277 058 116
Primary Funding Source All Other REF REF REF REF REF REF Tax Subsidies (State or local) -215 + 270 -273 -249 107 080
Medical Direction All Other (including none) REF REF REF REF REF REF Single Person Responsible 439 043 275 069 147 + 119
of Providers that are Volunteer gt 50 REF REF REF REF REF REF
lt=50 092 149 512 296 238 196 + p lt010 plt 005 plt 001
95
96
DOT HS 811 824 August 2013
9785-111413-v2