characterizing physiological and symptomatic variation in
TRANSCRIPT

ARTICLE OPEN
Characterizing physiological and symptomatic variationin menstrual cycles using self-tracked mobile-health dataKathy Li 1,2, Iñigo Urteaga 1,2, Chris H. Wiggins 1,2, Anna Druet3, Amanda Shea3, Virginia J. Vitzthum 3,4 andNoémie Elhadad 2,5✉
The menstrual cycle is a key indicator of overall health for women of reproductive age. Previously, menstruation was primarilystudied through survey results; however, as menstrual tracking mobile apps become more widely adopted, they provide anincreasingly large, content-rich source of menstrual health experiences and behaviors over time. By exploring a database of user-tracked observations from the Clue app by BioWink GmbH of over 378,000 users and 4.9 million natural cycles, we show that self-reported menstrual tracker data can reveal statistically significant relationships between per-person cycle length variability and self-reported qualitative symptoms. A concern for self-tracked data is that they reflect not only physiological behaviors, but also theengagement dynamics of app users. To mitigate such potential artifacts, we develop a procedure to exclude cycles lacking userengagement, thereby allowing us to better distinguish true menstrual patterns from tracking anomalies. We uncover that womenlocated at different ends of the menstrual variability spectrum, based on the consistency of their cycle length statistics, exhibitstatistically significant differences in their cycle characteristics and symptom tracking patterns. We also find that cycle and periodlength statistics are stationary over the app usage timeline across the variability spectrum. The symptoms that we identify asshowing statistically significant association with timing data can be useful to clinicians and users for predicting cycle variability fromsymptoms, or as potential health indicators for conditions like endometriosis. Our findings showcase the potential of longitudinal,high-resolution self-tracked data to improve understanding of menstruation and women’s health as a whole.
npj Digital Medicine (2020) 3:79 ; https://doi.org/10.1038/s41746-020-0269-8
INTRODUCTIONMenstruation is an important indicator of overall health andquality of life in women: the reproductive endocrine system isassociated with sexual and reproductive health, bone and hearthealth, and cancers1–9; it affects fertility10,11, menopause12–14,exercise15, and diet16. Seminal work on variation of menstrualcycle length throughout the reproductive lifespan17,18 hasconcluded that “complete regularity in menstruation throughextended time is a myth,” and recent empirical studies19–21 haveconfirmed that variation between cycles, women, and populationsis the norm22–29. Establishing a clear, informative, and quantitativecharacterization of the patterns and the underlying femalephysiology of what has been hypothesized as “the fifth vitalsign”30–33 has been a long-explored issue in women’s health, butremains an open research question27,34,35, in part due to limitedaccess to large, reliable datasets concerning menstruation.With the rise of data-powered health, we now have the ability
to identify menstrual patterns at scale and explore their relation-ships with a broad set of symptoms. Observational health datasources have shed light on individual clinical trajectories36,increased self-awareness about individual health37, and helpeddeliver on the promise of precision medicine38. Mobile-healthsolutions enable a high-resolution view of a large, highly diverserange of individuals over time39–42, and can provide insights intochronic diseases and behaviors43–52. Menstrual trackers inparticular have become increasingly common: they are thesecond most popular app for adolescent girls and the fourthmost popular for adult women53,54. Millions of women around theworld routinely track their menstrual cycles and a variety of
contextual factors and symptoms, accumulating high volumes oftemporal, heterogeneous data via many different apps55–59. Asexemplified by studies connecting the menstrual cycle tovariations in women’s mood, behavior, and vital signs60, self-tracked data can provide insights into cycle characteristics61,ovulation timing, and the evolution of reproductive health forlarge populations62, as well as empower informed decision-making through increased self-awareness63.We utilize deidentified user-tracked data from Clue by BioWink
GmbH55, one of the most popular and accurate menstrual trackersworldwide64. In addition to period data, Clue users can tracksymptom information in categories like exercise, pain, and sexualactivity (see Fig. 1). Note that Clue users are not required to specifygender—in this paper, we refer to Clue users or menstruators as‘women,’ but we acknowledge that not all menstruators arewomen and vice versa. This large-scale dataset provides a high-resolution, long-term view of variation in both physiology (periodand cycle duration) and symptoms (e.g., pain and mood) acrossmenstrual cycles, enabling us to study the shared informationbetween quantitative, temporal attributes and qualitative, symp-tomatic attributes of menstrual experiences.While previous work has examined how menstrual cycle
characteristics like cycle and phase length vary with age andbody mass index (BMI)61, we aim instead to use the observedvariability in cycle length statistics to investigate differences insymptomatic behavior between those who exhibit more or lessvariable cycle lengths. Namely, we seek to answer two researchquestions: (1) how do cycle length characteristics for a large, self-tracked user population differ among groups of users? and (2)
1Department of Applied Physics and Applied Mathematics, Columbia University, New York, NY 10027, USA. 2Data Science Institute, Columbia University, New York, NY 10027, USA.3Clue by BioWink GmbH, Adalbertstraße 7-8, 10999 Berlin, Germany. 4Kinsey Institute & Department of Anthropology, Indiana University, Bloomington, IN 47405, USA. 5Departmentof Biomedical Informatics, Columbia University, New York, NY 10032, USA. ✉email: [email protected]
www.nature.com/npjdigitalmed
Scripps Research Translational Institute
1234567890():,;

how do users who fall at different ends of the cycle lengthvariability spectrum self-track their menstrual symptoms?To this end, we select users from the Clue dataset aged 21–33
(because menstrual cycle lengths are relatively less variable, andcycles are more likely to be ovulatory during this age inter-val18,22,29,65,66) with natural menstrual cycles (i.e., no hormonalbirth control or intrauterine device (IUD)). We define a menstrualcycle as the span of days from the first day of a period through toand including the day before the first day of the next period29. Aperiod consists of sequential days of bleeding (greater thanspotting and within 10 days after the first greater-than-spottingbleeding event) unbroken by no more than 1 day on which onlyspotting or no bleeding occurred.In this paper, we take symptom tracking behavior to be a proxy
for true physiological behavior. The Clue tracking categories(summarized in Table 3) encompass a wide range of experiences(subject to user interpretation of the category rather than basedon specific validated scales), enabling broad usage of the app tomeet individual user needs. Self-tracked data reliability isdependent on consistent and accurate user tracking; for instance,cycle length can be arbitrarily long if a user forgets to track theirperiod, which would skew the analysis of menstrual patterns bymisrepresenting a long cycle as due to physiological behaviorrather than tracking behavior. We propose a procedure to mitigatesuch potential engagement artifacts by quantifying engagementwith cycle tracking and identifying cycles lacking engagement,allowing us to separate true menstrual patterns from trackinganomalies. To investigate the spectrum of variability in women’smenstrual health experiences, we propose cycle length differenceor CLD—the absolute difference between subsequent cycle
lengths—as a robust metric for quantifying cycle variability, andwe examine users who fall at opposite ends of the variabilityspectrum.
RESULTSStudy populationThe cohort for this study comprises 378,694 users located on allcontinents, aged 21–33 years old (see Table 1 for detailedsummary statistics). The average user is 25.49 (median of 25) yearsold (per-country and per-age detailed statistics are provided in theSupplementary Information). As reported in Table 2, the averagenumber of cycles tracked per user is 12.89 (median of 11), with anaverage cycle length of 29.73 (median of 29) days and meanperiod length of 4.08 (median of 4) days.
Cycle length difference (CLD) as a robust metric for quantifyingcycle variabilityWe propose cycle length difference, or CLD—the absolutedifference between subsequent cycle lengths—as a powerfulmetric to characterize the spectrum of menstrual variability. Weexamine each user’s CLDs to identify those who are ‘consistentlyhighly variable’ in their cycle lengths. We find that a median CLDof 9 days splits consistently highly variable and consistently nothighly variable cycle behavior, and we use this threshold toseparate the menstrual experiences and symptom reporting ofthose at different ends of the variability spectrum. Tables 1–3showcase the summary statistics, high-level cycle characteristics,
Fig. 1 Clue app screenshot. Sample screenshots of the Clue app. Users can track daily symptoms across 20 categories; Table 3 providesa description of the available Clue categories and their corresponding symptoms. On the left for example, the app displays what day the useris currently on in their cycle. On the right, a user can choose from ‘cramps,’ ‘headache,’ ‘ovulation,’ or ‘tender breasts’ symptoms for thecategory ‘pain’ (the third most tracked category in our dataset, see Table 3). Screenshots produced by and used with permission from Clue byBioWink GmbH.
K. Li et al.
2
npj Digital Medicine (2020) 79 Scripps Research Translational Institute
1234567890():,;

Table 2. Per-user cycle characteristics.
Variable Full cohort’smean ± sd (95% CI)
Full cohort’smedian
Consistently nothighly variable group’smean ± sd (95% CI)
Consistently nothighly variablegroup’s median
Consistently highlyvariable group’smean ± sd (95% CI)
Consistentlyhighly variablegroup’s median
Number of cycles 12.89 ± 9.11 (3.00,36.00) 11.00 13.45 ± 9.19 (3.00,37.00) 11.00 6.19 ± 3.87 (2.00,17.00) 5.00
Cycle length 29.73 ± 5.73 (21.00,43.00) 29.00 29.45 ± 4.98 (21.00,41.00) 29.00 37.04 ± 13.71 (13.00,69.00) 34.00
Period length 4.08 ± 1.76 (1.00,7.00) 4.00 4.07 ± 1.72 (1.00,7.00) 4.00 4.28 ± 2.54 (1.00,9.00) 4.00
Median CLD 4.15 ± 4.94 (1.00,18.00) 3.00 3.04 ± 1.86 (1.00,8.00) 2.50 17.48 ± 9.15 (9.50,43.00) 14.00
Maximum CLD 10.07 ± 7.49 (2.00,31.00) 8.00 8.82 ± 5.65 (2.00,23.00) 8.00 25.15 ± 10.10 (12.00,53.00) 23.00
Per-user high-level cycle characteristics for the full cohort, as well as for the consistently not highly variable and consistently highly variable user groups. Weutilize a greater than 9 day median cycle length difference threshold to place users in each group—those in the consistently highly variable group representthe far end of a cycle variability spectrum. The ‘cycle length difference’ (CLD) refers to the absolute difference between two consecutive cycles.
Table 1. Summary statistics of the full cohort.
Variable Full cohort Consistently not highly variable Consistently highly variable
Number of users 378,694 (100.00%) 349,606 (92.32%) 29,088 (7.68%)
Number of observations 117,014,597 (100.00%) 112,093,683 (95.79%) 4,920,914 (4.21%)
Number of days of observation 34,056,343 (100.00%) 32,699,312 (96.02%) 1,357,031 (3.98%)
Number of cycles 4,881,697 (100.00%) 4,701,694 (96.31%) 180,003 (3.69%)
Summary statistics of the full cohort, as well as for the consistently not highly variable and consistently highly variable user groups. We utilize a greater than9 day median cycle length difference threshold to place users in each group—those in the consistently highly variable group represent the far end of a cyclevariability spectrum.
Table 3. Description of the Clue app tracking categories and symptoms.
Category Description Symptoms Number of trackingevents (%) for theconsistently not highlyvariable group
Number of trackingevents (%) for theconsistently highlyvariable group
Period Period flow Spotting, light, medium, and heavy 22,096,884 (19.71%) 913,403 (18.56%)
Emotion Emotional state Happy, sensitive, sad, and PMS 11,377,997 (10.15%) 501,610 (10.19%)
Pain Type of pain experienced Cramps, tender breasts, headache, andovulation pain
9,730,958 (8.68%) 406,710 (8.26%)
Energy Energy level Low, high, exhausted, and energized 8,710,403 (7.77%) 410,216 (8.34%)
Sleep Hours of sleep 0–3, 3–6, 6–9, and >9 8,597,769 (7.67%) 405,726 (8.24%)
Skin Skin health Acne, good, oily, and dry 5,896,540 (5.26%) 263,258 (5.35%)
Mental Mental state Calm, distracted, focused, and stressed 5,871,137 (5.24%) 252,621 (5.13%)
Sex Sexual health Unprotected sex, high sex drive, protectedsex, and withdrawal sex
5,813,292 (5.19%) 271,540 (5.52%)
Motivation Motivation level Motivated, unmotivated, productive, andunproductive
5,467,728 (4.88%) 236,052 (4.80%)
Craving Food cravings Sweet, salty, carbs, and chocolate 4,867,777 (4.34%) 224,751 (4.57%)
Digestion Digestive health Great, bloated, gassy, and nauseated 4,825,627 (4.30%) 209,651 (4.26%)
Social Social behavior Sociable, withdrawn, supportive, and conflict 4,178,744 (3.73%) 186,110 (3.78%)
Poop Stool health Normal, constipated, great, and diarrhea 3,889,471 (3.47%) 172,716 (3.51%)
Hair Hair health Good, bad, oily, and dry 3,128,384 (2.79%) 147,844 (3.00%)
Fluid Vaginal discharge type Creamy, egg white, sticky, and atypical 2,378,211 (2.12%) 106,782 (2.17%)
Collection method Method for period collection Pad, tampon, panty liner, and menstrual cup 2,027,258 (1.81%) 84,270 (1.71%)
Exercise Physical exercise Running, yoga, biking, and swimming 1,222,568 (1.09%) 44,946 (0.91%)
Party Party-related experiences Drinks, cigarettes, big night, and hangover 900,444 (0.8%) 40,779 (0.83%)
Medication Type of medication taken Pain, cold/flu, antihistamine, and antibiotic 561,540 (0.5%) 21,030 (0.43%)
Ailment Physical maladies Cold/flu, allergy, injury, and fever 550,951 (0.49%) 20,899 (0.42%)
Description of tracking categories and the corresponding symptoms for the Clue app, along with the per-symptom number of tracking observations (and theircorresponding proportion with respect to the total number of observations) for the consistently not highly variable and consistently highly variable usergroups.
K. Li et al.
3
Scripps Research Translational Institute npj Digital Medicine (2020) 79

and category tracking frequencies for the resulting two groups,respectively.We note that the consistently highly variable group comprises
about 7.68% of the user cohort (29,088 out of 378,694 users), andthat their relative category tracking frequencies are similar to thelarger, consistently not highly variable user group. Period flow,emotional state, and experienced pain are the most frequentlytracked categories across both groups; they account for 38.54% ofthe events for the consistently not highly variable group and37.01% for the consistently highly variable group. Below, wesummarize the commonalities and differences in cycle and periodlength characteristics and symptom tracking behavior betweenthese two populations.
Cycle variability characterization—women in the consistentlyhighly variable group experience volatile cycle lengthsWe examine the cycle length characteristics of the proposed usergroups, both visually and statistically. At an individual level, wevisualize for two randomly sampled users (one per group) a timeseries embedding of all of their consecutive cycle lengths in Fig. 2.We sample one consistently highly variable and one consistentlynot highly variable user with the median number of cycles (11)from the cohort and plot each set of three consecutive cycles onthe x, y, and z axes, respectively. In Fig. 2, the consistently nothighly variable (teal) user occupies a small region of the space,indicating that this user experiences similar cycle lengthsthroughout their history; however, the consistently highly variable(orange) user’s points wander through the space, indicating thatthis user experiences consistently fluctuating cycle lengthsthroughout their cycle history.In Fig. 3a, we plot the time series embeddings of cycle length for
the entire cohort, where each point represents three consecutivecycles randomly sampled from each user’s cycle history (for userswith at least three cycles). In contrast to Fig. 2, each user isrepresented by one point, instead of plotting the whole cyclehistories of two randomly sampled users. We visualize at apopulation level whether our median CLD metric successfully
Fig. 2 Time series embedding for cycle length (one user, acrossgroups). We sample one consistently highly variable and oneconsistently not highly variable user, each with the median numberof cycles (11), from the user cohort and plot each set of threeconsecutive cycles on the x, y, and z axes, respectively. This allows usto visualize how much a user’s cycle lengths change throughouttheir entire cycle tracking history—we would expect that a notconsistently highly variable user would have points that clustercloser together in space. We see that the consistently not highlyvariable (teal) user occupies a small region, while the consistentlyhighly variable (orange) user’s points move through the space. Thisindicates that the teal user’s cycle lengths are consistently verysimilar to one another, whereas the orange user experiences moreconsistent fluctuation in cycle lengths. Thus, we see that separatingusers into groups on the basis of median CLD identifies those whoare more and less consistently highly variable.
Fig. 3 Time series embedding and probability distribution for cycle length (all users, across groups). Time series embedding (a) andprobability distributions (b) of cycle length for the consistently not highly variable (teal) and consistently highly variable (orange) groups.a The cycle lengths of three consecutive randomly sampled cycles from each user in the cohort are plotted on the x, y, and z axes. Eachconsistently not highly variable user is represented by a teal point, and each consistently highly variable user by an orange point. It is visuallyevident that the teal cluster of users occupies a tighter region of the space around the x= y= z line, with the orange cluster fanning outward.b The cycle length probability distributions of the cohort, where we note that the orange group’s distribution has a much wider spread and isless peaked than the teal group. Cycle lengths are more heterogeneous or widely distributed for the orange group, confirming that theconsistently highly variable group represents those with more fluctuation in cycle length. The cumulative distributions per group differsignificantly (as per a two-sample Kolmogorov–Smirnov test).
K. Li et al.
4
npj Digital Medicine (2020) 79 Scripps Research Translational Institute

separates out groups of users based on their cycle lengthfluctuations. If a user is perfectly consistently not highly variable,then its representative point would fall exactly on the x= y= z line,since the three cycle lengths would be identical (i.e., not fluctuatingat all). We observe a consistent phenomenon in Fig. 3a: theconsistently not highly variable group (teal) occupies a tighterregion of the space than the consistently highly variable one(orange). That is, a user in the consistently highly variable groupexperiences volatile menstrual patterns (i.e., highly varying cyclelengths).Furthermore, we study the empirical cycle length distributions
per group, and as seen in Fig. 3b, the cycle length distributionsdiffer significantly between the two user groups. Observe that notonly are cycle length statistics such as mean and median cyclelength different, but that the shapes of the distributions are alsodistinct. Specifically, in addition to being centered at longer cyclelengths (median of 34 vs. 29 days), the cycle length distribution forthe consistently highly variable group is less peaked with a widerspread (encompasses a more volatile range of cycle lengths), hasmuch heavier tails, and is skewed toward longer cycle lengths.
Cycle variability characterization—period length statistics arehomogeneous across the variability spectrumWe find that while women in different groups as separated bymedian CLD differ in their cycle length variability, their period lengthdistributions are much less variable and fluctuate similarly betweenthe groups. Period length is centered around the same median of4 days for both groups and displays a similar length distribution.Figure 4 confirms that the variability in cycle length is not due toperiod length differences between the groups, as the period lengthvaries the same amount across all women. These results show thatour metric (median CLD) identifies two distinct groups of usersbased on their cycle (not period) length variability. Note that whilethe period length distributions do differ significantly by the two-sample Kolmogorov–Smirnov (KS) test, the KS statistic for the periodlength distributions is 0.066 with a 95% confidence interval of (0.064,0.068) (details on computing the confidence interval using boot-strapping are presented in the Methods section). These numbers are
nearly an order of magnitude smaller than those for the cycle lengthdistributions (0.377 with a 95% confidence interval of (0.375, 0.378)).That is, the KS test identifies the cycle length distributions to differmore drastically and with much higher probability than the periodlength distributions.
Cycle variability characterization—cycle and period lengthstatistics are stationary within groups over the app usage timelineWe study per-group cycle statistics over the app usage timeline (asrepresented by cycle ID) in Fig. 5 and find that cycle and periodlength statistics are stationary over time at the group level. CycleID enables us to align all users according to their subsequentlytracked cycles (not absolute time), i.e., a cycle ID of 1 correspondsto the first cycle of a user, 2 to their second cycle, and so on. Asreported in Table 2, the mean cycle length for the consistently nothighly variable group is 29.45 days (median of 29), and the meanis 37.04 days (median of 34) for the consistently highly variablegroup. We observe that while the average cycle and periodlengths are similar over subsequent reported cycles for both theentire user cohort and the consistently not highly variable usergroup, consistently highly variable users exhibit a wider spread(i.e., higher volatility). This volatility is maintained across cycles forusers in the consistently highly variable group, showcasing thatthis group accounts for a large degree of the volatility in the data;this detail would be largely ‘smoothed out’ and lost if weconsidered the whole population rather than separating the usersinto two groups. Since cycle and period length statistics areconstant within groups across app usage, we are confident thatthe proposed median CLD is not merely capturing spuriouscorrelations that depend on how long the user stays with the app.
Reported symptom differences—women located at different endsof the spectrum of menstrual variability exhibit different symptompatternsWe find that there exists a relationship between median CLD andcycle level user symptom tracking behavior—despite CLD being ameasure of cycle length variability, it is also correlated with
Fig. 4 Time series embedding and probability distribution for period length (all users, across groups). Time series embedding (a) andprobability distributions (b) of period length for the consistently not highly variable (teal) and consistently highly variable (orange) groups. aThe period lengths of three consecutive randomly sampled cycles from each user in the cohort are plotted on the x, y, and z axes. Visually, weobserve that both groups occupy a very similar region of the period length space (few orange points are placed outside the region occupiedby the teal cluster). b The period length probability distributions of the cohort, where we observe that the orange and teal distributions arelargely overlapping, with the same median of 4 days and a similar shape, indicating that period lengths are distributed very similarly for thetwo groups. We notice a slight peak in single day period reports in both groups, which we argue is reminiscent of app usage behavior: someusers are interested in knowing (approximately) when they had their period, not in tracking how long it was, so they may only track the day itoccurred and not continue tracking after that.
K. Li et al.
5
Scripps Research Translational Institute npj Digital Medicine (2020) 79

symptom tracking behavior. Specifically, our analysis of thesymptoms tracked across the two variability groups showcases thatwhile users exhibit similar tracking frequencies (i.e., the total numberof times they track throughout history) per category (as in Table 3),there are notable differences among their symptom trackingpatterns (i.e., how they track throughout history). The population-level distributions of our metric (i.e., ‘proportion of cycles withsymptom out of cycles with category’ in Eq. (1)) differ between theuser groups across most categories, with these differences beingsignificant for all symptoms within the period, pain, and emotioncategories, a result that may be clinically useful for assessingmenstrual conditions and overall wellness. We present the KS testresults for symptoms within those categories in Table 4.
Reported symptom differences—women in the consistently highlyvariable group display more heterogeneous period trackingbehaviorWe find that women in the consistently highly variable group aresignificantly more likely not to report heavy periods throughouttheir cycle history (odds ratio of 1.734 on the low extreme end of
the proportion range in Table 5). In addition, the tracking patternfor spotting period flow is more heterogeneous for theconsistently highly variable group, as shown by the higher oddsratios on both extremes of the proportion range (i.e., either in allor none of their cycle history) shown in Tables 5 and 6.
Reported symptom differences—women in the consistently highlyvariable group report pain-related symptoms more unpredictablyWe observe generally more heterogeneous experiences for non-bleeding related symptoms like pain for the consistently highlyvariable group. Of particular interest is the finding that users in theconsistently highly variable group are much more likely associatedwith tracking headaches and tender breasts in at least 95% of theircycles, with odds ratios of 1.663 and 1.715, respectively (seeTable 6).
DISCUSSIONCharacterization of menstrual patterns has been previouslyexplored, though typically in relation to cycle and period lengths
Fig. 5 Average cycle and period length by cycle ID. For each user’s cycles (indexed by cycle ID), we average cycle (a) and period length (b)across three different groups: the entire user cohort (top, purple), the consistently not highly variable user cohort (middle, teal), and theconsistently highly variable user cohort (bottom, orange). This allows us to visualize how cycle and period length vary over time for eachgroup on average and in terms of standard deviation (for illustrative purposes, we restrict the cycle ID to 20). Cycle and period length statisticsare stationary over the app usage timeline within each plot. We note that the top and middle plots look similar in each figure (i.e., theconsistently not highly variable group looks similar to the overall population in terms of both cycle and period length), but the wider shadedorange spread of the bottom plot demonstrates the higher degree of variability in the consistently highly variable group. In addition, thisspread is consistently wider for the orange plot over time. This showcases that the consistently highly variable group represents a largedegree of the variability that we see in the data overall.
K. Li et al.
6
npj Digital Medicine (2020) 79 Scripps Research Translational Institute

only. While common knowledge refers to a 28-day cycle as“normal,” this belief has been consistently disproved by clinicalstudies18,22, as well as by recent analysis of high-level cyclecharacteristics via menstrual self-tracking apps61,62.
Overall, our results align with conclusions from these studies inthat the cycle lengths have slightly higher values (median of 29 inour dataset) and wider ranges than what was previouslycommonly believed. While our study population demographicsmay differ slightly from other studies, we believe these stillprovide a reasonable basis for comparison. We show comparativesummary statistics in the Supplementary Information, demonstrat-ing the consistency of our cycle and period characteristics: (i) theaverage number of cycles tracked per user in this dataset (12.9) isbigger than in ref. 61 (8.6), while it matches those (12.8) of ref. 62;(ii) the cycle length statistics are all similar: mean of 29.7 in thiswork, 29.3 in ref. 61; median of 29 in this work, 28 in ref. 62.Interestingly, both this work and ref. 61 report an overall variabilityof cycle length of around 5 days, and both this work and ref. 62
acknowledge the presence of “a heavy tail on longer cycles.” Theperiod length averages of this work and ref. 61 are in agreement aswell (4.08 ± 1.76 vs. 4.0 ± 1.50, respectively). Besides, these high-level cycle statistics align well with the results of previous clinicalstudies18,22,27.Examining cycle length is often insufficient for capturing all
fluctuations in menstrual patterns—studies regarding menstrualvariability showcase that although average cycle length isassociated with cycle length consistency, women still experiencesignificant variability in cycle lengths, regardless of their averagecycle length27. In this work, we address this limitation by utilizingour proposed metric, median CLD, to characterize menstrual cyclevariability. Separating users according to their median CLD yieldstwo distinct groups of users with statistically significant differ-ences in cycle length, cycle length variations, and symptomtracking behaviors. We are unaware of any single figure of meritwhich so helpfully separates users into distinct segments. Clueuses the International Federation of Gynecology and Obstetrics(FIGO) definitions for clinically irregular cycles in the app67, but hasnot found connections with differences in tracking.
Table 4. Kolmogorov–Smirnov test results for symptom trackingpatterns.
Category Symptom Kolmogorov–Smirnovstatistic (95% CI)
Period flow Heavy 0.181 (0.178,0.183)
Period flow Medium 0.134 (0.132,0.137)
Period flow Light 0.121 (0.118,0.124)
Period flow Spotting 0.089 (0.087,0.092)
Type of painexperienced
Cramps 0.101 (0.097,0.104)
Type of painexperienced
Ovulation pain 0.096 (0.093,0.099)
Type of painexperienced
Headache 0.089 (0.087,0.092)
Type of painexperienced
Tender breasts 0.082 (0.080,0.084)
Emotional state Sensitive emotion 0.115 (0.112,0.118)
Emotional state Happy 0.108 (0.105,0.111)
Emotional state PMS 0.086 (0.083,0.089)
Emotional state Sad 0.076 (0.073,0.079)
Kolmogorov–Smirnov test results for symptom tracking patterns that aresignificantly different (at a p= 0.000001 level) between users in theconsistently not highly variable and consistently highly variable groups.
Table 5. Pain and period tracking odds ratios for low extreme end of the proportion range.
Category Symptom Consistently highly variable group’slikelihood for λs < 0.05 (95% CI)
Consistently not highly variable group’slikelihood for λs < 0.05 (95% CI)
Odds ratio (95% CI) forλs < 0.05
Period flow Heavy 0.170 (0.169,0.170) 0.098 (0.096,0.100) 1.734 (1.703,1.766)
Period flow Spotting 0.314 (0.313,0.315) 0.239 (0.237,0.241) 1.314 (1.300,1.328)
Type of painexperienced
Headache 0.326 (0.325,0.327) 0.269 (0.266,0.272) 1.212 (1.199,1.225)
Type of painexperienced
Tender breasts 0.366 (0.365,0.367) 0.320 (0.317,0.322) 1.145 (1.134,1.156)
Likelihood of low λs per group, with the associated odds ratio (and 95% confidence intervals). The probability of not tracking ‘heavy period’ for users in theconsistently highly variable group is 0.17 and 0.098 in the other, with an odds ratio of 1.734: the consistently highly variable group is more likely not to track‘heavy period’.
Table 6. Pain and period tracking odds ratios for high extreme end of the proportion range.
Category Symptom Consistently highly variable group’slikelihood for λs > 0.95
Consistently not highly variable group’slikelihood for λs > 0.95
Odds ratio (95% CI) forλs > 0.95
Period flow Heavy 0.078 (0.077,0.079) 0.096 (0.094,0.097) 0.817 (0.802,0.833)
Period flow Spotting 0.067 (0.066,0.067) 0.039 (0.037,0.040) 1.729 (1.679,1.782)
Type of painexperienced
Tender breasts 0.193 (0.192,0.194) 0.113 (0.111,0.115) 1.715 (1.684,1.746)
Type of painexperienced
Headache 0.218 (0.217,0.219) 0.131 (0.129,0.133) 1.663 (1.636,1.691)
Likelihood of high λs per group, with the associated odds ratio (and 95% confidence intervals). The probability of consistently tracking ‘tender breast’ pain forusers in the consistently highly variable group is 0.193 and 0.113 in the other, with an odds ratio of 1.715: the consistently highly variable group is more likelyto regularly track ‘tender breast’ pain.
K. Li et al.
7
Scripps Research Translational Institute npj Digital Medicine (2020) 79

While there has been ample work on hormone-level character-izations of the menstrual cycle68–71, studies of the relationshipbetween menstrual patterns and symptomatic variables arelimited—recent work has explored this association using self-tracked data, but over a limited set of symptoms72 and withoutdiscriminating over age or birth control usage60. A method forestimating ovulation timing based on Fertility Awareness Methodobservations (i.e., basal body temperature (BBT), cervical mucus,cervix position, and vaginal sensation) has been presented62, butsuch data are inaccessible for this study due to the EuropeanUnion’s General Data Protection Regulation and other data-privacy concerns (sensitive fields such as appointments, ovulationand pregnancy tests, and BBT were not available in Clue’s dataset).Nonetheless, such studies showcase the potential large-scale self-tracked data offer in exploring questions relating to menstruation.This work further demonstrates that mobile self-tracked data
provide an accessible option for clinicians and researchersinvestigating changes of a variable of interest across themenstrual cycle. Our dataset allows us to explore symptoms ofinterest like pain, types of bleeding, and emotions explicitly, andwe are able to connect variability in cycle lengths to patterns inself-reported symptom tracking. In contrast to existing work, ourmethods allow us to comment quantitatively and qualitatively onthe menstrual experience over a broad set of symptoms. Whilecycle length has been proposed as a biomarker of menstrualhealth (e.g., very long and very short cycles are associated with ahigher risk of infertility), this work suggests that cycle variabilitymay also be a useful biomarker.We propose a definition of menstrual cycle variability and find
that users in high and low variability groups showcase bothstatistically significant differences in their cycle statistics, as well asin their symptom tracking patterns. We argue that the discovery ofsuch distinct forms of symptom expression allows for phenotypeidentification and the investigation of clinical associations. Inparticular, of the symptoms that show statistically significantassociation with timing data (as measured by median CLD), someof the most arguably unambiguous ones like period flow and painare also the diagnostic symptoms frequently appearing in theassessment of menstrual health conditions like endometriosis andpolycystic ovary syndrome (PCOS). Thus, cycle variability and thesehigh-signal self-tracked symptom patterns can be potentiallyuseful either for predicting each other (e.g., predicting cyclevariability from symptoms) or health consequences (e.g., PCOS),insights that are useful to both clinicians and users.Our perspective on how users experience their menstruation
enables development of data-driven models to predict multipleaspects of the menstrual cycle based on self-tracked history,ranging from modeling time to the next cycle, to forecasting theoccurrence of specific symptoms a user might report, to detectingunderlying medical conditions. Equipped with the results of thiswork at the cycle level, future work will consist of identifyingfurther differences at a finer grain, namely across the differentmenstrual phases.Despite the strength of these results, there are several
mitigating factors to bear in mind. We acknowledge that self-tracked data may be unreliable for several reasons, such asinconsistent user engagement or ambiguous symptomatic lan-guage. For example, there is potential overlap between similar-sounding symptoms, e.g., some users may track ‘low energy,’whereas others may track ‘exhausted.’ Users can also engageinconsistently by tracking an unequal number of cycles orforgetting to track their period. We successfully ameliorate thelatter issue by excluding unexpectedly long cycles utilizing ourproposed procedure. For the former issue, we observe that theconsistently highly variable group tracked a lower number ofcycles on average (see Table 2). However, we note that thenumber of users who only tracked two cycles (after ourpreprocessing steps) is small across the entire cohort, representing
2.62% and 0.57% of the consistently highly and not highly variablegroups, respectively.In addition to the risk of inconsistent user engagement,
inherent in the nature of self-tracked data is the challenge ofdisentangling user behavior from true physiological experiences.The design and selection of symptoms for the Clue app was basedboth on the scientific literature around the menstrual experienceand research on which categories users deemed important. Assuch, in order to encompass a wide range of relevant menstrualand health experiences, the available tracking categories arebroad and treated with equal importance. However, we acknowl-edge that since the symptoms in the app are not based onvalidated scales and are not designed for diagnosis of specificconditions, they are most likely not granular (or targeted) enoughto make definite claims about specific conditions. Furthermore,while there are infotexts in the Clue app that explain each trackingcategory, self-reported data are influenced by individual userinterpretation, and by how users use the app to meet their ownneeds; we cannot guarantee that each category holds the samemeaning for each user.In this paper, we take symptom tracking behavior to be a proxy
for true physiological behavior. However, we are cognizant of thefact that these are not necessarily equivalent. Note that it is verydifficult to know what the true physiological experience is in anycircumstance: e.g., the experience of menopause varies greatly byculture73. With self-tracked data and without access to groundtruth, it is complicated (if not impossible) to truthfully distinguishthe experienced symptoms from the tracked ones, due to thepresence of engagement artifacts and other unforeseen factors. Assuch, we have taken steps to reduce tracking artifacts withpreprocessing techniques, but recognize that limitations remain.Nonetheless, it remains useful to examine these datasets to betterunderstand not only women’s menstrual experiences at scale, butalso how to improve self-tracking technologies to enable clearer,more interpretable datasets in the future.Overall, large-scale self-tracked mobile-health data allow us to
quantitatively explore the question of characterizing menstrualbehavior. Our findings reinforce the claim that menstruation ischaracterized by variability rather than by regularity17,18,22,27,29. Wefind variation in cycle length statistics as well as in self-reportedsymptoms, showcasing the spectrum of how women experiencetheir menstruation. We reveal statistically significant relationshipsbetween the variability of cycle length and self-reportedqualitative symptoms. The identified set of symptoms that showassociation with timing data (e.g., period flow and pain) are thediagnostic symptoms frequently leveraged for diagnosis of health-relevant conditions, such as endometriosis and PCOS, insights thatare useful to both clinicians and users. More broadly, we alsodevelop a methodology for identifying artifacts in self-trackeddata, which can be extended to other self-reported menstrualtracking datasets. This work not only statistically verifies thevariation of menstrual experience, but also presents promisingopportunities for future statistical modeling, prediction, and thepotential to inform diagnosis of menstrual-related disorders.
METHODSData overviewWe leverage a deidentified version of the Clue data warehouse, a datasetof 117,014,597 self-tracking events for 378,694 users in our cohort ofinterest. Clue app users input overall personal information at sign up, suchas age and hormonal birth control (HBC) type. The dataset containsinformation from 2015 to 2018 for users worldwide, covering countrieswithin North and South America, Europe, Asia, and Africa (seeSupplementary Information for a detailed count of cohort users percountry). Users can self-track symptoms over time across the 20 availablecategories (see Table 3 for symptom list) and can preselect which
K. Li et al.
8
npj Digital Medicine (2020) 79 Scripps Research Translational Institute

categories they wish to track when they sign up—all users do not track allcategories.Clue app users track an event by selecting a category and then choosing
an associated symptom. Each row in the primitive dataset represents atracked event e, with relevant fields being (i) the user u that tracked theevent eu, (ii) the reported symptom s in that event eu= s, and (iii) the user-specific cycle ce in which the event takes place. A menstrual cycle isdefined as the span of days from the first day of a period through to andincluding the day before the first day of the next period29. A periodconsists of sequential days of bleeding (greater than spotting and within10 days after the first greater-than-spotting bleeding event) unbroken byno more than one day on which only spotting or no bleeding occurred.Note that Clue considers a menses duration longer than 10 days as anoutlier, as it would exceed mean period length plus 3 standard deviationsfor any studied population29. In addition, a user has the opportunity tospecify whether a cycle should be excluded from their Clue history—forinstance, if the user feels that the cycle is not representative of their typicalmenstrual behavior due to a medical procedure or changes in birthcontrol.
Cohort definitionA cohort of users and cycles was selected for this analysis, based on factors,including age, HBC usage, cycle length, and engagement patterns. Recallthat we restricted our data to users aged between 21 and 33 years, sincemenstrual cycles are relatively less variable in length and more likely to beovulatory during this age range18,22,29,65,66. At younger ages, thereproductive axis (the hypothalamic–pituitary–ovarian axis) in somewomen, especially those who experienced a later-than-average age atmenarche, may not be fully matured. At older ages, some women may beexperiencing premature menopause. Restricting our sample to this agegroup substantially reduces the influence of confounders like undetectedheterogeneity on our analyses. Per-age details like cycle and period lengthstatistics are provided in the Supplementary Information.Since HBC and copper IUDs have been shown to impact cycle length
and other aspects of menstruation, we consider natural menstrual cyclesonly. Therefore, we ignore cycles from users who reported some form ofHBC (patch, pill, injection, ring, and implant) or IUD (we excluded all cycleswith evidence of IUD use, as there is no explicit distinction betweenhormonal and copper IUD usage in the dataset). This step removes about45% of the cycle data, but is crucial to studying menstruation in astandardized way across users, else it would be unclear whether anexhibited menstrual behavior was due to physiology or the effect of birthcontrol. We exclude cycles that a user deems to be anomalous to avoidpotential artifacts in cycle patterns. In addition, we eliminate cycles greaterthan 90 days long, as well as users who have only tracked two cycles, torule out cases that we argue indicate lack of engagement or noncontin-uous use of the app. Finally, we exclude cycles where we believe the userforgot to track their period, hence resulting in an artificially long cyclelength; we explain this procedure below. The effect of these filtering stepson the dataset is outlined in Fig. 6, with the final step indicating theremoval of aforementioned suspected artificially long cycles. In total, theproposed data-filtering steps reduced the size of the cycle dataset byabout 49%. However, the resulting age-specific, natural cycle-only usercohort and the corresponding dataset with potential artifacts removedenables us to study our research questions in a less noisy setting.
EthicsThe research presented here was exempt from Columbia University IRBapproval, in accordance with 45CFR46.101(b), as all data are deidentified,and no participant risks are associated with taking part in the study.Participants do not receive direct benefit from this study, but theirparticipation contributes to the general knowledge of menstrual cyclesand their symptoms.
Characterizing longitudinal menstrual tracking via cycle lengthdifferenceThere are many useful ways to characterize menstrual cycles, each ofwhich offers its own advantages and disadvantages. For instance, cyclelength provides insight into the length of time between periods and hasbeen widely documented to vary across women22–28, but is insufficient forunderstanding menstrual cycle length volatility, as it fails to characterizevariability from one cycle to the next.
We propose computing cycle length differences (CLDs), which we defineas the absolute differences in subsequent cycle lengths. CLDs represent auser’s longitudinal cycle tracking history by quantifying their between-cycle volatility. This metric captures menstrual patterns, regardless ofspecific cycle lengths, allowing us to measure fluctuation over time andidentify those who are consistently highly variable. This metric does notcapture some other menstrual phenomena, such as cycle lengths growingat a constant rate—that is, if a cycle length grew consistently by two dayswith each cycle, the CLDs would all be equal to two, but there would be alarge difference between the shortest and longest cycle lengths. However,CLDs and related metrics of median and maximum CLD do allow us tocharacterize users on the extreme ends of the between-cycle variabilityspectrum and identify potential cycle tracking artifacts, as described in thefollowing sections. Figure 7 outlines the computation of CLDs and relatedstatistics.
Quantifying engagement with cycle trackingWe propose a methodology for identifying cycles associated with lack ofapp engagement, specifically where users forgot to track their period, sincethis may inflate the corresponding computed cycle length. Our procedureallows us to distinguish physiological behavior (i.e., true ‘long’ cyclelengths) from tracking artifacts (i.e., artificially inflated cycle lengths), whichallows us to more reliably utilize symptom tracking behavior as a proxy fortrue physiological behavior.Figure 8 showcases how maximum CLD impacts our overall picture of
user engagement. In particular, the multimodal nature of the histogram ofmaximum CLD (in blue) indicates that there may be cycles where usersforgot to track their period, resulting in an overestimation of cycle length.Note the peaks around 30 and 60 days, which may correspond to usersforgetting to track one or two periods, respectively. That is, consider a userwho exhibits a perfectly uniform cycle length of 30 and hence always has aCLD of 0. If this user were to forget to track a period once in their history,then the app would record that they have a cycle length of 60 and amaximum CLD of 30—such a user would fall into the first peak of thehistogram. The discrepancy between regular patterns (via the median CLD)and extreme events (maximum CLD) is further illustrated in Fig. 9.We identify cycles that are ‘atypically long’ compared with the ‘typical’
cycle length for each user by examining the difference between each CLDand the median CLD of that user. An illustrative example is provided in thetop panel of Fig. 7, where the third cycle appears to be ‘atypically long.’Specifically, we flag cycles per user where the corresponding CLD exceedsthe user’s median CLD by at least 10 days as ‘atypically long’ (the longer ofthe two cycles corresponding to the CLD is flagged). This cutoff is based onan attempt to find in the data, rather than posit a priori, a feature thatwould distinguish ‘typical’ from ‘extreme’ (i.e., abnormally long) reported
start: 851.9K users, 9.7M cycles
450.8K users, 5.4M cycles (52.9% users, 55.3% cycles remain)
natural cycles only
449.7K users, 5.3M cycles (52.8% users, 54.8% cycles remain)
446.9K users, 5.2M cycles (52.5% users, 53.9% cycles remain)
378.7K users, 5.1M cycles (44.5% users, 52.9% cycles remain)
378.7K users, 4.9M cycles (44.5% users, 50.3% cycles remain)
exclude user-excluded cycles
exclude cycles > 90 days
exclude users with only two cycles
exclude potential cycle artifacts
Fig. 6 Filtering process for computing user and cycle cohort. Step-by-step filtering process for computing the final user and cyclecohort. The percentage of users and cycles removed at each step iscomputed out of the initial numbers. Note that we only includeusers aged between 21 and 33 years, since women exhibit morestable menstrual behavior in their ‘middle life’ phase18,22,29,65,66.
K. Li et al.
9
Scripps Research Translational Institute npj Digital Medicine (2020) 79
cycles. To do so, we plot the two-dimensional histogram (see Fig. 9) ofmaximum CLD against median CLD; this is a histogram in which everyexample is a user. We observe a clear visual feature: a band of users weconsider ‘typical,’ for whom maximum CLD was within 10 days of themedian CLD, and a scatter of other users for whom their maximum CLDcould be far larger. To capture this visually striking feature (see thediagonal red line along maximum CLD equal to 10 more than median CLDin Fig. 9), we defined extreme events as those at least 10 days above themedian CLD. We consider the cycles flagged as ‘atypically long’ to be theresult of cycle engagement artifacts and exclude them from our analysis.As shown in Fig. 8 (red line), the multimodal shape is largely removed
after eliminating the ‘atypically long’ cycles. We find that 42% of the cohorthas at least one such cycle, and for these users, we exclude a small number(1.59) of cycles per user on average. This indicates that our method isstringent enough to identify artificially long cycles, but conservativeenough to preserve the heterogeneity of the data.
We further validate our method by examining tracking activity duringthe interval where a user is expected to track their period for each of theseexcluded cycles and find that in 89.18% of such cases, there is no evidenceof bleeding-related events during this interval, i.e., the user likely did notengage in period tracking. Note that we define this interval as the user’slast reported period day plus their median cycle length, plus or minus theirmedian period length. In the remaining 10.82% of excluded cycles, it isunclear whether the bleeding-related events tracked during this intervalrepresent a period or some other non-period bleeding. Note that by ourdefinition of a period, a single bleeding event is not synonymous with
cycle day 1 2 3 4 28 29 30 1 2 3 4 26 27 28 1 2 3 4 38 39 40
period day1 2 3 4 1 2 3 4
cycle length: 30
CLD: 2
1 2 3 4
cycle length: 28 cycle length: 40
//
CLD: 12
// //1 2 3 4 23 24 25
1 2 3 4
//
cycle length: 25
CLD: 15
median CLD: 12; max CLD: 15
cycle day 1 2 3 4 28 29 30 1 2 3 4 25 26 27 1 2 3 4 41 42 43
period day1 2 3 4 1 2 3 4
cycle length: 30
CLD: 3
1 2 3 4
cycle length: 27 cycle length: 43
//
CLD: 16
// //1 2 3 4 36 37 38
1 2 3 4
//
cycle length: 38
CLD: 5
median CLD: 5; max CLD: 16
1 2 3 4
//1 2 3 4 41 42 43
cycle length: 43
//
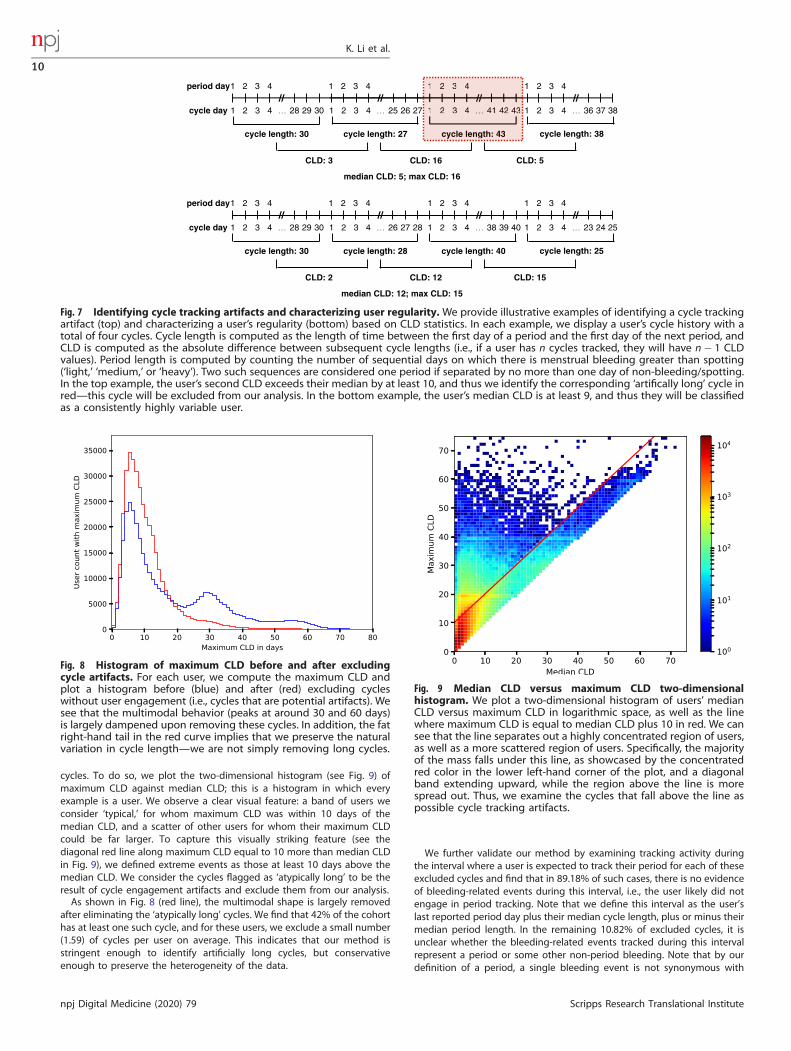
Fig. 7 Identifying cycle tracking artifacts and characterizing user regularity. We provide illustrative examples of identifying a cycle trackingartifact (top) and characterizing a user’s regularity (bottom) based on CLD statistics. In each example, we display a user’s cycle history with atotal of four cycles. Cycle length is computed as the length of time between the first day of a period and the first day of the next period, andCLD is computed as the absolute difference between subsequent cycle lengths (i.e., if a user has n cycles tracked, they will have n− 1 CLDvalues). Period length is computed by counting the number of sequential days on which there is menstrual bleeding greater than spotting(‘light,’ ‘medium,’ or ‘heavy’). Two such sequences are considered one period if separated by no more than one day of non-bleeding/spotting.In the top example, the user’s second CLD exceeds their median by at least 10, and thus we identify the corresponding ‘artifically long’ cycle inred—this cycle will be excluded from our analysis. In the bottom example, the user’s median CLD is at least 9, and thus they will be classifiedas a consistently highly variable user.
Fig. 8 Histogram of maximum CLD before and after excludingcycle artifacts. For each user, we compute the maximum CLD andplot a histogram before (blue) and after (red) excluding cycleswithout user engagement (i.e., cycles that are potential artifacts). Wesee that the multimodal behavior (peaks at around 30 and 60 days)is largely dampened upon removing these cycles. In addition, the fatright-hand tail in the red curve implies that we preserve the naturalvariation in cycle length—we are not simply removing long cycles.
Fig. 9 Median CLD versus maximum CLD two-dimensionalhistogram. We plot a two-dimensional histogram of users’ medianCLD versus maximum CLD in logarithmic space, as well as the linewhere maximum CLD is equal to median CLD plus 10 in red. We cansee that the line separates out a highly concentrated region of users,as well as a more scattered region of users. Specifically, the majorityof the mass falls under this line, as showcased by the concentratedred color in the lower left-hand corner of the plot, and a diagonalband extending upward, while the region above the line is morespread out. Thus, we examine the cycles that fall above the line aspossible cycle tracking artifacts.
K. Li et al.
10
npj Digital Medicine (2020) 79 Scripps Research Translational Institute

period. As a conservative measure and to maintain consistency of ourdefinitions for period and artificially long cycles, we exclude those cyclesfrom our analysis. This ensures a coherent data preprocessing pipeline andimpacts the results minimally (these excluded cycles with some bleeding-related events amount to only 0.56% of all cycles). Quantifying inconsistenttracking engagement allows us to ameliorate its impact on subsequentanalyses.
Characterizing users according to cycle length variabilityWe acknowledge that there is a wide spectrum of variability in women’smenstrual health experiences, and we wish to examine those who fall atopposite ends of the variability spectrum on the basis of their cycle patternconsistency. We choose the median CLD metric for our analysis, as it isrobust to outliers (the mean would be more susceptible to being skewedby rare events). Upon examining the cumulative distribution of this metricacross users in Fig. 10, we consider a median CLD of greater than 9 days tobe an appropriate stringent cutoff for identifying consistently highlyvariable menstrual patterns. This choice aligns with previous work onmenstrual pattern analysis: cycle length variability studies in Guatemalan,Bolivian, Indian, US, and European women noted differences in themaximum and minimum cycle length ranging from 6 to 14 days23–28. Ourproposed cutoff separates users into two distinct groups of menstrualpatterns: the vast majority (92.32%) of the population falls to the left of thisthreshold, and thus the consistently highly variable group (the remaining7.68%) represent those whose variability is extreme. As discussed in theResults section, we observe that the highly variable group experiencesmore drastic fluctuations in cycle length. We confirm that the cycle lengthdistributions differ significantly between the two groups using a two-sample Kolmogorov–Smirnov74 test.
Quantifying symptom tracking behavior across user groupsWe focus on symptom tracking behavior at the cycle level, evaluating howoften throughout their longitudinal tracking users track each symptom,regardless of when within the cycle the tracking occurred (i.e., ignoring atwhich phase or day of the cycle the symptom occurred). Note that becausecycle length varies both within each user’s longitudinal tracking and acrosswomen, the number of tracking events per cycle would be skewed bycycle length. To combat this issue, we measure the per-user proportion ofcycles where a symptom has been tracked.We also want our metric to capture symptom tracking behavior for
cycles where users were interested in tracking the associated category(recall how users do not have to track all categories). Specifically, ouranalysis focuses on how often a user u has a symptom s tracking eventeu= s per cycle n, given that they have tracked symptoms within theassociated category C at least once across all their cycles Nu. We refer tothis metric as the ‘proportion of cycles with symptom out of cycles with
category,’ mathematically denoted as
λus ¼PNu
n¼11½9eu ¼ s�
PNu
n¼11½9eu 2 C�
: (1)
That is, to account for whether a user is actually interested in the symptomat hand, we compute the proportion of cycles with a symptom beingtracked out of the number of cycles where the user has tracked thecategory related to that symptom. For example, consider a user whotracked 8 cycles; out of these, they tracked any of the symptoms within thepain category for 5 cycles. Specifically, they tracked the symptom‘headache’ for a single cycle and ‘tender breasts’ for 4 cycles. Our metricλs captures the tracking regularity of a given symptom across a user’scycles. When applied to the example user, 20% of cycles with pain have‘headache’ tracked, while 80% of the same cycles have reports of ‘tenderbreasts.’ In essence, λus is the conditional probability that user u tracks thespecific symptom s, given that they have tracked any symptom from thesymptom’s corresponding category. Our metric measures per-cyclesymptom tracking frequency and is robust to (i) different cycle lengthsand number of cycles (as it is normalized with respect to each user’snumber of cycles), (ii) different user app interests (as it is contingent onwhether the user has shown interest in tracking a given category at leastonce), and (iii) different app usage behaviors (as it does not depend of howmany times within a cycle the symptom is tracked).We study the cumulative distributions of λs per group (i.e., λus for all
users u within each variability group), as well as how such densities aredifferent on their support boundaries across groups. Since we lack amechanistic model of what distribution the data might follow and wish touse a test meaningful for any distribution, we utilize a nonparametric testsuitable for any ordinal (as opposed to, e.g., binary or categorical data): theKolmogorov–Smirnov (KS) test74. This test of the comparative equality ofone-dimensional probability distributions arising from two samples allowsus to quantify statistical differences in symptom tracking behaviorbetween groups. Specifically, we compare the distributions of theproportion of cycles with a symptom tracked (out of cycles with itscorresponding category) for the consistently not highly variable andconsistently highly variable user groups. The KS statistic quantifies thedistance between the empirical cumulative distributions of two samples,and the associated test is sensitive to differences in both location andshape of said distributions, allowing us to characterize where and howmuch the symptom tracking patterns (as measured by the proposed λsmetric) differ between groups.In the two-sample case, the null distribution of the KS statistic is
calculated under the null hypothesis that the samples are drawn from thesame distribution, where the distribution considered under the nullhypothesis is an unrestricted continuous distribution (i.e., no distributionalassumption is made on the symptom tracking patterns). The KS statisticdepends on the number of data points within each of the populations (i.e.,the number of observations that we have for each group when computingtheir per-symptom empirical cumulative density function). The nullhypothesis is rejected at level α if
Dn;m >
ffiffiffiffiffiffiffiffiffiffiffiffiffiffiffiffiffiffiffiffiffiffiffiffiffiffiffiffiffiffiffi
� 12lnα � nþm
nm
r
; (2)
where n and m are the sizes of the first and second data samples,respectively, and Dn,m, the computed two-sample KS statistic. The p-valuesreported by the KS test consider observed sample sizes, accounting for theimpact of whether certain symptoms are more or less frequently logged ineach group.In order to explore how the empirical distributions differ, we study their
support boundaries, i.e., p(λs > 0.95) and p(λs < 0.05). These represent howlikely users in each group are to either consistently track a symptomthroughout their cycle history (i.e., in almost every cycle where they trackthe category), or to not track it at all (i.e., in very few of their cycles wherethey track the category). We compute the odds ratio of these values (oneither the high or low extreme end of the proportion range) for theconsistently highly variable group to the consistently not highly variablegroup. If we have an odds ratio greater than 1 for the high extreme end ofthe metric range for a symptom, this would indicate that the consistentlyhighly variable group is more likely to report a very high proportion ofcycles with that symptom. On the other hand, an odds ratio greater than 1for the low extreme end of the proportion range (i.e., the proportion ofcycles with a symptom tracked is close to zero) indicates that the
Fig. 10 Cumulative distribution of median CLD. Looking at thecumulative distribution of median CLD, we see that the curveflattens out significantly around the ‘elbow’ at 9 days; thus, wechoose greater than 9 days as our cutoff for our definition ofconsistently highly variable.
K. Li et al.
11
Scripps Research Translational Institute npj Digital Medicine (2020) 79

consistently highly variable group is more likely not to report such asymptom.When possible, 95% confidence intervals have been added to reported
KS values using bootstrap analysis. To do so, we draw 100,000 randomsamples—resampled with replacement—from each variability group andreport the estimated mean KS statistic values and their 2.5 and 97.5percentiles.
Reporting summaryFurther information on experimental design is available in the NatureResearch Reporting Summary linked to this article.
DATA AVAILABILITYThe database that supports the findings of this study was made available by Clue byBioWink GmbH. While it is deidentified, it cannot be made directly available to thereader. Researchers interested in gaining access to the data can contact Clue byBioWink GmbH, and establish a data use agreement with them.
CODE AVAILABILITYOur code has been developed using open-source tools in Python with commonstatistical libraries (e.g., Pandas and SciPy). The code required for data preprocessingand producing results is available in the public GitHub repository https://github.com/iurteaga/menstrual_cycle_analysis.
Received: 11 October 2019; Accepted: 23 March 2020;
REFERENCES1. Popat, V. B., Prodanov, T., Calis, K. A. & Nelson, L. M. The menstrual cycle: a
biological marker of general health in adolescents. Ann. N. Y. Acad. Sci. 1135,43–51 (2008).
2. Bedford, J. L., Prior, J. C. & Barr, S. I. A prospective exploration of cognitive dietaryrestraint, subclinical ovulatory disturbances, cortisol, and change in bone densityover two years in healthy young women. J. Clin. Endocrinol. Metab. 95, 3291–3299(2010).
3. Zittermann, A. et al. Physiologic fluctuations of serum estradiol levels influencebiochemical markers of bone resorption in young women. J. Clin. Endocrinol.Metab. 85, 95–101 (2000).
4. Solomon, C. G. et al. Menstrual cycle irregularity and risk for future cardiovasculardisease. J. Clin. Endocrinol. Metab. 87, 2013–2017 (2002).
5. Carmina, E. & Lobo, R. A. Polycystic ovary syndrome (PCOS): arguably the mostcommon endocrinopathy is associated with significant morbidity in women. J.Clin. Endocrinol. Metab. 84, 1897–1899 (1999).
6. Giudice, L. C. Endometriosis. N. Engl. J. Med. 362, 2389–2398 (2010).7. Barbosa, C. P., Souza, A. B. D., Bianco, B. & Christofolini, D. The effect of hormones
on endometriosis development. Minerva Gynecol. 63, 375–386 (2011).8. Shuster, L. T., Rhodes, D. J., Gostout, B. S., Grossardt, B. R. & Rocca, W. A. Premature
menopause or early menopause: long-term health consequences. Maturitas 65,161–166 (2010).
9. Mahoney, M. M. Shift work, jet lag, and female reproduction. Int. J. Endocrinol.https://www.ncbi.nlm.nih.gov/pmc/articles/PMC2834958/ (2010).
10. Jordan, J., Craig, K., Clifton, D. K. & Soules, M. R. Luteal phase defect: the sensitivityand specificity of diagnostic methods in common clinical use. Fertil. Steril. 62,54–62 (1994).
11. Crawford, N. M., Pritchard, D. A., Herring, A. H. & Steiner, A. Z. Prospective eva-luation of luteal phase length and natural fertility. Fertil. Steril. 107, 749–755(2017).
12. Prior, J. C. Perimenopause The complex endocrinology of the menopausal tran-sition. Endocr. Rev. 19, 397–428 (1998).
13. Landgren, B.-M. et al. Menopause transition: annual changes in serum hormonalpatterns over the menstrual cycle in women during a nine-year period prior tomenopause. J. Clin. Endocrinol. Metab. 89, 2763–2769 (2004).
14. Prior, J. C. & Hitchcock, C. L. The endocrinology of perimenopause: need for aparadigm shift. Front. Biosci. 3, 474–486 (2011).
15. Prior, J. C., Vigna, Y., Sciarretta, D., Alojado, N. & Schulzer, M. Conditioning exercisedecreases premenstrual symptoms: a prospective, controlled 6-month trial. Fertil.Steril. 47, 402–408 (1987).
16. Barr, S., Janelle, K. & Prior, J. C. Energy intakes are higher during the luteal phaseof ovulatory menstrual cycles. Am. J. Clin. Nutr. 61, 39–43 (1995).
17. Arey, L. B. The degree of normal menstrual irregularity. Am. J. Obstet. Gynecol. 37,12–29 (1939).
18. Treloar, A. E., Boynton, R. E., Behn, B. G. & Brown, B. W. Variation of the humanmenstrual cycle through reproductive life. Int. J. Fertil. 12, 77–126 (1967).
19. Snowden, R., Christian, B. & World Health Organization. Patterns and perceptionsof menstruation: a World Health Organization international collaborative study inEgypt, India, Indonesia, Jamaica, Mexico, Pakistan, Philippines, Republic of Korea,United Kingdom and Yugoslavia (World Health Organization by Croom Helm,1983).
20. Ferrell, R. J. et al. The length of perimenopausal menstrual cycles increases laterand to a greater degree than previously reported. Fertil. Steril. 86, 619–624 (2006).
21. Gorrindo, T. et al. Lifelong menstrual histories are typically erratic and trending: ataxonomy. Menopause 14, 74–88 (2007).
22. Chiazze, L., Brayer, F. T., John, J., Macisco, J., Parker, M. P. & Duffy, B. J. The lengthand variability of the human menstrual cycle. J. Am. Med. Assoc. 203, 377–380(1968).
23. Mn¨ster, K., Schmidt, L. & Helm, P. Length and variation in the menstrual cycle—across-sectional study from a Danish county. Br. J. Obstet. Gynaecol. 99, 422–429(1992).
24. Belsey, E. M. & Pinol, A. P. Menstrual bleeding patterns in untreated women. Taskforce on long-acting systemic agents for fertility regulation. Contraception 55,57–65 (1997).
25. Burkhart, M. C., de Mazariegos, L., Salazar, S. & Hess, T. Incidence of irregularcycles among Mayan women who reported having regular cycles: implicationsfor fertility awareness methods. Contraception 59, 271–275 (1999).
26. Vitzthum, V. J., Spielvogel, H., Caceres, E. & Gaines, J. Menstrual patterns andfecundity among non-lactating and lactating cycling women in rural highlandBolivia: implications for contraceptive choice. Contraception 62, 181–187 (2000).
27. Creinin, M. D., Keverline, S. & Meyn, L. A. How regular is regular? An analysis ofmenstrual cycle regularity. Contraception 70, 289–292 (2004).
28. Williams, S. R. Menstrual cycle characteristics and predictability of ovulation ofBhutia women in Sikkim. India J. physiological Anthropol. 25, 85–90 (2006).
29. Vitzthum, V. J. The ecology and evolutionary endocrinology of reproduction inthe human female. Am. J. Phys. Anthropol. 140, 95–136 (2009).
30. American College of Obstetricians and Gynecologists. Menstruation in girls andadolescents: using the menstrual cycle as a vital sign. Obstet. Gynecol. 126, 143–6(2015).
31. Bobel, C. in The Managed Body: Developing Girls and Menstrual Health in the GlobalSouth (ed. Bobel, C.) 281–321 (Springer International Publishing, Cham, 2019).
32. Lippe Taylor, Inc. Scientific forum addresses menstrual cycle as vital sign. https://www.eurekalert.org/pub_releases/2004-09/lti-sfa092004.php (2004).
33. American Academy of Pediatrics, and American College of Obstetricians andGynecologists. Menstruation in girls and adolescents: using the menstrual cycleas a vital sign. Pediatrics 118, 2245–2250 (2006).
34. Solomon, C. G. et al. Long or highly irregular menstrual cycles as a marker for riskof type 2 diabetes mellitus. Jama 286, 2421–2426 (2001).
35. Solomon, C. G. et al. Menstrual cycle irregularity and risk for future cardiovasculardisease. J. Clin. Endocrinol. Metab. 87, 2013–2017 (2002).
36. Hripcsak, G. et al. Characterizing treatment pathways at scale using the OHDSInetwork. Proc. Natl Acad. Sci. USA 113, 7329–7336 (2016).
37. Li, I., Dey, A. & Forlizzi, J. A stage-based model of personal informatics systems. inProceedings of the SIGCHI Conference on Human Factors in Computing Systems,557–566 (ACM, 2010).
38. Kohane, I. S. Ten things we have to do to achieve precision medicine. Science 349,37–38 (2015).
39. Fox, S. & Duggan, M. Tracking for Health. Tech. Rep. (Pew Research Center, 2013).40. Krebs, P. & Duncan, D. T. Health app use among US mobile phone owners: a
national survey. JMIR mHealth and uHealth 3, e101 (2015).41. Althoff, T. Population-scale pervasive health. IEEE Pervasive Comput. 16, 75–79
(2017).42. Althoff, T. et al. Large-scale physical activity data reveal worldwide activity
inequality. Nature 547, 336–339 (2017).43. Chan, Y.-F. Y. et al. The Asthma Mobile Health Study, a large-scale clinical
observational study using ResearchKit. Nat. Biotechnol. 35, 354 (2017).44. Webster, D. E. et al. The Mole Mapper Study, mobile phone skin imaging and
melanoma risk data collected using ResearchKit. Sci. Data 4, 170005 (2018).45. Egger, H. L. et al. Automatic emotion and attention analysis of young children at
home: a ResearchKit autism feasibility study. npj Digital Med. 1, 20 (2018).46. Bot, B. M. et al. The mPower study, Parkinson disease mobile data collected using
ResearchKit. Sci. Data 3, 160011 (2016).47. Dagum, P. Digital biomarkers of cognitive function. npj Digital Med. 1, 10 (2018).48. Smets, E. et al. Large-scale wearable data reveal digital phenotypes for daily-life
stress detection. npj Digital Med. 1, 67 (2018).49. Byambasuren, O., Sanders, S., Beller, E. & Glasziou, P. Prescribable mHealth apps
identified from an overview of systematic reviews. npj Digital Med. 1, 12 (2018).
K. Li et al.
12
npj Digital Medicine (2020) 79 Scripps Research Translational Institute

50. Ata, R. et al. Clinical validation of smartphone-based activity tracking in peripheralartery disease patients. npj Digital Med. 1, 66 (2018).
51. Torous, J. et al. Characterizing the clinical relevance of digital phenotyping dataquality with applications to a cohort with schizophrenia. npj Digital Med. 1, 15(2018).
52. Urteaga, I., McKillop, M., Lipsky-Gorman, S. & Elhadad, N. Phenotyping endome-triosis through mixed membership models of self-tracking data. in 2018 MachineLearning for Healthcare (MLHC) (2018).
53. Wartella, E., Rideout, V., Montague, H., Beaudoin-Ryan, L. & Lauricella, A. Teens,health and technology: a national survey. Media Commun. 4, 13–23 (2016).
54. Fox, S. & Duggan, M. Mobile Health 2012. Tech. Rep. (Pew Research Center,2012).
55. Clue by BioWink GmbH, Adalbertstraße 7-8, 10999 Berlin, Germany. https://helloclue.com/ (2019).
56. Dot: A Fertility Tracker App. https://www.dottheapp.com/ (2019).57. Glow: An App for Fertility & Beyond. https://glowing.com/glow (2019).58. Spot On: A Birth Control and Period Tracker App powered by Planned Parenthood.
https://shortyawards.com/9th/spot-on (2019).59. Natural Cycles: Digital Birth Control. https://www.naturalcycles.com (2019).60. Pierson, E., Althoff, T., Thomas, D., Hillard, P. & Leskovec, J. The menstrual cycle is
a primary contributor to cyclic variation in women's mood, behavior, and vitalsigns. bioRxiv. https://doi.org/10.1101/583153 (2019).
61. Bull, J. R. et al. Real-world menstrual cycle characteristics of more than 600,000menstrual cycles. npj Digital Med. 2, 83 (2019).
62. Symul, L., Wac, K., Hillard, P. & Salathé, M. Assessment of menstrual health statusand evolution through mobile apps for fertility awareness. npj Digital Med. 2, 64(2019).
63. Epstein, D. A. et al. Examining menstrual tracking to inform the design of per-sonal informatics tools. in Proceedings of the 2017 CHI Conference on HumanFactors in Computing Systems, 6876–6888 (2017).
64. Moglia, M. L., Nguyen, H. V., Chyjek, K., Chen, K. T. & Castaño, P. M. Evaluation ofsmartphone menstrual cycle tracking applications using an adapted applicationsscoring system. Obstet. Gynecol. 127, 1153–1160 (2016).
65. Ferrell, R. J. et al. Monitoring reproductive aging in a 5-year prospective study:aggregate and individual changes in steroid hormones and menstrual cyclelengths with age. Menopause 12, 567–757 (2005).
66. Harlow, S. D. et al. Executive summary of the stages of reproductive agingworkshop+ 10: addressing the unfinished agenda of staging reproductive aging.J. Clin. Endocrinol. Metab. 97, 1159–1168 (2012).
67. Druet, A. What is an “irregular” menstrual cycle? https://helloclue.com/articles/cycle-a-z/whatis-an-irregular-menstrual-cycle (2018).
68. Johannisson, E., Landgren, B.-M., Rohr, H. P. & Diczfalusy, E. Endometrial mor-phology and peripheral hormone levels in women with regular menstrual cycles.Fertil. Steril. 48, 401–408 (1987).
69. Fehring, R. J., Schneider, M. & Raviele, K. M. Variability in the phases of themenstrual cycle. J. Obstet., Gynecologic, Neonatal Nurs. 35, 376–84 (2006).
70. Lenton, E. A., Landgren, B.-M. & Sexton, L. Normal variation in the length of theluteal phase of the menstrual cycle: identification of the short luteal phase. BJOG:Int. J. Obstet. Gynaecol. 91, 685–689 (1984).
71. Lenton, E. A., Landgren, B.-M., Sexton, L. & Harper, R. Normal variation in thelength of the follicular phase of the menstrual cycle: effect of chronological age.BJOG: Int. J. Obstet. Gynaecol. 91, 681–684 (1984).
72. Pierson, E., Althoff, T. & Leskovec, J. Modeling individual cyclic variation in humanbehavior. in Proceedings of the 2018 World Wide Web Conference, WWW ’18,107–116 (International World Wide Web Conferences Steering Committee,Republic and Canton of Geneva, Switzerland, 2018).
73. Jones, E. K., Jurgenson, J. R., Katzenellenbogen, J. M. & Thompson, S. C. Meno-pause and the influence of culture: another gap for Indigenous Australianwomen? BMC Womenas Health. 12, 43 (2012).
74. Kolmogorov, A. N. Sulla determinazione empirica di una legge di distribuzione. G.dellaIstituto Italianodegli Attuari 4, 83–91 (1933).
ACKNOWLEDGEMENTSThe authors are deeply grateful to all Clue users whose deidentified data have beenused for this study.
AUTHOR CONTRIBUTIONSK.L. and I.U. contributed equally to this work. K.L., I.U., C.H.W., and N.E. conceived theproposed research and designed the experiments. K.L. and I.U. processed the dataset,conducted the experiments, and wrote the first draft of the paper. C.H.W., A.D., A.S.,V.J.V., and N.E. reviewed and edited it. All authors read and approved the paper.
COMPETING INTERESTSK.L. is supported by NSF’s Graduate Research Fellowship Program Award #1644869.I.U., C.H.W., and N.E. are supported by NSF Award #1344668. K.L., I.U., C.W., and N.E.declare that they have no competing interests. A.D., A.S., and V.J.V. were employed byClue by BioWink GmbH at the time of this research project.
ADDITIONAL INFORMATIONSupplementary information is available for this paper at https://doi.org/10.1038/s41746-020-0269-8.
Correspondence and requests for materials should be addressed to N.E.
Reprints and permission information is available at http://www.nature.com/reprints
Publisher’s note Springer Nature remains neutral with regard to jurisdictional claimsin published maps and institutional affiliations.
Open Access This article is licensed under a Creative CommonsAttribution 4.0 International License, which permits use, sharing,
adaptation, distribution and reproduction in anymedium or format, as long as you giveappropriate credit to the original author(s) and the source, provide a link to the CreativeCommons license, and indicate if changes were made. The images or other third partymaterial in this article are included in the article’s Creative Commons license, unlessindicated otherwise in a credit line to the material. If material is not included in thearticle’s Creative Commons license and your intended use is not permitted by statutoryregulation or exceeds the permitted use, you will need to obtain permission directlyfrom the copyright holder. To view a copy of this license, visit http://creativecommons.org/licenses/by/4.0/.
© The Author(s) 2020
K. Li et al.
13
Scripps Research Translational Institute npj Digital Medicine (2020) 79