charge ready and market education programs pilot report · 2020-01-24 · the charge ready and...
TRANSCRIPT

Charge Ready and Market Education Programs
Pilot ReportMay 2016 – March 2018Submitted April 2, 2018Amended July 9, 2018
Get Started
Table Of Contents
1 Executive Summary ............................................................................................................... 6
1.1 Charge Ready Pilot Program Description .......................................................................... 7
1.2 Objectives ......................................................................................................................... 7
1.3 Implementation ................................................................................................................. 7
1.4 Market Education .............................................................................................................. 8
1.5 Conclusions ....................................................................................................................... 8
2 Charge Ready Pilot ................................................................................................................. 9
2.1 Pilot Design ....................................................................................................................... 9
2.2 Pilot Operations ............................................................................................................... 14
2.3 Successes ....................................................................................................................... 15
2.4 Pilot Operations Lessons Learned and Potential Improvements .................................... 16
2.5 Contractors ...................................................................................................................... 21
2.6 Charging Stations ............................................................................................................ 22
2.7 Charging Station Operation ............................................................................................. 24
2.8 Disadvantaged Communities .......................................................................................... 31
2.9 Customer Satisfaction ..................................................................................................... 32
2.10 Charge Ready Education and Outreach ........................................................................ 33
2.11 Pilot Costs ..................................................................................................................... 35
2.12 Pilot Summary ............................................................................................................... 37
3 Market Education .................................................................................................................. 38
3.1 Overview ......................................................................................................................... 38
3.2 TE Advisory Services ....................................................................................................... 39
– 2 –
3.3 Market Education Lessons Learned and Recommendations .......................................... 40
4 Demand Response Pilot .................................................................................................... 41
4.1 Demand Response Pilot Overview ................................................................................. 41
4.2 Pricing Model Overview .................................................................................................. 41
5 Appendices .............................................................................................................................. 42
Appendix A. Pilot Customer Participants .............................................................................. 42
Appendix B. Pilot Operational Metrics .................................................................................. 45
Appendix C. Charging Stations and Rebate .......................................................................... 50
Appendix D. Outreach Events ............................................................................................... 51
Appendix E. Charge Ready Marketing Materials ................................................................... 52
Appendix F. Media Outreach and Published Articles ............................................................. 53
Appendix G. Rejected and Withdrawn Applications .............................................................. 56
– 3 –
Table Of FiguresFigure 2.1 Charge Ready Model ...............................................................................................................................................9
Figure 2.2 Charge Ports by Market Segments .......................................................................................................................14
Figure 2.3 Charge Ports by Customer Type ............................................................................................................................14
Figure 2.4 Customer Preferred Charging Station Type ...........................................................................................................22
Figure 2.5 Customer Preferred Charging Station Connector ..................................................................................................22
Figure 2.6 Charging Station Users ..........................................................................................................................................25
Figure 2.7 Site Hosts Fee Schedule .......................................................................................................................................25
Figure 2.8 Workplaces Monthly Average Usage per Port ....................................................................................................... 26
Figure 2.9 Destinations Center Monthly Average Usage per Port ..........................................................................................26
Figure 2.10 Fleets Monthly Average Usage per Port ..............................................................................................................26
Figure 2.11 MUDs Monthly Average Usage per Port .............................................................................................................27
Figure 2.12 Workplaces – Weekday Average Usage ..............................................................................................................27
Figure 2.13 Workplaces – Weekend Average Usage ..............................................................................................................27
Figure 2.14 Destination Centers - Weekday Average Usage ..................................................................................................28
Figure 2.15 Destination Centers - Weekend Average Usage .................................................................................................28
Figure 2.16 Fleets - Weekday Average Usage ........................................................................................................................29
Figure 2.17 Fleets - Weekend Average Usage .......................................................................................................................29
Figure 2.18 MUDs - Weekday Average Usage .......................................................................................................................30
Figure 2.19 MUDs - Weekend Average Usage .......................................................................................................................30
Figure 2.20 Greenhouse Gas Emissions Reductions from the Pilot .......................................................................................31
Figure 2.21 Charge Ports in DACs and Non-DACs .................................................................................................................32
Figure 2.22 Reasons for MUDs Declining to Participate in Charge Ready .............................................................................34
Figure 5.1 Withdrawn Application Reasons ............................................................................................................................56
Figure 5.2 Rejected Application Reasons ...............................................................................................................................56
Table Of TablesTable 2.1 Pilot Rebate Levels by Market Segment ...................................................................................................................9
Table 2.2 Pilot Objectives........................................................................................................................................................11
Table 2.3 Customer Engagement and Evaluation Lessons Learned and Recommendations .................................................16
Table 2.4 Application Process Lessons Learned and Recommendations ...............................................................................17
Table 2.5 Pre-Construction Lessons Learned and Recommendations ...................................................................................18
Table 2.6 Construction Lessons Learned and Recommendations ..........................................................................................20
Table 2.7 Post-Construction Lessons Learned and Recommendations..................................................................................20
– 4 –

Table 2.8 MUDs Lessons Learned and Recommendations ....................................................................................................20
Table 2.9 Charging Stations Base Cost ...................................................................................................................................22
Table 2.10 Charging Station Rebate Update ...........................................................................................................................23
Table 2.13 Average Satisfaction Score per Survey Topic ...................................................................................................... 32
Table 2.14 Summary of Feedback Received from Pilot Approved Vendors and Customer Participants ............................... 33
Table 2.11 Average Customer Cost per Port after Rebate in non-DACs ................................. ................................. ............. 23
Table 2.12 Average Customer Cost per Port after Rebate in DACs ....................................................................................... 23
Table 2.16 Average Cost per Port ...........................................................................................................................................36
Table 2.15 Pilot Costs ............................................................................................................................................................ 35
Table 3.1 Electric Vehicle Awareness Website Metrics ..........................................................................................................38
Table 3.2 Digital Campaign Metrics ........................................................................................................................................38
Table 3.3 Customer Attitude Tracking Survey Metrics ............................................................................................................39
Table 3.4 TEAS web traffic......................................................................................................................................................40
Table 5.1 Summary by Market Segment in Disadvantaged Communities .............................................................................42
Table 5.2 Summary by Market Segment in Non-Disadvantaged Communities .....................................................................42
Table 5.3 Summary by City of Installation in Disadvantaged Communities ...........................................................................43
Table 5.4 Summary by City of Installation in Non-Disadvantaged Communities ...................................................................43
Table 5.5 Summary by Zip code in Disadvantaged Communities ..........................................................................................44
Table 5.6 Summary by Zip code in Non-Disadvantaged Communities ..................................................................................44
Table 5.7 Multi-Unit Dwelling Summary by City of Installation ...............................................................................................45
Table 5.8 Pilot Cycle Times .....................................................................................................................................................45
Table 5.9 Pilot Applications .....................................................................................................................................................46
Table 5.10 Customer Participant Request...............................................................................................................................48
Table 5.11 Average EVSE Procurement Period .......................................................................................................................49
Table 5.12 Charging Station Procurement Submission Issues ...............................................................................................49
Table 5.13 Number of Approved Charging System Models....................................................................................................50
Table 5.14 EVSE Model Summary ..........................................................................................................................................50
Table 5.15 Charging Station Request and Rebate...................................................................................................................50
Table 5.16 Outreach Events ....................................................................................................................................................51
Table 5.17 Charge Ready Marketing Materials .......................................................................................................................52
– 5 –
1 DACs were identified using the California Environmental Protection Agency’s (CalEPA) California Communities Environmental Health Screening Tool (CalEnviroScreen 2.0).2 Executive Order B-48-18.3 California Air Resources Board, “California’s Advanced Clean Cars Midterm Review”, January 2017, p. B64, B84-B86, available at https://www.arb.ca.gov/msprog/acc/mtr/
acc_mtr_finalreport_full.pdf4 See “California Transportation Electrification Assessment; Phase 1: Final Report,” prepared by ICG International and E3, September 2014, Section 5.2, pp. 46-50, available at
http://www.caletc.com/wp-content/uploads/2016/08/CalETC_TEA_Phase_1-FINAL_Updated_092014.pdf [as of October 27, 2014]. Installing charging stations at businesses involves many more factors than home charging, and also includes a more expensive setup. Commercial Level 2 charging station installation costs are an average of $2,500, compared with residential Level 2 costs of $1,300 and residential Level 1 costs of only $200. See “Electric Vehicle Supply Equipment Installed Cost Analysis: 2013 Technical Report,” Electric Power Research Institute (EPRI), December 6, 2013, pp. 18, 33, abstract available at http://www.epri.com/abstracts/Pages/ProductAbstract. aspx?ProductId=000000003002000577 [as of October 27, 2014]. As with businesses, charging station installation cost at multi-unit dwellings far exceeds that of single-family residences. Id., pp. 3-5, 3-6.
5 National Renewable Energy Laboratory, “Consumer Views on Plug-in Electric Vehicles – National Benchmark Report”, January 2017, p. 11, available at https://www.afdc.energy.gov/uploads/publication/consumer_views_pev_benchmark.pdf
6 International Council on Clean Transportation, “Literature review of electric vehicle consumer awareness and outreach activities”, March 2017, p. 2, available at https://www.theicct.org/sites/default/files/publications/Consumer-EV-Awareness_ICCT_Working-Paper_23032017_vF.pdf
7 CEC has funded less than $5 million in consumer education on EVs since 2009 with Alternative and Renewable Fuel and Vehicle Technology Program (ARFVTP) funds, out of more than $400 million between 2009 and 2013. See California Energy Commission, DRIVE: California’s Alternative & Renewable Fuel & Vehicle Technology Program, Reports, as of June 30, 2013, available at http://www.energy.ca.gov/drive/investing/reports.html [as of October 27, 2014].
1 Executive Summary
The Charge Ready and Market Education programs were
developed to support California’s policies to reduce greenhouse
gas (GHG) and air pollutant emissions and to help meet the state’s
zero-emission vehicle (ZEV) goals. The Charge Ready program
deploys electric infrastructure to support light-duty electric vehicle
(EV) charging at customer sites throughout Southern California
Edison’s (SCE’s) service area. At the time of this report, SCE
has deployed infrastructure to support 941 charge ports at 60
customer sites, including 462 charge ports (50%) at 36 sites
located in Disadvantaged Communities (DACs),1 significantly
exceeding the Pilot’s goal of placing 10% of charge ports in
DACs. Additionally, the Pilot exceeded SCE’s Diversified Business
Enterprise 40% spending goal. The architecture and engineering
firm and the general contractors selected for Charge Ready were
all Diversified Business Enterprises (DBEs).
The Market Education program targets car buyers to help them gain
awareness of EVs and the benefits of fueling from the grid. The
Market Education program also includes SCE’s advisory services,
providing education and support related to electrifying fleets,
EV charging, reducing GHG footprints, and other transportation
electrification (TE) areas for business customers. Each program
was designed in two phases, with a smaller-scope Phase 1 Pilot
to prepare for a broader Phase 2. This report covers Phase 1 of
each program, and demonstrates that the Pilots have achieved
their objectives. Based on successfully meeting its objectives for
the Pilot, SCE will request California Public Utilities Commission
(CPUC) approval of the second phase of these programs. Moving
forward with the broader Phase 2 is particularly important in light
of the adoption by California Governor Brown of a target of 5
million EVs by 20302.
The Charge Ready and Market Education programs support
California’s GHG- and air-pollution-reduction goals by addressing
the following issues resulting from insufficient EV infrastructure,
especially in certain market segments.
• Range anxiety continues to be a key roadblock to
expediting EV adoption. Access to charging at both home
and work is a top priority for EV drivers with workplace
charging serving a dual-role: 1) to advance adoption
through consumer assurance on available away-from-
home charging locations, and 2) to increase electric
vehicle miles traveled.3 SCE’s Pilot helps to accelerate EV
adoption by meeting a large portion of charging needs at
long-dwell-time locations.
• The cost and complexity of deploying charging
infrastructure at premises other than single-family homes
is another major barrier to EV adoption.4 For example,
while customers with parking facilities may understand
the benefits of offering EV charging to their tenants,
they may not envision an obvious return on investment.
Property owners and managers who provide parking may
not have the time or motivation to gain an understanding
of a new, complex, and potentially confusing market.
• Developing driver awareness of EVs and their benefits
is one of the most important factors for increasing EV
adoption and significantly growing the market. Not
understanding EV benefits (individual, societal, and
environmental) or the differences between internal
combustion vehicles, battery EVs (BEVs) and plug-in
hybrid EVs (PHEVs) significantly hinders EV adoption5,6.
Federal, state, and local governments may attempt to
address this issue, but only a small amount of public
funding is designated to raising consumer awareness.7
We, SCE, as a utility, together with other stakeholders,
is uniquely equipped to meet the need for greater
market education focused on the needs and interests of
| 6Charge Ready Phase 1 Program Pilot Report
8 California Public Utility Commission, Zero-Emission Vehicles Fast Facts, available at http://www.cpuc.ca.gov/zev/9 An EVSE may typically include one, two, or four charge ports, with varying costs and demand (kW), SCE uses charge port (rather than EVSE) as the preferred unit to provide
detailed reporting about Charge Ready. 10 Testimony In Support Of Southern California Edison Company’s Charge Ready Application, Vol. 02 – Phase 1 Charge Ready And Market Education Pilot, p. 3. 11 Post-deployment impacts will be evaluated by SCE using meter interval and EVSE networking data. In addition, customer outreach and recurring surveys to Charge
customers and drivers within the SCE service territory
with a population of 15 million people.
• DACs face additional socioeconomic barriers as well as
a concentrated amount of air pollution, mostly caused by
petroleum-powered vehicles.8 Education and outreach will
help familiarize customers with available EV incentives
and rebates that make EVs more affordable, including
special state incentives available to residents of DACs.
Providing EV charging infrastructure plus education and
outreach in these communities will help increase EV
adoption and reduce harmful emissions.
1.1 Charge Ready Pilot Program Description
Charge Ready was developed to reduce barriers to EV adoption
by deploying electric infrastructure to support installation of EV
charging stations (EV supply equipment, or EVSE)9 at locations
where EVs are usually parked for at least four hours (i.e. long
dwell-time locations). These locations provide adequate time for
most EV drivers to fully recharge their vehicles with Level 1 and
Level 2 charging stations.
The Pilot was open to non-residential customers in the following
long dwell-time location market segments:
• Workplaces
• Multi-Unit Dwellings (MUDs), such as apartment buildings
• Fleets
• Destination centers, such as sports arenas or malls
Through Charge Ready, SCE installed and paid all costs for make-
ready stubs serving EVSE, and will continue to own and maintain
that infrastructure, including:
• Electric distribution infrastructure, such as transformers,
service lines, and meters dedicated to EV charging
equipment deployed under the program.
• Customer-side infrastructure, such as panels, step-down
transformers, wiring and conduits, and stub outs, to allow
for EVSE installations.
Participating customers were responsible for procuring, installing,
and maintaining qualified EVSEs, including electrical energy and
networking costs, but received rebates to reduce the EVSE and
installation costs.
To efficiently execute the Pilot and inform stakeholders of
progress achieved, SCE established an Advisory Board open to
participation by industry stakeholders, and representatives of
disadvantaged communities (DACs). The board provided useful
input and guidance to SCE during the Pilot implementation and
execution.
1.2 Objectives
The objectives of the Charge Ready Phase 1 Pilot were to inform
and refine the design and cost estimates of the program, and
to develop success measures for Phase 2.10 Charge Ready
objectives included evaluating:
• Processes, including: 1) qualifying charging stations
(for example, availability of Level 2 charging stations with
load management and demand response (DR) capabilities);
2) procuring deployment-related services (such as sourcing
qualified electrical contractors); and 3) validate and refine
the Charge Ready Phase 1 filing assumptions about time
and costs to deploy EV charging infrastructure at
participating customer sites.
• Post-deployment impacts, including analyzing load from
the various market segments served by the Pilot and their
installed charging stations.11
As this report demonstrates, the Pilot successfully achieved its
objectives in accordance with the key guiding principles12 that
drove its implementation and execution.
1.3 Implementation
SCE launched the Charge Ready Pilot in May of 2016. The Pilot
immediately generated significant interest, with 190 applications
received within the first month. SCE stopped accepting new
applications in January 2017 as all program funding was reserved
for approved sites at that time.
Participating customers were able to select EVSE from different
approved models. At the time of this report, there are 61 approved
models offered by twelve SCE-qualified vendors, demonstrating
SCE’s commitment to offering a broad range of charging
equipment options to participating customers.
Charge Ready Pilot Program Description | 7
Ready customers will be used to identify parameters to effectively service current customers. 12 See Section 2.2.2 of this report.
Charge Ready Phase 1 Program Pilot Report
13 Sce.com/TE 14 Overall satisfaction of participating customers surveyed by SCE averaged 9.2 out of 10, with 100% of customers rating the program between 8 and 10.
SCE completed its first deployment in February 2017, in the City
of Lynwood. It included six charge ports to support the City’s new
EV fleet.
As of the date of this report, SCE has deployed infrastructure
to support 941 charge ports at 60 customer sites, including 462
charge ports (50%) at 36 sites located in DACs, significantly
exceeding the Pilot’s goal of placing 10% of charge ports in
DACs. On March 9, 2018, SCE released unused funds reserved
.snoitacilppa wen ot toliP eht denepo-er dna setis detelpmoc rof
SCE expects to add approximately 175 additional ports with the
recently released funding.
1.4 Market Education
SCE developed a Market Education campaign to generate
awareness about EVs and the benefits of fueling from the grid,
delivered to a broad audience of potential car buyers through
a variety of complementary channels, including paid media
(for example, radio) and direct messaging (such as email). SCE
developed specific efforts to target customers residing in DACs,
including outreach events. With limited funding, SCE’s Market
Education campaign successfully achieved a 15% recall
More information can be found in Section 3 Market Education.
rate.
SCE also launched new TE Advisory Services13 online content in
September 2017 to assist business customers in considering and
planning for TE deployment through self-service online tools (for
example, Charge Port Estimator), fact sheets (on topics such as
managed charging through
SCE has been sharing these new TE tools and content with
customers via one-on-one interactions, as well as promoting
the tools in larger community and industry forums. For example,
when discussing a customer’s desire to install charging stations
at its site, the Charge Port Estimator tool can be used to provide
a helpful estimate of the number of charge ports the customer
may need. Based on this conversation, the customer may submit
an application to the Charge Ready Program, or the conversation
may simply serve as a helpful reference point for customers
who may want to install stations on their own if they
do not meet the requirements of the program. Since the launch
of updated web pages with content specific to Workplace
Charging, Public Charging, Fleet, and MUDs, we have seen a
significant increase in unique site visitors with a total count of
620 unique visitors for all four market segments’ web pages
(a nearly 300% increase in Q4 2017 over Q3 2017) and page
views (a nearly 200% increase in Q4 2017 over Q3 2017).
vehicle-grid integration).
1.5 Conclusions
Phase 1 of the Charge Ready program successfully achieved
Additionally, as part of TE Advisory Services, SCE launched
in-person services in January 2018. More information can be
found in Section 3.2 TE Advisory Services.
its objectives. With infrastructure to support 941 charge ports
deployed thus far, the Pilot allowed SCE to develop and improve
processes to qualify a broad range of charging stations with DR
capabilities from multiple vendors. It also provided real-life data
about the time and costs to deploy EV charging infrastructure at
participating customer sites, and helped SCE refine some of the
assumptions included in its initial plans.
In addition, the Pilot confirmed customer interest in a program
to deploy utility-owned infrastructure on the customer side
of the meter to serve customer-owned charging equipment
while maintaining market and technology neutrality, with high
satisfaction expressed by participating customers.14
Phase 1 of the Market Education program demonstrated the
need for greater public education about EVs and the benefits of
fueling from the grid. The initial response to TE Advisory Services
also confirmed a business customer interest for more technical
assistance from a trusted energy advisor to help navigate the
complexities of adopting and deploying TE technologies.
SCE plans to file an application in the second quarter of 2018 to
seek approval of Phase 2, with changes based on the lessons
learned documented in this report.
Market Education | 8Charge Ready Phase 1 Program Pilot Report
15 Charge Ready rebates, combined with other rebates or programs, cannot cover more than 100% of the charging station costs. 16 Includes customer-side and utility-side infrastructure. 17 DACs were identified using the California Environmental Protection Agency’s (CalEPA) California Communities Environmental Health Screening Tool (CalEnviroScreen 2.0). 18 SCE defined the base cost as “The amount representing the best value for a Charging Station and its installation, as determined by SCE through primary or secondary
market research.” (Schedule CRPP). The base cost was determined by conducting an analysis for each of the charging station level categories using pricing information submitted by approved Charge Ready vendors. SCE evaluated several combinations to develop a fair comparison among single- and multiple- connector EVSEs. SCE determined a price per port for each of the qualified models and configurations, and used the lowest price per port within each EVSE category, to determine the base costs.
2 Charge Ready Pilot
2.1 Pilot Design
The Charge Ready program was designed to offer customers a
key solution for the electrical infrastructure necessary to support
EV charging. To remove barriers to deploying EV charging, as part
of the Pilot, SCE constructed the electric infrastructure needed to
serve EVSE at participating customer locations, and will continue
to own and maintain that infrastructure. The Pilot also offered
customer participants a rebate to reduce the cost of acquiring
and installing qualified EVSE. The rebates were calculated as a
percentage of the EVSE base cost, as shown in the table below:
Table 2.1 Pilot Rebate Levels by Market Segment
Market Segment Rebate (% Base Cost)15
All segments in DACs 100%
MUDs 50%
All other segments (workplaces, fleets, and destination centers)
25%
Customer participants must procure, operate, and maintain the
charging stations in accordance with the terms and conditions of
the Pilot.
Customer participants established their own policies about
charging station use (for example, access to charging stations
and financial contributions from EV drivers). However, customers
with Level 2 charging stations must participate in a Charge Ready
DR Pilot.
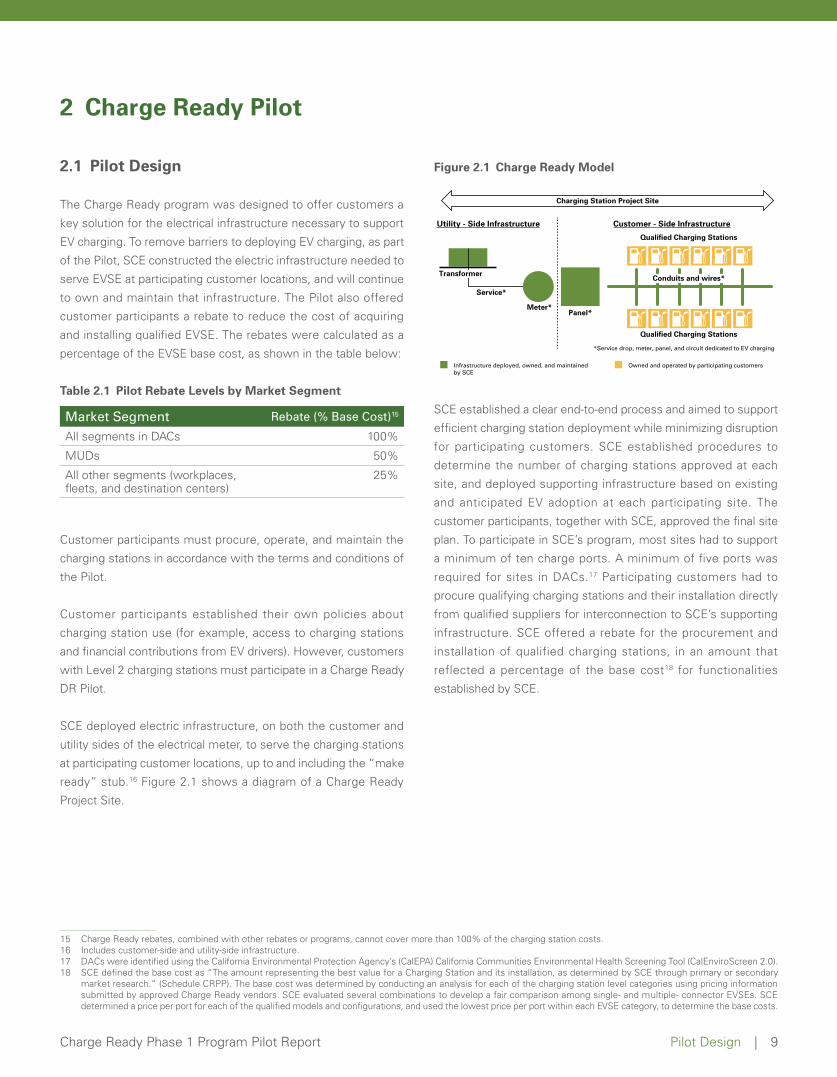
SCE deployed electric infrastructure, on both the customer and
utility sides of the electrical meter, to serve the charging stations
at participating customer locations, up to and including the “make
ready” stub.16 Figure 2.1 shows a diagram of a Charge Ready
Project Site.
Figure 2.1 Charge Ready Model
SCE established a clear end-to-end process and aimed to support
efficient charging station deployment while minimizing disruption
for participating customers. SCE established procedures to
determine the number of charging stations approved at each
site, and deployed supporting infrastructure based on existing
and anticipated EV adoption at each participating site. The
customer participants, together with SCE, approved the final site
plan. To participate in SCE’s program, most sites had to support
a minimum of ten charge ports. A minimum of five ports was
required for sites in DACs.17 Participating customers had to
procure qualifying charging stations and their installation directly
from qualified suppliers for interconnection to SCE’s supporting
infrastructure. SCE offered a rebate for the procurement and
installation of qualified charging stations, in an amount that
reflected a percentage of the base cost18 for functionalities
established by SCE.
Charging Station Project Site
Utility - Side Infrastructure
Transformer
Qualified Charging Stations
Qualified Charging Stations
Panel*
Service*
Meter*
Infrastructure deployed, owned, and maintained by SCE
Customer - Side Infrastructure
Owned and operated by participating customers
*Service drop, meter, panel, and circuit dedicated to EV charging
Conduits and wires*
Pilot Design | 9Charge Ready Phase 1 Program Pilot Report
2.1.1 Customer and Site Eligibility
The program was open to SCE customers who met the
following criteria:
Customer Eligibility
• Qualified as non-residential customers (business,
government)
• Met the program’s guidelines for EV adoption
• Owned, leased, or operated a long-dwell-time parking site
(4+ hours)
• Provided a grant of easement from the property owner
• Delivered proof of purchase of qualified charging
equipment
Site Approval
• Granted by SCE on a first-come, first-served basis that
meet Pilot cost thresholds
• Required agreement from customers on the number of
charging stations and their site locations (as proposed
by SCE)
• Required a minimum of ten charging stations (reduced
to five in DACs) in up to 4% of parking spaces (unless
existing adoption demonstrated higher demand)
In addition, program participants were required to own and operate
qualified charging stations for at least 10 years, pay for operating
costs (such as energy, maintenance, repairs, and the EV network),
and also provide non-Personally Identifiable Information (PII).
Customers with Level 2 charging stations must also participate in
a Charge Ready DR Pilot and any future DR program.
SCE focused its efforts on DACs, which are disproportionately
affected by low EV adoption and the negative environmental
impacts of gasoline- and diesel-powered vehicles. SCE managed
the Pilot to ensure a minimum of 10% of all charge port
installations were deployed in DACs. By March 2018, out of
the 1,066 charge ports funded through the program, 50% are
located in DACs. Out of the 43 sites in DACs, 27 sites have
less than 10 ports per site. On average, there were 12 ports
per site in DACs.19 Appendix A shows the breakdown by market
segment in DACs and non-DACs of sites with reserved funding
as of March 2018.
Pilot Design | 10Charge Ready Phase 1 Program Pilot Report
19 In comparison, non-DAC sites have an average of 20 ports per site.
20 D.16-01-023, p. 7. 21 Executive Order B-48-18 established a goal to put 5 million ZEVs in California by 2030. 22 Executive Order B-48-18 established a goal to install 250,000 vehicle charging stations in California by 2025.
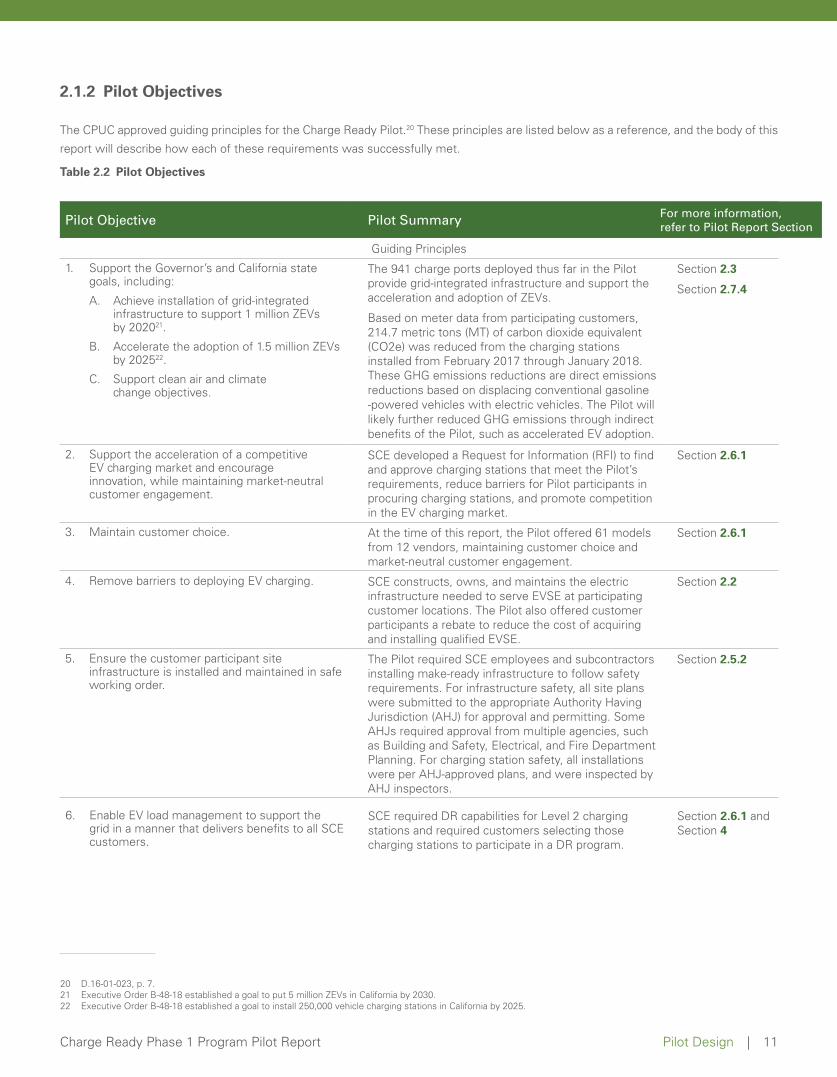
2.1.2 Pilot Objectives
The CPUC approved guiding principles for the Charge Ready Pilot.20 These principles are listed below as a reference, and the body of this
report will describe how each of these requirements was successfully met.
Table 2.2 Pilot Objectives
Pilot Objective Pilot Summary For more information,refer to Pilot Report Section
Guiding Principles
1. Support the Governor’s and California stategoals, including:
A. Achieve installation of grid-integratedinfrastructure to support 1 million ZEVsby 202021.
B. Accelerate the adoption of 1.5 million ZEVsby 202522.
C. Support clean air and climatechange objectives.
The 941 charge ports deployed thus far in the Pilot provide grid-integrated infrastructure and support the acceleration and adoption of ZEVs.
Based on meter data from participating customers, 214.7 metric tons (MT) of carbon dioxide equivalent (CO2e) was reduced from the charging stations installed from February 2017 through January 2018. These GHG emissions reductions are direct emissions reductions based on displacing conventional gasoline-powered vehicles with electric vehicles. The Pilot willlikely further reduced GHG emissions through indirectbenefits of the Pilot, such as accelerated EV adoption.
Section 2.3
Section 2.7.4
2. Support the acceleration of a competitiveEV charging market and encourageinnovation, while maintaining market-neutralcustomer engagement.
SCE developed a Request for Information (RFI) to find and approve charging stations that meet the Pilot’s requirements, reduce barriers for Pilot participants in procuring charging stations, and promote competition in the EV charging market.
Section 2.6.1
3. Maintain customer choice. At the time of this report, the Pilot offered 61 models from 12 vendors, maintaining customer choice and market-neutral customer engagement.
Section 2.6.1
4. Remove barriers to deploying EV charging. SCE constructs, owns, and maintains the electric infrastructure needed to serve EVSE at participating customer locations. The Pilot also offered customer participants a rebate to reduce the cost of acquiring and installing qualified EVSE.
Section 2.2
5. Ensure the customer participant siteinfrastructure is installed and maintained in safeworking order.
The Pilot required SCE employees and subcontractors installing make-ready infrastructure to follow safety requirements. For infrastructure safety, all site plans were submitted to the appropriate Authority Having Jurisdiction (AHJ) for approval and permitting. Some AHJs required approval from multiple agencies, such as Building and Safety, Electrical, and Fire Department Planning. For charging station safety, all installations were per AHJ-approved plans, and were inspected by AHJ inspectors.
Section 2.5.2
6. Enable EV load management to support thegrid in a manner that delivers benefits to all SCEcustomers.
SCE required DR capabilities for Level 2 charging stations and required customers selecting those charging stations to participate in a DR program.
Section 2.6.1 and Section 4
Pilot Design | 11Charge Ready Phase 1 Program Pilot Report
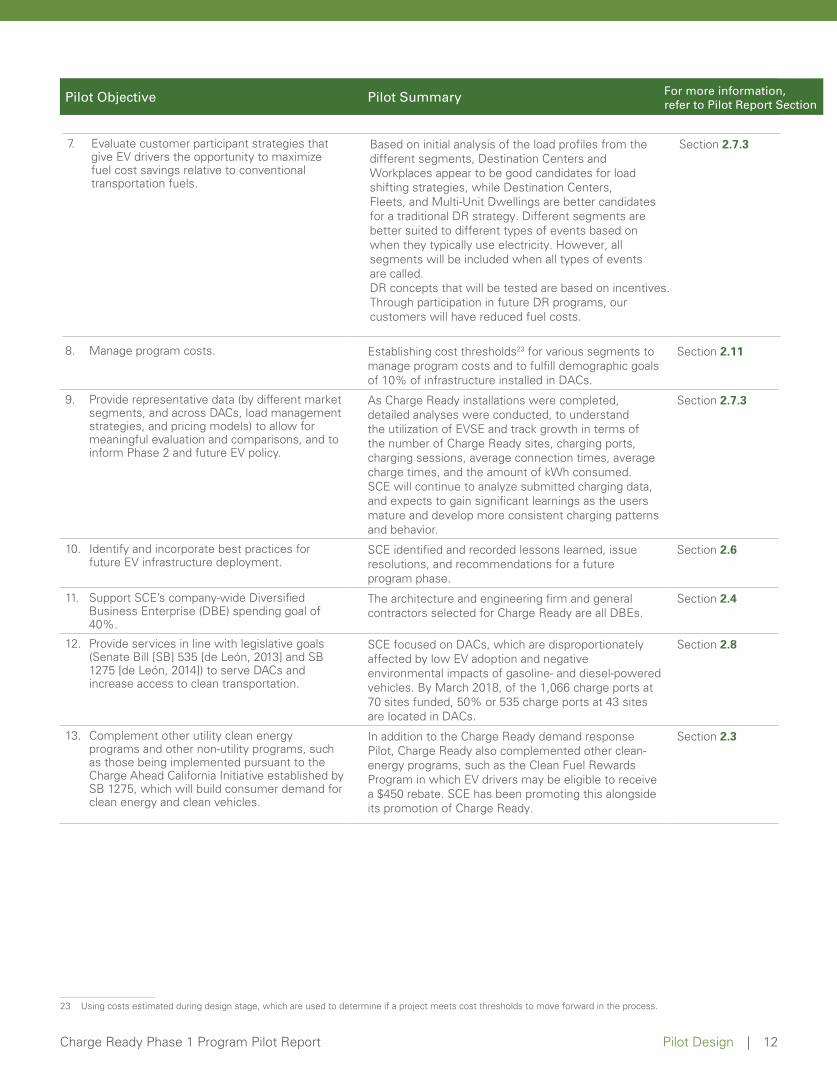
7. Evaluate customer participant strategies thatgive EV drivers the opportunity to maximizefuel cost savings relative to conventionaltransportation fuels.
Based on initial analysis of the load profiles from the different segments, Destination Centers and Workplaces appear to be good candidates for load shifting strategies, while Destination Centers, Fleets, and Multi-Unit Dwellings are better candidates for a traditional DR strategy. Different segments are better suited to different types of events based on when they typically use electricity. However, all segments will be included when all types of events are called.DR concepts that will be tested are based on incentives. Through participation in future DR programs, our customers will have reduced fuel costs.
Section 2.7.3
23 Using costs estimated during design stage, which are used to determine if a project meets cost thresholds to move forward in the process.
Pilot Objective Pilot Summary
8. Manage program costs. Establishing cost thresholds23 for various segments to manage program costs and to fulfill demographic goals of 10% of infrastructure installed in DACs.
Section 2.11
9. Provide representative data (by different marketsegments, and across DACs, load managementstrategies, and pricing models) to allow formeaningful evaluation and comparisons, and toinform Phase 2 and future EV policy.
As Charge Ready installations were completed, detailed analyses were conducted, to understand the utilization of EVSE and track growth in terms of the number of Charge Ready sites, charging ports, charging sessions, average connection times, average charge times, and the amount of kWh consumed. SCE will continue to analyze submitted charging data, and expects to gain significant learnings as the users mature and develop more consistent charging patterns and behavior.
Section 2.7.3
10. Identify and incorporate best practices forfuture EV infrastructure deployment.
SCE identified and recorded lessons learned, issue resolutions, and recommendations for a future program phase.
Section 2.6
11. Support SCE’s company-wide DiversifiedBusiness Enterprise (DBE) spending goal of40%.
The architecture and engineering firm and general contractors selected for Charge Ready are all DBEs.
Section 2.4
12. Provide services in line with legislative goals(Senate Bill [SB] 535 [de León, 2013] and SB1275 [de León, 2014]) to serve DACs andincrease access to clean transportation.
SCE focused on DACs, which are disproportionately affected by low EV adoption and negative environmental impacts of gasoline- and diesel-powered vehicles. By March 2018, of the 1,066 charge ports at 70 sites funded, 50% or 535 charge ports at 43 sites are located in DACs.
Section 2.8
13. Complement other utility clean energyprograms and other non-utility programs, suchas those being implemented pursuant to theCharge Ahead California Initiative established bySB 1275, which will build consumer demand forclean energy and clean vehicles.
In addition to the Charge Ready demand response Pilot, Charge Ready also complemented other clean-energy programs, such as the Clean Fuel Rewards Program in which EV drivers may be eligible to receive a $450 rebate. SCE has been promoting this alongside its promotion of Charge Ready.
Section 2.3
Pilot Design | 12Charge Ready Phase 1 Program Pilot Report
For more information,refer to Pilot Report Section
24 Application 14-10-014, Motion for Approval of Settlement Agreement, p. A-1.25 SCE meter data aggregates energy load and does not show session data, charging duration, or connection times per port. Vendor-submitted data does show session
data, for example, but is currently unreliable for reasons such as missing data due to charging station or network issues and in some cases did not match SCE meter data.
27 Shared with permission from customer26 Based on customer-submitted final invoices.
participant. 28 Based on EPRI data, the sales of EVs in year 2017 was 30 percent higher than EV sales in year 2016 in SCE territory. Additionally, the share of
EV-sales-to-total-vehicle-sales increased from 3 percent in year 2016 to 4 percent in year 2017 in SCE territory. SCE has not determined exact attribution Charge Ready pilot to additional EV sales.
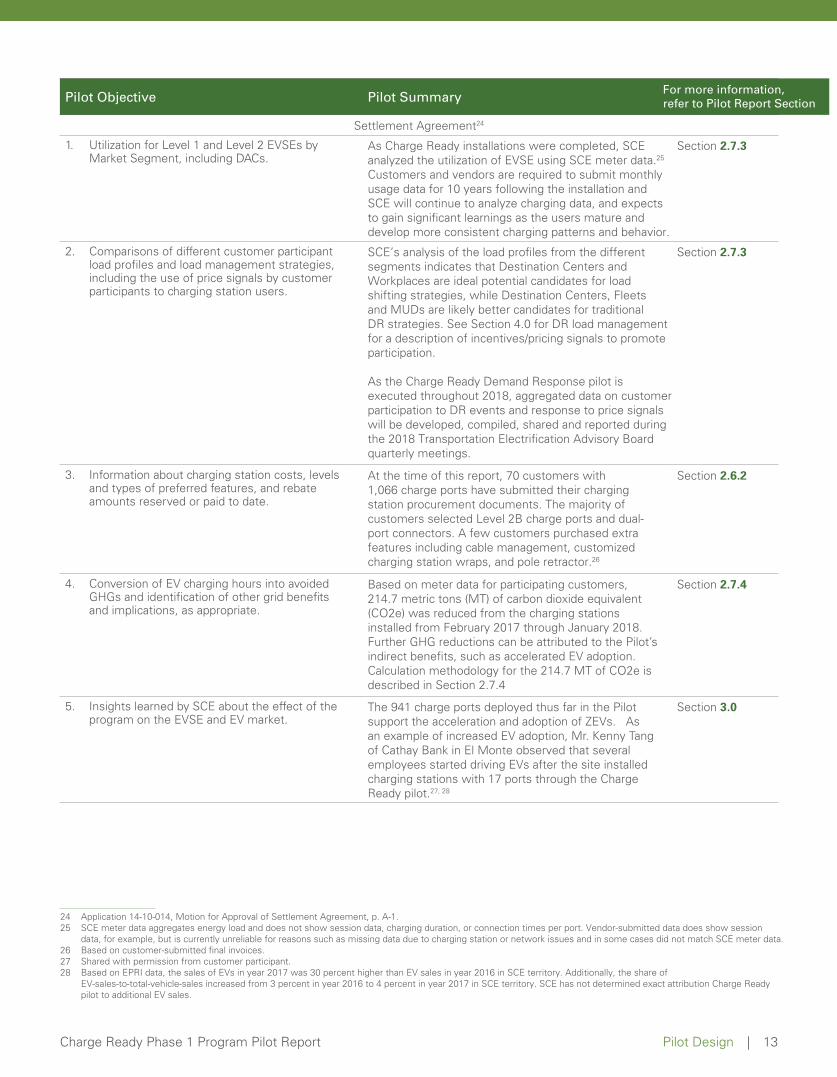
Pilot Objective Pilot Summary
Settlement Agreement24
1. Utilization for Level 1 and Level 2 EVSEs byMarket Segment, including DACs.
As Charge Ready installations were completed, SCE analyzed the utilization of EVSE using SCE meter data.25 Customers and vendors are required to submit monthly usage data for 10 years following the installation and SCE will continue to analyze charging data, and expects to gain significant learnings as the users mature and develop more consistent charging patterns and behavior.
Section 2.7.3
2. Comparisons of different customer participantload profiles and load management strategies,including the use of price signals by customerparticipants to charging station users.
SCE’s analysis of the load profiles from the different segments indicates that Destination Centers and Workplaces are ideal potential candidates for load shifting strategies, while Destination Centers, Fleets and MUDs are likely better candidates for traditional DR strategies. See Section 4.0 for DR load management for a description of incentives/pricing signals to promote participation.
As the Charge Ready Demand Response pilot is executed throughout 2018, aggregated data on customer participation to DR events and response to price signals will be developed, compiled, shared and reported during the 2018 Transportation Electrification Advisory Board quarterly meetings.
Section 2.7.3
3. Information about charging station costs, levelsand types of preferred features, and rebateamounts reserved or paid to date.
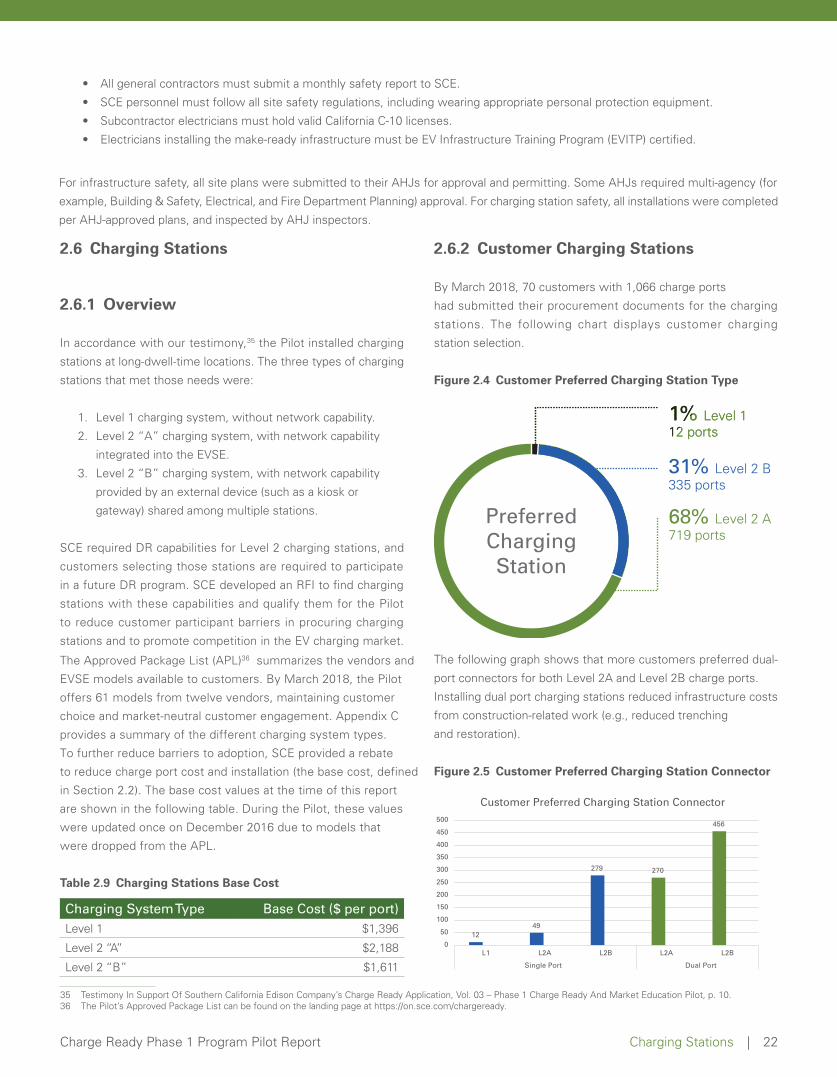
At the time of this report, 70 customers with 1,066 charge ports have submitted their charging station procurement documents. The majority of customers selected Level 2B charge ports and dual-port connectors. A few customers purchased extra features including cable management, customized charging station wraps, and pole retractor.26
Section 2.6.2
4. Conversion of EV charging hours into avoidedGHGs and identification of other grid benefitsand implications, as appropriate.
Based on meter data for participating customers, 214.7 metric tons (MT) of carbon dioxide equivalent (CO2e) was reduced from the charging stations installed from February 2017 through January 2018. Further GHG reductions can be attributed to the Pilot’s indirect benefits, such as accelerated EV adoption. Calculation methodology for the 214.7 MT of CO2e is described in Section 2.7.4
Section 2.7.4
5. Insights learned by SCE about the effect of theprogram on the EVSE and EV market.
The 941 charge ports deployed thus far in the Pilot support the acceleration and adoption of ZEVs. As an example of increased EV adoption, Mr. Kenny Tang of Cathay Bank in El Monte observed that several employees started driving EVs after the site installed charging stations with 17 ports through the Charge Ready pilot.27, 28
Section 3.0
Pilot Design | 13Charge Ready Phase 1 Program Pilot Report
For more information,refer to Pilot Report Section
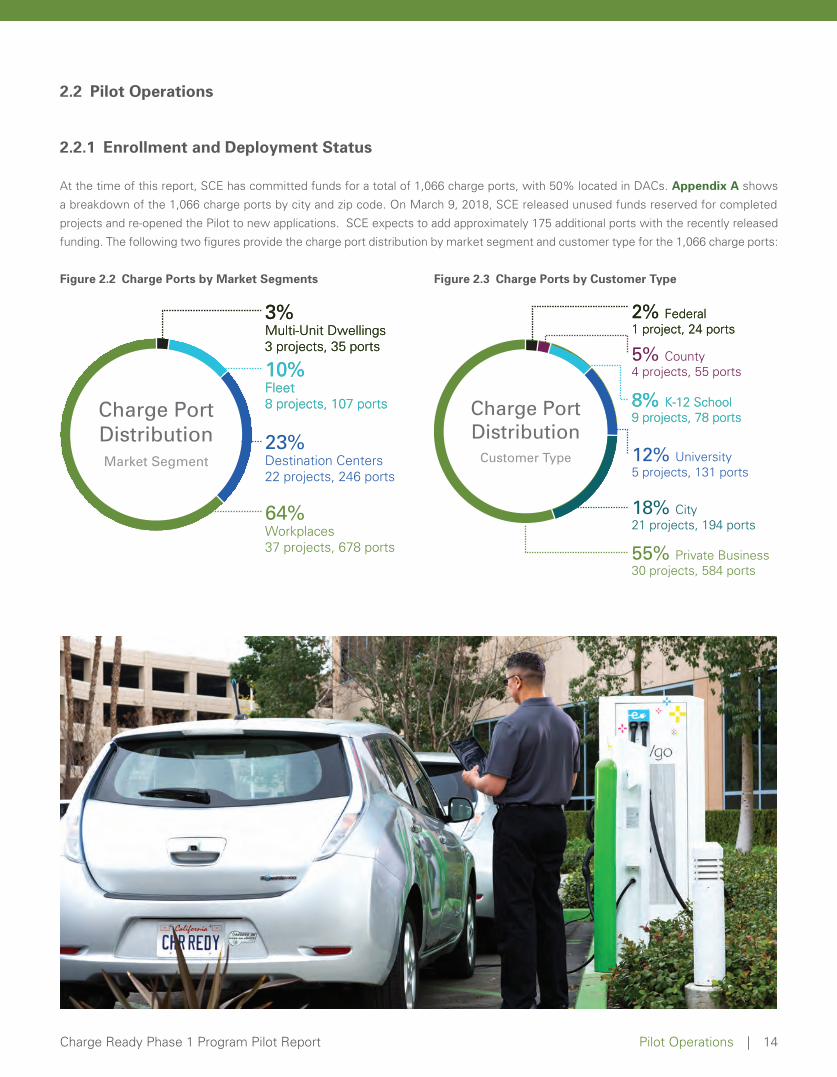
2.2 Pilot Operations
2.2.1 Enrollment and Deployment Status
At the time of this report, SCE has committed funds for a total of 1,066 charge ports, with 50% located in DACs. Appendix A shows
a breakdown of the 1,066 charge ports by city and zip code. On March 9, 2018, SCE released unused funds reserved for completed
projects and re-opened the Pilot to new applications. SCE expects to add approximately 175 additional ports with the recently released
funding. The following two figures provide the charge port distribution by market segment and customer type for the 1,066 charge ports:
Figure 2.2 Charge Ports by Market Segments Figure 2.3 Charge Ports by Customer Type
Charge Port DistributionMarket Segment
23%Destination Centers22 projects, 246 ports
64%Workplaces37 projects, 678 ports
3%Multi-Unit Dwellings3 projects, 35 ports
3%Multi-Unit Dwellings3 projects, 35 ports
3%Multi-Unit Dwellings3 projects, 35 ports
10%Fleet8 projects, 107 ports
10%Fleet8 projects, 107 ports
2% Federal1 project, 24 ports2% Federal1 project, 24 ports2% Federal1 project, 24 ports
12% University5 projects, 131 ports
55% Private Business30 projects, 584 ports
8% K-12 School9 projects, 78 ports8% K-12 School9 projects, 78 ports
18% City21 projects, 194 ports
5% County4 projects, 55 ports
Charge Port Distribution
Customer Type
Pilot Operations | 14Charge Ready Phase 1 Program Pilot Report
29 Charging stations were procured by customers only after the Step 2 Agreement was signed and SCE reserved funding. 30 The Step 3 procurement and preliminary site design period began once customers executed their Step 2 agreements and funds were reserved for the customers’
applications. This period allowed 30 calendar days from fund reservation, and customers were provided an additional 15 days if they submitted extension requests. SCE also offered, at its discretion, additional extensions if the customers were actively procuring charging stations. Customers who did not meet these timelines were subject to being placed onto a waitlist. SCE Account Managers encouraged customers to begin this process early to comply with the Pilot’s timelines.
31 Division of State Architect provides design and construction oversight for K–12 schools, community colleges, and various other state-owned and leased facilities. See http://www.dgs.ca.gov/dsa/home.aspx
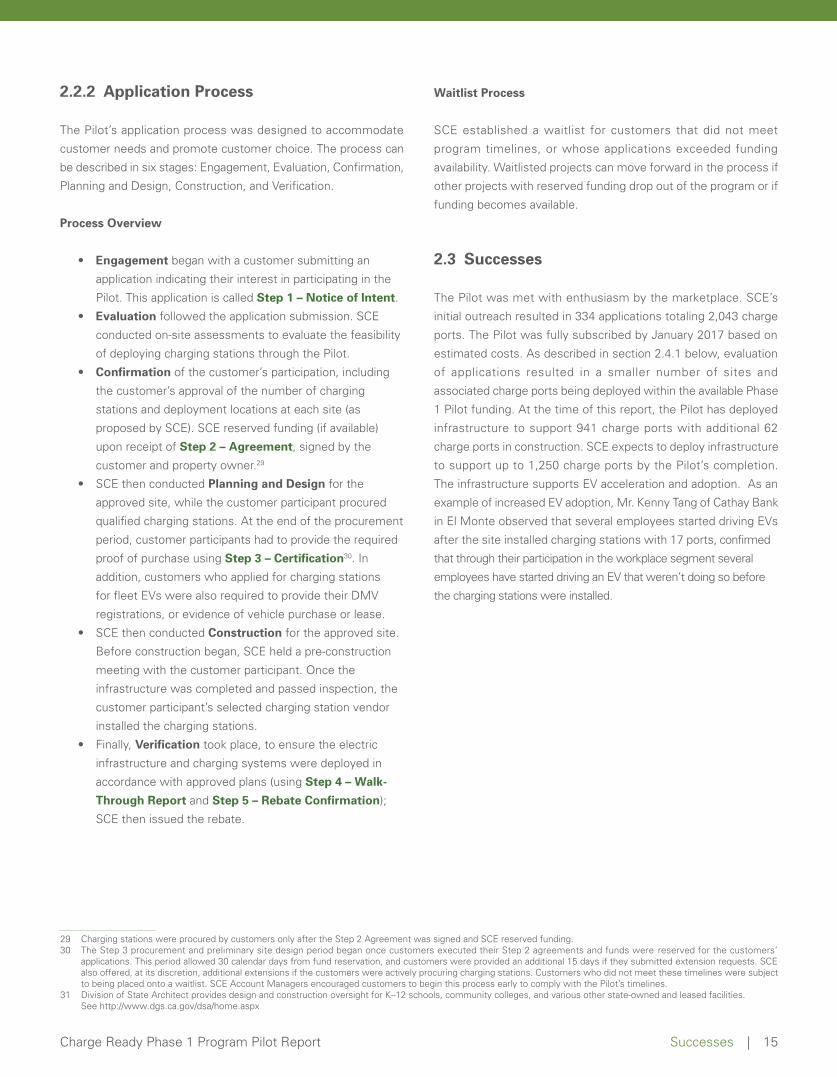
2.2.2 Application Process
The Pilot’s application process was designed to accommodate
customer needs and promote customer choice. The process can
be described in six stages: Engagement, Evaluation, Confirmation,
Planning and Design, Construction, and Verification.
Process Overview
• Engagement began with a customer submitting an
application indicating their interest in participating in the
Pilot. This application is called Step 1 – Notice of Intent.
• Evaluation followed the application submission. SCE
conducted on-site assessments to evaluate the feasibility
of deploying charging stations through the Pilot.
• Confirmation of the customer’s participation, including
the customer’s approval of the number of charging
stations and deployment locations at each site (as
proposed by SCE). SCE reserved funding (if available)
upon receipt of Step 2 – Agreement, signed by the
customer and property owner.29
• SCE then conducted Planning and Design for the
approved site, while the customer participant procured
qualified charging stations. At the end of the procurement
period, customer participants had to provide the required
proof of purchase using Step 3 – Certification30. In
addition, customers who applied for charging stations
for fleet EVs were also required to provide their DMV
registrations, or evidence of vehicle purchase or lease.
• SCE then conducted Construction for the approved site.
Before construction began, SCE held a pre-construction
meeting with the customer participant. Once the
infrastructure was completed and passed inspection, the
customer participant’s selected charging station vendor
installed the charging stations.
• Finally, Verification took place, to ensure the electric
infrastructure and charging systems were deployed in
accordance with approved plans (using Step 4 – Walk-
Through Report and Step 5 – Rebate Confirmation);
SCE then issued the rebate.
Waitlist Process
SCE established a waitlist for customers that did not meet
program timelines, or whose applications exceeded funding
availability. Waitlisted projects can move forward in the process if
other projects with reserved funding drop out of the program or if
funding becomes available.
2.3 Successes
The Pilot was met with enthusiasm by the marketplace. SCE’s
initial outreach resulted in 334 applications totaling 2,043 charge
ports. The Pilot was fully subscribed by January 2017 based on
estimated costs. As described in section 2.4.1 below, evaluation
of applications resulted in a smaller number of sites and
associated charge ports being deployed within the available Phase
1 Pilot funding. At the time of this report, the Pilot has deployed
infrastructure to support 941 charge ports with additional 62
charge ports in construction. SCE expects to deploy infrastructure
.noitelpmoc s’toliP eht yb strop egrahc 052,1 ot pu troppus ot
The infrastructure supports EV acceleration and adoption. As an
example of increased EV adoption, Mr. Kenny Tang of Cathay Bank
in El Monte observed that several employees started driving EVs
after the site installed charging stations with 17 ports, confirmed
that through their participation in the workplace segment several
employees have started driving an EV that weren’t doing so before
the charging stations were installed.
Successes | 15Charge Ready Phase 1 Program Pilot Report

2.4 Pilot Operations Lessons Learned and Potential Improvements
2.4.1 Customer Engagement and Evaluation
SCE reviewed customer applications and conducted on-site assessments to determine the feasibility of deploying charging stations. The
following table shows lessons learned and recommendations to improve the customer engagement and evaluation stage of the Pilot.
Table 2.3 Customer Engagement and Evaluation Lessons Learned and Recommendations
Program Phase Lessons Learned Resolution/Recommendation
Site Assessment Program Timing: Several schools were not able to conduct the program’s EV survey (to help identify existing and future EV adoption at the site) during the summer months when they were not in session. Also, the Pilot was launched in late May, and many businesses had already set their budget plans for the following year, creating a challenge for those interested in the program.
SCE will propose a five-year program which will resolve any seasonal/annual timing issues and will allow customers sufficient time to plan appropriately for participation.
Eligibility Requirement SCE proposed deploying a maximum number of customer-site charging stations, to meet anticipated use. For some DACs, maximum use supports the minimum program requirement of five charge ports. This presents a challenge for customers who prefer dual-port stations.
In DACs, customers who were approved for a maximum of five ports but selected dual-port stations were allowed to deploy six ports. The additional port also reduced the overall cost per port for those projects.
The 10-charge port minimum requirement was a challenge for some customers in non-DACs.
In the future phase, SCE may reduce the minimum port requirement fewer than 10 to support increased adoption across all targeted segments.
Some customer sites were not viable in the Charge Ready program due to high costs. Customers who are willing to pay excess costs were unable to do so.
SCE will consider submitting a proposal that allows customer cost-sharing in future programs. Several customers specificallyrequested this option and indicated they would have moved forward, if allowed to do so. This question was often brought up by customers whose applications were rejected because they exceeded the program’s cost thresholds.
Application Support Another challenge during the Pilot was the lack of automation in processing applications. Follow-up e-mails and notifications to customers and theirselected vendors were drafted and sent manually foreach project. Due to the Pilot’s short duration, SCEfocused its spending on charging station infrastructurerather than an application processing system to supportthe Pilot.
SCE will evaluate automation in processing applications where appropriate.
Pilot Operations Lessons Learned and Potential Improvements | 16Charge Ready Phase 1 Program Pilot Report
32 Division of State Architect provides design and construction oversight for K–12 schools, community colleges, and various other state-owned and leased facilities. See http://www.dgs.ca.gov/dsa/home.aspx
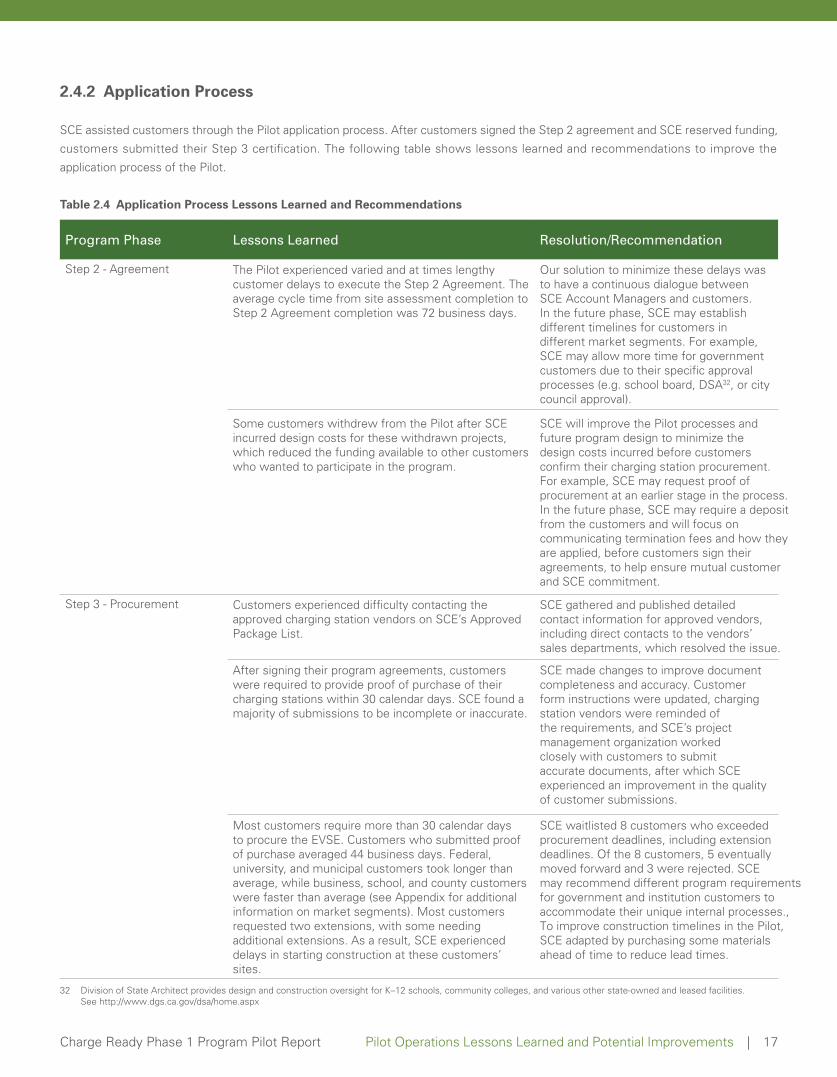
2.4.2 Application Process
SCE assisted customers through the Pilot application process. After customers signed the Step 2 agreement and SCE reserved funding,
customers submitted their Step 3 certification. The following table shows lessons learned and recommendations to improve the
application process of the Pilot.
Table 2.4 Application Process Lessons Learned and Recommendations
Program Phase Lessons Learned Resolution/Recommendation
Step 2 - Agreement The Pilot experienced varied and at times lengthy customer delays to execute the Step 2 Agreement. The average cycle time from site assessment completion to Step 2 Agreement completion was 72 business days.
Our solution to minimize these delays was to have a continuous dialogue between SCE Account Managers and customers. In the future phase, SCE may establish different timelines for customers in different market segments. For example, SCE may allow more time for government customers due to their specific approval processes (e.g. school board, DSA32, or city council approval).
Some customers withdrew from the Pilot after SCE incurred design costs for these withdrawn projects, which reduced the funding available to other customers who wanted to participate in the program.
SCE will improve the Pilot processes and future program design to minimize the design costs incurred before customers confirm their charging station procurement. For example, SCE may request proof of procurement at an earlier stage in the process. In the future phase, SCE may require a deposit from the customers and will focus on communicating termination fees and how they are applied, before customers sign their agreements, to help ensure mutual customer and SCE commitment.
Step 3 - Procurement Customers experienced difficulty contacting the approved charging station vendors on SCE’s Approved Package List.
SCE gathered and published detailed contact information for approved vendors, including direct contacts to the vendors’ sales departments, which resolved the issue.
After signing their program agreements, customers were required to provide proof of purchase of their charging stations within 30 calendar days. SCE found a majority of submissions to be incomplete or inaccurate.
SCE made changes to improve document completeness and accuracy. Customer form instructions were updated, charging station vendors were reminded of the requirements, and SCE’s project management organization worked closely with customers to submit accurate documents, after which SCE experienced an improvement in the quality of customer submissions.
Most customers require more than 30 calendar days to procure the EVSE. Customers who submitted proof of purchase averaged 44 business days. Federal, university, and municipal customers took longer than average, while business, school, and county customers were faster than average (see Appendix for additional information on market segments). Most customers requested two extensions, with some needing additional extensions. As a result, SCE experienced delays in starting construction at these customers’ sites.
SCE waitlisted 8 customers who exceeded procurement deadlines, including extension deadlines. Of the 8 customers, 5 eventually moved forward and 3 were rejected. SCE may recommend different program requirements for government and institution customers to accommodate their unique internal processes., To improve construction timelines in the Pilot, SCE adapted by purchasing some materials ahead of time to reduce lead times.
Pilot Operations Lessons Learned and Potential Improvements | 17Charge Ready Phase 1 Program Pilot Report

Program Phase Lessons Learned Resolution/Recommendation
Step 3 - Procurement A number of customers submitted incomplete procurement documents, which delayed deployment design completion and construction start.
For a future phase, SCE will change materials to add an in-depth requirements overview at the initial customer meeting.
The procurement requirements could also be included in educational materials. Vendors could be trained and responsible for ensuring their supporting documents include the necessary elements. Additionally, a Step 3 requirements meeting, in which the Account Manager reviews all Step 3 requirements, may be added to the process.
2.4.3 Pre-Construction Process
While the customers procured the charging stations, SCE completed and presented the deployment design to the customers. Once
the customers approved the design and SCE received all supporting documents required with Step 3 - Certification, SCE completed
other pre-construction requirements such as applying for permits and ordering materials. The following table shows lessons learned and
recommendations to improve the pre-construction stage of the Pilot.
Table 2.5 Pre-Construction Lessons Learned and Recommendations
Program Phase Lessons Learned Resolution/Recommendation
Requirements Initially, SCE required a two-step process to obtain easements. First, property owners were asked to sign contingent easements that provided “blanket” easements over their entire properties. The intent of contingent easements was to move applications through the design and construction processes. Once the final design was complete and accepted by the customer participants, SCE amended the contingent easements to encompass only the charging station infrastructure locations. Several customers were resistant to executing contingent easements over their entire properties. Additionally, the contingent easements caused delays in receiving the customers’ signed program agreements, due to additional time needed for customers’ legal review.
In Q1 2016, as a process improvement, SCE bypassed the contingent easement and only required execution of the final easement. The final easement reflected the final charging station design and location. Requiring customers to execute final easements only resolved delays in moving applications through the design process and receiving customers’ signed program agreements.
SCE experienced delays in executing final easements. Average cycle time was 59 business days; 37% of projects took more than 59 business days, and some took up to 234 business days, causing construction delays. For some customers, more time was needed for management and legal easement document review.
While the easement process was mentioned in the Charge Ready participation package and at Account Manager meetings with customers, for the future phase, SCE will ensure customers thoroughly understand the easement process during the early application stages and will recommend customers’ management and legal team review easements early in the process. SCE has begun discussing the easement with customers and providing the easement template during the first three customer touchpoints, and is asking customers to have their management and legal personnel begin reviewing the easement template at the beginning of the project.
Pilot Operations Lessons Learned and Potential Improvements | 18Charge Ready Phase 1 Program Pilot Report
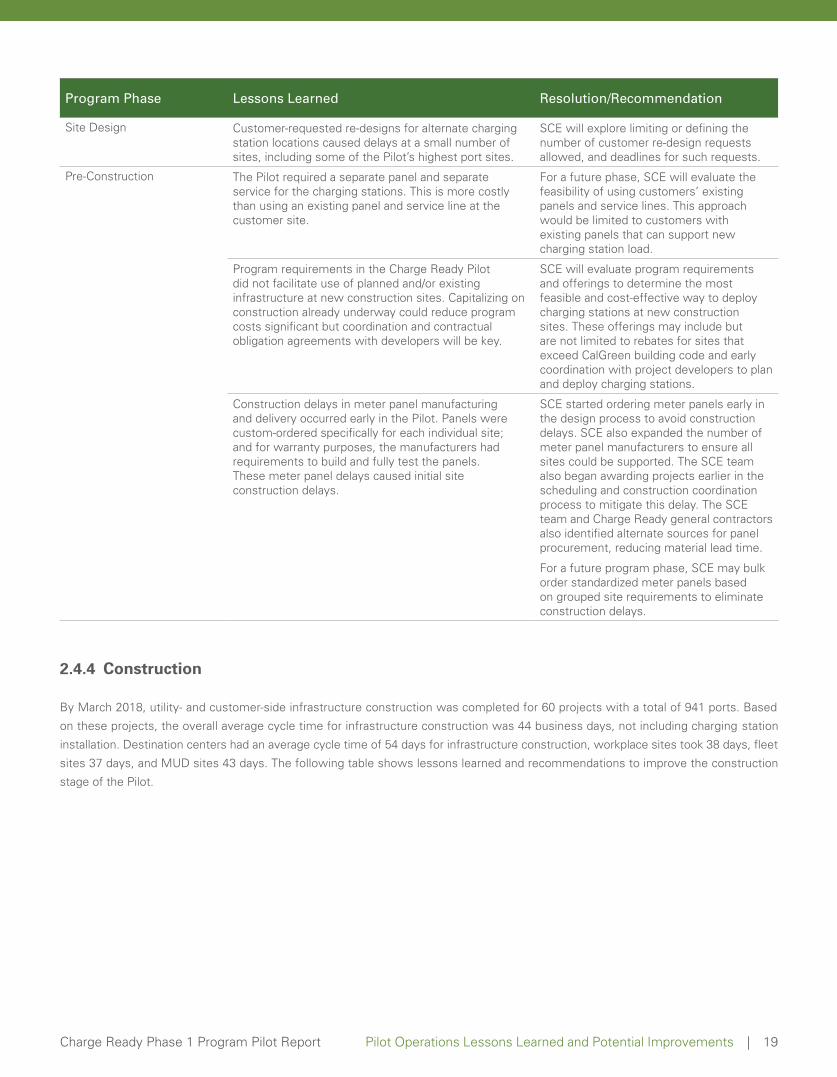
Program Phase Lessons Learned Resolution/Recommendation
Site Design Customer-requested re-designs for alternate charging station locations caused delays at a small number of sites, including some of the Pilot’s highest port sites.
SCE will explore limiting or defining the number of customer re-design requests allowed, and deadlines for such requests.
Pre-Construction The Pilot required a separate panel and separate service for the charging stations. This is more costly than using an existing panel and service line at the customer site.
For a future phase, SCE will evaluate the feasibility of using customers’ existing panels and service lines. This approach would be limited to customers with existing panels that can support new charging station load.
Program requirements in the Charge Ready Pilot did not facilitate use of planned and/or existing infrastructure at new construction sites. Capitalizing on construction already underway could reduce program costs significant but coordination and contractual obligation agreements with developers will be key.
SCE will evaluate program requirements and offerings to determine the most feasible and cost-effective way to deploy charging stations at new construction sites. These offerings may include but are not limited to rebates for sites that exceed CalGreen building code and early coordination with project developers to plan and deploy charging stations.
Construction delays in meter panel manufacturing and delivery occurred early in the Pilot. Panels were custom-ordered specifically for each individual site; and for warranty purposes, the manufacturers had requirements to build and fully test the panels. These meter panel delays caused initial site construction delays.
SCE started ordering meter panels early in the design process to avoid construction delays. SCE also expanded the number of meter panel manufacturers to ensure all sites could be supported. The SCE team also began awarding projects earlier in the scheduling and construction coordination process to mitigate this delay. The SCE team and Charge Ready general contractors also identified alternate sources for panel procurement, reducing material lead time.
For a future program phase, SCE may bulk order standardized meter panels based on grouped site requirements to eliminate construction delays.
2.4.4 Construction
By March 2018, utility- and customer-side infrastructure construction was completed for 60 projects with a total of 941 ports. Based
on these projects, the overall average cycle time for infrastructure construction was 44 business days, not including charging station
installation. Destination centers had an average cycle time of 54 days for infrastructure construction, workplace sites took 38 days, fleet
sites 37 days, and MUD sites 43 days. The following table shows lessons learned and recommendations to improve the construction
stage of the Pilot.
Pilot Operations Lessons Learned and Potential Improvements | 19Charge Ready Phase 1 Program Pilot Report
33 See https://www.evsolutions.com/Upload/Product/636035262081975030.pdf, page 15 for an example of a pedestal footprint.
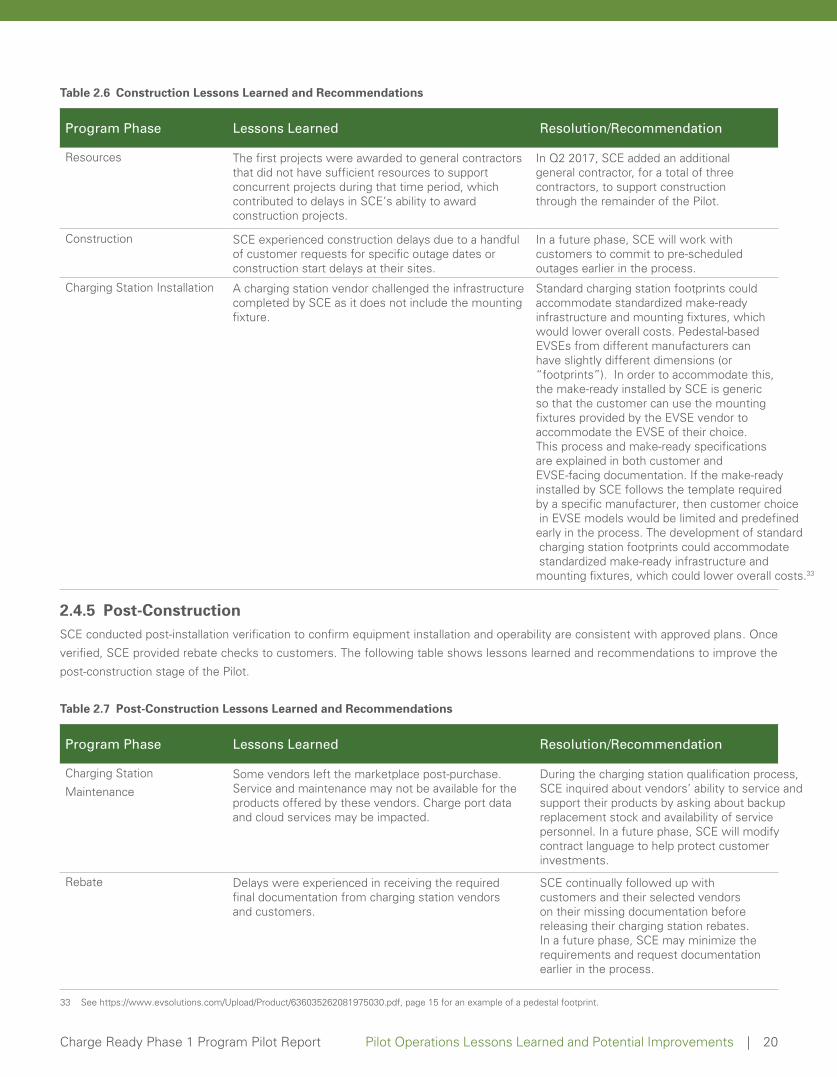
Table 2.6 Construction Lessons Learned and Recommendations
Program Phase Lessons Learned Resolution/Recommendation
Resources The first projects were awarded to general contractors that did not have sufficient resources to support concurrent projects during that time period, which contributed to delays in SCE’s ability to award construction projects.
In Q2 2017, SCE added an additional general contractor, for a total of three contractors, to support construction through the remainder of the Pilot.
Construction SCE experienced construction delays due to a handful of customer requests for specific outage dates or construction start delays at their sites.
In a future phase, SCE will work with customers to commit to pre-scheduled outages earlier in the process.
Charging Station Installation A charging station vendor challenged the infrastructure completed by SCE as it does not include the mounting fixture.
Standard charging station footprints could accommodate standardized make-ready infrastructure and mounting fixtures, which would lower overall costs. Pedestal-based EVSEs from different manufacturers can have slightly different dimensions (or “footprints”). In order to accommodate this, the make-ready installed by SCE is generic so that the customer can use the mounting fixtures provided by the EVSE vendor to accommodate the EVSE of their choice. This process and make-ready specifications are explained in both customer and EVSE-facing documentation. If the make-ready installed by SCE follows the template required by a specific manufacturer, then customer choice in EVSE models would be limited and predefined early in the process. The development of standard charging station footprints could accommodate standardized make-ready infrastructure and mounting fixtures, which could lower overall costs.33
2.4.5 Post-ConstructionSCE conducted post-installation verification to confirm equipment installation and operability are consistent with approved plans. Once
verified, SCE provided rebate checks to customers. The following table shows lessons learned and recommendations to improve the
post-construction stage of the Pilot.
Table 2.7 Post-Construction Lessons Learned and Recommendations
Program Phase Lessons Learned Resolution/Recommendation
Charging Station
MaintenanceSome vendors left the marketplace post-purchase. Service and maintenance may not be available for the products offered by these vendors. Charge port data and cloud services may be impacted.
During the charging station qualification process, SCE inquired about vendors’ ability to service and support their products by asking about backup replacement stock and availability of service personnel. In a future phase, SCE will modify contract language to help protect customer investments.
Rebate Delays were experienced in receiving the required final documentation from charging station vendors and customers.
SCE continually followed up with customers and their selected vendors on their missing documentation before releasing their charging station rebates. In a future phase, SCE may minimize the requirements and request documentation earlier in the process.
Pilot Operations Lessons Learned and Potential Improvements | 20Charge Ready Phase 1 Program Pilot Report

2.4.6 MUDs
The Multi-unit Dwelling (MUD) segment represents a large and growing opportunity to reduce Southern California’s GHG emissions.
Most MUD tenants are renters and over 50% of renters are “rent burdened.”34 MUD tenants must rely on their landlords or Homeowners’
Associations (HOAs) to provide or allow EV charging services. Based on our interactions with MUD owners during the course of the Pilot
we received feedback that some are more likely to provide upgrades to the facilities that benefit most tenants as opposed to amenities
like charging stations that may benefit fewer tenants.
As described in section 2.10.3 of this report, SCE conducted surveys of MUD customers that were contacted through our outreach
efforts but did not participate in the program. Thirty two percent of survey respondents show that installing charging stations at their
sites were of a low priority; addressing their concerns should increase their motivation for installing them.
SCE concentrated its Pilot efforts on outreach to the MUD owners. However, more traction in this segment may be possible by
marketing directly to tenants and encouraging them to convey their needs to their landlords.
Finally, MUDs also had other unique challenges with charge port installation in the Charge Ready pilot.
Identified challenges are listed below:
Table 2.8 MUDs Lessons Learned and Recommendations
Lessons Learned Resolution/Recommendation
Parking limitations were the most pervasive constraint for all MUDs. Because most spaces were already assigned to residents; it was difficult for the owners or property managers to allocate sections of parking stalls for charging station installations. While some commercial customers would have liked this option also, most went ahead with a deployment in one area of their parking lot. MUDs felt it would be especially burdensome to ask their residents to have to park on the opposite side of a large residential complex. The Pilot also required port count to not exceed 4% of the number of total parking spaces (unless EV adoption supports additional ports), which prevented MUDs with smaller parking lots from participating.
Allowing parking lots adjacent to the MUD property to be eligible for the program if they can serve those MUD residents. However, this will require increased coordination with different site hosts and may add cost and complexity to the program.
SCE proposes to lower port minimum requirement as well as eliminate minimum parking lot size to address participation barriers.
For customer convenience, large MUD complexes often wanted to deploy charging stations throughout the grounds, rather than in single, defined areas. This required multiple service connections and exclusive infrastructure components resulting in high costs that exceeded Pilot thresholds.
SCE will work with site hosts to learn more about customers parking management best practices and incorporate learnings earlier in process to help address deployment location concerns.
As with all parking structures, MUDs with parking structures faced challenges in meeting current state accessibility requirements, which required more work. In some cases, AHJs required MUDs to update all parking areas to current codes.
SCE proposes to eliminate parking lot size requirements which would allow for an option of curb side charging deployment. Allowing parking lots (non-parking structure) adjacent to the MUD property to be eligible for the program if they can serve those MUD residents. However, this will require increased coordination with different site hosts and may add cost and complexity to the program.
Due to space constraints, it could be difficult to find viable locations for switchgear, transformers, and other necessary equipment for charging station deployment.
Capitalizing on construction already underway could address space constraints but coordination and contractual obligation agreements with developers will be key.
2.5 Contractors
2.5.1 Supplier DiversityThe architecture and engineering firm, as well as the general contractors selected for Charge Ready, were all Diversified Business
Enterprises (DBEs). This exceeded SCE’s Diversified Business Enterprise 40% spending
2.5.2 Training and SafetySCE values safety, and ensured the utility and the customer participant site infrastructures were installed and maintained in safe working
order. The Pilot required SCE employees and subcontractors installing the make-ready infrastructure to follow these safety requirements:
• All general contractors must prepare and adhere to a job-specific Job Hazard Analysis (JHA).
• All general contractors must have a dedicated safety officer or manager who regularly visits the job site.• Safety tailboards must be held daily to discuss the work to be performed and any potential risks.
Contractors | 21Charge Ready Phase 1 Program Pilot Report
34 See: http://www.hcd.ca.gov/policy-research/plans-reports/docs/California's-Housing-Future-Main-Document-Draft.pdf “California’s Housing Future: Challenges and Opportunities, Public Draft – Statewide Housing Assessment 2025”, January 2017, figure 1.20, p. 15.
• All general contractors must submit a monthly safety report to SCE.
• SCE personnel must follow all site safety regulations, including wearing appropriate personal protection equipment.
• Subcontractor electricians must hold valid California C-10 licenses.
• Electricians installing the make-ready infrastructure must be EV Infrastructure Training Program (EVITP) certified.
For infrastructure safety, all site plans were submitted to their AHJs for approval and permitting. Some AHJs required multi-agency (for
example, Building & Safety, Electrical, and Fire Department Planning) approval. For charging station safety, all installations were completed
per AHJ-approved plans, and inspected by AHJ inspectors.
35 Testimony In Support Of Southern California Edison Company’s Charge Ready Application, Vol. 03 – Phase 1 Charge Ready And Market Education Pilot, p. 10. 36 The Pilot’s Approved Package List can be found on the landing page at https://on.sce.com/chargeready.
2.6 Charging Stations
2.6.1 Overview
In accordance with our testimony,35 the Pilot installed charging
stations at long-dwell-time locations. The three types of charging
stations that met those needs were:
1. Level 1 charging system, without network capability.
2. Level 2 “A” charging system, with network capability
integrated into the EVSE.
3. Level 2 “B” charging system, with network capability
provided by an external device (such as a kiosk or
gateway) shared among multiple stations.
SCE required DR capabilities for Level 2 charging stations, and
customers selecting those stations are required to participate
in a future DR program. SCE developed an RFI to find charging
stations with these capabilities and qualify them for the Pilot
to reduce customer participant barriers in procuring charging
stations and to promote competition in the EV charging market.
The Approved Package List (APL)36 summarizes the vendors and
EVSE models available to customers. By March 2018, the Pilot
offers 61 models from twelve vendors, maintaining customer
choice and market-neutral customer engagement. Appendix C
provides a summary of the different charging system types.
To further reduce barriers to adoption, SCE provided a rebate
to reduce charge port cost and installation (the base cost, defined
in Section 2.2). The base cost values at the time of this report
are shown in the following table. During the Pilot, these values
were updated once on December 2016 due to models that
were dropped from the APL.
Table 2.9 Charging Stations Base Cost
Charging System Type Base Cost ($ per port)Level 1 $1,396
Level 2 “A” $2,188
Level 2 “B” $1,611
2.6.2 Customer Charging Stations
By March 2018, 70 customers with 1,066 charge ports
had submitted their procurement documents for the charging
stations. The following chart displays customer charging
station selection.
Figure 2.4 Customer Preferred Charging Station Type
The following graph shows that more customers preferred dual-
port connectors for both Level 2A and Level 2B charge ports.
Installing dual port charging stations reduced infrastructure costs
from construction-related work (e.g., reduced trenching
and restoration).
Figure 2.5 Customer Preferred Charging Station Connector
1% Level 112 ports1% Level 112 ports1% Level 112 ports
31% Level 2 B335 ports
68% Level 2 A719 ports
Preferred Charging Station
1249
279 270
456
0
50
100
150
200
250
300
350
400
450
500
L1 L2A L2B L2A L2B
Single Port Dual Port
Customer Preferred Charging Station Connector
Charging Stations | 22Charge Ready Phase 1 Program Pilot Report
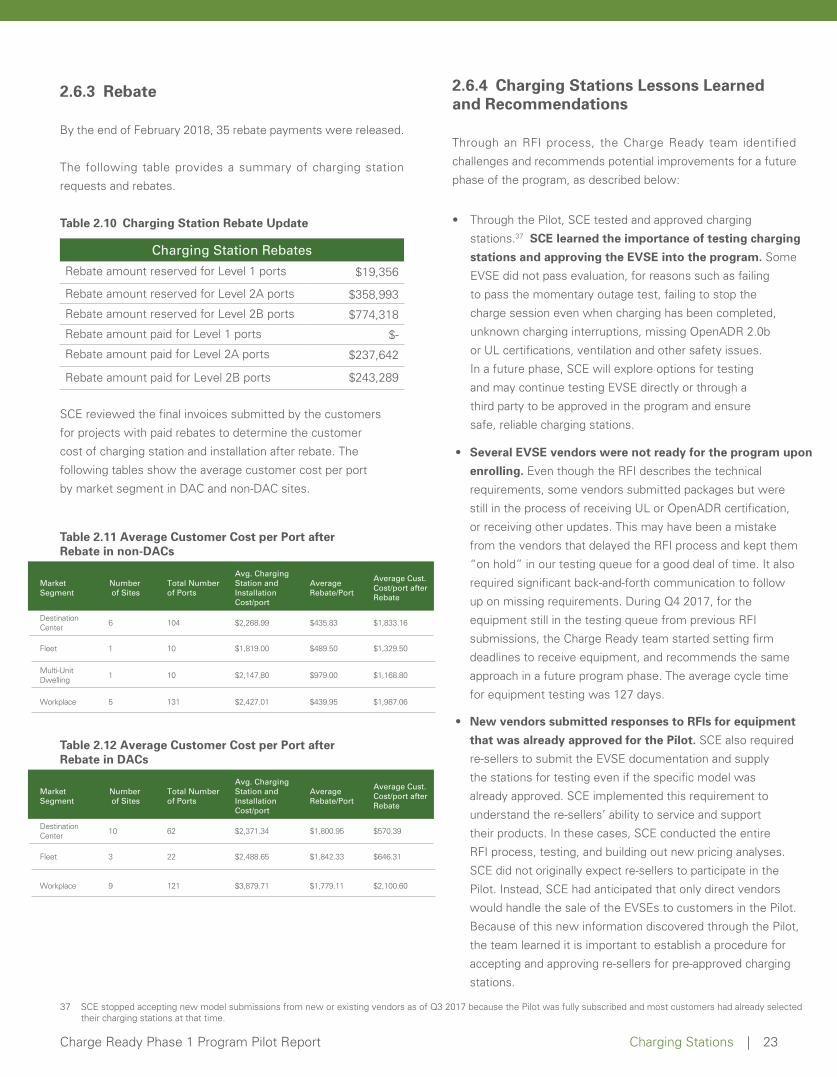
37 SCE stopped accepting new model submissions from new or existing vendors as of Q3 2017 because the Pilot was fully subscribed and most customers had already selected their charging stations at that time.
2.6.3 Rebate
By the end of February 2018, 35 rebate payments were released.
The following table provides a summary of charging station
SCE reviewed the final invoices submitted by the customers
for projects with paid rebates to determine the customer
cost of charging station and installation after rebate. The
following tables show the average customer cost per port
by market segment in DAC and non-DAC sites.
requests and rebates.
Table 2.10
Table 2.11 Average Customer Cost per Port after Rebate in non-DACs
Charging Station Rebate Update
Charging Station Rebates
Market Segment
Number of Sites
Total Number of Ports
Avg. Charging Station and Installation Cost/port
Average Rebate/Port
Average Cust.Cost/port afterRebate
Rebate amount reserved for Level 1 ports
Destination Center 6 104 $2,268.99 $435.83 $1,833.16
Fleet 1 10 $1,819.00 $489.50 $1,329.50
Multi-UnitDwelling 1 10 $2,147.80 $979.00 $1,168.80
Workplace 5 131 $2,427.01 $439.95 $1,987.06
$19,356
Rebate amount reserved for Level 2A ports $358,993
Rebate amount reserved for Level 2B ports $774,318
Rebate amount paid for Level 1 ports $-
Rebate amount paid for Level 2A ports $237,642
Rebate amount paid for Level 2B ports $243,289
2.6.4 Charging Stations Lessons Learned and Recommendations
Through an RFI process, the Charge Ready team identified
challenges and recommends potential improvements for a future
phase of the program, as described below:
• Through the Pilot, SCE tested and approved charging
stations.37 SCE learned the importance of testing charging
stations and approving the EVSE into the program. Some
EVSE did not pass evaluation, for reasons such as failing
to pass the momentary outage test, failing to stop the
charge session even when charging has been completed,
unknown charging interruptions, missing OpenADR 2.0b
or UL certifications, ventilation and other safety issues.
In a future phase, SCE will explore options for testing
and may continue testing EVSE directly or through a
third party to be approved in the program and ensure
safe, reliable charging stations.
Charging Stations | 23Charge Ready Phase 1 Program Pilot Report
Table 2.12 Average Customer Cost per Port after Rebate in DACs
Market Segment
Number of Sites
Total Number of Ports
Avg. Charging Station and Installation Cost/port
Average Rebate/Port
Average Cust.Cost/port afterRebate
Destination Center 10 62 $2,371.34 $1,800.95 $570.39
Fleet 3 22 $2,488.65 $1,842.33 $646.31
Workplace 9 121 $3,879.71 $1,779.11 $2,100.60
• New vendors submitted responses to RFIs for equipment
that was already approved for the Pilot. SCE also required
re-sellers to submit the EVSE documentation and supply
the stations for testing even if the specific model was
already approved. SCE implemented this requirement to
understand the re-sellers’ ability to service and support
their products. In these cases, SCE conducted the entire
RFI process, testing, and building out new pricing analyses.
SCE did not originally expect re-sellers to participate in the
Pilot. Instead, SCE had anticipated that only direct vendors
would handle the sale of the EVSEs to customers in the Pilot.
Because of this new information discovered through the Pilot,
the team learned it is important to establish a procedure for
accepting and approving re-sellers for pre-approved charging
stations.
• Several EVSE vendors were not ready for the program upon
enrolling. Even though the RFI describes the technical
requirements, some vendors submitted packages but were
still in the process of receiving UL or OpenADR certification,
or receiving other updates. This may have been a mistake
from the vendors that delayed the RFI process and kept them
“on hold” in our testing queue for a good deal of time. It also
required significant back-and-forth communication to follow
up on missing requirements. During Q4 2017, for the
equipment still in the testing queue from previous RFI
submissions, the Charge Ready team started setting firm
deadlines to receive equipment, and recommends the same
approach in a future program phase. The average cycle time
for equipment testing was 127 days.
• Although OpenADR 2.0 and network communication were requirements for EVSE to be approved for the Charge Ready Pilot,
preparation for the Charge Ready DR Pilot discovered that actual executions to meet the requirements varied by EVSE vendor.
For example, at least one vendor does not support the ability for chargers to “throttle” to a lower capacity of charging, but only
turn chargers off or on. Some vendor systems also do not require an e-mail address or phone number from drivers using their
chargers, making it difficult to notify drivers when events are called that could impact their charging. SCE is testing whether the
lack of these features on certain EVSEs will impact future DR participation in the Charge Ready DR Pilot. SCE will report its
findings in the Advisory Board meetings as the Pilot progresses. Also SCE will use the findings from the Pilot to develop
specifications for EVSE vendor capabilities to enable increased participation in future demand response programs. Finally SCE,
through continual post-deployment analysis, will exclude vendors that cannot meet or execute the requirements of future DR
programs.
2.7 Charging Station Operation
2.7.1 Rate SchedulesCustomers with low load factors are more costly to serve because their utilization is volatile. Therefore, utilities must size transmission
and distribution systems accordingly. Under current CPUC-approved tariffs, some of these costs are passed on to customers via demand
charges, which are measured in kW. These are different from energy consumption charges, which are measured in kWh.
Charge Ready customer participants who had general service accounts located at their premises could select available EV rates with
Facilities-Related Demand (FRD) charge offset options.
For Rate Schedules TOU-EV-3-B, TOU-EV-4, and TOU-EV-6, FRD charges are determined using the FRD in excess of the primary account
located at the same premises (the customer of record must be the same for both accounts). If the FRD from EV charging is less than the
FRD of the primary service account (within any given monthly billing period), no separate FRD charge is due for the qualifying EV account.
This is also known as demand neutralization.
The majority of Pilot participants are selecting TOU-EV-4 due to the estimated load expected by the number of charging stations being
deployed at the site. TOU-EV-3 is for customers with peak demand under 20kW. Any site with a minimum of 5 6.6kW Level 2 stations
will exceed this threshold. TOU-EV-6 is for sites with over 500kW peak demand and only one of the sites is expected to exceed this
threshold. Also, the demand neutralization feature of the EV-4 rate made it more attractive for customers with an existing service
account at the site compared to the traditional TOU-GS rate option with full demand charges.
Charging Station Operation | 24Charge Ready Phase 1 Program Pilot Report
• Energy management systems, which are considered a new technology, are encouraged by vendors in their RFI introductions.
A standard procedure to test energy management systems does not exist as these systems were just permitted under
California Code after January 2017. The Pilot had to adapt at that point and develop evaluation methods to ensure safe function
and approve them for Pilot customers. Such systems, in the right circumstances, can reduce the electrical infrastructure
needed to serve a number of cars, as long as operating conditions permit. Also, the RFIs do not cover compliance standards,
such as NEC Article 750 or UL 916, for these systems. In the Pilot, there were two vendors who submitted these systems and
made it through the RFI review, and specific procedures were drafted to accommodate these vendors. For a future phase, SCE
will develop a standard procedure for testing and approving energy management systems to be used in the Charge Ready program.
• SCE encountered vendors changing model numbers during the testing process, and submitted different model numbers than
originally listed in the RFI response. This made it challenging to match models with the RFI response, manuals, pricing templates,
and nameplate labels on the test equipment, making some parts of the testing process more difficult. Some information is not
requested in the RFI, such as gateway model numbers, differentiation between L2A and L2B, and firmware version number,
and needs to be acquired from the vendor prior to approval. This requires extensive coordination with the vendor. SCE worked
closely with vendors during the tech evaluation process to get the equipment approved that would meet the tech requirements.
This process helped vendors learn what it takes to deliver equipment and services. Simply rejecting the equipment that presented
these issues would have been quicker, but would also mean far fewer options for customers, which could have had an impact on
Pilot participation. For a future phase, SCE intends to create a supplemental document that the vendor signs and submits at the
end of testing. This document would capture all the information that may have changed during testing, and also a method to c
onsolidate all the emails that go back and forth between SCE and the vendor to acquire this information.
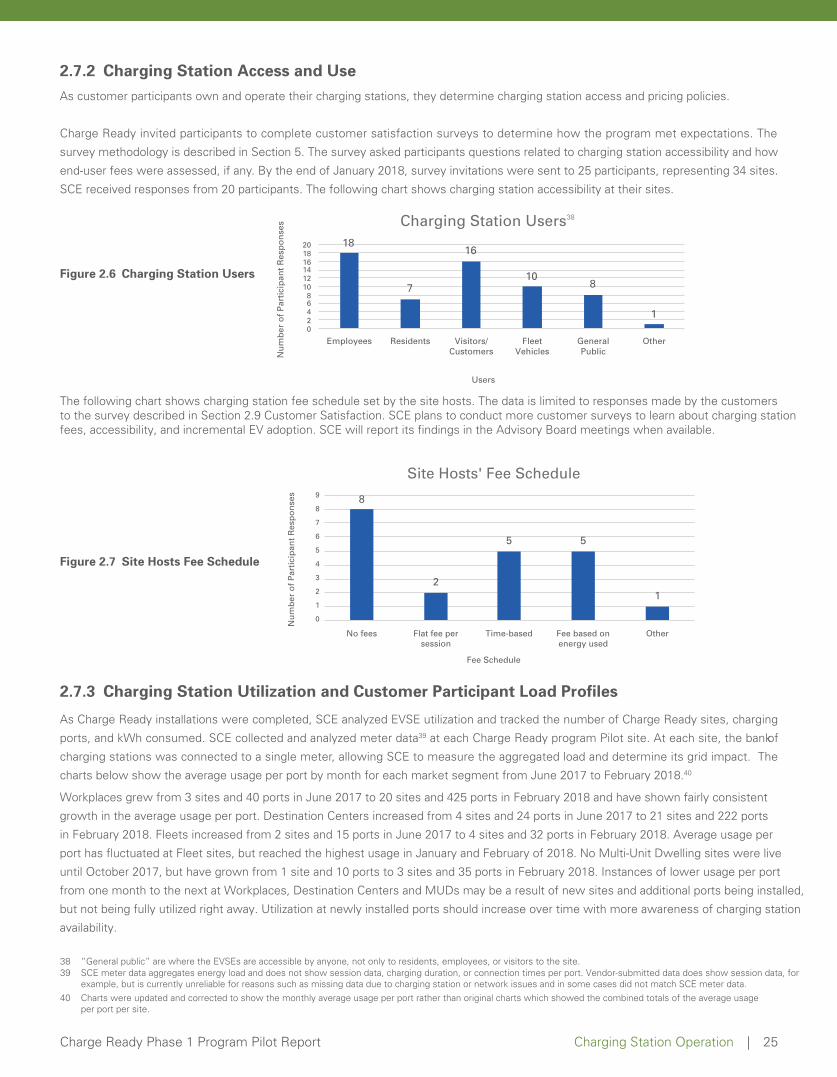
40 Charts were updated and corrected to show the monthly average usage per port rather than original charts which showed the combined totals of the average usage per port per site.
38 “General public” are where the EVSEs are accessible by anyone, not only to residents, employees, or visitors to the site.39 SCE meter data aggregates energy load and does not show session data, charging duration, or connection times per port. Vendor-submitted data does show session data, for
example, but is currently unreliable for reasons such as missing data due to charging station or network issues and in some cases did not match SCE meter data.
2.7.2 Charging Station Access and UseAs customer participants own and operate their charging stations, they determine charging station access and pricing policies.
Charge Ready invited participants to complete customer satisfaction surveys to determine how the program met expectations. The
survey methodology is described in Section 5. The survey asked participants questions related to charging station accessibility and how
end-user fees were assessed, if any. By the end of January 2018, survey invitations were sent to 25 participants, representing 34 sites.
SCE received responses from 20 participants. The following chart shows charging station accessibility at their sites.
Figure 2.6
Charging Station Users
18
7
16
108
102468
101214161820
Nu
mb
er o
f P
arti
cip
ant
Res
po
nse
s
Users
Employees Residents Visitors/Customers
FleetVehicles
GeneralPublic
Other
Charging Station Users
The following chart shows charging station fee schedule set by the site hosts. The data is limited to responses made by the customers to the survey described in Section 2.9 Customer Satisfaction. SCE plans to conduct more customer surveys to learn about charging station fees, accessibility, and incremental EV adoption. SCE will report its findings in the Advisory Board meetings when available.
Figure 2.7 Site Hosts Fee Schedule
2.7.3 Charging Station Utilization and Customer Participant Load Profiles
As Charge Ready installations were completed, SCE analyzed EVSE utilization and tracked the number of Charge Ready sites, charging
ports, and kWh consumed. SCE collected and analyzed meter data39 at each Charge Ready program Pilot site. At each site, the bank of
charging stations was connected to a single meter, allowing SCE to measure the aggregated load and determine its grid impact. The
charts below show the average usage per port by month for each market segment from June 2017 to February
Workplaces grew from 3 sites and 40 ports in June 2017 to 20 sites and 425 ports in February 2018 and have shown fairly consistent
growth in the average usage per port. Destination Centers increased from 4 sites and 24 ports in June 2017 to 21 sites and 222 ports
in February 2018. Fleets increased from 2 sites and 15 ports in June 2017 to 4 sites and 32 ports in February 2018. Average usage per
port has fluctuated at Fleet sites, but reached the highest usage in January and February of 2018. No Multi-Unit Dwelling sites were live
until October 2017, but have grown from 1 site and 10 ports to 3 sites and 35 ports in February 2018. Instances of lower usage per port
from one month to the next at Workplaces, Destination Centers and MUDs may be a result of new sites and additional ports being installed,
but not being fully utilized right away. Utilization at newly installed ports should increase over time with more awareness of charging station
availability.
2018.40
8
2
5 5
1
0
1
2
3
4
5
6
7
8
9
No fees Flat fee persession
Time-based Fee based onenergy used
Other
Nu
mb
er o
f P
arti
cip
ant
Res
po
nse
s
Fee Schedule
Site Hosts' Fee Schedule
Charging Station Operation | 25Charge Ready Phase 1 Program Pilot Report
38
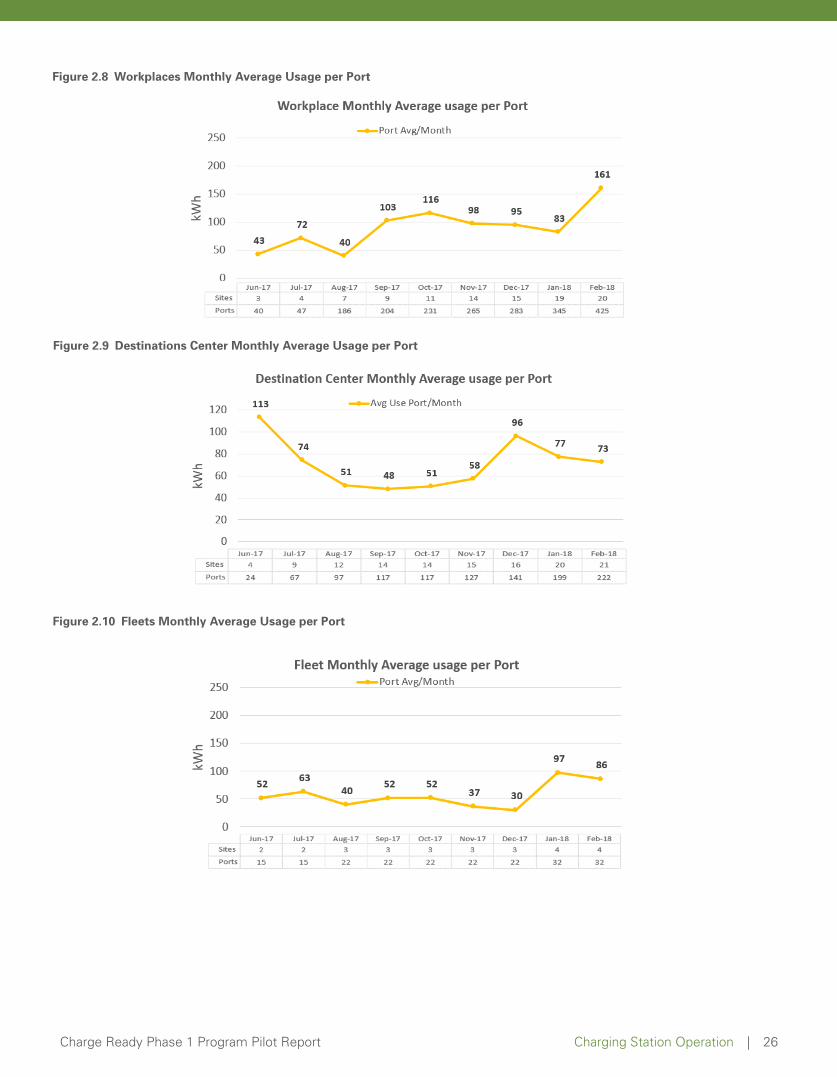
Figure 2.8 Workplaces Monthly Average Usage per Port
Figure 2.9 Destinations Center Monthly Average Usage per Port
Figure 2.10 Fleets Monthly Average Usage per Port
Charging Station Operation | 26Charge Ready Phase 1 Program Pilot Report
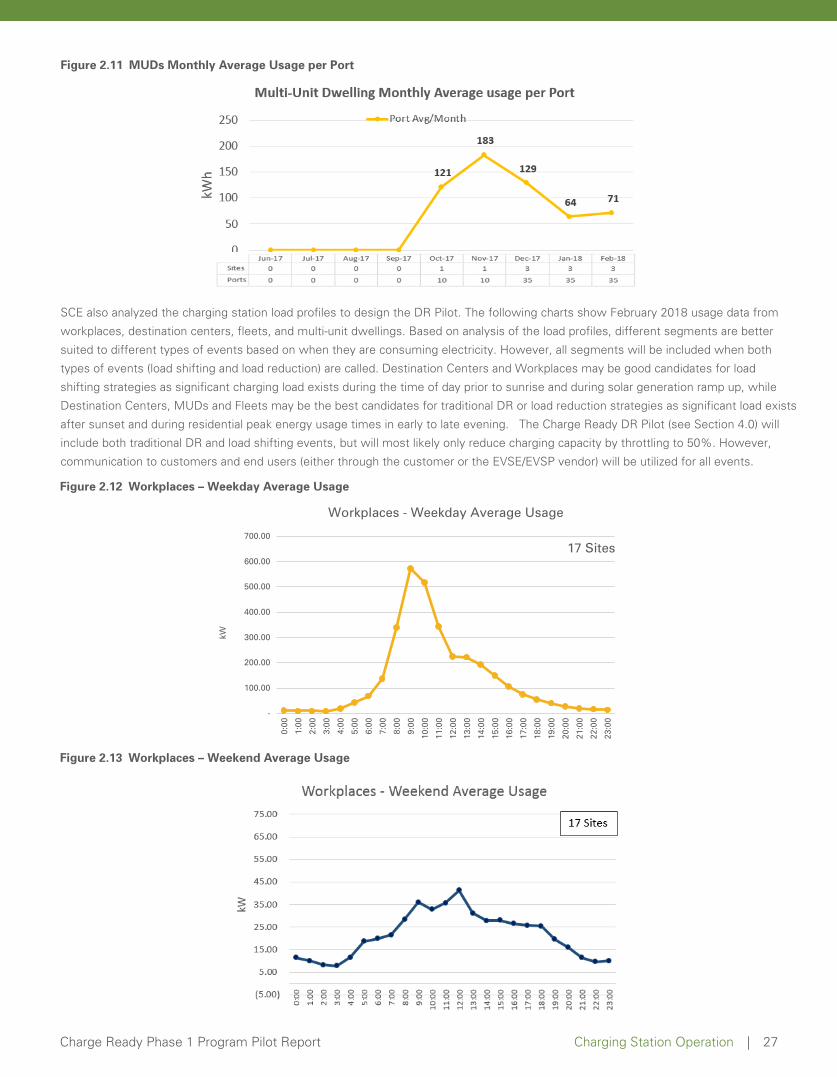
Figure 2.12 Workplaces – Weekday Average Usage
Figure 2.13 Workplaces – Weekend Average Usage
-
100.00
200.00
300.00
400.00
500.00
600.00
700.00
0:00
1:00
2:00
3:00
4:00
5:00
6:00
7:00
8:00
9:00
10:0
0
11:0
0
12:0
0
13:0
0
14:0
0
15:0
0
16:0
0
17:0
0
18:0
0
19:0
0
20:0
0
21:0
0
22:0
0
23:0
0
kW
Workplaces - Weekday Average Usage
17 Sites
Charging Station Operation | 27Charge Ready Phase 1 Program Pilot Report
Figure 2.11 MUDs Monthly Average Usage per Port
SCE also analyzed the charging station load profiles to design the DR Pilot. The following charts show February 2018 usage data from
workplaces, destination centers, fleets, and multi-unit dwellings. Based on analysis of the load profiles, different segments are better
suited to different types of events based on when they are consuming electricity. However, all segments will be included when both
types of events (load shifting and load reduction) are called. Destination Centers and Workplaces may be good candidates for load
shifting strategies as significant charging load exists during the time of day prior to sunrise and during solar generation ramp up, while
Destination Centers, MUDs and Fleets may be the best candidates for traditional DR or load reduction strategies as significant load exists
after sunset and during residential peak energy usage times in early to late evening. The Charge Ready DR Pilot (see Section 4.0) will
include both traditional DR and load shifting events, but will most likely only reduce charging capacity by throttling to 50%. However,
communication to customers and end users (either through the customer or the EVSE/EVSP vendor) will be utilized for all events.
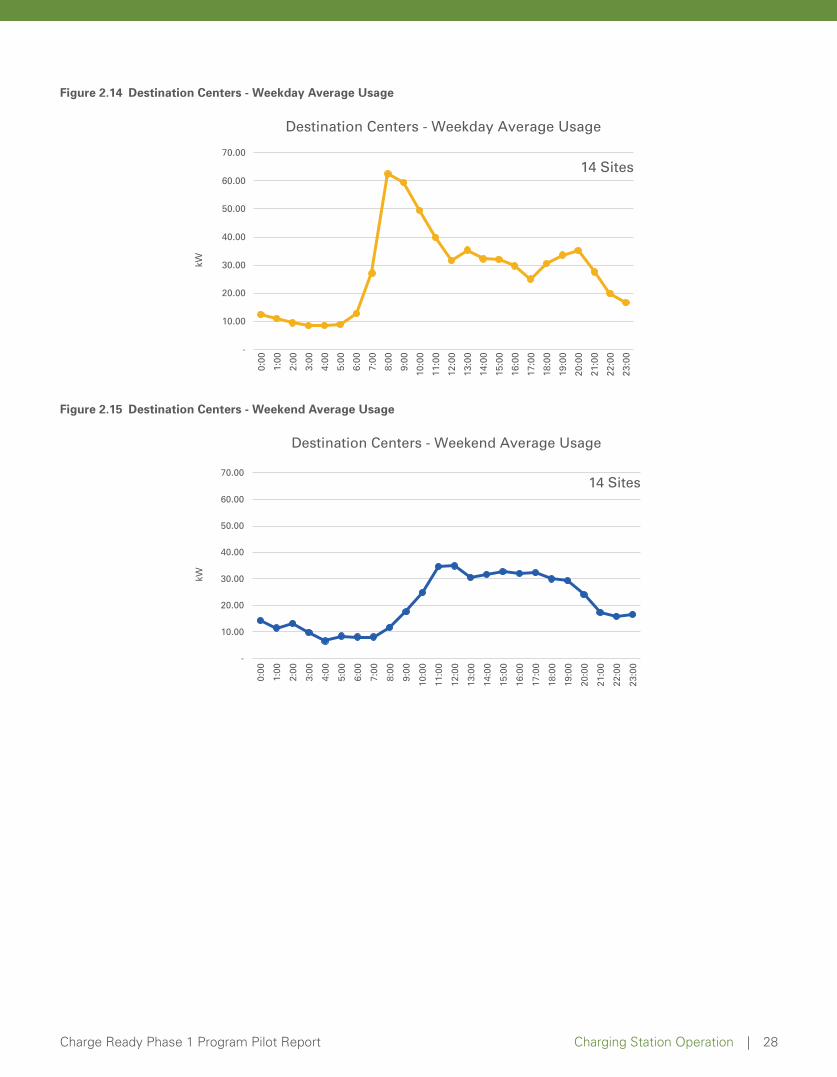
Figure 2.14 Destination Centers - Weekday Average Usage
Figure 2.15 Destination Centers - Weekend Average Usage
-
10.00
20.00
30.00
40.00
50.00
60.00
70.00
0:00
1:00
2:00
3:00
4:00
5:00
6:00
7:00
8:00
9:00
10:0
0
11:0
0
12:0
0
13:0
0
14:0
0
15:0
0
16:0
0
17:0
0
18:0
0
19:0
0
20:0
0
21:0
0
22:0
0
23:0
0
kW
Destination Centers - Weekday Average Usage
14 Sites
-
10.00
20.00
30.00
40.00
50.00
60.00
70.00
0:00
1:00
2:00
3:00
4:00
5:00
6:00
7:00
8:00
9:00
10:0
0
11:0
0
12:0
0
13:0
0
14:0
0
15:0
0
16:0
0
17:0
0
18:0
0
19:0
0
20:0
0
21:0
0
22:0
0
23:0
0
kW
Destination Centers - Weekend Average Usage
14 Sites
Charging Station Operation | 28Charge Ready Phase 1 Program Pilot Report
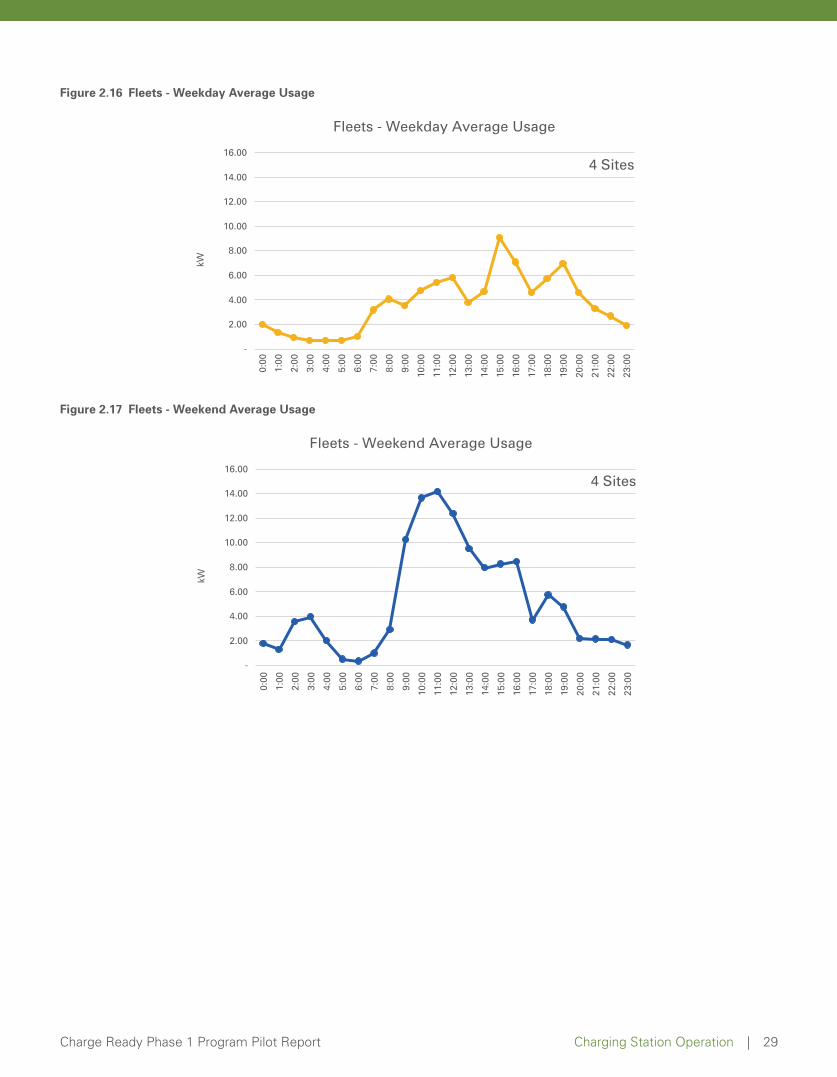
Figure 2.16 Fleets - Weekday Average Usage
Figure 2.17 Fleets - Weekend Average Usage
-
2.00
4.00
6.00
8.00
10.00
12.00
14.00
16.00
0:00
1:00
2:00
3:00
4:00
5:00
6:00
7:00
8:00
9:00
10:0
0
11:0
0
12:0
0
13:0
0
14:0
0
15:0
0
16:0
0
17:0
0
18:0
0
19:0
0
20:0
0
21:0
0
22:0
0
23:0
0
kW
Fleets - Weekday Average Usage
4 Sites
Fleets - Weekend Average Usage
-
2.00
4.00
6.00
8.00
10.00
12.00
14.00
16.00
0:00
1:00
2:00
3:00
4:00
5:00
6:00
7:00
8:00
9:00
10:0
0
11:0
0
12:0
0
13:0
0
14:0
0
15:0
0
16:0
0
17:0
0
18:0
0
19:0
0
20:0
0
21:0
0
22:0
0
23:0
0
kW
4 Sites
Charging Station Operation | 29Charge Ready Phase 1 Program Pilot Report

Figure 2.18 MUDs - Weekday Average Usage
Figure 2.19 MUDs - Weekend Average Usage
The figures above indicate that, on average, workplaces experience a higher level of charging on weekday mornings and consistent
level of charging during weekdays. Destination centers, on average, experience higher levels of charging in the morning with usage
on weekend afternoons. Fleet sites, on average, experience higher levels of charging on weekday afternoons and during mid-day on
weekends. Finally, MUDs, on average, experience similar patterns of charging with higher usage at night on weekdays and weekends.
SCE will continue to analyze submitted charging data, and expects to gain significant learnings as the users mature and develop more
consistent charging patterns and behaviors.
-
2.00
4.00
6.00
8.00
10.00
12.00
0:00
1:00
2:00
3:00
4:00
5:00
6:00
7:00
8:00
9:00
10:0
0
11:0
0
12:0
0
13:0
0
14:0
0
15:0
0
16:0
0
17:0
0
18:0
0
19:0
0
20:0
0
21:0
0
22:0
0
23:0
0
kW
Multi - Unit Dwellings - Weekday Average Usage
3 Sites
-
2.00
4.00
6.00
8.00
10.00
12.00
0:00
1:00
2:00
3:00
4:00
5:00
6:00
7:00
8:00
9:00
10:0
0
11:0
0
12:0
0
13:0
0
14:0
0
15:0
0
16:0
0
17:0
0
18:0
0
19:0
0
20:0
0
21:0
0
22:0
0
23:0
0
kW
Multi - Unit Dwellings - Weekend Average Usage
3 Sites
Charging Station Operation | 30Charge Ready Phase 1 Program Pilot Report
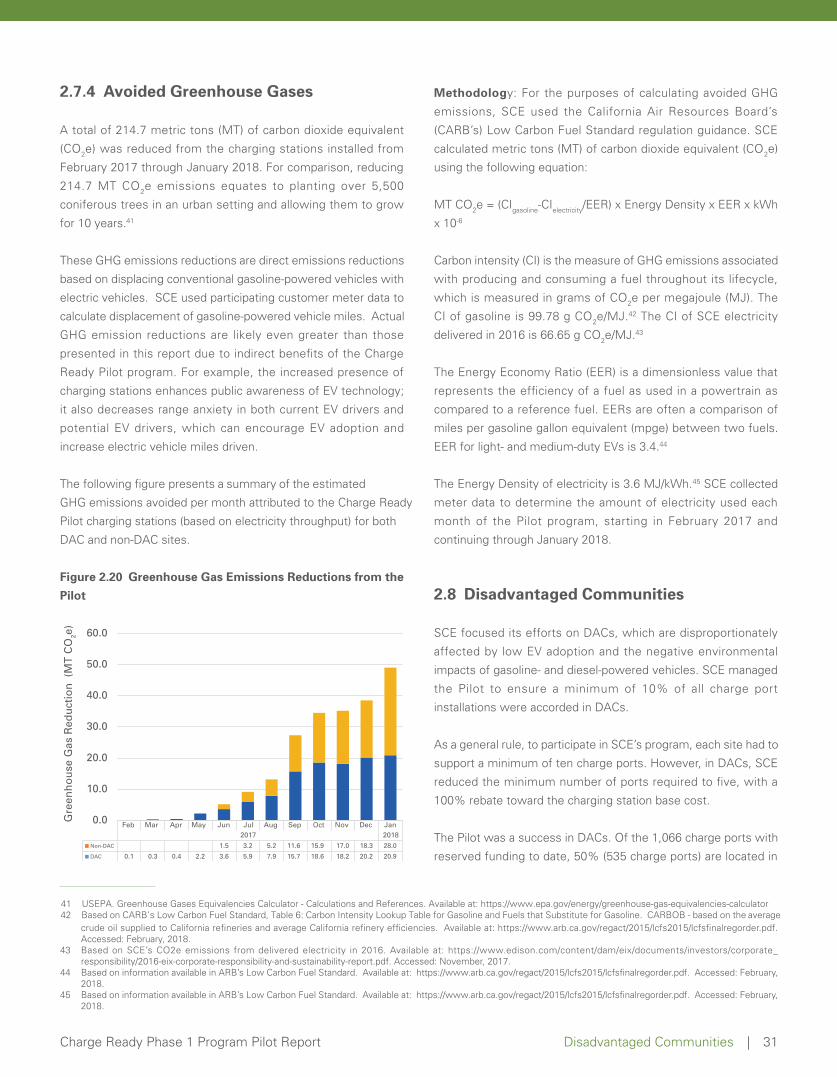
41 USEPA. Greenhouse Gases Equivalencies Calculator - Calculations and References. Available at: https://www.epa.gov/energy/greenhouse-gas-equivalencies-calculator 42 Based on CARB’s Low Carbon Fuel Standard, Table 6: Carbon Intensity Lookup Table for Gasoline and Fuels that Substitute for Gasoline. CARBOB - based on the average
.fdp.redrogerlanfisfcl/5102sfcl/5102/tcager/vog.ac.bra.www//:sptth :ta elbaliavA .seicneicfife yrenfier ainrofilaC egareva dna seirenfier ainrofilaC ot deilppus lio edurcAccessed: February, 2018.
43 Based on SCE’s CO2e emissions from delivered electricity in 2016. Available at: https://www.edison.com/content/dam/eix/documents/investors/corporate_responsibility/2016-eix-corporate-responsibility-and-sustainability-report.pdf. Accessed: November, 2017.
44 Based on information available in ARB’s Low Carbon Fuel Standard. Available at: https://www.arb.ca.gov/regact/2015/lcfs2015/lcfsfinalregorder.pdf. Accessed: February, 2018.
45 Based on information available in ARB’s Low Carbon Fuel Standard. Available at: https://www.arb.ca.gov/regact/2015/lcfs2015/lcfsfinalregorder.pdf. Accessed: February, 2018.
2.7.4 Avoided Greenhouse Gases
A total of 214.7 metric tons (MT) of carbon dioxide equivalent
(CO2e) was reduced from the charging stations installed from
February 2017 through January 2018. For comparison, reducing
214.7 MT CO2e emissions equates to planting over 5,500
coniferous trees in an urban setting and allowing them to grow
for 10 years.41
These GHG emissions reductions are direct emissions reductions
based on displacing conventional gasoline-powered vehicles with
electric vehicles. SCE used participating customer meter data to
calculate displacement of gasoline-powered vehicle miles. Actual
GHG emission reductions are likely even greater than those
presented in this report due to indirect benefits of the Charge
Ready Pilot program. For example, the increased presence of
charging stations enhances public awareness of EV technology;
it also decreases range anxiety in both current EV drivers and
potential EV drivers, which can encourage EV adoption and
increase electric vehicle miles driven.
The following figure presents a summary of the estimated
GHG emissions avoided per month attributed to the Charge Ready
Pilot charging stations (based on electricity throughput) for both
DAC and non-DAC sites.
Figure 2.20 Greenhouse Gas Emissions Reductions from the
Pilot
Methodology: For the purposes of calculating avoided GHG
emissions, SCE used the California Air Resources Board’s
(CARB’s) Low Carbon Fuel Standard regulation guidance. SCE
calculated metric tons (MT) of carbon dioxide equivalent (CO2e)
using the following equation:
MT CO2e = (CIgasoline-CIelectricity/EER) x Energy Density x EER x kWh
x 10-6
Carbon intensity (CI) is the measure of GHG emissions associated
with producing and consuming a fuel throughout its lifecycle,
which is measured in grams of CO2e per megajoule (MJ). The
CI of gasoline is 99.78 g CO2e/MJ.42 The CI of SCE electricity
delivered in 2016 is 66.65 g CO2e/MJ.43
The Energy Economy Ratio (EER) is a dimensionless value that
represents the efficiency of a fuel as used in a powertrain as
compared to a reference fuel. EERs are often a comparison of
.sleuf owt neewteb )egpm( tnelaviuqe nollag enilosag rep selim
EER for light- and medium-duty EVs is 3.4.44
The Energy Density of electricity is 3.6 MJ/kWh.45 SCE collected
meter data to determine the amount of electricity used each
month of the Pilot program, starting in February 2017 and
continuing through January 2018.
2.8 Disadvantaged Communities
SCE focused its efforts on DACs, which are disproportionately
affected by low EV adoption and the negative environmental
impacts of gasoline- and diesel-powered vehicles. SCE managed
the Pilot to ensure a minimum of 10% of all charge port
installations were accorded in DACs.
As a general rule, to participate in SCE’s program, each site had to
support a minimum of ten charge ports. However, in DACs, SCE
reduced the minimum number of ports required to five, with a
100% rebate toward the charging station base cost.
The Pilot was a success in DACs. Of the 1,066 charge ports with
reserved funding to date, 50% (535 charge ports) are located in
Feb Mar Apr May Jun Jul Aug Sep Oct Nov Dec Jan2017 2018
Non-DAC 1.5 3.2 5.2 11.6 15.9 17.0 18.3 28.0
DAC 0.1 0.3 0.4 2.2 3.6 5.9 7.9 15.7 18.6 18.2 20.2 20.9
0.0
10.0
20.0
30.0
40.0
50.0
60.0
Gre
enh
ou
se G
as R
edu
ctio
n (
MT
CO
2e)
Disadvantaged Communities | 31Charge Ready Phase 1 Program Pilot Report

Table 2.13 Average Satisfaction Score per Survey Topic
Survey Topic Average Satisfaction Score
The total time for the project was reasonable 9.1
Prices of the charging stations from SCE approved vendors 8.3
The amount of time it took to receive the rebate after the �nal walk-through
8.7
Cost of the charging network services 8.0
Cost of charging stations after rebate (amount paid minus the rebate)
8.4
SCE managed the process without excessive delays 9.1
Overall Satisfaction with SCE’s Charge Ready program 9.2
SCE clearly explained each step of the process 9.1
SCE was easy to work with 9.4
SCE kept you well informed throughout the process 9.3
Easement process 8.9
The amount of the rebate 9.3
SCE was able to answer all questions related to Charge Ready 9.4
Final walk-through by SCE 9.3
The online enrollment including registration, online forms, dashboard, etc.
9.3
Site evaluation and presentation of De�ned Plan 9.0
The information available from SCE on quali�ed charging stations / approved vendors
9.3
Overall Satisfaction with the charging station procurement process with the approved SCE Charge Ready vendor
9.1
SCE understood your needs and challenges 9.4
SCE always responded to your questions and requests in a timely manner
9.5
SCE always took responsibility to completely address your issues 9.5
The information available from SCE to help you learn about the program
9.4
The overview meeting with SCE Account Representative 9.6
The variety of charging station brands / models on the Approved Package List
9.6
SCE Construction (e.g., trenching, conduit, etc.) 9.4
The Parking Survey completed by your employees or residents, if applicable
10.0
Average Satisfaction Score 9.2
DACs, which greatly exceeds the Pilot’s requirement to deploy
10% of charge ports in DACs.
Figure 2.21 Charge Ports in DACs and Non-DACs
During the Pilot, SCE conducted six outreach events in DACs to
support program enrollment. SCE employees who attended the
events provided an estimated 1,900 customer interactions. A full
list of the outreach events can be found in Appendix D.
2.9 Customer Satisfaction
Charge Ready invited its participants to complete customer
satisfaction surveys to determine how the program met
expectations. SCE uses Verint, a third-party online software
to deploy these surveys. SCE sent invitations to each
customer, with unique links so they could be identified in the
analysis. The survey invitation was sent to customer
participants approximately 10 to 12 weeks after their
charging stations were installed and verified by SCE to
allow customers ample time to use the charging stations.
Areas of questioning included overall satisfaction levels
with the Charge Ready program (1 – very dissatisfied to
10 – very satisfied) and satisfaction levels for the different
areas of the program. By the end of January 2018, SCE
sent survey invitations to 25 participants representing 34
sites. SCE received responses from 20 customers.
The table below shows the average satisfaction score
provided by the survey respondents. The program received
an average satisfaction score of 9.2. Based on feedback
from these completed projects, customers are highly
satisfied with the overall program and application process.
50%DAC43 projects, 535 ports
50%DAC43 projects, 535 ports
50%Non-DAC
27 projects, 531 ports
50%Non-DAC
27 projects, 531 ports
Charge Port DistributionDAC and Non-DAC
Customer Satisfaction | 32Charge Ready Phase 1 Program Pilot Report
The lowest average score of 8.0 was rated for charging
network pricing from SCE-approved vendors.
46 190 Pilot applicants were invited, including those with projects that did not move forward.

48 SCE’s program RFI documents detailed the standard stub out design. The customer’s selected EVSE vendor is responsible to provide and install the appropriate charging station base plate template.
49 Due to the Pilot’s short duration, SCE focused its spending on charging station infrastructure rather than a processing system to support the Pilot.
Table 2.14 Summary of Feedback Received from Pilot Approved Vendors and Customer Participants
Area of Focus Vendor Feedback Customer Feedback
Program Design • Marketing was done very well
• Customers liked SCE covering make-ready
infrastructure costs
• Easement process was long, recommends
moving it up in the process
• Heard concerns about customers not being able
to add more ports in the future (SCE installed
only the required infrastructure to support the
Pilot installations, which may not support future
charging station additions)
• Marketing was done very well
• Easement process was long, recommends
moving it up in the process
• Concerns about long-term commitment and
stations becoming obsolete47
• Minimum port count was a challenge at some
sites
• Would be easier if SCE offered package of
make-ready infrastructure options including charging
stations, which would eliminate the need for customer
procurement of charging stations
Base Cost and
Rebate• Some of the vendors’ confused the base cost with
the rebate amount
• Would prefer set rebate levels vs base cost
calculation
• Feels that utility is “getting in their business” by
requiring pricing information that is used to calculate
the base cost of charging stations
• Customers who attended the session had full
understanding of what base cost and rebate mean
• 100% rebate for Disadvantaged Communities
is great
Charging Station
and RFI• There is interest in Level 3 stations for faster
charging capabilities• Recommends not re-testing stations once
primary vendor is approved
• There is interest in Level 3 stations for faster
charging capabilities
Site Design and
Construction• Pre-construction meeting is great
• Some stub-outs48 did not match charging station
templates
• Pre-construction meeting is great
• Appreciates SCE’s attention to detail and
customer service
General • Time it took from application to completion is
long
• Recommends using API49 for monthly data pulls
versus Excel-based submissions
• Overwhelming positive feedback for all SCE
employees and general contractor interaction
• Application process and enrollment portal was
easy
• One customer noted that time to complete was long but
customer do not see SCE as the reason for any delays,
which occurred during customer requirement
submission stage50
Charge Ready Education and Outreach | 33Charge Ready Phase 1 Program Pilot Report
47 Some Pilot customers chose not to participate in the Pilot because of the 10-year commitment term. The concern was over the possibility of transfer of ownership of the site as well as equipment obsolescence prior to the end of the 10-year time period.
50 See Section 2.4.2 and 2.4.3 of this report for lessons learned on application process and requirements cycle time.
SCE plans to conduct additional customer surveys in Q3 2018 to learn about charging station fees, accessibility, and incremental
EV adoption. SCE will report its findings in the Advisory Board meetings and quarterly reports when available.
In addition, SCE hosted a vendor conference for charging station vendors participating in the Pilot on February 26, 2018. The
session was attended by 12 vendors. The following day, SCE hosted a customer-feedback session for Pilot customers that
was attended by 20 Pilot customers.46 The objective of both sessions was to learn about the vendors’ and customers’
experience in the Pilot and gather feedback for future programs. The following table summarizes the feedback received from
both sessions. Feedback will be used to improve requirements and processes of future programs.

51 https://on.sce.com/chargeready
• Direct Engagement: SCE Account Managers individually
reached out to a list of MUD customers that had been
screened as potential Charge Ready participants. During
the Pilot, there were 147 Account Manager interactions
with MUD customers.
• Targeted Marketing Collateral: SCE developed a MUD
Customer Fact Sheet articulating the value proposition
for MUDs to deploy EV charging, in general, and through
Charge Ready, in particular. The collateral was distributed
via email to 482 customers with an invitation to attend
a MUD workshop.
• MUD Customer Outreach Events: SCE conducted an
in-person meeting at SCE’s Energy Education Center on
August 30, 2016. SCE presented a program overview
and organized a meet-and-greet with the program’s
charging station vendors. Participating MUD customers
also learned about complementary financing opportunities
from representatives from CARB and the California State
Treasurer’s office (CPCFA/CalCAP).
SCE also started weekly MUD Virtual Workshops in Q4 2016
to educate MUDs about the Charge Ready program and other
available complementary EV programs. During the meetings,
SCE learned about the MUD customer segment through its
marketing and outreach approach. Low customer attendance
at the first two MUD Virtual Workshops changed the outreach
strategy from a mass message approach to a targeted, direct
engagement approach. SCE intended to reach large numbers of
MUD customers through the virtual workshops, but later found
direct engagement to be more effective in educating customers
about the program.
SCE discontinued the weekly MUD Virtual Workshops and,
instead, focused efforts on direct engagement with customers.
SCE’s direct interactions (phone, email, and in-person meetings)
with MUD customers revealed customers interested in charging
stations and also uncovered reasons why some MUD customers
were not interested in the program. For the customers interested
in the program, SCE focused resources to support these
customers during in the enrollment process. For customers not
interested in the program, SCE gathered customer feedback to
inform a future Phase 2 MUD outreach strategy. The following
chart summarizes the feedback from 71 MUD customers who
indicated their reasons for not participating in the program.
Figure 2.22 Reasons for MUDs Declining to Participate in
Charge Ready
2.10.4 Overall SuccessesCharge Ready Pi lot marketing created overwhelming
customer and vendor interest, gaining favorable feedback
from vendors and customers as described in Section 2.9
Customer Satisfaction. In addit ion, the effectiveness of
the multi -media marketing was proven two weeks after
launch; the program had already received a total of 183
applications. SCE communicated the detai ls of a complex,
months-long project in a simple, easy-to-fol low manner.
Due to signif icant interest in the program, SCE stopped
accepting new applications seven months after launch.
334 customers had submitted applications to have 2,043
EV charging stations instal led on their property when SCE
23
17
1311
5
2
0
5
10
15
20
25
Chargingstations arelow priority
Lack orunknownutilization
Customernot interested
Site did notmeet programrequirements
Parkingmanagement
issues
Participated ina differentprogram
Reasons for Non - Participation in MUDs
Charge Ready Education and Outreach | 34Charge Ready Phase 1 Program Pilot Report
SCE shared the MUD fact sheet and other targeted marketing
materials developed during Q3 2016.
2.10 Charge Ready Education and Outreach2.10.1 OverviewCharge Ready education and outreach efforts were designed to promote the Pilot to SCE customers. SCE also tested marketing
channels in preparation for a subsequent phase of Charge Ready,
including email, website, social media, collateral, and account
manager interaction. SCE developed content to
communicate to potential customer participants about the Pilot,
and highlighted key areas such as eligible rates, bill impact
analyses, metering options, EV infrastructure, access to subject
matter expert resources, and EVSE information. SCE also
developed marketing materials to provide relevant program
information and help customers through the application process.
The Charge Ready program landing page51 is the main resource
for customers to learn about the Pilot and submit their
applications. A full list of the Charge Ready marketing materials,
along with their descriptions, can be found in Appendix E.
2.10.2 Outreach EventsSCE conducted 38 outreach events during the Pilot to support
program enrollment. SCE employees who attended the events
provided an estimated 6,281 customer interactions. A full list of
the outreach events can be found in Appendix D.
2.10.3 Multi-Unit Dwelling OutreachIn Q3 2016, SCE focused some of its Charge Ready marketing
efforts toward the MUD market segment. To increase MUD
customer enrollment in Charge Ready, SCE developed a customer
outreach and engagement plan, including:

stopped accepting new applications. SCE expects to add approximately 175 addit ional ports with the recently
released funds previously reserved for completed sites.
52 Using estimated costs. 53 D.16-01-023, p. 59. 54 In 2014 dollars. 55 In nominal dollars. 56 In comparison to Authorized/Planning Assumptions.
2.10.5 Charge Ready Education and Outreach Lessons Learned and Potential Improvements
During the Pilot, SCE learned that there is no “one-size-fits-all” marketing campaign or outreach that works for all segments of the Charge
Ready program. Especially with MUDs, SCE learned that much more education is required for both residents and MUD owners. SCE
will take a more holistic approach in educating these customers, combining messages on safety, EVs, charging, and EVSE education.
2.11 Pilot Costs
Through the execution of the Charge Ready pilot SCE discovered several ways to manage the cost of delivering electric vehicle charging
infrastructure to the customer such as:
• Executing concurrent steps to reduce overall timeline and example is obtaining SCE and GC permits in parallel
• Scheduling site inspections strategically to reduce drive time and onsite presence to reduce design costs and inspector hours
that are billed to the program
• New messaging was developed to improve efforts to educate the customers and suggest installations in parking areas that
have the greatest chance of qualifying on the original site visit resulting in the reduction of follow-up site visits and associated
costs
• Establishing cost thresholds52 for various segments to manage program costs and to fulfill demographic goals of 10% of
infrastructure installed in DACs
° DAC charge ports are by nature more expensive due to the 5-port minimum – allocating fixed costs amongst a smaller number
of ports – initially $30,000 was allocated per port for this segment; if DAC successes continue this allocation will no longer be
necessary to achieve goals in DACs.
° Non-DAC (and DAC after 10% achieved) threshold allocated remaining capital to Non-DAC ports – threshold was set at
approximately $15,000 per port
The CPUC approved SCE’s proposal to establish a Charge Ready Program balancing account to recover the revenue requirements
associated with up to $22 million in direct capital and O&M costs to implement Phase 1 of the Charge Ready and Market Education
Programs.53 The following table summarizes the Pilot’s spend at the time of this report.
Table 2.15 Pilot Costs
VariablesAuthorized/Planning
Assumptions54
2/28/18 Inception-to-date55 Remaining56 Percentage
RemainingCapital
Utility-Side Infrastructure Costs $3,353,532 $1,225,388 $2,128,144 63%
Customer-Side Infrastructure Costs $7,586,387 $8,352,551 ($766,164) -10%
Easement $115,942 $120,425 ($4,483) -4%
Station Testing $30,000 $60,393 ($30,393) -101%
BCD Labor $103,500 $108,776 ($5,276) -5%
PMO Labor $460,003 $686,212 ($226,209) -49%
Total Capital $11,649,364 $10,553,746 $1,095,618 9%
Operations & Maintenance
Rebate $5,850,000 $480,931 $5,369,070 92%
BCD Labor $51,750 $57,099 ($5,349) -10%
Transportation Electrification Advisory Services $316,800 $265,019 $51,781 16%
Pilot Costs | 35Charge Ready Phase 1 Program Pilot Report
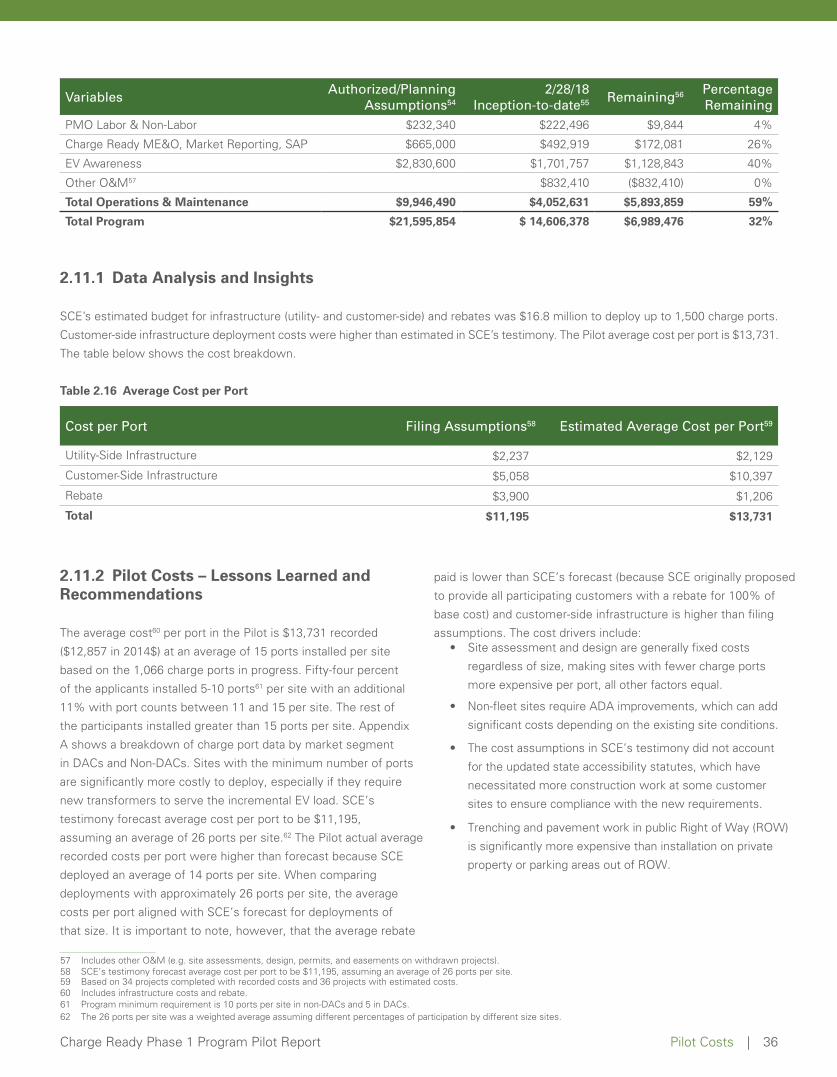
57 Includes other O&M (e.g. site assessments, design, permits, and easements on withdrawn58 SCE’s testimony forecast average cost per port to be $11,195, assuming an average of 26 ports per site.
projects).
59 Based on 34 projects completed with recorded costs and 36 projects with estimated costs. 60 Includes infrastructure costs and rebate. 61 Program minimum requirement is 10 ports per site in non-DACs and 5 in DACs. 62 The 26 ports per site was a weighted average assuming different percentages of participation by different size sites.
VariablesAuthorized/Planning
Assumptions54
2/28/18 Inception-to-date55 Remaining56 Percentage
RemainingPMO Labor & Non-Labor $232,340 $222,496 $9,844 4%
Charge Ready ME&O, Market Reporting, SAP $665,000 $492,919 $172,081 26%
EV Awareness $2,830,600 $1,701,757 $1,128,843 40%
Other O&M57 $832,410 ($832,410) 0%
Total Operations & Maintenance $9,946,490 $4,052,631 $5,893,859 59%
Total Program $21,595,854 $ 14,606,378 $6,989,476 32%
2.11.1 Data Analysis and Insights
SCE’s estimated budget for infrastructure (utility- and customer-side) and rebates was $16.8 million to deploy up to 1,500 charge ports.
Customer-side infrastructure deployment costs were higher than estimated in SCE’s testimony. The Pilot average cost per port is $13,731.
The table below shows the cost breakdown.
Table 2.16 Average Cost per Port
Cost per Port Filing Assumptions58 Estimated Average Cost per Port59
Utility-Side Infrastructure $2,237 $2,129
Customer-Side Infrastructure $5,058 $10,397
Rebate $3,900 $1,206
Total $11,195 $13,731
2.11.2 Pilot Costs – Lessons Learned and Recommendations
The average cost60 per port in the Pilot is $13,731 recorded
($12,857 in 2014$) at an average of 15 ports installed per site
based on the 1,066 charge ports in progress. Fifty-four percent
of the applicants installed 5-10 ports61 per site with an additional
11% with port counts between 11 and 15 per site. The rest of
the participants installed greater than 15 ports per site. Appendix
A shows a breakdown of charge port data by market segment
in DACs and Non-DACs. Sites with the minimum number of ports
are significantly more costly to deploy, especially if they require
new transformers to serve the incremental EV load. SCE’s
testimony forecast average cost per port to be $11,195,
assuming an average of 26 ports per site.62 The Pilot actual average
recorded costs per port were higher than forecast because SCE
deployed an average of 14 ports per site. When comparing
deployments with approximately 26 ports per site, the average
costs per port aligned with SCE’s forecast for deployments of
that size. It is important to note, however, that the average rebate
paid is lower than SCE’s forecast (because SCE originally proposed
to provide all participating customers with a rebate for 100% of
base cost) and customer-side infrastructure is higher than filing
assumptions. The cost drivers include:
Pilot Costs | 36Charge Ready Phase 1 Program Pilot Report
• Site assessment and design are generally fixed costs
regardless of size, making sites with fewer charge ports
more expensive per port, all other factors equal. • Non-fleet sites require ADA improvements, which can add
significant costs depending on the existing site conditions.
• The cost assumptions in SCE’s testimony did not account
for the updated state accessibility statutes, which have
necessitated more construction work at some customer
sites to ensure compliance with the new requirements.
• Trenching and pavement work in public Right of Way (ROW)
is significantly more expensive than installation on private
property or parking areas out of ROW.

63 The infrastructure and equipment behind a customer’s primary metering cabinet is customer-owned. SCE does not serve new load from a customer-owned transformer. This did not exclude a primary-metered customer from participating if their site had another viable SCE power source that was within the program budget.
64 Permitting fees in the Pilot ranges from $0.00 to $10,673.55.
Other infrastructure cost drivers include:• Sites that were primary metered63 were not approved in
the program. SCE found it too costly to bring power to
proposed charging station location in these sites. This
would require creating a parallel line extension from
upstream SCE facilities to feed the proposed charging
site.
AHJ constraints – the costs associated with municipality
fee requirements or other jurisdictional constraints varied
by jurisdiction, and influenced site viability. Permitting64 can
be variable if the AHJ charges based on site value rather
than fixed-plan-review pricing.
• K-12 school sites requiring Division of the State Architect (DSA) inspection incur an additional $5,000 to $6,000 per
site in inspection fees.
• Underground parking garages presented challenges,
such as non-level grades, space constraints, and height
restrictions, to serve power primarily due to AHJ
requirements that required significant civil work to bring
sites into compliance.
• Parking structures and sites that may accommodate
surface-mounted conduits represent significant
savings since there is minimal site restoration work
following installation.
° However, older parking structures present difficulties
with current ADA code and may be too costly.
• Site conditions and construction complexity – in some
cases, SCE found site conditions added significant costs.
Examples included:
° Older buildings with parking lots that would require
large investment to conform to AHJ requirements,
such as ADA and state accessibility statutes.
° Poor customer parking lot conditions required
restoring the entire parking lot.
° Proximity – longer distances from charging station
sites to existing transformers increased trenching and
boring costs.
2.12 Pilot Summary
Charge Ready Phase 1 successfully met its objectives. SCE
deployed infrastructure to support 941 charge port to date,
half of this total in DACs, and expects to deploy infrastructure
to support approximately 1,250 charge ports by the Pilot’s
completion. SCE also developed and improved processes
to qualify a wide range of charging stations and vendors.
The Pilot produced real-life data on the time and costs to
deploy EV charging infrastructure.
SCE discovered that MUDs are interested in participating in
the Pilot and also identified barriers for this segment, such
as lack of assignable parking space and expensive parking
upgrade requirements triggered by EVSE installations.
SCE was also able to meet its objective of deploying
DR-compatible EVSEs and is using these devices to develop
an effective DR program for this market through the execution
of the Charge Ready DR pilot. This pilot is currently underway
and is necessary for SCE to study charging patterns and develop
an effective DR program.
The Pilot proved customers are interested in utility-owned EV
charging infrastructure with the expected deployment of
approximately 1,250 charge ports by the end of the Pilot.
Customers also provided their satisfaction with the program
(an average customer satisfaction rating of 9.2 (1 – very
dissatisfied to 10 – very satisfied) as described in Section 2.9
Customer Satisfaction).
The Market Education program revealed that enhanced public
EV education is necessary to help customers understand program
benefits. SCE also discovered that business customers need
additional assistance from their trusted energy advisors.
SCE plans to file an application for Phase 2 approval. In that
phase, SCE will propose changes based on lessons learned
during Phase 1.
Pilot Summary | 37Charge Ready Phase 1 Program Pilot Report
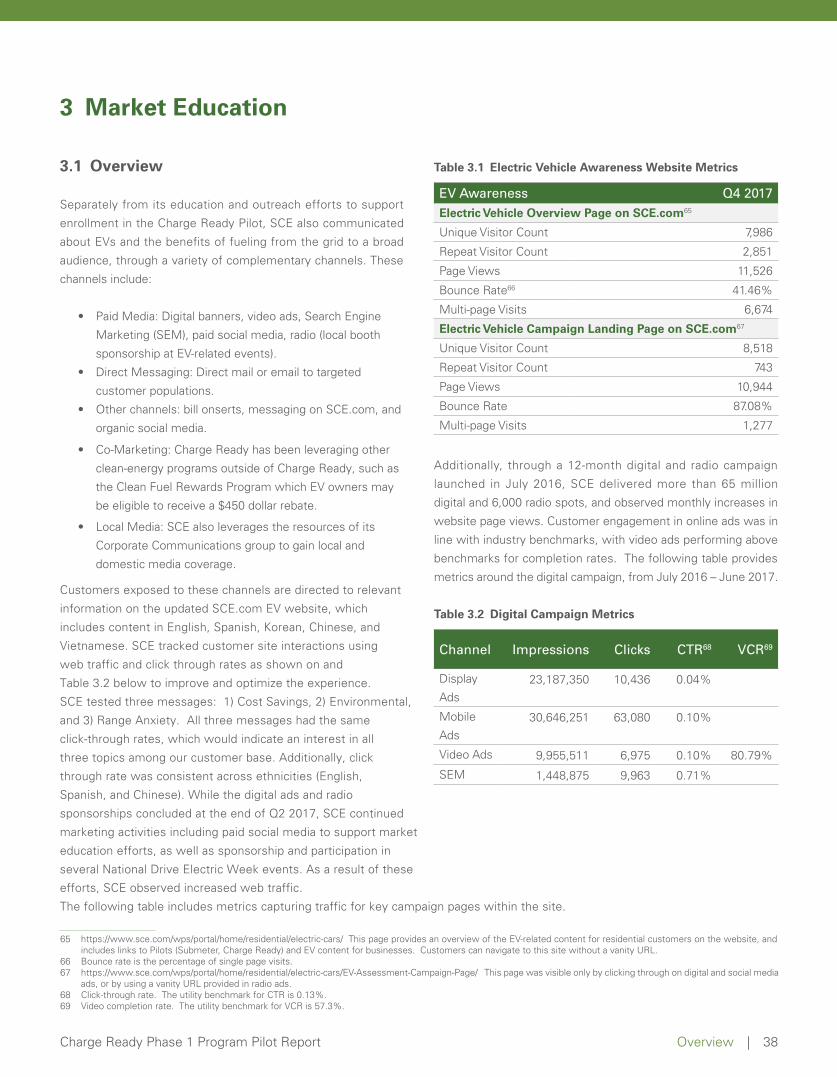
65 https://www.sce.com/wps/portal/home/residential/electric-cars/ This page provides an overview of the EV-related content for residential customers on the website, and includes links to Pilots (Submeter, Charge Ready) and EV content for businesses. Customers can navigate to this site without a vanity URL.
66 Bounce rate is the percentage of single page visits. 67 https://www.sce.com/wps/portal/home/residential/electric-cars/EV-Assessment-Campaign-Page/ This page was visible only by clicking through on digital and social media
ads, or by using a vanity URL provided in radio ads. 68 Click-through rate. The utility benchmark for CTR is 0.13%. 69 Video completion rate. The utility benchmark for VCR is 57.3%.
3 Market Education
3.1 Overview
Separately from its education and outreach efforts to support
enrollment in the Charge Ready Pilot, SCE also communicated
about EVs and the benefits of fueling from the grid to a broad
audience, through a variety of complementary channels. These
channels include:
• Paid Media: Digital banners, video ads, Search Engine
Marketing (SEM), paid social media, radio (local booth
sponsorship at EV-related events).
• Direct Messaging: Direct mail or email to targeted
customer populations.
• Other channels: bill onserts, messaging on SCE.com, and
• Co-Marketing: Charge Ready has been leveraging other
clean-energy programs outside of Charge Ready, such as
the Clean Fuel Rewards Program which EV owners may
be eligible to receive a $450 dollar rebate.
• Local Media: SCE also leverages the resources of its
Corporate Communications group to gain local and
domestic media coverage.
organic social media.
Customers exposed to these channels are directed to relevant
information on the updated SCE.com EV website, which
includes content in English, Spanish, Korean, Chinese, and
Vietnamese. SCE tracked customer site interactions using
web traffic and click through rates as shown on and
Table 3.2 below to improve and optimize the experience.
SCE tested three messages: 1) Cost Savings, 2) Environmental,
and 3) Range Anxiety. All three messages had the same
click-through rates, which would indicate an interest in all
three topics among our customer base. Additionally, click
through rate was consistent across ethnicities (English,
Spanish, and Chinese). While the digital ads and radio
sponsorships concluded at the end of Q2 2017, SCE continued
marketing activities including paid social media to support market
education efforts, as well as sponsorship and participation in
several National Drive Electric Week events. As a result of these
efforts, SCE observed increased web traffic.
The following table includes metrics capturing traffic for key campaign pages within the site.
Table 3.1 Electric Vehicle Awareness Website Metrics
EV Awareness Q4 2017Electric Vehicle Overview Page on SCE.com65
Unique Visitor Count 7,986
Repeat Visitor Count 2,851
Page Views 11,526
Bounce Rate66 41.46%
Multi-page Visits 6,674
Electric Vehicle Campaign Landing Page on SCE.com67
Unique Visitor Count 8,518
Repeat Visitor Count 743
Page Views 10,944
Bounce Rate 87.08%
Multi-page Visits 1,277
Additionally, through a 12-month digital and radio campaign
launched in July 2016, SCE delivered more than 65 million
digital and 6,000 radio spots, and observed monthly increases in
website page views. Customer engagement in online ads was in
line with industry benchmarks, with video ads performing above
benchmarks for completion rates. The following table provides
metrics around the digital campaign, from July 2016 – June 2017.
Table 3.2 Digital Campaign Metrics
Channel Impressions Clicks CTR68 VCR69
Display
Ads23,187,350 10,436 0.04%
Mobile
Ads30,646,251 63,080 0.10%
Video Ads 9,955,511 6,975 0.10% 80.79%
SEM 1,448,875 9,963 0.71%
Overview | 38Charge Ready Phase 1 Program Pilot Report
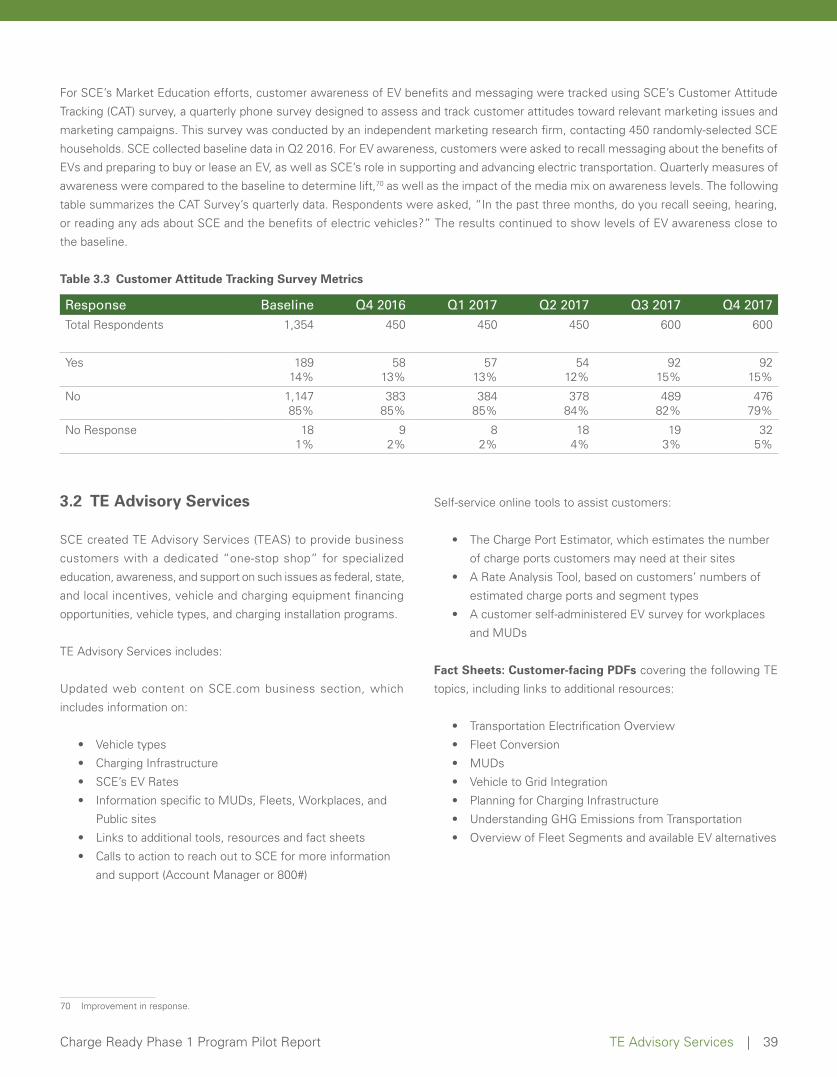
70 Improvement in response.
For SCE’s Market Education efforts, customer awareness of EV benefits and messaging were tracked using SCE’s Customer Attitude
Tracking (CAT) survey, a quarterly phone survey designed to assess and track customer attitudes toward relevant marketing issues and
marketing campaigns. This survey was conducted by an independent marketing research firm, contacting 450 randomly-selected SCE
households. SCE collected baseline data in Q2 2016. For EV awareness, customers were asked to recall messaging about the benefits of
EVs and preparing to buy or lease an EV, as well as SCE’s role in supporting and advancing electric transportation. Quarterly measures of
awareness were compared to the baseline to determine lift,70 as well as the impact of the media mix on awareness levels. The following
table summarizes the CAT Survey’s quarterly data. Respondents were asked, “In the past three months, do you recall seeing, hearing,
or reading any ads about SCE and the benefits of electric vehicles?” The results continued to show levels of EV awareness close to
the baseline.
Table 3.3 Customer Attitude Tracking Survey Metrics
Response Baseline Q4 2016 Q1 2017 Q2 2017 Q3 2017 Q4 2017Total Respondents 1,354 450 450 450 600 600
Yes 18914%
5813%
5713%
5412%
9215%
9215%
No 1,14785%
38385%
38485%
37884%
48982%
47679%
No Response 181%
92%
82%
184%
193%
325%
3.2 TE Advisory Services
SCE created TE Advisory Services (TEAS) to provide business
customers with a dedicated “one-stop shop” for specialized
education, awareness, and support on such issues as federal, state,
and local incentives, vehicle and charging equipment financing
opportunities, vehicle types, and charging installation programs.
TE Advisory Services includes:
Updated web content on SCE.com business section, which
includes information on:
• Vehicle types
• Charging Infrastructure
• SCE’s EV Rates
• Information specific to MUDs, Fleets, Workplaces, and
Public sites
• Links to additional tools, resources and fact sheets
• Calls to action to reach out to SCE for more information
and support (Account Manager or 800#)
Self-service online tools to assist customers:
• The Charge Port Estimator, which estimates the number
of charge ports customers may need at their sites
• A Rate Analysis Tool, based on customers’ numbers of
estimated charge ports and segment types
• A customer self-administered EV survey for workplaces
and MUDs
Fact Sheets: Customer-facing PDFs covering the following TE
topics, including links to additional resources:
• Transportation Electrification Overview
• Fleet Conversion
• MUDs
• Vehicle to Grid Integration
• Planning for Charging Infrastructure
• Understanding GHG Emissions from Transportation
• Overview of Fleet Segments and available EV alternatives
TE Advisory Services | 39Charge Ready Phase 1 Program Pilot Report
In addition to the above, TE Advisory Services launched
in-person services for approximately 25 business customers
in Q1 2018. Services included the following
• An initial fleet assessment (including GHG savings
calculations) to help customers evaluate business cases
for converting fleets of vehicles to TE technology
• Infrastructure Assessments to assist customers in
evaluating a potential deployment of charging equipment
Customers selected were those who had shown a commitment
to sustainability, potential for a larger scale conversion/
deployment, and had participated in multiple discussions with
their Account Managers to confirm their interest in TE. A
combination of government entities and commercial businesses
were selected to include a representative mix of customers.
SCE is tracking web traffic and has established the following
baselines presented in the table below to compare against as
more outreach is conducted.
Table 3.4 TEAS web traffic
Q4 2017: Baseline
Metric Workplace Public Fleet MUDUnique
Visitor Count
292 121 138 69
Page Views 507 188 281 162
Multi-Page 346 143 165 111
3.3 Market Education Lessons Learned and Recommendations
The EV Market Education and Outreach effort was designed to
raise awareness and provide education on the benefits of EVs
and fueling from the grid. The campaign was not developed as
an enrollment campaign. The campaign was developed to
establish a baseline for awareness and to learn about effective
marketing strategies to inform the future phase of the program.
The EV awareness campaign cost $1.5 million, and was in the
market for 12 months.
This limited spending and time in the market was not enough
to build momentum for large gains in awareness. SCE maintained
awareness levels at or around 14%; however, to increase
awareness, a larger media spend level should be implemented
over a longer duration.
Future media campaigns would also benefit from additional
channels to enable a broader reach, such as out-of-home
(billboards), television, or print.
Market Education Lessons Learned and Recommendations | 40Charge Ready Phase 1 Program Pilot Report
71 Schedule CRPP. 72 See http://www3.sce.com/sscc/law/dis/dbattach5e.nsf/0/64403AD51EE6896F882580AC000B520F/$FILE/A1701XXX-SCE%202018-2022%20DR%20Testimony%20Vol %202%20Chap.%203-13.pdf “SOUTHERN CALIFORNIA EDISON COMPANY’S (U 338-E) TESTIMONY IN SUPPORT OF ITS APPLICATION FOR APPROVAL OF ITS 2018 – 2022 DEMAND RESPONSE PROGRAMS: VOLUME 2 – SCE’S 2018 – 2022 PROPOSED DEMAND RESPONSE PROGRAMS BY CATEGORY”, 1/17/2017, p 45-55. 73 https://www.caiso.com/Documents/FlexibleResourcesHelpRenewables_FastFacts.pdf 74 Advice Letter 3773-E, “Southern California Edison Company’s Charge Ready Demand Response Pilot Plan, Pursuant to Decisions 16-01-023 and 17-12-003”.
4 Demand Response Pilot
4.1 Demand Response Pilot Overview
SCE required all customer participants with Level 2 charging
stations to participate in future DR programs designed in
connection with the Program and approved by the Commission.71
SCE also required all Level 2 charging stations to be DR-capable
(i.e., capable of receiving and executing real-time instructions to
throttle, and/or modify the end-user pricing of EV charging load)
and encouraged those charging stations to include additional load
management features (e.g., EV charging sequencing or sharing).
All Level 2 charging stations qualified for the Pilot have DR
communication capabilities built directly into the charging station
(Type A) or communication through a gateway device to the
charging station (Type B). The different types of charging stations
installed as part of the Pilot have gone through rigorous testing
by SCE’s ATO, and the communication capabilities will be tested
further during the Charge Ready DR Pilot72 that will launch in Q2
2018.
To participate in the Charge Ready Pilot, customers must, at
their own expense, procure, own, install, operate, and maintain
the charging stations in working order at their originally-installed
locations for the entire 10-year term of participation, in accordance
with Schedule CRPP. Based on charging station procurement
documents submitted by customers during the Step 3 process,
some customers chose to pay for maintenance packages and
extended warranty coverage from the EVSE suppliers.
With the rapid increase of renewable energy sources in California,
an imbalance of load-to-energy is emerging. To mitigate the
impacts of this “duck curve,”73 SCE’s Charge Ready DR Pilot
events will attempt to shift load to periods of high solar generation
during spring and winter months, and decrease load during steep
ramping periods that occur in late afternoons and evenings during
summer months. In addition, SCE has proposed new time-of-use
(TOU) rates that better align with the needs of the electric grid,
with on-peak time periods beginning in the evening hours when
solar generation is decreasing and typical net customer electricity
use is highest. These new TOU rates also shift off-peak time
periods to morning and afternoon hours when solar generation is
maximized. Although the DR Charge Ready Pilot will begin before
these new TOU rates are in place, the program was designed in
consideration of these potential new rates in an effort to limit the
need for future major program modifications.
4.2 Pricing Model Overview
All Level 2 Charge Ready customers will participate in a DR Pilot
beginning in the spring of 2018. Customers will be incented based
on participating in two different types of test events:
1. Load Shift events, in which customers receive a
discounted rate for charging during a time of high solar
generation and potential negative prices by shifting
charging from early morning to midday.
2. Traditional DR events, in which customers receive
incentives for consuming less electricity during
peak times, or during periods of steep ramping of
electricity demand.
The Charge Ready DR Pilot plans to test both incentives and
controls to influence charging behavior of EV drivers. A more
detailed description can be found in SCE’s Charge Ready DR
Advice letter.74
Demand Response Pilot Overview | 41Charge Ready Phase 1 Program Pilot Report
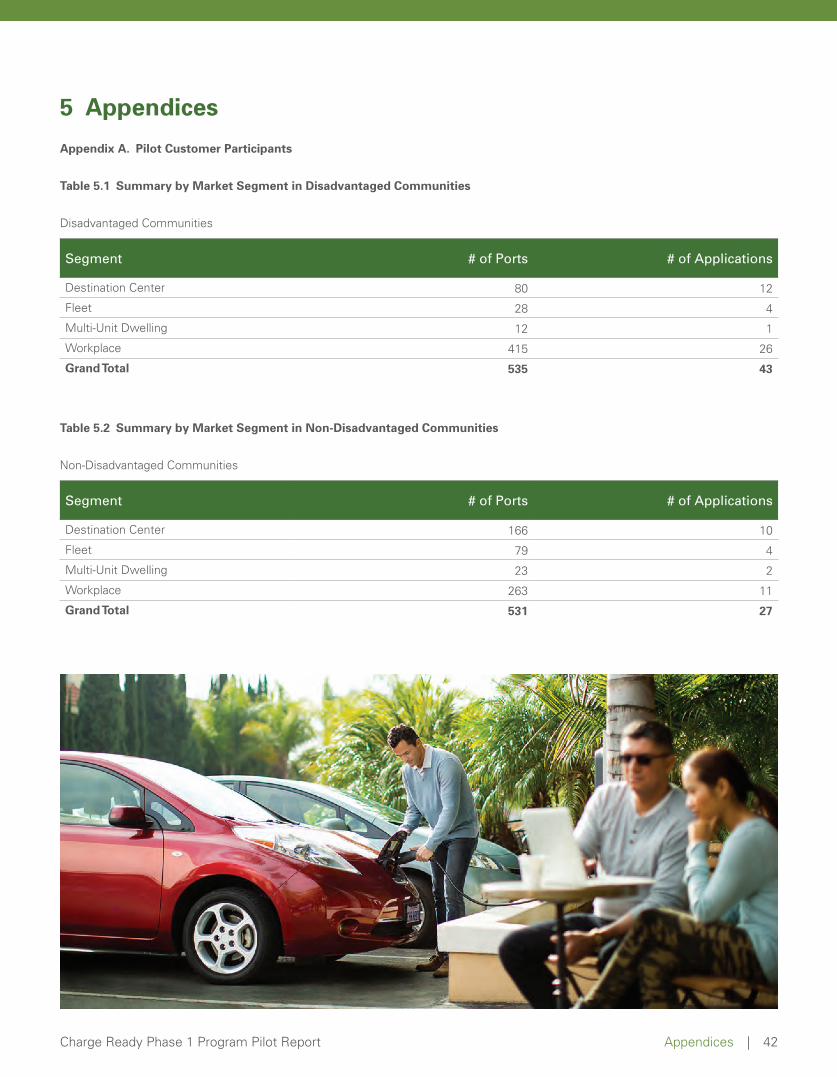
5 Appendices
Appendix A. Pilot Customer Participants
Table 5.1 Summary by Market Segment in Disadvantaged Communities
Disadvantaged Communities
Segment # of Ports # of Applications
Destination Center 80 12
Fleet 28 4
Multi-Unit Dwelling 12 1
Workplace 415 26
Grand Total 535 43
Table 5.2 Summary by Market Segment in Non-Disadvantaged Communities
Non-Disadvantaged Communities
Segment # of Ports # of Applications
Destination Center 166 10
Fleet 79 4
Multi-Unit Dwelling 23 2
Workplace 263 11
Grand Total 531 27
Appendices | 42Charge Ready Phase 1 Program Pilot Report
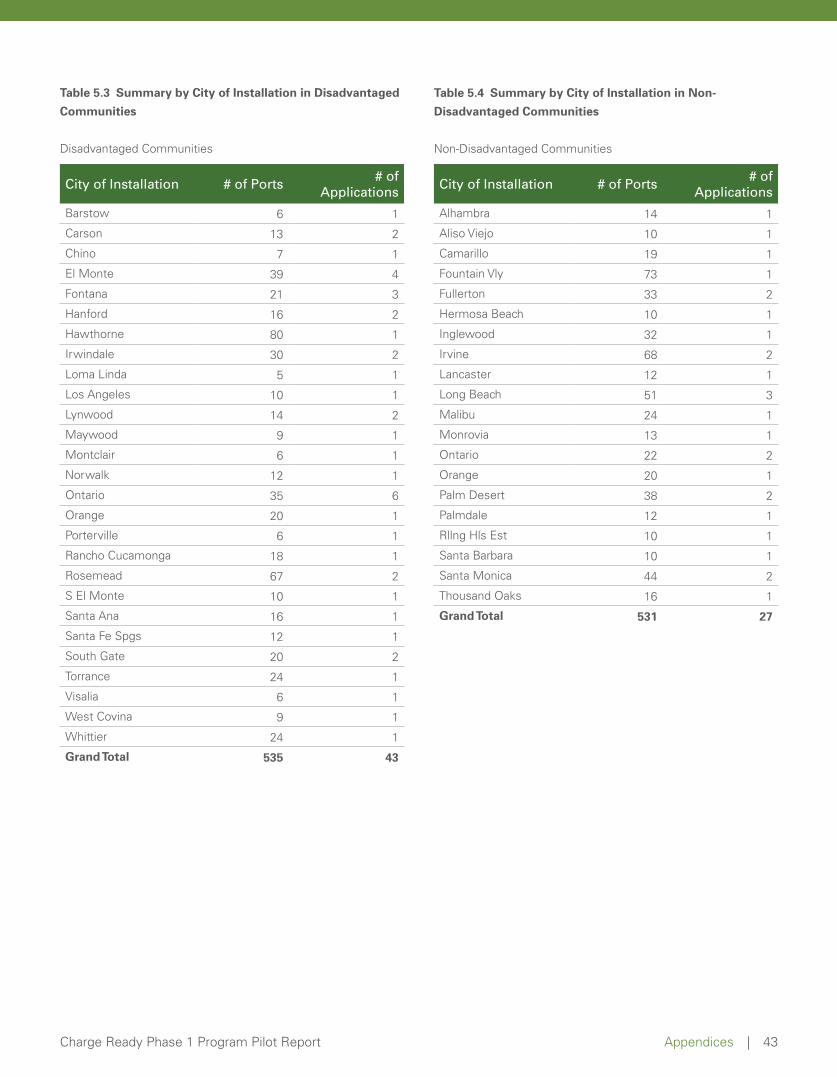
Table 5.3 Summary by City of Installation in Disadvantaged
Communities
Disadvantaged Communities
City of Installation # of Ports# of
Applications
Barstow 6 1
Carson 13 2
Chino 7 1
El Monte 39 4
Fontana 21 3
Hanford 16 2
Hawthorne 80 1
Irwindale 30 2
Loma Linda 5 1
Los Angeles 10 1
Lynwood 14 2
Maywood 9 1
Montclair 6 1
Norwalk 12 1
Ontario 35 6
Orange 20 1
Porterville 6 1
Rancho Cucamonga 18 1
Rosemead 67 2
S El Monte 10 1
Santa Ana 16 1
Santa Fe Spgs 12 1
South Gate 20 2
Torrance 24 1
Visalia 6 1
West Covina 9 1
Whittier 24 1
Grand Total 535 43
Table 5.4 Summary by City of Installation in Non-
Disadvantaged Communities
Non-Disadvantaged Communities
City of Installation # of Ports# of
Applications
Alhambra 14 1
Aliso Viejo 10 1
Camarillo 19 1
Fountain Vly 73 1
Fullerton 33 2
Hermosa Beach 10 1
Inglewood 32 1
Irvine 68 2
Lancaster 12 1
Long Beach 51 3
Malibu 24 1
Monrovia 13 1
Ontario 22 2
Orange 20 1
Palm Desert 38 2
Palmdale 12 1
Rllng Hls Est 10 1
Santa Barbara 10 1
Santa Monica 44 2
Thousand Oaks 16 1
Grand Total 531 27
Appendices | 43Charge Ready Phase 1 Program Pilot Report
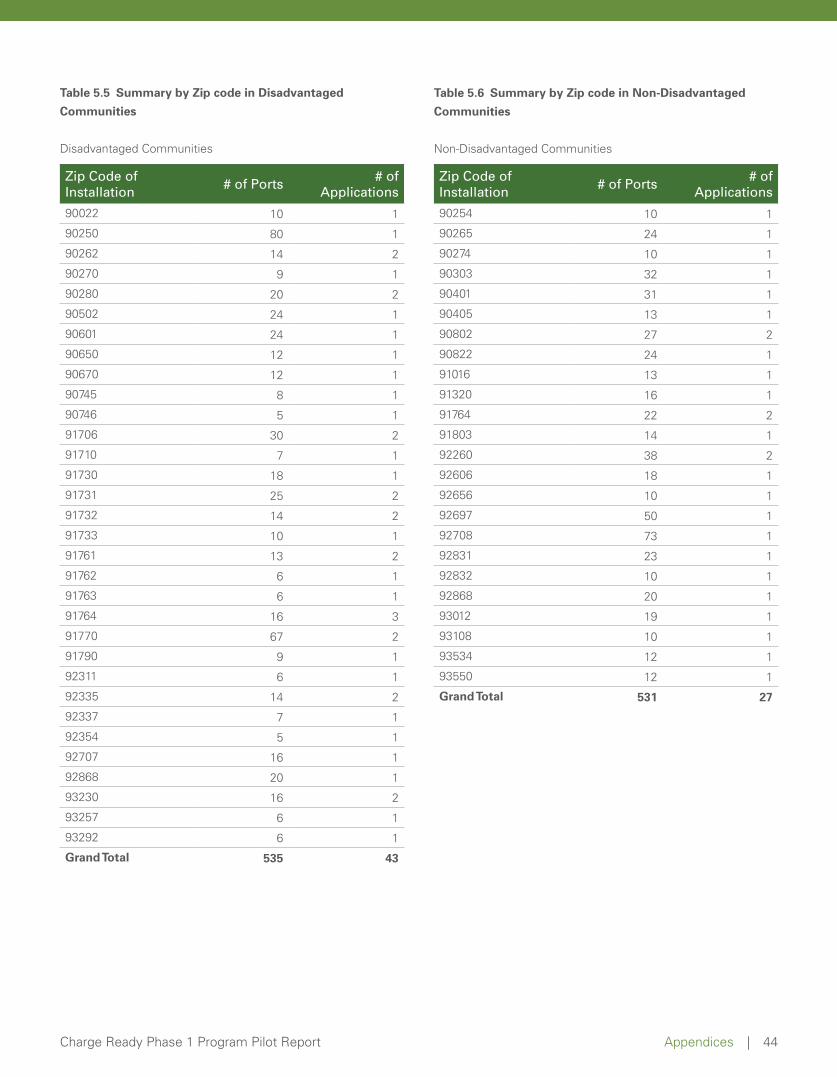
Table 5.5 Summary by Zip code in Disadvantaged
Communities
Disadvantaged Communities
Zip Code of Installation
# of Ports# of
Applications
90022 10 1
90250 80 1
90262 14 2
90270 9 1
90280 20 2
90502 24 1
90601 24 1
90650 12 1
90670 12 1
90745 8 1
90746 5 1
91706 30 2
91710 7 1
91730 18 1
91731 25 2
91732 14 2
91733 10 1
91761 13 2
91762 6 1
91763 6 1
91764 16 3
91770 67 2
91790 9 1
92311 6 1
92335 14 2
92337 7 1
92354 5 1
92707 16 1
92868 20 1
93230 16 2
93257 6 1
93292 6 1
Grand Total 535 43
Table 5.6 Summary by Zip code in Non-Disadvantaged
Communities
Non-Disadvantaged Communities
Zip Code of Installation
# of Ports# of
Applications
90254 10 1
90265 24 1
90274 10 1
90303 32 1
90401 31 1
90405 13 1
90802 27 2
90822 24 1
91016 13 1
91320 16 1
91764 22 2
91803 14 1
92260 38 2
92606 18 1
92656 10 1
92697 50 1
92708 73 1
92831 23 1
92832 10 1
92868 20 1
93012 19 1
93108 10 1
93534 12 1
93550 12 1
Grand Total 531 27
Appendices | 44Charge Ready Phase 1 Program Pilot Report

75 Business Days. 76 Based on 35 projects with rebate paid. 77 Based on 35 projects with rebate paid. 78 Based on 35 projects with rebate paid.
Table 5.7 Multi-Unit Dwelling Summary by City of Installation
Multi-Unit Dwelling
City of InstallationNumber of
Charge Ready Ports
Number of Charge Ready Applications
Disadvantaged Community
Property Type
Rolling Hills Estates 10 1 No Condominiums
Santa Fe Springs 12 1 Yes Apartments
Santa Monica 13 1 No Apartments
Total 35 3
Appendix B. Pilot Operational Metrics
Table 5.8 Pilot Cycle Times75
Pilot Cycle Times
Average customer "end-to-end" cycle time, by segment 33776
Minimum customer “end-to-end” cycle time, by segment 21177
Maximum customer “end-to-end” cycle time, by segment 43278
Average time for Application Received to Initial Qualification 37
Average time for Initial Qualification to Site Assessment Completion 43
Average time for Site Assessment Completion to Program Agreement Complete 72
Average time to complete base map 9
Average time to complete preliminary design 35
Average time from Preliminary Design Sent to customer to Preliminary Design Approved 11
Average time to complete T&D final design 17
Average time for Final Design Received to Permit Requested 9
Average time for Permit Requested to Permit Approved 36
Average time for Permit Approved to Ready to Break Ground 27
Average time from Ready to Break Ground to Final Inspection Completed 66
Average time from Final Inspection Completed to Rebate Check Issued 45
Appendices | 45Charge Ready Phase 1 Program Pilot Report
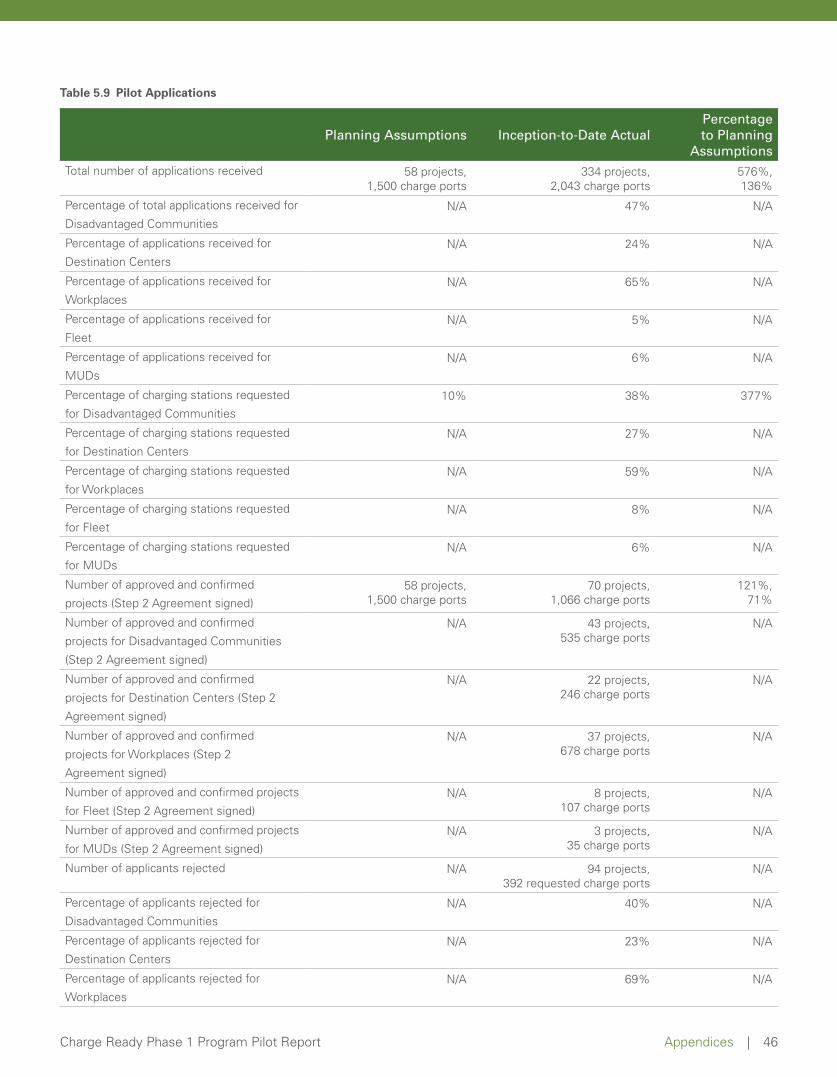
Table 5.9 Pilot Applications
Planning Assumptions Inception-to-Date ActualPercentage to Planning
AssumptionsTotal number of applications received 58 projects,
1,500 charge ports334 projects,
2,043 charge ports576%,136%
Percentage of total applications received for
Disadvantaged CommunitiesN/A 47% N/A
Percentage of applications received for
Destination CentersN/A 24% N/A
Percentage of applications received for
WorkplacesN/A 65% N/A
Percentage of applications received for
FleetN/A 5% N/A
Percentage of applications received for
MUDsN/A 6% N/A
Percentage of charging stations requested
for Disadvantaged Communities10% 38% 377%
Percentage of charging stations requested
for Destination CentersN/A 27% N/A
Percentage of charging stations requested
for WorkplacesN/A 59% N/A
Percentage of charging stations requested
for FleetN/A 8% N/A
Percentage of charging stations requested
for MUDsN/A 6% N/A
Number of approved and confirmed
projects (Step 2 Agreement signed)58 projects,
1,500 charge ports70 projects,
1,066 charge ports121%,
71%
Number of approved and confirmed
projects for Disadvantaged Communities
(Step 2 Agreement signed)
N/A 43 projects,535 charge ports
N/A
Number of approved and confirmed
projects for Destination Centers (Step 2
Agreement signed)
N/A 22 projects,246 charge ports
N/A
Number of approved and confirmed
projects for Workplaces (Step 2
Agreement signed)
N/A 37 projects,678 charge ports
N/A
Number of approved and confirmed projects
for Fleet (Step 2 Agreement signed)N/A 8 projects,
107 charge portsN/A
Number of approved and confirmed projects
for MUDs (Step 2 Agreement signed)N/A 3 projects,
35 charge portsN/A
Number of applicants rejected N/A 94 projects,392 requested charge ports
N/A
Percentage of applicants rejected for
Disadvantaged CommunitiesN/A 40% N/A
Percentage of applicants rejected for
Destination CentersN/A 23% N/A
Percentage of applicants rejected for
WorkplacesN/A 69% N/A
Appendices | 46Charge Ready Phase 1 Program Pilot Report
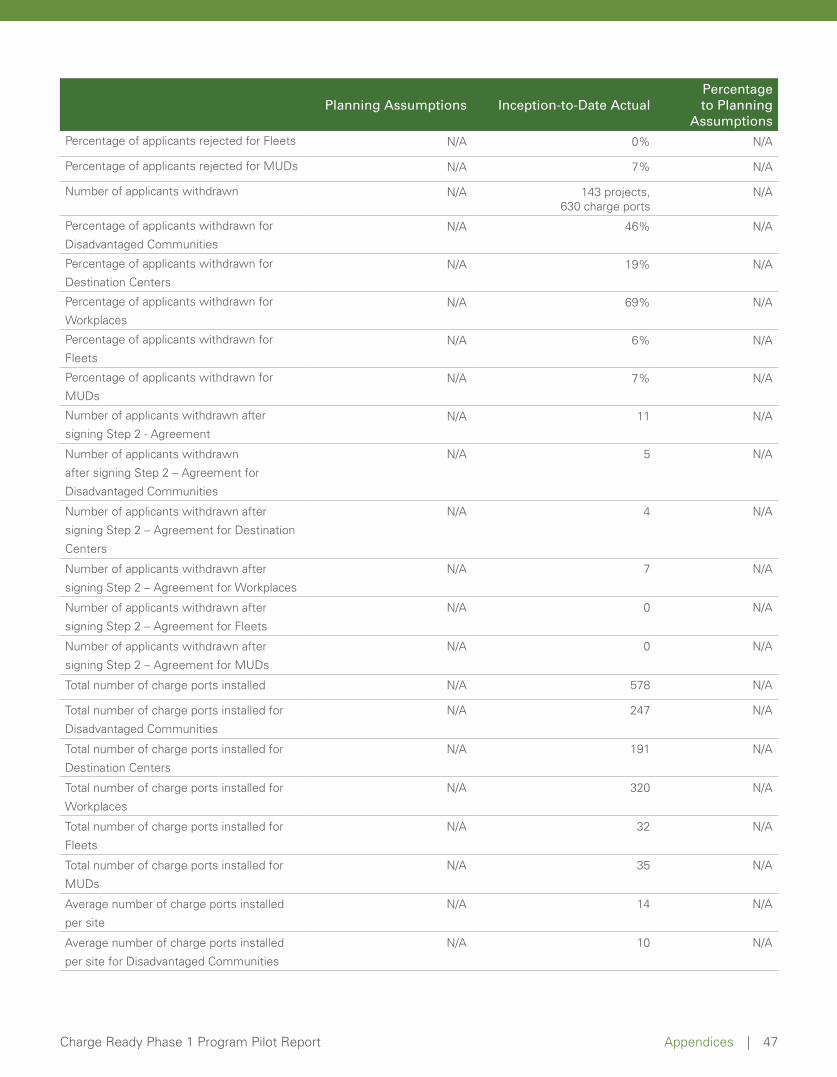
Planning Assumptions Inception-to-Date ActualPercentage to Planning
AssumptionsPercentage of applicants rejected for Fleets N/A 0% N/A
Percentage of applicants rejected for MUDs N/A 7% N/A
Number of applicants withdrawn N/A 143 projects,630 charge ports
N/A
Percentage of applicants withdrawn for
Disadvantaged CommunitiesN/A 46% N/A
Percentage of applicants withdrawn for
Destination CentersN/A 19% N/A
Percentage of applicants withdrawn for
WorkplacesN/A 69% N/A
Percentage of applicants withdrawn for
FleetsN/A 6% N/A
Percentage of applicants withdrawn for
MUDsN/A 7% N/A
Number of applicants withdrawn after
signing Step 2 - AgreementN/A 11 N/A
Number of applicants withdrawn
after signing Step 2 – Agreement for
Disadvantaged Communities
N/A 5 N/A
Number of applicants withdrawn after
signing Step 2 – Agreement for Destination
Centers
N/A 4 N/A
Number of applicants withdrawn after
signing Step 2 – Agreement for Workplaces
N/A 7 N/A
Number of applicants withdrawn after
signing Step 2 – Agreement for Fleets
N/A 0 N/A
Number of applicants withdrawn after
signing Step 2 – Agreement for MUDs
N/A 0 N/A
Total number of charge ports installed N/A 578 N/A
Total number of charge ports installed for
Disadvantaged Communities
N/A 247 N/A
Total number of charge ports installed for
Destination Centers
N/A 191 N/A
Total number of charge ports installed for
Workplaces
N/A 320 N/A
Total number of charge ports installed for
Fleets
N/A 32 N/A
Total number of charge ports installed for
MUDs
N/A 35 N/A
Average number of charge ports installed
per site
N/A 14 N/A
Average number of charge ports installed
per site for Disadvantaged Communities
N/A 10 N/A
Appendices | 47Charge Ready Phase 1 Program Pilot Report

Planning Assumptions Inception-to-Date ActualPercentage to Planning
Assumptions
Average number of charge ports installed
per site for Destination Centers
N/A 11 N/A
Average number of charge ports installed
per site for Workplaces
N/A 20 N/A
Average number of charge ports installed
per site for Fleets
N/A 8 N/A
Average number of charge ports installed
per site for MUDs
N/A 12 N/A
Total number of completed projects 58 projects, 1,500 charge ports
41 projects,578 charge ports
N/A
Percentage of completed projects for
Disadvantaged Communities
N/A 61% N/A
Percentage of completed projects for
Destination Centers
N/A 44% N/A
Percentage of completed projects for
Workplaces
N/A 39% N/A
Percentage of completed projects for Fleets N/A 10% N/A
Percentage of completed projects for
MUDs
N/A 7% N/A
Table 5.10 Customer Participant Request
Planning Assumptions
Inception-to-Date Actual
Average number of total parking spaces per site N/A 621 parking spaces/site
Average number of total parking spaces per site for Disadvantaged
CommunitiesN/A 377 parking spaces/site
Average number of total parking spaces per site for Destination Centers N/A 931 parking spaces/site
Average number of total parking spaces per site for Workplaces N/A 523 parking spaces/site
Average number of total parking spaces per site for Fleets N/A 404 parking spaces/site
Average number of total parking spaces per site for MUDs N/A 636 parking spaces/site
Percentage of total number of parking spaces located in parking structures N/A 12%
Total number of parking spaces located in parking structures for
Disadvantaged CommunitiesN/A 1,660
Total number of parking spaces located in parking structures for Destination
CentersN/A 7,560
Total number of parking spaces located in parking structures for Workplaces N/A 23,332
Total number of parking spaces located in parking structures for Fleets N/A 1,882
Appendices | 48Charge Ready Phase 1 Program Pilot Report
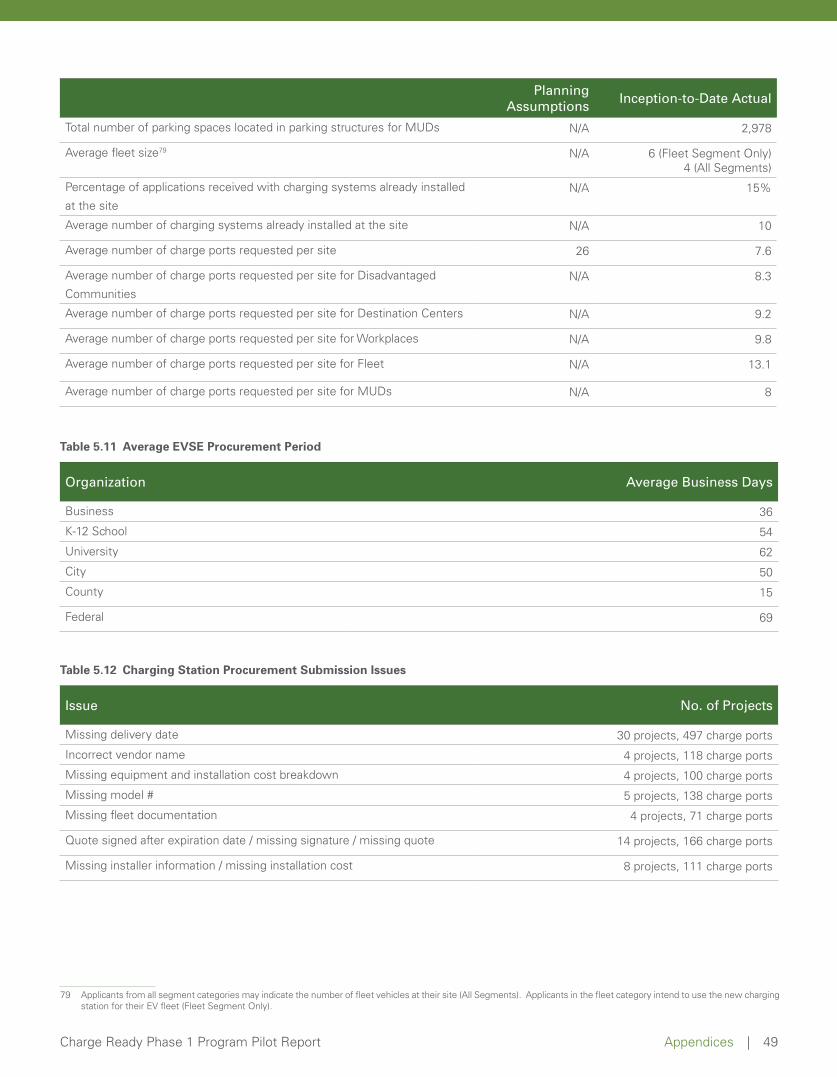
79 Applicants from all segment categories may indicate the number of fleet vehicles at their site (All Segments). Applicants in the fleet category intend to use the new charging station for their EV fleet (Fleet Segment Only).
Planning Assumptions
Inception-to-Date Actual
Total number of parking spaces located in parking structures for MUDs N/A 2,978
Average fleet size79 N/A 6 (Fleet Segment Only)4 (All Segments)
Percentage of applications received with charging systems already installed
at the siteN/A 15%
Average number of charging systems already installed at the site N/A 10
Average number of charge ports requested per site 26 7.6
Average number of charge ports requested per site for Disadvantaged
CommunitiesN/A 8.3
Average number of charge ports requested per site for Destination Centers N/A 9.2
Average number of charge ports requested per site for Workplaces N/A 9.8
Average number of charge ports requested per site for Fleet N/A 13.1
Average number of charge ports requested per site for MUDs N/A 8
Table 5.11 Average EVSE Procurement Period
Organization Average Business Days
Business 36
K-12 School 54
University 62
City 50
County 15
Federal 69
Table 5.12 Charging Station Procurement Submission Issues
Issue No. of Projects
Missing delivery date 30 projects, 497 charge ports
Incorrect vendor name 4 projects, 118 charge ports
Missing equipment and installation cost breakdown 4 projects, 100 charge ports
Missing model # 5 projects, 138 charge ports
Missing fleet documentation 4 projects, 71 charge ports
Quote signed after expiration date / missing signature / missing quote 14 projects, 166 charge ports
Missing installer information / missing installation cost 8 projects, 111 charge ports
Appendices | 49Charge Ready Phase 1 Program Pilot Report
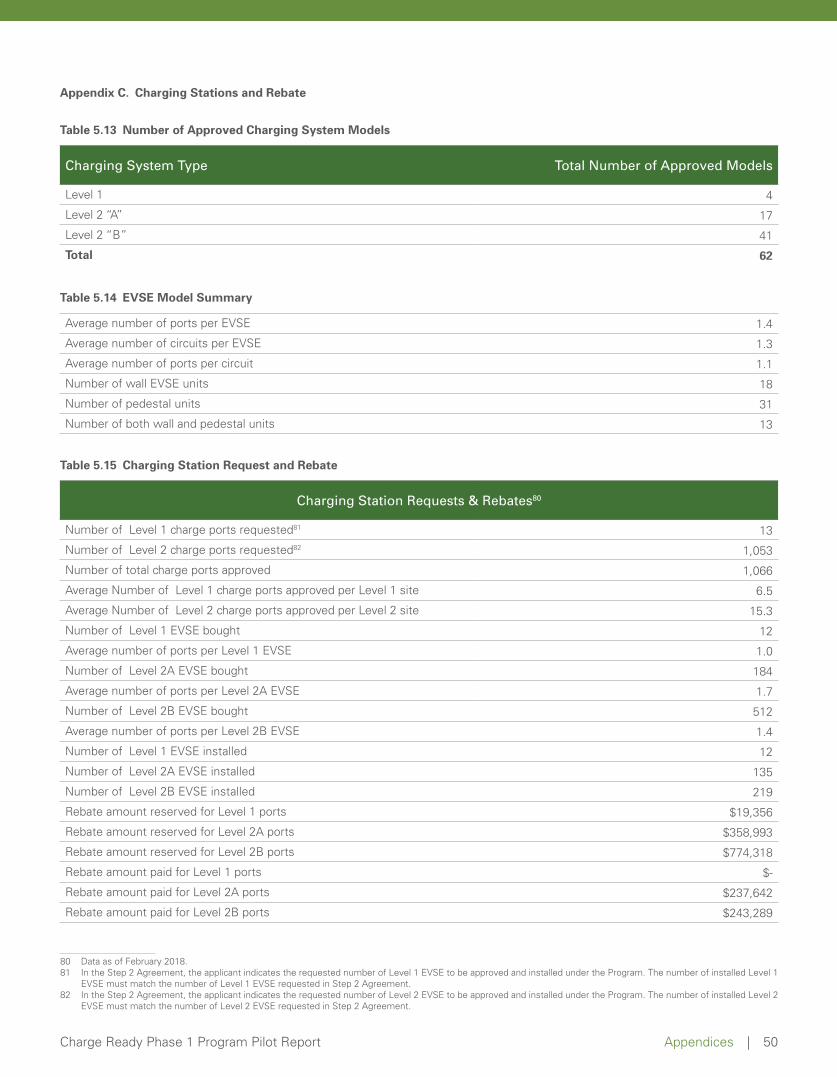
80 Data as of February 2018. 81 In the Step 2 Agreement, the applicant indicates the requested number of Level 1 EVSE to be approved and installed under the Program. The number of installed Level 1
EVSE must match the number of Level 1 EVSE requested in Step 2 Agreement. 82 In the Step 2 Agreement, the applicant indicates the requested number of Level 2 EVSE to be approved and installed under the Program. The number of installed Level 2
EVSE must match the number of Level 2 EVSE requested in Step 2 Agreement.
Appendix C. Charging Stations and Rebate
Table 5.13 Number of Approved Charging System Models
Charging System Type Total Number of Approved Models
Level 1 4
Level 2 “A” 17
Level 2 “B” 41
Total 62
Table 5.14 EVSE Model Summary
Average number of ports per EVSE 1.4
Average number of circuits per EVSE 1.3
Average number of ports per circuit 1.1
Number of wall EVSE units 18
Number of pedestal units 31
Number of both wall and pedestal units 13
Table 5.15 Charging Station Request and Rebate
Charging Station Requests & Rebates80
Number of Level 1 charge ports requested81 13
Number of Level 2 charge ports requested82 1,053
Number of total charge ports approved 1,066
Average Number of Level 1 charge ports approved per Level 1 site 6.5
Average Number of Level 2 charge ports approved per Level 2 site 15.3
Number of Level 1 EVSE bought 12
Average number of ports per Level 1 EVSE 1.0
Number of Level 2A EVSE bought 184
Average number of ports per Level 2A EVSE 1.7
Number of Level 2B EVSE bought 512
Average number of ports per Level 2B EVSE 1.4
Number of Level 1 EVSE installed 12
Number of Level 2A EVSE installed 135
Number of Level 2B EVSE installed 219
Rebate amount reserved for Level 1 ports $19,356
Rebate amount reserved for Level 2A ports $358,993
Rebate amount reserved for Level 2B ports $774,318
Rebate amount paid for Level 1 ports -$
Rebate amount paid for Level 2A ports $237,642
Rebate amount paid for Level 2B ports $243,289
Appendices | 50Charge Ready Phase 1 Program Pilot Report
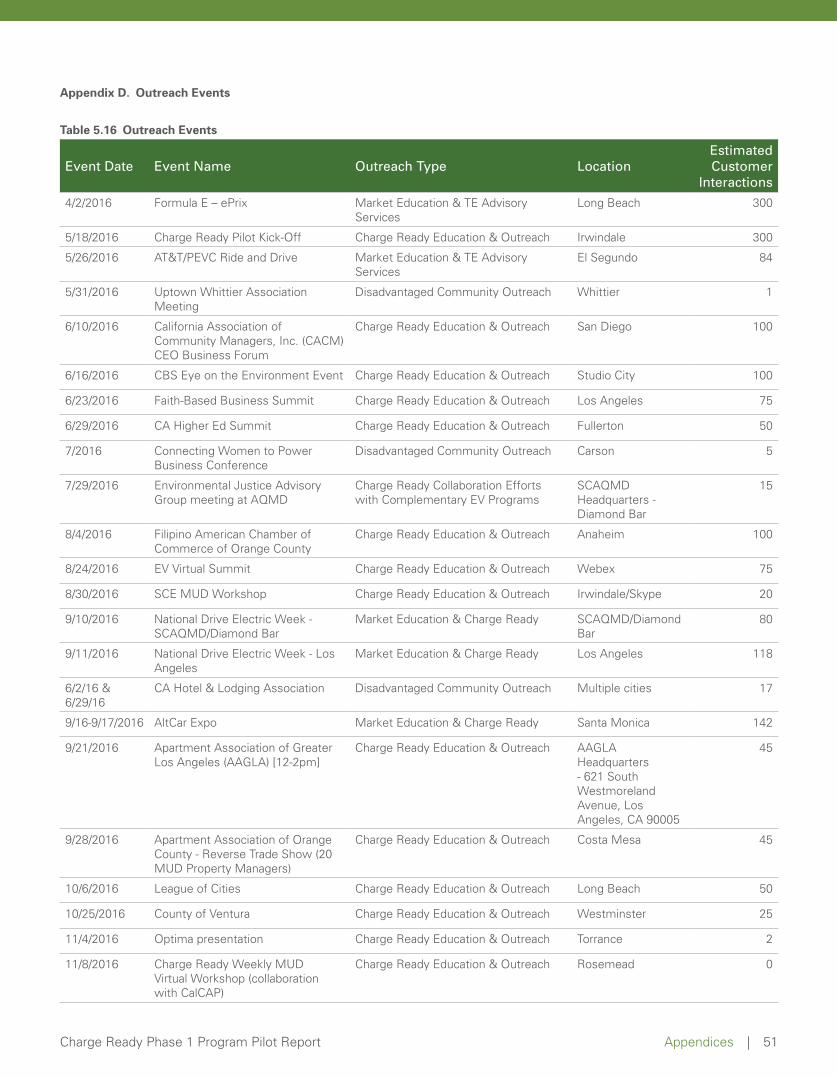
Appendix D. Outreach Events
Table 5.16 Outreach Events
Event Date Event Name Outreach Type LocationEstimated Customer
Interactions
4/2/2016 Formula E – ePrix Market Education & TE Advisory Services
Long Beach 300
5/18/2016 Charge Ready Pilot Kick-Off Charge Ready Education & Outreach Irwindale 300
5/26/2016 AT&T/PEVC Ride and Drive Market Education & TE Advisory Services
El Segundo 84
5/31/2016 Uptown Whittier Association Meeting
Disadvantaged Community Outreach Whittier 1
6/10/2016 California Association of Community Managers, Inc. (CACM) CEO Business Forum
Charge Ready Education & Outreach San Diego 100
6/16/2016 CBS Eye on the Environment Event Charge Ready Education & Outreach Studio City 100
6/23/2016 Faith-Based Business Summit Charge Ready Education & Outreach Los Angeles 75
6/29/2016 CA Higher Ed Summit Charge Ready Education & Outreach Fullerton 50
7/2016 Connecting Women to Power Business Conference
Disadvantaged Community Outreach Carson 5
7/29/2016 Environmental Justice Advisory Group meeting at AQMD
Charge Ready Collaboration Efforts with Complementary EV Programs
SCAQMD Headquarters - Diamond Bar
15
8/4/2016 Filipino American Chamber of Commerce of Orange County
Charge Ready Education & Outreach Anaheim 100
8/24/2016 EV Virtual Summit Charge Ready Education & Outreach Webex 75
8/30/2016 SCE MUD Workshop Charge Ready Education & Outreach Irwindale/Skype 20
9/10/2016 National Drive Electric Week - SCAQMD/Diamond Bar
Market Education & Charge Ready SCAQMD/Diamond Bar
80
9/11/2016 National Drive Electric Week - Los Angeles
Market Education & Charge Ready Los Angeles 118
6/2/16 & 6/29/16
CA Hotel & Lodging Association Disadvantaged Community Outreach Multiple cities 17
9/16-9/17/2016 AltCar Expo Market Education & Charge Ready Santa Monica 142
9/21/2016 Apartment Association of Greater Los Angeles (AAGLA) [12-2pm]
Charge Ready Education & Outreach AAGLA Headquarters - 621 South Westmoreland Avenue, Los Angeles, CA 90005
45
9/28/2016 Apartment Association of Orange County - Reverse Trade Show (20 MUD Property Managers)
Charge Ready Education & Outreach Costa Mesa 45
10/6/2016 League of Cities Charge Ready Education & Outreach Long Beach 50
10/25/2016 County of Ventura Charge Ready Education & Outreach Westminster 25
11/4/2016 Optima presentation Charge Ready Education & Outreach Torrance 2
11/8/2016 Charge Ready Weekly MUD Virtual Workshop (collaboration with CalCAP)
Charge Ready Education & Outreach Rosemead 0
Appendices | 51Charge Ready Phase 1 Program Pilot Report
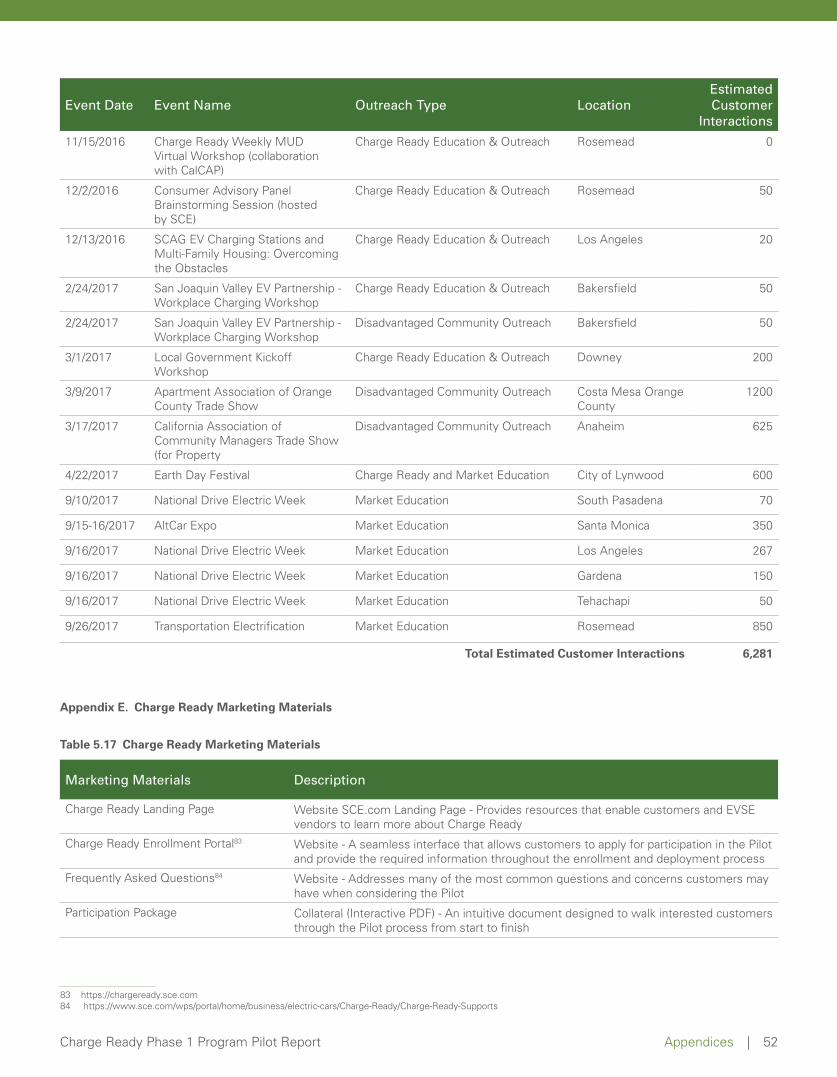
83 https://chargeready.sce.com 84 https://www.sce.com/wps/portal/home/business/electric-cars/Charge-Ready/Charge-Ready-Supports
Event Date Event Name Outreach Type LocationEstimated Customer
Interactions
11/15/2016 Charge Ready Weekly MUD Virtual Workshop (collaboration with CalCAP)
Charge Ready Education & Outreach Rosemead 0
12/2/2016 Consumer Advisory Panel Brainstorming Session (hosted by SCE)
Charge Ready Education & Outreach Rosemead 50
12/13/2016 SCAG EV Charging Stations and Multi-Family Housing: Overcoming the Obstacles
Charge Ready Education & Outreach Los Angeles 20
2/24/2017 San Joaquin Valley EV Partnership - Workplace Charging Workshop
Charge Ready Education & Outreach Bakersfield 50
2/24/2017 San Joaquin Valley EV Partnership - Workplace Charging Workshop
Disadvantaged Community Outreach Bakersfield 50
3/1/2017 Local Government Kickoff Workshop
Charge Ready Education & Outreach Downey 200
3/9/2017 Apartment Association of Orange County Trade Show
Disadvantaged Community Outreach Costa Mesa Orange County
1200
3/17/2017 California Association of Community Managers Trade Show (for Property
Disadvantaged Community Outreach Anaheim 625
4/22/2017 Earth Day Festival Charge Ready and Market Education City of Lynwood 600
9/10/2017 National Drive Electric Week Market Education South Pasadena 70
9/15-16/2017 AltCar Expo Market Education Santa Monica 350
9/16/2017 National Drive Electric Week Market Education Los Angeles 267
9/16/2017 National Drive Electric Week Market Education Gardena 150
9/16/2017 National Drive Electric Week Market Education Tehachapi 50
9/26/2017 Transportation Electrification Market Education Rosemead 850
Total Estimated Customer Interactions 6,281
Appendix E. Charge Ready Marketing Materials
Table 5.17 Charge Ready Marketing Materials
Marketing Materials Description
Charge Ready Landing Page Website SCE.com Landing Page - Provides resources that enable customers and EVSE vendors to learn more about Charge Ready
Charge Ready Enrollment Portal83 Website - A seamless interface that allows customers to apply for participation in the Pilot and provide the required information throughout the enrollment and deployment process
Frequently Asked Questions84 Website - Addresses many of the most common questions and concerns customers may have when considering the Pilot
Participation Package Collateral (Interactive PDF) - An intuitive document designed to walk interested customers through the Pilot process from start to finish
Appendices | 52Charge Ready Phase 1 Program Pilot Report
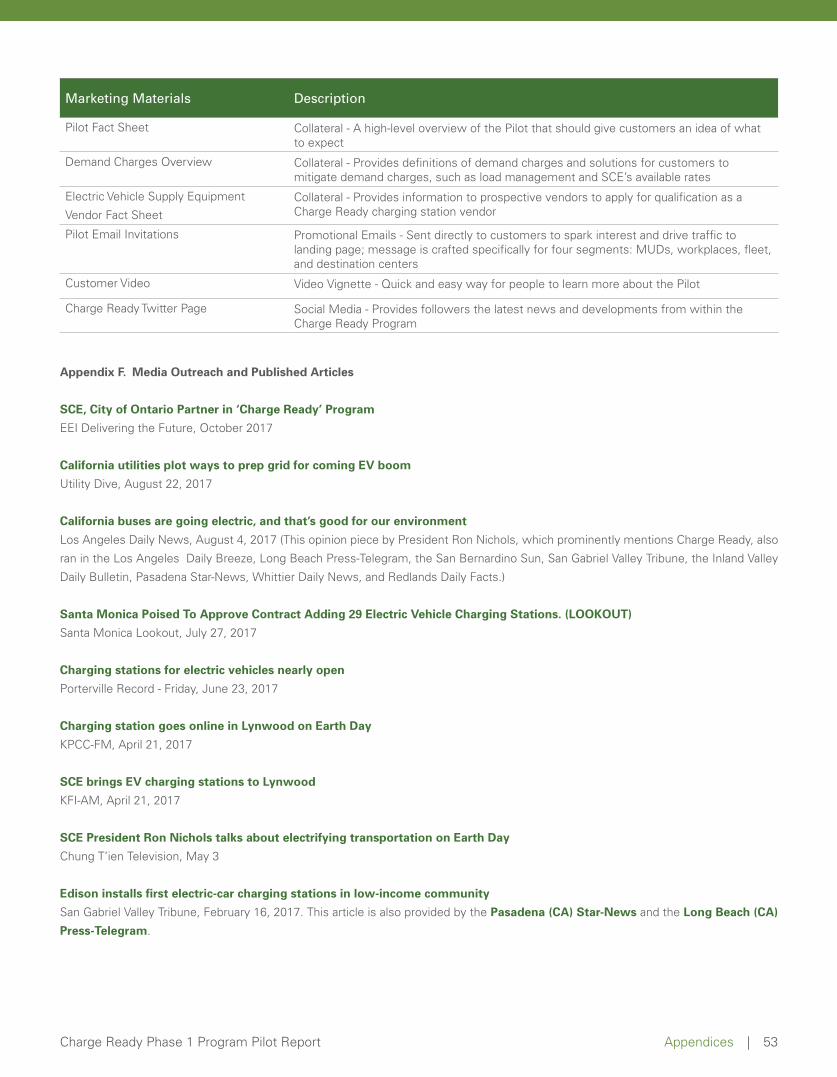
Marketing Materials Description
Pilot Fact Sheet Collateral - A high-level overview of the Pilot that should give customers an idea of what to expect
Demand Charges Overview Collateral - Provides definitions of demand charges and solutions for customers to mitigate demand charges, such as load management and SCE’s available rates
Electric Vehicle Supply Equipment
Vendor Fact SheetCollateral - Provides information to prospective vendors to apply for qualification as a Charge Ready charging station vendor
Pilot Email Invitations Promotional Emails - Sent directly to customers to spark interest and drive traffic to landing page; message is crafted specifically for four segments: MUDs, workplaces, fleet, and destination centers
Customer Video Video Vignette - Quick and easy way for people to learn more about the Pilot
Charge Ready Twitter Page Social Media - Provides followers the latest news and developments from within the Charge Ready Program
Appendix F. Media Outreach and Published Articles
SCE, City of Ontario Partner in ‘Charge Ready’ Program
EEI Delivering the Future, October 2017
California utilities plot ways to prep grid for coming EV boom
Utility Dive, August 22, 2017
California buses are going electric, and that’s good for our environment
Los Angeles Daily News, August 4, 2017 (This opinion piece by President Ron Nichols, which prominently mentions Charge Ready, also
yellaV dnalnI eht ,enubirT yellaV leirbaG naS ,nuS onidranreB naS eht ,margeleT-sserP hcaeB gnoL ,ezeerB yliaD selegnA soL eht ni nar
Daily Bulletin, Pasadena Star-News, Whittier Daily News, and Redlands Daily Facts.)
Santa Monica Poised To Approve Contract Adding 29 Electric Vehicle Charging Stations. (LOOKOUT)
Santa Monica Lookout, July 27, 2017
Charging stations for electric vehicles nearly open
Porterville Record - Friday, June 23, 2017
Charging station goes online in Lynwood on Earth Day
KPCC-FM, April 21, 2017
SCE brings EV charging stations to Lynwood
KFI-AM, April 21, 2017
SCE President Ron Nichols talks about electrifying transportation on Earth Day
Chung T’ien Television, May 3
Edison installs first electric-car charging stations in low-income community
San Gabriel Valley Tribune, February 16, 2017. This article is also provided by the Pasadena (CA) Star-News and the Long Beach (CA)
Press-Telegram.
Appendices | 53Charge Ready Phase 1 Program Pilot Report

SoCal Edison to install 1,500 electric-car charging sites;
what’s your electric utility doing?
Green Car Reports, June 1, 2016
How Southern California Edison might help you charge your
electric car at work
L.A. Daily News/Long Beach Press-Telegram/San Gabriel Valley
Tribune/Pasadena Star, May 25, 2016
Southern California Edison plugging into electric-vehicle
charging market
L.A. Daily News/Long Beach Press-Telegram/San Gabriel Valley
Tribune/Pasadena Star, May 14, 2016
SCE to add electric vehicle charging stations
KNBC-TV, May 16, 2016
So Cal Edison looking to install 1,500 new electric vehicle
charging stations
KNX News Radio, May 16, 2016
Plugging EVs: Program by SoCal Edison will add 1,500
charging stations
Los Angeles Business Journal, March 27, 2016
CA EV Infrastructure: Platform for innovation or simple
utility service?
SmartGridNews, April 25, 2016
EV charging pilot takes off in Southern California
Green Transit News, May 16, 2016
SCE Launches Charge Ready Electric Vehicle Charging Pilot
Program
The Street, May 24, 2016
SCE launching $22M Charge Ready EV charging pilot
Green Car Congress, May 17, 2016
SDG&E kicks off $52.5 million EV charger installation and
customer education pilot
Utility Dive, May 23, 2016
Electric vehicle charging station pilot
World Journal, May 19, 2016
SCE Ramps Up Electric Vehicle Charging Program
socalTECH, May 17, 2016
SCE Launches Charge Ready Electric Vehicle Charging Pilot
Program
Electric Cars Report, May 17, 2016
Southern California Edison to start electric car charging pilot
program
Korea Herald Biz, May 17, 2016
SCE Launches Charge Ready Electric Vehicle Charging Pilot
Program
Transmission & Distribution World, May 18, 2016
SCE electric vehicle charging facilities expansion plan
Korea Daily, May 19, 2016
SCE encourages participation in charging station pilot
program
Singtao Daily, May 17, 2016
Plugging EVs: Program by SoCal Edison will add 1,500
charging stations.
Los Angeles Business Journal, March 27, 2016
You Know Electric Cars Are Poised to Take Off When the Koch
Brothers Plan the Technology’s Demise
Huffington Post, February 26, 2016
So Cal Edison gets green light to install 1,500 charging
stations
CBS2, Jan. 15, 2016
So Cal Edison to Install Charging Stations
KCAL9, Jan. 15, 2016
Edison to install 1,500 electric vehicle charging stations
KNBC-TV, Jan 22, 2016
Edison will be installing 1,500 Charging Stations
KABC-TV, Jan. 15, 2016
State regulators approve electric vehicle charging station
pilot program
Los Angeles Times, Jan. 15, 2016
Editorial: The right way to charge electric cars
Los Angeles Times, Jan. 27, 2016
EV drivers get more spark from Edison
L.A. Daily News/Long Beach Press-Telegram/San Gabriel Valley
Tribune/Pasadena Star, Jan. 20, 2016
Appendices | 54Charge Ready Phase 1 Program Pilot Report
Southern California Edison to install 1,500 charging station
Orange County Register, March 29, 2016
Commentary: We’ll all pay to charge others’ electric cars
Orange County Register, Feb. 4, 2016
Utility to roll out more electric vehicle charging stations
San Jose Mercury News, Jan. 20, 2016
Electric vehicle charging stations will be installed around the
area by Southern California Edison
KNX Radio, Jan. 15, 2016
SCE is getting ready to roll out a $22 million pilot program for
EV charging stations
KPCC Radio, Jan. 20, 2016
Southern California pilot program to install 1,500 car charging
stations
KPCC Website, Jan. 15, 2016
Edison to Install 1,500 Charging Stations
Los Angeles Business Journal, Jan. 15, 2016
Tesla’s Cheaper Model 3 Could Strain Charging Infrastructure
MIT Technology Review, March 29, 2016
California Invites Power Utilities into the Car-Charging Market
Bloomberg, May 5, 2016
SCE Electric Car Initiative
KCOY-TV, Jan. 15, 2016
So Cal Edison will install 1,500 new charging stations for
electric vehicles
KESQ-TV, Jan. 15, 2016
So Cal Edison says it will help to pay for the installation of
1,500 new electric car chargers
KFI Radio, Jan. 15, 2016
SCE receives green light from state regulators to begin
vehicle charging pilot project
KCEP-FM, Las Vegas, Jan. 15, 2016
SoCal Edison to Add 1,500 new stations for a pilot project to
install 1,500 EV charging stations
KFSN-TV, Fresno
Today CPUC gave SCE Green Light to Install As Many As
1,500 Charging Stations
KCRW Radio, Jan 22, 2016
$22 Million EV Charging Pilot Launched In Southern California
CleanTechnica, Jan. 27, 2016
Gov’t Regulators To Break Out Subsidy For EV Charging
Stations
Daily Caller, Jan. 19, 2016
Two California Utilities Get Creative with EV Charging
Energy Efficient Markets, Feb. 1, 2016
Southern California Utilities to Deploy 5,000 EV Chargers in
First-of-Their Kind Pilots
Green Tech Media, Feb. 1, 2016
How Utilities Are Planning Electric-Vehicle Infrastructure in
California and Beyond
Green Tech Media, Feb. 25, 2016
To Lead Nation in EVs, California Should Encourage Charging
Station Competition
GovTech, April 27, 2016
You Know Electric Cars Are Poised to Take Off When the Koch
Brothers Plan the Technology’s Demise
Huffington Post, Feb. 26, 2016
Proposal to Charge Electric Cars in Southern California Gets
the Green Light
NRDC Switchboard, Jan. 14, 2016
Electric Charging Station Coming Your Way
Los Alamitos-Seal Beach Patch, Jan. 14, 2016
California Regulators Approve Pilot EV Charging Program for
Southern California Edison
Renewable Energy World, Jan. 15, 2016
Proposal to Charge Electric Cars in Southern California Gets
the Green Light
NRDC, Jan. 14, 2016
Utility to roll out more electric vehicle charging stations
San Jose Mercury News, Jan. 20, 2016
California legislature not happy with PG&E EV proposal
SmartGridNews, April 21, 2016
Appendices | 55Charge Ready Phase 1 Program Pilot Report
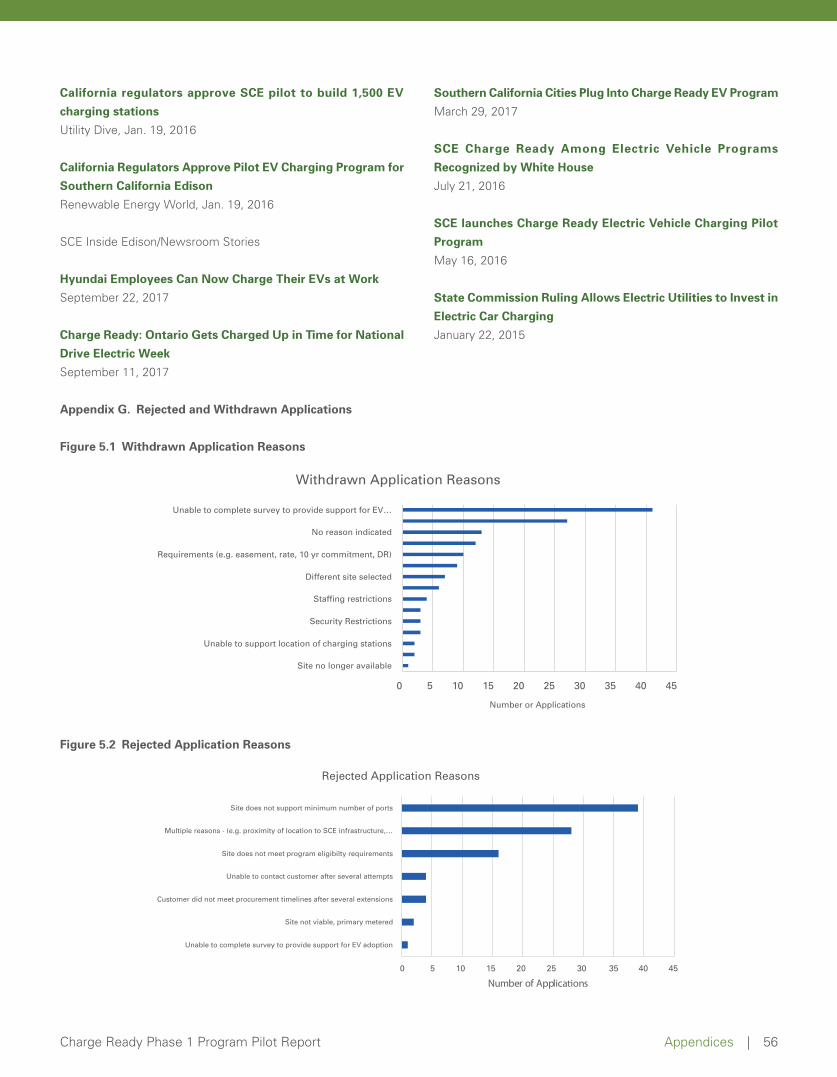
California regulators approve SCE pilot to build 1,500 EV
charging stations
Utility Dive, Jan. 19, 2016
California Regulators Approve Pilot EV Charging Program for
Southern California Edison
Renewable Energy World, Jan. 19, 2016
SCE Inside Edison/Newsroom Stories
Hyundai Employees Can Now Charge Their EVs at Work
September 22, 2017
Charge Ready: Ontario Gets Charged Up in Time for National
Drive Electric Week
September 11, 2017
Southern California Cities Plug Into Charge Ready EV Program
March 29, 2017
SCE Charge Ready Among Electric Vehicle Programs
Recognized by White House
July 21, 2016
SCE launches Charge Ready Electric Vehicle Charging Pilot
Program
May 16, 2016
State Commission Ruling Allows Electric Utilities to Invest in
Electric Car Charging
January 22, 2015
Appendix G. Rejected and Withdrawn Applications
Figure 5.1 Withdrawn Application Reasons
Figure 5.2 Rejected Application Reasons
0 5 10 15 20 25 30 35 40 45
Site no longer available
Unable to support location of charging stations
Security Restrictions
Staffing restrictions
Different site selected
Requirements (e.g. easement, rate, 10 yr commitment, DR)
No reason indicated
Unable to complete survey to provide support for EV…
Number or Applications
Withdrawn Application Reasons
0 5 10 15 20 25 30 35 40 45
Unable to complete survey to provide support for EV adoption
Site not viable, primary metered
Customer did not meet procurement timelines after several extensions
Unable to contact customer after several attempts
Site does not meet program eligibilty requirements
Multiple reasons - (e.g. proximity of location to SCE infrastructure,…
Site does not support minimum number of ports
Number of Applica ons
Rejected Application Reasons
Appendices | 56Charge Ready Phase 1 Program Pilot Report