charges work group meeting agenda august 2, …...north interceptor east arm 35 wrrf treated...
TRANSCRIPT

1
Charges Work Group Meeting Agenda August 2, 2018, 2:00 – 4:00 pm
Lathrup Village Community Center 27400 Southfield Rd. Lathrup Village, MI - Lathrup Village
Time Topic
2:00 p.m. Welcome, desired outcomes, agenda review – Kerry Sheldon § Desired outcomes: 1) To deepen member-partners’ shared understanding of
how the wastewater system operates under both dry and wet conditions, and the way GLWA’s charges methodology is currently structured, and 2) to share a proposed work plan and timeline for refining the latter
2:05 p.m. Opening remarks – Sue McCormick
2:10 p.m. Overview of the wastewater system – Suzanne Coffey 30 minute presentation; 15 minute discussion
§ What questions and observations do you have? § What surprised you to learn? § What did we miss or not emphasize enough?
2:55 p.m. Discussion of current charges methodology – Nicolette Bateson, Bart Foster 20 minute presentation; 10 minute discussion
§ What did you hear? § What questions and observations do you have?
3:25 p.m. Work groups’ membership, mission, and guiding principles – Kerry Sheldon § Sewer SHAREs work group § Charges methodology work group § Suggested guiding principles for both work groups:
1. Practice the Rules of Collaboration in the Partnering Agreement 2. Focus on the long-term impacts of the decisions we make today;
ensure alignment with the longer-term vision of where we’re headed as a region (including the WWMP)
3. Maintain good connectivity with our respective communities’ leadership and key stakeholders throughout the process
4. What else?
3:40 p.m. Timeline and next steps – Kerry Sheldon, Suzanne Coffey, Nicolette Bateson § Review overall timeline § Sewer SHAREs work group tomorrow: August 3, 12:00-2:00p, SEMCOG § Charges methodology work group – scheduling in process
4:00 p.m. Adjourn

Wastewater Charges Work GroupAugust 2, 2018

Agenda
Welcome, Introduction & Desired Outcomes
Opening Remarks
Overview of the Wastewater System
Wastewater Charges Methodology Summary
Work Group’s Membership, Mission, & Guiding Principles
Timeline & Next Steps

Desired Outcomes
1. To deepen member-partners’ shared understanding of how the wastewater system operates under both dry and wet conditions, and the way GLWA’s charges methodology is currently structured, and
2. To share a proposed work plan and timeline for refining the latter

Opening Remarks
Sue McCormick

Overview of the Wastewater System
Suzanne Coffey

Oakland County
Macomb County
Wayne County
Detroit
8 Mile
I-696
M-59
I-75
M-59
M-39
I-696
M-24
GLWA Service Area
6

GLWA Tier 1 Member Partners
7
8 Mile
I-696
M-59
I-75
M-59
M-39
I-696
M-24
17 1st Tier Member Partners

color
Tier 1 Member Partners Collection System Type
8
Combined = 24%Separated = 76%

GLWA Interceptors
9

GLWA Interceptors
WRRF

Collection System ElementsPipes
• 190 MilesPump Stations
• 5 GLWA Pump Stations• 4 DWSD Pump Stations
In-system Storage Dams• 13 Inflatable dams on GLWA and DWSD sewers• 56 MG of storage
Valve Remotes• 17 Valve remote sites to regulate/divert flow in the collection system
Sewer and Flow Monitoring Network• 26 Level sensors throughout the collection system to monitor trunk sewer and interceptor levels• 43 Sewer meters to monitor flows at the customer connections, interceptors, and GLWA facilities
Precipitation Gage Network• 39 precipitation gages in the collection system to monitor rain intensity and volume
CSO Outfalls• 39 Outfalls on Detroit River• 17 Outfalls on Rouge River• River level, sewer level and backwater gate monitoring

Overview of System ComponentsDry Weather

13
City of Farmington
Dearborn
Dearborn
Dearborn
Dearborn
DearbornDearborn
Dearborn
Dearborn
Allen ParkMelvindale
Wayne County
Wayne County
Wayne County
Wayne County (Dearborn Heights)
RedfordTwp
RedfordTwp Highland
Park
Northwest Interceptor
Orange area within Highland Park is tributary to North Interceptor East Arm (NIEA)

14
City of Farmington
Allen ParkMelvindale
Wayne County
Wayne County
Wayne County
Wayne County (Dearborn Heights)
Detroit Tributary to NWI
(Approximate)
RedfordTwp
RedfordTwp
Dearborn
Dearborn
Dearborn
Dearborn
DearbornDearborn
Dearborn
Dearborn
Highland Park
Orange area within Highland Park is tributary to Northwest Interceptor (NWI)
Northwest Interceptor

15
OMIDEFSDS GWKDD
Hamtramck
Highland Park
Orange area within Highland Park is tributary to North Interceptor East Arm (NIEA)
Green area within Hamtramck is tributary to NIEA
North Interceptor East Arm

North Interceptor East Arm
16
EFSDS GWKDD OMID
Detroit
Detroit
Detroit Tributary to NIEA
(Approximate) Hamtramck
Highland Park
WRRF
Orange area within Highland Park is tributary to North Interceptor East Arm (NIEA)
Green area within Hamtramck is tributary to NIEA

17
Center LineWayne County
Northeast
Grosse Pointe Farms
Grosse PointeHamtramck
Detroit River Interceptor
Green area within Hamtramck is tributary to Detroit River Interceptor (DRI)
Grosse Pointe Park

Detroit River Interceptor
18
GPF
Center LineWayne County
Northeast
Detroit Tributary to DRI (Approximate)
Hamtramck
Green area within Hamtramck is tributary to Detroit River Interceptor (DRI)
WRRF
Grosse Pointe Farms
Grosse Pointe
Grosse Pointe Park

GLWA Interceptors
WRRF

Water Resource Recovery Facility (WRRF)Schematic
PRIMARY CLARIFIERS
PUMP STA 1
Preliminary & Primary Treatment
Removes heavy Settleable solids
SLUDGE PROCESSING –
COMPLEX A
SLUDGE PROCESSING-COMPLEX B
DEWATERING PRESSES
DEWATERING CENTRIFUGES
SLUDGE STORAGE
DewateringRemoves water from solids
to reduce volume before disposal
SO2
AERATION TANKS
SECONDARY CLARIFIERS
JUNCTION CHAMBERPROCESS
WATER
DRO
CHLORINE
Secondary Treatment Removes organic matter both Non-settleable and Dissolved
DisinfectionKills disease-causing
(pathogenic) organisms
BIOSOLIDS DRYER
FACILITY
Residuals Sludge is dried and formed into
fertilizer pellets for beneficial reuse
INCINERATORS
ResidualsSludge is incinerated and the
resulting ash is landfilled
FeCl3
FeCl3
PUMP STA 2
PUMP STA 1
PRIMARY CLARIFIERS

ROUGE RIVER
TO DETROIT RIVERNW
INW
I
PE-AS
RRO
DRO-1
CHLORINE JUNCTION CHAMBER
PUMP STA. 1
PUMP STA. 2
RECTANGULAR PRIMARY SEDIM
ENTATION
TANKS
NORTH
Water Resource Recovery Facility (WRRF)Physical Layout

OPERATION•PS-1 and PS-2 pump 450 MGD as average dry weatherflow
•Screens remove large items (screenings) at both pumpstations
•Ferric chloride added to remove excess phosphorus (P)•Grit removal systems at both pump stations•Rectangular and circular primary clarifiers slow flow tosettle solids.
•Removes 60 to 65% of suspended solids (TSS) andbiochemical oxygen demand (BOD)
•Fats, oils and grease (FOG) is skimmed•Screenings, skimmed material and grit are landfilled
ROUGE RIVER
TO DETROIT RIVERNW
INW
I
PE-AS
DRO-1
CHLORINE JUNCTION CHAMBER
PUMP STA. 1
PUMP STA. 2
RECTANGULAR PRIMARY SEDIM
ENTATION
TANKS
NORTH
Dry WeatherPreliminary & Primary Treatment

OPERATION•Aeration tanks provide oxygen for microorganisms (biomass) to thrive
•Target to keep the microorganism population stable•Secondary clarifiers slow flow for microorganisms to settle
•Processes remove nearly all remaining •Suspended solids (TSS)•Phosphorous (P)•Organic matter or Biochemical Oxygen Demand (BOD)
Dry WeatherSecondary Treatment
TO DETROIT RIVER
SECONDARY CLARIFIERS
SECONDARY CLARIFIERS
AERATION TANKS
SCREENED FINAL EFFLUENT PROCESS
O2 STORAGE (BACKUP TO SUPPLY-PIPELINE)
PE-AS
NORTH

DECHLORINATION
DETROIT RIVER OUTFALL DRO
Zug Island
Detroit River
CHLORINATION
NORTHJUNCTION CHAMBER
Dry WeatherDisinfection
OPERATION•Add chlorine to kill pathogens (disinfect)•Add sulfur dioxide to remove any remaining chlorineafter disinfection

NORTH
SLUDGE PROCESSING COMPLEX A
SLUDGE PROCESSING COMPLEX B
DEWATERING COMPLEX 2
DEWATERING COMPLEX 1
Dry WeatherDewatering
OPERATION•Allow time for sludge to thicken•Send thickened sludge to the biosolids dryer first where the BDF facility dewaters with centrifuges
•Dewater the remaining sludge•Add polymer to improve dewatering•Dewater with belt filter presses

NORTH
OFFLOADING FACILITY
INCINERATION COMPLEX
BIOSOLIDS DRYER FACILITY
Dry WeatherResiduals Disposal
OPERATION•Prioritize beneficial reuse through production offertilizer pellets
• Incinerate remaining sludge with upgraded emissionsequipment that meets the Maximum AchievableControl Technology (MACT) standards
•Minimize use of natural gas•Keep exhaust gases cool and clean•Offload facility is in standby

Overview of System ComponentsWet Weather

GLWA Wet Weather Facilities
28
WRRF

GLWA Wet Weather Facilities
29
WRRF

GLWA Wet Weather Facilities
30
WRRF

GLWA Wet Weather Facilities
31
WRRF

GLWA Wet Weather Facilities
32
WRRF

GLWA Wet Weather Facilities
33
WRRF

City of Farmington
Dearborn
Dearborn
Dearborn
Dearborn
Dearborn
Dearborn
Dearborn
Dearborn
Allen ParkMelvindale
Wayne County
Wayne County
Wayne County
Wayne County (Dearborn Heights)
RedfordTwp
RedfordTwp
Detroit Tributary to NWI
(Approximate) Highland Park
7 Mile RTB
Puritan FenkellRTB
Hubble SouthfieldRTB
OakwoodRTB
WRRF Effluent
Dearbornnnnnnnnnnnnnnnnnn
e County ndale
Way
Baby CreekSDF
Northwest Interceptor
34
Treated Discharge
Untreated Discharge
WRRF

EFSDS GWKDD OMID
Detroit
Detroit
Hamtramck
Highland Park
WRRF Effluent
LeibSDFLeibSDF
North Interceptor East Arm
35
WRRFTreated Discharge
Untreated Discharge

Detroit River Interceptor
36
Dotted areas indicate area is tributary to both NIEA and DRI during wet weather
Complex and variable flow patterns occur during wet weather events
EFSDSGWKDD
Center Line Wayne CountyNortheast
GPF
GPP
GP
Detroit Tributary to DRI (Approximate)
Hamtramck
Highland Park
Conner CreekRTB
Belle IsleRTB
LeibSDFLeibSDF
St. Aubin SDFAubinSDF
WRRF Effluent
WRRF
Treated Discharge
Untreated Discharge

GLWA Wet Weather Facilities
37
WRRF

Regional System Operational Elements
WRRF

GLWA Interceptors
WRRF

Water Resource Recovery Facility (WRRF)Schematic
PRIMARY CLARIFIERS
PUMP STA 1
SLUDGE PROCESSING –
COMPLEX A
SLUDGE PROCESSING-COMPLEX B
DEWATERING PRESSES
DEWATERING CENTRIFUGES
SLUDGE STORAGE
SO2
AERATION TANKS
SECONDARY CLARIFIERS
JUNCTION CHAMBERPROCESS
WATER
DRO
CHLORINE
BIOSOLIDS DRYER
FACILITYINCINERATORS
FeCl3
FeCl3
PUMP STA 2
PUMP STA 1
PRIMARY CLARIFIERS
Primary EffluentFlows in Excess of 930 MGD
SODIUM BI SULFITESODIUM HYPO CHLORITE
ResidualsCentral Offload Facility loads
trucks of stabilized biosolids for landfill disposal
CENTRAL OFFLOAD FACILITY

OPERATION•PS-1 and PS-2 pump up to 1700 MGD peak wet weather flow
•Screens remove large items (screenings)•Ferric Chloride added to remove excess phosphorus (P)•Grit increases with wet weather•Flows up to 930 MGD receive full secondary treatment, disinfection and dichlorination
•Flows in excess of 930 MGD receive primary treatment (including phosphorus removal), disinfection and dichlorination
•DRO primary effluent is disinfected and dechlorinated
•RRO primary effluent is currently not disinfected. The RRO Disinfection Project will provide disinfection and dichlorination for the RRO primary effluent
ROUGE RIVER
TO DETROIT RIVERO
NWI
NWI
PE-AS
DRO-1
CHLORINE JUNCTION CHAMBER
PUMP STA. 1
PUMP STA. 2
RECTANGULAR PRIMARY SEDIM
ENTATION
TANKS
NORTH
Wet WeatherPreliminary & Primary Treatment
TO ROUGE RIVER
RRO
DRO-1

OPERATION•Flows up to 930 MGD receive full secondary treatment•Aeration tanks provide oxygen for microorganisms(biomass) to thrive
•Target to keep the microorganism population stable•Secondary clarifiers slow flow for microorganisms tosettle
•Processes remove nearly all remaining•Suspended solids (TSS)•Phosphorous (P)•Organic matter or Biological Oxygen Demand(BOD)
Wet WeatherSecondary Treatment
TO DETROIT RIVER
SECONDARY CLARIFIERS
SECONDARY CLARIFIERS
AERATION TANKS
SCREENED FINAL EFFLUENT PROCESS
O2 STORAGE (BACKUP TO SUPPLY-PIPELINE)
PE-AS
NORTH

DECHLORINATION
DETROIT RIVER OUTFALL DRO
Zug Island
Detroit River
CHLORINATION
NORTHJUNCTION CHAMBER
Wet WeatherDisinfection
OPERATION•Add chlorine to kill pathogens (disinfect)•Add sulfur dioxide to remove any remaining chlorine after disinfection

NORTH
SLUDGE PROCESSING COMPLEX A
SLUDGE PROCESSING COMPLEX B
DEWATERING COMPLEX 2
DEWATERING COMPLEX 1
Wet WeatherDewatering
OPERATION•Allow time for sludge to thicken•Send thickened sludge to the biosolids dryer first wherethe BDF facility dewaters with centrifuges
•Dewater the remaining sludge•Add polymer to improve dewatering•Dewater with belt filter presses first•Dewater with centrifuges as needed

NORTH
OFFLOADING FACILITY
INCINERATION COMPLEX
BIOSOLIDS DRYER FACILITY
Wet WeatherResiduals Disposal
OPERATION•Prioritize beneficial reuse through production of fertilizer pellets
•Sludge in excess of the BDF capacity is incinerated or offloaded
•Central Offload Facility stabilizes sludge prior to loadingto trucks for landfilling

Dry Weather vs. Wet Weather

Dry Weather vs. Wet Weather Pump Stations
Pump Station Rated Capacity (cfs)
Total # of pumps Dry Weather Wet Weather
Belle Isle Sanitary (Detroit) 44 2 1 1
Belle Isle Storm 696 4 0 2
Blue Hill Sanitary (Detroit) 20 2 1 1
Blue Hill Storm (Detroit) 961 4 0 3
Conner Sanitary 333 4 2 2
Conner Storm 4,000 8 0 3
Freud Sanitary 55 2 1 0
Freud Storm 3,600 8 0 5
Fairview 525 4 1 2
Fischer (Detroit) 22 2 1 2
Woodmere Sanitary (Detroit) 18 2 1 0
Woodmere Storm (Detroit) 920 3 2 2
Oakwood Sanitary 40 4 1 0
Oakwood Storm 1,950 8 0 4

Dry Weather vs. Wet Weather at WRRF
Process Component Total Dry WeatherIn-Service
Wet WeatherIn-Service
Primary
Pump Station 1 Pumps 8 2-4 6-8Rectangular Clarifiers 12 6-7 8-10
Pump Station 2 Pumps 8 2-4 6-8Circular Clarifiers 6 3-4 5-6
Secondary
Aeration Decks 4 3 3Secondary Clarifiers 25 23 23
Chlorinators 16 2-4 6-8Sulfinators 14 2-3 5-6
DewateringBelt Filter Presses 22 2-3 10-12
Centrifuges 12 4-6 6-10
Residuals Disposal
Incinerators 8 2 4-6Central Offload Facility Bays 3 0 1-2
Biosolids Dryer Facility Dryers 4 2-3 3-4

Preliminary and Primary Process Total Capacity Firm Capacity
Pump Station 1 w/ Screens, Gravity Grit Chambers & FeCl3 Addition 1417 MGD 1188 MGD (based on
largest pump OOS)Pump Station 2 w/Screens, Aerated
Grit Chambers & FeCl3 Addition 758 MGD 653 MGD (based on largest pump OOS)
Total Pumping 2175 MGD 1841 MGDPrimary Rectangular Tanks: 12 @
90 MGD ea. 1080 MGD
Primary Circular Tanks: 6 @ 180MGD ea. 1080 MGD
Total Primary Treatment 2160 MGD
1800 MGD (based on two rectangular and
one circular tank OOS for
maintenance)
Secondary Process Capacity Firm CapacityIntermediate Lift Pumps: 5 @ 365
ea. 1825 MGD 1460 MGD (based on one ILP OOS)
Aeration Tanks: 4 @ 310 MGD ea. 1240 MGD930 MGD (based on one basin OOS for
maintenance)
Secondary Clarifiers: 25 @ 40 MGD ea. 1000 MGD
960 MGD (based on one tank OOS for
maintenance)Screened Final Effluent Pumps: 6 @
18 MGD ea. + 2 @ 12 MGD ea. 132 MGD
Disinfection Process Capacity Firm CapacityChlorinators: 16 @ 8,000
lb/day128,000 lbs/day 112,000 lbs/day (based on
14 of 16 chlorinators in service)
Sulfinators: 14 @ 7,600 lb/day
106,400 lbs/day 91,200 lbs/day (based on 12 of 14 sulfinators in
service)
Dewatering Process Capacity Firm CapacityPrimary Sludge Gravity
Thickeners: 6 @ 5 MGD ea. 30 MGD
Secondary Sludge Gravity Thickeners: 6 @ 2 MGD ea. 12 MGD
Sludge Feed Pumps: 6 @ 3.5 MGD ea. 21 MGD
Belt Filter Presses: 22 @ 48 Dry Ton/Day ea. 1,056 ton/day 696ton/day (based on
14.5 BFPs of 22 in service)Centrifuges: 4 @ 48 Dry
Ton/Day ea. 192 ton/day 144 ton/day (based on 3 of 4 centrifuges in service
Residuals Process Capacity Firm CapacityBiosolids Dryer Facility: 4Trains @ 105 dry ton/day
ea.420 dry ton/day 315 dry ton/day (based on
3 of 4 trains in service)
Incineration: 8 Incinerators @ 76.8 dry ton/day 614 dry ton/day
460.8 dry ton/day (based on 6 of 8 incinerators in
service)
COF: 3 Trains @ 200 dry ton/day ea. 600 dry ton/day 300 dry ton/day (based on
50% in service)
WRRF Unit Process Capacities

Considerations• Rainfall is rarely spatially uniform producing complex and
variable flow patterns• Member Partners have a wide range of actual flows and
contract capacities• GLWA currently has a high level of control in the system with
gates, in-system storage devices, pump stations and regulators• Updating models and running scenarios is providing ideas for
further optimization• Optimization of existing assets involves moving flows around
the system and storing in locations that will vary significantly from storm to storm
• Although the wastewater system is currently treating approximately 97% of wet weather flows, untreated discharges still occur
• Coordinated regional operations is key

Questions?


8/1/18
1
THE FOSTER GROUPTFG
Wastewater Charges Methodology SummaryChargesWorkGroupMeetingAugust2,2018
THE FOSTER GROUP
TFG
Presentation Outline / Key Messages
• Thisdiscussiondocumentprovidesmaterialthathasbeenprepared(andpreviouslypresented)regardingthecurrentwastewaterchargesmethodologyüPortionsareexcerptedfromthe“preSymposium”primerthatwasdistributedtoparticipants
• Nothingcontainedhereinis“newmaterial”
2
8/1/18
2
THE FOSTER GROUP
TFG
GLWA Wastewater Charges Methodology – Cost Pools• AnnualRevenueRequirementsareassignedto
“CostPools”designedtofacilitatecostsofservicetoCustomersüCommon-to-All(“CTA”)SHAREs
§ WaterResourceRecoveryFacility,Interceptors,LiftStationsü SuburbanWholesaleOnly
§ MasterMeterFacilitiesandProgramsüCombinedSewerOverflow(“CSO”)FacilitiesüOaklandMacombInterceptorDistrict(“OMID”)specificfacilities
ü IndustrialWasteControl(“IWC”)ProgramüNote– anyLocalSystemspecificcostsrelatedtoservicetoDetroitareremovedbeforecostallocation
3
THE FOSTER GROUP
TFG
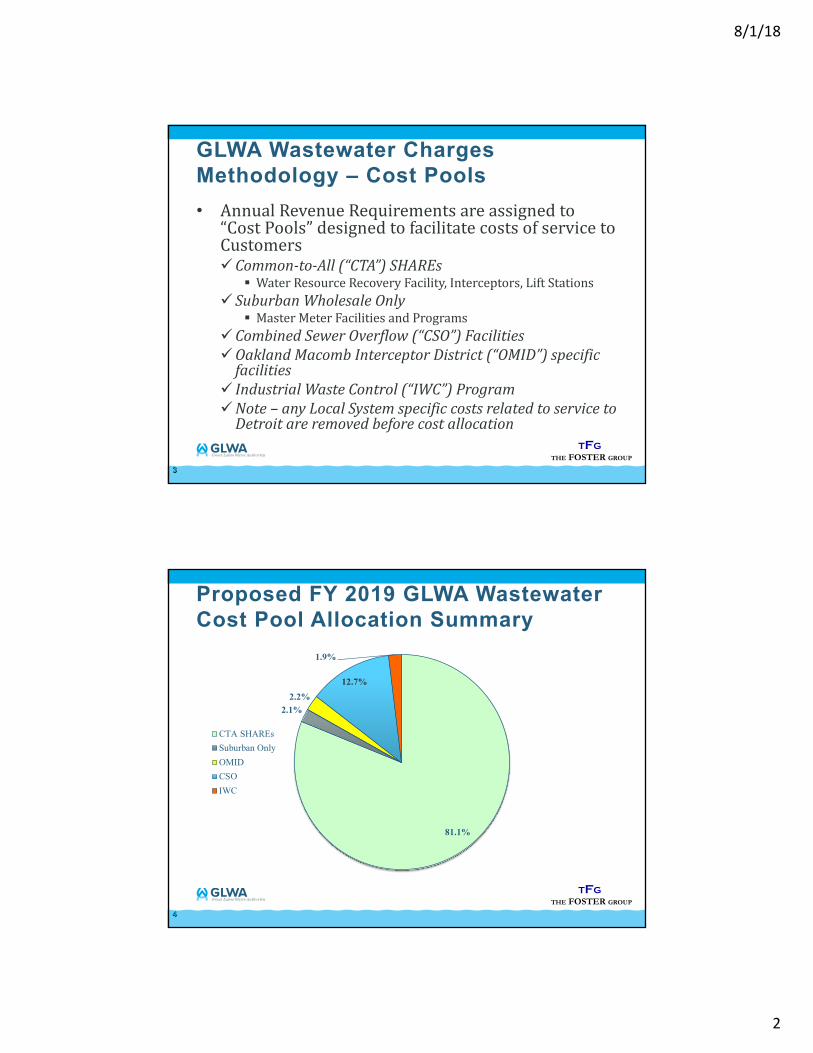
Proposed FY 2019 GLWA Wastewater Cost Pool Allocation Summary
4
81.1%
2.1%2.2%
12.7%
1.9%
CTA SHAREsSuburban OnlyOMIDCSOIWC

8/1/18
3
THE FOSTER GROUP
TFG
GLWA Wastewater Charges Methodology – CTA SHAREs
• GLWAassignsrevenuerequirementsto“sub”costpoolswithintheCTASHAREscategory
• Theseadditionalcategoriesaredesignedtoalignwithcostcausativecollection,treatment,anddisposalfunctions
5
THE FOSTER GROUP
TFG
Wastewater Collection & Treatment
TSSBODVolume PHOS FOG
Flow Strength (Pollutant Loadings)6
GLWA Wastewater Charges Methodology CTA SHARE Cost Pools

8/1/18
4
THE FOSTER GROUP
TFG
GLWA Wastewater Charges Methodology – Capital Rev Req’ts
7
Functional / Service Cost Allocation Matrix - CAPITAL COSTSEffective Methodology Applied for FY 2017 GLWA Revenue Requirements via Rate Simplification Initiative
(1) (2) (3) (4) (5) (6) (7) (8) (9) (10)
Directly Assigned Common-to-AllCost Wholesale OMID Costs Allocable via SHAREs New CSO IndustryCode System Component Only Only Volume BOD TSS PHOS FOG Facilities Customer Only
0101 Primary Pumping 100%0102 Rack & Grit 100%0103 Primary Chemical Addition 100%0104 Primary Sedimentation 85% 10% 5%0105 Aeration 20% 80%0106 Secondary Clarifiers 65% 35%0107 Chlorination 100%0108 Sludge Treatment 15% 70% 15%0109 Scum Incineration 100%0110 Process Water & Outfall 100%0111 Industry Only 100%0201 Laboratory Allocated to WWTP functions based on subtotal of direct allocations0202 Process Water & Outfall Allocated to WWTP functions based on subtotal of direct allocations0203 Heating Plant Allocated to WWTP functions based on subtotal of direct allocations0204 General Plant Allocated to WWTP functions based on subtotal of direct allocations1904 OMID Pump Stations 100%1905 Common Pump Stations 100%2004 OMID Interceptors 100%2005 Common Interceptors 100%2007 Suburban Meters 100%3000 New CSO Facilities - 83/17 100%
THE FOSTER GROUP
TFG
GLWA Wastewater Charges Methodology – Operating Rev Req’ts
8
Functional / Service Cost Allocation Matrix - OPERATING COSTSEffective Methodology Applied for FY 2017 GLWA Revenue Requirements via Rate Simplification Initiative
(1) (2) (3) (4) (5) (6) (7) (8) (9) (10)
Directly Assigned Common-to-AllCost Wholesale OMID Costs Allocable via SHAREs New CSO IndustryCode System Component Only Only Volume BOD TSS PHOS FOG Facilities Customer Only
0101 Primary Pumping 100%0102 Rack & Grit 100%0103 Primary Chemical Addition 100%0104 Primary Sedimentation 70% 20% 10%0105 Aeration 100%0106 Secondary Clarifiers 25% 65% 10%0107 Chlorination 100%0108 Sludge Treatment 15% 70% 15%0109 Scum Incineration 100%0110 Process Water & Outfall 100%0111 Industry Only 100%0201 Laboratory Allocated to WWTP functions based on subtotal of direct allocations0202 Process Water & Outfall Allocated to WWTP functions based on subtotal of direct allocations0203 Heating Plant Allocated to WWTP functions based on subtotal of direct allocations0204 General Plant Allocated to WWTP functions based on subtotal of direct allocations1904 OMID Pump Stations 100%1905 Common Pump Stations 100%2004 OMID Interceptors 100%2005 Common Interceptors 100%2007 Suburban Meters 100%3000 New CSO Facilities - 83/17 100%
Administriative and General Allocated to all other functions based on subtotal of direct allocations

8/1/18
5
THE FOSTER GROUP
TFG
SHAREs Assessment Project UpdateCost Pool Allocations • IncompletependingdevelopmentofFY2018Budget• NochangesfromStatusQuoapproachareanticipatedforFY2018
pendingadditionalstudy• However,thespecificsoftheFY2018Budgetmayresultinshifts
amongstcostpoolsandpossibleimpactsonCustomers• ApproximateRelativeCommontoAllCostPoolAllocation– Current
SHAREs:
9
O&M Capital Total
Volume 28% 61% 47%
Strength 72% 39% 53%
From FY 2018 SHAREs Update
Used 50/50 for purposes of FY 2018 SHAREs
THE FOSTER GROUP
TFG
Alignment of “Allocated Costs” and“Units of Service”
• Thepriormaterialillustratesthecurrentmethodologyfor“populating”costcausativeCostPools
• Step 2 is determining how best to measureeachCustomer’suseofeachCostPoolüUnitsofService,whichthenaresimplifiedintoSHAREs
10

8/1/18
6
THE FOSTER GROUP
TFG
GLWA Wastewater Charges Methodology – CTA SHAREs
• SHAREsaredevelopedbasedonreviewofhistoricaldatamonitoredforeachCustomerandfortheSystemintotal
• Datareviewedincludes:üContributedWastewaterVolume:
§ SanitaryFlows§ DryWeatherInfiltration§ WetWeatherInflow
üPollutantLoadingsforeachtypeofflow,re:§ BOD,TSS,PHOS,FOG
11
THE FOSTER GROUP
TFG
GLWA Wastewater Charges Methodology – CTA SHAREs
• TheunderlyingdataisusedtoassigneachCustomer’sresponsibility(share)foreachoftheCTAcostpools
• SHAREsrepresenttheaggregationoftheindividualshares foreachcostpool
12

8/1/18
7
THE FOSTER GROUP
TFG
Estimated "Strength of Flow" Factors - mg/lBOD TSS PHOS FOG
Sanitary Contributions 274.5 322.9 7.6 34.8Dry Weather Infiltration 6.6 6.8 0.3 0.0Wet Weather Inflow 14.5 125.9 0.2 14.0
"Common" Extraneous Flow 117.4 161.3 3.3 17.2
Weighted Avg Flow to WRRF 95.8 138.5 2.7 14.7
Sample Customer BOD Calculation
Volume Strength Conversion LoadingsMcf mg/l mg/l lbs
Sanitary Contributions 1,011,100 274.5 0.0624 17,316,100Dry Weather Infiltration 645,800 6.6 0.0624 265,400Wet Weather Inflow 820,900 14.5 0.0624 745,100
---------- ---------- Customer Contributions to WRRF 2,477,800 118.5 18,326,600
Total for All Customers 23,690,800 173,326,400Customer Share 10.46% 10.57%
GLWA Wastewater Charges Methodology –Sample Customer SHARE Calculation
13
THE FOSTER GROUP
TFG
Sample Customer BOD Calculation
Volume Strength Conversion LoadingsMcf mg/l mg/l lbs
Sanitary Contributions 1,011,100 274.5 0.0624 17,316,100Dry Weather Infiltration 645,800 6.6 0.0624 265,400Wet Weather Inflow 820,900 14.5 0.0624 745,100
---------- ---------- Customer Contributions to WRRF 2,477,800 118.5 18,326,600
Total for All Customers 23,690,800 173,326,400Customer Share 10.46% 10.57%
Consolidated Sample Customer SHARE Calculation
Rev Req't WeightedShare Allocation Share
Volume Share 10.46% 50.00% 5.229%BOD Share 10.57% 15.14% 1.601%TSS Share 11.37% 26.72% 3.037%PHOS Share 10.45% 6.53% 0.683%FOG Share 11.46% 1.61% 0.184%
-------- Consolidated SHARE 10.735%
GLWA Wastewater Charges Methodology –Sample Customer SHARE Calculation (cont’d)
14

8/1/18
8
THE FOSTER GROUP
TFG
Consolidated Sample Customer SHARE Calculation
Rev Req't WeightedShare Allocation Share
Volume Share 10.46% 50.00% 5.229%BOD Share 10.57% 15.14% 1.601%TSS Share 11.37% 26.72% 3.037%PHOS Share 10.45% 6.53% 0.683%FOG Share 11.46% 1.61% 0.184%
-------- Consolidated SHARE 10.735%
Consolidated Sample Customer Revenue Requirement Allocation
Common To All Revenue Requirements - $ 375,967,300Customer SHARE 10.735%
Allocated Customer Revenue Requirements - $ 40,359,100
GLWA Wastewater Charges Methodology –Sample Customer SHARE Calculation (cont’d)
15

PRELIMINARYTFG
THE FOSTER GROUP 2/1/18
Table 3Sewage Disposal System
Allocation of FY 2019 GLWA Wholesale Service BUDGET to Cost Pools(1) (2) (3) (4) (5) (6) (7) (8)
Cost PoolsAllocated Common to All Suburban OMID CSO Industrial Common-to-All (SHAREs) Common-to-All (SHAREs)FY 2019 SHAREs Wholesale Specific Facilities Waste Control Flow Pollutants
BUDGET Elements1 Regional System O&M Expense 193,122,000 157,127,900 3,926,000 6,046,800 18,781,700 7,239,600 47,350,100 109,777,8002 Pension Obligation - Operating Portion 10,824,000 8,375,600 267,000 411,300 1,277,500 492,400 2,577,800 5,797,8003 Debt Service 214,991,000 174,412,400 4,407,800 2,817,200 33,042,700 310,800 117,898,900 56,513,5004 Non-Operating Portion of Pension Oblig 11,620,700 8,992,100 286,700 441,600 1,371,500 528,700 2,767,600 6,224,5005 Transfer to WRAP Fund 2,261,000 1,832,300 46,700 50,400 287,700 43,900 905,200 927,1006 Transfer to Extra. Repair and Repl. Fund 627,000 508,700 12,900 8,200 96,400 900 343,900 164,8007 Lease Payment - Transfer to Detroit Local I&E 27,500,000 22,285,600 567,500 613,600 3,499,500 533,700 11,009,600 11,276,0008 Transfer to GLWA Regional I&E Account 12,010,600 9,743,600 246,200 157,400 1,846,000 17,400 6,586,500 3,157,1009 Operating Reserves 1,853,800 1,508,400 37,700 58,000 180,300 69,500 454,500 1,053,900
------------ ------------ ------------ ------------ ------------ ------------ ------------ ------------ 10 Total Gross BUDGET 474,810,100 384,786,600 9,798,500 10,604,500 60,383,300 9,236,900 189,894,100 194,892,500
11 less: Non-Operating Revenue (4,570,900) (3,704,200) (94,300) (102,000) (581,700) (88,700) (1,829,900) (1,874,300) ------------ ------------ ------------ ------------ ------------ ------------ ------------ ------------
12 Net BUDGET Req'd from Charges 470,239,200 381,082,400 9,704,200 10,502,500 59,801,600 9,148,200 188,064,200 193,018,200
Summary - BUDGET Required from Charges13 Net Operating Expenses 205,799,800 167,011,900 4,230,700 6,516,100 20,239,500 7,801,500 50,382,400 116,629,50014 Net Capital Requirements 264,439,400 214,070,500 5,473,500 3,986,400 39,562,100 1,346,700 137,681,800 76,388,700
------------ ------------ ------------ ------------ ------------ ------------ ------------ ------------ 15 Total 470,239,200 381,082,400 9,704,200 10,502,500 59,801,600 9,148,200 188,064,200 193,018,20016 Relative Cost Pool Distribution 81.0% 2.1% 2.2% 12.7% 1.9% 40.0% 41.0%
Page 3-S
PROPOSED

PRELIMINARYTFG
THE FOSTER GROUP 2/1/18
Table 5Sewage Disposal System
Summarized FY 2019 Wholesale Service BUDGET Allocation to Cost Pools and Customer Classes(1) (2) (3) (4) (5) (6) (7) (8) (9)
Cost Pool AllocationAmount to Common Suburban OMID CSO Industrial Common to All (b)Allocate to All Wholesale Specific Facilities Waste Control TOTAL Flow Pollutants
$ $ $ $ $ $ $ $ $BUDGET Elements
1 Net Operating Expenses 205,799,800 167,011,900 4,230,700 6,516,100 20,239,500 7,801,500 205,799,700 50,382,400 116,629,5002 Net Capital Requirements 264,439,400 214,070,500 5,473,500 3,986,400 39,562,100 1,346,700 264,439,200 137,681,800 76,388,700
------------- ------------- ------------- ------------- ------------- ------------- ------------- ------------- ------------- 3 Net to Recover from Charges 470,239,200 381,082,400 9,704,200 10,502,500 59,801,600 9,148,200 470,238,900 188,064,200 193,018,200
Allocated to Industrial4 Net Operating Expenses 10,892,200 3,090,700 0 0 0 7,801,500 10,892,200 0 3,090,7005 Net Capital Requirements 3,371,100 2,024,400 0 0 0 1,346,700 3,371,100 0 2,024,400
------------- ------------- ------------- ------------- ------------- ------------- ------------- ------------- ------------- 6 Net to Recover from Charges 14,263,300 5,115,100 0 0 0 9,148,200 14,263,300 0 5,115,100
Net Req'd from Customers7 Net Operating Expenses 194,907,600 163,921,200 4,230,700 6,516,100 20,239,500 0 194,907,500 50,382,400 113,538,8008 Net Capital Requirements 261,068,300 212,046,100 5,473,500 3,986,400 39,562,100 0 261,068,100 137,681,800 74,364,300
------------- ------------- ------------- ------------- ------------- ------------- ------------- ------------- ------------- 9 Net BUDGET from Charges 455,975,900 375,967,300 9,704,200 10,502,500 59,801,600 0 954,741,100 188,064,200 187,903,100
(a) Industrial Surcharge Customers based on % of total influent pollutant loadings that are "surchargeable" 2.65%(b) Relative Flow/Pollutants in CTA Cost Pool 50% 50%
Page 5-S
PROPOSED

PRELIMINARYTFG
THE FOSTER GROUP 1/31/18
Consolidated Allocation of Wastewater Operating Costs to Cost Pools - FY 2019 Budget
Goal is to allocate specific budget items within the Group that align with Cost Pools used to allocate costs to customers.Based on the assignment to Groups, Functional Category allocation factors can be applied to allocate to Cost PoolsThe FY 2019 allocation factors are based on historical data and judgement. The upcoming Sewer Cost Allocation Methodology Project will review these factors.
Step 1 - Summarize Group Expenes Wastewater System Functional CategoriesWRRF Cost Allocation Wastewater Collection Cost Allocation Grand
Primary Rack & Primary Secondary Sludge General Lift CSO Industrial Master Admin & TotalPumping Grit Treatment Aeration Treatment Dewatering Disposal WRRF Stations Facilities Interceptors Waste Control Meters General O&M
Wastewater Operations GroupTotal 5,481,600 3,411,200 9,640,900 13,801,500 10,697,100 13,680,500 41,689,600 3,727,100 14,853,900 0 5,725,600 289,400 122,999,300Power 2,869,500 1,147,800 574,000 2,295,600 1,377,400 2,869,500 1,398,300 0 0 0 0 0 12,532,100Chemicals 282,600 421,400 2,103,000 2,640,800 2,639,900 1,008,500 982,800 0 0 0 0 0 10,079,900Other Utilities 449,300 449,300 449,100 1,797,000 449,300 449,300 7,335,900 0 0 0 0 0 11,379,200Subtotal w/o Commodities 1,880,200 1,392,700 6,514,800 7,068,100 6,230,500 9,353,200 31,972,600 3,727,100 14,853,900 0 5,725,600 289,400 89,008,100WTP Allocation Factors 2.9% 2.2% 10.1% 11.0% 9.7% 14.5% 49.6% 100.0%
Centralized ServicesOriginal Allocation 10,591,300 14,093,900 0 9,343,800 0 2,815,600 36,844,600Allocation of General 309,200 229,000 1,071,200 1,162,200 1,024,500 1,537,900 5,257,300 (10,591,300) 0Allocated Total 309,200 229,000 1,071,200 1,162,200 1,024,500 1,537,900 5,257,300 0 14,093,900 0 9,343,800 0 2,815,600 36,844,600
Subtotal "Direct" Total 5,790,800 3,640,200 10,712,100 14,963,700 11,721,600 15,218,400 46,946,900 0 17,821,000 14,853,900 9,343,800 5,725,600 3,105,000 159,843,900Subtotal "Direct" w/o Commodities 2,189,400 1,621,700 7,586,000 8,230,300 7,255,000 10,891,100 37,229,900 0 17,821,000 14,853,900 9,343,800 5,725,600 3,105,000 125,852,700Indirect Overhead Allocation Factors 1.7% 1.3% 6.0% 6.5% 5.8% 8.7% 29.6% 0.0% 14.2% 11.8% 7.4% 4.5% 2.5% 100.0%
Administrative ServicesOriginal Allocation 33,278,300 33,278,300Allocation of General 578,900 428,800 2,005,900 2,176,300 1,918,400 2,879,900 9,844,400 0 4,712,300 3,927,700 2,470,700 1,514,000 821,000 (33,278,300) 0Allocated Total 578,900 428,800 2,005,900 2,176,300 1,918,400 2,879,900 9,844,400 0 4,712,300 3,927,700 2,470,700 1,514,000 821,000 0 33,278,300
ALLOCATED GRAND TOTAL 6,369,700 4,069,000 12,718,000 17,140,000 13,640,000 18,098,300 56,791,300 0 22,533,300 18,781,600 11,814,500 7,239,600 3,926,000 0 193,122,200
Step 2 - Develop Allocation Factors Cost Pool AllocationBased on Prior Simplified Assumptions Common-to-All (SHAREs) Suburban OMID CSO Industrial Det Only
Flow BOD TSS PHOS FOG Wholesale Specific Facilities Waste Control Direct
Primary Pumping 100.00%Rack & Grit 100.00%Primary Chemical Addition 100.00%Primary Sedimentation 70.00% 20.00% 10.00%Aeration 100.00%Secondary Clarification 25.00% 65.00% 10.00%Chlorination 100.00%Dewatering 15.00% 70.00% 15.00%Sludge Treatment 15.00% 70.00% 15.00%Process Water & Outfall 100.00%Lift Stations 75.00% 25.00%CSO Facilities 100.00%Interceptors 96.50% 3.50%Industrial Waste Control 100.00%Suburban Meters 100.00%
Page 15

PRELIMINARYTFG
THE FOSTER GROUP 1/31/18
Consolidated Allocation of Wastewater Operating Costs to Cost Pools - FY 2019 Budget
Goal is to allocate specific budget items within the Group that align with Cost Pools used to allocate costs to customers.Based on the assignment to Groups, Functional Category allocation factors can be applied to allocate to Cost PoolsThe FY 2019 allocation factors are based on historical data and judgement. The upcoming Sewer Cost Allocation Methodology Project will review these factors.
Step 3 - Apply Allocation Factors Cost Pool AllocationCommon-to-All (SHAREs) Suburban OMID CSO Industrial Det Only Allocated
Flow BOD TSS PHOS FOG Wholesale Specific Facilities Waste Control Direct TOTALAll Operating CostsPrimary Pumping 6,369,700 6,369,700 0 0 0 0 0 0 0 0 0 6,369,700Rack & Grit 4,069,000 4,069,000 0 0 0 0 0 0 0 0 0 4,069,000Primary Chemical Addition 2,103,000 0 0 0 2,103,000 0 0 0 0 0 0 2,103,000Primary Sedimentation 10,615,000 0 0 7,430,500 2,123,000 1,061,500 0 0 0 0 0 10,615,000Aeration 17,140,000 0 17,140,000 0 0 0 0 0 0 0 0 17,140,000Secondary Clarification 11,000,100 0 2,750,000 7,150,100 1,100,000 0 0 0 0 0 0 11,000,100Chlorination 2,639,900 2,639,900 0 0 0 0 0 0 0 0 0 2,639,900Dewatering 18,098,300 0 2,714,700 12,668,800 2,714,700 0 0 0 0 0 0 18,098,200Sludge Treatment 56,791,300 0 8,518,700 39,753,900 8,518,700 0 0 0 0 0 0 56,791,300Process Water & Outfall 0 0 0 0 0 0 0 0 0 0 0 0Lift Stations 22,533,300 16,900,000 0 0 0 0 0 5,633,300 0 0 0 22,533,300CSO Facilities 18,781,600 0 0 0 0 0 0 0 18,781,600 0 0 18,781,600Interceptors 11,814,500 11,401,000 0 0 0 0 0 413,500 0 0 0 11,814,500Industrial Waste Control 7,239,600 0 0 0 0 0 0 0 0 7,239,600 0 7,239,600Suburban Meters 3,926,000 0 0 0 0 0 3,926,000 0 0 0 0 3,926,000
-------------- -------------- -------------- -------------- -------------- -------------- -------------- -------------- -------------- -------------- -------------- -------------- Total 193,121,300 41,379,600 31,123,400 67,003,300 16,559,400 1,061,500 3,926,000 6,046,800 18,781,600 7,239,600 0 193,121,200Cost Pool Allocation Factor - All Costs 21.4% 16.1% 34.7% 8.6% 0.5% 2.0% 3.1% 9.7% 3.7% 0.0%
Non-Commodity CostsPrimary Pumping 2,189,400 2,189,400 0 0 0 0 0 0 0 0 0 2,189,400Rack & Grit 1,621,700 1,621,700 0 0 0 0 0 0 0 0 0 1,621,700Primary Chemical Addition 0 0 0 0 0 0 0 0 0 0 0Primary Sedimentation 7,586,000 0 0 5,310,200 1,517,200 758,600 0 0 0 0 0 7,586,000Aeration 8,230,300 0 8,230,300 0 0 0 0 0 0 0 0 8,230,300Secondary Clarification 7,255,000 0 1,813,800 4,715,800 725,500 0 0 0 0 0 0 7,255,100Chlorination 0 0 0 0 0 0 0 0 0 0 0Dewatering 10,891,100 0 1,633,700 7,623,800 1,633,700 0 0 0 0 0 0 10,891,200Sludge Treatment 37,229,900 0 5,584,500 26,060,900 5,584,500 0 0 0 0 0 0 37,229,900Process Water & Outfall 0 0 0 0 0 0 0 0 0 0 0 0Lift Stations 17,821,000 13,365,800 0 0 0 0 0 4,455,300 0 0 0 17,821,100CSO Facilities 14,853,900 0 0 0 0 0 0 0 14,853,900 0 0 14,853,900Interceptors 9,343,800 9,016,800 0 0 0 0 0 327,000 0 0 0 9,343,800Industrial Waste Control 5,725,600 0 0 0 0 0 0 0 0 5,725,600 0 5,725,600Suburban Meters 3,105,000 0 0 0 0 0 3,105,000 0 0 0 0 3,105,000
-------------- -------------- -------------- -------------- -------------- -------------- -------------- -------------- -------------- -------------- -------------- -------------- Total 125,852,700 26,193,700 17,262,300 43,710,700 9,460,900 758,600 3,105,000 4,782,300 14,853,900 5,725,600 0 125,853,000Cost Pool Allocation Factor - Non Commodity Costs 20.8% 13.7% 34.7% 7.5% 0.6% 2.5% 3.8% 11.8% 4.5% 0.0%
Page 16

PRELIMINARYTFG
THE FOSTER GROUP 1/30/18
Allocation of Wastewater Capital Revenue Requirements to Cost Pools - FY 2019 Budget
Goal is to use recent GLWA asset inventory and valuation analysis to establish allocation of capital revenue requirements (debt service, etc) to Cost Pools and Customers.First step: Evaluate data from recent capital asset inventory and valuation study.Then: Utilize this information to establish functional allocation of capital revenue requirements.Final: Allocate capital revenue requirements to Cost Pools based on existing methodology matrices.
Step 3 - Allocate to Cost Pools (1) (2) (3) (4) (5) (6) (7) (8) (9) (10) (11) (12) (13) (14) (15) (16) (17)
Capital Revenue Requirement Allocation Factors Allocation of Capital Revenue Requirements to Cost PoolsTotal Capital Common-to-All (SHAREs) Common-to-All (SHAREs) Suburban OMID CSO Industrial Det Only
Rev Req't Flow BOD TSS PHOS FOG Other Flow BOD TSS PHOS FOG Wholesale Specific Facilities Waste Control Direct
1 Primary Pumping 14,035,300 100% 14,035,300 0 0 0 02 Rack & Grit 6,705,300 100% 6,705,300 0 0 0 03 Primary Chemical Addition 0 100% 0 0 0 0 04 Primary Sedimentation 21,280,400 85% 10% 5% 18,088,300 0 2,128,000 0 1,064,0005 Aeration 10,996,900 20% 80% 2,199,400 8,797,500 0 0 06 Secondary Clarification 19,609,100 65% 35% 12,745,900 6,863,200 0 0 07 Chlorination 0 100% 0 0 0 0 08 Dewatering 0 15% 70% 15% 0 0 0 0 09 Sludge Treatment 55,204,600 15% 70% 15% 0 8,280,700 38,643,200 8,280,700 010 Process Water & Outfall 11,386,800 100% 11,386,800 0 0 0 011 Lift Stations 21,794,000 100% 21,794,000 0 0 0 012 CSO Facilities 34,282,500 Direct Cost Pool Allocation 34,282,50013 Interceptors 20,667,600 96.5% 3.5% 19,944,200 0 0 0 0 723,40014 Industrial Waste Control 322,500 Direct Cost Pool Allocation 322,50015 Suburban Meters 4,573,200 Direct Cost Pool Allocation 4,573,20016 OMID Facilities 2,199,500 Direct Cost Pool Allocation 2,199,500
------------ ------------ ------------ ------------ ------------ ------------ ------------ ------------ ------------ ------------ ------------ 17 Total 223,057,700 106,899,200 23,941,400 40,771,200 8,280,700 1,064,000 4,573,200 2,922,900 34,282,500 322,500 018 Capital Revenue Req't Allocation Factor 47.9% 10.7% 18.3% 3.7% 0.5% 2.1% 1.3% 15.4% 0.1% 0.0%
Page 22

PRELIMINARYTFG
THE FOSTER GROUP 1/31/18
Consolidated Sewer Revenue Requirment Allocated to Cost Pools - FY 2019 Budget
Goal is to use allocation factors resulting from detailed review to allocate the final 2019 BUDGET figures for the FY 2019 Charges
Allocation Factors from Detailed Review Cost Pool AllocationCommon-to-All (SHAREs) Suburban OMID CSO Industrial Det Only
Flow BOD TSS PHOS FOG Wholesale Specific Facilities Waste Control Direct
O&M Expense - Total 1 21.4% 16.1% 34.7% 8.6% 0.5% 2.0% 3.1% 9.7% 3.7% 0.0%O&M Expense - Non-Commodity 2 20.8% 13.7% 34.7% 7.5% 0.6% 2.5% 3.8% 11.8% 4.5% 0.0%Capital Revenue Requirements 3 47.9% 10.7% 18.3% 3.7% 0.5% 2.1% 1.3% 15.4% 0.1% 0.0%
Apply Allocation Factors to BUDGET Cost Pool AllocationBudget to Allocation Common-to-All (SHAREs) Suburban OMID CSO Industrial Det Only AllocatedAllocate Basis Flow BOD TSS PHOS FOG Wholesale Specific Facilities Waste Control Direct TOTAL
BUDGET Elements1 Regional System O&M Expense 193,122,000 1 41,379,800 31,123,500 67,003,600 16,559,500 1,061,500 3,926,000 6,046,800 18,781,700 7,239,600 0 193,122,0002 Pension Obligation - Operating Portion 10,824,000 2 2,252,800 1,484,600 3,759,300 813,700 65,200 267,000 411,300 1,277,500 492,400 0 10,823,8003 Debt Service 214,991,000 3 103,033,300 23,075,600 39,296,800 7,981,200 1,025,500 4,407,800 2,817,200 33,042,700 310,800 0 214,990,9004 Non-Operating Portion of Pension Oblig 11,620,700 2 2,418,600 1,593,900 4,036,000 873,600 70,000 286,700 441,600 1,371,500 528,700 0 11,620,6005 Transfer to WRAP Fund 2,261,000 4 791,100 299,200 594,100 136,300 11,600 46,700 50,400 287,700 43,900 0 2,261,0006 Transfer to Extra. Repair and Repl. Fund 627,000 3 300,500 67,300 114,600 23,300 3,000 12,900 8,200 96,400 900 0 627,1007 Lease Payment - Transfer to Detroit Local I&E 27,500,000 4 9,621,400 3,639,200 7,226,000 1,657,400 141,600 567,500 613,600 3,499,500 533,700 0 27,499,9008 Transfer to GLWA Regional I&E Account 12,010,600 3 5,756,000 1,289,100 2,195,300 445,900 57,300 246,200 157,400 1,846,000 17,400 0 12,010,6009 Operating Reserves 1,853,800 1 397,200 298,800 643,200 159,000 10,200 37,700 58,000 180,300 69,500 0 1,853,900
------------ ------------ ------------ ------------ ------------ ------------ ------------ ------------ ------------ ------------ ------------ ------------ 10 Total Gross BUDGET 474,810,100 165,950,700 62,871,200 124,868,900 28,649,900 2,445,900 9,798,500 10,604,500 60,383,300 9,236,900 0 474,809,800
11 less: Non-Operating Revenue (4,570,900) 4 (1,599,200) (604,900) (1,201,100) (275,500) (23,500) (94,300) (102,000) (581,700) (88,700) 0 (4,570,900) ------------ ------------ ------------ ------------ ------------ ------------ ------------ ------------ ------------ ------------ ------------ ------------
12 Net BUDGET Req'd from Charges 470,239,200 164,351,500 62,266,300 123,667,800 28,374,400 2,422,400 9,704,200 10,502,500 59,801,600 9,148,200 0 470,238,900
13 Subtotal Direct Elements 154,840,500 58,566,700 116,291,000 26,673,900 2,279,500 9,133,700 9,874,300 56,319,400 8,588,900 0 442,567,90014 Allocation Factors for Indirect Elements 4 35.0% 13.2% 26.3% 6.0% 0.5% 2.1% 2.2% 12.7% 1.9% 0.0%
Page 24

Aug-18 Sep-18 Oct-18 Nov-18 Dec-18 Jan-19 Feb-19 Mar-19 Apr-19 May-19 Jun-19 Jul-19 Aug-19 Sep-19 Oct-19 Nov-19 Dec-19
1 Combined / Coordinated Work Group Meetings1a Gain Understanding of Current Design / Operating Structure X1b Final Recommended Methodology X1c Consolidated Findings - Application of Technical/Cost Data to Methodology X1d Application of Findings to Preliminary FY 2021Budget X1e Consolidated Progress Update Meeting X X X X
2 Wastewater Charges Methodology Work Group2a Gain Understanding of Current Design / Operating Structure X2b Explore Alternative Methodology Approaches2c Identify 3rd Party Scope of Services X2d Procure 3rd Party X2e 3rd Party Recommended Methodology Due X2f Review and Establish Consensus Recommendation re: Matrix2g Final Work Group Methodology Recommendation X2h Identify Data Needs from Sewer SHAREs Work Group X2i Collaboratively Review Technical Data2j Identify Cost Pool Requirements of Cost Allocation Project X
3 Sewer SHAREs Work GroupStrength of Flow Sampling
3a Review and understand sampling from last SHAREs update3b Finalize sampling plan3c Perform sampling3d Analyze sampling data3e Consider update of 2016 Strength of Flow recommendations
Flow Analyses3f Install and collect data from WWMP meters3g Install and collect data from D+ meters3h Review data frorm new metering efforts3i Determine use of new metering data (direct measurement, extrapolation, etc.)3j Compile FY2015 through FY2019 metered flows3k Review and update Table 1 from the 2016 Sewer Share Assessment Report X
Peaking3l Select options for compiling peak flow data
3m Prepare peaking datasets3n Review peaking datasets3o Other Data As Requested3p Final 2019 Sewer Shares Assessment Report X
4 Cost Allocation Project4a Establish / Refine Financial Systems to Align with Cost Pools4b Refined Functional Cost Structure / Reporting Capability Implemented X4c Prepare / Deliver FY 2021 Cost of Service Study X
Wastewater Charges Methodology Review Project Work Plan

EXECUTIVE SUMMARY
GROUP NAME: Charges Work Group Meeting
ATTENDEES: 48 Participants
MEETING DATE: August 2, 2018
● Overview of the wastewater system ● Review current charges methodology ● Discuss SHAREs and Charges Methodology work groups’ respective membership, mission, and guiding principles
● None
● None
● Each Tier 1 community to designate one primary and one secondary (backup) representative to participate in the Sewer SHAREs and Charges Methodology Work Groups. Direct member participation is required for the Charges Methodology Work Group; members or member representatives are welcome in SHAREs.
● Members are asked to keep their elected leadership and key stakeholders informed of the progress and decisions made throughout the process.

Discussion Highlights
1. Welcome and Agenda Review - Kerry Sheldon, Bridgeport Consulting ● Desired outcomes: To deepen our shared understanding of:
○ How the wastewater system operates under both dry and wet conditions ○ How the current charges methodology is structured ○ The overall charges schedule
2. Opening Remarks - Sue McCormick, GLWA ● I very much appreciate the investment everyone has made already to this process: from
participating in the symposium to reconvening a couple weeks ago to weigh in on the path forward.
● We know the work ahead will be a heavy lift, and it’s encouraging to see everyone’s willingness to do that work alongside us.
● As requested, we’re going to get into the details of what that work looks like today, beginning with a walk-through of how the wastewater system operates under different conditions. We heard loud and clear that this type of shared understanding is vital.
● Before we do that, though, I also wanted to respond to a few offline comments and concerns members have shared through Outreach.
● Specifically, we’ve focused a lot on the technical work and the financial work - but what about the policy work? What are the policy parameters that define that work? How do we ensure acceptance by our respective governing bodies when all this good work comes to conclusion?
● Please know that these questions are of paramount importance - they are top of mind for me. My leadership team and I will be engaging with the GLWA Board regularly, both to help articulate those parameters, and be absolutely sure they are well-informed at every step along the way.
● As several people mentioned at our last meeting, making sure there are no surprises is a key success factor to this process.
● To that end, you’ll hear later today our request - and in fact, expectation - that you do the same with your elected leadership and other key stakeholders. It’s a shared responsibility to bring everyone along. We’re all in this together.
3. Overview of the Wastewater System - Suzanne Coffey, GLWA
● Suzanne provided an overview of how the wastewater system works, inclusive of the WRRF, interceptors, and other facilities (see presentation for details)
● Suzanne concluded the presentation with several considerations that shape the path
forward: ○ Rainfall is variable, which produces complex and variable flow patterns. It’s not
intuitive where all the flows are going, so we need models to understand.
1

○ There’s a wide range of actual flows and contract capacities among members. ○ We have a high level of control in the system with gates and in-system storage
devices. ○ As we are updating models and running scenarios, we are discovering new ideas
for further optimization to reduce overflows. ○ Optimization of existing assets involves moving flows around; focusing on the
region rather than any individual component of the system. 97% of overflows are treated, but we all agree further reduction of untreated overflows is the goal.
○ Coordinated regional operations is key. At the Symposium, Seattle said they “just build it bigger,” meaning they just continue to upsize their infrastructure to accommodate higher volumes. We don’t want to do that; we want to optimize what we have.
● Questions and answers, comments and responses:
1. Detroit relief sewers have excess capacity - could these hold flow from
suburban communities? How could that be leveraged for the region’s benefit as a whole?
a. This concept is precisely aligned with the regional optimization approach described earlier. Must keep in mind that the specific way we optimize will depend on the storm, so modeling is needed. We’re starting to run these scenarios to understand what will happen.
2. Ah-ha moment about possibilities: in upstream facilities currently, we quickly dewater the retention treatment basin (RTB). Does that practice contribute to a downstream discharge? Maybe an operating practice serves the particular community, but it may be contributing to a discharge downstream.
a. Agreed. The Wastewater Master Plan steering team has also talked about this phenomenon. We foresee a need to have a work group to transcend the WWMP to drive the Regional Operating Plan. The SCC can quarterback who will dewater and when. We don’t anticipate having one single permit, but DEQ will review a Regional Operating Plan that may be referenced in each permit.. Spatial variation in rains means that we would be able to store in some areas to prevent overflows. Scenarios are being modeled as part of WWMP.
3. Can we get the PowerPoint presentation, rather than a PDF, that retains the arrows?
a. Yes!
4. Why are there 23 secondary clarifiers on all the time; why not use them just in wet weather?
a. Keeping the clarifiers active maintains the sludge blankets, which are important. The health of the “bugs” in the clarifiers is critical to maintain.
2

5. What forum is the opportunity to get into the detail? First meeting of the methodology work group?
a. Yes, that’s correct - both in the Sewer Shares and Methodologies work groups, as well as in the WWMP Steering Team.
6. You described system performance into both wet and dry scenarios: would it make sense to evaluate four scenarios: dry, small storm, big storm, and post-storm?
a. In reality, there are probably infinite scenarios possible. And yes, we can and will develop models to look at many different scenarios.
4. Discussion of current charges methodology - Nickie Bateson, GLWA and Bart Foster,
The Foster Group ● Bart notes that the material in the presentation was previously provided to members prior
to Wastewater Charges Symposium, as well. ● Looking back at the 1979 study and the consent judgement, Bart notes some of the
changes: ○ Per the consent agreement, 1100 MGD had to go all the way through the plant,
today we’re at 930 MGD. ○ 3 treatment buckets/capacities: 1700 MGD primary, 930 MGD secondary, solids
● Regarding the 1979 CDM report figure 2.e. - the basic treatment train is the same today. Difference is the incineration and solids treatment. Cost allocation has been refined over time but methodology has remained static since 1979.
● Cost pools established in 1979 remain today: Volume, BOD, TSS, PHOS, FOG. ● Until strength of flow, BOD, TSS, PHOS, FOG costs weren’t differentiated among
member communities. ● First train: primary pumping, rack and grit, primary chemical addition, and primary
sedimentation ● Second train: Aeration, secondary clarifiers, chlorination, and sludge treatment ● Third train: disinfection, dewatering, residuals disposal ● Flow/strength of flow was allocated 50/50 for FY2018 Sewer SHAREs ● Key questions for the Charge Methodology Work Group to consider: Do we have the
right buckets? Do we have all the buckets we need? Are we assigning costs to buckets in an appropriate manner? When those answers are determined, then instruct the technical group to collect data for those buckets.
● Whether or how the 83/17 CSO allocation is addressed is an in depth conversation for the subgroups to address.
● Questions and answers, comments and responses
1. Bart’s last statement regarding key questions for the Charge Methodology Work Group gets to the core of what we’re trying to do.
2. Would like to know the technical decisions that went into the strength of flow
calculation - how do you know what costs go into what buckets? What is the current process? What is the vision? Personnel, electrical, chemical use?
a. The technical basis for each decision (with respect to the matrix that aligns treatment processes with cost pools) is described in
3

great detail in the 1979 study. Developing the future vision is the mission of the Charges Methodology work group.
3. Explain the technical details of how you get to strength of flow for the non-master
metered communities? a. Prior to Rate Simplification, flow modeling was prepared for the
individual non-master metered customer communities. During Rate Simplification, the individual data points for these customers were ignored and they were grouped into “D+” - which was simply total flow reported at the WWRF less estimated “common” infiltration less the flow from the master metered customer communities. We then simply pro-rata assigned D+ flow (by type) to each D+ community based on the old flow balance data, and computed loadings for each customer based on SOF assumptions. The SHAREs work group will take up this topic.
4. Slide 14: Breakout of sanitary contributions. What differences from the current way we recognize peak flows are we contemplating? What are the refinements proposed or desired?
a. This topic will be considered in the Charges Methodology work group.
5. Would like to understand the CSO costs better. a. We will provide an in-depth review of this topic at a future Charges
work group meeting.
6. Observation: The National Symposium participants were able to explain their methodologies. No one without a wastewater treatment background would be able to understand ours. We should be heading more toward simplicity.
A: Agreed. Current GLWA methodology is incredibly complex. It takes three slides to explain the calculations for one pollutant. Simplicity is a worthwhile goal.
5. Work Group Membership, Charges, and Guiding Principles - Kerry Sheldon,
Bridgeport Consulting ● Sewer SHAREs is the technical work group. First meeting is August 3, 12:00 - 2:00 p.m.
Purpose is to generate the data needed to populate the charge methodology. May generate data that is ultimately not used.
● Charges methodology is the financial work group. Will engage a third party consultant to assist in developing the methodology itself, and ultimately using/applying the data from the Sewer SHAREs methodology to populate member-partner charges.
● Subgroups will be populated by first tier members. ● GLWA requests one primary and one alternate representative from each first-tier
community, to ensure coverage when someone is unavailable. ● Designated Sewer SHAREs representative can be a consultant, but on the charges
methodology, direct member participation is sought. (That group will be engaged in third party consultant scope development, etc.; appropriate and aligned with past practice to specify direct member participation.)
4

● Guiding principles for both work groups: 1. Practice the Rules of Collaboration as described in the Partnering Agreement:
● Show mutual respect for each Members’ point of view ● Balance the needs of your individual community or entity with the
interests of the system as a whole ● Work toward consensus on each issue 1
● Enter each meeting with a willingness to acknowledge your own personal bias to encourage and maintain a collaborative working environment
● Respect individual concerns and needs as each member is unique ● Be proactive and take initiative in raising issues and providing
recommendations prior to, during, and after meetings 2. Focus on the long-term impacts of the decisions we make today; ensure alignment with the longer-term vision of where we’re headed as a region (including the wastewater master plan) 3. Maintain good connectivity with our respective communities’
● Questions and answers, comments and responses
○ Suggestion to print and post the 3 Guiding Principles at all meetings ○ Can the work groups throw out the entire methodology and see where we end
up? ■ Yes - that’s for the work groups to determine. Be mindful, however, that
the clock is ticking. Directional convergence is needed within the next few months, and the process must be completed by November 2019.
6. Timeline and Next Steps
● Preliminary timeline is included on Slide 71 of the presentation ● Sewer SHAREs work group meeting: August 3, 12:00pm - 2:00pm, SEMCOG ● Charges Methodology work group - scheduling in process
Participants:
Last Name First Name Organization Email
Alford Dan _GLWA [email protected]
Bantios Evans Macomb County [email protected]
Barrera Elizabeth Wayne County [email protected]
Bateson Nickie _GLWA [email protected]
Brink Phil CDM Smith [email protected]
Brown Gary _GLWA Board [email protected]
Brown Randal _GLWA [email protected]
Burgess Ted CDM Smith [email protected]
1 “Consensus” means an opinion held by all or most of the partnership and/or work group, which is supported by a show of hands.
5

Byron Lori Bridgeport Consulting [email protected]
Cain Brigid Metro Consulting [email protected]
Chirolla Raphael OCWRC [email protected]
Coffey Suzanne _GLWA [email protected]
Cox Carrie OCWRC [email protected]
Foster Bart The Foster Group [email protected]
Galisdorfer Brittany Bridgeport Consulting [email protected]
Gee Sherri _GLWA [email protected]
Gushard Tammy Farmington Hills [email protected]
Harker Ashley _GLWA [email protected]
Hendricks Susan Hamtramck [email protected]
Homminga Scott City of Grosse Pointe Farms [email protected]
Jackson Lavonda _GLWA [email protected]
Kaunelis Vyto OHM [email protected]
Khan Majid _GLWA [email protected]
King Todd _GLWA [email protected]
Koester Laurie _GLWA [email protected]
Kosters Jill _GLWA [email protected]
Mancini Lisa _GLWA [email protected]
McCormick Sue _GLWA [email protected]
McCormack Keith HRC Engineers [email protected]
Merzlyakov Madison _GLWA [email protected]
Minor Tim Applied Science, Inc. [email protected]
Mobley Palencia DWSD [email protected]
Munfakh Abe _GLWA Board [email protected]
Murray Tom Allen Park [email protected]
Murray Jim Dearborn [email protected]
Oswalt Richard _GLWA [email protected]
6

Panicker Mini _GLWA [email protected]
Rothstein Eric GRG [email protected]
Saparia Biren _GLWA [email protected]
Schevtchuk Tom CDM Smith [email protected]
Sedki Maria FTCH [email protected]
Seidel Kyle AEW [email protected]
Sheldon Kerry Bridgeport Consulting [email protected]
Smalley Sam DWSD [email protected]
Stephens Tom City of Detroit [email protected]
Wertz Amanda Allen Park [email protected]
Wheatley Jon _GLWA [email protected]
Witte Eric Dearborn [email protected]
7