charles river ims
TRANSCRIPT

Charles River IMS Portfolio Management
and Risk Analytics
Information Classification: General

The Charles River Portfolio Management and
Risk Analytics
Portfolio Construction
Exposures & Sensitivities
Risk Management
Scenario Analysis
Performance & Attribution
FOUNDATIONS
Analytics Ecosystem and Managed DataMulti-Asset Coverage Asset Valuations
Charles River Portfolio Management and Risk Analytics Information Classification: General

A Complete Solution for Portfolio ManagersCharles River Portfolio Management and Risk Analytics combines all of the necessary capabilities, data, analytics and benchmarks needed to effectively manage large multi-asset portfolios.
The scalable, cloud-based infrastructure helps ensure buy-side firms can handle complex multi-asset portfolios as well as large benchmarks. Native analytics and a high performance modeling engine allow portfolio managers to generate risk forecasts and analyze scenarios in real-time. Charles River’s open architecture and interoperability with a number of leading third-party analytics providers help ensure firms can meet the bespoke demands of their investment process and product mix.
Buy-side firms can replace multiple point systems with a single solution that supports all investment products and asset classes, and provides the front and middle office with a consistent, enterprise-wide view of risk and performance.
Institutional asset managers can implement their entire investment process on Charles River using a common set of data and analytics, and can incorporate third-party risk models and bespoke data sources to support their strategies and products.
The solution provides asset managers with:
1. Portfolio construction and analysis
2. Ex-ante risk modeling and ex-post risk measurement
3. Scenario and trend analysis
4. Performance measurement and attribution
5. Pre-packaged workflows and standardized interfaces
Charles River Portfolio Management and Risk Analytics Information Classification: General
Charles River helps institutional investment managers:
More readily understand risks
with a single, enterprise-wide
view of counterparty exposures and
risk metrics
1
Respond faster to market opportunities
and make more informed allocation,
targeting and hedging decisions
2Increase portfolio
manager and analyst productivity by
providing a complete set of capabilities
that streamline the investment process
3Eliminate disparate
systems by managing all products on a single solution
4Leverage the
latest capabilities and risk models
with cloud-based deployment
5

Portfolio ConstructionCONSTRUCT, ANALYZE AND OPTIMIZE MULTI-ASSET PORTFOLIOS
Centralized portfolio management capabilities provide views of exposures and holdings.
Managers can optimize a number of portfolio attributes directly from the portfolio management workspace. Attributes include the desired level of turnover, tracking error ranges, and the desired number of transactions. Portfolios can be tilted toward specific targets for any number of user-defined variables or security groupings. Hard constraints can be applied in absolute terms, relative to a benchmark, or relative to the initial position. Both market neutral and uneven long/short strategies can be optimized as a single problem, eliminating the need to perform separate optimizations. The optimizer can use factors derived from both Charles River’s standard models and third-party models.
Charles River also supports historical analysis. Portfolio managers can view history in terms of holdings, and/or perform trend analysis. For example, a fixed income manager may wish to see how they were positioned actively against a benchmark in terms of exposure and duration; this analysis can be performed via the historical views and charted for visual effect.
CONSTRUCT AND MANAGE LDI DRIVEN STRATEGIES
Liability-Driven Investment (LDI) strategies help insurers and pensions manage assets based on the cash flows required to fund future liabilities. These strategies may include matching the cash flows of assets with the cash flows of liabilities, or matching the risk sensitivities of both assets and liabilities, so that assets can still fund liabilities if market conditions change. These capabilities help asset managers minimize a portfolio’s liquidation risk by ensuring asset sales, interest, and dividend payments correspond with expected payments to beneficiaries.
Portfolio managers can:
1. See the impact of asset allocation and de-risking decisions
2. Construct portfolios that align with investment guidelines
3. Understand even the most complex compliance and risk guidelines and readily adjust proposed allocations
Charles River Portfolio Management and Risk Analytics Information Classification: General

(Continued Portfolio Construction)
The Charles River Investment Management Solutions (Charles River IMS) uses a “Liability Instrument” to streamline modeling of cash flows.
The following capabilities support LDI workflows:
Liability Benchmarks: Users assign a liability benchmark to their respective funds. These benchmarks contain the liabilities that correspond to the fund.
Liability Mapping: Users can define liabilities to be either nominal or inflation-adjusted. Inflation adjusted liabilities can be modeled based on an imported set of real and/or inflation adjusted cash flows.
Flexible Analytics: Liability valuations can be produced relative to a set of actuarial cash flows discounted relative to the appropriate curve (e.g., IRS curve) and spread. Users can incorporate third party or client derived tenor set sensitivities for the asset portfolio and the liabilities.
The sets feature:
1. Flexible tenor definitions
2. Ability to generate interest rate and inflation sensitivities per tenor
3. Ability to link interest rate to inflation sets
Portfolio Management: The Charles River Manager Workbench enables users to efficiently manage a portfolio of assets and liabilities. Portfolio managers can display liability securities, calculate and show funding ratios, and generate a range of analytics by tenor, including PV01, DV01 and IE01. This supports standard hedging and targeting workflows, for example, hedging a position and determining funding ratio impact.
Scenario Analysis: Charles River Scenario Analysis supports the ability to shift the market factors that are relevant to liabilities (e.g., interest rates, inflation and spreads). User-specified shifts are applied to all relevant curves, liability, and asset attributes in order to obtain a scenario specific set of valuations, analytics and cash flows.
From a fund management perspective this allows a portfolio manager to:
4. View funding and hedge ratios subject to various economic environments
5. Perform cash ladder analysis relative to their liabilities
6. Analyze changes in valuations and sensitivities subject to regime changes
For stress testing, liabilities can be proxied or used in factor scenarios if factor exposures are available.
Compliance Monitoring: Compliance rules can be based on portfolio level analytics, tenors, and funding ratio.
Charles River Portfolio Management and Risk Analytics Information Classification: General

Exposures & SensitivitiesANALYZE AND UNDERSTAND EXPOSURES AND SENSITIVITIES
Portfolio managers, compliance officers, and risk managers can calculate, manage, and monitor risk across the entire investment lifecycle. Assessments of portfolio, market, and sector risk are calculated using a single, consistent set of data, eliminating the potential for conflicting or questionable results.
Managers can view portfolio exposures across multiple dimensions and custom classifications, propose trades to bring exposure to target levels, and see exposures adjust in real-time. Trades can then be generated and routed to the appropriate trading desk.
Charles River Portfolio Management and Risk Analytics Information Classification: General
The Solution Lets Managers and Analysts:
Analyze sensitivities to rate, credit and inflation
risk factors at portfolio and
category levels
1
Propose changes and
analyze results of de-risking
decisions pre-trade
2Model and hedge portfolios using
the latest market data
3Optionally incorporate
bespoke and 3rd party analytics
4 5Utilize industry-
standard derivative
valuation models

Risk Management
Charles River implements three ex-ante risk measures that help managers assess forward-looking risk and adjust their portfolios accordingly:
Assess Forward Looking Risk
Adjustments are immediately reflected, helping managers validate their decision and understand portfolio-level impacts. Historical simulation is a robust, non-parametric method for calculating VaR that makes no assumptions about the underlying distribution of risk factors or returns. VaR calculations can incorporate either exponential decay to weight recent data more heavily, or stressed conditions to produce realistic worst-case forecasts. Replacement securities can be utilized to account for missing data.
Charles River also supports risk forecasts based on factor models, including projected volatility, tracking error, and beta. Firms can utilize Charles River’s proprietary factor model based on Principal Components Analysis (PCA) or incorporate in-house and third party models.
UNDERSTAND RISK IN A HISTORICAL CONTEXT
Portfolio managers can monitor changes in historical VaR and ex-post risk metrics over time and analyze the evolution of their portfolio using trend analysis. This provides insight into whether changes to risk levels were anticipated and desired, or whether they were a result of increased risk exposures that should have been managed and reduced. The displays are also actionable, so de-risking activities can be carried out and reflected in real time.
Conditional VaR Or expected shortfall, quantifies the potential loss once the VaR threshold
has been exceeded.
Value at Risk (VaR) Uses historical simulation to calculate the worst case loss over a given time period that won’t be exceeded with a
given level of confidence.
Component VaR Lets portfolio managers quickly visualize how much a particular
sector, category or security adds or subtracts to their overall VaR so they
can reduce or hedge those exposures.
Information Classification: GeneralCharles River Portfolio Management and Risk Analytics

Scenario AnalysisMODEL HISTORICAL AND HYPOTHETICAL STRESS SCENARIOS
Charles River’s Scenario Analysis capabilities are used to model portfolio impacts of one or more stress factors, including interest rate and FX shifts, credit spread changes, inflation shocks, and equity market movements. The solution provides standard market scenarios and supports the creation of complex custom scenarios.
Stress testing applies scenarios mandated by regulatory authorities to model potential outcomes and gauge worst-case drawdown.
Hypothetical scenario analysis allows managers to construct and apply a plausible scenario based on their portfolio’s risk exposures, reflecting the full impact of underlying instruments, including derivatives, and taking into account all portfolio and cash events.
Horizon analysis applies shifts and then displays portfolio performance over a horizon term ranging from days to years, based on a reinvestment rate for any cash flows received, including coupon payments, maturities, and callable/puttable bonds that would be called/put within that term.
The following methodologies are applied when evaluating scenarios:
Instrument Type MethodologyFixed rate bonds Interest rate shift is applied to the spot curve and credit shift to OAS.
Floating rate bonds Interest rate shift is applied to both the index and the discount curve, and credit shift to OAS.
Inflation linked bondsInterest rate shift is applied to discount curve and credit shift to OAS. Inflation shift is applied to either an inflation swap curve or a constant inflation rate assumption.
Mortgages and other asset-backed instruments
Scenario analysis is performed using the Yield Book calculation engine, via real-time integration.
Interest rate swaps Each leg of a swap can be shifted independently, including accrual and discount curves. Credit shifts do not apply.
Bond futuresInterest rate shift is applied to the yield curve. Credit shifts do not apply. Daily mark-to-market is ignored for horizon analysis; cheapest-to-deliver bond is assumed to remain unchanged throughout the life of the future.
Interest rate futuresInterest rate shift is applied to the yield curve. Credit shifts do not apply. Daily mark-to-market is ignored for horizon analysis; futures are converted to cash at the futures’ expiration date, including any gain/loss on the contract.
Bond and interest rate options Interest rate shift is applied to the underlying future.
Forward rate agreements Interest rate shift is applied to the yield curve. Credit shifts do not apply. For horizon analysis rate of return calculations, fair value is centered on 100.
Currency futures and forwards FX shifts are applied to the FX forward curves.
Charles River Portfolio Management and Risk Analytics Information Classification: General

Performance & AttributionMEASURE PORTFOLIO PERFORMANCE AND ATTRIBUTION
Portfolio managers can view historical portfolio performance across any timeframe and understand the portfolio construction and asset selection decisions responsible for that performance. Users can change performance or attribution settings on the fly and run different analyses for the same account across asset types, down to the individual security level. Performance results can be converted to any currency and custom benchmarks can be created by importing and blending category- or constituent-level indices.
Managers can: · Measure performance using either time-weighted or
money-weighted methodologies, configurable at the account level
· Calculate multiple return types, including capital, income, base, local, currency, gross and net
· Roll up performance to any level, including multiple nested classifications, total portfolio/benchmark, account groups and composites
· Choose the attribution methodology that best supports their business needs, and configure the methodology at global system, account, or report levels
Attribution methodologies and major capabilities include: · Daily attribution by asset style, including currency, fixed
income roll, duration, convexity and spread effects · Roll up attributions to multiple classification levels for each
security, including domicile (region, country, currency) and sector (industry or sub-sector)
· Automated rule-based workflows for composite construction and maintenance
· Extensive audit trail helps reduce third-party verification costs
· Equity attribution methods include Brinson-Hood-Beebower, Brinson-Fachler and Karnosky-Singer
UNDERSTAND RISK-ADJUSTED PERFORMANCE Performance risk analysis quantifies how much risk was required to achieve historical portfolio returns. This enables portfolio managers to ensure their risk/return ratio aligns with their risk guidelines and Investment Policy Statements and provides visibility into how closely they track their benchmark.
SUPPORTED RISK MEASURES INCLUDE:
Absolute and relative summary risk measures: alpha, beta, Sharpe ratio, Treynor ratio and Sortino ratio
Ex-post risk measures: beta, information ratio, tracking error, volatility and variance
Information Classification: GeneralCharles River Portfolio Management and Risk Analytics

Charles River Portfolio Management and Risk Analytics Information Classification: General
FOUNDATIONS
FIXED INCOME, CURRENCIES AND COMMODITIES (FICC)
· Global Government: Over 100 jurisdictions/sovereigns
· Securitized Products: MBS, ABS, CMBS and CMOs
· Treasury and Swap curve-based analytics, swap curves in 14 currencies
· Corporate: Global Investment Grade, High Yield, and Bank Loans
· Structured Products: Fixed Rate, Floating Rate, Fixed-to-Float, Stepped, PIK, Callable
· Municipals: Comprehensive state coverage
· Inflation Linked: Over 20 countries
· Convertible bonds
· Currencies: Spot and Forwards for 174 base currencies
· Futures for over 3200 commodities
DERIVATIVES
Exchange Traded:Bond Futures, Interest Rate Futures, Currency Futures, Equity Index Futures, Options on Futures, Equity Options and Equity Index Options
OTC Rate and Credit: Interest Rate Swaps, Inflation Swaps, Asset Swaps, FRAs, Caps/ Floors, Swaptions, CDS, CDX/iTraxx, TRS- Bond, CDS/CDX Swaptions
OTC Other:TRS- Equity, Variance/Volatility Swaps, FX Forwards, FX Options, Commodity Swaps
EQUITIES · Common Stock, Closed-End Funds, ETFs, ADRs,
REITs, Convertible Bonds
· Developed and Emerging Markets in 160 countries and 72 currencies
Global Multi-Asset Coverage The Charles River Data Service provides managed reference and pricing data to support broad and deep global coverage across all asset classes. Frequent updates help ensure that new instruments are made available to asset managers on a timely basis.
Consistent and Accurate Asset ValuationsCharles River provides a highly performant analytics engine; managed reference, benchmark and pricing data; extensive global instrument coverage; and industry standard computational models for accurate, real-time valuations of all instruments.
Firms can store and compare multiple reference, analytics, and pricing suppliers and sources to meet the particular valuation requirements of their investment process and product mix. Charles River maintains always-current mappings for 1000+ data elements to support over 120 types of bonds globally. Continuous validation helps ensure that accrued interest and critical analytics are calculated correctly.
Stats as of Q1 2020

Charles River Portfolio Management and Risk Analytics Information Classification: General
FOUNDATIONS
Charles River supports both natively calculated and third-party analytics for bonds, derivatives, mortgages, and asset-backed securities. Natively calculated analytics are compatible with major index analytics across all asset types such that comparisons to benchmarks can be performed accurately. This eliminates the need for external index-provider analytics systems. However, external analytics can be imported, and selectively mixed and validated.
Native Analytics Calculated Using the Embedded Analytics Engine.
Users also have the capability to recalculate analytics for specific components of their portfolios should underlying market activity dictate. Analytics are calculated using industry standard methodologies, and new methods (e.g., dual-curve stripping) are added when industry best practices change.
Representative Methodologies Utilized to Calculate Analytics.
Category Analytic(s)Trade-level Price, yield, accrued interest, projected cash flows, factor, spread to benchmark
Sensitivities Duration, modified duration, convexity, DV01, mortgage-specific sensitivities
Derivative-related Option greeks, credit DV01, inflation DV01, par swap rate
Advanced Option adjusted spreads, I-spread, Z-spread, fair value, spread duration, spread convexity, key rate durations
Instrument Type MethodologyBonds 1-factor Hull-White model, Black Karasinski with configurable volatility and mean
reversion parameters
Options Black Scholes or binomial tree for European options, Binomial tree for American or Bermudan options, Dividend yield or projected discrete dividends
CDS Basket 1-factor Gaussian copula for homogeneous baskets, Normal copula for non-homogeneous baskets
CDS Index Tranche Monte Carlo, Fast Fourier Transform, Recursion method
Swaptions Black model with lognormal volatility
Inflation Swaps Accruing on inflation swap curves, discounting on LIBOR/Swap or OIS
Interest Rate Swaps Discounted cash flows with different principal exchange conventions, Supporting different accrual (forward) and discount curves – e.g., accrual on LIBOR/Swap and discount on OIS
Variance & Volatility Swaps Discounted cash flows, Heston, and Options Portfolio Replicating methods
Analytics Ecosystem and Managed Data
Charles River Portfolio Management and Risk Analytics Information Classification: General
FOUNDATIONS
MORTGAGE PASS-THROUGH SECURITIES AND TBAS
Trade-time analytics and mortgage duration and convexity are calculated natively. Charles River provides a Public Securities Association (PSA) pre-payment model based on an absolute, constant pre-payment rate. Alternately, externally calculated cash flows can be imported to model pre-payments. Additionally, Charles River offers its own proprietary dynamic prepayment model for US Fixed Rate Agency Pools.
ASSET-BACKED SECURITIES
Instrument coverage includes RMBS and CMBS, agency and non-agency CMOs, fixed and adjustable rate mortgages, TBAs and other asset-backed securities. More sophisticated pre-payment models are supported in the Charles River IMS via the integrated Yield Book analytics. For example, the Citi Mortgage Prepayment model incorporates over 12 factors, including average credit score, turnover effects, refinancing, and loan-to-value. Supported interest rate models include LIBOR-Market, 2-factor skew and 1-factor single volatility.
(Analytics Ecosystem and Managed Data Continued)
Charles River Portfolio Management and Risk Analytics Information Classification: General
FOUNDATIONS
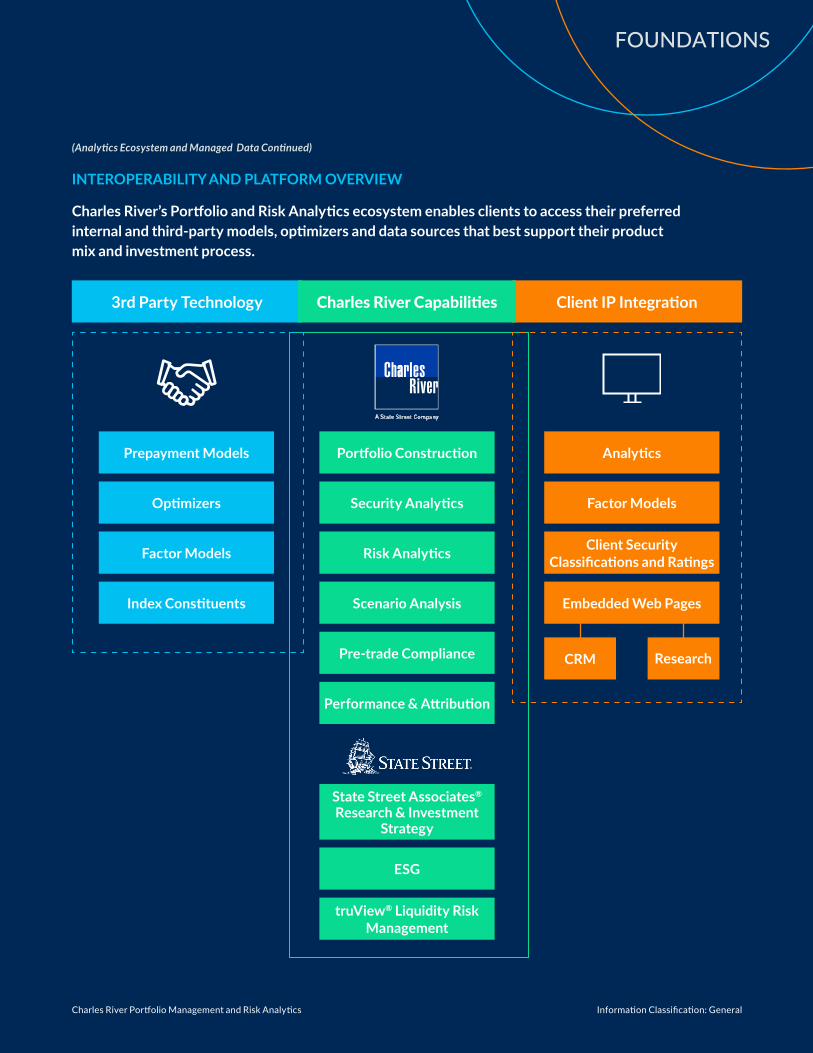
INTEROPERABILITY AND PLATFORM OVERVIEW
Charles River’s Portfolio and Risk Analytics ecosystem enables clients to access their preferred internal and third-party models, optimizers and data sources that best support their product mix and investment process.
(Analytics Ecosystem and Managed Data Continued)
3rd Party Technology Client IP Integration
Portfolio Construction
Security Analytics
Risk Analytics
Pre-trade Compliance
Performance & Attribution
Scenario Analysis
ESG
State Street Associates® Research & Investment
Strategy
truView® Liquidity Risk Management
Prepayment Models
Optimizers
Factor Models
Index Constituents
Charles River Capabilities
Analytics
Factor Models
Client Security Classifications and Ratings
Embedded Web Pages
CRM Research

Information Classification: General3328065.1.1.GBL.
Investment firms, asset owners, wealth managers, hedge funds and insurers in more than 30 countries rely on Charles River’s front and middle office investment management platform to manage more than US$30 Trillion in assets. Together with State Street’s middle and back office capabilities, Charles River’s cloud-deployed software technology forms the foundation of State Street Alpha℠. The Charles River Investment Management Solution (Charles River IMS) is designed to automate and simplify the institutional investment process across asset classes, from portfolio management and risk analytics through trading and post-trade settlement, with integrated compliance and managed data throughout. Charles River’s growing partner ecosystem enables clients to seamlessly access external data and analytics, applications and liquidity venues that support the demands of their product and asset class mix. Headquartered in Burlington, Massachusetts, we serve clients globally with more than 1,000 employees in 11 regional offices.(Statistics as of Q1 2021)
Learn more at crd.com/pmrisk
Charles River Development - A State Street Company is a wholly owned business of State Street Corporation (incorporated in Massachusetts).
This document and information herein (together, the “Content”) is subject to change without notice based on market and other conditions and may not reflect the views of State Street Corporation and its subsidiaries and affiliates (“State Street”). The Content is provided only for general informational, illustrative, and/or marketing purposes, or in connection with exploratory conversations; it does not take into account any client or prospects particular investment or other financial objectives or strategies, nor any client’s legal, regulatory, tax or accounting status, nor does it purport to be comprehensive or intended to replace the exercise of a client or prospects own careful independent review regarding any corresponding investment or other financial decision. The Content does not constitute investment research or legal, regulatory, investment, tax or accounting advice and is not an offer or solicitation to buy or sell securities or any other product, nor is it intended to constitute any binding contractual arrangement or commitment by State Street of any kind. The Content provided was prepared and obtained from sources believed to be reliable at the time of preparation, however it is provided “as-is” and State Street makes no guarantee, representation, or warranty of any kind including, without limitation, as to its accuracy, suitability, timeliness, merchantability, fitness for a particular purpose, non-infringement of third-party rights, or otherwise. State Street disclaims all liability, whether arising in contract, tort or otherwise, for any claims, losses, liabilities, damages (including direct, indirect, special or consequential), expenses or costs arising from or connected with the Content. The Content is not intended for retail clients or for distribution to, and may not be relied upon by, any person or entity in any jurisdiction or country where such distribution or use would be contrary to applicable law or regulation. The Content provided may contain certain statements that could be deemed forward-looking statements; any such statements or forecasted information are not guarantees or reliable indicators for future performance and actual results or developments may differ materially from those depicted or projected. Past performance is no guarantee of future results. No permission is granted to reprint, sell, copy, distribute, or modify the Content in any form or by any means without the prior written consent of State Street.
The offer or sale of any of these products and services in your jurisdiction is subject to the receipt by State Street of such internal and external approvals as it deems necessary in its sole discretion. Please contact your sales representative for further information. State Street may from time to time, as principal or agent, for its own account or for those of its clients, have positions in and/or actively trade in financial instruments or other products identical to or economically related to those discussed in this communication. State Street may have a commercial relationship with issuers of financial instruments or other products discussed in this communication.
©2021 STATE STREET CORPORATION
Charles River Development, A State Street Company