charts and graphs – blued6vsczyu1rky0.cloudfront.net/.../14/2017/04/charts-and-… · web...
TRANSCRIPT

Q1. Some children work out how much money two shopkeepers get from selling fruit. They use pie charts to show this.
Mrs Binns gets £350 selling bananas.
Estimate how much she gets selling oranges.
1 mark
Mrs Binns gets a total of £1000 and Mr Adams gets a total of £800.
Estimate how much more Mrs Binns gets than Mr Adams for selling peaches.
1 mark
Page 1

Q2. The Year 6 children in a school were asked to choose a musical instrument. This is a pie chart of their choices.
Estimate what fraction of the children chose a drum.
1 mark
There are 80 children in Year 6.
Estimate the number of children who chose a violin.
1 mark
Explain how you decided.
...............................................................................................................................
...............................................................................................................................
...............................................................................................................................1 mark
Page 2

15% of the 80 children chose a guitar.
How many children is this?
2 marks
Q3. Kelly chooses a section of a newspaper.
It has 50 words in it.
She draws a bar chart of the number of letters in each word.
What fraction of the 50 words have more than 6 letters?
Page 3

1 mark
Kelly says,
23 of the 50 words have less than 5 letters.This shows that nearly half of all the words used in the newspaper have less than 5 letters in them.
Explain why she could be wrong.
...............................................................................................................................
...............................................................................................................................
...............................................................................................................................1 mark
Q4. A school collects money for charity.
This chart shows how much has been collected.
Page 4

The target is £3000.
Estimate how much more money the school needs to reach the target.
£
1 mark
Anil says,
The chart shows that we will reach the target in two months.
Use the chart to explain why Anil may be wrong.
...............................................................................................................................
...............................................................................................................................
...............................................................................................................................1 mark
Page 5
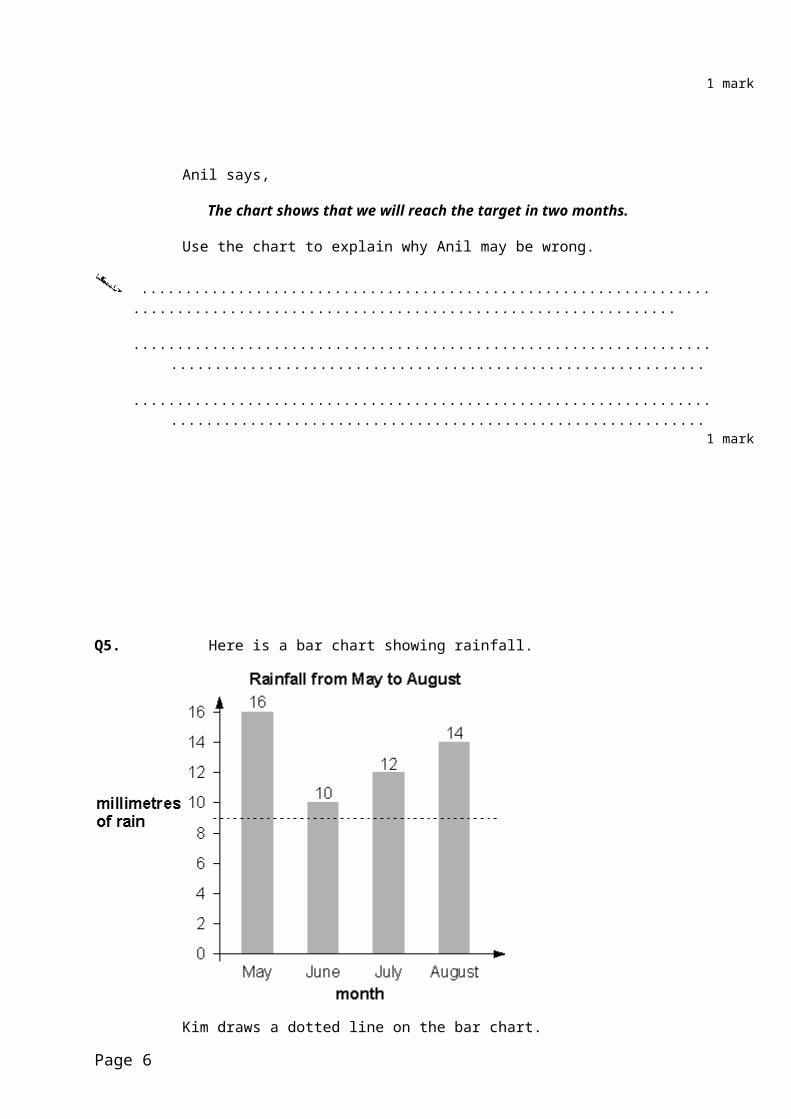
Q5. Here is a bar chart showing rainfall.
Kim draws a dotted line on the bar chart.
She says,
‘The dotted line on the chart shows the mean rainfall for the four months.’
Use the chart to explain why Kim cannot be correct.
...............................................................................................................................
...............................................................................................................................
...............................................................................................................................1 mark
What is the mean rainfall for the four months?
mm
Page 6

1 mark
Q6. Three children do a sponsored silence.
This is a chart of the money they collected.
Page 7

Estimate how much Sheena collected.
£
1 mark
Together Gary and Pip collected more than £60.
Explain how the chart shows this.
...............................................................................................................................
...............................................................................................................................
...............................................................................................................................1 mark
Q7. n stands for a number.
Complete this table of values.
n 5 n – 2
20
38
2 marks
Q8. Tony and Gemma looked for snails, worms, slugs and beetles in their gardens.
Page 8

They each made a pie chart of what they found.
Estimate the number of worms that Tony found.
1 mark
Who found more snails?
Circle Tony or Gemma. Tony / Gemma
Explain how you know.
...............................................................................................................................
...............................................................................................................................
...............................................................................................................................1 mark
Page 9

Q9. A hot liquid is left to cool in a science experiment.
This graph shows how the temperature of the liquid changes as it cools.
Read from the graph how many minutes it takes for the temperature to reach 40°C
minutes
1 mark
Read from the graph how many minutes the temperature is above 60°C
minutes
1 mark
Page 10

Q10.
This chart shows the amount of money spent in a toy shop in three months.
How much more money was spent in the shop in December than in November?
£
1 mark
Stepan says,
‘In November there was a 100% increase on the money spent in October’.
Is he correct?
Circle Yes or No. Yes / No Explain how you can tell from the chart.
...............................................................................................................................
...............................................................................................................................
...............................................................................................................................1 mark
Page 11

Q11.
A is the point (10, 60)
B is the point (20, 20)
M is the midpoint of line AB.
Write the coordinates of M.
( , )
1 mark
C is on the x-axis, directly below B.
Write the coordinates of C.
( , )
1 mark
Page 12

Q12. This graph shows how the weight of a baby changed over twelve months.
From the graph, what was the weight of the baby at 10 months?
kg
1 mark
How much more did the baby weigh at 5 months than at birth?
kg
1 mark
Page 13

Q13. Some children take part in the long jump.
The graph shows the distances the children jumped.
Estimate how much further Lucy jumped than Nicola.
cm
1 mark
Page 14

Q14. The pie charts show the results of a school’s netball and football matches.
The netball team played 30 games.
The football team played 24 games.
Estimate the percentage of games that the netball team lost.
%
1 mark
David says,
‘The two teams won the same number of games’.
Is he correct?
Circle Yes or No. Yes / No
Explain how you know.
...............................................................................................................................
...............................................................................................................................
...............................................................................................................................1 mark
Page 15

Q15.
This graph shows the height of a balloon at different times.
From the graph, find the height of the balloon at 50 seconds.
m
1 mark
Use the graph to find out how long it took the balloon to rise from 30 metres to 60 metres.
Page 16

seconds
1 mark
Q16. On Monday all the children at Grange School each play one sport.
They choose either hockey or rounders.
There are 103 children altogether in the school.
27 girls choose hockey.
Write all this information in the table. Then complete the table.
hockey rounders Total
boys 22
girls 53
Total
2 marks
Page 17

Q17. All the children at Park School chose their favourite soup.
The graph shows the results.
How many more children chose chicken soup than mushroom soup?
1 mark
Robbie says,
‘More than half of the children chose tomato soup’.
Is he correct? Circle Yes or No.
Yes / No Explain how you can tell from the graph.
Page 18

................................................................................................................................
................................................................................................................................
................................................................................................................................1 mark
Q18. This pie chart shows how the children in Class 6 best like their potatoes cooked.
32 children took part in the survey.
Look at the four statements below.
For each statement put a tick ( ) if it is correct. Put a cross ( ) if it is not correct.
10 children like chips best.
25% of the children like mashed potatoes best.
of the children like roast potatoes best.
12 children like jacket potatoes best.
2 marks
Page 19

Q19. This graph shows the temperature in a greenhouse.
Use the graph to find the time when the temperature was 25°C.
1 mark
Use the graph to find the difference between the temperature at 2 pmand the temperature at 4 pm.
degrees
Page 20

1 mark
Q20. Class 6 did a survey of the number of trees in a country park.
This pie chart shows their results.
Estimate the fraction of trees in the survey that are oak trees.
1 mark
Page 21

The children counted 60 ash trees.
Use the pie chart to estimate the number of beech trees they counted.
1 mark
Q21. This chart shows the number of books some children read last month.
How many children altogether read more than 9 books?
1 mark
7 children read 4 books.
1 child read 5 books.
Page 22

Lin says,
‘That means 2 children read 6 books’.
Explain how she can work this out from the chart.
1 mark
Q22. This graph shows the height of a candle as it burns.
Page 23

Look at the graph.
What is the height of the candle after 2 hours?
cm
1 mark
How long does the candle take to burn down from 16cm to 4cm?
1 mark
Q23. This graph shows the number of people living in a town.
Page 24

Look at the graph.
How many people lived in the town in 1985?
°
1 mark
In which year was the number of people the same as in 1950?
°
1 mark
Find the year when the number of people first went below 20 000
Page 25

°
1 mark
Q24. The London Eye is a big wheel with pods to carry passengers.
It takes 30 minutes for the wheel to make a complete turn.
This graph shows the height of a pod above the ground as the wheel turns.
Page 26

How long from the start does it take the pod to reach a height of 75 metres?
minutes
1 mark
How many metres above the ground is the pod at its highest point?
m
1 mark
Q25. 40 children predicted who would win the boys’ race at sports day.
This pie chart shows their predictions.
What percentage of the children predicted that Stefan would win?
Page 27

%
1 mark
10 children predicted the winner of the race correctly.
Who won the race? ...........................................
Explain how you know.
1 mark
Q26. This graph shows the outside temperature from 4pm to 10pm on a day in winter.
Page 28

At what time was the temperature –2°C?
1 mark
How many degrees did the temperature drop from 5pm to 7pm?
degrees
1 mark
Q27. A shop sells books, CDs and DVDs.
This pie chart shows the sales of each in one week.
Page 29

Estimate the fraction of the total sales that were DVDs.
1 mark
In this week, 200 CDs were sold.
Estimate how many books were sold.
1 mark
Q28. This table shows the number of things to eat in five children’s lunch boxes.
sandwiches apples bananas fruit bars
Lisa 1 2 0 2
Page 30

Jack 2 0 2 1
Kemi 1 1 0 2
Nik 1 2 1 0
Ben 2 1 2 1
Here is a graph of the information for four of the children.
Which child’s information is missing from the graph?
...............................
Explain how you know.
1 mark
Page 31

Q29. Here is information about pupils in a class.
• The total number of pupils is 30
• 26 of the pupils do not wear glasses.
• A quarter of the pupils who do wear glasses are boys.
• There are 2 more boys than girls.
Use the information to fill in the missing numbers in the table below.
Number who dowear glasses
Number who do notwear glasses Total
Numberof boys
Numberof girls
Total 30
2 marks
Q30. 500 children started a 20 kilometre sponsored cycle ride.
This graph shows how far they cycled.
Page 32

At what distance were exactly half of the children still cycling?
km
1 mark
Estimate how many children completed the 20 kilometre cycle ride.
1 mark
Q31.The graph shows the average heights of girls in the UK from age 6 – 11 years.
Page 33

Emily is 1.38 m tall.
She is the average height for her age.
How old is she?
years old
1 mark
Zoe is years old.
She is also 1.38 m tall.
How much taller than average is she?
Give your answer in centimetres.
Page 34

cm
1 mark
Q32.
People in a village were asked if they shopin the village, or in the town, or in both.
The bar chart shows the results.
Altogether 246 people took part in the survey.
How many people shop in both the village and the town?
Page 35

2 marks
Q33. Kirsty measured the length of her shadow every hour on one sunny day.
She plotted her results on this graph.
Page 36

Look at the graph.
Estimate the length of Kirsty’s shadow at 3:30 pm.
cm
1 mark
Estimate a time when her shadow was 180 centimetres long.
:
1 mark
Page 37

Q34. This pie chart shows the ingredients to make a food mixture for wild birds.
Estimate the percentage of mixture that is suet.
%
1 mark
Mina uses 100 grams of millet in the mixture.
Estimate how many grams of sunflower seeds she should use.
g
1 mark
Q35.Megan asked children from two different schools,
‘How do you travel to school?’
Page 38

Here are her results.
Foxwood school80 children
Midtown school240 children
Megan says,
‘The number of children walking to Foxwood school is more than the number walking to Midtown school.’
Is she correct?Circle Yes or No.
Yes / No
Explain how you know.
Page 39

1 mark
At Midtown school, one third of children travel by car.
The number of children who cycle is the same as the number who go on the bus.
How many children cycle to Midtown school?
2 marks
Page 40